economic group eandis ifrs financial statements … group eandis ifrs financial statements for ......
TRANSCRIPT
Economic Group Eandis IFRS Financial Statements for the six-month period
ended 30 June 2013
1
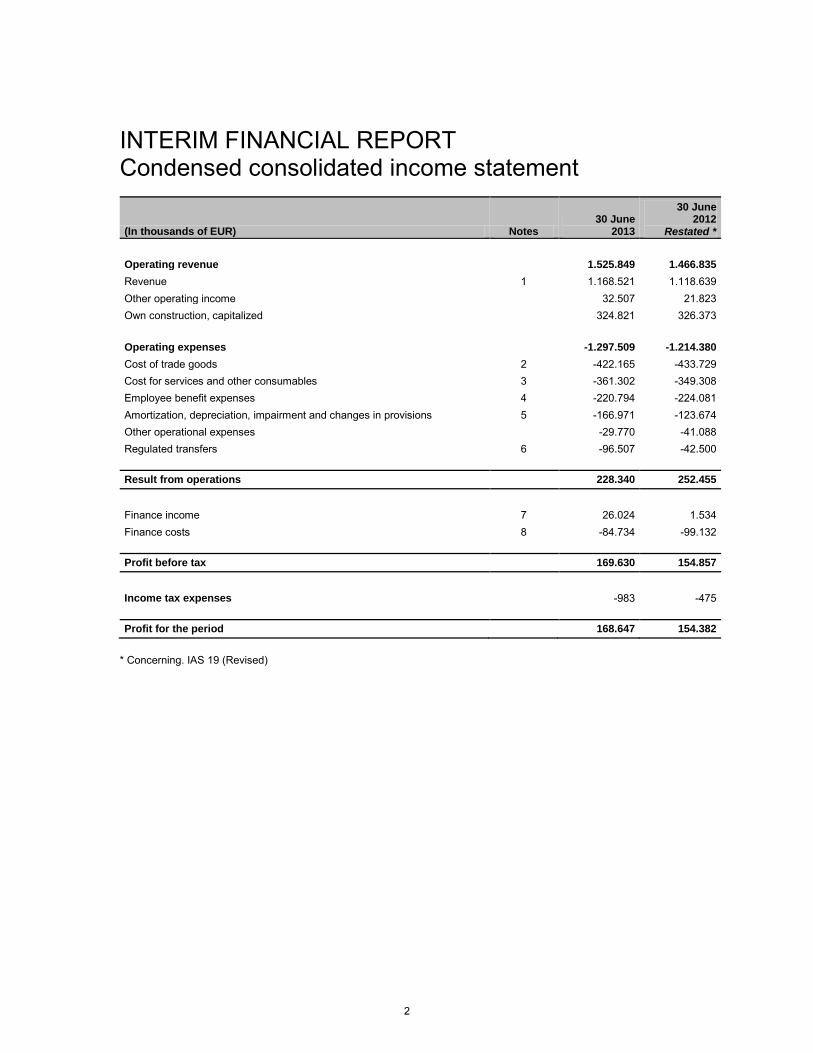
INTERIM FINANCIAL REPORT Condensed consolidated income statement
(In thousands of EUR) Notes 30 June
2013
30 June 2012
Restated *
Operating revenue 1.525.849 1.466.835
Revenue 1 1.168.521 1.118.639 Other operating income 32.507 21.823 Own construction, capitalized 324.821 326.373
Operating expenses -1.297.509 -1.214.380
Cost of trade goods 2 -422.165 -433.729 Cost for services and other consumables 3 -361.302 -349.308 Employee benefit expenses 4 -220.794 -224.081 Amortization, depreciation, impairment and changes in provisions 5 -166.971 -123.674 Other operational expenses -29.770 -41.088 Regulated transfers 6 -96.507 -42.500 Result from operations 228.340 252.455
Finance income 7 26.024 1.534 Finance costs 8 -84.734 -99.132
Profit before tax 169.630 154.857
Income tax expenses -983 -475 Profit for the period 168.647 154.382
* Concerning. IAS 19 (Revised)
2
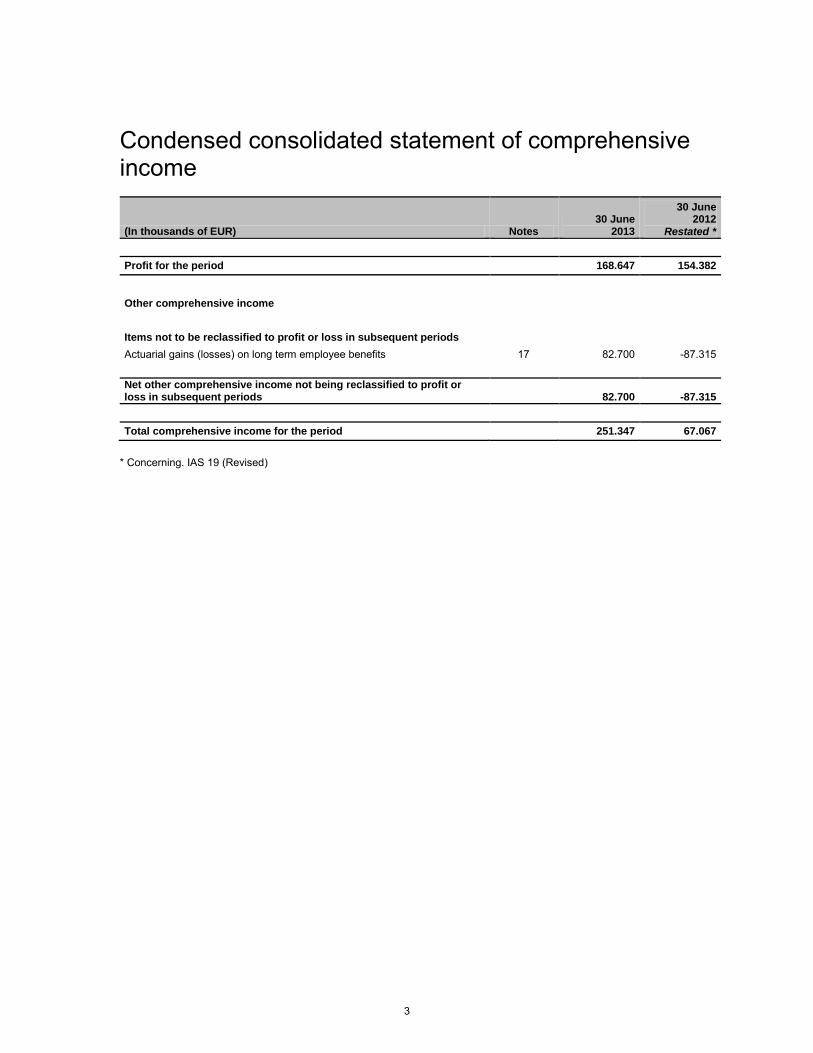
Condensed consolidated statement of comprehensive income
(In thousands of EUR) Notes 30 June
2013
30 June 2012
Restated *
Profit for the period 168.647 154.382
Other comprehensive income
Items not to be reclassified to profit or loss in subsequent periods
Actuarial gains (losses) on long term employee benefits 17 82.700 -87.315 Net other comprehensive income not being reclassified to profit or loss in subsequent periods 82.700 -87.315
Total comprehensive income for the period 251.347 67.067
* Concerning. IAS 19 (Revised)
3
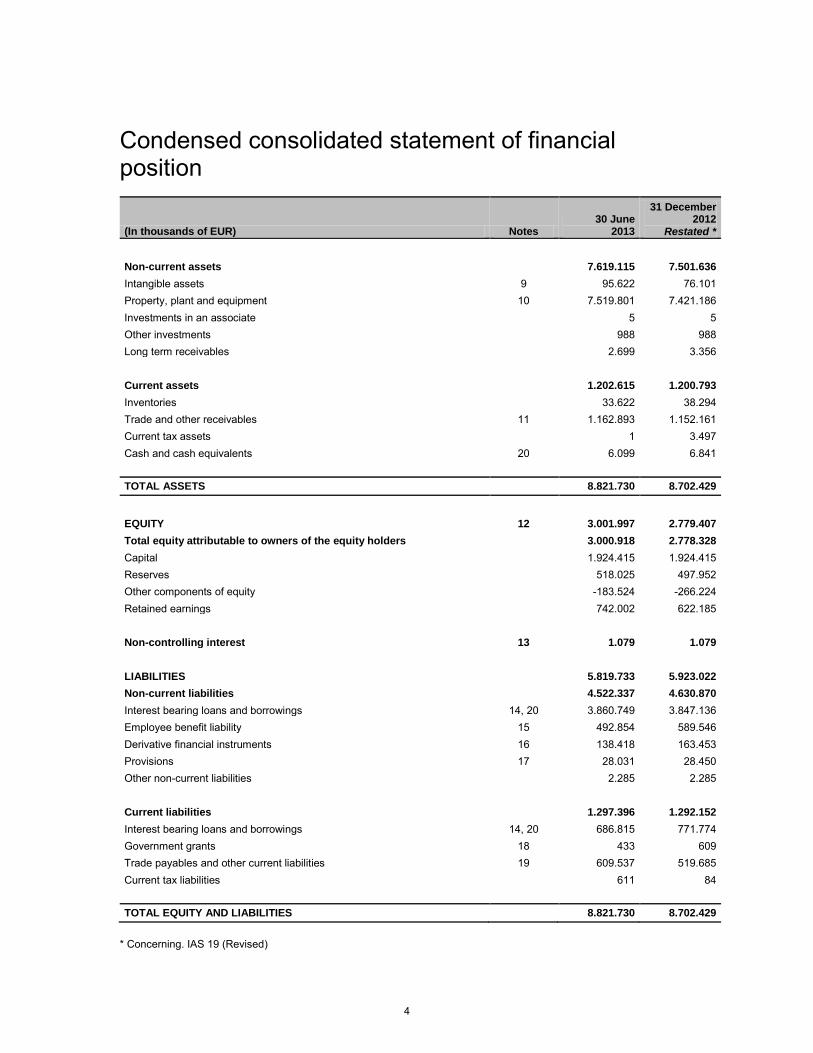
Condensed consolidated statement of financial position
(In thousands of EUR) Notes 30 June
2013
31 December 2012
Restated *
Non-current assets 7.619.115 7.501.636
Intangible assets 9 95.622 76.101 Property, plant and equipment 10 7.519.801 7.421.186 Investments in an associate 5 5 Other investments 988 988 Long term receivables 2.699 3.356 Current assets 1.202.615 1.200.793
Inventories 33.622 38.294 Trade and other receivables 11 1.162.893 1.152.161 Current tax assets 1 3.497 Cash and cash equivalents 20 6.099 6.841 TOTAL ASSETS 8.821.730 8.702.429
EQUITY 12 3.001.997 2.779.407
Total equity attributable to owners of the equity holders 3.000.918 2.778.328
Capital 1.924.415 1.924.415 Reserves 518.025 497.952 Other components of equity -183.524 -266.224 Retained earnings 742.002 622.185 Non-controlling interest 13 1.079 1.079
LIABILITIES 5.819.733 5.923.022
Non-current liabilities 4.522.337 4.630.870
Interest bearing loans and borrowings 14, 20 3.860.749 3.847.136 Employee benefit liability 15 492.854 589.546 Derivative financial instruments 16 138.418 163.453 Provisions 17 28.031 28.450 Other non-current liabilities 2.285 2.285
Current liabilities 1.297.396 1.292.152
Interest bearing loans and borrowings 14, 20 686.815 771.774 Government grants 18 433 609 Trade payables and other current liabilities 19 609.537 519.685 Current tax liabilities 611 84 TOTAL EQUITY AND LIABILITIES 8.821.730 8.702.429
* Concerning. IAS 19 (Revised)
4
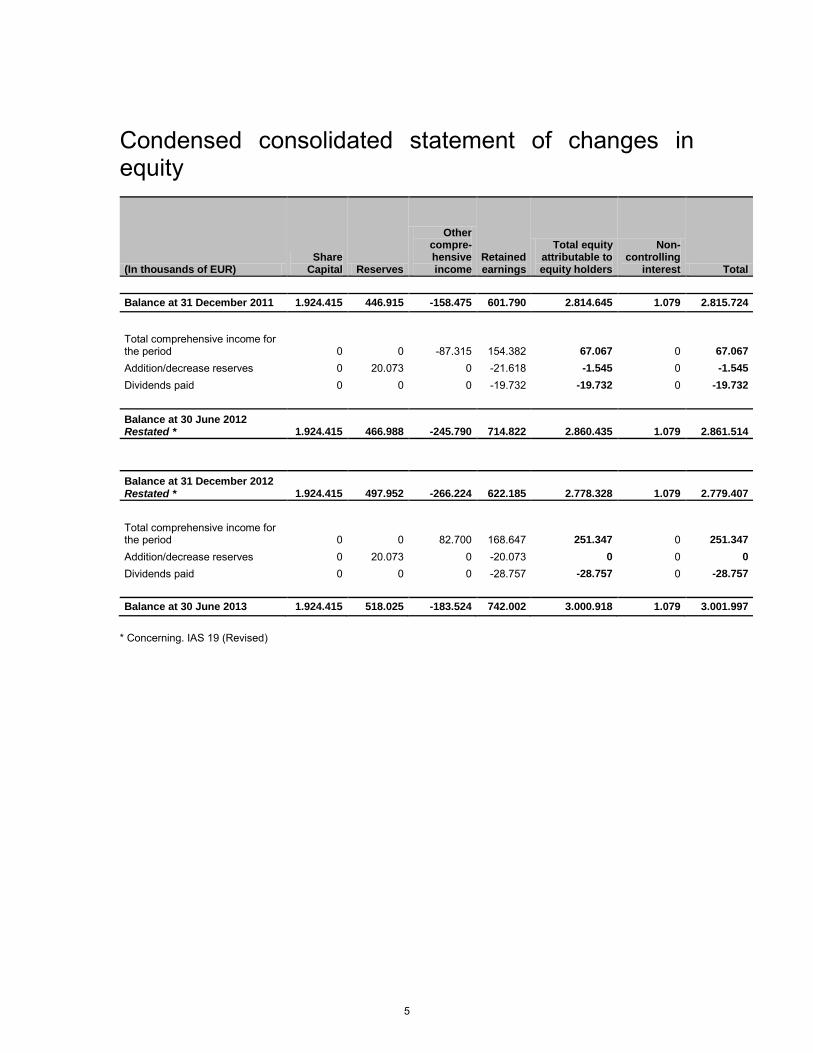
Condensed consolidated statement of changes in equity
(In thousands of EUR) Share
Capital Reserves
Other compre-hensive income
Retained earnings
Total equity attributable to equity holders
Non-controlling
interest Total
Balance at 31 December 2011 1.924.415 446.915 -158.475 601.790 2.814.645 1.079 2.815.724
Total comprehensive income for the period 0 0 -87.315 154.382 67.067 0 67.067
Addition/decrease reserves 0 20.073 0 -21.618 -1.545 0 -1.545
Dividends paid 0 0 0 -19.732 -19.732 0 -19.732
Balance at 30 June 2012 Restated * 1.924.415 466.988 -245.790 714.822 2.860.435 1.079 2.861.514
Balance at 31 December 2012 Restated * 1.924.415 497.952 -266.224 622.185 2.778.328 1.079 2.779.407
Total comprehensive income for the period 0 0 82.700 168.647 251.347 0 251.347
Addition/decrease reserves 0 20.073 0 -20.073 0 0 0
Dividends paid 0 0 0 -28.757 -28.757 0 -28.757
Balance at 30 June 2013 1.924.415 518.025 -183.524 742.002 3.000.918 1.079 3.001.997
* Concerning. IAS 19 (Revised)
5
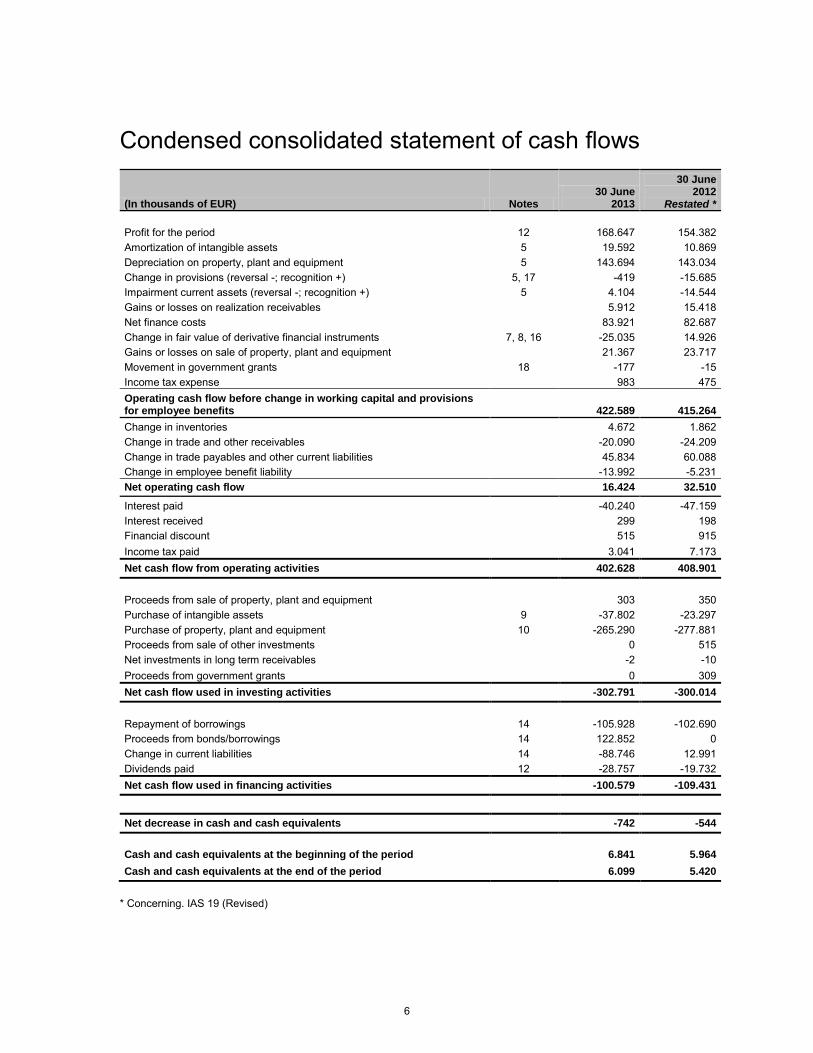
Condensed consolidated statement of cash flows
(In thousands of EUR) Notes 30 June
2013
30 June 2012
Restated *
Profit for the period 12 168.647 154.382 Amortization of intangible assets 5 19.592 10.869 Depreciation on property, plant and equipment 5 143.694 143.034 Change in provisions (reversal -; recognition +) 5, 17 -419 -15.685 Impairment current assets (reversal -; recognition +) 5 4.104 -14.544 Gains or losses on realization receivables 5.912 15.418 Net finance costs 83.921 82.687 Change in fair value of derivative financial instruments 7, 8, 16 -25.035 14.926 Gains or losses on sale of property, plant and equipment 21.367 23.717 Movement in government grants 18 -177 -15 Income tax expense 983 475 Operating cash flow before change in working capital and provisions for employee benefits 422.589 415.264
Change in inventories 4.672 1.862 Change in trade and other receivables -20.090 -24.209 Change in trade payables and other current liabilities 45.834 60.088 Change in employee benefit liability -13.992 -5.231 Net operating cash flow 16.424 32.510
Interest paid -40.240 -47.159 Interest received 299 198 Financial discount 515 915 Income tax paid 3.041 7.173 Net cash flow from operating activities 402.628 408.901
Proceeds from sale of property, plant and equipment 303 350 Purchase of intangible assets 9 -37.802 -23.297 Purchase of property, plant and equipment 10 -265.290 -277.881 Proceeds from sale of other investments 0 515 Net investments in long term receivables -2 -10 Proceeds from government grants 0 309 Net cash flow used in investing activities -302.791 -300.014
Repayment of borrowings 14 -105.928 -102.690 Proceeds from bonds/borrowings 14 122.852 0 Change in current liabilities 14 -88.746 12.991 Dividends paid 12 -28.757 -19.732 Net cash flow used in financing activities -100.579 -109.431
Net decrease in cash and cash equivalents -742 -544
Cash and cash equivalents at the beginning of the period 6.841 5.964
Cash and cash equivalents at the end of the period 6.099 5.420
* Concerning. IAS 19 (Revised)
6
Selected explanatory notes Reporting entity The consolidated financial statements of the Economic group Eandis comprise – beside the accounts of the 7 mixed Flemish Distribution System Operators (DSOs) Gaselwest, IMEA, Imewo, Intergem, Iveka, Iverlek and Sibelgas – the accounts of the subsidiary, being the operating company Eandis cvba, and its subsidiaries De Stroomlijn cvba, Indexis cvba, Atrias cvba and SYNDUCTIS cvba. The aggregated accounts taken together form the ‘Group’. The DSOs are being managed centrally by the operating company Eandis. The statutory aim of the DSOs is the distribution system operation as understood by the Electricity and Gas Decrees and their execution resolutions, as well as carrying out each peripheral activity, such as public lighting. The main activities are subject to the regulation by the Commission for the Regulation of Electricity and Gas (CREG) and the Flemish Regulating Body for Electricity and Gas (VREG). For more information, see chapter of the financial statements of 2012 “Operating in a regulated environment”. The Group can also carry out energy services to local authorities (ESLA). On request of the local public authorities (municipalities, towns, …) Eandis offers support at cost price on planning and implementation in their local policy on energy through efficient measures and projects . The companies IMEA, Imewo, Intergem, Iveka and Iverlek are mission charged associations according to the provisions of the Flemish Decree on Intermunicipal Cooperation (6 July 2001) and the companies Gaselwest and Sibelgas are intermunicipal associations under the form of cooperative societies with limited liability. All companies of the Group are registered in Belgium. The rating agency Moody's Investor Service (Moody's) granted Eandis in October 2011 an ‘A1’ credit rating (negative outlook) which was confirmed in December 2012. This is what distinguishes Eandis from other Belgian operating companies for the distribution of electricity and gas. It allows Eandis to issue bonds in the international financial markets. Statement of compliance The condensed interim IFRS financial statements for the six-month period ended 30 June 2013 have been prepared in accordance with International Accounting Standard 34 ‘Interim Financial Reporting’, as adopted by the European Union. They do not contain all the necessary information for a full set of financial statements, and should therefore be read in conjunction with the financial statements of the Group for the year ended on 31 December 2012. Summary of significant accounting policies The accounting policies used in the preparation of the consolidated financial statements are consistent to the accounting policies applied in the preparation of the consolidated financial statements for the year ended 31 December 2012 except for the new standards or interpretations in force since 1 January 2013.
7
The Group applies for the first time certain standards, interpretations and amendments. As required, those amendments on the accounting policies are detailed below: IAS 19 Employee benefits (revised 2011) This revised standard contains many amendments. Since the Group already processed the actuarial differences via Other Comprehensive Income, the following amendments are of interest for the Group: the expected return on plan assets can no longer be recognized in profit or loss, instead, the interest on the net defined benefit liability should be recognizsed in profit or loss. The interest is determined on the basis of the discount rate, which is also used to measure the defined benefit obligation. In addition, the unvested past service costs are now recognized in profit or loss when the amendment in the pension plan occurs. Other amendments include new disclosures, such as quantitative information and sensitivity disclosures. The impact of this amendment is explained in the note 'Employee benefit liability'. IAS 1 Presentation of items of Other Comprehensive Income This amendment requires a presentation amendment introducing the breakdown and grouping of items in Other Comprehensive Income that could or will never be reclassified (or recycled) to profit or loss at a future point in time. This amendment affected presentation only and has no impact on the Group’s financial position or performance. Several other new standards, interpretations and amendments to standards are mandatory for the first time for the financial year beginning on 1 January 2013. A detailed list of these was included in the IFRS Financial Statements ended 31 December 2012 (see ‘Summary of significant accounting policies’). They were not repeated here because they are not applicable or do not have a significant impact on these interim condensed financial statements of the Economic group Eandis. The Group chose not to early adopt standards, interpretations or amendments that were published but not yet effective. The Group will apply the new standards and interpretations applicable to its financial statements as soon as they become effective. Use of estimates and judgments The preparation of financial statements in conformity with IFRS requires management to make judgments, estimates and assumptions that affect the reported amounts of assets and liabilities, and the amounts of revenue and expenses. The actual results could differ from these estimates. In preparing these interim consolidated financial statements, evaluation by management on the application of the accounting policies of the company as well as the sources on uncertainty used, are the same as those applied to the consolidated financial statements for the year ended 31 December 2012. Notes to the interim financial report 1. Operating revenue Revenue increases to 1.168.521 k EUR due to the increase in the distribution and transmission grid fee with 57.129 k EUR.
8

2. Cost for trade goods The cost for trade goods reduced by 11.564 k EUR compared to June 2012 up to 422.165 k EUR. This decrease mainly concerns the cost for transportation and the purchase of energy. The cost for Green Power Certificates amount to 121.237 k EUR compared to 119.810 k EUR in June 2012. 3. Cost for services and other consumables The cost for services and other goods amounts 361.302 k EUR, an increase of 11.994 k EUR compared to June 2012. This increase is due to the increase in costs for the rational use of energy (RUE) to 48.927 k EUR and the cost related to the contribution 100 kWh free of charge to 52.741 k EUR. On the other hand the costs of purchase network grids and direct purchases decrease (due to the bad weather conditions at the beginning of 2013). 4. Employee benefit expenses For the first half of 2013, the employee benefit expenses amount to 220.794 k EUR, a decrease of 3.287 k EUR compared to June 2012. 5. Amortization, depreciation, impairment (on current and non-current assets) and
changes in provisions
30 June 30 June
(In thousands of EUR) 2013 2012
Amortization of intangible assets 19.592 10.869 Depreciation of property, plant and equipment 143.694 143.034 Total amortization and depreciation 163.286 153.903
Impairment of inventories and trade receivables 4.104 -14.544 Changes in provisions -419 -15.685 Total 166.971 123.674
The amortization of intangible assets and the depreciation of property, plant and equipment increased by 9.383 k EUR to 163.286 k EUR. This increase is due to mainly the amortization of investments for the 'smart projects'. In the period up to June 2012, the impairment of trade receivables was impacted by an important write back. In the period up to June 2012, the changes in provisions for rehabilitation costs was impacted by a reversal of the provision, as a result of the sale of various contaminated sites with a rehabilitation obligation for which a provision was recorded.
9
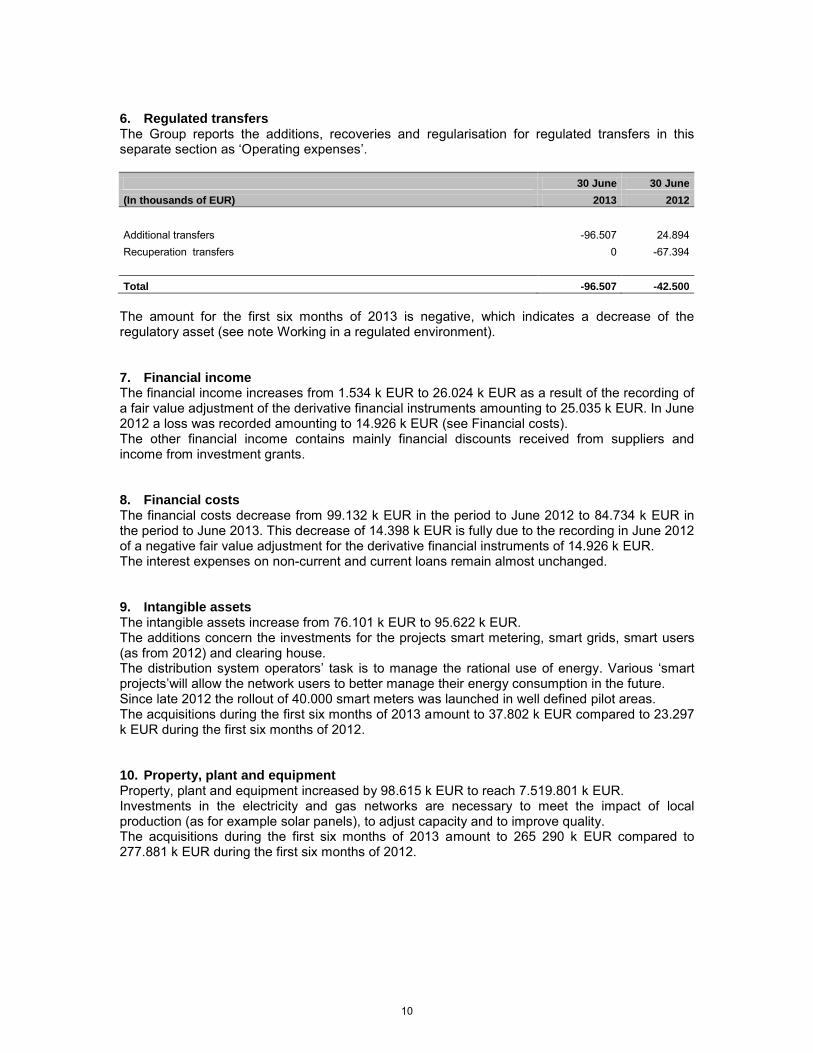
6. Regulated transfers The Group reports the additions, recoveries and regularisation for regulated transfers in this separate section as ‘Operating expenses’.
30 June 30 June
(In thousands of EUR) 2013 2012
Additional transfers -96.507 24.894 Recuperation transfers 0 -67.394
Total -96.507 -42.500
The amount for the first six months of 2013 is negative, which indicates a decrease of the regulatory asset (see note Working in a regulated environment). 7. Financial income The financial income increases from 1.534 k EUR to 26.024 k EUR as a result of the recording of a fair value adjustment of the derivative financial instruments amounting to 25.035 k EUR. In June 2012 a loss was recorded amounting to 14.926 k EUR (see Financial costs). The other financial income contains mainly financial discounts received from suppliers and income from investment grants. 8. Financial costs The financial costs decrease from 99.132 k EUR in the period to June 2012 to 84.734 k EUR in the period to June 2013. This decrease of 14.398 k EUR is fully due to the recording in June 2012 of a negative fair value adjustment for the derivative financial instruments of 14.926 k EUR. The interest expenses on non-current and current loans remain almost unchanged. 9. Intangible assets The intangible assets increase from 76.101 k EUR to 95.622 k EUR. The additions concern the investments for the projects smart metering, smart grids, smart users (as from 2012) and clearing house. The distribution system operators’ task is to manage the rational use of energy. Various ‘smart projects’will allow the network users to better manage their energy consumption in the future. Since late 2012 the rollout of 40.000 smart meters was launched in well defined pilot areas. The acquisitions during the first six months of 2013 amount to 37.802 k EUR compared to 23.297 k EUR during the first six months of 2012. 10. Property, plant and equipment Property, plant and equipment increased by 98.615 k EUR to reach 7.519.801 k EUR. Investments in the electricity and gas networks are necessary to meet the impact of local production (as for example solar panels), to adjust capacity and to improve quality. The acquisitions during the first six months of 2013 amount to 265 290 k EUR compared to 277.881 k EUR during the first six months of 2012.
10

11. Trade and other receivables Trade and other receivables rose by 10.732 k EUR to 1.162.893 k EUR. The increase is on the one hand due to the application of the ‘banking principle’ of the green power and other certificates. Due to the application of banking, being the temporary immobilization of the surplus certificates with a guarantee by the Flemish Region for a certain number of certificates to be sold at an agreed price, this item is increasing further. This receivable amounts to 330.954 k EUR in June 2013 compared to 246.151 k EUR in December 2012. During the first half of 2013, certificates were sold on the market. The result from the sale amounted to 886 k EUR and was included in the item ‘Cost of trade goods’. On the other hand, the transfers are decreasing with 96.507 k EUR (see operating in a regulated environment). 12. Equity Equity amounted to 3.001.997 k EUR, an increase of 222.590 k EUR compared to the end of 2012. This increase is due to the inclusion of the profit for the period amounting to 168.647 k EUR and an actuarial gain related to the defined benefit obligation of 82.700 k EUR, reduced by the dividends paid of 28.757 k EUR. Below the detail of the remaining balance of 2012 dividends paid in 2013 per distribution system operator:
DSOs 30 June
2013
Gaselwest 7.350 IMEA 2.384 Imewo 6.273 Intergem 2.409 Iveka 4.266 Iverlek 5.348 Sibelgas 727 Total 28.757
The reserves increased by 20.073 k EUR. The various components of equity and the movements for the first six months of 2012 and 2013 were reflected in the ‘Condensed consolidated statement of changes in equity’. 13. Non-controlling interest On 17 June 2013 Antwerpse Waterwerken withdrew from De Stroomlijn cvba and SYNDUCTIS cvba has taken over these 77 shares.
11
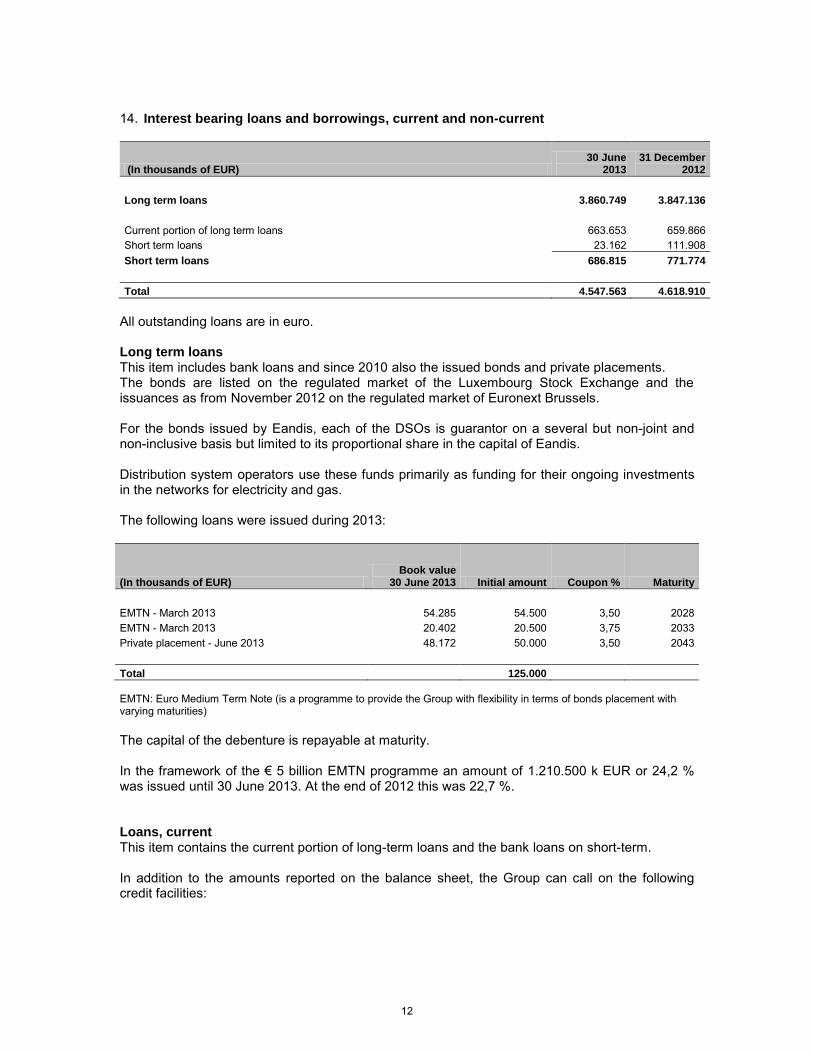
14. Interest bearing loans and borrowings, current and non-current
(In thousands of EUR) 30 June
2013 31 December
2012
Long term loans 3.860.749 3.847.136
Current portion of long term loans 663.653 659.866 Short term loans 23.162 111.908 Short term loans 686.815 771.774
Total 4.547.563 4.618.910
All outstanding loans are in euro. Long term loans This item includes bank loans and since 2010 also the issued bonds and private placements. The bonds are listed on the regulated market of the Luxembourg Stock Exchange and the issuances as from November 2012 on the regulated market of Euronext Brussels. For the bonds issued by Eandis, each of the DSOs is guarantor on a several but non-joint and non-inclusive basis but limited to its proportional share in the capital of Eandis. Distribution system operators use these funds primarily as funding for their ongoing investments in the networks for electricity and gas. The following loans were issued during 2013:
(In thousands of EUR) Book value
30 June 2013 Initial amount Coupon % Maturity
EMTN - March 2013 54.285 54.500 3,50 2028 EMTN - March 2013 20.402 20.500 3,75 2033 Private placement - June 2013 48.172 50.000 3,50 2043 Total 125.000
EMTN: Euro Medium Term Note (is a programme to provide the Group with flexibility in terms of bonds placement with varying maturities) The capital of the debenture is repayable at maturity. In the framework of the € 5 billion EMTN programme an amount of 1.210.500 k EUR or 24,2 % was issued until 30 June 2013. At the end of 2012 this was 22,7 %. Loans, current This item contains the current portion of long-term loans and the bank loans on short-term. In addition to the amounts reported on the balance sheet, the Group can call on the following credit facilities:
12
(In thousands of EUR) 30 June 2013 31 December
2012
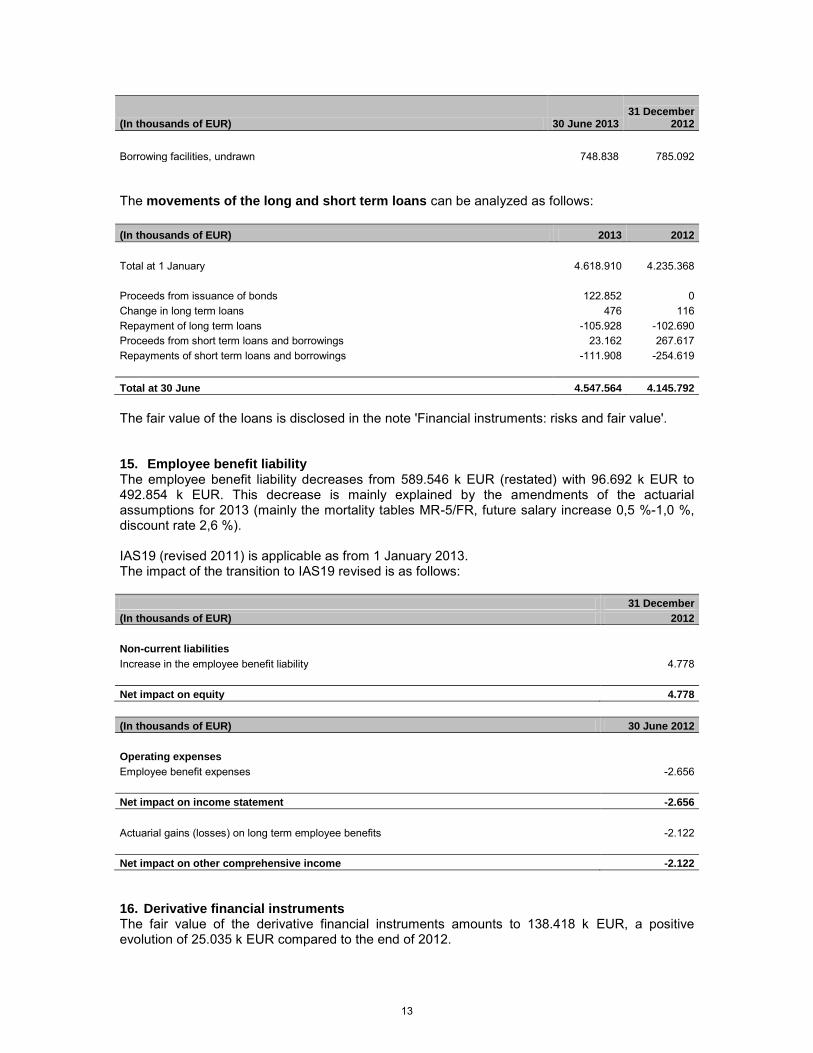
Borrowing facilities, undrawn 748.838 785.092 The movements of the long and short term loans can be analyzed as follows: (In thousands of EUR) 2013 2012
Total at 1 January 4.618.910 4.235.368 Proceeds from issuance of bonds 122.852 0 Change in long term loans 476 116 Repayment of long term loans -105.928 -102.690 Proceeds from short term loans and borrowings 23.162 267.617 Repayments of short term loans and borrowings -111.908 -254.619 Total at 30 June 4.547.564 4.145.792
The fair value of the loans is disclosed in the note 'Financial instruments: risks and fair value'. 15. Employee benefit liability The employee benefit liability decreases from 589.546 k EUR (restated) with 96.692 k EUR to 492.854 k EUR. This decrease is mainly explained by the amendments of the actuarial assumptions for 2013 (mainly the mortality tables MR-5/FR, future salary increase 0,5 %-1,0 %, discount rate 2,6 %). IAS19 (revised 2011) is applicable as from 1 January 2013. The impact of the transition to IAS19 revised is as follows: 31 December
(In thousands of EUR) 2012
Non-current liabilities
Increase in the employee benefit liability 4.778
Net impact on equity 4.778
(In thousands of EUR) 30 June 2012
Operating expenses
Employee benefit expenses -2.656 Net impact on income statement -2.656
Actuarial gains (losses) on long term employee benefits -2.122 Net impact on other comprehensive income -2.122
16. Derivative financial instruments The fair value of the derivative financial instruments amounts to 138.418 k EUR, a positive evolution of 25.035 k EUR compared to the end of 2012.
13
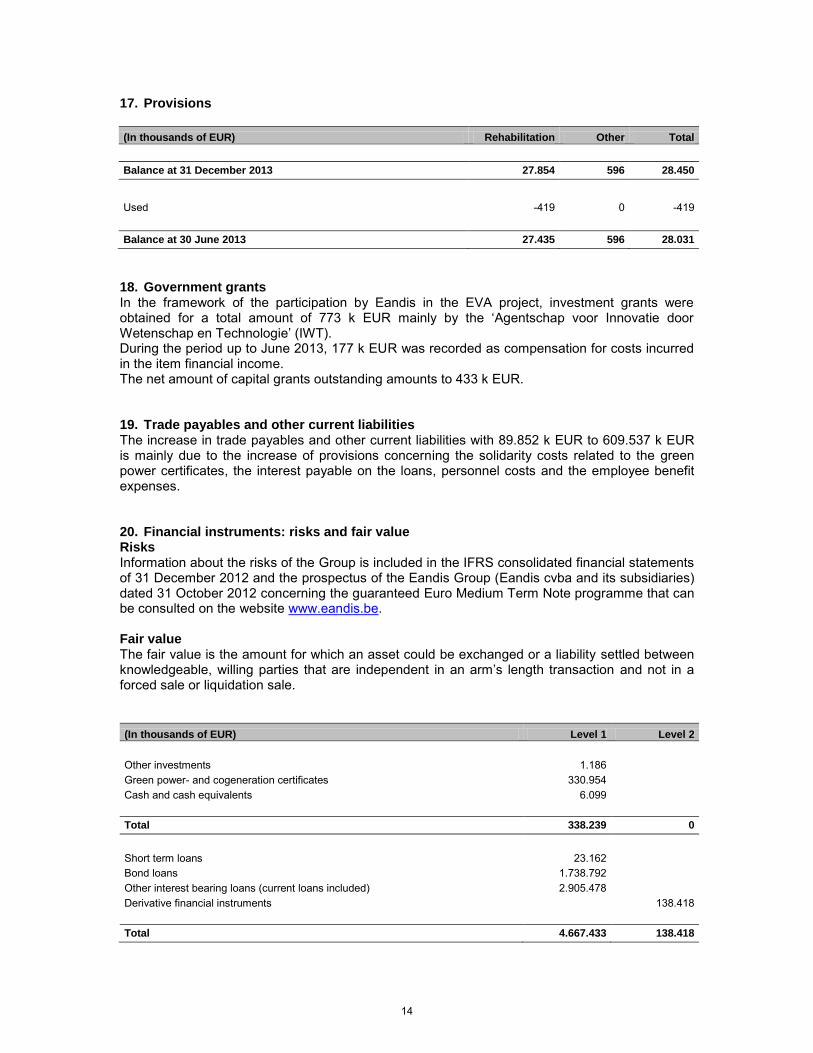
17. Provisions (In thousands of EUR) Rehabilitation Other Total
Balance at 31 December 2013 27.854 596 28.450
Used -419 0 -419 Balance at 30 June 2013 27.435 596 28.031
18. Government grants In the framework of the participation by Eandis in the EVA project, investment grants were obtained for a total amount of 773 k EUR mainly by the ‘Agentschap voor Innovatie door Wetenschap en Technologie’ (IWT). During the period up to June 2013, 177 k EUR was recorded as compensation for costs incurred in the item financial income. The net amount of capital grants outstanding amounts to 433 k EUR. 19. Trade payables and other current liabilities The increase in trade payables and other current liabilities with 89.852 k EUR to 609.537 k EUR is mainly due to the increase of provisions concerning the solidarity costs related to the green power certificates, the interest payable on the loans, personnel costs and the employee benefit expenses. 20. Financial instruments: risks and fair value Risks Information about the risks of the Group is included in the IFRS consolidated financial statements of 31 December 2012 and the prospectus of the Eandis Group (Eandis cvba and its subsidiaries) dated 31 October 2012 concerning the guaranteed Euro Medium Term Note programme that can be consulted on the website www.eandis.be. Fair value The fair value is the amount for which an asset could be exchanged or a liability settled between knowledgeable, willing parties that are independent in an arm’s length transaction and not in a forced sale or liquidation sale. (In thousands of EUR) Level 1 Level 2
Other investments 1.186 Green power- and cogeneration certificates 330.954 Cash and cash equivalents 6.099 Total 338.239 0
Short term loans 23.162 Bond loans 1.738.792 Other interest bearing loans (current loans included) 2.905.478 Derivative financial instruments 138.418 Total 4.667.433 138.418
14
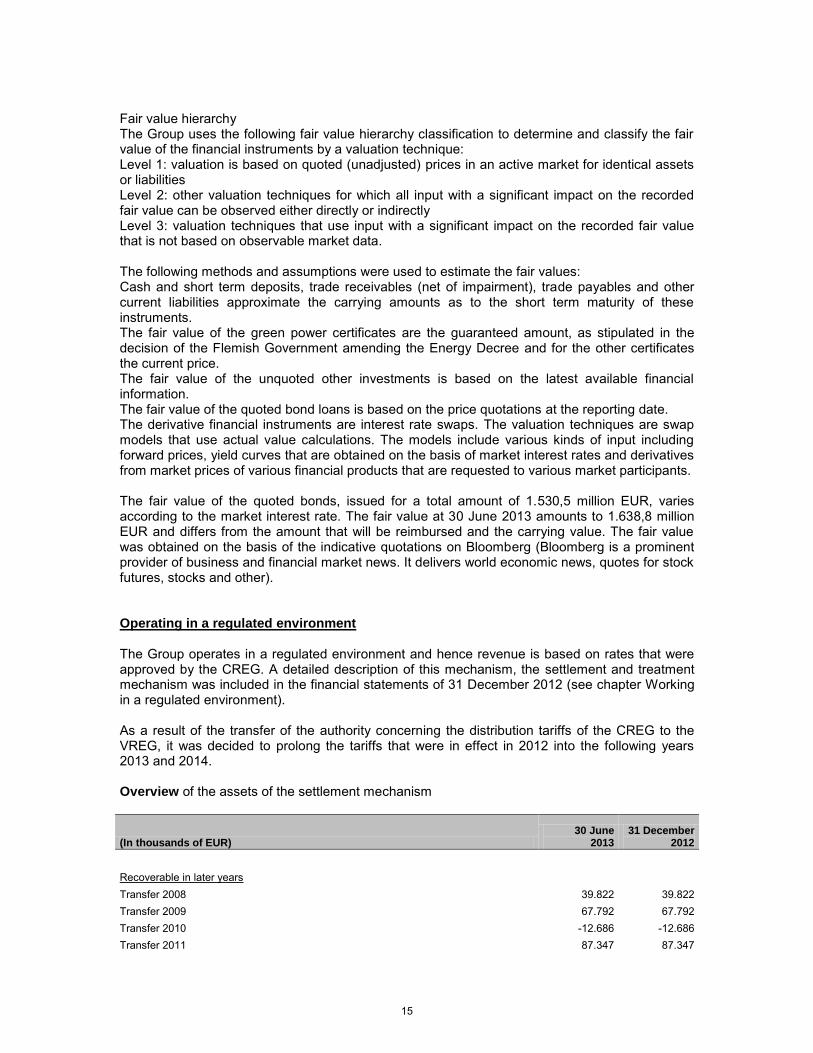
Fair value hierarchy The Group uses the following fair value hierarchy classification to determine and classify the fair value of the financial instruments by a valuation technique: Level 1: valuation is based on quoted (unadjusted) prices in an active market for identical assets or liabilities Level 2: other valuation techniques for which all input with a significant impact on the recorded fair value can be observed either directly or indirectly Level 3: valuation techniques that use input with a significant impact on the recorded fair value that is not based on observable market data. The following methods and assumptions were used to estimate the fair values: Cash and short term deposits, trade receivables (net of impairment), trade payables and other current liabilities approximate the carrying amounts as to the short term maturity of these instruments. The fair value of the green power certificates are the guaranteed amount, as stipulated in the decision of the Flemish Government amending the Energy Decree and for the other certificates the current price. The fair value of the unquoted other investments is based on the latest available financial information. The fair value of the quoted bond loans is based on the price quotations at the reporting date. The derivative financial instruments are interest rate swaps. The valuation techniques are swap models that use actual value calculations. The models include various kinds of input including forward prices, yield curves that are obtained on the basis of market interest rates and derivatives from market prices of various financial products that are requested to various market participants. The fair value of the quoted bonds, issued for a total amount of 1.530,5 million EUR, varies according to the market interest rate. The fair value at 30 June 2013 amounts to 1.638,8 million EUR and differs from the amount that will be reimbursed and the carrying value. The fair value was obtained on the basis of the indicative quotations on Bloomberg (Bloomberg is a prominent provider of business and financial market news. It delivers world economic news, quotes for stock futures, stocks and other). Operating in a regulated environment The Group operates in a regulated environment and hence revenue is based on rates that were approved by the CREG. A detailed description of this mechanism, the settlement and treatment mechanism was included in the financial statements of 31 December 2012 (see chapter Working in a regulated environment). As a result of the transfer of the authority concerning the distribution tariffs of the CREG to the VREG, it was decided to prolong the tariffs that were in effect in 2012 into the following years 2013 and 2014. Overview of the assets of the settlement mechanism
(In thousands of EUR) 30 June
2013 31 December
2012
Recoverable in later years Transfer 2008 39.822 39.822 Transfer 2009 67.792 67.792 Transfer 2010 -12.686 -12.686 Transfer 2011 87.347 87.347
15
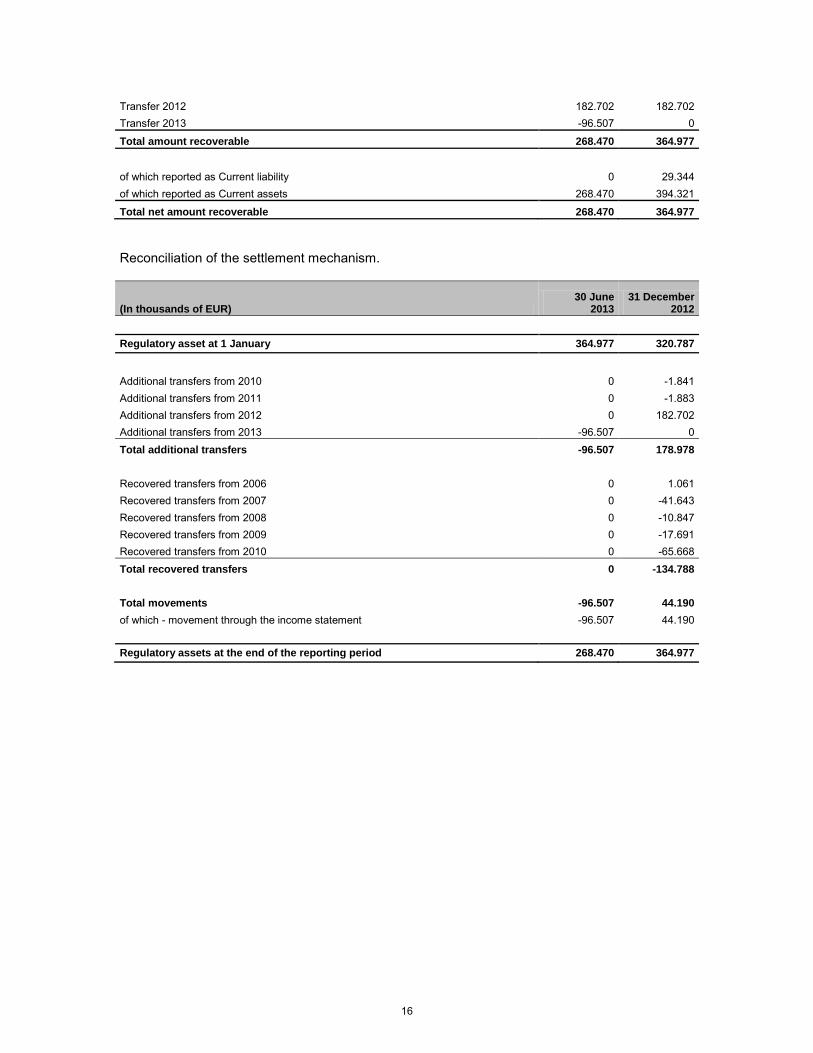
Transfer 2012 182.702 182.702 Transfer 2013 -96.507 0
Total amount recoverable 268.470 364.977
of which reported as Current liability 0 29.344 of which reported as Current assets 268.470 394.321
Total net amount recoverable 268.470 364.977
Reconciliation of the settlement mechanism.
(In thousands of EUR) 30 June
2013 31 December
2012
Regulatory asset at 1 January 364.977 320.787
Additional transfers from 2010 0 -1.841 Additional transfers from 2011 0 -1.883 Additional transfers from 2012 0 182.702 Additional transfers from 2013 -96.507 0 Total additional transfers -96.507 178.978
Recovered transfers from 2006 0 1.061 Recovered transfers from 2007 0 -41.643 Recovered transfers from 2008 0 -10.847 Recovered transfers from 2009 0 -17.691 Recovered transfers from 2010 0 -65.668 Total recovered transfers 0 -134.788
Total movements -96.507 44.190
of which - movement through the income statement -96.507 44.190 Regulatory assets at the end of the reporting period 268.470 364.977
16
Important events during the reporting period On 9 January 2013, the Board of Directors of Eandis appointed Walter Van den Bossche, Director-General, as new CEO of Eandis. He is the successor to Luc De Bruycker who has terminated his active career. The Board of Directors also approved the new composition of the Management Committee. The new structure of the Management Committee officially started as from 1 April 2013. On 6 March 2013, the Board of Directors of Eandis cvba formulated and approved its vision on future developments and evolutions of the distribution grid management in Flanders. A timeline has been laid out by the Eandis Board of Directors, based on a number of milestones already known today, for the different steps in its restructuring plan for the energy distribution sector in Flanders. Eandis has expressed its willingness to discuss and cooperate with all parties concerned in order to reach a consensus on and implement the most efficient structure for tomorrow’s energy distribution sector in the Flemish Region. On 27 March 2013, the shareholders reconstituted the Board of Directors of Eandis, in accordance with the statutory procedure. Piet Buyse was appointed Chairman. On 23 April 2013, the ‘Intercommunale voor Waterbedeling in Vlaams-Brabant’ (IWVB) joined SYNDUCTIS and endorsed 52 shares within the water sector. Belgacom participates for the time being in SYNDUCTIS on a contractual basis for one year and will have an observer in the Board of Directors of SYNDUCTIS. Related parties transactions The nature of the transactions with the Management Committee and the directors during the first half of 2013 does not differ substantially from the transactions included in the annual report of 2012. Subsequent events No subsequent events occurred which could have a significant impact on the interim condensed consolidated financial statement of the Group per 30 June 2013.
17