economic futures in the sahtu region ... · economic futures in the sahtu region: a discussion...
TRANSCRIPT
ECONOMIC FUTURES IN THE SAHTU REGION
A DISCUSSION PAPER ON BUILDING A BALANCED ECONOMY
JANUARY 2016
ECONOMIC FUTURES IN THE SAHTU REGION: A Discussion Paper on Building a Balanced Economy
January 2016
Prepared for Alternatives North
Researchers: Diana Gibson, David Thompson, and Allison Thompson, PolicyLink Research and Consulting
Graphic design by Nadene Rehnby, Hands On Publications
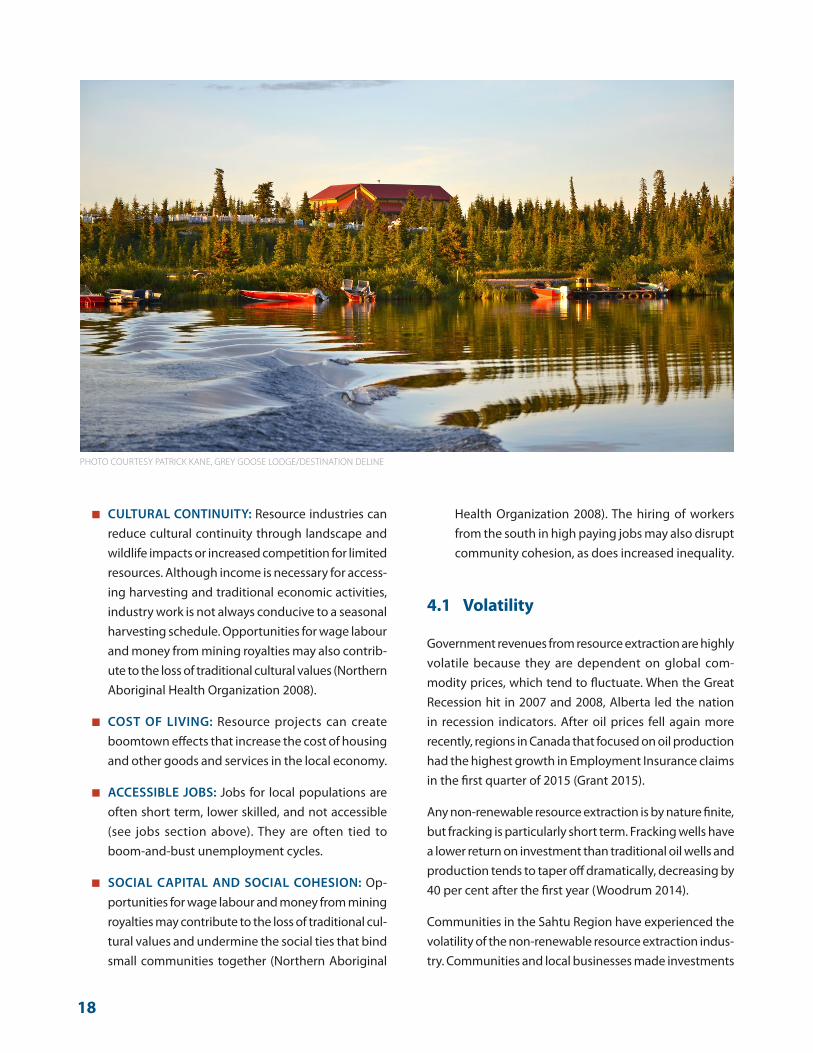
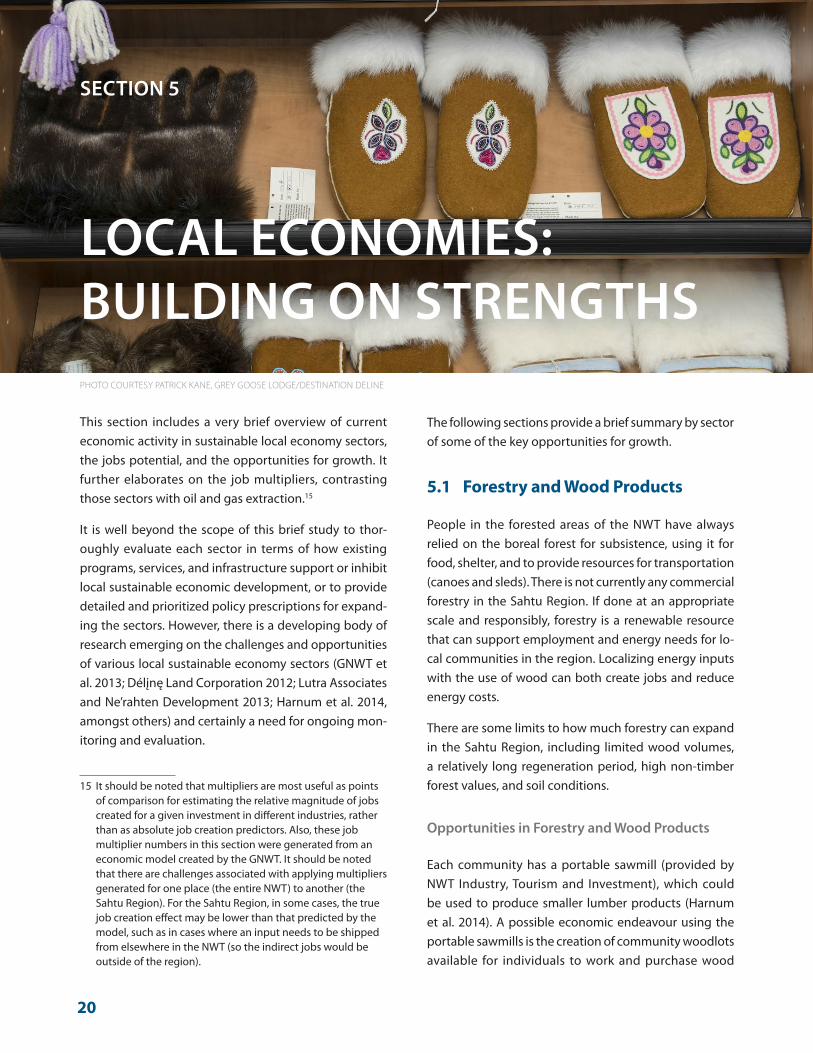
Photos courtesy Sahtu Wildlife, Flickr Creative Commons, flickr.com/photos/sahtuwildlife/ and Patrick Kane, Grey Goose Lodge, DestinationDeline.com
Cover photo courtesy Sahtu Wildlife
P.O. Box 444, Yellowknife, Northwest Territories X1A 2N3
t: 867.873.5422 e: [email protected]
alternativesnorth.ca
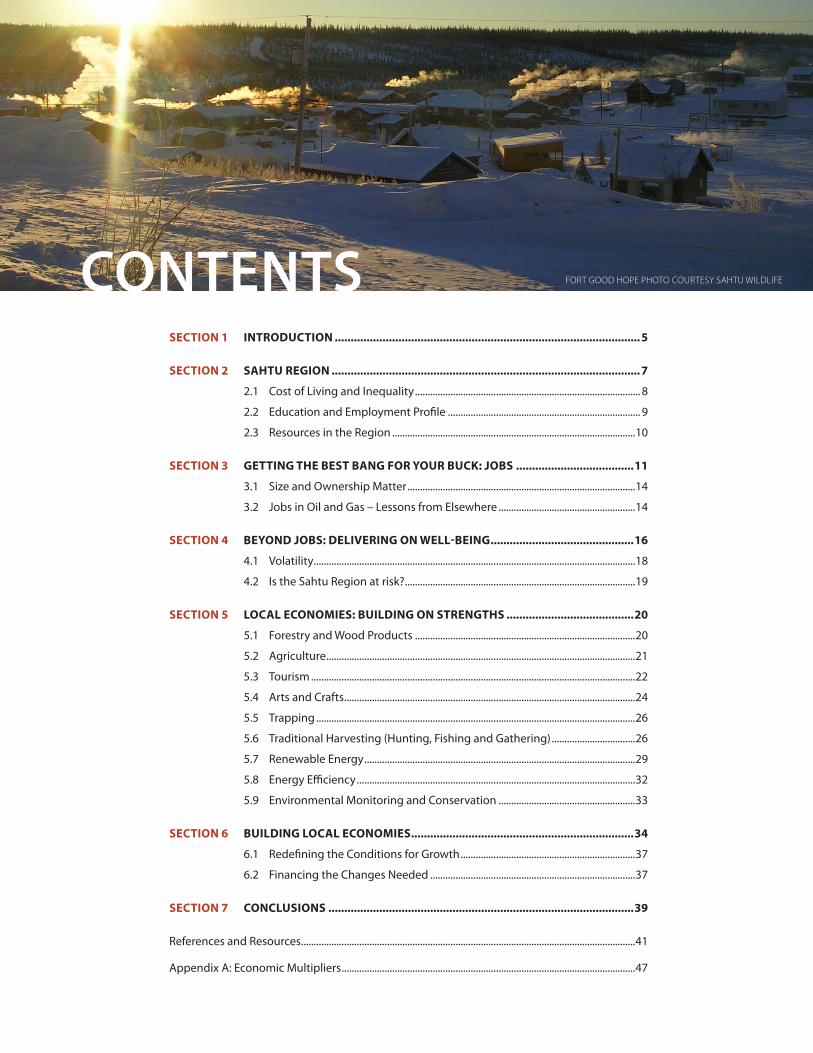
SECTION 1 INTRODUCTION ................................................................................................5
SECTION 2 SAHTU REGION .................................................................................................7
2.1 Cost of Living and Inequality ......................................................................................... 8
2.2 Education and Employment Profile ............................................................................ 9
2.3 Resources in the Region ................................................................................................10
SECTION 3 GETTING THE BEST BANG FOR YOUR BUCK: JOBS .....................................11
3.1 Size and Ownership Matter ..........................................................................................14
3.2 Jobs in Oil and Gas – Lessons from Elsewhere ......................................................14
SECTION 4 BEYOND JOBS: DELIVERING ON WELL-BEING .............................................16
4.1 Volatility ...............................................................................................................................18
4.2 Is the Sahtu Region at risk? ...........................................................................................19
SECTION 5 LOCAL ECONOMIES: BUILDING ON STRENGTHS ........................................20
5.1 Forestry and Wood Products .......................................................................................20
5.2 Agriculture ..........................................................................................................................21
5.3 Tourism ................................................................................................................................22
5.4 Arts and Crafts ...................................................................................................................24
5.5 Trapping ..............................................................................................................................26
5.6 Traditional Harvesting (Hunting, Fishing and Gathering) .................................26
5.7 Renewable Energy ...........................................................................................................29
5.8 Energy Efficiency ..............................................................................................................32
5.9 Environmental Monitoring and Conservation ......................................................33
SECTION 6 BUILDING LOCAL ECONOMIES ......................................................................34
6.1 Redefining the Conditions for Growth .....................................................................37
6.2 Financing the Changes Needed .................................................................................37
SECTION 7 CONCLUSIONS ................................................................................................39
References and Resources ....................................................................................................................................41
Appendix A: Economic Multipliers ....................................................................................................................47
CONTENTS FORT GOOD HOPE PHOTO COURTESY SAHTU WILDLIFE

4
Figures
Figure 1: Administrative Regions in the NWT ................................................................................................. 7
Figure 2: Sahtu Region Map .................................................................................................................................. 8
Figure 3: Selected Economic Multipliers in the NWT .................................................................................12
Figure 4: Employment in NWT Oil and Gas Extraction and Support Services ...................................13
Figure 5: Economic Multipliers for Forestry and Agriculture vs. Oil and Gas, NWT, 2012..............21
Figure 6: Economic Multipliers for Tourism and Arts and Crafts vs. Oil and Gas, NWT, 2012 .......24
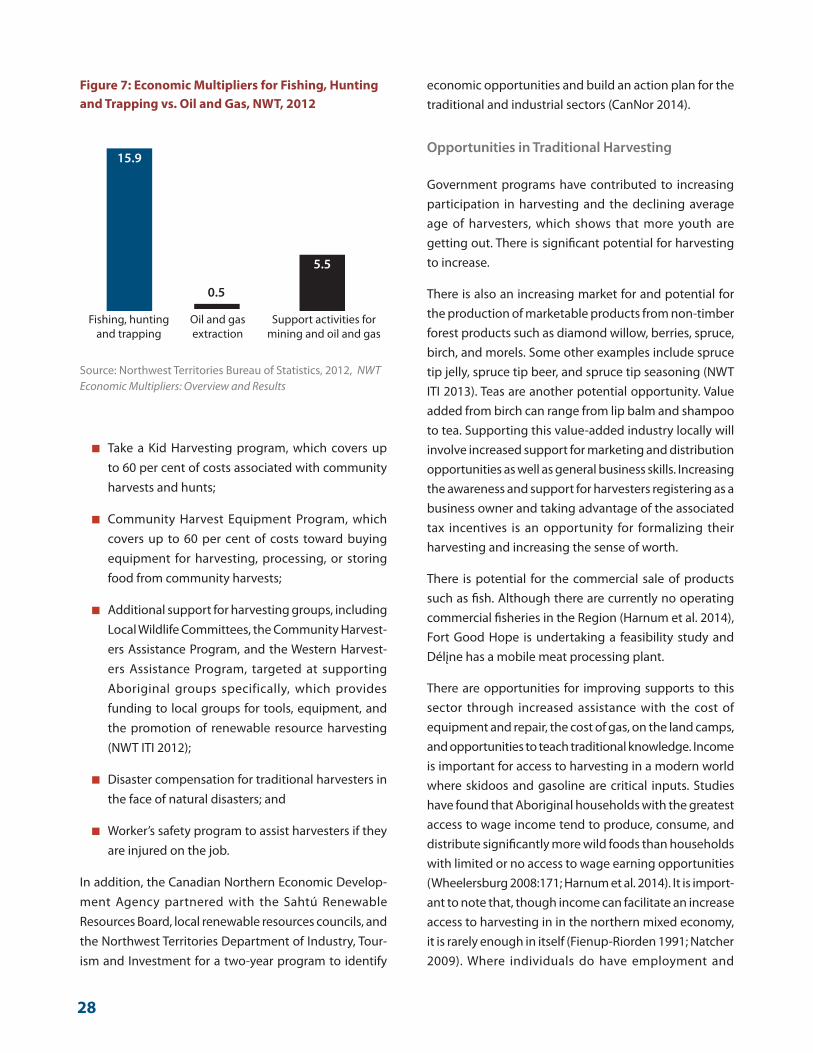
Figure 7: Economic Multipliers for Fishing, Hunting and Trapping vs. Oil and Gas, NWT, 2012 ... 28
Figure 8: Economic Multipliers for Energy Efficiency vs. Oil and Gas, NWT, 2012 ............................32
Figure 9: Economic Multipliers for Enivironmental Monitoring vs. Oil and Gas, NWT, 2012 ........33
Tables
Table 1: NWT Visitor Trends, 2007–2014..........................................................................................................23
Table 2: Persons Who Produced Arts & Crafts During 2013, by Community .....................................25
Table 3: Persons Who Hunted or Fished in Previous Year, by Community, 1999–2014 ..................27

5
In 2011, the Sahtu Region was buzzing with news of oil and gas exploration; 15 shale leases were awarded between 2011 and 2013, and there was talk of a boom. Expanding oil and gas extraction was not without con-troversy, particularly the hydraulic fracturing (fracking) technology that was to be used. However, environmental and social concerns were met with promises of much needed jobs, and promises that the Mackenzie Valley would “wave goodbye” to its 30 to 40 per cent unemploy-ment rate.1
In June 2014, an international oil price crash resulting in a slowdown and, instead of a boom, local contractors in the Sahtu Region were laying off workers. Despite this lull, in the spring of 2015, the Government of the Northwest Territories (GNWT) proposed new regulations for fracking, sparking heated public debate.
The Sahtu Region struggles with some of the lowest incomes, highest unemployment rates, and highest cost of living in the NWT. In this context, the promises of jobs and economic gain are politically powerful. However, it
1 Minister David Ramsay (Industry, Tourism and Investment) in Chris Puglia, “Oil boom will bring jobs for everyone,” Northern News Services, December 2, 2013, nnsl.com/frames/newspapers/2013-12/dec2_13oil.html
SECTION 1
INTRODUCTION
is important to look closely at the ability of oil and gas to deliver on those promises, and to consider the risk that oil and gas may foreclose other, more sustainable and preferred economic options. The slowdown provides an important reprieve that allows for informed debate.
The Sahtu Region and the Northwest Territories face a choice between two different economic futures. One is a future dominated by industrial resource extraction. This future holds out claims of high-paying jobs and much needed income for governments, often appearing to be a silver bullet. The other economic future is a broader and more sustainable economy based on renewable resources and building on local strengths across a range of sectors, from agriculture, renewable energy, and forestry, to arts and tourism.
The resource extraction option hinges largely on the potential for major expansion in oil and gas extraction in the Sahtu Region, and on fracking. This fits with the “industrial recruitment” economic development theory, which focuses on attracting high-profile investment from outside, often in order to produce an export product. In this model, governments use a variety of subsidy and incentive mechanisms to attract outside investment dollars that are looking for profits.
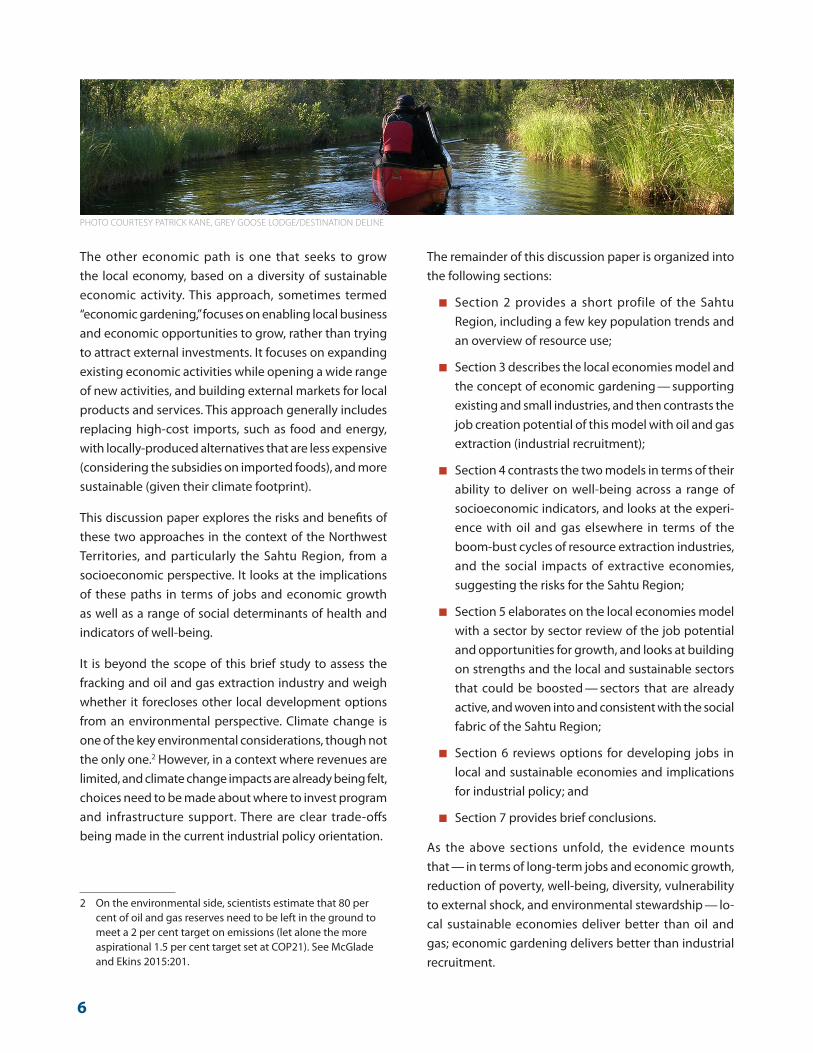
PHOTO COURTESY PATRICK KANE, GREY GOOSE LODGE/DESTINATION DELINE
“The oil and gas industry has packed up and left the NWT. We don’t expect to see
any exploration for probably 10 years.” — Robert McLeod, MLA and Premier
6
The other economic path is one that seeks to grow the local economy, based on a diversity of sustainable economic activity. This approach, sometimes termed “economic gardening,” focuses on enabling local business and economic opportunities to grow, rather than trying to attract external investments. It focuses on expanding existing economic activities while opening a wide range of new activities, and building external markets for local products and services. This approach generally includes replacing high-cost imports, such as food and energy, with locally-produced alternatives that are less expensive (considering the subsidies on imported foods), and more sustainable (given their climate footprint).
This discussion paper explores the risks and benefits of these two approaches in the context of the Northwest Territories, and particularly the Sahtu Region, from a socioeconomic perspective. It looks at the implications of these paths in terms of jobs and economic growth as well as a range of social determinants of health and indicators of well-being.
It is beyond the scope of this brief study to assess the fracking and oil and gas extraction industry and weigh whether it forecloses other local development options from an environmental perspective. Climate change is one of the key environmental considerations, though not the only one.2 However, in a context where revenues are limited, and climate change impacts are already being felt, choices need to be made about where to invest program and infrastructure support. There are clear trade-offs being made in the current industrial policy orientation.
2 On the environmental side, scientists estimate that 80 per cent of oil and gas reserves need to be left in the ground to meet a 2 per cent target on emissions (let alone the more aspirational 1.5 per cent target set at COP21). See McGlade and Ekins 2015:201.
The remainder of this discussion paper is organized into the following sections:
■ Section 2 provides a short profile of the Sahtu Region, including a few key population trends and an overview of resource use;
■ Section 3 describes the local economies model and the concept of economic gardening — supporting existing and small industries, and then contrasts the job creation potential of this model with oil and gas extraction (industrial recruitment);
■ Section 4 contrasts the two models in terms of their ability to deliver on well-being across a range of socioeconomic indicators, and looks at the experi-ence with oil and gas elsewhere in terms of the boom-bust cycles of resource extraction industries, and the social impacts of extractive economies, suggesting the risks for the Sahtu Region;
■ Section 5 elaborates on the local economies model with a sector by sector review of the job potential and opportunities for growth, and looks at building on strengths and the local and sustainable sectors that could be boosted — sectors that are already active, and woven into and consistent with the social fabric of the Sahtu Region;
■ Section 6 reviews options for developing jobs in local and sustainable economies and implications for industrial policy; and
■ Section 7 provides brief conclusions.
As the above sections unfold, the evidence mounts that — in terms of long-term jobs and economic growth, reduction of poverty, well-being, diversity, vulnerability to external shock, and environmental stewardship — lo-cal sustainable economies deliver better than oil and gas; economic gardening delivers better than industrial recruitment.
PHOTO COURTESY PATRICK KANE, GREY GOOSE LODGE/DESTINATION DELINE
7
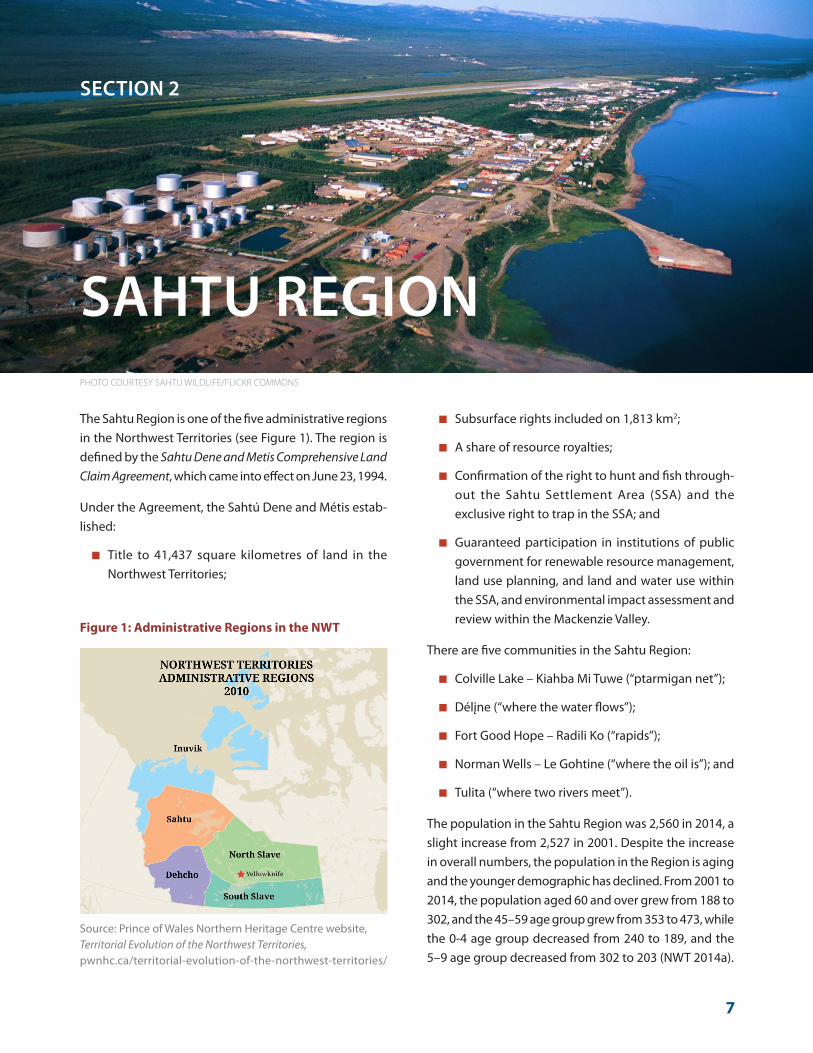
The Sahtu Region is one of the five administrative regions in the Northwest Territories (see Figure 1). The region is defined by the Sahtu Dene and Metis Comprehensive Land Claim Agreement, which came into effect on June 23, 1994.
Under the Agreement, the Sahtú Dene and Métis estab-lished:
■ Title to 41,437 square kilometres of land in the Northwest Territories;
■ Subsurface rights included on 1,813 km2;
■ A share of resource royalties;
■ Confirmation of the right to hunt and fish through-out the Sahtu Settlement Area (SSA) and the exclusive right to trap in the SSA; and
■ Guaranteed participation in institutions of public government for renewable resource management, land use planning, and land and water use within the SSA, and environmental impact assessment and review within the Mackenzie Valley.
There are five communities in the Sahtu Region:
■ Colville Lake – Kiahba Mi Tuwe (“ptarmigan net”);
■ Délįne (“where the water flows”);
■ Fort Good Hope – Radili Ko (“rapids”);
■ Norman Wells – Le Gohtine (“where the oil is”); and
■ Tulita (“where two rivers meet”).
The population in the Sahtu Region was 2,560 in 2014, a slight increase from 2,527 in 2001. Despite the increase in overall numbers, the population in the Region is aging and the younger demographic has declined. From 2001 to 2014, the population aged 60 and over grew from 188 to 302, and the 45–59 age group grew from 353 to 473, while the 0-4 age group decreased from 240 to 189, and the 5–9 age group decreased from 302 to 203 (NWT 2014a).
SECTION 2
SAHTU REGION
Figure 1: Administrative Regions in the NWT
Source: Prince of Wales Northern Heritage Centre website, Territorial Evolution of the Northwest Territories,pwnhc.ca/territorial-evolution-of-the-northwest-territories/
PHOTO COURTESY SAHTU WILDLIFE/FLICKR COMMONS

8
Similar to the population, infrastructure in the Sahtu Region is also aging (GNWT 2014a). Energy and water infrastructure have both been identified as at risk of failure. More generally, inadequate infrastructure and a heavy reliance on imported fuel create vulnerabilities. Norman Wells has experienced two shortages in natural gas (its main electricity source) over the past five years. Délįne, Colville Lake, Fort Good Hope, and Tulita are all powered by diesel, which must be imported into these regions. Many of the communities in the Sahtu Region currently experience annual boil water advisories. The ef-fects of climate change, including an increase in extreme weather and a shorter season for the ice road, mean that both water and energy infrastructure are going to be increasingly at risk and in need of additional investment.
2.1 Cost of Living and Inequality
Heavy reliance by communities in the Sahtu Region on imported food and fuel contributes significantly to the high cost of living. The cost of living in the NWT has been higher than the Canadian average for six of the past eight years, particularly in Sahtu Region communities.3 Yellowknife residents paid 10 per cent more for the same
3 Data on the cost of living from Northwest Territories Bureau of Statistics, Consumer Price Index, statsnwt.ca/prices-expenditures/cpi/; Statistics Canada, 2015, Consumer price index, food, by province (Alberta), statcan.gc.ca/tables-tableaux/sum-som/l01/cst01/econ156j-eng.htm
food basket than Edmonton residents, while community residents of Tulita, Délįne, and Norman Wells paid 50 per cent more than those in Yellowknife.
There is significant inequality within and between the communities in the Sahtu Region. In 2012, 35 per cent of residents reported incomes of greater than $50,000, while 31 per cent reported incomes of less than $15,000.4 When this data is broken out by community, a pattern begins to appear. In Norman Wells, residents reporting greater income than $50,000 in 2012 was 61 per cent, while the other communities ranged from 21 to 35 per cent. Similarly, residents in Norman Wells reporting less than $15,000 in annual income was 16 per cent, while the other communities in the Region ranged from 31 to 41 per cent.
The next section documents how these inequalities extend into education and employment. There are gender and cultural dimensions to inequality with a gap between the Aboriginal and non-Aboriginal populations and between women and men.
4 The income statistics for this section, except where otherwise indicated, are from the NWT Bureau of Statistics online data summaries at statsnwt.ca/labour-income/income/index.html. Information on personal and family income for the Northwest Territories and NWT communities comes from tax information compiled by Statistics Canada.
Figure 2: Sahtu Region Map
SOURCE: LAND AND WATER BOARDS OF THE MACKENZIE VALLEY TULITA PHOTO COURTESY SAHTU WILDLIFE/FLICKR COMMONS
9
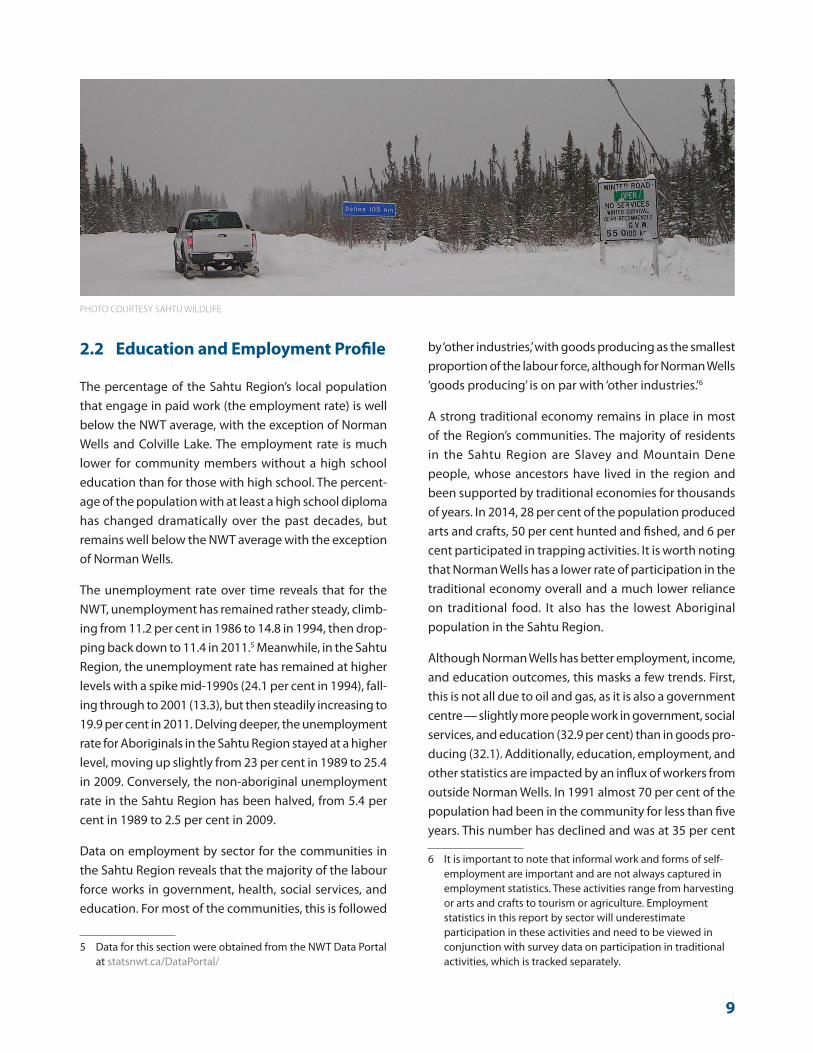
2.2 Education and Employment Profile
The percentage of the Sahtu Region’s local population that engage in paid work (the employment rate) is well below the NWT average, with the exception of Norman Wells and Colville Lake. The employment rate is much lower for community members without a high school education than for those with high school. The percent-age of the population with at least a high school diploma has changed dramatically over the past decades, but remains well below the NWT average with the exception of Norman Wells.
The unemployment rate over time reveals that for the NWT, unemployment has remained rather steady, climb-ing from 11.2 per cent in 1986 to 14.8 in 1994, then drop-ping back down to 11.4 in 2011.5 Meanwhile, in the Sahtu Region, the unemployment rate has remained at higher levels with a spike mid-1990s (24.1 per cent in 1994), fall-ing through to 2001 (13.3), but then steadily increasing to 19.9 per cent in 2011. Delving deeper, the unemployment rate for Aboriginals in the Sahtu Region stayed at a higher level, moving up slightly from 23 per cent in 1989 to 25.4 in 2009. Conversely, the non-aboriginal unemployment rate in the Sahtu Region has been halved, from 5.4 per cent in 1989 to 2.5 per cent in 2009.
Data on employment by sector for the communities in the Sahtu Region reveals that the majority of the labour force works in government, health, social services, and education. For most of the communities, this is followed
5 Data for this section were obtained from the NWT Data Portal at statsnwt.ca/DataPortal/
by ‘other industries,’ with goods producing as the smallest proportion of the labour force, although for Norman Wells ‘goods producing’ is on par with ‘other industries.’6
A strong traditional economy remains in place in most of the Region’s communities. The majority of residents in the Sahtu Region are Slavey and Mountain Dene people, whose ancestors have lived in the region and been supported by traditional economies for thousands of years. In 2014, 28 per cent of the population produced arts and crafts, 50 per cent hunted and fished, and 6 per cent participated in trapping activities. It is worth noting that Norman Wells has a lower rate of participation in the traditional economy overall and a much lower reliance on traditional food. It also has the lowest Aboriginal population in the Sahtu Region.
Although Norman Wells has better employment, income, and education outcomes, this masks a few trends. First, this is not all due to oil and gas, as it is also a government centre — slightly more people work in government, social services, and education (32.9 per cent) than in goods pro-ducing (32.1). Additionally, education, employment, and other statistics are impacted by an influx of workers from outside Norman Wells. In 1991 almost 70 per cent of the population had been in the community for less than five years. This number has declined and was at 35 per cent
6 It is important to note that informal work and forms of self-employment are important and are not always captured in employment statistics. These activities range from harvesting or arts and crafts to tourism or agriculture. Employment statistics in this report by sector will underestimate participation in these activities and need to be viewed in conjunction with survey data on participation in traditional activities, which is tracked separately.
PHOTO COURTESY SAHTU WILDLIFE
10
in 2011, but still remains high compared to the rest of the Sahtu Region (approximately 10 per cent). The temporary nature of the oil economy in Norman Wells is already in evidence as the depletion of natural gas resources and peak of oil production are already having an impact. The relatively high reliance on the oil economy in a town the size of Norman Wells makes it very vulnerable to change in that volatile and finite industry.
2.3 Resources in the Region
The Sahtu Region has a bounty of both renewable and non-renewable resources that the local economies depend on to varying degrees. Three co-management boards in the region work with communities, govern-ment, and industry to manage the land and resources: the Sahtú Renewable Resources Board (SRRB), Sahtu Land and Water Board (SLWB), and Sahtu Land Use Planning Board (SLUPB).
Renewable Resources
Renewable resources have historically been the founda-tion of the Sahtu Region economy. According to the SRRB Sahtu Atlas, based on a resource mapping project in 2000, renewable resources relied on in the Sahtu Region included fish, wildlife, and forests.7 Renewable energy potential adds solar, wind, hydro, geothermal, and biomass to this list.
There is already a strong local economy based on a range of renewable resources from agriculture and fishing to non-timber forest products and harvesting. There have been inroads made in most communities in the Sahtu Region on introducing renewable energy to replace diesel and natural gas. See Section 5 for an overview of renew-able resources and the potential for development.
7 Sahtú Renewable Resources Board website, Sahtu Atlas, Renewable Resources Management, www.srrb.nt.ca/index.php?option=com_content&view=article&id=202:renewable-resource-management&catid=102:resources-and-development&Itemid=689
Non-Renewable Resources
The majority of the NWT’s natural gas and crude oil production comes from Norman Wells. Conventional oil and natural gas are both on the decline in Norman Wells and Imperial Oil has restricted gas sales for residential and business use due to dwindling supplies. Production at the conventional oil field, which is owned and oper-ated by Calgary-based Imperial Oil Ltd., peaked in 1992 at 35,000 barrels per day (bpd) and has been sitting at about 13,000 bpd. There is significant speculation and no firm estimate as to how many more years the field will remain operational.8 Non-conventional sources, such as the Canol Shale discovery, are getting more attention and being promoted by the NWT government as holding great promise.9
However, debate about the costs and benefits of resource extraction is not new to the Sahtu Region. The extensive debate about the Mackenzie Valley pipeline illustrates how controversial fossil fuel extraction is in the region and the need for a closer examination of extractive industries. The next section begins the process of unpacking the two economic models and contrasting the job creation potential.
8 For a discussion of production levels and estimates for the future, see “Time is running out for Norman Wells’ nearly century-old oil field. But the town is hardly panicking” by Darren Campbell in Up Here Business, a news magazine for the Yukon, NWT, and Nunavut, upherebusiness.ca/post/89876587042
9 For more detail, see NWT Ministry of Industry Tourism and Investment, Sahtu (profile), iti.gov.nt.ca/content/sahtu-profile
11
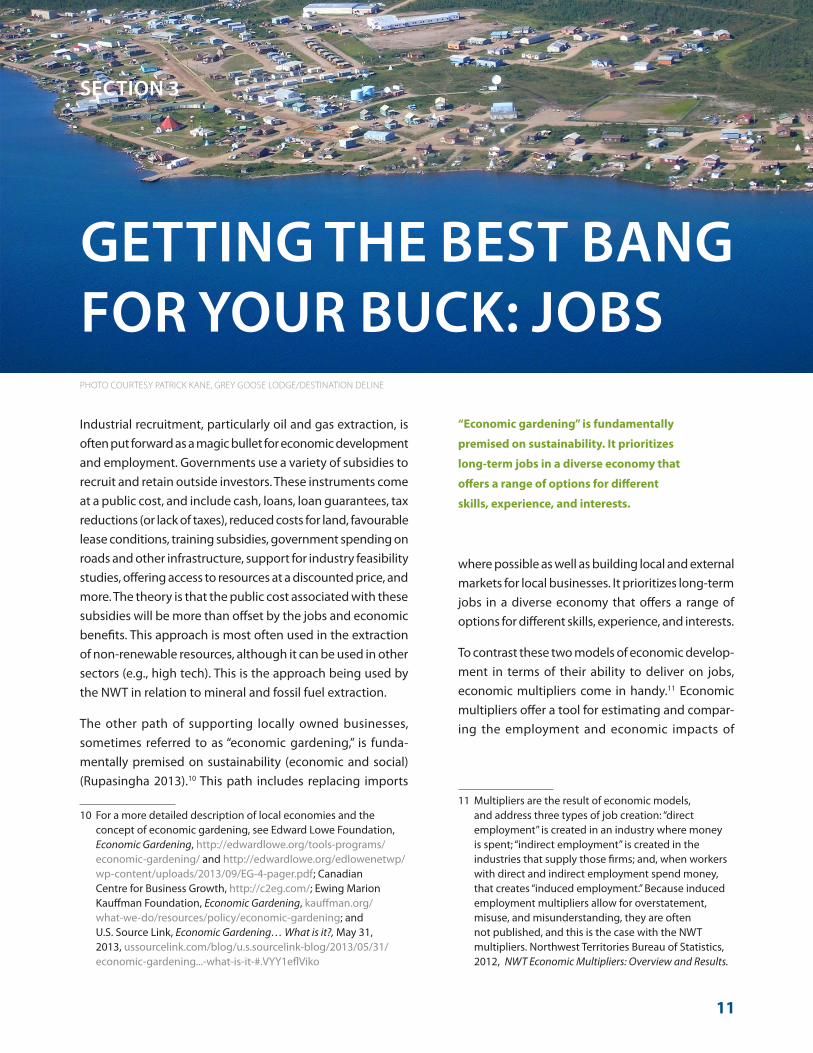
Industrial recruitment, particularly oil and gas extraction, is often put forward as a magic bullet for economic development and employment. Governments use a variety of subsidies to recruit and retain outside investors. These instruments come at a public cost, and include cash, loans, loan guarantees, tax reductions (or lack of taxes), reduced costs for land, favourable lease conditions, training subsidies, government spending on roads and other infrastructure, support for industry feasibility studies, offering access to resources at a discounted price, and more. The theory is that the public cost associated with these subsidies will be more than offset by the jobs and economic benefits. This approach is most often used in the extraction of non-renewable resources, although it can be used in other sectors (e.g., high tech). This is the approach being used by the NWT in relation to mineral and fossil fuel extraction.
The other path of supporting locally owned businesses, sometimes referred to as “economic gardening,” is funda-mentally premised on sustainability (economic and social) (Rupasingha 2013).10 This path includes replacing imports
10 For a more detailed description of local economies and the concept of economic gardening, see Edward Lowe Foundation, Economic Gardening, http://edwardlowe.org/tools-programs/economic-gardening/ and http://edwardlowe.org/edlowenetwp/wp-content/uploads/2013/09/EG-4-pager.pdf; Canadian Centre for Business Growth, http://c2eg.com/; Ewing Marion Kauffman Foundation, Economic Gardening, kauffman.org/what-we-do/resources/policy/economic-gardening; and U.S. Source Link, Economic Gardening… What is it?, May 31, 2013, ussourcelink.com/blog/u.s.sourcelink-blog/2013/05/31/economic-gardening...-what-is-it-#.VYY1eflViko
where possible as well as building local and external markets for local businesses. It prioritizes long-term jobs in a diverse economy that offers a range of options for different skills, experience, and interests.
To contrast these two models of economic develop-ment in terms of their ability to deliver on jobs, economic multipliers come in handy.11 Economic multipliers offer a tool for estimating and compar-ing the employment and economic impacts of
11 Multipliers are the result of economic models, and address three types of job creation: “direct employment” is created in an industry where money is spent; “indirect employment” is created in the industries that supply those firms; and, when workers with direct and indirect employment spend money, that creates “induced employment.” Because induced employment multipliers allow for overstatement, misuse, and misunderstanding, they are often not published, and this is the case with the NWT multipliers. Northwest Territories Bureau of Statistics, 2012, NWT Economic Multipliers: Overview and Results.
SECTION 3
GETTING THE BEST BANG FOR YOUR BUCK: JOBS
“Economic gardening” is fundamentally
premised on sustainability. It prioritizes
long-term jobs in a diverse economy that
offers a range of options for different
skills, experience, and interests.
PHOTO COURTESY PATRICK KANE, GREY GOOSE LODGE/DESTINATION DELINE

12
Figure 3: Selected Economic Multipliers in the NWT
23.4forestry and logging
15.9fishing, hunting and trapping
13.7transit and ground passenger transportation
13.3arts, entertainment and recreation
12.9repair and maintenance
12.4retail trade
11.9personal and laundry services and private households
11.3administrative and support services
10.7accommodation and food services
9.7support activities for agriculture and forestry
8.5crop and animal production
6.8educational services
6.7Waste management and remediation services
6.6professional, scientific and technical services
6.4health care and social assistance
5.5support activities for mining and oil and gas extraction
4.1information and cultural industries
4.1transportation and Warehousing
3.5construction
1.6electric poWer generation, transmission and distribution
1.1diamond mining
0.5oil and gas extraction
number of jobs created per $ million invested
Note: For a complete list of economic multipliers in the NWT, see Appendix A.
Source: Northwest Territories Bureau of Statistics, 2012, NWT Economic Multipliers: Overview and Results
13
various investments (public or private sector).12 A glance at NWT multipliers (Figure 3) shows that almost any spending will create employment.13 However, there are large differences in how much employment is created per dollar, depending on where the spending is directed.
Figure 3 illustrates that sustainable local economic activities generate far more jobs per dollar invested than non-renewable resource extraction. Forestry is the highest at more than 40 times the rate for oil and gas extraction. Fishing hunting and trapping is a close second. Arts and crafts, tourism, and agriculture are all in the top half for job creation. Construction (building transit or energy retrofits) creates about three times as many jobs as oil and gas. Although renewable energy is not broken out in the multipliers data, overall repair and maintenance (key jobs for solar and wind) are in the top five.
Investing in physical and social infrastructure is also a good jobs investment. Health care and social assistance, as well as educational services, create jobs at between 11 and 13 times the rate of oil and gas extraction. With the aging population, ‘personal services’ is another area that would be a good investment, with high multipliers. Infrastructure and construction also have relatively high multipliers for jobs. Research has also shown that investments in public infrastructure, including standard infrastructure such as roads and transportation systems, but also health, community, and social infrastructure, help to support local economies as they lower business costs and increase labour productivity, resulting in higher private sector financial returns (Brodhead et al. 2014).
Oil and gas extraction creates fewer jobs per dollar than any other industry, at just one half of one job per $1 mil-lion. Where does the rest of that money go? As these are capital-intensive industries, much of their procurement dollars leave the region to pay for imported goods, and the high level of foreign ownership means that profits are also exported to shareholders, many of who live outside
12 Note that the use of multipliers for estimating the impact of particular investments in a given sector is rough, and they are better used for comparisons of investment impacts between different sectors (e.g., oil and gas extraction vs. construction, education, or tourism).
13 Consistent with industry and government definitions, the term “jobs” in this report is defined as person-years of employment.
of Canada. Such “leakage” is a major challenge in job cre-ation for some industries, particularly in the North where economies of scale are too small to enable many of the inputs to be manufactured locally. The NWT multipliers take into consideration the high level of leakage in the northern context.
After oil and gas extraction, the next worst industry for job creation is pipeline transportation, at one job per $1 million, followed tightly by diamond mining at 1.1 jobs. Support activities for mining and oil and gas extraction creates 5.5 jobs per $1 million. All of these subsectors are a part of the overall sector, “mining and oil and gas extraction,” which creates just 1.3 jobs for every $1 million invested.
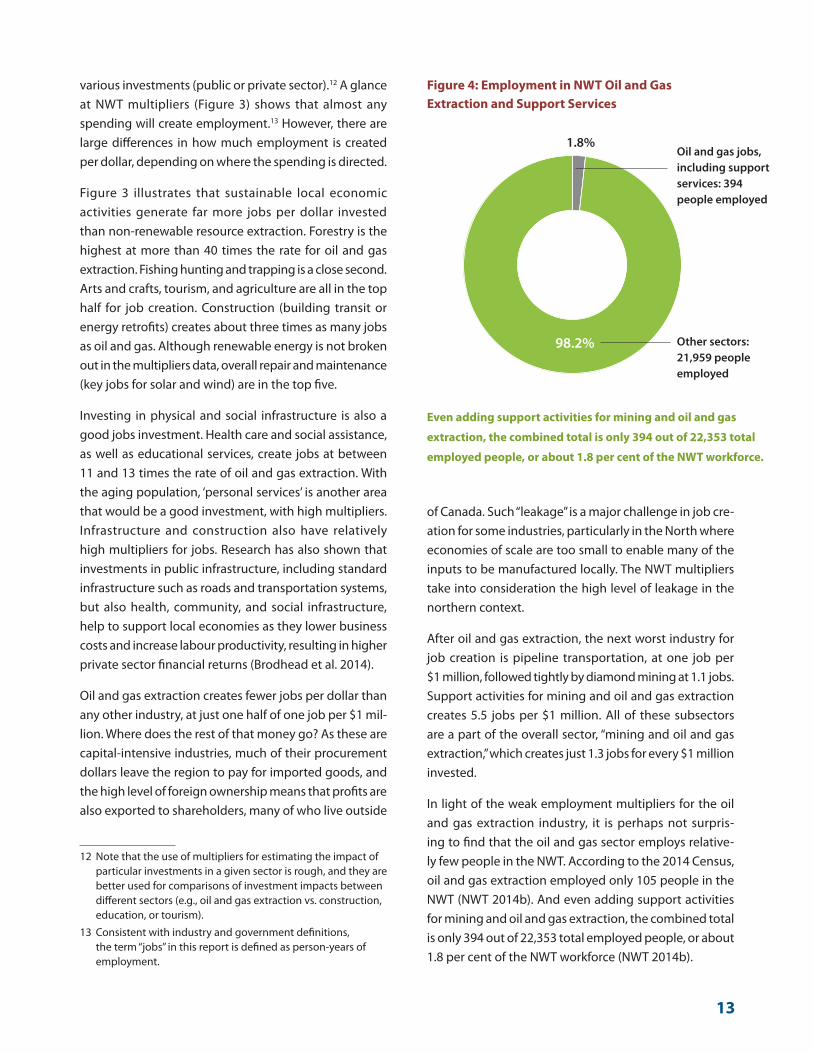
In light of the weak employment multipliers for the oil and gas extraction industry, it is perhaps not surpris-ing to find that the oil and gas sector employs relative-ly few people in the NWT. According to the 2014 Census, oil and gas extraction employed only 105 people in the NWT (NWT 2014b). And even adding support activities for mining and oil and gas extraction, the combined total is only 394 out of 22,353 total employed people, or about 1.8 per cent of the NWT workforce (NWT 2014b).
Even adding support activities for mining and oil and gas
extraction, the combined total is only 394 out of 22,353 total
employed people, or about 1.8 per cent of the NWT workforce.
Figure 4: Employment in NWT Oil and Gas Extraction and Support Services
Oil and gas jobs, including support services: 394 people employed
1.8%
98.2% Other sectors: 21,959 people employed
14
Although the GDP multipliers for oil and gas extraction are higher than the employment multipliers, the GDP impact of the sector is relatively small within the broader NWT economy, accounting for less than 9 per cent of total GDP (NWT 2014b).
Job multipliers do not tell the whole story for local jobs in the NWT and particularly the Sahtu Region oil and gas sector. Many of those workers are brought in from outside, meaning further “leakage.” The Northern Journal reports that of approximately 200 workers onsite at ConocoPhil-lips’ exploratory operations in 2013–14, only 65, less than one third, were from the Sahtu Region. Even with the Husky Road project, only half of the 40 workers were from the Sahtu Region.14 To get a very rough sense of the jobs benefits for local communities in the Sahtu Region, based on the above two examples, the extremely low job multiplier for oil and gas extraction and support activities would need to be cut by one half for road building and two thirds for exploration. Industry continues to report a range of challenges associated with the hire and retention of locals (GNWT 2014b).
3.1 Size and Ownership Matter
The previous section laid out the multipliers for jobs by sector and illustrated that not all sectors are equal when it comes to job creation. A variety of studies have also looked at the relationship between job multipliers and the size of a business and ownership (local vs. outside the region), finding that both matter for local job and economic impacts.
■ A UBC report on the economic benefits of local procurement policies and locally-focused economic development found that local ownership has higher multipliers: local companies spend a greater por-tion of the revenue they receive back in the local economy (Pringle 2013).
■ A B.C. study determined that “for every $1 million in sales, independent retail stores generate $450,000 in local economic activity, compared to just $170,000 for chains. Among restaurants, the figures are $650,000 for independents and $300,000 for chains”
14 Megan Wholberg, “Sahtu needs coordinated training plan,” Northern Journal, April 14, 2014.
(Civic Economics 2013). Across both sectors, this translates into about 2.6 times as many local jobs created when spending is directed to independent businesses instead of chains.
■ A similar study looked at local retail sales in Salt Lake City and found that dollars spent at locally owned stores generate almost four times as much economic benefit for the surrounding region as shopping at a chain (Civic Economics 2012). That study also found that eating at a local restaurant produces more than twice the local economic impact of dining at a chain restaurant and that local business spends significantly more of their revenue in the local economy (52–79 per cent versus 14–30 per cent from chain businesses).
■ A study by the Federal Reserve Bank of Atlanta used U.S. county-level data to examine the relationship between local-based businesses and county eco-nomic performance for the period 2000 to 2009. The study found that local entrepreneurship matters for local economic performance, and that smaller local businesses are more important than larger local businesses for local economic performance (Rupasingha 2013).
3.2 Jobs in Oil and Gas – Lessons from Elsewhere
A number of studies have found industry and government estimates of job potential associated with fracking to be exaggerated (Hefley and Wang 2015; Mauro et al. 2013). These studies have concluded that the actual employ-ment impacts are much smaller than claimed; they range from findings of a positive but modest impact on employ-ment at the county level (Hefley and Wang 2015) to no statistically significant relationship between the number of wells and employment growth (Mauro et al. 2013). A six-state study of job impacts from shale extraction by the Multi-State Shale Research Collaborative in the U.S. found that industry-funded studies estimated jobs at twice to seven times that of academic studies (Mauro et al. 2013).
An examination of Pennsylvania before and after shale extraction began found very little change in total employ-ment (Weinstien and Partridge 2011). The authors suggest
15
this is due to a combination of the capital-intensive nature of the industry and the negative impacts on other sectors such as tourism.
In the case of the Marcellus shale play in the eastern United States, jobs and economic benefits were found to have leaked out of the local economy at a high rate. Ac-cording to Kelsey et al. (2011) 37 per cent of the Marcellus employment went to workers from out of state. Another study found that Texas has derived the lion’s share of benefits from U.S. fracking, despite the drilling being in other states (Christopherson and Rightor 2012).
Where jobs are created for local workers, they are often in the front-end construction phase and short term. Local employment for the Marcellus shale was concentrated in trucking, construction, and retail jobs, many part-time, short-term, and low-wage. In contrast, most of the skilled drilling workforce — the majority of the industry’s managers, scientists and experts — were from outside the region (Jacquet 2011). In oil and gas extraction, construction phase employment is often relatively brief, at the early stages of a development, and lower skilled. A study out of Cornell University indicates that in fracking,
about 98 per cent of jobs are concerned with developing the gas well, and are not needed after the well has been drilled (Jacquet 2011).
The boom and bust nature of oil and gas begs the ques-tion, not just of how many jobs are created, but for how long. Jacobson and Parker (2014) looked at 391 rural counties in the U.S. and found that incomes per capita and employment were lower post-boom in areas where a boom had occurred than in those where a boom had not occurred. In effect, those locations were worse off in the long term than if they had not had the boom.
Bringing this home to the Sahtu Region is not hard. The region is no stranger to the boom and bust nature of oil and gas and has seen layoffs even just recently from the collapse of the oil price. As has been seen in Norman Wells, oil and gas does produce some high earning jobs. How-ever, the case studies above caution that the economic impacts of conventional oil extraction are very different from the impact of fracking extraction. Also, the positive economic effect is not sustainable, has social downsides, and can mean the region is worse off in the longer term, not to mention the environmental implications.
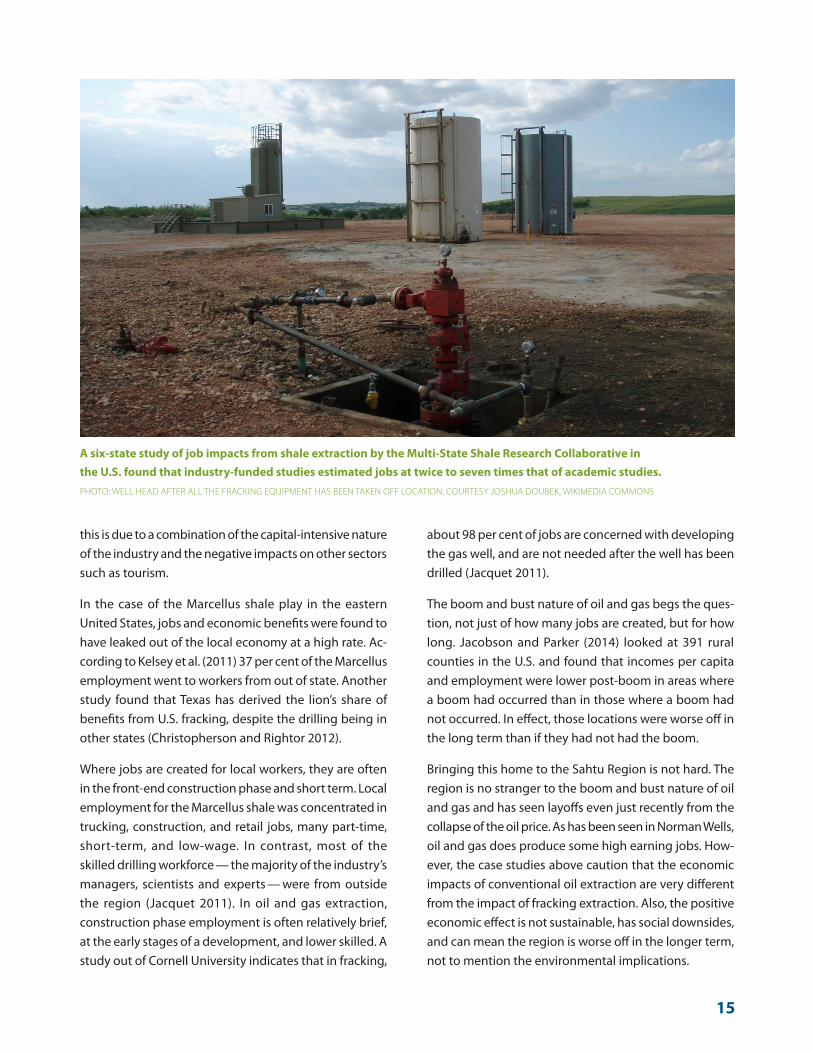
A six-state study of job impacts from shale extraction by the Multi-State Shale Research Collaborative in the U.S. found that industry-funded studies estimated jobs at twice to seven times that of academic studies. PHOTO: WELL HEAD AFTER ALL THE FRACKING EQUIPMENT HAS BEEN TAKEN OFF LOCATION, COURTESY JOSHUA DOUBEK, WIKIMEDIA COMMONS
16
The multiplier data set out in Section 3 contrasts the local sustainable economy approach with industrial recruit-ment (oil and gas) on job creation. This section contrasts the two economic approaches across a broader range of socioeconomic indicators.
Benefits associated with “local economies” approach
The multipliers show that the “local economies” approach delivers better on jobs. However, it is not just in terms of jobs and economic activity that local economies deliver better. The following summarizes the benefits:
■ VOLATILITY AND SECURE LONG-TERM REVENUE BASE: This economic approach can increase divers-ification and reduce vulnerability to external shocks (Power 2015). If properly supported with appropriate industrial policy (see Section 6), local economies can ensure long-term, stable revenues for government.
■ CRIME RATES, SOCIAL SERVICES, AND PUBLIC HEALTH AND SAFETY: Studies in the U.S. have drawn a link between an economy of small-scale businesses and improved community well-being, including lower crime rates and better public health (i.e., lower rates of mortality and a lower prevalence of obesity and diabetes) (Blanchard et al. 2011).
■ POVERTY AND WELL-BEING: Research has found
that smaller, locally owned businesses deliver better
than larger businesses owned externally in terms of
poverty and well-being (Rupasingha 2013; Pringle
2013; Civic Economic 2013).
■ THE ENVIRONMENT: Smaller, locally owned busi-
nesses also deliver better than larger businesses
owned externally in terms of the environment
(Rupasingha 2013; Pringle 2013; Civic Economic
2013). Local sustainable economies can diminish
the environmental footprint of business (i.e., energy
efficiency and renewable energy). Providing for basic
needs from local and regional renewable resources
strengthens ties to the land and land knowledge,
promoting increased, ongoing, and informed
stewardship.
■ CULTURAL CONTINUITY: Jobs in the sustainable
economy can maintain the traditions and heritage
of the region’s communities and people. Local
businesses based on traditional practices and cul-
ture — from trapping to commercial production of
local teas and berries to tourism — can strengthen
cultural ties.
■ COST OF LIVING: Local economies replace expen-
sive imports and reduce the cost of living.
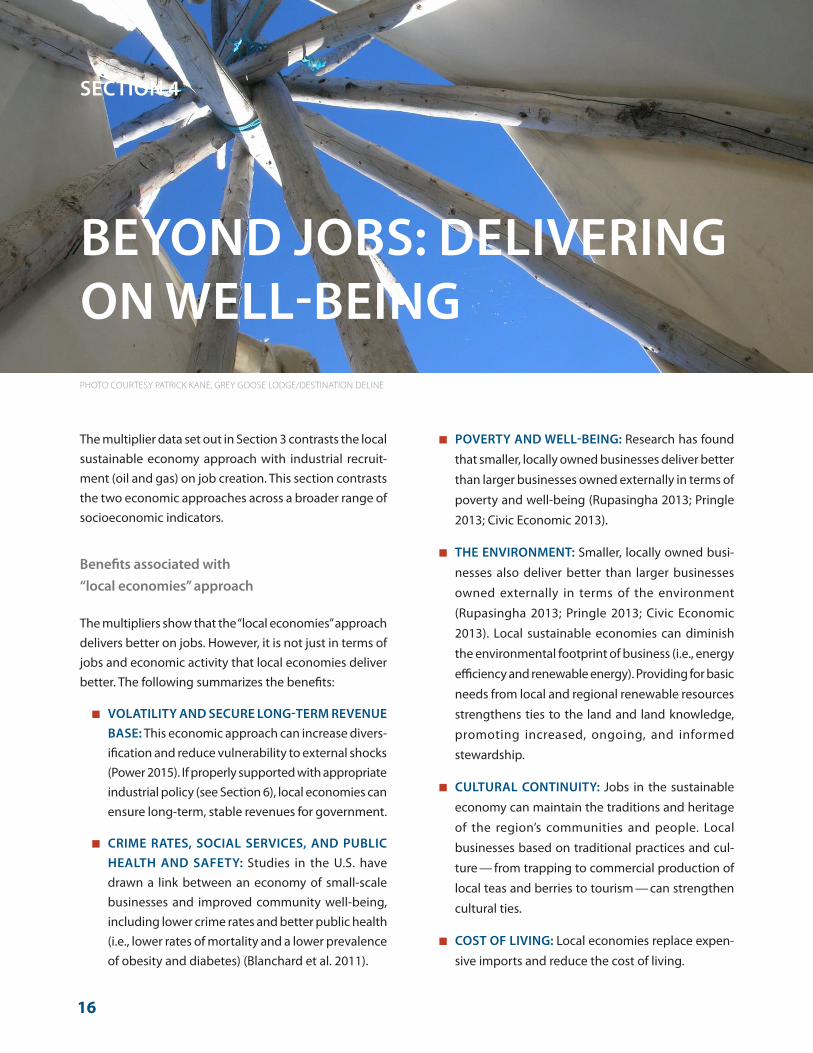
SECTION 4
BEYOND JOBS: DELIVERING ON WELL-BEINGPHOTO COURTESY PATRICK KANE, GREY GOOSE LODGE/DESTINATION DELINE

17
■ ACCESSIBLE JOBS: A diverse local sustainable economy will offer a range of jobs at different levels of skill, experience, and education, presenting fewer barriers to local community members than oil and gas jobs do.
■ SOCIAL CAPITAL AND SOCIAL COHESION: Sustain-able local economies build social cohesion through activities that engage family and community (e.g., harvesting, trapping, child care). The sustainable lo-cal economy can support a broad range of business models and sizes from cooperatives and non-profits to regular corporations. Cooperatives can also con-tribute more to local economic development and community well-being, including social cohesion, than a regular corporation (Blanchard and Matthews 2006). Dispersed economies composed predomin-antly of locally owned small businesses tend to have higher electoral engagement (vote more and are more likely to keep up with local affairs), participate in community organizations, engage in reform ef-forts, and participate in advocacy activities than in more concentrated economies with higher foreign ownership (Blanchard and Matthews 2006).
Resource extraction industries, on the other hand, come with risks in both the short and longer term across the same range of indicators. The following is a brief summary and by no means a complete list of the negative social impacts of resource extraction, particularly oil and gas.
Negative impacts associated with resource extraction sector
■ VOLATILITY AND INSECURE LONG TERM REV-ENUE BASE: Export industries are linked to reces-sions and depressions, and amplify them (Power 2015). Reliance on export markets ties the economy to export commodity price volatility, causing govern-ment revenue volatility and destabilizing revenues and raising costs for government (see below for a discussion of volatility and boom-bust economies).
■ CRIME RATES, SOCIAL SERVICES, AND PUBLIC HEALTH AND SAFETY: Rapid economic growth, followed by rapid decline, can cause numerous negative effects, such as increased crime rates,
increased demand on health and other social services, social upheaval, increases in poor mental health and addictions, unrealistic expectations for future growth, excess investment in project expansion, and housing shortages (Hua 1985; GNWT 2000; Ruddell et al., 2014; APG, n.d.). Safety can also be impacted by a boom with higher risk on busier roads, increased drug and other offenses, and an increase in domestic violence. Women are particularly vulnerable as inequality rises, housing options are limited, there is a higher popula-tion of younger and transient males, and employment options for women are limited.
■ POVERTY AND WELL-BEING: Research in the U.S. demonstrates the economic volatility and relative poverty of counties depending on resource extraction versus those with a more varied economy (Boettner 2015). With resource dependence, poverty can be worse as costs escalate, gaps grow between the rich and poor, and social cohesion declines (Boettner 2015).
■ THE ENVIRONMENT: Resource extraction mega-projects are associated with short and long term environmental impacts and costs. Giant Mine and Colomac Mine contamination and clean up costs are examples still fresh for the NWT. Oil and gas extraction also have the added impact of high climate change emissions.
FORT ST. JOHN LAW COURTS: Research in Fort St. John, B.C. where oil, gas, and mining have caused boomtown effects, found that assault rates had risen, with Fort St. John having the highest rate of domestic violence cases in northern B.C. courts (Eckford and Wagg 2014).
18
■ CULTURAL CONTINUITY: Resource industries can reduce cultural continuity through landscape and wildlife impacts or increased competition for limited resources. Although income is necessary for access-ing harvesting and traditional economic activities, industry work is not always conducive to a seasonal harvesting schedule. Opportunities for wage labour and money from mining royalties may also contrib-ute to the loss of traditional cultural values (Northern Aboriginal Health Organization 2008).
■ COST OF LIVING: Resource projects can create boomtown effects that increase the cost of housing and other goods and services in the local economy.
■ ACCESSIBLE JOBS: Jobs for local populations are often short term, lower skilled, and not accessible (see jobs section above). They are often tied to boom-and-bust unemployment cycles.
■ SOCIAL CAPITAL AND SOCIAL COHESION: Op-portunities for wage labour and money from mining royalties may contribute to the loss of traditional cul-tural values and undermine the social ties that bind small communities together (Northern Aboriginal
Health Organization 2008). The hiring of workers from the south in high paying jobs may also disrupt community cohesion, as does increased inequality.
4.1 Volatility
Government revenues from resource extraction are highly volatile because they are dependent on global com-modity prices, which tend to fluctuate. When the Great Recession hit in 2007 and 2008, Alberta led the nation in recession indicators. After oil prices fell again more recently, regions in Canada that focused on oil production had the highest growth in Employment Insurance claims in the first quarter of 2015 (Grant 2015).
Any non-renewable resource extraction is by nature finite, but fracking is particularly short term. Fracking wells have a lower return on investment than traditional oil wells and production tends to taper off dramatically, decreasing by 40 per cent after the first year (Woodrum 2014).
Communities in the Sahtu Region have experienced the volatility of the non-renewable resource extraction indus-try. Communities and local businesses made investments
PHOTO COURTESY PATRICK KANE, GREY GOOSE LODGE/DESTINATION DELINE
19
in anticipation of the Mackenzie Valley pipeline, and again
for the shale boom, both of which have yet to materialize.
The two companies drilling in the Canol shale play did
not return for drilling in 2015 (Quenneville 2015); neither
company plans to return in 2016. Northridge Contracting
reports that there has been a slowdown in exploration in
the Region with soft oil prices resulting in the need to lay
off staff (Quenneville 2015). Oil may have to reach $100
per barrel for companies to resume work in the Region
(CBC News 2014). However, most analysts are forecasting
lower prices — in the $40 to $70 range. Outside of the
Region, the oil industry is slowing down as well. In June
2015, Imperial Oil and BP both announced they had
delayed their plans to pursue drilling in the Beaufort
Sea in the Inuvialuit Settlement Region; Chevron had
previously backed out of plans in the region in December
2014 (CBC News 2015).
4.2 Is the Sahtu Region at risk?
Experience elsewhere and in the NWT suggests that there
are considerable risks in relying on oil and gas develop-
ment for the Sahtu Region.
Section 2 noted a number of social and physical infra-
structure deficits in the Region. It highlighted risks in
terms of physical infrastructure that is aging, combined
with trends such as an aging population, the high cost
of imported food and fuels, and climate change that
will increase the need for investment. It also documents
particularly vulnerable populations with already high
rates of inequality, and Aboriginal unemployment, in a
high cost of living environment. Any increases driven
by pressures from the resource extraction sector would
impact on already vulnerable households.
In addition, Aboriginal communities in the NWT are still
grappling with the residual effects of residential schools
that truncated cultural teachings and undermined
attitudes toward education as well as related barriers
to participation in traditional economies, employment,
and education (Ministry of Indian Affairs and Northern
Development 2013). This creates additional vulnerabilities
to the potential impacts of oil resource expansion, and
challenges in accessing employment opportunities.
Social needs and the difficulties of providing related services and programs can be exacerbated by extractive sector development. There are already identified service gaps across communities in the Region (GNWT 2013). The risks of oil and gas expansion include increased pressures on NWT government programs. During the Mackenzie Gas Pipeline review, risks identified for programs and services included daycare needs, spousal assault and mar-riage counselling, child protection and foster care, money management counselling, mental health services, justice, housing, education and training, as well as addictions treatment and counselling (Lutra Associates 2005). Pres-sures on addiction programs were expected to increase not only from alcohol use, but also from gambling and drug and other substance abuse. Workshops sponsored by the GNWT in 2005 on the social impacts of the Mack-enzie Valley Gas Project in the Sahtu Region identified risks across health, social services, education culture and employment, justice, and housing (Lutra Associates 2005).
The GNWT (2000) tracked the social impacts of develop-ment in communities affected by the Beaufort Delta oil and gas developments of the 1970s, the construction of the Norman Wells to Zama pipeline, and the Ekati Mine. The study found marked increases in both alcohol consumption and alcohol related crime in the Fort Liard community, with incidents of alcohol related crime almost tripling in one year (GNWT 2000). Development projects in Norman Wells and Tuktoyaktuk also led to serious negative impacts on the markers for socioeconomic well-being, with increases in child abuse and neglect, family breakdown, and spousal assault (GNWT 2000).
Employment is important in the Sahtu Region; it can be positively correlated with engagement in harvesting (Harnum et al. 2014), income security, food security, mental health, and other indicators of well-being (Lop-pie Reading and Wien 2009). However, the discussions above have illustrated that oil and gas extraction has less to offer in the way of long-term, quality jobs for local community members while being accompanied by significant potential social risks, not to mention the potential environmental downsides.
The next section explores the potential for expansion of local sustainable economies in the NWT as a longer-term and more sustainable development path.
20
This section includes a very brief overview of current economic activity in sustainable local economy sectors, the jobs potential, and the opportunities for growth. It further elaborates on the job multipliers, contrasting those sectors with oil and gas extraction.15
It is well beyond the scope of this brief study to thor-oughly evaluate each sector in terms of how existing programs, services, and infrastructure support or inhibit local sustainable economic development, or to provide detailed and prioritized policy prescriptions for expand-ing the sectors. However, there is a developing body of research emerging on the challenges and opportunities of various local sustainable economy sectors (GNWT et al. 2013; Délįnę Land Corporation 2012; Lutra Associates and Ne’rahten Development 2013; Harnum et al. 2014, amongst others) and certainly a need for ongoing mon-itoring and evaluation.
15 It should be noted that multipliers are most useful as points of comparison for estimating the relative magnitude of jobs created for a given investment in different industries, rather than as absolute job creation predictors. Also, these job multiplier numbers in this section were generated from an economic model created by the GNWT. It should be noted that there are challenges associated with applying multipliers generated for one place (the entire NWT) to another (the Sahtu Region). For the Sahtu Region, in some cases, the true job creation effect may be lower than that predicted by the model, such as in cases where an input needs to be shipped from elsewhere in the NWT (so the indirect jobs would be outside of the region).
The following sections provide a brief summary by sector of some of the key opportunities for growth.
5.1 Forestry and Wood Products
People in the forested areas of the NWT have always relied on the boreal forest for subsistence, using it for food, shelter, and to provide resources for transportation (canoes and sleds). There is not currently any commercial forestry in the Sahtu Region. If done at an appropriate scale and responsibly, forestry is a renewable resource that can support employment and energy needs for lo-cal communities in the region. Localizing energy inputs with the use of wood can both create jobs and reduce energy costs.
There are some limits to how much forestry can expand in the Sahtu Region, including limited wood volumes, a relatively long regeneration period, high non-timber forest values, and soil conditions.
Opportunities in Forestry and Wood Products
Each community has a portable sawmill (provided by NWT Industry, Tourism and Investment), which could be used to produce smaller lumber products (Harnum et al. 2014). A possible economic endeavour using the portable sawmills is the creation of community woodlots available for individuals to work and purchase wood
SECTION 5
LOCAL ECONOMIES: BUILDING ON STRENGTHSPHOTO COURTESY PATRICK KANE, GREY GOOSE LODGE/DESTINATION DELINE
21
(Harnum et al. 2014). Additionally, the manufacture of furniture and toboggans could be a possible avenue for economic growth. There are also potential opportunities being opened up with the exploration of biomass as an energy alternative (see renewable energy section). Local silviculture, nurseries, and fire management, amongst other forest management, could also provide opportun-ities locally as could non-timber forest harvests such as mushroom or other products.
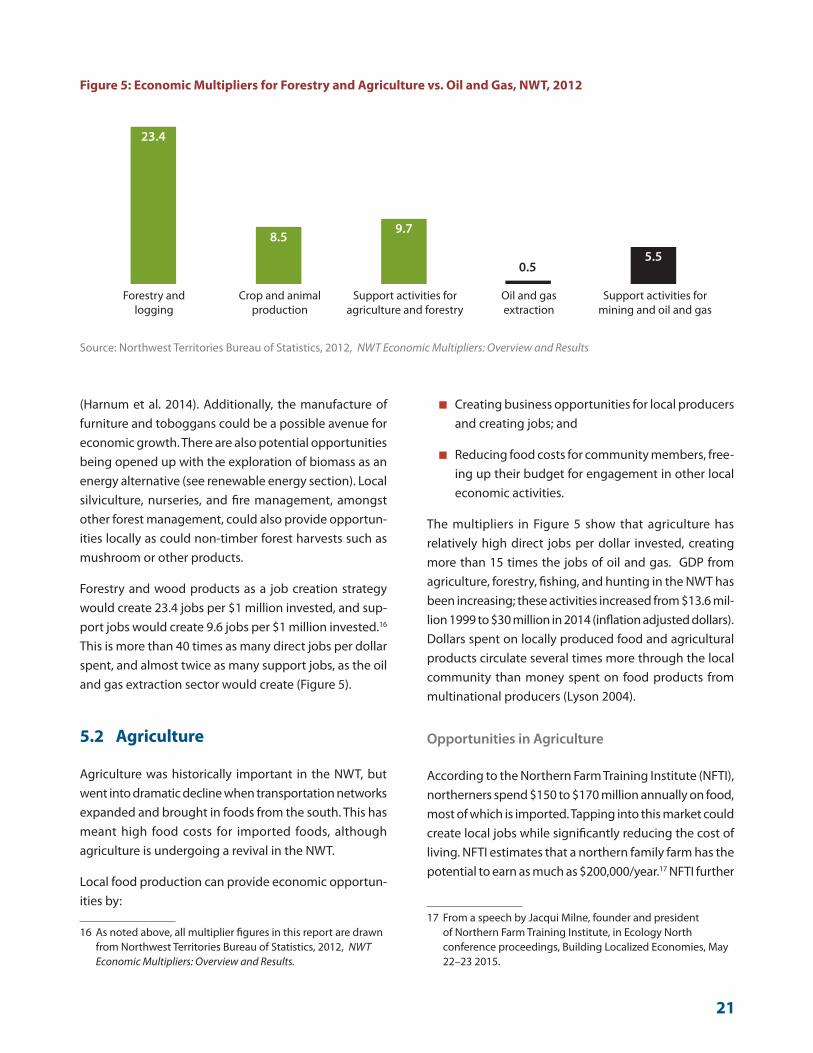
Forestry and wood products as a job creation strategy would create 23.4 jobs per $1 million invested, and sup-port jobs would create 9.6 jobs per $1 million invested.16 This is more than 40 times as many direct jobs per dollar spent, and almost twice as many support jobs, as the oil and gas extraction sector would create (Figure 5).
5.2 Agriculture
Agriculture was historically important in the NWT, but went into dramatic decline when transportation networks expanded and brought in foods from the south. This has meant high food costs for imported foods, although agriculture is undergoing a revival in the NWT.
Local food production can provide economic opportun-ities by:
16 As noted above, all multiplier figures in this report are drawn from Northwest Territories Bureau of Statistics, 2012, NWT Economic Multipliers: Overview and Results.
■ Creating business opportunities for local producers and creating jobs; and
■ Reducing food costs for community members, free-ing up their budget for engagement in other local economic activities.
The multipliers in Figure 5 show that agriculture has relatively high direct jobs per dollar invested, creating more than 15 times the jobs of oil and gas. GDP from agriculture, forestry, fishing, and hunting in the NWT has been increasing; these activities increased from $13.6 mil-lion 1999 to $30 million in 2014 (inflation adjusted dollars). Dollars spent on locally produced food and agricultural products circulate several times more through the local community than money spent on food products from multinational producers (Lyson 2004).
Opportunities in Agriculture
According to the Northern Farm Training Institute (NFTI), northerners spend $150 to $170 million annually on food, most of which is imported. Tapping into this market could create local jobs while significantly reducing the cost of living. NFTI estimates that a northern family farm has the potential to earn as much as $200,000/year.17 NFTI further
17 From a speech by Jacqui Milne, founder and president of Northern Farm Training Institute, in Ecology North conference proceedings, Building Localized Economies, May 22–23 2015.
Figure 5: Economic Multipliers for Forestry and Agriculture vs. Oil and Gas, NWT, 2012
Source: Northwest Territories Bureau of Statistics, 2012, NWT Economic Multipliers: Overview and Results
8.5
23.4
9.7
0.55.5
Forestry and logging
Crop and animal production
Support activities for agriculture and forestry
Oil and gas extraction
Support activities for mining and oil and gas
22
estimates that, with a population of about 42,000 people, it is reasonable to train 4,000 northerners to produce food. Although there is a skills gap, the NFTI is dedicated to developing knowledge and skills about food production, processing, and storage and is engaged in knowledge and resource sharing as well as training.
There are opportunities for the government to work with communities to increase access to agricultural land, reduce soil contaminants and increase soil quality, provide access to adequate start-up funds, and improve technical knowledge and experience. Also, the Nutrition North food subsidy program should be restructured to support the competitiveness of local products compared to subsidized imports, rather than the reverse as is some-times the case now.
Other opportunities include identifying food storage solutions to mitigate the short growing season, and supporting small scale operations in small communities to meet regulations related to butchering and food processing. For example, the Yamoga Land Corporation purchased a mobile unit to facilitate processing and stor-age of country foods, but the unit is not yet functioning due to lack of local capacity (e.g., a trained manager) to manage and respond to quotas, food safety regulations, and inspections.
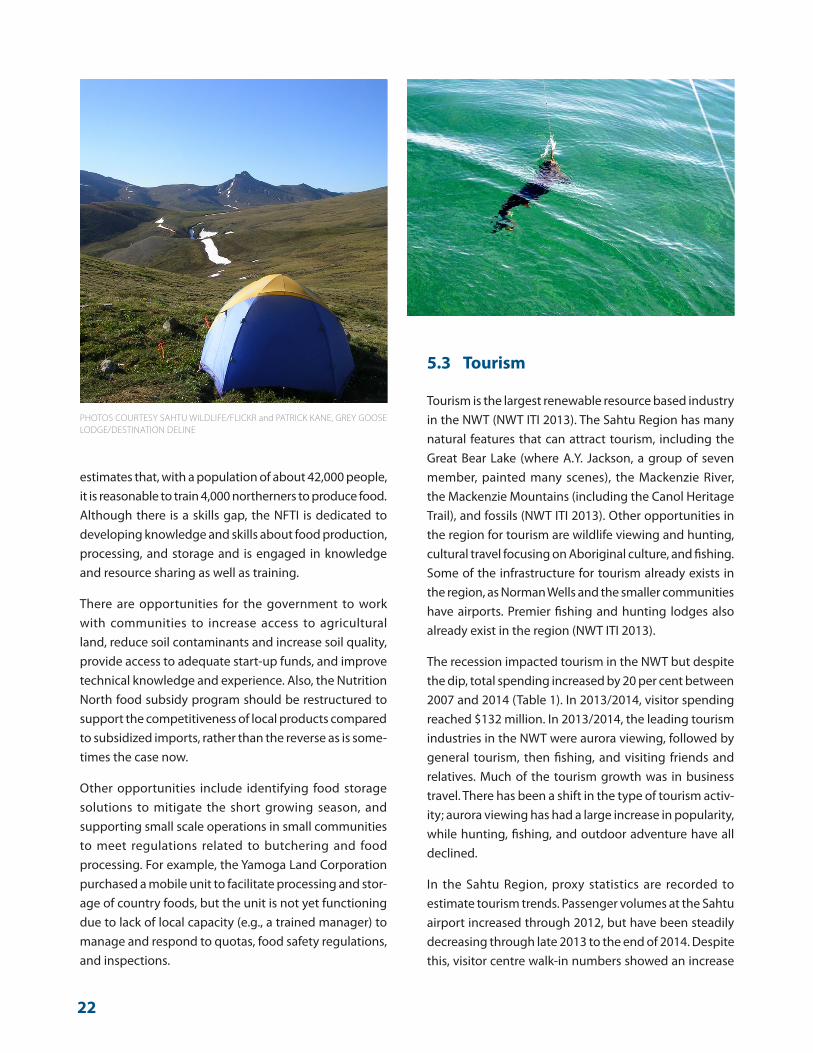
5.3 Tourism
Tourism is the largest renewable resource based industry in the NWT (NWT ITI 2013). The Sahtu Region has many natural features that can attract tourism, including the Great Bear Lake (where A.Y. Jackson, a group of seven member, painted many scenes), the Mackenzie River, the Mackenzie Mountains (including the Canol Heritage Trail), and fossils (NWT ITI 2013). Other opportunities in the region for tourism are wildlife viewing and hunting, cultural travel focusing on Aboriginal culture, and fishing. Some of the infrastructure for tourism already exists in the region, as Norman Wells and the smaller communities have airports. Premier fishing and hunting lodges also already exist in the region (NWT ITI 2013).
The recession impacted tourism in the NWT but despite the dip, total spending increased by 20 per cent between 2007 and 2014 (Table 1). In 2013/2014, visitor spending reached $132 million. In 2013/2014, the leading tourism industries in the NWT were aurora viewing, followed by general tourism, then fishing, and visiting friends and relatives. Much of the tourism growth was in business travel. There has been a shift in the type of tourism activ-ity; aurora viewing has had a large increase in popularity, while hunting, fishing, and outdoor adventure have all declined.
In the Sahtu Region, proxy statistics are recorded to estimate tourism trends. Passenger volumes at the Sahtu airport increased through 2012, but have been steadily decreasing through late 2013 to the end of 2014. Despite this, visitor centre walk-in numbers showed an increase
PHOTOS COURTESY SAHTU WILDLIFE/FLICKR and PATRICK KANE, GREY GOOSE LODGE/DESTINATION DELINE

23
from 2012 to 2013. Finally, the number of tour operator licenses was 16 from 2011-2014, and decreased by one to 15 in 2015.18 Based on these numbers, although total visitors to the Sahtu Region have decreased, tourism ap-pears to have remained steady in the region over the past few years. The Sahtu Region has the opportunity to try to attract the increasing tourists to the NWT to the region.
Opportunities in Tourism
There is significant potential for tourism growth in the Sahtu Region. The Sahtu Region offers a range of tourism enterprises, such as hunting, wilderness lodges, bed and
18 Northwest Territories Industry, Tourism and Investment, Sahtu Region – Tourism Indicators, August 2015, iti.gov.nt.ca/sites/default/files/regional_data_sheet-sahtu.pdf
breakfasts, and cultural and interpretive tours.19 Interest in cultural tourism is growing and there is a high level of interest from foreign tourists in the opportunity to participate in Aboriginal cultural experiences, celebra-tions, and attractions while in Canada — 82 per cent among the French, 72 per cent among Germans, and 46 per cent among UK travellers.20 Growth in aurora view-ing is a great example of a successful model for tourism growth through branding and marketing. In addition,
19 These, and other tourism enterprises in the Sahtu Region, can be found at www.spectacularnwt.com
20 See Canada Tourism Commission survey, http://en.destinationcanada.com/research/product-knowledge. Note that cultural tourism needs to be done carefully and in close consultation with communities to ensure it is consistent with cultural ethics, intellectual property rights, sustainability, and environmental limits.
Table 1: NWT Visitor Trends, 2007–2014
Source: Northwest Territories Industry, Tourism and Investment, Visitor Spending and Numbers, iti.gov.nt.ca/infopage/visitor-spending-and-numbers
Northwest Territories Visitor Statistics
Northwest Territories Visitor Spending (millions)
24
0.5
the Canol Trail holds great potential for attracting tour-ists. It has been called one of the most challenging trails in North America, and is considered Canada’s hardest backpacking route;21 it also has the potential to attract as a historic site. As the fastpacking22 and mountain biking industries continue to grow and people seek out new trails, the Canol Trail could become the next big attrac-tion, especially if infrastructure were installed to facilitate easier river crossings along the route. There are currently guided hikes offered for the Canol Trail and flight-seeing.
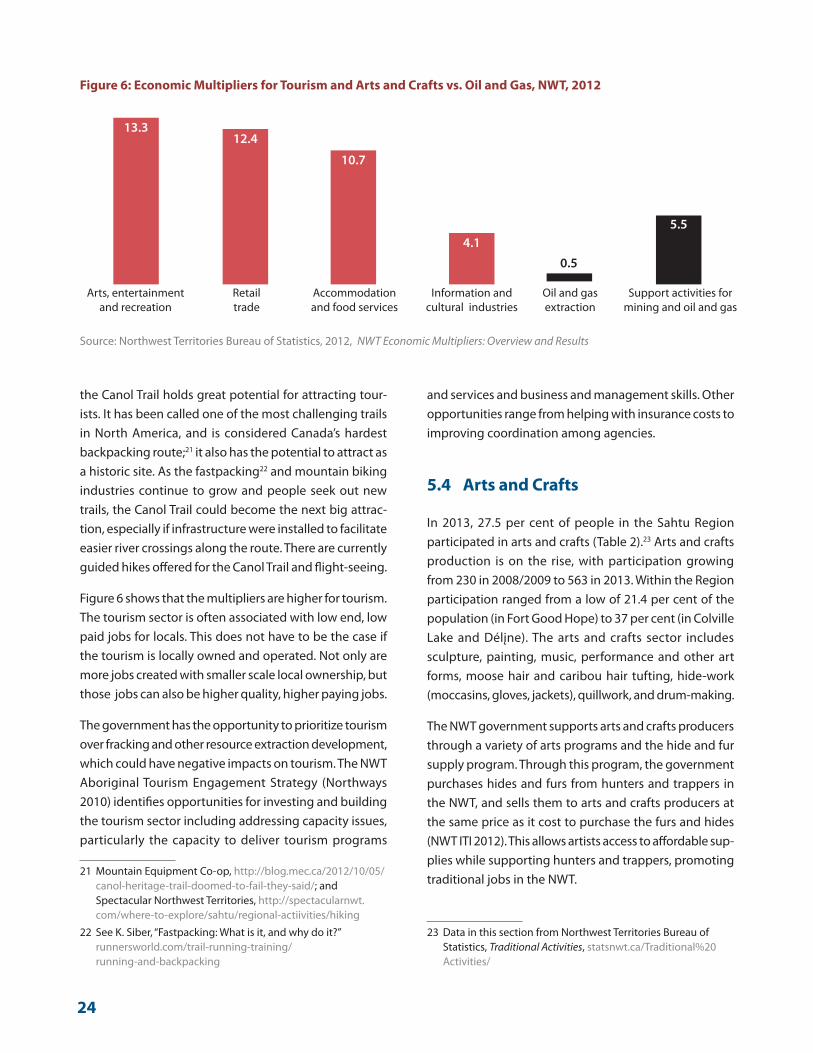
Figure 6 shows that the multipliers are higher for tourism. The tourism sector is often associated with low end, low paid jobs for locals. This does not have to be the case if the tourism is locally owned and operated. Not only are more jobs created with smaller scale local ownership, but those jobs can also be higher quality, higher paying jobs.
The government has the opportunity to prioritize tourism over fracking and other resource extraction development, which could have negative impacts on tourism. The NWT Aboriginal Tourism Engagement Strategy (Northways 2010) identifies opportunities for investing and building the tourism sector including addressing capacity issues, particularly the capacity to deliver tourism programs
21 Mountain Equipment Co-op, http://blog.mec.ca/2012/10/05/canol-heritage-trail-doomed-to-fail-they-said/; and Spectacular Northwest Territories, http://spectacularnwt.com/where-to-explore/sahtu/regional-actiivities/hiking
22 See K. Siber, “Fastpacking: What is it, and why do it?” runnersworld.com/trail-running-training/running-and-backpacking
and services and business and management skills. Other opportunities range from helping with insurance costs to improving coordination among agencies.
5.4 Arts and Crafts
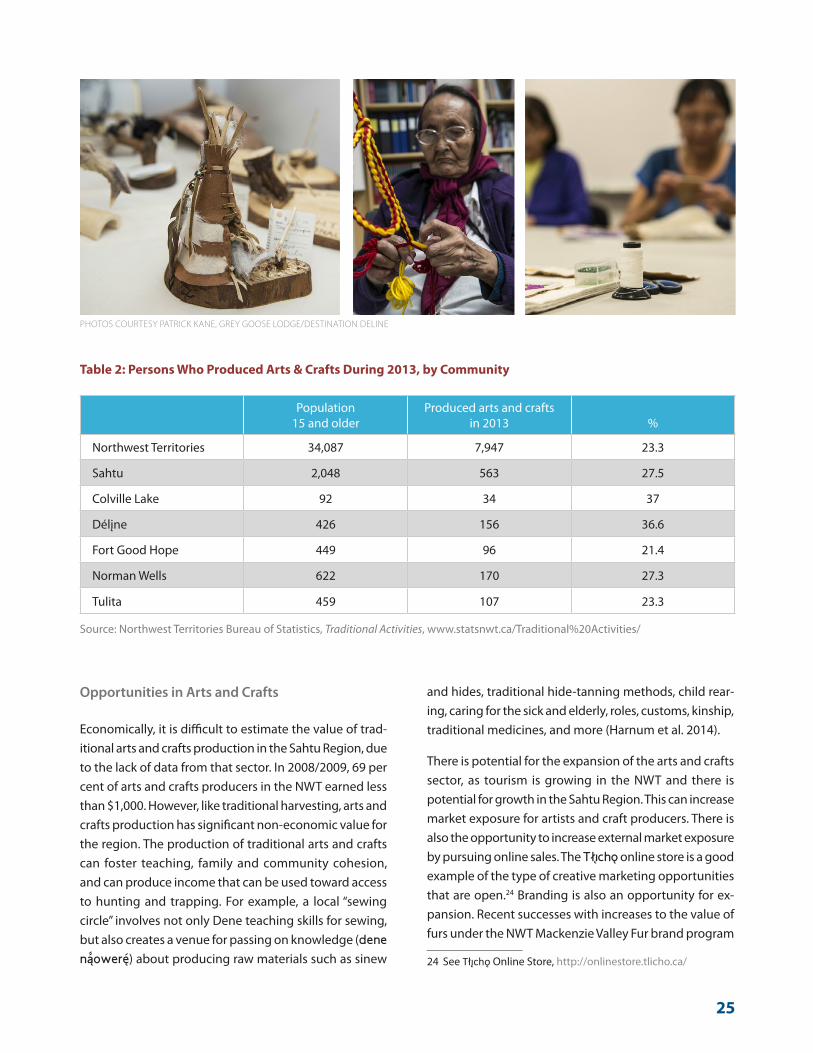
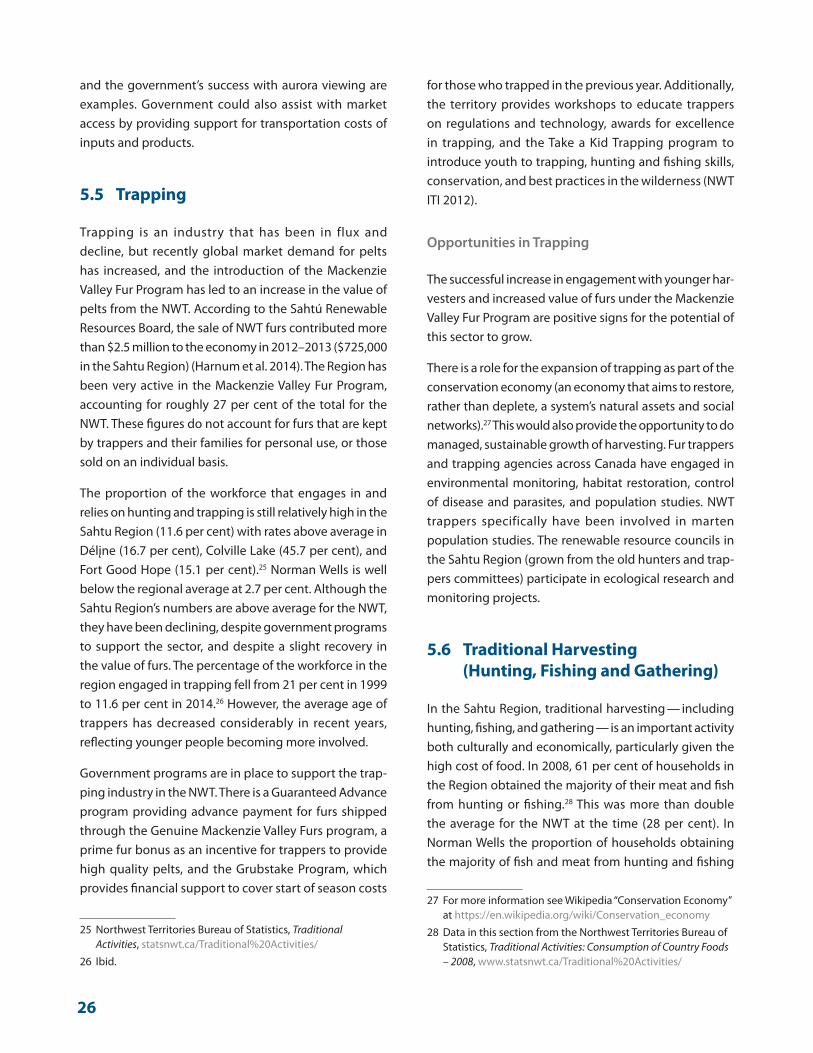
In 2013, 27.5 per cent of people in the Sahtu Region participated in arts and crafts (Table 2).23 Arts and crafts production is on the rise, with participation growing from 230 in 2008/2009 to 563 in 2013. Within the Region participation ranged from a low of 21.4 per cent of the population (in Fort Good Hope) to 37 per cent (in Colville Lake and Délįne). The arts and crafts sector includes sculpture, painting, music, performance and other art forms, moose hair and caribou hair tufting, hide-work (moccasins, gloves, jackets), quillwork, and drum-making.
The NWT government supports arts and crafts producers through a variety of arts programs and the hide and fur supply program. Through this program, the government purchases hides and furs from hunters and trappers in the NWT, and sells them to arts and crafts producers at the same price as it cost to purchase the furs and hides (NWT ITI 2012). This allows artists access to affordable sup-plies while supporting hunters and trappers, promoting traditional jobs in the NWT.
23 Data in this section from Northwest Territories Bureau of Statistics, Traditional Activities, statsnwt.ca/Traditional%20Activities/
Figure 6: Economic Multipliers for Tourism and Arts and Crafts vs. Oil and Gas, NWT, 2012
Source: Northwest Territories Bureau of Statistics, 2012, NWT Economic Multipliers: Overview and Results
12.413.3
10.7
5.5
Arts, entertainment and recreation
Retail trade
Accommodation and food services
Oil and gas extraction
Support activities for mining and oil and gas
10.7
Information and cultural industries
4.1
25
Opportunities in Arts and Crafts
Economically, it is difficult to estimate the value of trad-itional arts and crafts production in the Sahtu Region, due to the lack of data from that sector. In 2008/2009, 69 per cent of arts and crafts producers in the NWT earned less than $1,000. However, like traditional harvesting, arts and crafts production has significant non-economic value for the region. The production of traditional arts and crafts can foster teaching, family and community cohesion, and can produce income that can be used toward access to hunting and trapping. For example, a local “sewing circle” involves not only Dene teaching skills for sewing, but also creates a venue for passing on knowledge (dene náowere) about producing raw materials such as sinew
and hides, traditional hide-tanning methods, child rear-ing, caring for the sick and elderly, roles, customs, kinship, traditional medicines, and more (Harnum et al. 2014).
There is potential for the expansion of the arts and crafts sector, as tourism is growing in the NWT and there is potential for growth in the Sahtu Region. This can increase market exposure for artists and craft producers. There is also the opportunity to increase external market exposure by pursuing online sales. The Tłıchǫ online store is a good example of the type of creative marketing opportunities that are open.24 Branding is also an opportunity for ex-pansion. Recent successes with increases to the value of furs under the NWT Mackenzie Valley Fur brand program
24 See Tłıchǫ Online Store, http://onlinestore.tlicho.ca/
Table 2: Persons Who Produced Arts & Crafts During 2013, by Community
Population 15 and older
Produced arts and crafts in 2013 %
Northwest Territories 34,087 7,947 23.3
Sahtu 2,048 563 27.5
Colville Lake 92 34 37
Délįne 426 156 36.6
Fort Good Hope 449 96 21.4
Norman Wells 622 170 27.3
Tulita 459 107 23.3
Source: Northwest Territories Bureau of Statistics, Traditional Activities, www.statsnwt.ca/Traditional%20Activities/
PHOTOS COURTESY PATRICK KANE, GREY GOOSE LODGE/DESTINATION DELINE
26
and the government’s success with aurora viewing are examples. Government could also assist with market access by providing support for transportation costs of inputs and products.
5.5 Trapping
Trapping is an industry that has been in flux and decline, but recently global market demand for pelts has increased, and the introduction of the Mackenzie Valley Fur Program has led to an increase in the value of pelts from the NWT. According to the Sahtú Renewable Resources Board, the sale of NWT furs contributed more than $2.5 million to the economy in 2012–2013 ($725,000 in the Sahtu Region) (Harnum et al. 2014). The Region has been very active in the Mackenzie Valley Fur Program, accounting for roughly 27 per cent of the total for the NWT. These figures do not account for furs that are kept by trappers and their families for personal use, or those sold on an individual basis.
The proportion of the workforce that engages in and relies on hunting and trapping is still relatively high in the Sahtu Region (11.6 per cent) with rates above average in Délįne (16.7 per cent), Colville Lake (45.7 per cent), and Fort Good Hope (15.1 per cent).25 Norman Wells is well below the regional average at 2.7 per cent. Although the Sahtu Region’s numbers are above average for the NWT, they have been declining, despite government programs to support the sector, and despite a slight recovery in the value of furs. The percentage of the workforce in the region engaged in trapping fell from 21 per cent in 1999 to 11.6 per cent in 2014.26 However, the average age of trappers has decreased considerably in recent years, reflecting younger people becoming more involved.
Government programs are in place to support the trap-ping industry in the NWT. There is a Guaranteed Advance program providing advance payment for furs shipped through the Genuine Mackenzie Valley Furs program, a prime fur bonus as an incentive for trappers to provide high quality pelts, and the Grubstake Program, which provides financial support to cover start of season costs
25 Northwest Territories Bureau of Statistics, Traditional Activities, statsnwt.ca/Traditional%20Activities/
26 Ibid.
for those who trapped in the previous year. Additionally, the territory provides workshops to educate trappers on regulations and technology, awards for excellence in trapping, and the Take a Kid Trapping program to introduce youth to trapping, hunting and fishing skills, conservation, and best practices in the wilderness (NWT ITI 2012).
Opportunities in Trapping
The successful increase in engagement with younger har-vesters and increased value of furs under the Mackenzie Valley Fur Program are positive signs for the potential of this sector to grow.
There is a role for the expansion of trapping as part of the conservation economy (an economy that aims to restore, rather than deplete, a system’s natural assets and social networks).27 This would also provide the opportunity to do managed, sustainable growth of harvesting. Fur trappers and trapping agencies across Canada have engaged in environmental monitoring, habitat restoration, control of disease and parasites, and population studies. NWT trappers specifically have been involved in marten population studies. The renewable resource councils in the Sahtu Region (grown from the old hunters and trap-pers committees) participate in ecological research and monitoring projects.
5.6 Traditional Harvesting (Hunting, Fishing and Gathering)
In the Sahtu Region, traditional harvesting — including hunting, fishing, and gathering — is an important activity both culturally and economically, particularly given the high cost of food. In 2008, 61 per cent of households in the Region obtained the majority of their meat and fish from hunting or fishing.28 This was more than double the average for the NWT at the time (28 per cent). In Norman Wells the proportion of households obtaining the majority of fish and meat from hunting and fishing
27 For more information see Wikipedia “Conservation Economy” at https://en.wikipedia.org/wiki/Conservation_economy
28 Data in this section from the Northwest Territories Bureau of Statistics, Traditional Activities: Consumption of Country Foods – 2008, www.statsnwt.ca/Traditional%20Activities/
27
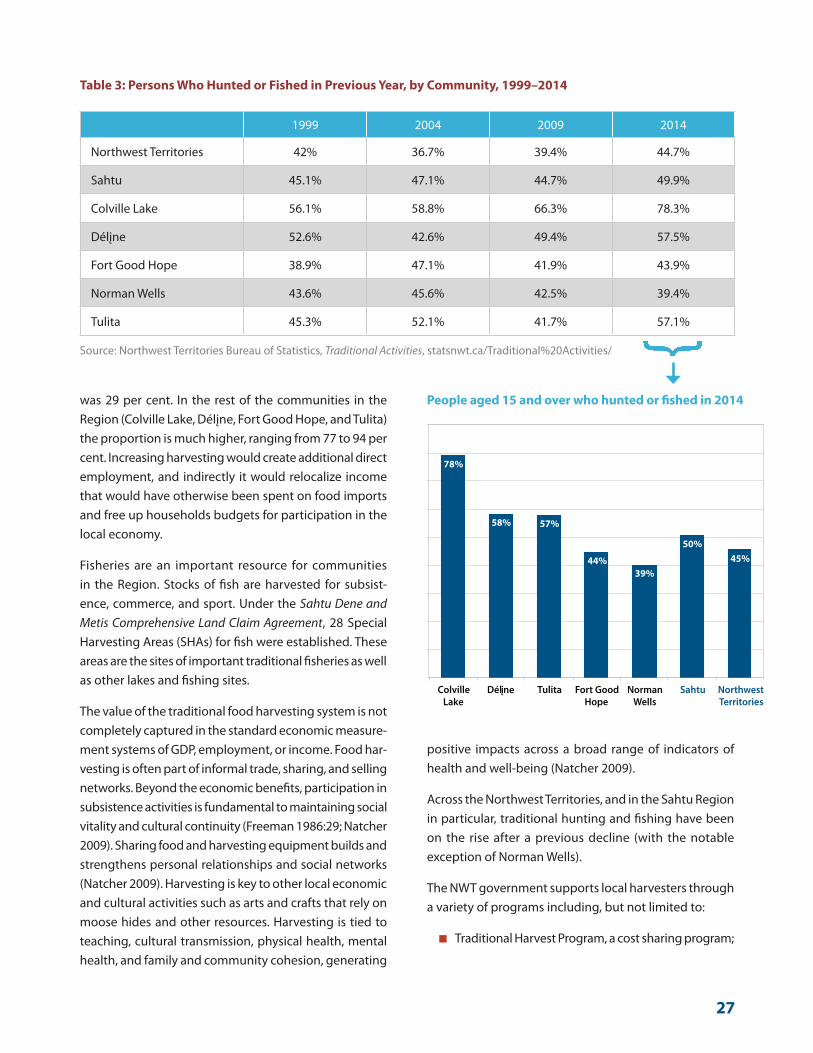
was 29 per cent. In the rest of the communities in the Region (Colville Lake, Délįne, Fort Good Hope, and Tulita) the proportion is much higher, ranging from 77 to 94 per cent. Increasing harvesting would create additional direct employment, and indirectly it would relocalize income that would have otherwise been spent on food imports and free up households budgets for participation in the local economy.
Fisheries are an important resource for communities in the Region. Stocks of fish are harvested for subsist-ence, commerce, and sport. Under the Sahtu Dene and Metis Comprehensive Land Claim Agreement, 28 Special Harvesting Areas (SHAs) for fish were established. These areas are the sites of important traditional fisheries as well as other lakes and fishing sites.
The value of the traditional food harvesting system is not completely captured in the standard economic measure-ment systems of GDP, employment, or income. Food har-vesting is often part of informal trade, sharing, and selling networks. Beyond the economic benefits, participation in subsistence activities is fundamental to maintaining social vitality and cultural continuity (Freeman 1986:29; Natcher 2009). Sharing food and harvesting equipment builds and strengthens personal relationships and social networks (Natcher 2009). Harvesting is key to other local economic and cultural activities such as arts and crafts that rely on moose hides and other resources. Harvesting is tied to teaching, cultural transmission, physical health, mental health, and family and community cohesion, generating
positive impacts across a broad range of indicators of health and well-being (Natcher 2009).
Across the Northwest Territories, and in the Sahtu Region in particular, traditional hunting and fishing have been on the rise after a previous decline (with the notable exception of Norman Wells).
The NWT government supports local harvesters through a variety of programs including, but not limited to:
■ Traditional Harvest Program, a cost sharing program;
People aged 15 and over who hunted or fished in 2014
78%
58% 57%
44% 39%
50% 45%
Colville Lake
Délįne Tulita Fort Good Hope
Norman Wells
Sahtu Northwest Territories
Table 3: Persons Who Hunted or Fished in Previous Year, by Community, 1999–2014
1999 2004 2009 2014
Northwest Territories 42% 36.7% 39.4% 44.7%
Sahtu 45.1% 47.1% 44.7% 49.9%
Colville Lake 56.1% 58.8% 66.3% 78.3%
Délįne 52.6% 42.6% 49.4% 57.5%
Fort Good Hope 38.9% 47.1% 41.9% 43.9%
Norman Wells 43.6% 45.6% 42.5% 39.4%
Tulita 45.3% 52.1% 41.7% 57.1%
Source: Northwest Territories Bureau of Statistics, Traditional Activities, statsnwt.ca/Traditional%20Activities/
28
■ Take a Kid Harvesting program, which covers up to 60 per cent of costs associated with community harvests and hunts;
■ Community Harvest Equipment Program, which covers up to 60 per cent of costs toward buying equipment for harvesting, processing, or storing food from community harvests;
■ Additional support for harvesting groups, including Local Wildlife Committees, the Community Harvest-ers Assistance Program, and the Western Harvest-ers Assistance Program, targeted at supporting Aboriginal groups specifically, which provides funding to local groups for tools, equipment, and the promotion of renewable resource harvesting (NWT ITI 2012);
■ Disaster compensation for traditional harvesters in the face of natural disasters; and
■ Worker’s safety program to assist harvesters if they are injured on the job.
In addition, the Canadian Northern Economic Develop-ment Agency partnered with the Sahtú Renewable Resources Board, local renewable resources councils, and the Northwest Territories Department of Industry, Tour-ism and Investment for a two-year program to identify
economic opportunities and build an action plan for the traditional and industrial sectors (CanNor 2014).
Opportunities in Traditional Harvesting
Government programs have contributed to increasing participation in harvesting and the declining average age of harvesters, which shows that more youth are getting out. There is significant potential for harvesting to increase.
There is also an increasing market for and potential for the production of marketable products from non-timber forest products such as diamond willow, berries, spruce, birch, and morels. Some other examples include spruce tip jelly, spruce tip beer, and spruce tip seasoning (NWT ITI 2013). Teas are another potential opportunity. Value added from birch can range from lip balm and shampoo to tea. Supporting this value-added industry locally will involve increased support for marketing and distribution opportunities as well as general business skills. Increasing the awareness and support for harvesters registering as a business owner and taking advantage of the associated tax incentives is an opportunity for formalizing their harvesting and increasing the sense of worth.
There is potential for the commercial sale of products such as fish. Although there are currently no operating commercial fisheries in the Region (Harnum et al. 2014), Fort Good Hope is undertaking a feasibility study and Délįne has a mobile meat processing plant.
There are opportunities for improving supports to this sector through increased assistance with the cost of equipment and repair, the cost of gas, on the land camps, and opportunities to teach traditional knowledge. Income is important for access to harvesting in a modern world where skidoos and gasoline are critical inputs. Studies have found that Aboriginal households with the greatest access to wage income tend to produce, consume, and distribute significantly more wild foods than households with limited or no access to wage earning opportunities (Wheelersburg 2008:171; Harnum et al. 2014). It is import-ant to note that, though income can facilitate an increase access to harvesting in in the northern mixed economy, it is rarely enough in itself (Fienup-Riorden 1991; Natcher 2009). Where individuals do have employment and
0.5
Figure 7: Economic Multipliers for Fishing, Hunting and Trapping vs. Oil and Gas, NWT, 2012
Source: Northwest Territories Bureau of Statistics, 2012, NWT Economic Multipliers: Overview and Results
15.9
5.5
Fishing, hunting and trapping
Oil and gas extraction
Support activities for mining and oil and gas
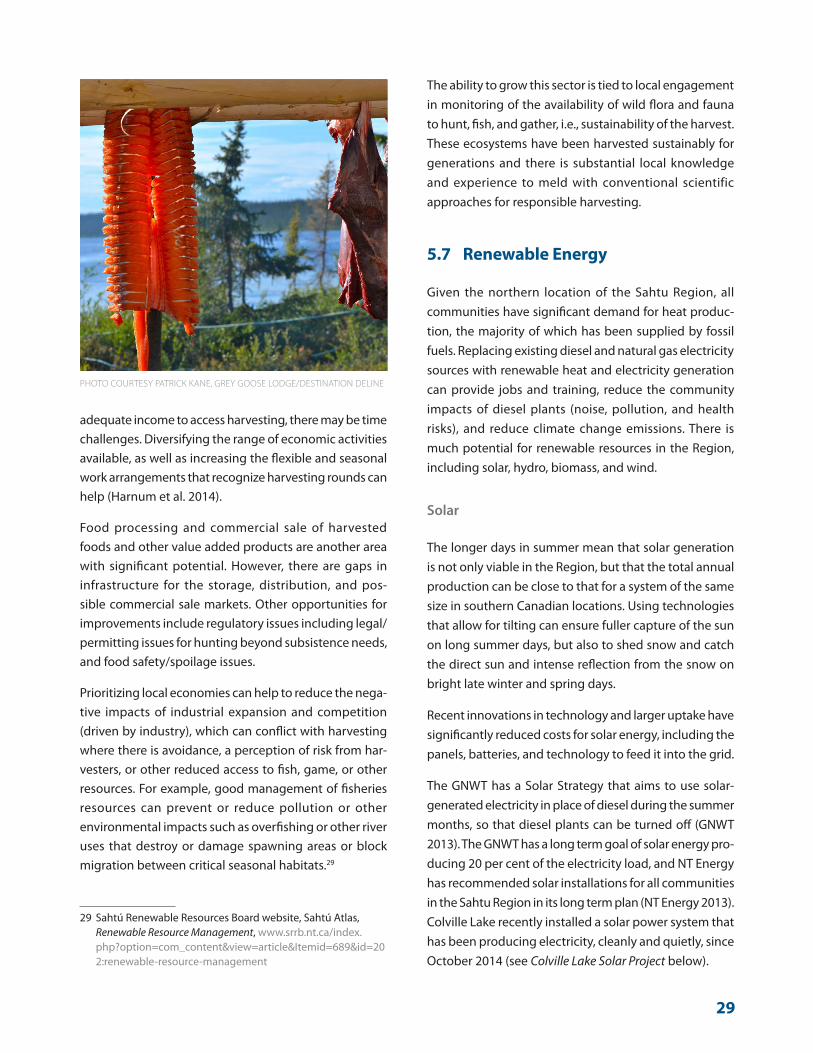
29
adequate income to access harvesting, there may be time challenges. Diversifying the range of economic activities available, as well as increasing the flexible and seasonal work arrangements that recognize harvesting rounds can help (Harnum et al. 2014).
Food processing and commercial sale of harvested foods and other value added products are another area with significant potential. However, there are gaps in infrastructure for the storage, distribution, and pos-sible commercial sale markets. Other opportunities for improvements include regulatory issues including legal/permitting issues for hunting beyond subsistence needs, and food safety/spoilage issues.
Prioritizing local economies can help to reduce the nega-tive impacts of industrial expansion and competition (driven by industry), which can conflict with harvesting where there is avoidance, a perception of risk from har-vesters, or other reduced access to fish, game, or other resources. For example, good management of fisheries resources can prevent or reduce pollution or other environmental impacts such as overfishing or other river uses that destroy or damage spawning areas or block migration between critical seasonal habitats.29
29 Sahtú Renewable Resources Board website, Sahtú Atlas, Renewable Resource Management, www.srrb.nt.ca/index.php?option=com_content&view=article&Itemid=689&id=202:renewable-resource-management
The ability to grow this sector is tied to local engagement in monitoring of the availability of wild flora and fauna to hunt, fish, and gather, i.e., sustainability of the harvest. These ecosystems have been harvested sustainably for generations and there is substantial local knowledge and experience to meld with conventional scientific approaches for responsible harvesting.
5.7 Renewable Energy
Given the northern location of the Sahtu Region, all communities have significant demand for heat produc-tion, the majority of which has been supplied by fossil fuels. Replacing existing diesel and natural gas electricity sources with renewable heat and electricity generation can provide jobs and training, reduce the community impacts of diesel plants (noise, pollution, and health risks), and reduce climate change emissions. There is much potential for renewable resources in the Region, including solar, hydro, biomass, and wind.
Solar
The longer days in summer mean that solar generation is not only viable in the Region, but that the total annual production can be close to that for a system of the same size in southern Canadian locations. Using technologies that allow for tilting can ensure fuller capture of the sun on long summer days, but also to shed snow and catch the direct sun and intense reflection from the snow on bright late winter and spring days.
Recent innovations in technology and larger uptake have significantly reduced costs for solar energy, including the panels, batteries, and technology to feed it into the grid.
The GNWT has a Solar Strategy that aims to use solar-generated electricity in place of diesel during the summer months, so that diesel plants can be turned off (GNWT 2013). The GNWT has a long term goal of solar energy pro-ducing 20 per cent of the electricity load, and NT Energy has recommended solar installations for all communities in the Sahtu Region in its long term plan (NT Energy 2013). Colville Lake recently installed a solar power system that has been producing electricity, cleanly and quietly, since October 2014 (see Colville Lake Solar Project below).
PHOTO COURTESY PATRICK KANE, GREY GOOSE LODGE/DESTINATION DELINE
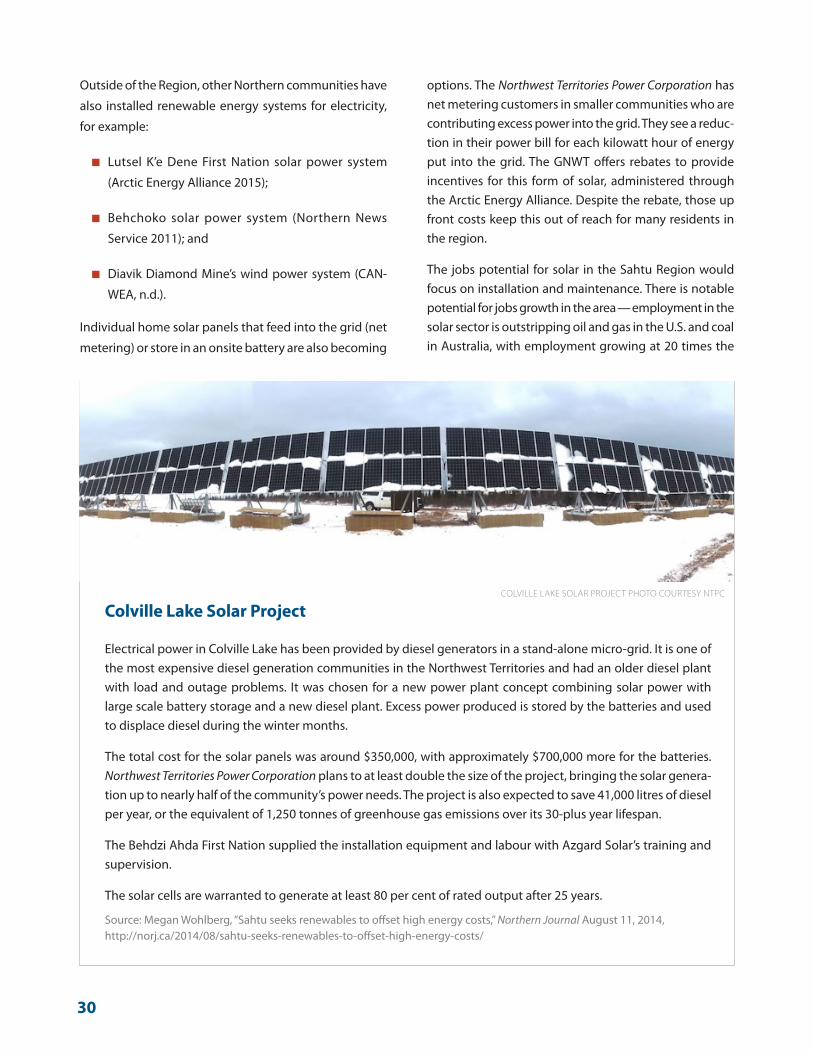
30
Outside of the Region, other Northern communities have
also installed renewable energy systems for electricity,
for example:
■ Lutsel K’e Dene First Nation solar power system
(Arctic Energy Alliance 2015);
■ Behchoko solar power system (Northern News
Service 2011); and
■ Diavik Diamond Mine’s wind power system (CAN-
WEA, n.d.).
Individual home solar panels that feed into the grid (net
metering) or store in an onsite battery are also becoming
options. The Northwest Territories Power Corporation has net metering customers in smaller communities who are contributing excess power into the grid. They see a reduc-tion in their power bill for each kilowatt hour of energy put into the grid. The GNWT offers rebates to provide incentives for this form of solar, administered through the Arctic Energy Alliance. Despite the rebate, those up front costs keep this out of reach for many residents in the region.
The jobs potential for solar in the Sahtu Region would focus on installation and maintenance. There is notable potential for jobs growth in the area — employment in the solar sector is outstripping oil and gas in the U.S. and coal in Australia, with employment growing at 20 times the
COLVILLE LAKE SOLAR PROJECT PHOTO COURTESY NTPC
Colville Lake Solar Project
Electrical power in Colville Lake has been provided by diesel generators in a stand-alone micro-grid. It is one of the most expensive diesel generation communities in the Northwest Territories and had an older diesel plant with load and outage problems. It was chosen for a new power plant concept combining solar power with large scale battery storage and a new diesel plant. Excess power produced is stored by the batteries and used to displace diesel during the winter months.
The total cost for the solar panels was around $350,000, with approximately $700,000 more for the batteries. Northwest Territories Power Corporation plans to at least double the size of the project, bringing the solar genera-tion up to nearly half of the community’s power needs. The project is also expected to save 41,000 litres of diesel per year, or the equivalent of 1,250 tonnes of greenhouse gas emissions over its 30-plus year lifespan.
The Behdzi Ahda First Nation supplied the installation equipment and labour with Azgard Solar’s training and supervision.
The solar cells are warranted to generate at least 80 per cent of rated output after 25 years.
Source: Megan Wohlberg, “Sahtu seeks renewables to offset high energy costs,” Northern Journal August 11, 2014, http://norj.ca/2014/08/sahtu-seeks-renewables-to-offset-high-energy-costs/

31
national average in the U.S.30 Encouraging employment growth in solar energy would have to involve building local capacity, perhaps through mentorship programs to train local people in solar energy installation and maintenance.
Hydro
There is potential for significant hydroelectricity produc-tion in the Sahtu Region. The Mackenzie River could pro-vide hydro, and there is potential for 600MW on the Bear River (NWT Opportunities 2013). Although the majority of jobs are restricted to the construction phase, small scale hydro creates approximately 2.4 operations and mainten-ance jobs per MW installed, while large scale hydro creates approximately 0.3 operations and maintenance jobs per MW installed (IRENA 2013).
Biomass
New technologies have made it possible for wood to be used as a reliable source of energy for individual home or institutional larger scale heating. Large wood pellet boilers can heat institutional buildings such as schools and offices. Some boilers can also fuel district heating systems and generate electricity while smaller models are available for homes.
Biomass incineration (usually wood and wood pellets) has been successfully implemented in a number of communities in the NWT, including public buildings in Norman Wells. The implementation of biomass boilers has produced $1 million in savings annually for the GNWT (GNWT 2013). Additionally, biomass creates approximately 5.51 jobs per MW installed in operations and maintenance (IRENA 2013).
There is a cost advantage of wood boilers over fossil fuel sources although wood pellets are currently imported from Alberta, meaning there are transportation costs associated with the pellets and the harvesting and manufacturing jobs are in the south. Communities in the South Slave (Enterprise and Hay River) are in the process of developing a wood pellet mill based on harvesting in the South Slave. Local alternatives to the wood pellets
30 See survey conducted by the Solar Foundation in the U.S., thesolarfoundation.org/press-release-solar-industry-creating-jobs-nearly-20-times-faster-than-overall-u-s-economy/
include chipping willow and local wood harvesting to reduce costs and localize jobs.
Wind
Wind is a potential source of energy being explored in a number of Sahtu Region communities. Norman Wells has the potential for wind energy, with an average wind speed of 6.3m/s (NT Energy 2013). With current economic conditions, wind energy installations must be subsidized to be competitive as an energy source. However, if carbon emissions were priced appropriately, wind energy (and solar and biomass) would become more competitive. Furthermore, the speed of wind in Norman Wells makes it so that the “break-even” subsidy level would be lower than for solar. The GNWT long term energy strategy rec-ommends conducting a site assessment for wind turbines in Norman Wells (NT Energy 2013). Wind energy creates approximately 0.2 operations and maintenance jobs per MW installed (IRENA 2013).
Diesel Electricity and Human Health
Much of the electricity used in the Sahtu Region is generated by diesel generators. The price of shipped-in diesel is high and there are health risks from diesel exhaust. Diesel includes a number of known and suspected carcinogens, including benzene, arsenic, and formaldehyde, and the International Agency for Cancer Research (IARC) has classified diesel exhaust as a known human carcinogen (IARC 2012). Other pollutants include nitric oxide, nitrogen dioxide, sulphur dioxide, acetaldehyde, acrolein, and hydrocarbons par-ticles. Prolonged exposure can increase the risk of cardiovascular, cardiopulmonary and respiratory disease, and lung cancer (OSHA 2013). Converting to renewable energy sources not only helps grow the local economy, but reduces energy production associated health impacts.31
31 Union of Concerned Scientists, Benefits of Renewable Energy Use, ucsusa.org/clean_energy/our-energy-choices/renewable-energy/public-benefits-of-renewable.html#.Via79n6rTDc
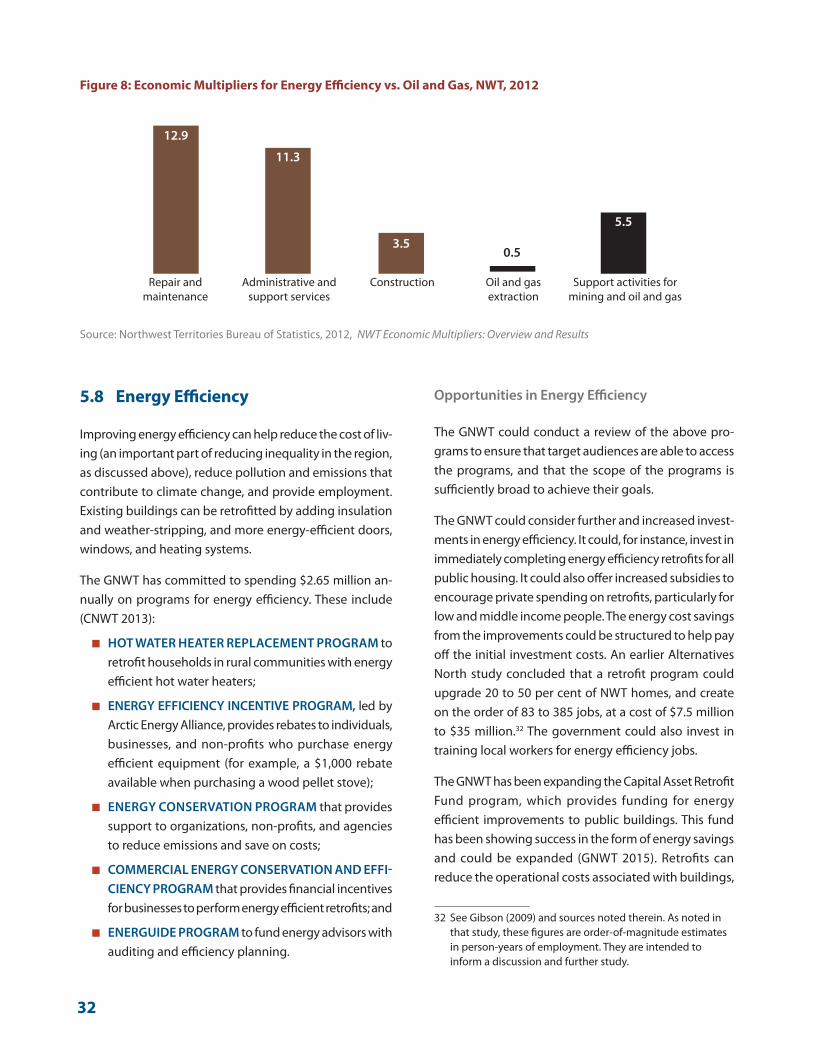
32
5.8 Energy Efficiency
Improving energy efficiency can help reduce the cost of liv-ing (an important part of reducing inequality in the region, as discussed above), reduce pollution and emissions that contribute to climate change, and provide employment. Existing buildings can be retrofitted by adding insulation and weather-stripping, and more energy-efficient doors, windows, and heating systems.
The GNWT has committed to spending $2.65 million an-nually on programs for energy efficiency. These include (CNWT 2013):
■ HOT WATER HEATER REPLACEMENT PROGRAM to retrofit households in rural communities with energy efficient hot water heaters;
■ ENERGY EFFICIENCY INCENTIVE PROGRAM, led by Arctic Energy Alliance, provides rebates to individuals, businesses, and non-profits who purchase energy efficient equipment (for example, a $1,000 rebate available when purchasing a wood pellet stove);
■ ENERGY CONSERVATION PROGRAM that provides support to organizations, non-profits, and agencies to reduce emissions and save on costs;
■ COMMERCIAL ENERGY CONSERVATION AND EFFI-CIENCY PROGRAM that provides financial incentives for businesses to perform energy efficient retrofits; and
■ ENERGUIDE PROGRAM to fund energy advisors with auditing and efficiency planning.
Opportunities in Energy Efficiency
The GNWT could conduct a review of the above pro-grams to ensure that target audiences are able to access the programs, and that the scope of the programs is sufficiently broad to achieve their goals.
The GNWT could consider further and increased invest-ments in energy efficiency. It could, for instance, invest in immediately completing energy efficiency retrofits for all public housing. It could also offer increased subsidies to encourage private spending on retrofits, particularly for low and middle income people. The energy cost savings from the improvements could be structured to help pay off the initial investment costs. An earlier Alternatives North study concluded that a retrofit program could upgrade 20 to 50 per cent of NWT homes, and create on the order of 83 to 385 jobs, at a cost of $7.5 million to $35 million.32 The government could also invest in training local workers for energy efficiency jobs.
The GNWT has been expanding the Capital Asset Retrofit Fund program, which provides funding for energy efficient improvements to public buildings. This fund has been showing success in the form of energy savings and could be expanded (GNWT 2015). Retrofits can reduce the operational costs associated with buildings,
32 See Gibson (2009) and sources noted therein. As noted in that study, these figures are order-of-magnitude estimates in person-years of employment. They are intended to inform a discussion and further study.
0.5
Figure 8: Economic Multipliers for Energy Efficiency vs. Oil and Gas, NWT, 2012
Source: Northwest Territories Bureau of Statistics, 2012, NWT Economic Multipliers: Overview and Results
11.3
12.9
3.5
5.5
Repair and maintenance
Administrative and support services
Construction Oil and gas extraction
Support activities for mining and oil and gas
■ xx put admin back into that para
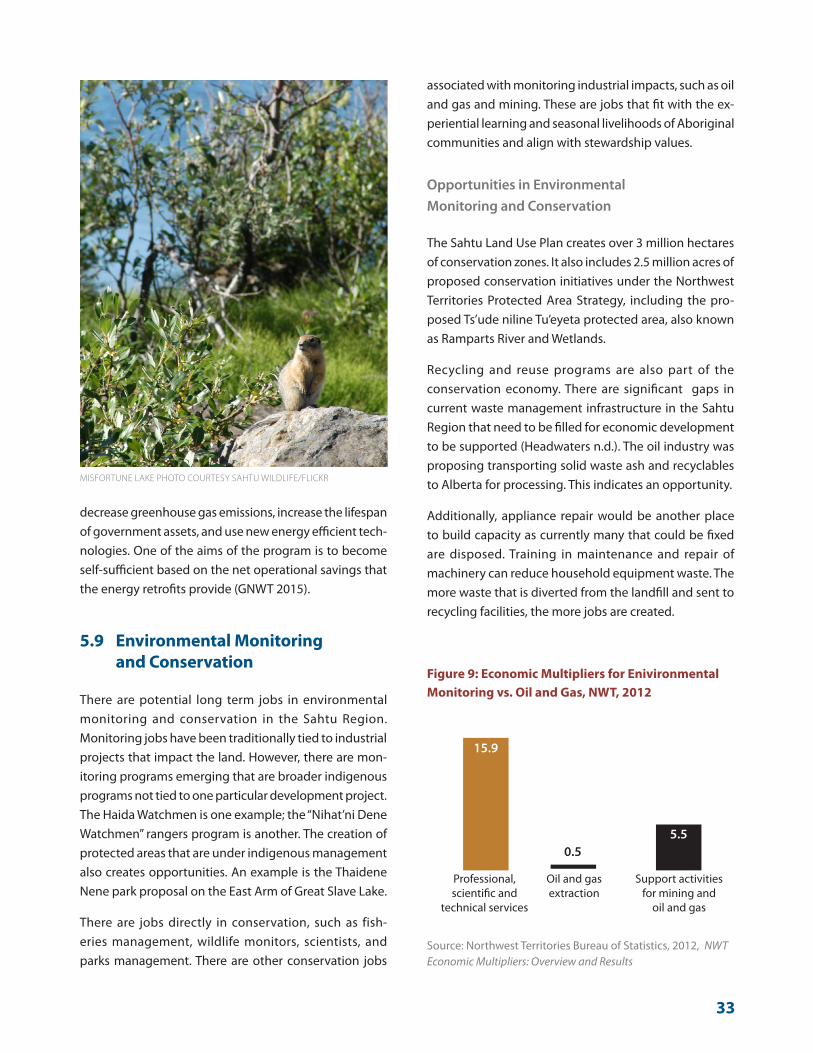
33
decrease greenhouse gas emissions, increase the lifespan of government assets, and use new energy efficient tech-nologies. One of the aims of the program is to become self-sufficient based on the net operational savings that the energy retrofits provide (GNWT 2015).
5.9 Environmental Monitoring and Conservation
There are potential long term jobs in environmental monitoring and conservation in the Sahtu Region. Monitoring jobs have been traditionally tied to industrial projects that impact the land. However, there are mon-itoring programs emerging that are broader indigenous programs not tied to one particular development project. The Haida Watchmen is one example; the “Nihat’ni Dene Watchmen” rangers program is another. The creation of protected areas that are under indigenous management also creates opportunities. An example is the Thaidene Nene park proposal on the East Arm of Great Slave Lake.
There are jobs directly in conservation, such as fish-eries management, wildlife monitors, scientists, and parks management. There are other conservation jobs
associated with monitoring industrial impacts, such as oil and gas and mining. These are jobs that fit with the ex-periential learning and seasonal livelihoods of Aboriginal communities and align with stewardship values.
Opportunities in Environmental Monitoring and Conservation
The Sahtu Land Use Plan creates over 3 million hectares of conservation zones. It also includes 2.5 million acres of proposed conservation initiatives under the Northwest Territories Protected Area Strategy, including the pro-posed Ts’ude niline Tu’eyeta protected area, also known as Ramparts River and Wetlands.
Recycling and reuse programs are also part of the conservation economy. There are significant gaps in current waste management infrastructure in the Sahtu Region that need to be filled for economic development to be supported (Headwaters n.d.). The oil industry was proposing transporting solid waste ash and recyclables to Alberta for processing. This indicates an opportunity.
Additionally, appliance repair would be another place to build capacity as currently many that could be fixed are disposed. Training in maintenance and repair of machinery can reduce household equipment waste. The more waste that is diverted from the landfill and sent to recycling facilities, the more jobs are created.
■ xx put admin back into that para
MISFORTUNE LAKE PHOTO COURTESY SAHTU WILDLIFE/FLICKR
0.5
Figure 9: Economic Multipliers for Enivironmental Monitoring vs. Oil and Gas, NWT, 2012
Source: Northwest Territories Bureau of Statistics, 2012, NWT Economic Multipliers: Overview and Results
15.9
5.5
Professional, scientific and
technical services
Oil and gas extraction
Support activities for mining and
oil and gas
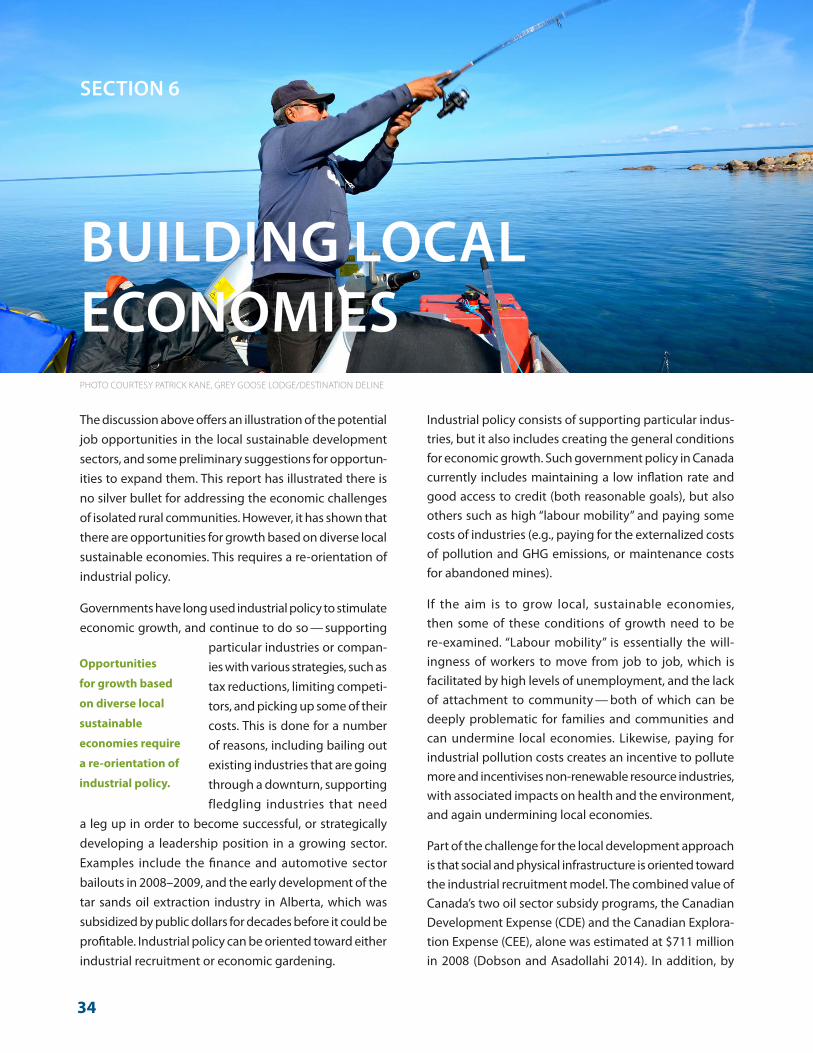
34
Industrial policy consists of supporting particular indus-tries, but it also includes creating the general conditions for economic growth. Such government policy in Canada currently includes maintaining a low inflation rate and good access to credit (both reasonable goals), but also others such as high “labour mobility” and paying some costs of industries (e.g., paying for the externalized costs of pollution and GHG emissions, or maintenance costs for abandoned mines).
If the aim is to grow local, sustainable economies, then some of these conditions of growth need to be re-examined. “Labour mobility” is essentially the will-ingness of workers to move from job to job, which is facilitated by high levels of unemployment, and the lack of attachment to community — both of which can be deeply problematic for families and communities and can undermine local economies. Likewise, paying for industrial pollution costs creates an incentive to pollute more and incentivises non-renewable resource industries, with associated impacts on health and the environment, and again undermining local economies.
Part of the challenge for the local development approach is that social and physical infrastructure is oriented toward the industrial recruitment model. The combined value of Canada’s two oil sector subsidy programs, the Canadian Development Expense (CDE) and the Canadian Explora-tion Expense (CEE), alone was estimated at $711 million in 2008 (Dobson and Asadollahi 2014). In addition, by
The discussion above offers an illustration of the potential job opportunities in the local sustainable development sectors, and some preliminary suggestions for opportun-ities to expand them. This report has illustrated there is no silver bullet for addressing the economic challenges of isolated rural communities. However, it has shown that there are opportunities for growth based on diverse local sustainable economies. This requires a re-orientation of industrial policy.
Governments have long used industrial policy to stimulate economic growth, and continue to do so — supporting
particular industries or compan-ies with various strategies, such as tax reductions, limiting competi-tors, and picking up some of their costs. This is done for a number of reasons, including bailing out existing industries that are going through a downturn, supporting fledgling industries that need
a leg up in order to become successful, or strategically developing a leadership position in a growing sector. Examples include the finance and automotive sector bailouts in 2008–2009, and the early development of the tar sands oil extraction industry in Alberta, which was subsidized by public dollars for decades before it could be profitable. Industrial policy can be oriented toward either industrial recruitment or economic gardening.
SECTION 6
BUILDING LOCAL ECONOMIES
Opportunities
for growth based
on diverse local
sustainable
economies require
a re-orientation of
industrial policy.
PHOTO COURTESY PATRICK KANE, GREY GOOSE LODGE/DESTINATION DELINE
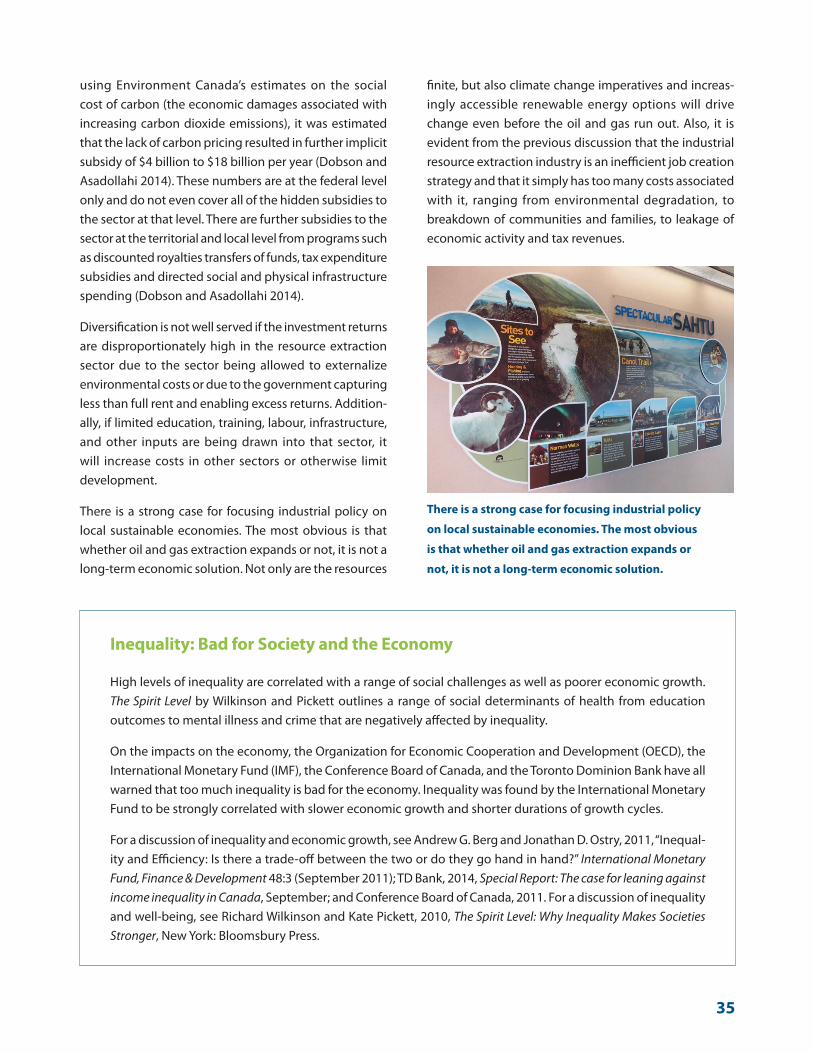
35
using Environment Canada’s estimates on the social cost of carbon (the economic damages associated with increasing carbon dioxide emissions), it was estimated that the lack of carbon pricing resulted in further implicit subsidy of $4 billion to $18 billion per year (Dobson and Asadollahi 2014). These numbers are at the federal level only and do not even cover all of the hidden subsidies to the sector at that level. There are further subsidies to the sector at the territorial and local level from programs such as discounted royalties transfers of funds, tax expenditure subsidies and directed social and physical infrastructure spending (Dobson and Asadollahi 2014).
Diversification is not well served if the investment returns are disproportionately high in the resource extraction sector due to the sector being allowed to externalize environmental costs or due to the government capturing less than full rent and enabling excess returns. Addition-ally, if limited education, training, labour, infrastructure, and other inputs are being drawn into that sector, it will increase costs in other sectors or otherwise limit development.
There is a strong case for focusing industrial policy on local sustainable economies. The most obvious is that whether oil and gas extraction expands or not, it is not a long-term economic solution. Not only are the resources
finite, but also climate change imperatives and increas-ingly accessible renewable energy options will drive change even before the oil and gas run out. Also, it is evident from the previous discussion that the industrial resource extraction industry is an inefficient job creation strategy and that it simply has too many costs associated with it, ranging from environmental degradation, to breakdown of communities and families, to leakage of economic activity and tax revenues.
Inequality: Bad for Society and the Economy
High levels of inequality are correlated with a range of social challenges as well as poorer economic growth. The Spirit Level by Wilkinson and Pickett outlines a range of social determinants of health from education outcomes to mental illness and crime that are negatively affected by inequality.
On the impacts on the economy, the Organization for Economic Cooperation and Development (OECD), the International Monetary Fund (IMF), the Conference Board of Canada, and the Toronto Dominion Bank have all warned that too much inequality is bad for the economy. Inequality was found by the International Monetary Fund to be strongly correlated with slower economic growth and shorter durations of growth cycles.
For a discussion of inequality and economic growth, see Andrew G. Berg and Jonathan D. Ostry, 2011, “Inequal-ity and Efficiency: Is there a trade-off between the two or do they go hand in hand?” International Monetary Fund, Finance & Development 48:3 (September 2011); TD Bank, 2014, Special Report: The case for leaning against income inequality in Canada, September; and Conference Board of Canada, 2011. For a discussion of inequality and well-being, see Richard Wilkinson and Kate Pickett, 2010, The Spirit Level: Why Inequality Makes Societies Stronger, New York: Bloomsbury Press.
There is a strong case for focusing industrial policy
on local sustainable economies. The most obvious
is that whether oil and gas extraction expands or
not, it is not a long-term economic solution.
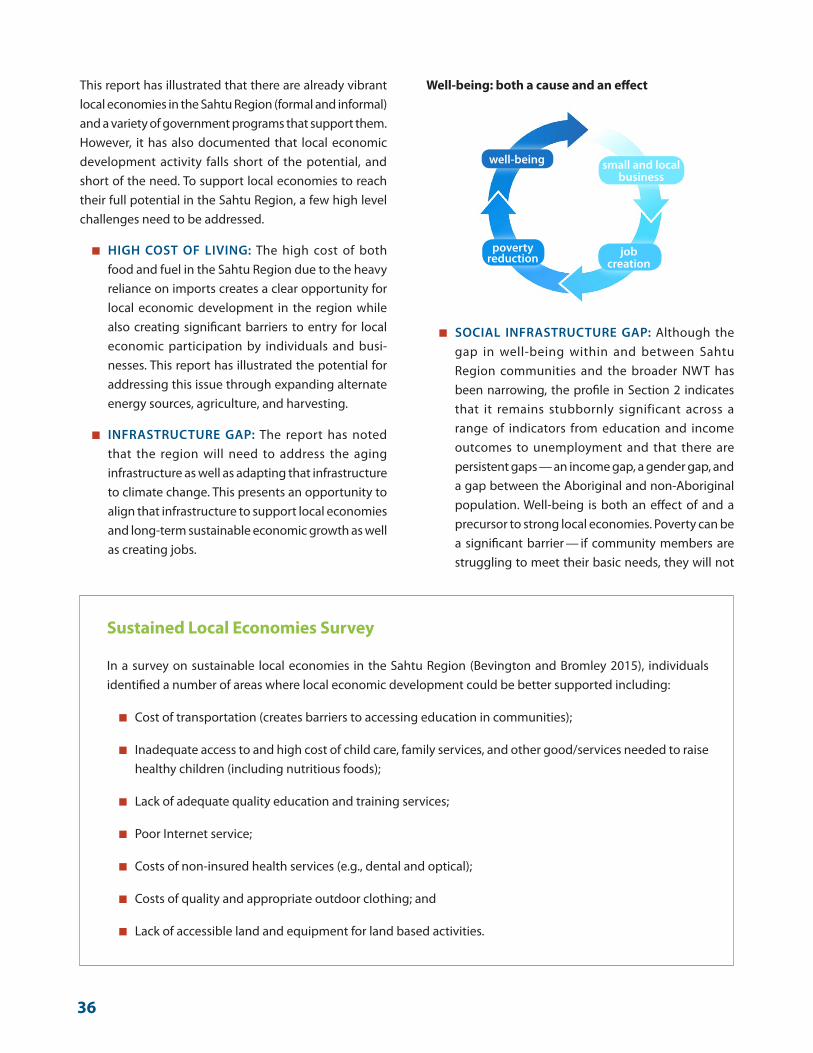
36
This report has illustrated that there are already vibrant local economies in the Sahtu Region (formal and informal) and a variety of government programs that support them. However, it has also documented that local economic development activity falls short of the potential, and short of the need. To support local economies to reach their full potential in the Sahtu Region, a few high level challenges need to be addressed.
■ HIGH COST OF LIVING: The high cost of both food and fuel in the Sahtu Region due to the heavy reliance on imports creates a clear opportunity for local economic development in the region while also creating significant barriers to entry for local economic participation by individuals and busi-nesses. This report has illustrated the potential for addressing this issue through expanding alternate energy sources, agriculture, and harvesting.
■ INFRASTRUCTURE GAP: The report has noted that the region will need to address the aging infrastructure as well as adapting that infrastructure to climate change. This presents an opportunity to align that infrastructure to support local economies and long-term sustainable economic growth as well as creating jobs.
■ SOCIAL INFRASTRUCTURE GAP: Although the gap in well-being within and between Sahtu Region communities and the broader NWT has been narrowing, the profile in Section 2 indicates that it remains stubbornly significant across a range of indicators from education and income outcomes to unemployment and that there are persistent gaps — an income gap, a gender gap, and a gap between the Aboriginal and non-Aboriginal population. Well-being is both an effect of and a precursor to strong local economies. Poverty can be a significant barrier — if community members are struggling to meet their basic needs, they will not
Well-being: both a cause and an effect
well-being small and local business
job creation
poverty reduction
Sustained Local Economies Survey
In a survey on sustainable local economies in the Sahtu Region (Bevington and Bromley 2015), individuals identified a number of areas where local economic development could be better supported including:
■ Cost of transportation (creates barriers to accessing education in communities);
■ Inadequate access to and high cost of child care, family services, and other good/services needed to raise healthy children (including nutritious foods);
■ Lack of adequate quality education and training services;
■ Poor Internet service;
■ Costs of non-insured health services (e.g., dental and optical);
■ Costs of quality and appropriate outdoor clothing; and
■ Lack of accessible land and equipment for land based activities.
37
be able to participate fully in the local economy as a producer, consumer, or entrepreneur. It is not just absolute income that matters, but relative income is important too — too much inequality can also be a drag on economic growth and can be bad for well-being (see Inequality: Bad for Society and the Economy on page 35).
6.1 Redefining the Conditions for Growth
In addition to re-examining some of the conventional industrial policies, and addressing the high level challen-ges, there should be a fuller study and discussion of other policies that may need to be implemented or expanded in order to better stimulate local, sustainable economies. The following are some preliminary suggestions.
■ Implementing a “triple bottom line” approach that balances economic goals with environmental and social goals would eliminate artificial trade offs between jobs and the environment.
■ Expanded education and training and redefinition to better include experiential learning and informal skills in order to have a local workforce that is prepared for the diverse opportunities in the local economy. Training programs that build skills and expertise locally to expand local business support initiatives such as entrepreneurship, business administration, and marketing.
■ Creating more capacity at the community level (perhaps with expanding the Industry, Tourism, and Investment regional economic development offices to support local economic development initiatives), do capacity building, and transfer knowledge around business administration, amongst other areas.
■ A healthy environment in order to maintain the foundation for traditional harvest and sustenance, tourism, and other economic activity.
■ Elimination of subsidies to industrial-scale resource extraction, in order to rebalance the playing field and redirection of those subsidies to alternative economic sectors.
■ Better income redistribution mechanisms to reduce income inequality and improve economic growth.
■ Focus on programs and economic development activities (e.g., harvesting, farmers markets) that strengthen social capital (personal networks and community cohesion) — also correlated with eco-nomic growth (Putnam 2000).
■ The maintenance of vibrant traditional economy activities in order to provide current and future guideposts and critical information about ways to nourish and grow a sustainable economy.
■ Support alternative business ownership structures that encourage positive social outcomes, e.g., cooperatives and social enterprises. Cooperatives play a key role in small, rural communities where a smaller population base presents challenges for making a business succeed (Gibson 2005). Co-operatives can provide an alternative, and can be designed to service the needs of their members instead of make a profit.
■ Financial and other incentive programs for local econ-omies need to be appropriately targeted to support small steps as well as large ones and early explora-tion of potential. Innovation needs to be supported.
■ A longer-term economic vision and a longer-term outlook generally, particularly among industrial leaders and government policymakers, rather than the short-term focus on the next election and the next quarterly financial statement.
■ Paying greater attention to a wide range of metrics for monitoring success, not just in terms of GDP and formal employment levels, but also in terms of income and food security, well-being, social and family cohesion, cultural connectedness, and other social determinants of health.
6.2 Financing the Changes Needed
Some of the changes above will reduce costs to the government. For example, reducing subsidies to oil and gas extraction and other extractive industries can provide the government with significant funds to support other
38
local sustainable economy initiatives. Restructuring subsidies could include requiring polluting firms to pay for the costs of their own emissions, including climate change emissions.
In terms of infrastructure spending, debt financing is appropriate and available. Debt financing is particularly appropriate for infrastructure investments (as opposed to program spending) because the services or benefits provided by the investment are received over the period of the debt repayments. Debt financing became more available to the GNWT under the 2015/2016 Federal Budget, which raised the debt cap for the Northwest Territories to $1.3 billion. This increased the amount of money available for the NWT government to borrow to invest in the infrastructure needed for economic develop-ment (Canadian Chamber of Commerce 2015).
Finally, tax revenues can be raised if the other sources are not adequate. Revenue reports for the NWT have indicated that there is revenue room (Thompson 2008a; Thompson, 2008b; Thompson and Gibson 2009). It is a carefully constructed myth that taxes have to be low to build economies. Scandinavian countries, with higher tax and growth rates, have demonstrated that this is not true. Taxes are needed in order to pay for the necessary social and physical infrastructure to support a thriving economy
(Thompson and Gibson 2009). People and businesses are attracted by the availability of healthy workers who are well-housed, educated, and skilled; social and family cohesion; and overall quality of life. If taxes are kept low to attract business, and public services under funded, the local economy can be undermined. Academic research has concluded that decisions to live locally for individuals and families are critical to building a base for local econ-omies. These decisions hinge on the attractive qualities of the living environment from the environment to social capital (Power 2015). These factors include:
■ Character, cost, and quality of the available work-force;
■ Character and quality of the local school system;
■ Character and quality of public services;
■ Richness and depth of culture and community (see Social Capital text box); and
■ Environment.
Governments can boost investment in these areas in order to support local economies.
Social Capital
Social capital is the glue that holds people and communities together, and includes civic engagement, volunteer-ing and social clubs, norms of reciprocation and cooperation, networks, sharing, and trust. Like physical capital (e.g., factories) and human capital (education), social capital contributes to productivity and economic growth.
It appears that social capital is declining in modern industrial societies (e.g., Putnam 2000) with adverse con-sequences for communities and economies. The evidence suggests that one major contributor to this trend is the privatization of leisure time, e.g., through television and the Internet. Other factors resulting in community disruption, such as parents leaving their community to work in remote locations for extended periods of time, would exacerbate the problem.
The identification of realistic policy solutions to support social capital will be dependent upon local culture, and should include the involvement of local people. However, it seems reasonable that public policy should first and foremost “do no harm” i.e., avoid undermining existing social capital.
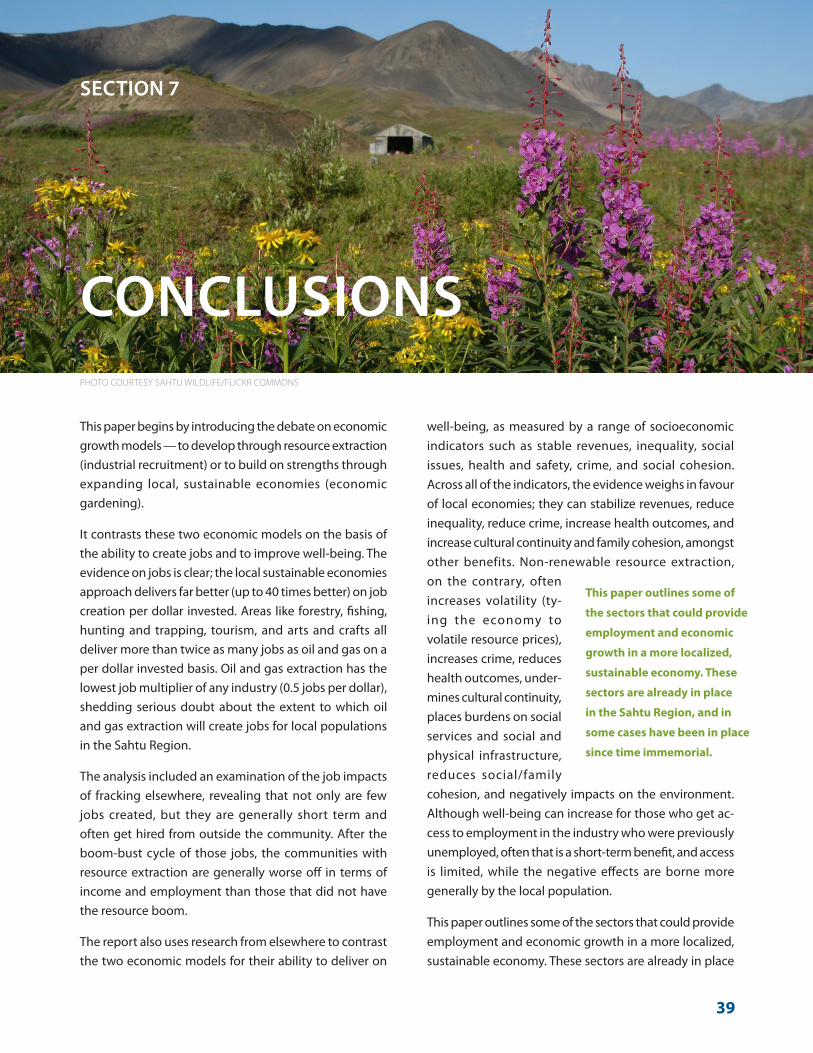
39
This paper begins by introducing the debate on economic growth models — to develop through resource extraction (industrial recruitment) or to build on strengths through expanding local, sustainable economies (economic gardening).
It contrasts these two economic models on the basis of the ability to create jobs and to improve well-being. The evidence on jobs is clear; the local sustainable economies approach delivers far better (up to 40 times better) on job creation per dollar invested. Areas like forestry, fishing, hunting and trapping, tourism, and arts and crafts all deliver more than twice as many jobs as oil and gas on a per dollar invested basis. Oil and gas extraction has the lowest job multiplier of any industry (0.5 jobs per dollar), shedding serious doubt about the extent to which oil and gas extraction will create jobs for local populations in the Sahtu Region.
The analysis included an examination of the job impacts of fracking elsewhere, revealing that not only are few jobs created, but they are generally short term and often get hired from outside the community. After the boom-bust cycle of those jobs, the communities with resource extraction are generally worse off in terms of income and employment than those that did not have the resource boom.
The report also uses research from elsewhere to contrast the two economic models for their ability to deliver on
well-being, as measured by a range of socioeconomic indicators such as stable revenues, inequality, social issues, health and safety, crime, and social cohesion. Across all of the indicators, the evidence weighs in favour of local economies; they can stabilize revenues, reduce inequality, reduce crime, increase health outcomes, and increase cultural continuity and family cohesion, amongst other benefits. Non-renewable resource extraction, on the contrary, often increases volatility (ty-ing the economy to volatile resource prices), increases crime, reduces health outcomes, under-mines cultural continuity, places burdens on social services and social and physical infrastructure, reduces social/family cohesion, and negatively impacts on the environment. Although well-being can increase for those who get ac-cess to employment in the industry who were previously unemployed, often that is a short-term benefit, and access is limited, while the negative effects are borne more generally by the local population.
This paper outlines some of the sectors that could provide employment and economic growth in a more localized, sustainable economy. These sectors are already in place
SECTION 7
CONCLUSIONS
This paper outlines some of
the sectors that could provide
employment and economic
growth in a more localized,
sustainable economy. These
sectors are already in place
in the Sahtu Region, and in
some cases have been in place
since time immemorial.
PHOTO COURTESY SAHTU WILDLIFE/FLICKR COMMONS
40
in the Sahtu Region, and in some cases have been in place since time immemorial. Some receive support from existing programs.
Local, sustainable economic options — from agricul-ture and renewable energy to tourism and arts and crafts — have been around for a long time, and are growing. There is likely significant potential for further growth in those sectors if they are prioritized. It will be necessary to change the economic model to one that focuses on local sustainable economies rather than one that aims to recruit investment dollars from outside. Policies will need to use a triple bottom line approach to avoid false trade-offs between short-term jobs and the environment, so that the environmental, social and economic goals will be balanced. Policies will need to bet-ter value non-traditional, informal sector work, education and training, and activities that build the social capital on which the economy depends (e.g., social and family cohesion, independence).
Finally, it will be useful to conduct an evidence based public review of the programs in place to assess whether there are continuing barriers to access, or unintended inefficiencies that create disincentives for local economic participation and development.
Encouraging sustainable economic development in all communities of the Sahtu Region can help decrease this inequality and improve well-being, but it also hinges on there being adequate social and physical infrastructure as well as basic needs in place for those economies to flourish.
More generally, this discussion paper suggests that it is time for a closer analysis and a thoughtful public conver-sation about the future development of the Sahtu Region. There are very different options available, and the choices to be made could have profound and long-term impacts on the people, culture and communities of the Region.
41
Aboriginal Affairs and Northern Development Canada (AANDC). 2014. Aboriginal Business. https://www.aadnc-aandc.gc.ca/eng/1100100032796/1100100032800
Aboriginal Affairs and Northern Development Canada (AANDC). 2014a. Frequently Asked Questions – Northwest Territories Devolution. https://www.aadnc-aandc.gc.ca/eng/1352470624114/1352470863709
Aboriginal Affairs and Northern Development Canada (AANDC). 2014b. Changes to the Mackenzie Valley Resources Management Act. https://www.aadnc-aandc.gc.ca/eng/1395959603959/1396007102876
Aboriginal Affairs and Northern Development Canada (AANDC). 2013. Northwest Territories Devolution. https://www.aadnc-aandc.gc.ca/eng/1352398433161/1352400493640
Aboriginal Affairs and Northern Development Canada (AANDC). 1993. Sahtu Dene and Metis Comprehensive Land Claim Agreement. Ottawa. ISBN: 0-662-21218-5. QS- 5315-000-EE-AI.
Aboriginal Pipeline Group (APG). No Date. Aboriginal Pipeline Group. www.mackenziegasproject.com/whoWeAre/APG/APG.htm
Arctic Energy Alliance. 2015. “Lutsel K’e Dene 35 kW Solar PV Installation.” April 5. http://aea.nt.ca/blog/2015/05/lutsel-ke-35-kw-solar-pv-installation
Arctic Marine and Assessment Programme (AMAP). 1998. AMAP Assessment Report: Arctic pollution issues. Oslo, Norway.
Bevington, D. and B. Bromley. 2015. Sustainable NWT Economies – On-line Survey Summary. www.dennisbevington.ca/pdfs/en/2015/Sustainable_NWT_Survey_Report_2015.pdf
Blanchard, Troy and Todd L. Matthews. 2006. “The Configuration of Local Economic Power and Civic Participation in the Global Economy.” Social Forces. June.
Blanchard, Troy C., Charles Tolbert and Carson Mencken. 2011. The Health and Wealth of US Counties: How the Small Business Environment Impacts Alternative Measures of Development. Cambridge Journal of Regions, Economy, and Society.
Blix, Arnoldus Schytte, John Ness and Hans Lian. 2011. “Experiences from 40 years of muskox (Ovibos moschatus) farming in Norway.” Rangifer 31.1:1-6.
Boettner, T. 2015. A Softer Landing – Fighting the Resource Curse. West Virginia Center on Policy and Budget. March 20. www.wvpolicy.org/wp-content/uploads/2015/03/Fed-Reserve-Shale-Presentation-March-19-20151.pdf
Brodhead, J., J. Darling and S. Mullin. 2014. Crisis and Opportunity: Time for a National Infrastructure Plan for Canada. October 1. http://canada2020.ca/crisis-opportunity-time-national-infrastructure-plan-canada/
Bruce, M. and S. Robertson. 1994. “An examination of the impact of the commercial use of muskox underwool upon Native Alaskan villagers.” Rangifer 14.1: 39-44.
Canada Without Poverty. 2012. Northwest Territories Poverty Progress Profile.
Canadian Chamber of Commerce. 2015. Budget Analysis: Federal Budget 2015. www.chamber.ca/media/blog/150421-budget-brings-canada-to-crossroads-/2015_Budget_Analysis.pdf
Canadian Community Economic Development Network. 2005. Defining the social economy in Indigenous communities. Victoria, British Columbia: Canadian Community Economic Development Network.
Canadian Northern Economic Development Network (CanNor). 2014. Government of Canada Invests in NWT Traditional Economy. www.cannor.gc.ca/eng/1391621523312/1391621666723
References and Resources

42
Canadian Wind Energy Association (CANWEA). No date. Diavik wind farm: Wind energy helps reduce carbon footprint. http://canwea.ca/wp-content/uploads/2013/12/canwea-casestudy-DiavikMine-e-web2.pdf
CBC News. 2015. “Imperial Oil, BP delay Beaufort sea drilling plans indefinitely: Companies had planned to begin drilling by 2020.” www.cbc.ca/news/canada/north/imperial-oil-bp-delay-beaufort-sea-drilling-plans-indefinitely-1.3129505
CBC News. 2014. “Sahtu oil needs $100 price to get to market: analyst.” October 27. www.cbc.ca/news/canada/north/sahtu-oil-needs-100-price-to-get-to-market-analyst-1.2814066
CBC News. 2012. “N.W.T. farmer harvests potatoes near Arctic Circle.” October 12. www.cbc.ca/news/canada/north/n-w-t-farmer-harvests-potatoes-near-arctic-circle-1.1219655
Christopherson, Susan and Ned Rightor. 2012. “How shale gas extraction affects drilling localities: Lessons for regional and city policy makers.” Journal of Town & City Management 2, 4, 000–000. Henry Stewart Publications 1756-9538.
Christopherson, Susan. 2011. “The Economic Consequences of Marcellus Shale Gas Extraction: Key Issues.” Cornell University Department of City & Regional Planning CaRDI Reports No. 14. September.
Civic Economics. 2013. Small Business and the British Columbia Economy.
Civic Economics. 2012. Indie Impact Study: Salt Lake City, Utah.
Conference Board of Canada. 2013. Cultivating OppOrtunities: Canada’s Growing Appetite for Local Food.
Conference Board of Canada. 2011. Canadian Income Inequality, Is Canada Becoming More Unequal? July.
Day-Farnsworth, Lindsey et al. 2009. Scaling Up: Meeting the Demand for Local Food. University of Wisconsin-Extension Agricultural Innovation Center, University of Wisconsin Center for Integrated Agricultural Systems.
Délįnę Land Corporation. 2012. “Délįnę Land Corporation Planning Workshop.” May 15-16, 2012.
Dobson, Sarah and Amin Asadollahi. 2014. Fossil Fuel Subsidies: An analysis of federal financial support to Canada’s oil sector. Pembina Institute. pembina.org/reports/fossil-fuel-subsidies.pdf
Eckford, C. and J. Wagg. 2014. The Peace Project: Gender based analysis of violence against women and girls in Fort St. John. February. Prepared for the Fort St. John Women’s Resource Society. https://thepeaceprojectfsj.files.wordpress.com/2014/03/the_peace_project_gender_based_analysis_amended.pdf
Fienup-Riorden, Ann. 1991. Eskimo essays: Yup’ik lives and how we see them. New Brunswick, NJ: Rutgers University Press.
Flora, Jan L. et al. 1992. “Self‐Development: A Viable Rural Development Option?” Policy Studies Journal 20(2): 276-288.
Freeman, Milton M.R. 1986. “Renewable resources, economics and Native communities.” In Native peoples and renewable resource management. Edmonton: Alberta Society of Professional Biologists. 23–37.
Gibson, D. and D. Thompson. 2009. The Northwest Territories 2010-2011 Budget: An Opportunity for Today and the Future. www.aged.alternativesnorth.ca/pdf/NWTBudgetReport2009.pdf
Gibson, Ryan. 2005. The role of cooperatives in community economic development. Brandon University.
Grant, T. 2015. “Energy provinces take hardest hit as EI claims spike.” Globe and Mail. April 24. www.monster.ca/news/other/energy-provinces-take-hardest-hit-as-ei-claims-spike-cf49bb?nichecat=it
Green, Joanna and Duncan Hilchey. 2002. Growing Home: A Guide to Reconnecting Agriculture, Food and Communities. Ithaca, NY, Community, Food and Agriculture Program, Department of Sociology, Cornell University.
Government of Canada. No Date. Canada Business Network. www.canadabusiness.ca/eng/
43
Government of the Northwest Territories (GNWT). 2015. Tom Beaulieu: Capital asset retrofit fund program update. February 25. http://news.exec.gov.nt.ca/tom-beaulieu-capital-asset-retrofit-fund-program-update/
Government of the Northwest Territories (GNWT). 2014a. Sahtu Region Hazard Identification Risk Assessment (HIRA). www.maca.gov.nt.ca/wp-content/uploads/2014/04/hira-Sahtu_final.pdf
Government of the Northwest Territories (GNWT). 2014b. Sahtu Oil and Gas Exploration Needs Assessment 2012-2014.
Government of the Northwest Territories (GNWT). 2013. Northwest Territories energy action plan: A three-year action plan and a long-term vision. www.iti.gov.nt.ca/sites/default/files/energy_action_plan_web_feb_20.pdf
Government of the Northwest Territories (GNWT). 2000. Towards a Better Tomorrow – A Non-Renewable Resource Development Strategy for the Northwest Territories. www.gov.nt.ca/FMBS/documents/dox/NRRDS.pdf
Government of the Northwest Territories (GNWT), NWT Chamber of Commerce, Northern Aboriginal Business Association, NWT Association of Communities, and Canadian Northern Economic Development Agency. 2013. Northwest Territories Economic Opportunities Strategy.
Grant, T. 2015. Number of Alberta EI recipients increases for sixth straight month. The Globe and Mail June 19, 2015. www.theglobeandmail.com/report-on-business/economy/jobs/oil-sensitive-alberta-sees-107-surge-in-jobless-benefits/article25013799/
Harnum, B., J. Hanlon, T. Lim, J. Modeste, D. Simmons and A. Spring. 2014. “Best of Both Worlds: Depending on the Land in the Sahtú Region.” Sahtú Renewable Resources Board with the Pembina Institute. Tulita, Canada: Sahtú Renewable Resources Board. www.srrb.nt.ca/index.php?option=com_content&view=article&id=253:traditional-economy&catid=120&Itemid=848
Headwater Group. n.d. Sahtu Region Shale Oil Issues and Action Plan. Draft Pre-Workshop Report.
Hefley, E. William and Yongsheng Wang (eds). 2015. Economics of Unconventional Shale Gas Development: Case Studies and Impacts. Springer International Publishing.
Herzenberg, S. 2011. “Drilling deeper into job claims.” Harrisburg, Pennsylvania: Keystone Research Center. http://keystoneresearch.org/sites/keystoneresearch.org/files/Drilling-Deeper-into-Jobs-Claims-6-20-2011_0.pdf
Hirvonen, R. 1975. Forest resources of the Mackenzie River Valley. Forest Management Institute Information Report. FMR-X-71 Study FM-112.
Hua, C. 1985. “Energy-Related Boom Towns: problems, Causes, Policies, and Modeling.” In Large-scale Energy Projects: Assessment of Regional Consequences. T.R. Lakshmanan and B. Johansson (eds). Amsterdam: Elsevier Science Publishers. p. 215-232.
International Agency for Research on Cancer (IARC). 2012. IARC: Diesel engine exhaust carcinogenic. June 12. www.iarc.fr/en/media-centre/pr/2012/pdfs/pr213_E.pdf
International Renewable Energy Agency (IRENA). 2013. Renewable Energy and Jobs. Abu Dhabi. www.irena.org/rejobs.pdf
Jacobsen, Grant D. and Dominic P. Parker. 2014. “The Economic Aftermath of Resource Booms: Evidence from Boomtowns in the American West.” The Economic Journal. October 18. DOI: 10.1111/ecoj.12173.
Jacquet, J. 2011.”Workforce development challenges in the natural gas industry.” Working Paper Series for A comprehensive economic impact analysis of natural gas extraction in the Marcellus Shale, Cornell University Department of City and Regional Planning. greenchoices.cornell.edu/development /marcellus/policy.cfm
KAIROS: Canadian Ecumenical Justice Initiatives. 2008. Pumped Up: How Canada subsidizes fossil fuels at the expense of green alternatives.
Kelsey, T.W., Ladlee J. Shields and M. Ward. 2011. Economic Impacts of Marcellus Shale in Pennsylvania: Employment and Income in 2009. Marcellus Shale Education and Training Center.
44
Lee, M.R. and S.A. Thomas. 2010. “Civic Community, Population Change, and Violent Crime in Rural Communities.” Journal of Research in Crime and Delinquency 47:118-147.
Lonner, T.D. 1980. Subsistence as an economic system in Alaska: Theoretical and policy implications. Anchorage: Alaska Department of Fish and Game, Division of Subsistence. Technical Paper 67.
Loppie Reading, Charlotte and Fred Wien. 2009. Health Inequalities and Social Determinants of Aboriginal Peoples’ Health. National Collaborating Centre for Aboriginal Health.
Low, Sarah et al. 2015. Trends in U.S. Local and Regional Food Systems: A Report to Congress. U.S. Department of Agriculture, Economic Research Service.
Luton, Harry and Rodney Cluck. 2003. Social Impact Assessment and Offshore Oil and Gas in the Gulf of Mexico.
Lutra Associates and Ne’rahten Development. 2013. A Framework for Economic Development in Fort Good Hope, NWT. January.
Lutra Associates. 2005. GNWT regional workshop on the social impacts of the Mackenzie Valley Gas Project. Sponsored by the GNWT. Norman Wells. September.
Lyson, Thomas A. 2004. Civic Agriculture: Reconnecting Farm, Food, and Community. Lebanon, NH: Tufts University Press.
McGlade, C. and P. Ekins. 2015. “The geographical distribution of fossil fuels unused when limiting global warming to 2C.” Nature 517 (January). http://dx.doi.org/10.1038/nature14016
Mauro, Frank, Michael Wood, Michele Mattingly, Mark Price, Stephen Herzenberg and Sharon Ward. 2013. Exaggerating the Employment Impacts of Shale Drilling: How and Why. Multi-State Shale Research Collaborative. November 2013.
Ministry of Indian Affairs and Northern Development. 2013. “Creating the conditions for economic success on reserve lands: A report on the experiences of 25 First Nation communities.” QS: QS-7129-000-EE-A1. Catalogue: R3-190/2013E-PDF
Natcher, David C. 2009. “Subsistence and the Social Economy of Canada’s Aboriginal North.” Northern Review 30 (Spring): 83–98.
Neale, Walter C. 1971. “Monetization, commercialization, market orientation, and market dependence.” In G. Dalton (ed.), Studies in Economic Anthropology. Washington, DC: American Anthropological Association. p. 25–29.
National Aboriginal Health Organization. 2008. Resource Extraction and Aboriginal Communities in Northern Canada: Cultural Considerations. Ottawa.
Northways. 2010. “Aboriginal Tourism Engagement Strategy.”
Northern News Service. 2011. “Behchoko Solar Panel System First in NWT.” www.nnsl.com/frames/newspapers/2011-08/aug29_11sol.html
Northwest Territories Bureau of Statistics (NWT). 2014a. Population Estimates: Community population by age group, 2001-2014. www.statsnwt.ca/population/population-estimates/
Northwest Territories Bureau of Statistics (NWT). 2014b. Labour force by detailed industry and gender: 2011 & 2014. www.statsnwt.ca/labour-income/labour-force-activity/
Northwest Territories Bureau of Statistics (NWT). 2012. NWT Economic Multipliers: Overview and Results, www.statsnwt.ca/economy/multipliers/Multiplier%20Report-2012.pdf
Northwest Territories Business Development and Investment Corporation (NWT BDIC). 2015. www.bdic.ca/
Northwest Territories Community Futures Association (NWT CFA). No date. Sahtu Business Development Centre. www.nwtcfa.ca/Sahtu.htm
Northwest Territories Energy (NT Energy). 2013. A vision for the NWT power system plan. www.iti.gov.nt.ca/sites/default/files/nwt_power_systems_plan_december2013.pdf

45
Northwest Territories Industry, Tourism and Investment, Government of Canada, and Genuine Mackenzie Valley Furs. 2012. Programs and Services in Support of a Traditional Economy in the NorthWest Territories. www.iti.gov.nt.ca/publications/traditional-economy-northwest-territories
Northwest Territories Industry, Tourism and Investment (NWT ITI). No date. Support for Entrepreneurs and Economic Development (SEED). www.iti.gov.nt.ca/programs-services/support-entrepreneurs-and-economic-development-seed
Northwest Territories Industry, Tourism and Investment (NWT ITI). No date. Sahtu (profile). www.iti.gov.nt.ca/content/Sahtu-profile
Northwest Territories Industry, Tourism and Investment (NWT ITI). 2014a. 2013/2014 Grants and Contributions Results Report. www.assembly.gov.nt.ca/sites/default/files/td_168-175.pdf
Northwest Territories Industry, Tourism and Investment (NWT ITI). 2014b. Visitor Spending and Numbers. www.iti.gov.nt.ca/infopage/visitor-spending-and-numbers
Northwest Territories Industry, Tourism and Investment (NWT ITI). 2013. “Economic Opportunities Strategy.” Sahtu Presentation. January 21.
Northwest Territories Industry, Tourism and Investment (NWT ITI). 2012. Programs and services in support of the traditional economy in the Northwest Territories. www.iti.gov.nt.ca/sites/default/files/TraditionalEconomyInTheNWT_WEB_20120405.pdf
Northwest Territories Industry, Tourism and Investment (NWT ITI). 2011. Tourism 2015: New directions for spectacular future. www.iti.gov.nt.ca/sites/default/files/tourismplanbrochure2015_20110223.pdf
NWT Opportunities. 2013. Economic Opportunities Profile: The Sahtu Region. www.nwtopportunities.com/sites/default/files/Profile%20%26%20SWOT%20Sahtu.pdf
Occupational Safety and Health Administration (OSHA). 2013. Hazard alert: Diesel exhaust/diesel particulate matter. https://www.osha.gov/Publications/OSHA-3590.pdf
Power, Thomas. 2015. Economic Development and Environmental Protection. Routledge, New York. 2 ed.
Pringle, Anthony. 2013. The Power of Purchasing: The Economic Impacts of Local Procurement. Vancouver, BC: Columbia Institute, LOCO BC, and ISIS Research Centre at the Sauder School of Business.
Putnam, Robert D. 2000. Bowling Alone: The Collapse and Revival of American Community. New York: Simon & Schuster. ISBN 0-7432-0304-6.
Quenneville, G. 2015. “Layoffs in N.W.T.’s Sahtu region follow slowdown in oil exploration Businesses in Norman Wells face prospect of 2nd winter with no exploration.” CBC News, March 24, 2015. www.cbc.ca/m/news/canada/north/layoffs-in-n-w-t-s-Sahtu-region-follow-slowdown-in-oil-exploration-1.3006280
Ruddell, R., S. Dheeshana, R.M. Jayasundara and T. Heitkamp. 2014. “Drilling down: An examination of the boom-crime relationship in resource based boom counties.” Western Criminology Review 15(1):3-17.
Rupasingha, Anil. 2013. “Locally Owned: Do Local Business Ownership and Size Matter for Local Economic Well-being?” Federal Reserve Bank of Atlanta Community and Economic Development Discussion Paper No. 01-13. August.
Sahlins, Marshal. 1971. The intensity of domestic production in primitive societies: Social inflections of the Chayanov Slope. In G. Dalton (ed.), Studies in economic anthropology. Washington, DC: American Anthropological Association: 30–51.
Sahtú Renewable Resources Planning Board (SRRB). 2013. Sahtú Land Use Plan.
Sahtú Renewable Resources Planning Board (SRRB). 2010. “Sahtú Land Use Plan Background Report.” July 8.
Scotland, M. 2013. “Farmers Market Revived.” Northern News Services Online. April 3, 2013. www.nnsl.com/frames/newspapers/2013-04/apr3_13fm.html
Statistics Canada. 2015. Consumer price index, food, by province (Alberta). www.statcan.gc.ca/tables-tableaux/sum-som/l01/cst01/econ156j-eng.htm
46
Story, L. 2012. “As companies seek tax deals, governments pay high price.” New York Times, December 1, 2012. www.nytimes.com/2012/12/02/us/how-local-taxpayers-bankroll-corporations.html?pagewanted=all&_r=2
Stumpff, Linda Moon. 2013. “Sustaining Oomingmak, Sustain Us: Alaska Natives and the Muskox Adapt to Social and Ecological Change.” Native Cases: The Evergreen State College.
Thompson D. and D. Gibson. 2009. “The Northwest Territories 2010-2011 Budget: An opportunity for today and the future” Parkland Institute, University of Alberta. www.parklandinstitute.ca/research/summary/the_northwest_territories_2010-2011_budget
Thompson, David. 2008a. Public Service Cuts in the Northwest Territories: Economic Imperative or Political Choice? Parkland Institute, University of Alberta. May.
Thompson, David. 2008b. A Fair Price: Taxation, Services and Programs in the Northwest Territories. Parkland Institute, University of Alberta. October.
Thornton, Thomas F. 1998. “Alaska Native subsistence: A matter of cultural survival.” Cultural Survival Quarterly 22(3):29–34.
Torjusen, Hanne, Geir Lieblein, and Gunnar Vitters. 2008. “Learning, communicating and eating in local food-systems: the case of organic box schemes in Denmark and Norway.” Local environment 13 (3):219-234.
Vail, Stephen and Graeme Clinton. 2001. Nunavut economic outlook: An examination of the Nunavut economy. Ottawa, Ontario: Conference Board of Canada.
Weinstein, A.L. and M.D. Partridge. 2011.“The Economic Value of Shale Gas in Ohio.” Ohio State University. December.
Wheelersburg, Robert P. 2008. “The need to conduct studies of Swedish Saami reindeer- herder subsistence behaviours: A case of Indigenous resource-use rights.” Northern Review 28:161–180.
Wilkinson, Richard and Kate Pickett. 2010. The Spirit Level: Why Greater Equality Makes Societies Stronger. New York: Bloomsbury Press.
Woodrum, A. 2014. Fracking in Carroll County, Ohio: An impact assessment. Policy Matters Ohio. April. www.policymattersohio.org/wp-content/uploads/2014/04/Shale_Apr2014.pdf
Yellowknife Farmers Market. No date. Our Story. www.yellowknifefarmersmarket.ca/history/
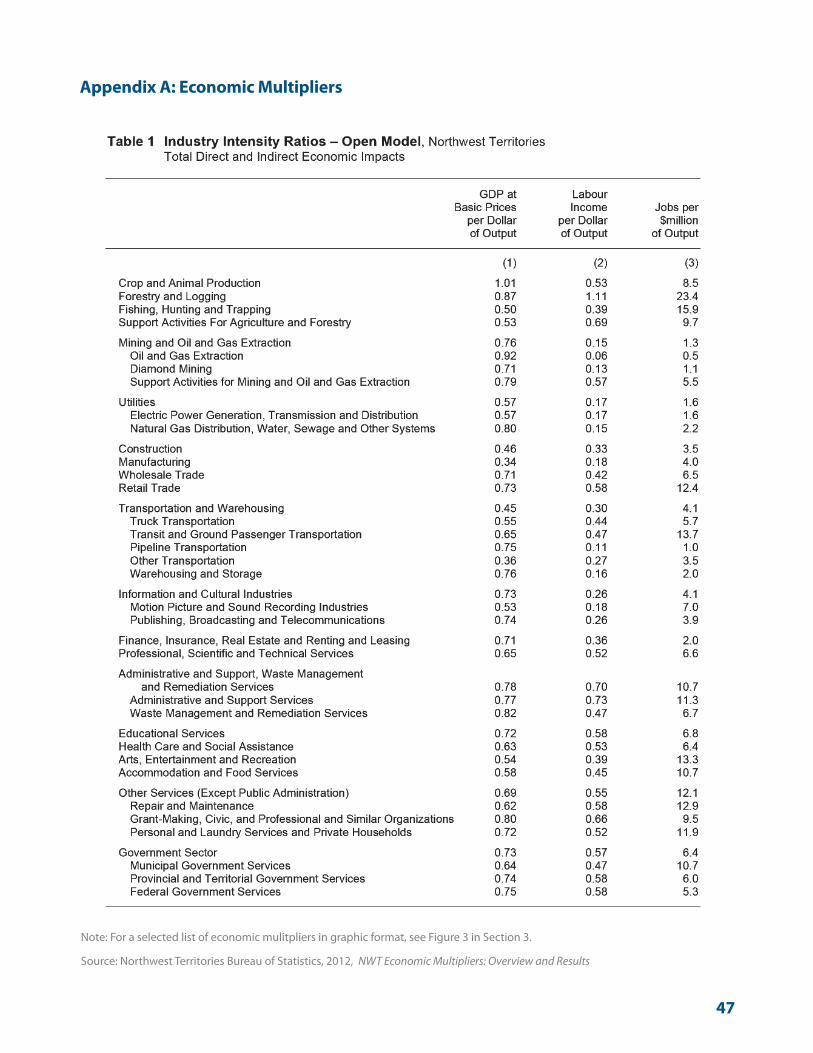
47
Appendix A: Economic Multipliers
Note: For a selected list of economic mulitpliers in graphic format, see Figure 3 in Section 3.
Source: Northwest Territories Bureau of Statistics, 2012, NWT Economic Multipliers: Overview and Results
P.O. Box 444, Yellowknife, Northwest Territories X1A 2N3
t: 867.873.5422 e: [email protected]
alternativesnorth.ca
SAHTU REGION/GOOGLE EARTH