economic & fiscal impact analysis - martin county, florida · development program to estimate...
TRANSCRIPT

WTL+a
WTL +a R e a l E s t a t e & E c o n o m i c A d v i s o r s W a s h i n g t o n , D C — P r o v i n c e t o w n , M A 2 0 2 . 6 3 6 . 4 0 0 2 3 0 1 . 5 0 2 . 4 1 7 1 7 7 4 . 5 3 8 . 6 0 7 0 1
Economic & Fiscal Impact Analysis Pineland Prairie Martin County, FL
Prepared for: Marcela Camblor & Associates, Inc. Stuart, FL
On behalf of: Shadow Lake Groves, Inc. Stuart, FL
Revised October 2017

WTL+a
WTL +a R e a l E s t a t e & E c o n o m i c A d v i s o r s W a s h i n g t o n , D C — P r o v i n c e t o w n , M A 2 0 2 . 6 3 6 . 4 0 0 2 3 0 1 . 5 0 2 . 4 1 7 1 7 7 4 . 5 3 8 . 6 0 7 0 2
Table of Contents Table of Contents ................................................................................................................................. 2
Tables & Figures .................................................................................................................................. 3
General & Limiting Conditions ........................................................................................................ 4
1 Introduction ..................................................................................................................................... 5
Project Overview ....................................................................................................................................... 5
Development Program ............................................................................................................................. 6
Assumptions, Methodology & Data Sources ........................................................................................ 8
2 Key Findings ................................................................................................................................... 9
Executive Summary .................................................................................................................................. 9
One-time/Temporary Impacts ........................................................................................................................... 9
Permanent Impacts: Ongoing Operations..................................................................................................... 10
Annual Tax Revenues: Ongoing Operations ................................................................................................ 10
3 Economic Impacts ................................................................................................................................ 12
During Construction/Sales & Ongoing Operations ............................................................................ 12
Direct, Indirect & Induced Impacts ................................................................................................................. 12
Development Impacts on Employment .......................................................................................................... 13
Development Impacts on Martin County Revenues .................................................................................... 13
Estimated Construction Costs .............................................................................................................. 13
One-time Impacts: Construction ........................................................................................................... 15
Permanent Impacts: Ongoing Operations ........................................................................................... 16
Annual Tax Revenues: Ongoing Operations ....................................................................................... 18
4 Market Considerations ........................................................................................................................ 20
Martin County Housing Potentials (2016—2040) ....................................................................................... 20
Scenario #1 ........................................................................................................................................................ 21
Scenario #2 ........................................................................................................................................................ 22
Workforce Region #20 Office Potentials (2016—2024) .................................................................... 24
Allocation to Martin County ............................................................................................................................. 25
Workforce Region #20 Industrial Potentials (2016—2024) ...................................................................... 28

WTL+a
WTL +a R e a l E s t a t e & E c o n o m i c A d v i s o r s W a s h i n g t o n , D C — P r o v i n c e t o w n , M A 2 0 2 . 6 3 6 . 4 0 0 2 3 0 1 . 5 0 2 . 4 1 7 1 7 7 4 . 5 3 8 . 6 0 7 0 3
Allocation to Martin County ............................................................................................................................. 29
Tables & Figures Table 1: Proposed Development Program (At Buildout)—Pineland Prairie 7 Table 2: Estimated Construction Costs (2017 Dollars) 14 Table 3: Economic Impacts of Construction 15 Table 4: Annual Impacts at Buildout/Stabilized Year—Ongoing Operations 17 Table 5: Annual Property Tax Revenues at Buildout—Martin County (General Operations Only) 19 Table 6: Scenario #1 Housing Demand Potentials—Martin County, 2016—2040 23 Table 7: Scenario #2 Housing Demand Potentials—Martin County, 2016—2040 24 Table 8: Office Market Potentials, 2016—2024 26 Table 9: General Industrial Market Potentials, 2016—2024 30 Table 10: Demographics Trends & Forecasts—Martin County, 2000—2021 33 Table 11: Employment Trends—Martin & St. Lucie Counties, 1995—2016 34 Table 12: Business Mix—Martin County, 2016 35 Table 13: DEO Employment Forecasts—Workforce Region #20, 2016—2024 36 Table 14: Annual Housing Starts—Martin County, 2002—2016 (15 Years) 37 Table 15: Comparison of 2010 Housing Data—Martin County 38 Table 16: Housing Profile—Martin County, 2010—2021 39 Table 17: Office Real Estate Metrics—Martin County, 2007—2016 40 Table 18: Industrial Real Estate Metrics—Martin County, 2007—2016 41 Table 19: Retail Real Estate Metrics—Martin County, 2007—2016 42 Table 20: Comparison of Household Growth to Housing Starts—Martin County, 2001—2016 43

WTL+a
WTL +a R e a l E s t a t e & E c o n o m i c A d v i s o r s W a s h i n g t o n , D C — P r o v i n c e t o w n , M A 2 0 2 . 6 3 6 . 4 0 0 2 3 0 1 . 5 0 2 . 4 1 7 1 7 7 4 . 5 3 8 . 6 0 7 0 4
General & Limiting Conditions Every reasonable effort has been made to ensure that the data contained in this study reflect the most
accurate and timely information possible. These data are believed to be reliable at the time the study
was conducted. This study is based on estimates, assumptions, and other information developed by
WTL +Associates (referred hereinafter as “WTL+a”) from its independent research effort, general
knowledge of the market and the industry, and consultations with the client and its representatives. No
responsibility is assumed for inaccuracies in reporting by the client, its agent and/or representatives, or
any other data source used in preparing or presenting this study.
No warranty or representation is made by WTL+a that any of the projected values or results contained
in this study will be achieved. Possession of this study does not carry with it the right of publication
thereof or to use the name of "WTL+a" in any manner without first obtaining the prior written consent of
WTL+a. No abstracting, excerpting or summarizing of this study may be made without first obtaining
the prior written consent of WTL+a. This report is not to be used in conjunction with any public or
private offering of securities or other similar purpose where it may be relied upon to any degree by any
person, other than the client, without first obtaining the prior written consent of WTL+a. This study may
not be used for purposes other than that for which it is prepared or for which prior written consent has
first been obtained from WTL+a.
This study is qualified in its entirety by, and should be considered in light of, these limitations,
conditions and considerations.

WTL+a
WTL +a R e a l E s t a t e & E c o n o m i c A d v i s o r s W a s h i n g t o n , D C — P r o v i n c e t o w n , M A 2 0 2 . 6 3 6 . 4 0 0 2 3 0 1 . 5 0 2 . 4 1 7 1 7 7 4 . 5 3 8 . 6 0 7 0 5
1 Introduction
Project Overview WTL+a, a national real estate and economic development consulting firm based in Washington, D.C.,
with extensive experience in public and private projects across Florida, was retained by Marcela
Camblor & Associates, Inc., on behalf of Shadow Lake Groves, Inc., to prepare an economic and fiscal
impact analysis of a proposed mixed-use project, Pineland Prairie, in Martin County, FL. We also
prepared a demographic and economic profile, reviewed growth forecasts, and evaluated real estate
market conditions in Martin County as the basis for understanding preliminary market potentials for the
project’s residential, commercial and industrial land uses.
Pineland Prairie comprises approximately 3,400 acres of land in north central Martin County. The site
is surrounded by development of various scales, intensities, and uses:
North—bounded by the C-23 canal and the City of Port St. Lucie;
South—bounded by Citrus Grove Elementary, County playing fields, the Canopy Creek
subdivision, and the equestrian ranchettes of Palm City Farms along Martin Highway (714);
East—bounded by Florida’s Turnpike and Martin Downs; and
West (inside I-95)—bounded by Martin County’s Waste Transfer Station and shooting range, the
Seven J’s industrial park, and the equestrian and golf communities of Stuart West and Cobblestone.
Pineland Prairie is also bisected on a diagonal by Citrus Boulevard, which extends from Martin
Highway to Port St. Lucie across the C-23.
The eastern portion of the site (approximately 600 acres alongside Florida’s Turnpike) is located inside
the Primary Urban Service District (PUSD), and has a land use designation of Industrial (I) with a
zoning designation of Light Industrial (LI). Public sewer and water are readily available at the property
line. The remainder of the site has a land use designation of AG Ranchette with a zoning designation
of A2.

WTL+a
WTL +a R e a l E s t a t e & E c o n o m i c A d v i s o r s W a s h i n g t o n , D C — P r o v i n c e t o w n , M A 2 0 2 . 6 3 6 . 4 0 0 2 3 0 1 . 5 0 2 . 4 1 7 1 7 7 4 . 5 3 8 . 6 0 7 0 6
The applicant, Shadow Grove Lakes, Inc., is seeking to create a new land use category—“Compact
Mixed Use (CMU)”—as well as a new zoning category—“Planned Mixed Use Village (PMUV)”—to
guide implementation of a new, mixed-use community that will be developed according to the best
practices of Traditional Neighborhood Design (TND). As a result, an amendment to Martin County’s
Comprehensive Plan is required.
The applicant and its planner, Marcela Camblor & Associates, Inc., requested that WTL+a prepare an
economic and fiscal impact analysis of the proposed development program. This memorandum
summarizes the results of that analysis.
Development Program The proposed development program is focused on balancing key land uses—residential, workplace
(office and industrial) and supporting retail—in a mix necessary to support a self-contained, walkable
community. A key objective of the plan is to reduce dependency on vehicles and enhance public
access to an extensive network of undeveloped parcels/open space that will be preserved in perpetuity.
In fact, development rights will be removed in perpetuity on approximately 65% (over 2,200 acres) of
the site.
The proposed development is illustrated in Table 1 below. Uses are distributed across nine
neighborhoods, and include the following:
Residential—4,200 housing units across a range of product types, including “compounds” and
“estate” houses, large and small houses, cottages, duplexes, rowhouses, “mansion” apartments,
multi-family units and live/work units in small, medium and large mixed-use buildings
“Workplace”—includes approximately 139,500 sq. ft. of professional office space; 1.5 million sq. ft.
of logistics and general industrial space and almost 500,000 sq. ft. of “flex-tech” industrial uses, and
Commercial Retail—includes approximately 154,270 sq. ft. of various retail uses as identified in
the analysis prepared by Gibbs Planning Group (GPG).
WTL+a notes that the program for both the workplace (office and logistics/general industrial) and
commercial retail uses fall within the site’s previously approved entitlements totaling 2,290,000 sq. ft.

WTL+a
WTL +a R e a l E s t a t e & E c o n o m i c A d v i s o r s W a s h i n g t o n , D C — P r o v i n c e t o w n , M A 2 0 2 . 6 3 6 . 4 0 0 2 3 0 1 . 5 0 2 . 4 1 7 1 7 7 4 . 5 3 8 . 6 0 7 0 7
Table 1: Proposed Development Program (At Buildout)—Pineland Prairie
Average GrossNo. of Unit Size Building Area
Land Use Units (SF) (SF)Residential (Revised Program)Large Mixed-Use 160 1,167 186,720 Medium Mixed-Use 183 1,167 213,561 Small-Mixed Use 56 1,167 65,352 Apartment House 674 688 463,712 Mansion Apartment 206 1,172 241,432 Rowhouse 900 2,188 1,969,200 Duplex 62 2,925 181,350 Small Lot House (Cottage) 896 1,625 1,456,000 House 674 3,413 2,300,362 Large House 252 6,075 1,530,900 Estate House 123 7,988 982,524 House Compound 14 3,125 43,750 Subtotal - Residential: 4,200 2,464 9,634,863
WorkplaceProfessional Office 139,490 Logistics/General Industrial (1) 1,497,180 Flex-tech (1) 499,060 Subtotal - Workplace: 2,135,730
CommercialRetail 154,270
TOTAL: Workplace/Commercial Entitlements 2,290,000
Residential 9,634,863
Total - Gross Building Area (SF): 11,924,863
(1) Assumed 75% split for logistics and 25% for flex-tech uses.
Source: Shadow Lake Groves, Inc.; Marcela Camblor & Associates, Inc.; WTL+a, revised October 2017.

WTL+a
WTL +a R e a l E s t a t e & E c o n o m i c A d v i s o r s W a s h i n g t o n , D C — P r o v i n c e t o w n , M A 2 0 2 . 6 3 6 . 4 0 0 2 3 0 1 . 5 0 2 . 4 1 7 1 7 7 4 . 5 3 8 . 6 0 7 0 8
Assumptions, Methodology & Data Sources The economic impact analysis evaluates how the development program for Pineland Prairie could be
expected to impact Martin County through the creation of new jobs as well as new tax revenues
accruing to the County and potential other taxing districts/entities.
For purposes of this study, WTL+a utilized IMPLAN (a national software and data provider) that
calculates impact multipliers and generates a model that applies inputs from Pineland Prairie’s
development program to estimate corresponding impacts on job growth and fiscal revenues. To
strengthen and validate these multipliers, WTL+a also incorporated data from ESRI (a national
analytics and data provider) on average business revenues, number of employees by business type,
and average household size and income. In addition, current tax rates were collected from Martin
County.
At this stage of planning, we note that the following key inputs to fully complete the economic impact
analysis were not available:
Hard and soft construction costs for the project’s residential, commercial and workplace uses. We
have used inputs from general comparables in/surrounding Martin County and industry standards
as placeholders; and
Hard and soft construction costs for the project’s infrastructure, public realm and transportation-
related improvements. At this time, economic and fiscal impacts associated with the project’s infrastructure and public realm improvements cannot be determined.

WTL+a
WTL +a R e a l E s t a t e & E c o n o m i c A d v i s o r s W a s h i n g t o n , D C — P r o v i n c e t o w n , M A 2 0 2 . 6 3 6 . 4 0 0 2 3 0 1 . 5 0 2 . 4 1 7 1 7 7 4 . 5 3 8 . 6 0 7 0 9
2 Key Findings
Executive Summary At buildout, Pineland Prairie will be a walkable community with a mix of land uses, including: 4,200
residential units in a variety of products and price points; community amenities; almost 154,300 sq. ft. of
supporting community retail; and a significant amount of “workplace” uses, such as 139,500 sq. ft. of
professional office space and approximately 1.9 million sq. ft. of jobs-producing logistics and flex-tech
industrial space.
Based on the current development program, Pineland Prairie is expected to cost almost $1.075 billion (in current/2017 dollars). WTL+a notes, however, that this excludes costs associated with land
acquisition as well as infrastructure, public realm and transportation-related costs. These costs were
not available for this analysis, but could be expected to enhance the project’s overall economic impacts
beyond those identified in this analysis.
One-time/Temporary Impacts Pineland Prairie will create a significant number of temporary (or “one-time”) construction jobs
generated by the project’s 11.9 million sq. ft. of total development. As illustrated in Table 3, this
includes:
o 6,509 direct construction job years (i.e., the amount of labor needed for one year’s work) over
the entire construction period (which is unknown at this time)
o Another 1,281 direct construction job years in architecture, engineering, design and other
professional services
o Income from one-time construction jobs will be spent on a variety of goods and services, which
will support an additional 2,650 indirect and 2,000+ induced job years in various industry sectors
o Over 12,400 total construction job years over the construction period, approximately $791 million in “value-added” business revenues, and over $520 million in total labor income.

WTL+a
WTL +a R e a l E s t a t e & E c o n o m i c A d v i s o r s W a s h i n g t o n , D C — P r o v i n c e t o w n , M A 2 0 2 . 6 3 6 . 4 0 0 2 3 0 1 . 5 0 2 . 4 1 7 1 7 7 4 . 5 3 8 . 6 0 7 0 10
Permanent Impacts: Ongoing Operations Once development of Pineland Prairie is complete, there will be significant annual impacts from
“ongoing operations” of the project. These impacts will be generated throughout Martin County and
beyond; however, we have examined only those impacts generated by ongoing operations on Martin
County itself. These impacts, which are illustrated in Table 4, are highlighted below:
o At buildout, the project will create a total of 4,245 direct jobs plus an additional 2,184 indirect
and over 3,700 induced jobs—for a total of 10,200 jobs in a stabilized year;
o Because of the project’s significant amount of logistics and general industrial uses, fully 74% of
the direct jobs (over 3,100 jobs) will be generated in these sectors, which may include
warehousing, distribution, logistics/freight movement, light assembly/device manufacturing,
research and development, etc.;
o At buildout and stabilized occupancies (i.e., generally considered to be 95% across all uses),
the project will generate over $424 million in annual labor income based on current annual
salaries among various industry sectors used by IMPLAN in the analysis;
o The project could be expected to create almost $629 million in annual (net) business revenues (i.e., gross sales less costs)—irrespective of location—generated by direct, indirect
and induced economic activity. However, over $272 million in direct (i.e., on-site) annual net
business revenues could be expected at buildout; and
o In summary, the IMPLAN economic impact model estimates that Pineland Prairie will generate over $1.22 billion in annual economic output because of direct, indirect and
induced economic activity in ongoing operations when buildout is complete and stabilized
occupancies are achieved.
Annual Tax Revenues: Ongoing Operations WTL+a has estimated those property tax revenues accruing only to the Martin County General Fund based on the preliminary 2017 millage rate of $9.5622 per $1,000 of assessed value. Other
taxing entities, such as the Martin County School Board (Local and State), Children Services, South
Florida Water Management District, Florida Inland Navigation District (FIND) and District 5 MSTU have
not been estimated at this time. Key results are summarized below and illustrated in Table 5:

WTL+a
WTL +a R e a l E s t a t e & E c o n o m i c A d v i s o r s W a s h i n g t o n , D C — P r o v i n c e t o w n , M A 2 0 2 . 6 3 6 . 4 0 0 2 3 0 1 . 5 0 2 . 4 1 7 1 7 7 4 . 5 3 8 . 6 0 7 0 11
The project’s residential uses are expected to command the largest share of new General Fund
revenues—approximately $10.2 million per year based on estimated assessed values of $1.068
billion at buildout;
The project’s workplace (office) and supporting retail uses, with an estimated assessed value of
$38.5 million at buildout, could be expected to generate approximately $367,700 per year in annual
ad valorem; and
Due to the low assessed values (despite a sizable gross building area of more than 1.99 million sq.
ft.), the project’s logistics/general industrial uses will generate annual ad valorem of less than
$200,000 per year based on estimated assessed values of $19.8 million. However, this is a
preliminary estimate that does not consider the types of logistics users that could be located at
Pineland Prairie. High-value logistics users (such as an Amazon Logistics/Freight facility) typically
command much higher values due to fixtures/equipment necessary for operations.
In summary, Pineland Prairie’s 11.9 million sq. ft. of proposed land uses are expected to create over
$1.12 billion in gross assessed value at buildout (in current/2017 dollars). At current General Fund
mil rates, this has the potential to generate over $10.7 million in annual property tax revenues for
Martin County at buildout.
Pineland Prairie: $1.12 Billion in Value = $10.7 Million
in Annual Ad Valorem to Martin County

WTL+a
WTL +a R e a l E s t a t e & E c o n o m i c A d v i s o r s W a s h i n g t o n , D C — P r o v i n c e t o w n , M A 2 0 2 . 6 3 6 . 4 0 0 2 3 0 1 . 5 0 2 . 4 1 7 1 7 7 4 . 5 3 8 . 6 0 7 0 12
3 Economic Impacts
During Construction/Sales & Ongoing Operations Pineland Prairie’s economic impacts can be classified into two primary categories that affect job growth,
tax revenues and County expenditures:
Temporary/One-time Impacts—during site construction and sales/lease-up of each land use
before the project is fully occupied. For example, construction of infrastructure, public realm
improvements and each of the land uses generates temporary construction jobs and associated
taxes. Initial home sales of Pineland Prairie’s residential uses generate sizeable property transfer
tax revenues.; and
Ongoing Operations—ongoing annual impacts once the project is built out and achieves stabilized
and/or full occupancy. Once Pineland Prairie is built out and achieves stabilized and/or full
occupancy, the primary sources of County revenues include property taxes from residents and
corporate and sales tax receipts from businesses expenditures that, in turn, fund municipal services
such as fire protection, police protection, EMS, and public-school costs.
Moreover, as fiscal revenues and expenses are so different before and after a project has stabilized,
the analysis considers these two periods separately. As such, the results of these analyses are
presented in separate tables for (1) the time during construction/sales/lease-up, and (2) the ongoing
period after stabilized occupancies have been achieved.
Direct, Indirect & Induced Impacts The analysis considers not only direct (i.e., on-site) job growth and fiscal revenues, but also indirect and
induced fiscal impacts. Indirect impacts reflect the “trickle-down” nature of money. For example, when
a new job is created, an employee generates economic activity through the purchase of goods and
services with that income (and income tax revenues in those states with income taxes). That spending
is taxed via various taxing categories, such as retail sales and business taxes. Not only does this
employee generate additional indirect tax revenues, but this spending generates “induced” impacts,
such as another business hiring additional employees and the resultant spending that occurs with that
new employee. These additional economic impacts are incorporated into the analysis.

WTL+a
WTL +a R e a l E s t a t e & E c o n o m i c A d v i s o r s W a s h i n g t o n , D C — P r o v i n c e t o w n , M A 2 0 2 . 6 3 6 . 4 0 0 2 3 0 1 . 5 0 2 . 4 1 7 1 7 7 4 . 5 3 8 . 6 0 7 0 1 3
Development Impacts on Employment The analysis utilizes the findings of retail demand prepared by Gibbs Planning Group that identifies
potentially supportable types of retail at Pineland Prairie. In addition, other key inputs and assumptions
pertain to types of workplace/industry sectors and tenants that would locate at Pineland Prairie,
including the potential types of businesses; the amount of commercial office, logistics and/or retail
space each could be expected to occupy; reasonable annual sales estimates for each business
enterprise; and order-of-magnitude hard and soft construction costs for the project. These are critical
inputs required in the IMPLAN model to generate total estimated jobs and tax revenues for each type of
job, by industry sector.
Development Impacts on Martin County Revenues WTL+a has estimated property tax revenues accruing to Martin County’s General Fund and School
District if Pineland Prairie is developed as proposed in its entirety. While there are multiple other tax
revenues that would be created by new development at this stage of the analysis these other tax
revenues—such as communications and utility taxes, retail sales tax receipts, business licensing and
the like—cannot be determined because of uncertainties associated with types of businesses
phasing/annual unit absorption, annual retail sales, etc.
Estimated Construction Costs As illustrated in Table 2 below, Pineland Prairie is expected to cost almost $1.075 billion (in
current/2017 dollars). WTL+a notes, however, that this excludes costs associated with land acquisition
as well as infrastructure, public realm and transportation-related costs. These costs were not available
for this analysis, but could be expected to enhance the project’s overall economic impacts beyond
those identified in this analysis.
Estimated construction costs will also sustain a significant number of jobs in construction, engineering,
design and other related fields during Pineland Prairie’s buildout. Estimated construction costs for each
use are as follows:
Residential—the project’s 4,200 housing units, comprising over 9.6 million sq. ft. of gross building
area, are estimated to cost $844.9 million (almost 79% of total)
Commercial—the project’s 293,760 sq. ft. of supporting retail and workplace/office uses is
estimated to cost over $55 million, or only 5% of total construction costs

WTL+a
WTL +a R e a l E s t a t e & E c o n o m i c A d v i s o r s W a s h i n g t o n , D C — P r o v i n c e t o w n , M A 2 0 2 . 6 3 6 . 4 0 0 2 3 0 1 . 5 0 2 . 4 1 7 1 7 7 4 . 5 3 8 . 6 0 7 0 14
Table 2: Estimated Construction Costs (2017 Dollars)
Average Total Hard Costs Estimated Soft Costs Estimated Land & Infra- TOTALUnits SF / Unit SF Per SF (1) Hard Costs Per SF (2) Soft Costs structure (3) COSTS
Residential (Revised Program)Large Mixed-Use 160 1,167 186,720 (140.00)$ (26,140,800)$ (35.00)$ (6,535,200)$ N/A (32,676,000)$ Medium Mixed-Use 183 1,167 213,561 (140.00) (29,898,540) (35.00) (7,474,635) (37,373,175) Small-Mixed Use 56 1,167 65,352 (140.00) (9,149,280) (35.00) (2,287,320) (11,436,600) Apartment House 674 688 463,712 (68.95) (31,972,942) (14.31) (6,635,719) (38,608,661) Mansion Apartment 206 1,172 241,432 (68.95) (16,646,736) (14.31) (3,454,892) (20,101,628) Rowhouse 900 2,188 1,969,200 (68.95) (135,776,340) (14.31) (28,179,252) (163,955,592) Duplex 62 2,925 181,350 (68.95) (12,504,083) (14.31) (2,595,119) (15,099,201) Small Lot House (Cottage) 896 1,625 1,456,000 (68.95) (100,391,200) (14.31) (20,835,360) (121,226,560) House 674 3,413 2,300,362 (68.95) (158,609,960) (14.31) (32,918,180) (191,528,140) Large House 252 6,075 1,530,900 (68.95) (105,555,555) (14.31) (21,907,179) (127,462,734) Estate House 123 7,988 982,524 (68.95) (67,745,030) (14.31) (14,059,918) (81,804,948) House Compound 14 3,125 43,750 (68.95) (3,016,563) (14.31) (626,063) (3,642,625) Total - Units: 4,200 2,464 9,634,863 (697,407,029)$ (147,508,836)$ (844,915,865)$
CommercialRetail 154,270 (150.00)$ (23,140,500)$ (37.50)$ (5,785,125)$ N/A (28,925,625)$ Workplace/Office 139,490 (150.00) (20,923,500) (37.50) (5,230,875) (26,154,375) Total - SF: 293,760 (44,064,000)$ (11,016,000)$ (55,080,000)$
Logistics/General IndustrialLogistics/Warehousing & Distribution 1,497,180 (70.00)$ (104,802,600)$ (17.50)$ (26,200,650)$ N/A (131,003,250)$ Flex-tech 499,060 (70.00) (34,934,200) (17.50) (8,733,550) (43,667,750) Total - SF: 1,996,240 (139,736,800)$ (34,934,200)$ (174,671,000)$
TOTAL PROGRAM & COSTS: 11,924,863 (881,207,829)$ (193,459,036)$ (1,074,666,865)$
(1) Residential hard costs based on comparable projects, as available. Commercial and logistics hard costs based on national industry standards.(2) Residential soft costs based on comparable projects, as available. Commercial and logistics soft costs assumed at 25% of hard costs.(3) Land acquisition, infrastructure and public realm costs are unknown at this time and therefore excluded from analysis.(4) All mixed-use, Apartment House, and Mansion Apartment units considered "multifamily", for purposes of IMPLAN input
http://www.maxxbuilders.com/insight/construction-cost-per-sf
Source: IMPLAN; Hilltop Property Advisors; Jon Stover & Associates, Inc.; Marcela Camblor & Associates, Inc.; WTL +a, revised October 2017.

WTL+a
WTL +a R e a l E s t a t e & E c o n o m i c A d v i s o r s W a s h i n g t o n , D C — P r o v i n c e t o w n , M A 2 0 2 . 6 3 6 . 4 0 0 2 3 0 1 . 5 0 2 . 4 1 7 1 7 7 4 . 5 3 8 . 6 0 7 0 15
Logistics/General Industrial—the project’s 1.99 million sq. ft. of logistics and general industrial
uses are expected to cost almost $174.7 million in 2017 dollars (19% of total)
One-time Impacts: Construction The analysis estimates that Pineland Prairie will create a significant number of temporary (or “one-
time”) construction jobs generated by the project’s 11.9 million sq. ft. of total development. As
illustrated in Table 3, this includes:
o A total of 6,509 direct construction job years (i.e., the amount of labor needed for one year’s
work) over the entire construction period (which is unknown at this time), plus another 1,281
direct construction job years in architecture, engineering, design and other professional
services. Income from these jobs will be spent on a variety of goods and services, which will
support an additional 2,650 indirect and 2,008 induced job years in various industry sectors; and
Table 3: Economic Impacts of Construction
Labor Value Added OutputImpact Type Employment (1) Income (2) (Sales - Costs) (Total Sales)
Construction Hard CostsDirect Effect 6,509 $ 251,338,428 $ 423,142,450 $ 881,207,829 Indirect Effect 1,884 75,783,498 109,286,628 197,021,812 Induced Effect 1,466 52,945,522 93,673,993 167,535,385
Subtotal - Hard Costs: 9,858 380,067,448$ 626,103,071$ 1,245,765,026$
Construction Soft CostsDirect Effect 1,281 $ 92,145,697 $ 93,205,762 $ 193,459,036 Indirect Effect 767 28,921,028 37,332,362 69,229,192 Induced Effect 542 19,593,683 34,666,450 62,000,412
Subtotal - Soft Costs: 2,590 140,660,408$ 165,204,574$ 324,688,640$
Total Construction ImpactsDirect Effect 7,790 $ 343,484,125 $ 516,348,212 $ 1,074,666,865 Indirect Effect 2,650 104,704,526 146,618,990 266,251,004 Induced Effect 2,008 72,539,205 128,340,443 229,535,797
TOTAL: 12,448 520,727,856$ 791,307,645$ 1,570,453,666$
(1) Direct effect employment estimated by IMPLAN based on total sales. Employment, labor income and sales are provided for the entire construction period. To understand annual impacts, these estimates must be divided by the total number of years of construction.(2) Labor Income includes both employee compensation and proprietor income.
Source: IMPLAN; Jon Stover & Associates, Inc.; WTL+a, revised October 2017.

WTL+a
WTL +a R e a l E s t a t e & E c o n o m i c A d v i s o r s W a s h i n g t o n , D C — P r o v i n c e t o w n , M A 2 0 2 . 6 3 6 . 4 0 0 2 3 0 1 . 5 0 2 . 4 1 7 1 7 7 4 . 5 3 8 . 6 0 7 0 16
o In summary, the construction period will generate
o Over 12,400 total construction job years
o Approximately $791 million in “value-added” business revenues, and
o Over $520 million in total labor income.
Permanent Impacts: Ongoing Operations Once development of Pineland Prairie is complete, there will be significant annual impacts from
“ongoing operations” of the project. These impacts will be generated throughout Martin County and
beyond; however, we have examined only those impacts generated by ongoing operations on Martin
County itself. These impacts, which are illustrated in Table 4, are highlighted below:
o At buildout, the project will create a total of 4,245 direct jobs plus an additional 2,184 indirect
and over 3,760 induced jobs—for a total of almost 10,200 jobs in a stabilized year;
o Because of the project’s significant amount of logistics and general industrial uses, fully 74% of
the direct jobs (3,150 jobs) will be generated in these sectors, which may include warehousing,
distribution, logistics/freight movement, light assembly/device manufacturing, research and
development, etc.;
o At buildout and stabilized occupancies (i.e., generally considered to be 95% across all uses),
the project will generate over $424 million in annual labor income based on current annual
salaries among various industry sectors used by IMPLAN in the analysis;
o The project could be expected to create almost $629 million in annual (net) business revenues (i.e., gross sales less costs)—irrespective of location—generated by direct, indirect
and induced economic activity. Fully $272 million of that amount could be generated in direct
(i.e., on-site) annual net business revenues at buildout; and
o In summary, the IMPLAN economic impact model estimates that Pineland Prairie will generate over $1.22 billion in annual economic output because of direct, indirect and
induced economic activity in ongoing operations when buildout is complete and stabilized
occupancies are achieved.

WTL+a
WTL +a R e a l E s t a t e & E c o n o m i c A d v i s o r s W a s h i n g t o n , D C — P r o v i n c e t o w n , M A 2 0 2 . 6 3 6 . 4 0 0 2 3 0 1 . 5 0 2 . 4 1 7 1 7 7 4 . 5 3 8 . 6 0 7 0 17
Table 4: Annual Impacts at Buildout/Stabilized Year—Ongoing Operations
Labor Value Added OutputImpact Type Employment (1) Income (2) (Sales - Costs) (Total Sales)
Residential (Revised Program)Direct Effect - -$ -$ -$ Indirect Effect - - - - Induced Effect 2,475 89,794,518 159,259,798 284,833,950
Total - Residential: 2,475 89,794,518$ 159,259,798$ 284,833,950$
RetailDirect Effect 359 9,911,015$ 13,782,929$ 22,322,187$ Indirect Effect 44 1,348,324 2,428,279 4,749,666 Induced Effect 51 1,827,440 3,232,088 5,781,889
Total - Retail: 453 13,086,779$ 19,443,296$ 32,853,742$
OfficeDirect Effect 735 36,709,276$ 41,621,457$ 80,628,678$ Indirect Effect 277 9,452,314 13,749,434 25,993,004 Induced Effect 205 7,416,247 13,133,290 23,474,522
Total - Office: 1,217 53,577,837$ 68,504,181$ 130,096,204$
Logistics/General IndustrialDirect Effect 3,151 168,737,314$ 217,034,467$ 470,169,731$ Indirect Effect 1,864 62,011,846 98,552,610 188,522,098 Induced Effect 1,036 37,416,057 66,183,394 118,386,425
Total - Logistics/General Ind'l: 6,051 268,165,217$ 381,770,471$ 777,078,254$
TOTALDirect Effect 4,245 215,357,605$ 272,438,853$ 573,120,596$ Indirect Effect 2,184 72,812,484 114,730,323 219,264,768 Induced Effect 3,767 136,454,262 241,808,570 432,476,786
Total - Stabilized Annual Impacts: 10,196 424,624,351$ 628,977,746$ 1,224,862,150$
(1) Direct effect employment provided through IMPLAN based on anticipated business-related revenues in various sectors.(2) Labor Income includes both employee compensation and proprietor income.
Source: IMPLAN; Jon Stover & Associates, Inc.; WTL+a, revised October 2017.

WTL+a
WTL +a R e a l E s t a t e & E c o n o m i c A d v i s o r s W a s h i n g t o n , D C — P r o v i n c e t o w n , M A 2 0 2 . 6 3 6 . 4 0 0 2 3 0 1 . 5 0 2 . 4 1 7 1 7 7 4 . 5 3 8 . 6 0 7 0 18
Annual Tax Revenues: Ongoing Operations Once development of Pineland Prairie is complete, there will be significant annual revenues accruing to
Martin County (as well as other taxing entities) in the form of net new property taxes created by new
housing, supporting retail and workplace uses.
For purposes of this analysis, WTL+a has estimated only those property tax revenues accruing to the Martin County General Fund based on the preliminary 2017 millage rate of $9.5622 per $1,000 of
assessed value. Other taxing entities, such as the Martin County School Board (Local and State),
Children Services, South Florida Water Management District, Florida Inland Navigation District (FIND)
and District 5 MSTU have not been estimated at this time. Key results are summarized below and
illustrated in Table 5:
The project’s residential uses (4,200 units at buildout) are expected to command the largest share
of new General Fund revenues—approximately $10.2 million per year based on estimated
assessed values of $1.068 billion at buildout;
The project’s workplace (office) and supporting retail uses, with an estimated assessed value of
$38.5 million at buildout, could be expected to generate approximately $367,700 per year in annual
ad valorem; and
Due to the low assessed values (despite a sizable gross building area of more than 1.99 million sq.
ft.), the project’s logistics/general industrial uses will generate annual ad valorem of less than
$200,000 per year based on estimated assessed values of $19.8 million. However, this is a
preliminary estimate that does not consider the types of logistics users that could be located at
Pineland Prairie. High-value logistics users (such as an Amazon Logistics/Freight facility) typically
command much higher values due to fixtures/equipment necessary for operations.
In summary, Pineland Prairie’s 11.9 million sq. ft. of proposed land uses are expected to create over
$1.12 billion in gross assessed value at buildout (in current/2017 dollars). At current General Fund
mil rates, this has the potential to generate over $10.7 million in annual property tax revenues for
Martin County at buildout.

WTL+a
WTL +a R e a l E s t a t e & E c o n o m i c A d v i s o r s W a s h i n g t o n , D C — P r o v i n c e t o w n , M A 2 0 2 . 6 3 6 . 4 0 0 2 3 0 1 . 5 0 2 . 4 1 7 1 7 7 4 . 5 3 8 . 6 0 7 0 19
Table 5: Annual Property Tax Revenues at Buildout—Martin County (General Operations Only)
Gross District 5 TotalHousing Avg. Unit Gross Bldg. Assessed Assessed Total Gen'l Operations Annual
Units Size (SF) Area (SF) Value/SF (1) Value/Unit Assessed Value Millage Rate (2) Property TaxResidential (Revised Program)Large Mixed-Use 160 1,167 186,720 139.04$ 162,260$ 25,961,549$ 9.5622$ 248,250$ Medium Mixed-Use 183 1,167 213,561 139.04 162,260 29,693,521 9.5622 283,935 Small-Mixed Use 56 1,167 65,352 139.04 162,260 9,086,542 9.5622 86,887 Apartment House 674 688 463,712 139.00 95,632 64,455,968 9.5622 616,341 Mansion Apartment 206 1,172 241,432 139.00 162,908 33,559,048 9.5622 320,898 Rowhouse 900 2,188 1,969,200 99.33 217,334 195,600,636 9.5622 1,870,372 Duplex 62 2,925 181,350 106.88 312,624 19,382,688 9.5622 185,341 Small Lot House (Cottage) 896 1,625 1,456,000 89.95 146,169 130,967,200 9.5622 1,252,335 House 674 3,413 2,300,362 103.07 351,778 237,098,311 9.5622 2,267,181 Large House 252 6,075 1,530,900 118.96 722,682 182,115,864 9.5622 1,741,428 Estate House 123 7,988 982,524 135.42 1,081,735 133,053,400 9.5622 1,272,283 House Compound 14 3,125 43,750 162.31 507,219 7,101,063 9.5622 67,902 Total - Residential: 4,200 2,464 9,634,863 1,068,075,790$ 9.5622$ 10,213,154$
WorkplaceCommercial Retail 154,270 134.96$ 20,820,194$ 9.5622$ 199,087$ Office 139,490 126.42 17,634,326 9.5622 168,623 Total - Workplace: 293,760 38,454,520$ 367,710$
Logistics/General IndustrialWarehouse/Distribution 1,497,180 10.00$ 14,971,800$ 9.5622$ 143,163$ Flex/Tech Industrial 499,060 9.68 4,830,901 9.5622 46,194 Total - Industrial: 1,996,240 19,802,701$ 189,357$
TOTAL ANNUAL IMPACTS: 11,924,863 1,126,333,011$ 10,770,222$
(1) Assessed property values (per SF) are based on generally comparable or proximate building types in Martin County.(2) The preliminary 2017 millage rate in District 5 is $9.5622 per $1,000 of taxable value, and includes only the Martin County-General Operations rate as provided by the Martin County Property Appraiser-Property Tax Estimator. It excludes other taxing entities, such as Martin County School Board; FIND; South Florida Water Management District; Children Services; MSTU, etc.
https://www.pa.martin.fl.us/learn-more/tax-roll/millage-codes/216-2017-preliminary-millage-rates
Source: IMPLAN; Martin County Property Appraiser; WTL +a, revised October 2017.
Estimates (2017 Dollars)

WTL+a
WTL +a R e a l E s t a t e & E c o n o m i c A d v i s o r s W a s h i n g t o n , D C — P r o v i n c e t o w n , M A 2 0 2 . 6 3 6 . 4 0 0 2 3 0 1 . 5 0 2 . 4 1 7 1 7 7 4 . 5 3 8 . 6 0 7 0 20
4 Market Considerations
As detailed above, the primary objective of this study is to estimate the potential economic impacts
generated by construction and ongoing operations at buildout of Pineland Prairie. As project planning
moves forward, more detailed feasibility studies will be required. These include two critical initiatives:
Market Analysis—designed to measure supportable market potentials of each land use to inform
phasing, development strategies, rents and sales prices, land disposition, etc., and
Financial Feasibility—which will evaluate the project’s overall economic viability, inform
investment decisions, rates of return, investment partnerships, third-party financing, land disposition
strategies, etc.
As an additional task outside of our core scope of services, WTL+a prepared a demographic and
economic profile and examined real estate market conditions to inform preliminary market-supportable
opportunities for the land uses envisioned at Pineland Prairie. This section of our report summarizes
these findings, and focuses on market potentials for market-rate housing, general industrial and
professional office uses. Supporting data are contained in the Appendix Tables 10 through 20.
Martin County Housing Potentials (2016—2040) The preliminary demand analysis measures market potentials for new housing countywide for a
planning horizon between 2016 and 2040. The primary objective of this analysis is to understand the
capture (or penetration) rate that the 4,200 proposed housing units at Pineland Prairie would require of
all future housing demand in Martin County through 2040. Two growth scenarios have been evaluated.
WTL+a notes that Martin County’s Comprehensive Growth Management Plan requires the County to
produce a residential capacity assessment every two years (the Residential Capacity & Vacant Land
Analysis, August 2013). This report defines available residential development options that can
accommodate demand from future population growth. For this analysis, WTL+a utilized key inputs from
that report (such as vacant housing units less seasonal units) and netted out population in the four
incorporated municipalities (Jupiter Island, Ocean Breeze Park, Sewell’s Point and Stuart) for a relevant

WTL+a
WTL +a R e a l E s t a t e & E c o n o m i c A d v i s o r s W a s h i n g t o n , D C — P r o v i n c e t o w n , M A 2 0 2 . 6 3 6 . 4 0 0 2 3 0 1 . 5 0 2 . 4 1 7 1 7 7 4 . 5 3 8 . 6 0 7 0 21
comparison to understand housing demand opportunities in unincorporated parts of Martin County.
This ensures consistency with County policies. These two scenarios include:
Countywide Scenario #1—Utilizes an annual (“straight-line”) growth rate of 1.2% per year consistent with actual population growth rates in Martin County between 2000 and 2015
Countywide Scenario #2—Utilizes an annual countywide growth rate of 0.90% per year based on
five-year (2016—2021) population growth forecasts prepared by ESRI Business Analyst, and
extrapolated through 2040
Scenario #1 This methodology is illustrated in Table 6 and explained below:
The population of Martin County increased by 26,700 new residents in 11,500+ new households
over the past 15 years (see Appendix Table 10). If the County’s pace of growth continues at this
historic rate (1.20% per year), it would yield an additional 50,960 new residents and 22,600+ new housing units countywide (if average household size of 2.25 remains unchanged). Notably, this
growth rate would yield a 2040 population of almost 204,400 residents, which falls above the
Moderate Growth forecast prepared by the University of Florida/BEBR (179,800) but below its High
Growth forecast (214,000);
If the four incorporated municipalities’ share of the County’s total population remains at 13% in
2040, netting out future growth attributable to these cities results in 44,300 new residents and 19,700 new housing units, or 177,700 total residents in unincorporated parts of Martin County by
2040;
According to the County’s 2013 study, there were 5,228 “truly vacant” housing units in Martin
County (as of the 2010 Census). Truly vacant is defined as all vacant units less seasonal units.
The analysis assumes that fully 50% of these existing vacant units are habitable and available for
occupancy (i.e., from a financing perspective, financing new housing construction is more attainable
at lower vacancy rates). This leaves roughly 2,600 existing units available to accommodate part of
the demand generated by future growth;
According to the County’s Active Residential Development Inventory (ARDI) report from March
2016, there are approximately 4,672 approved but unbuilt units across Martin County. To ensure
that the analysis is consistent for the unincorporated County, we netted out unbuilt units in Stuart

WTL+a
WTL +a R e a l E s t a t e & E c o n o m i c A d v i s o r s W a s h i n g t o n , D C — P r o v i n c e t o w n , M A 2 0 2 . 6 3 6 . 4 0 0 2 3 0 1 . 5 0 2 . 4 1 7 1 7 7 4 . 5 3 8 . 6 0 7 0 22
(19) and Indiantown (2,003 units) (to reflect Indiantown’s Urban Service District/future
incorporation);
Scenario #1 yields net new housing demand of more than 14,400 units by 2040—or roughly 600
units per year (notably, this is below historic annual housing starts in Martin County, which
averaged 741 units per year in the 15-year period between 2002 and 2016; see Appendix Table
14);
Therefore, in Scenario #1 the 4,200 housing units proposed for Pineland Prairie would necessitate a project capture of approximately 29% of all future housing demand in
unincorporated Martin County between now and 2040. That is, over 70% of all future demand for
new housing in unincorporated Martin County generated by new population growth could be
accommodated in other projects elsewhere in the County.
Scenario #1:
29% = Pineland Prairie’s Capture of Future County Housing Demand
Scenario #2 A similar methodology was applied in a second scenario, as illustrated in Table 7. However, in this
scenario, a more conservative growth rate was applied, utilizing the 2016—2021 growth forecast
prepared by ESRI Business Analyst (a national demographic data and forecasting service). ESRI
estimates that Martin County will grow at a compound annual rate of 0.90% per year over the next five
years. This annual rate was extrapolated through 2040, and suggests:
After netting out a 13% factor for the four incorporated municipalities, this rate of growth will yield
over 29,900 new residents in 13,300+ new housing units in the unincorporated areas, for a 2040
population of more than 163,300 residents;
Scenario #2 also assumes that fully 50% of the 5,228 vacant units are habitable and available for
occupancy, leaving roughly 2,600 existing units available to accommodate demand generated by
future growth. We also netted out approved, unbuilt units from the ARDI list as noted above;

WTL+a
WTL +a R e a l E s t a t e & E c o n o m i c A d v i s o r s W a s h i n g t o n , D C — P r o v i n c e t o w n , M A 2 0 2 . 6 3 6 . 4 0 0 2 3 0 1 . 5 0 2 . 4 1 7 1 7 7 4 . 5 3 8 . 6 0 7 0 23
Table 6: Scenario #1 Housing Demand Potentials—Martin County, 2016—2040
As such, Scenario #2 yields net new housing demand for 11,000 units by 2040, or roughly 460
units per year, and would necessitate a higher project capture—in the range of 38%—of all future housing demand in unincorporated Martin County through 2040.
Scenario #2:
38% = Pineland Prairie’s Capture of Future County Housing Demand
Average 2040Population Household Housing
2016 2040 Change Size (2) UnitsScenario #1Martin County Annual Growth Rate (2000-2015) 1.20%Countywide Growth Forecast: 153,430 204,386 50,956 2.25 22,647 Less Incorporated Municipalities 20,061 26,724 % Share of County 13%Unincorporated County Growth Forecast: 133,369 177,663 44,294 2.25 19,686
Allocation to True Vacant Units2010 Vacant Units (Less Seasonal) 5,228 Assumed Habitable & Available for Occupancy @ 50%Net Available/Vacant Units: 2,614
Allocation to Active Unbuilt Units (Approved Residential Development Inventory/ARDI 03/16) (3) 2,650
Scenario #1 Demand: 14,422
Per Year (2016-2040) 601
REQUIRED PROJECT CAPTURE - 4,200 Units: 29%
(1) Scenario #1 assumes that Martin County continues to grow at the same pace between 2016 and 2040 as it did between 2000 and 2015 (also known as a "straight-line" forecast).(2) In order to convert 2040 population into housing units, the analysis assumes that average household size remains the same as it was in 2016 (2.25 persons per household).(3) Based on Active Residential Development Inventory/ARDI data provided by Martin County (4,672 units) less unbuilt units in in- corporated areas of the County (Stuart = 19 units; Indiantown/future incorporation = 2,003 units).(4) Scenario #2 utilizes the 2016-2021 population growth forecasts prepared by ESRI Business Analyst and applies them through 2040. It also assumes no change in average household size.
Source: University of Florida Bureau of Business & Economic Research; ESRI Business Analyst; WTL+a, revised October 2017.
Forecasts (1)

WTL+a
WTL +a R e a l E s t a t e & E c o n o m i c A d v i s o r s W a s h i n g t o n , D C — P r o v i n c e t o w n , M A 2 0 2 . 6 3 6 . 4 0 0 2 3 0 1 . 5 0 2 . 4 1 7 1 7 7 4 . 5 3 8 . 6 0 7 0 24
Table 7: Scenario #2 Housing Demand Potentials—Martin County, 2016—2040
Workforce Region #20 Office Potentials (2016—2024) As noted in the Introduction to this report, a key objective in the development of Pineland Prairie is the
provision of a fully walkable, mixed-use community that provides open space and recreation, new
housing and job opportunities to enhance the County’s economic development potentials. To that end,
WTL+a examined preliminary market potentials for “workplace” uses that include professional office
and business services, and logistics and general industrial uses. As more specific project planning
moves forward, more detailed market and financial feasibility studies will be required. This analysis is
presented below.
Average 2040Population Household Housing
2016 2040 Change Size (2) UnitsScenario #2ESRI Forecasts (2016-2021) Thru 2040 0.90% (4)Countywide Growth Forecast: 153,430 190,041 36,611 2.25 16,271 Less Incorporated Municipalities 20,061 26,724 % Share of County 13%Unincorporated County Growth Forecast: 133,369 163,317 29,948 2.25 13,310
Allocation to True Vacant Units2010 Vacant Units (Less Seasonal) 5,228 Assumed Habitable & Available for Occupancy @ 50%Net Available/Vacant Units: 2,614
Allocation to Active Unbuilt Units (Approved Residential Development Inventory/ARDI 03/16) (3) 2,650
Scenario #2 Demand: 11,007
Per Year (2016-2040) 459
REQUIRED PROJECT CAPTURE - 4,200 Units: 38%
(1) Scenario #1 assumes that Martin County continues to grow at the same pace between 2016 and 2040 as it did between 2000 and 2015 (also known as a "straight-line" forecast).(2) In order to convert 2040 population into housing units, the analysis assumes that average household size remains the same as it was in 2016 (2.25 persons per household).(3) Based on Active Residential Development Inventory/ARDI data provided by Martin County (4,672 units) less unbuilt units in in- corporated areas of the County (Stuart = 19 units; Indiantown/future incorporation = 2,003 units).(4) Scenario #2 utilizes the 2016-2021 population growth forecasts prepared by ESRI Business Analyst and applies them through 2040. It also assumes no change in average household size.
Source: University of Florida Bureau of Business & Economic Research; ESRI Business Analyst; WTL+a, revised October 2017.
Forecasts (1)
WTL+a
WTL +a R e a l E s t a t e & E c o n o m i c A d v i s o r s W a s h i n g t o n , D C — P r o v i n c e t o w n , M A 2 0 2 . 6 3 6 . 4 0 0 2 3 0 1 . 5 0 2 . 4 1 7 1 7 7 4 . 5 3 8 . 6 0 7 0 25
The first step in measuring support for new office space at Pineland Prairie examines market potentials
for office use in Martin County and allocates demand to the project. The analysis translates
employment forecasts (for 2016—2024) among specific industry sectors (for purposes of analysis, the
Florida Department of Economic Opportunity/DEO combines both Martin and St. Lucie Counties into
one area known as “Workforce Region #20”). DEO forecasts that more than 25,100 new jobs will be created in Workforce Region #20 by 2024. The analysis estimates demand for office space by
applying an occupancy factor (of occupied space per employee), and estimates the proportion of
employees in each sector who are office workers (in a typical suburban economy this is in the range of
35%). We note that DEO employment forecasts are issued only in eight-year periods; therefore,
this analysis is illustrated only through 2024.
DEO Forecasts: 25,100 New Jobs
in Martin & St. Lucie Counties, 2016—2024
The analysis also considers demand generated by other market factors, such as vacancy adjustments,
part-time/self-employed individuals (who may or may not occupy multi-tenant office space), and
cumulative replacement; these estimates either increase or reduce future demand for office space.
Cumulative replacement, for example, considers tenants that move when a building is removed from
the inventory due to physical and/or functional obsolescence. The office analysis is illustrated in Table
8, and summarized below:
Allocation to Martin County The analysis indicates gross demand for more than 1.8 million sq. ft. of office space across
Workforce Region #20 (both counties) between 2016 and 2024, generated by growth in office-using
jobs and inclusive of adjustments related to vacancy, cumulative (building) replacements, tenant
churn, etc.;
As employment forecasts are prepared only for the combined two counties, the next step is to
allocate growth to Martin County. As illustrated in Appendix Table 12, in 2016 Martin County comprised a 40.3% share of all jobs in Workforce Region #20. The analysis assumes that the
County’s 40.3% share will remain level through 2024. If so, this translates into demand for
approximately 755,800 sq. ft. of gross demand for office space generated by new jobs in office-
using sectors by 2024; and

WTL+a
WTL +a R e a l E s t a t e & E c o n o m i c A d v i s o r s W a s h i n g t o n , D C — P r o v i n c e t o w n , M A 2 0 2 . 6 3 6 . 4 0 0 2 3 0 1 . 5 0 2 . 4 1 7 1 7 7 4 . 5 3 8 . 6 0 7 0 26
Table 8: Office Market Potentials, 2016—2024
SF 2024New Jobs % Office- Occupancy Demand
Industry Sector 2016-2024 Using Factor (In SF)Workforce Region #20Agriculture & Mining (270) 10% 175 (4,725) Construction 2,232 20% 175 78,120 Manufacturing
Durable Goods 605 20% 200 24,200 Non-Durable Goods (88) 20% 200 (3,520)
Transportation & WarehousingTransportation 199 40% 200 15,920 Warehousing & Storage 109 40% 200 8,720
Wholesale & Retail TradeWholesale Trade 495 20% 175 17,325 Retail Trade 3,609 20% 175 126,315
Information & Finance/Real EstateInformation (64) 85% 200 (10,880) Finance & Insurance 181 95% 275 47,286 Real Estate Rental & Leasing 302 85% 225 57,758
ServicesProfessional, Scientific & Technical Services 1,598 90% 250 359,550 Management of Companies & Enterprises 83 60% 250 12,450 Administrative & Waste Management 1,686 35% 175 103,268 Educational Services 422 20% 225 18,990 Health Care & Social Assistance 6,038 35% 200 422,660 Arts, Entertainment & Recreation 571 20% 175 19,985 Accommodation & Food Services 3,014 20% 175 105,490 Other Services (Except Government) 690 35% 225 54,338
Government 2,025 60% 150 182,250 Self-Employed 1,619 10% 200 32,380 Data Reconciliation (Additional Jobs) 78 0% - - Total/Weighted Average: 25,134 34% 189 1,667,879
+ Vacancy Adjustment @ 5% (1) 83,400 + Cumulative Replacement Demand 7.5% (2) 125,100
2024 Gross Demand - Workforce Region #20 (Rounded): 1,876,400
Martin CountyAllocation to Martin County @ 40.3%Gross Demand - Martin County (2024): 755,848
Existing Vacant Office Space (Table 7) 249,401 - Lease-up Required @ 50% (124,700) (124,700)
Remaining Vacant Space: 124,701 % Vacant 3.2%
Net Demand - Martin County (2024): 631,100 Supportable Annual (In SF): 78,900 Average Annual Absorption-Past 5 Years (Table 7) 46,009
Pineland PrairiePotential Project Capture @ 15%
SUPPORTABLE OFFICE SPACE (2024): 94,665
(1)
(2)
(3)leased before financing of new construction is viable. The analysis assumes that 50% of existing vacant office
Source: Florida Dept. of Economic Opportunity (DEO); CoStar, Inc.; WTL+a, May 2017.
space. This is assumed to represent 7.5% of total demand.From a financing perspective, some portion of existing vacant office space in Martin County will need to be
space is leased, thereby reducing the overall countywide office vacancy rate to approximately 3% (i.e., stabilized).
This allows for a 5% "frictional" vacancy rate in new office space delivered to the market (i.e., this accounts fortenant movement to new space).This represents new space required by existing businesses to replace obsolete or otherwise unusable office

WTL+a
WTL +a R e a l E s t a t e & E c o n o m i c A d v i s o r s W a s h i n g t o n , D C — P r o v i n c e t o w n , M A 2 0 2 . 6 3 6 . 4 0 0 2 3 0 1 . 5 0 2 . 4 1 7 1 7 7 4 . 5 3 8 . 6 0 7 0 27
From a financing perspective, however, some portion of Martin County’s existing 249,400 sq. ft. of
vacant office space would need to be leased before new office space could be financed. It is also
not known how much of the remaining existing vacant inventory suffers from physical and/or
functional obsolescence, will be converted to other uses such as residential, or could be
demolished. For purposes of this analysis, WTL+a conservatively assumes that fully 50% of Martin
County’s vacant office inventory (or 124,200 sq. ft.) is available to accommodate demand generated
by new job growth before financing is provided for new office construction. This serves to reduce
the County’s office vacancy rate (to roughly 3% from current levels, which is close to “stabilization”).
In conclusion, this analysis estimates demand for new office space in Martin County over the next eight
years—generated by job growth in office-using sectors (which can be partially accommodated in
existing vacant office space)—of approximately 631,000 sq. ft. of net new space by 2024. Martin
County’s office market is supported primarily by professional and business services firms (accounting,
legal, engineering, etc.) in small office buildings. In fact, the County’s 3.9 million sq. ft. of office space
is distributed across 445 buildings, suggesting an average building size of only 8,700 sq. ft. In the real
estate industry, these are known as “garden” office buildings.
WTL+a notes that 631,000 sq. ft. of net new demand would translate into roughly 78,900 sq. ft. of
annual demand. By comparison (and as illustrated in Appendix Table 17), Martin County averaged only 46,000 sq. ft. of net absorption of office space annually over the past five years, but less than 16,300 sq. ft. per year over the past 10 years (or roughly two “garden” office buildings annually).
Absorption trends are illustrative of the significant negative impacts on office demand created by the
2007—2009 national recession, and reiterates the critical importance of a countywide economic
development strategy design around business retention and recruitment that enhances growth in office-
using sectors, thereby strengthening demand for workplace uses such as office buildings.
If Pineland Prairie succeeds in capturing an estimated 15% or so of this net new demand suggests
support for approximately 95,000 to 100,000 sq. ft. of multi-tenant/speculative office space as part of
the project’s workplace uses by 2024.
15% Capture at Pineland Prairie =
95,000 to 100,000 SF of New Office Space by 2024

WTL+a
WTL +a R e a l E s t a t e & E c o n o m i c A d v i s o r s W a s h i n g t o n , D C — P r o v i n c e t o w n , M A 2 0 2 . 6 3 6 . 4 0 0 2 3 0 1 . 5 0 2 . 4 1 7 1 7 7 4 . 5 3 8 . 6 0 7 0 28
Workforce Region #20 Industrial Potentials (2016—2024) A similar analysis was prepared for general industrial space, which estimates demand for industrial
space by applying an occupancy factor (of occupied space per employee), and estimates the proportion
of employees in each sector who are industrial workers (in a typical suburban economy this is in the
range of 20%).
For purposes of this analysis, general industrial uses may encompass a variety of business/industry
sectors, ranging from warehousing and distribution to light assembly/manufacturing to “logistics”
functions. In Florida, logistics is a state-designated term for a critical concentration of freight and
logistics facilities in certain parts of the state. Logistics involves a wide range of activities related to the
transformation and distribution of goods—from movement of raw materials to final distribution of
products to the marketplace. As trade has expanded from local and regional to global shipping
networks, the industries of freight handling and management, the information systems that support
them and the design and operational approaches to streamlined product flows have emerged as a
major industry in the United States. Because sales and trade increase as the U.S. economy continues
to recover from the 2007—2009 recession, the logistics and freight industry is a major contributor to the
country’s Gross Domestic Product (GDP). According to the Council of Supply Chain Management
Professionals (CSCMP), U.S. Business Logistics rose to $1.45 trillion in 2014, a 3.1% increase over
2013. However, because the general economy also expanded, the growth rate for logistics as a
proportion of GDP remained steady, with only a slight decline—from 8.4% in 2013 to 8.3% in 2014.
Logistics refers to the set of operations required for goods to be made available to markets or to
specific locations. In the broadest sense, this incorporates a variety of transportation methods
(waterways and oceans, trains, trucks and other vehicles and air cargo) as well as the efficiencies in
moving, holding and transferring and delivering products across the country and throughout the world.
In Florida, the I-4 corridor encompasses a significant logistics cluster, benefitting from the availability of
reasonably-priced land adjacent to the I-4 corridor; a ready and qualified labor force; and the ‘cluster
effect’ of concentrating logistics and freight venues in an area extending from industrial and
warehouse/distribution parks in Tampa with newer facilities in Plant City, Lakeland and the new
Intermodal Center in Winter Haven. As requirements for increased efficiency and accessibility have
become critical elements to competition, these characteristics have fostered development of a major
new industry for the region, generating new jobs as well as investment in logistics and
warehouse/distribution buildings along rail and road networks. Moreover, growth of Internet-based
retail has created an enormous appetite for large-scaled distribution centers along I-4 for companies

WTL+a
WTL +a R e a l E s t a t e & E c o n o m i c A d v i s o r s W a s h i n g t o n , D C — P r o v i n c e t o w n , M A 2 0 2 . 6 3 6 . 4 0 0 2 3 0 1 . 5 0 2 . 4 1 7 1 7 7 4 . 5 3 8 . 6 0 7 0 29
such as Amazon and Rooms-to-Go, among others. In Martin County, the presence of significant
amounts of vacant land in the western portion of the county as well as I-95 and Florida’s Turnpike
providing excellent regional access suggest that a strategy focused on business retention and
recruitment of logistics-oriented functions would generate significant new job growth.
Another function among general industrial uses includes “flex-tech”. Flex space is typically defined to
include a combination of front-end office/administrative functions with back-end warehousing, freight
movement, logistics uses.
Allocation to Martin County As the occupancy factor for general industrial employees is typically larger (500 sq. ft. to as much
as 1,000 sq. ft. per employee depending on function), we have illustrated a low (518 sq. ft.) and
high (760 sq. ft.) range. Employment forecasts suggest gross demand ranging from 3.6 to 5.2
million sq. ft. across Workforce Region #20 (both counties) between 2016 and 2024, generated by
growth in industrial-using jobs and inclusive of adjustments related to vacancy, cumulative (building)
replacements, tenant movement, etc.;
If Martin County successfully maintains its current 40.3% share of regional employment through
2024 suggests demand ranging from 1.47 to 2.1 million sq. ft. of gross demand for industrial space generated by new jobs in industrial-using sectors; and
Martin County’s industrial market has strengthened significantly over the past 10 years. As
illustrated in Appendix Table 18, annual net absorption has averaged almost 90,000 sq. ft. per year
over each of the past five years (and 72,800 sq. ft. annually over the past 10 years). In fact, the
County’s industrial market has achieved stabilization (i.e., vacancies of 5% or less). Nonetheless,
WTL+a conservatively assumes that 25% of Martin County’s remaining vacant industrial inventory
(or 35,000 sq. ft.) is available to accommodate demand generated by new job growth before
financing is provided for new construction. This serves to reduce the County’s industrial vacancy
rate to less than 2% from current levels.
In conclusion, this analysis estimates demand for new industrial space in Martin County over the next
eight years—generated by job growth in specific sectors (which can be partially accommodated in
existing vacant industrial space)—ranging from 1.4 to 2.0 million sq. ft. of net new space by 2024.

WTL+a
WTL +a R e a l E s t a t e & E c o n o m i c A d v i s o r s W a s h i n g t o n , D C — P r o v i n c e t o w n , M A 2 0 2 . 6 3 6 . 4 0 0 2 3 0 1 . 5 0 2 . 4 1 7 1 7 7 4 . 5 3 8 . 6 0 7 0 30
Table 9: General Industrial Market Potentials, 2016—2024
New Jobs % Industrial-Industry Sector 2016-2024 Using Low High Low High
Workforce Region #20Agriculture & Mining (270) 20% 600 850 (32,400) (45,900) Construction 2,232 35% 1,000 1,250 781,200 976,500 Manufacturing
Durable Goods 605 95% 850 1,200 488,538 689,700 Non-Durable Goods (88) 95% 850 1,200 (71,060) (100,320)
Transportation & WarehousingTransportation 199 50% 850 1,200 84,575 119,400 Warehousing & Storage 109 95% 850 1,200 88,018 124,260
Wholesale & Retail TradeWholesale Trade 495 90% 850 1,200 378,675 534,600 Retail Trade 3,609 30% 600 1,000 649,620 1,082,700
Information & Finance/Real EstateInformation (64) 10% 850 1,000 (5,440) (6,400) Finance & Insurance 181 10% 150 300 2,715 5,430 Real Estate Rental & Leasing 302 10% 500 750 15,100 22,650
ServicesProfessional, Scientific & Technical Services 1,598 10% 250 400 39,950 63,920 Management of Companies & Enterprises 83 20% 175 350 2,905 5,810 Administrative & Waste Management 1,686 25% 600 850 252,900 358,275 Educational Services 422 10% 750 1,200 31,650 50,640 Health Care & Social Assistance 6,038 5% 175 300 52,833 90,570 Arts, Entertainment & Recreation 571 10% 600 850 34,260 48,535 Accommodation & Food Services 3,014 15% 750 1,000 339,075 452,100 Other Services (Except Government) 690 20% 750 1,000 103,500 138,000
Government 2,025 10% 600 850 121,500 172,125 Self-Employed 1,619 10% 250 500 40,475 80,950 Data Reconciliation (Additional Jobs) 78 0% - - - - Total/Weighted Average: 25,134 20% 518 760 3,398,588 4,863,545
+ Vacancy Adjustment @ 2.5% (1) 85,000 121,600 + Cumulative Replacement Demand 5.0% (2) 169,900 243,200
2024 Gross Demand - Workforce Region #20 (Rounded): 3,653,500 5,228,300
Martin CountyAllocation to Martin County @ 40.3% 40.3%Gross Demand - Martin County (2024): 1,471,696 2,106,054
Existing Vacant Industrial Space (Table 7) 141,653 - Lease-up Required @ 25% (35,400) (3) (35,400) (35,400)
Remaining Vacant Space: 106,253 % Vacant 1.5%
Net Demand - Martin County (2024): 1,436,300 2,070,700
Pineland PrairiePotential Project Capture @ 20% 20%
SUPPORTABLE INDUSTRIAL SPACE (2024): 287,260 414,140
(1)
(2)
(3)cing of new construction is viable. The analysis assumes that 25% of existing vacant industrial space is leased, thereby reducing the
Source: Florida Dept. of Economic Opportunity (DEO); CoStar, Inc.; WTL +a, May 2017.
new space).This represents new space required by existing businesses to replace obsolete or otherwise unusable industrial space. This is assumedto represent 5% of total demand.From a financing perspective, some portion of existing vacant industrial space in Martin County will need to be leased before finan-
overall countywide industrial vacancy rate to only 1.5% (i.e., stabilized).
SF Occupancy Factor 2024 Demand (In SF)
This allows for a 2.5% "frictional" vacancy rate in new industrial space delivered to the market (i.e., this accounts for tenant movement to

WTL+a
WTL +a R e a l E s t a t e & E c o n o m i c A d v i s o r s W a s h i n g t o n , D C — P r o v i n c e t o w n , M A 2 0 2 . 6 3 6 . 4 0 0 2 3 0 1 . 5 0 2 . 4 1 7 1 7 7 4 . 5 3 8 . 6 0 7 0 31
If Pineland Prairie succeeds in capturing an estimated 20% or more of this net new demand suggests
support for approximately 275,000 to 425,000 sq. ft. of general industrial space as part of the project’s
workplace uses by 2024. In other words, fully 80% of demand for new general industrial space can be
accommodated elsewhere in Martin County.
20% Capture at Pineland Prairie =
275,000 to 425,000 SF of New Industrial Space by 2024
The Appendix that follows contains supporting data prepared as part of our demographic and economic
profile and analysis of real estate market conditions in Martin County.

WTL+a
WTL +a R e a l E s t a t e & E c o n o m i c A d v i s o r s W a s h i n g t o n , D C — P r o v i n c e t o w n , M A 2 0 2 . 6 3 6 . 4 0 0 2 3 0 1 . 5 0 2 . 4 1 7 1 7 7 4 . 5 3 8 . 6 0 7 0 32
Appendix

WTL+a
WTL +a R e a l E s t a t e & E c o n o m i c A d v i s o r s W a s h i n g t o n , D C — P r o v i n c e t o w n , M A 2 0 2 . 6 3 6 . 4 0 0 2 3 0 1 . 5 0 2 . 4 1 7 1 7 7 4 . 5 3 8 . 6 0 7 0 33
Table 10: Demographics Trends & Forecasts—Martin County, 2000—2021
2000 2010 2016 % Dist. 2021 % Dist. Amount CAGR %Demographic ProfilePopulation 126,731 146,318 153,430 160,425 6,995 0.90%Households 55,288 63,899 66,456 69,288 2,832 0.84%Avg. HH Size 2.23 2.23 2.25 2.26 Median Age 47.4 49.7 52.0 54.1 Race White 127,691 131,762 86% 135,734 85% 3,972 0.6% Black 7,842 8,712 6% 9,438 6% 726 1.6% American Indian 840 976 1% 1,091 1% 115 2.3% Asian, Pacific Islander 1,644 2,146 1% 2,682 2% 536 4.6% Other 5,968 6,970 5% 8,077 5% 1,107 3.0% Two or More Races 2,333 2,864 2% 3,403 2% 539 3.5%Total: 146,318 153,430 160,425 6,995 Hispanic (1) 17,881 20,965 14% 24,495 15% 3,530 3.2%
Age Distribution 0-14 20,848 20,259 13% 19,932 12% (327) -0.3% 15-24 14,227 14,551 9% 14,117 9% (434) -0.6% 25-34 12,436 13,900 9% 15,152 9% 1,252 1.7% 35-44 15,429 14,211 9% 14,462 9% 251 0.4% 45-54 22,181 20,499 13% 18,338 11% (2,161) -2.2% 55-64 21,225 24,192 16% 25,613 16% 1,421 1.1% 65-74 19,475 23,324 15% 27,395 17% 4,071 3.3% 75+ 20,497 22,494 15% 25,416 16% 2,922 2.5%
Average HH Income 84,422$ 93,575$ 2.1%Median HH Income 52,526$ 60,103$ 2.7%
Educational ProfileYears of Education (2015 American Community Survey/ACS) Less than 9th Grade 4.5% 9th-12th Grade, No Diploma 5.7% High School Graduate (Includes Equivalency) 26.1% Some College, No Degree 22.2% Associate Degree 9.9% Bachelor's Degree 19.8% Graduate/Professional Degree 11.9%
(1) Persons of Hispanic origin are a subset of other race categories; therefore, totals do not add.https://factfinder.census.gov/faces/tableservices/jsf/pages/productview.xhtml?src=CF
Source: ESRI Business Analyst; WTL +a, May 2017.
Change: 2016-2021

WTL+a
WTL +a R e a l E s t a t e & E c o n o m i c A d v i s o r s W a s h i n g t o n , D C — P r o v i n c e t o w n , M A 2 0 2 . 6 3 6 . 4 0 0 2 3 0 1 . 5 0 2 . 4 1 7 1 7 7 4 . 5 3 8 . 6 0 7 0 34
Table 11: Employment Trends—Martin & St. Lucie Counties, 1995—2016
Industry Sector 1995 2000 2005 Amount CAGR % 2007 2009 2011 2013 2015 2016 Amount CAGR %
Mining & Construction 8,100 10,200 15,700 7,600 6.8% 12,800 8,000 7,200 7,500 9,200 10,100 (2,700) -2.6%Manufacturing 5,400 5,900 6,900 1,500 2.5% 6,200 4,900 5,100 5,500 6,500 6,500 300 0.5%Transp/Communications/Utilities 3,700 3,200 4,300 600 1.5% 4,200 4,000 4,200 4,300 4,600 4,700 500 1.3%Trade Wholesale 2,800 3,200 6,400 3,600 8.6% 6,300 6,000 5,600 4,800 5,300 5,200 (1,100) -2.1% Retail 15,200 16,800 21,200 6,000 3.4% 21,100 18,400 19,300 20,200 21,500 22,200 1,100 0.6%Information 1,700 1,800 1,700 - 0.0% 1,700 1,400 1,600 1,400 1,300 1,300 (400) -2.9%Financial Activities 4,600 5,000 7,500 2,900 5.0% 6,800 5,600 5,400 5,400 5,400 5,500 (1,300) -2.3%Services Professional & Business 7,200 10,600 13,900 6,700 6.8% 14,200 12,400 13,800 15,200 16,400 17,900 3,700 2.6% Education/Health Services 12,700 15,400 17,600 4,900 3.3% 19,200 20,700 21,500 22,600 25,600 26,600 7,400 3.7% Leisure & Hospitality 10,500 12,000 13,700 3,200 2.7% 15,500 14,800 15,300 16,900 18,100 19,000 3,500 2.3% Other Services 4,700 5,700 6,900 2,200 3.9% 7,100 6,900 6,400 6,800 8,500 8,500 1,400 2.0%Government 13,900 16,300 18,500 4,600 2.9% 20,400 20,000 19,600 19,800 19,500 19,700 (700) -0.4%
Total (In 000s): 90,500 106,100 134,300 43,800 4.0% 135,500 123,100 125,000 130,400 141,900 147,200 11,700 0.9%
Change During Period: 15,600 28,200 1,200 (12,400) 1,900 5,400 11,500 5,300
(1) The Port St. Lucie MSA includes Martin and St. Lucie Counties.
http://floridajobs.org/labor-market-information/data-center/statistical-programs/current-employment-statistics
Source: Florida Department of Economic Opportunity (DEO); WTL +a, May 2017.
Change: 1995-2005 Change: 2007-201610 Years 10 Years

WTL+a
WTL +a R e a l E s t a t e & E c o n o m i c A d v i s o r s W a s h i n g t o n , D C — P r o v i n c e t o w n , M A 2 0 2 . 6 3 6 . 4 0 0 2 3 0 1 . 5 0 2 . 4 1 7 1 7 7 4 . 5 3 8 . 6 0 7 0 35
Table 12: Business Mix—Martin County, 2016
NAICS Category No. % of Total No. % of Total
Agriculture & Mining 261 2.9% 1,815 2.3%Construction 884 9.7% 4,865 6.2%Manufacturing 283 3.1% 4,068 5.2%Transportation & Warehousing 272 3.0% 2,426 3.1%Communications 74 0.8% 406 0.5%Utilities 21 0.2% 203 0.3%Wholesale & Retail Trade
Wholesale 277 2,536 Retail 1,886 19,716 - Home Improvement 174 1,717 - General Merchandise 45 1,712 - Food Stores 150 2,842 - Auto Dealers/Gas Stations 274 2,088 - Apparel & Accessory Stores 119 785 - Furniture/Home Furnishings 193 1,268 - Eating & Drinking Places 433 6,612 - Miscellaneous & Non-store Retail 498 2,692 Subtotal - All Retail: 2,163 23.7% 22,252 28.5%
Finance/Insurance/Real Estate 1,139 12.5% 6,117 7.8%Services
- Hotel/Lodging 47 840 - Automotive Services 239 940 - Motion Pictures & Amusements 279 2,971 - Health Services 561 10,503 - Legal Services 216 1,049 - Educational Institutions 103 3,425 - Other Services 2,021 11,303 Subtotal - Services: 3,466 37.9% 31,031 39.7%
Government 223 2.4% 4,908 6.3%Unclassified Establishments 349 3.8% 96 0.1%
TOTAL: 9,135 100.0% 78,187 100.0%
ANALYSIS:2016 Total Employment 78,187
As Share of Workforce Region #20 40.3%
2016 County Population 153,430
Jobs/Population Ratio 0.51
Source: ESRI Business Analyst; Dun & Bradstreet, Inc.; WTL +a, May 2017.
Businesses Employees

WTL+a
WTL +a R e a l E s t a t e & E c o n o m i c A d v i s o r s W a s h i n g t o n , D C — P r o v i n c e t o w n , M A 2 0 2 . 6 3 6 . 4 0 0 2 3 0 1 . 5 0 2 . 4 1 7 1 7 7 4 . 5 3 8 . 6 0 7 0 36
Table 13: DEO Employment Forecasts—Workforce Region #20, 2016—2024
Employment Category 2016 % Dist. 2024 % Dist. Total CAGR
Agriculture/Mining/ConstructionAgriculture 3,253 2,977 (276) -1.1%Mining 94 100 6 0.0%Construction 12,827 15,059 2,232 2.0%
Subtotal: 16,174 7.6% 18,136 7.7% 1,962 1.4%
Manufacturing Durable Goods Manufacturing 6,368 6,973 605 1.1% Non-Durable Goods Manufacturing 1,885 1,797 (88) -0.6%
Subtotal: 8,253 3.9% 8,770 3.7% 517 0.8%
Transportation & WarehousingTransportation 2,624 2,823 199 0.9%Warehousing & Storage 1,439 1,548 109 0.9%
Subtotal: 4,063 1.9% 4,371 1.8% 308 0.9%
Wholesale & Retail TradeWholesale Trade 6,071 6,566 495 1.0%Retail Trade 30,190 33,799 3,609 1.4%
Subtotal: 36,261 17.1% 40,365 17.0% 4,104 1.3%
Finance/Insurance/Real EstateInformation 1,851 1,787 (64) -0.4%Finance & Insurance 4,664 4,845 181 0.5%Real Estate, Rental & Leasing 3,220 3,522 302 1.1%
Subtotal: 9,735 4.6% 10,154 4.3% 419 0.5%
ServicesProfessional, Scientific & Technical Services 9,763 11,361 1,598 1.9%Management of Companies & Enterprises 492 575 83 2.0%Administrative & Waste Management 12,017 13,703 1,686 1.7%Educational Services 2,332 2,754 422 2.1%Health Care & Social Assistance 33,824 39,862 6,038 2.1%Arts, Entertainment & Recreation 5,022 5,593 571 1.4%Accommodation & Food Services 25,598 28,612 3,014 1.4%Other Services (Except Government) 7,798 8,488 690 1.1%
Subtotal: 96,846 45.7% 110,948 46.8% 14,102 1.7%
Government 23,349 11.0% 25,374 10.7% 2,025 1.0%
Self-Employed & Unpaid Family Workers 15,543 7.3% 17,162 7.2% 1,619 1.2%
Data Reconciliation (Additional Jobs) 1,586 0.7% 1,664 0.7% 78 0.6%
TOTAL:Workforce Region #20 211,810 100% 236,944 100% 25,134 1.4%
Annual Increase (Rounded): 3,100
Share of Jobs (If Martin Maintains its Current Share of MSA Employment):
Martin County @ 40.3% 10,100
Change: 2016-2024
Source: Florida Department of Economic Opportunity (DEO); WTL +a, May 2017.

WTL+a
WTL +a R e a l E s t a t e & E c o n o m i c A d v i s o r s W a s h i n g t o n , D C — P r o v i n c e t o w n , M A 2 0 2 . 6 3 6 . 4 0 0 2 3 0 1 . 5 0 2 . 4 1 7 1 7 7 4 . 5 3 8 . 6 0 7 0 37
Table 14: Annual Housing Starts—Martin County, 2002—2016 (15 Years)
Total Annual % ofMunicipality 2002 2003 2004 2005 2006 2007 2008 2009 2010 2011 2012 2013 2014 2015 2016 Starts Average Total
Single-family DetachedJupiter Island 10 10 12 5 15 15 11 2 6 5 3 10 11 5 12 132 9 1%Stuart 110 101 71 32 8 13 2 - 16 13 20 35 20 - 23 464 31 5%Unincorporated County 1,313 1,271 1,150 1,073 908 284 157 101 143 183 272 422 328 314 291 8,210 547 92%
Subtotal - SFD: 1,440 1,390 1,243 1,120 936 318 174 106 167 205 299 474 366 323 333 8,894 593 80%As % of Total 97% 69% 85% 56% 97% 87% 78% 88% 84% 92% 93% 98% 85% 78% 78%
Multi-familyJupiter Island - - - - - - - - - - - - - - - - - 0%Stuart - 502 38 519 8 - - - - - - 11 - - - 1,078 72 12%Unincorporated County 37 114 178 367 20 48 50 14 32 19 21 - 66 89 94 1,149 77 13%
Subtotal - MF: 37 616 216 886 28 48 50 14 32 19 21 11 66 89 94 2,227 148 20%As % of Total 3% 31% 15% 44% 3% 13% 22% 12% 16% 8% 7% 2% 15% 22% 22%
TOTAL - Martin County: 1,477 2,006 1,459 2,006 964 366 224 120 199 224 320 485 432 412 427 11,121 741 100%
http://socds.huduser.org/permits/
Source: U.S. Census Bureau; U.S. Dept. of Housing & Urban Development; WTL+a, May 2017.
15-Year Change: 2002-2016
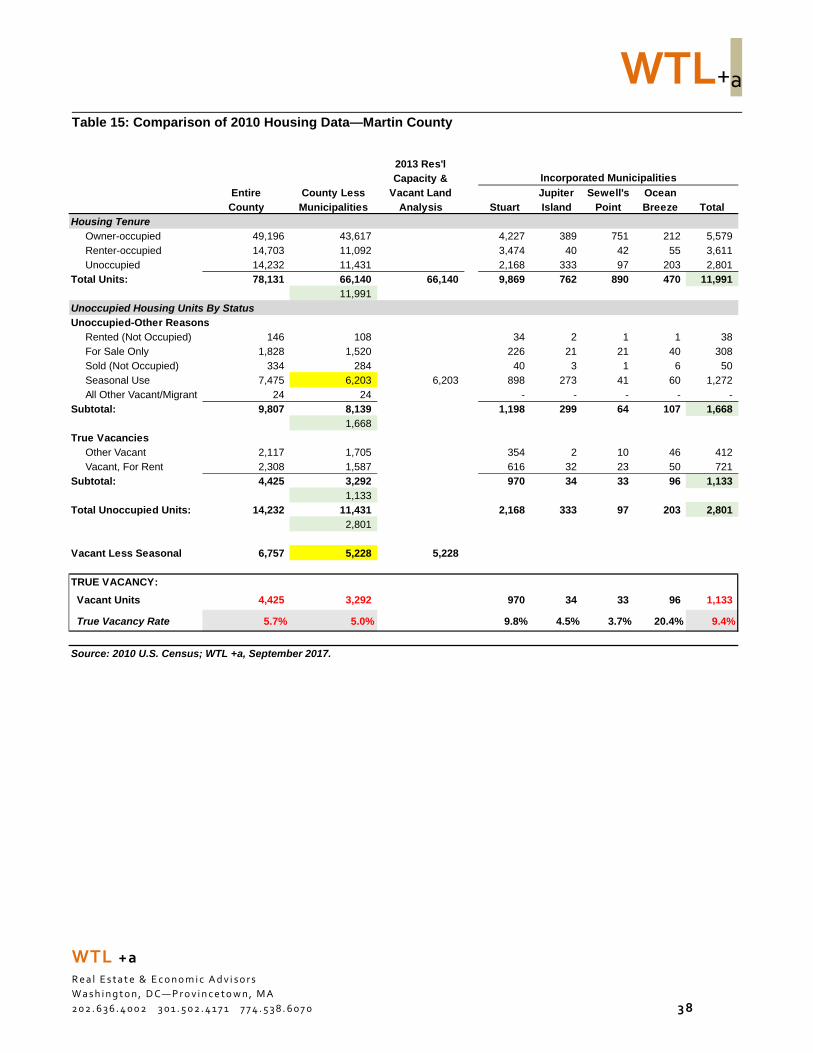
WTL+a
WTL +a R e a l E s t a t e & E c o n o m i c A d v i s o r s W a s h i n g t o n , D C — P r o v i n c e t o w n , M A 2 0 2 . 6 3 6 . 4 0 0 2 3 0 1 . 5 0 2 . 4 1 7 1 7 7 4 . 5 3 8 . 6 0 7 0 38
Table 15: Comparison of 2010 Housing Data—Martin County
2013 Res'lCapacity &
Entire County Less Vacant Land Jupiter Sewell's OceanCounty Municipalities Analysis Stuart Island Point Breeze Total
Housing TenureOwner-occupied 49,196 43,617 4,227 389 751 212 5,579 Renter-occupied 14,703 11,092 3,474 40 42 55 3,611 Unoccupied 14,232 11,431 2,168 333 97 203 2,801
Total Units: 78,131 66,140 66,140 9,869 762 890 470 11,991 11,991
Unoccupied Housing Units By StatusUnoccupied-Other Reasons
Rented (Not Occupied) 146 108 34 2 1 1 38 For Sale Only 1,828 1,520 226 21 21 40 308 Sold (Not Occupied) 334 284 40 3 1 6 50 Seasonal Use 7,475 6,203 6,203 898 273 41 60 1,272 All Other Vacant/Migrant 24 24 - - - - -
Subtotal: 9,807 8,139 1,198 299 64 107 1,668 1,668
True VacanciesOther Vacant 2,117 1,705 354 2 10 46 412 Vacant, For Rent 2,308 1,587 616 32 23 50 721
Subtotal: 4,425 3,292 970 34 33 96 1,133 1,133
Total Unoccupied Units: 14,232 11,431 2,168 333 97 203 2,801 2,801
Vacant Less Seasonal 6,757 5,228 5,228
TRUE VACANCY: Vacant Units 4,425 3,292 970 34 33 96 1,133
True Vacancy Rate 5.7% 5.0% 9.8% 4.5% 3.7% 20.4% 9.4%
Source: 2010 U.S. Census; WTL +a, September 2017.
Incorporated Municipalities

WTL+a
WTL +a R e a l E s t a t e & E c o n o m i c A d v i s o r s W a s h i n g t o n , D C — P r o v i n c e t o w n , M A 2 0 2 . 6 3 6 . 4 0 0 2 3 0 1 . 5 0 2 . 4 1 7 1 7 7 4 . 5 3 8 . 6 0 7 0 39
Table 16: Housing Profile—Martin County, 2010—2021
US Census ACS/ESRI ESRI2010 2016 % Dist. 2021 % Dist. No. CAGR %
Housing TenureOwner-occupied 49,196 48,481 50,308 1,827 0.7%
% of Total 63.0% 59.2% 59.1%Renter-occupied 14,703 17,975 18,980 1,005 1.1%
% of Total 18.8% 22.0% 22.3%Unoccupied 14,232 15,388 15,892 504 0.6%
% of Total 18.2% 18.8% 18.7%Total Units: 78,131 81,844 85,180 7,049 0.8%
Owner-Occupied Value$0 - $99,999 10,191 21% 6,797 14% (3,394) -7.8%$100,000 - $199,999 9,457 20% 8,762 17% (695) -1.5%$200,000 - $299,999 8,080 17% 11,482 23% 3,402 7.3%$300,000 - $399,999 7,033 15% 7,591 15% 558 1.5%$400,000 - $499,999 3,911 8% 4,473 9% 562 2.7%$500,000 - $749,999 4,442 9% 5,167 10% 725 3.1%$750,000+ 5,367 11% 6,036 12% 669 2.4%
Median Value 249,371$ 282,158$ 2.5%Average Value 349,145$ 379,632$ 1.7%
Unoccupied Housing Units By StatusUnoccupied-Other Reasons
Rented (Not Occupied) 146 1%For Sale Only 1,828 13%Sold (Not Occupied) 334 2%Seasonal Use 7,475 53%For Migrant Workers 24 0%
Subtotal: 9,807 69%True Vacancies
Other Vacant 2,117 15%Vacant, For Rent 2,308 16%
Subtotal: 4,425 31%
Total Unoccupied Units: 14,232 100.0%
TRUE VACANCY: Vacant Units 4,425 4,635
True Vacancy Rate 5.7%
All Housing Units By Structure (2015 American Community Survey)1 Unit, Detached 48,042 58.7%1 Unit, Attached 4,829 5.9%2 Units 3,437 4.2%3 or 4 Units 3,356 4.1%5 to 9 Units 5,893 7.2%10 or More Units 9,412 11.5%Mobile Home 6,875 8.4%
Total: 81,844 100%
Source: ESRI Business Analyst; 2015 American Community Survey; WTL +a, May 2017.
Change: 2016-2021
2010 Census

WTL+a
WTL +a R e a l E s t a t e & E c o n o m i c A d v i s o r s W a s h i n g t o n , D C — P r o v i n c e t o w n , M A 2 0 2 . 6 3 6 . 4 0 0 2 3 0 1 . 5 0 2 . 4 1 7 1 7 7 4 . 5 3 8 . 6 0 7 0 40
Table 17: Office Real Estate Metrics—Martin County, 2007—2016
2007 2008 2009 2010 2011 2012 2013 2014 2015 2016 Total Ann'l Avg. % CAGROfficeInventory 3,772,779 3,829,062 3,854,062 3,854,062 3,866,798 3,866,798 3,881,396 3,881,396 3,861,569 3,868,998 96,219 No. of Buildings 437 442 443 443 444 444 446 446 445 445 8 Vacant Stock (1) 334,858 408,987 491,990 427,711 477,248 497,454 514,581 430,788 276,845 249,401 (85,457) Vacancy Rate 8.9% 10.7% 12.8% 11.1% 12.3% 12.9% 13.3% 11.1% 7.2% 6.4% -3.5%Total Net Absorption (19,080) (17,846) (58,003) 64,279 (36,801) (20,206) (2,529) 83,793 134,116 34,873 162,596 16,260
Past 5 Years 230,047 46,009 Construction Deliveries 49,252 56,283 25,000 - 12,736 - 14,598 - - 17,367 175,236 Average-Direct Gross Rent 26.00$ 28.50$ 18.02$ 17.02$ 17.09$ 16.70$ 16.04$ 15.79$ 15.84$ 16.32$ -5.0% Average Annual % Change 9.6% -36.8% -5.5% 0.4% -2.3% -4.0% -1.6% 0.3% 3.0%
Years to Stabilized (95%) Occupancy: Based on Average Annual Absorption for Previous 10 Years 14.6
Previous 5 Years 5.1
(1) Includes existing vacant relet and sublet space.
Source: CoStar, Inc.; WTL+a, May 2017.
Change: 2007-2016National Recession

WTL+a
WTL +a R e a l E s t a t e & E c o n o m i c A d v i s o r s W a s h i n g t o n , D C — P r o v i n c e t o w n , M A 2 0 2 . 6 3 6 . 4 0 0 2 3 0 1 . 5 0 2 . 4 1 7 1 7 7 4 . 5 3 8 . 6 0 7 0 41
Table 18: Industrial Real Estate Metrics—Martin County, 2007—2016
2007 2008 2009 2010 2011 2012 2013 2014 2015 2016 Total Ann'l Avg. % CAGRIndustrialInventory 6,493,652 6,781,467 6,849,632 6,849,632 6,849,632 6,849,632 6,855,682 6,855,682 6,855,682 6,855,682 362,030 No. of Buildings 386 394 396 396 396 396 397 397 397 397 11 Vacant Stock (1) 206,211 294,644 653,303 609,070 582,717 584,916 381,832 375,505 244,828 141,653 (64,558) Vacancy Rate 3.2% 4.3% 9.5% 8.9% 8.5% 8.5% 5.6% 5.5% 3.6% 2.1% -4.7%Total Net Absorption 301,632 199,382 (290,494) 44,233 26,353 (2,199) 209,134 6,327 130,677 103,175 728,220 72,822
Past 5 Years 447,114 89,423 Construction Deliveries 98,669 287,815 68,165 - - - 6,050 - - - 460,699 Average-Direct Gross Rent 11.73$ 9.73$ 8.11$ 7.46$ 6.81$ 6.63$ 6.79$ 6.65$ 6.84$ 8.06$ -4.1% Average Annual % Change -17.1% -16.6% -8.1% -8.6% -2.7% 2.4% -2.1% 2.9% 17.9%
Years to Stabilized (95%) Occupancy: Based on Average Annual Absorption for Previous 10 Years 1.8
Previous 5 Years 1.5
(1) Includes existing vacant relet and sublet space.
Source: CoStar, Inc.; WTL+a, May 2017.
Change: 2007-2016National Recession

WTL+a
WTL +a R e a l E s t a t e & E c o n o m i c A d v i s o r s W a s h i n g t o n , D C — P r o v i n c e t o w n , M A 2 0 2 . 6 3 6 . 4 0 0 2 3 0 1 . 5 0 2 . 4 1 7 1 7 7 4 . 5 3 8 . 6 0 7 0 42
Table 19: Retail Real Estate Metrics—Martin County, 2007—2016
2007 2008 2009 2010 2011 2012 2013 2014 2015 2016 Total Ann'l Avg. % CAGRRetailInventory 10,923,986 10,949,330 11,009,987 11,131,212 11,173,006 11,163,257 11,139,647 11,142,639 11,151,657 11,235,699 311,713 No. of Buildings 726 729 732 738 743 740 741 742 741 748 22 Vacant Stock (1) 497,274 819,115 915,666 685,665 785,468 875,533 831,434 702,867 540,446 433,968 (63,306) Vacancy Rate 4.6% 7.5% 8.3% 6.2% 7.0% 7.8% 7.5% 6.3% 4.8% 3.9% -1.8%Total Net Absorption (1) 89,347 (296,497) (35,894) 351,226 (58,009) (99,814) 20,489 131,559 171,439 190,520 464,366 46,437
Past 5 Years 414,193 82,839 Construction Deliveries 164,664 28,143 60,657 121,225 41,794 - 58,268 2,992 18,388 84,042 580,173 Average-Direct NNN Rent 18.26$ 17.04$ 17.72$ 16.88$ 17.15$ 16.54$ 15.80$ 15.87$ 16.44$ 16.94$ -0.8% Average Annual % Change -6.7% 4.0% -4.7% 1.6% -3.6% -4.4% 0.4% 3.6% 3.0%
Years to Stabilized (95%) Occupancy: Based on Average Annual Absorption for Previous 10 Years 8.9
Previous 5 Years 5.0
(1) Includes existing vacant relet and sublet space.(2) Average direct rents for retail space are on a triple net basis (i.e., tenants pay their pro rata share of operating expenses, real estate taxes, common area maintenance, etc.).
Source: CoStar, Inc.; WTL+a, May 2017.
National Recession Change: 2007-2016

WTL+a
WTL +a R e a l E s t a t e & E c o n o m i c A d v i s o r s W a s h i n g t o n , D C — P r o v i n c e t o w n , M A 2 0 2 . 6 3 6 . 4 0 0 2 3 0 1 . 5 0 2 . 4 1 7 1 7 7 4 . 5 3 8 . 6 0 7 0 43
Table 20: Comparison of Household Growth to Housing Starts—Martin County, 2001—2016
Annual Unit(Shortfall)/
Total Annual Total Annual Overage
Martin County 11,168 745 11,121 741 (3)
Source: U.S. Department of Housing & Urban Development; ESRI Business Analyst; WTL+a, May 2017.
Household Growth: 2001-2015 Housing Starts: 2002-2016