economic feasibility of photovoltaic/diesel/battery …528769/fulltext01.pdfeconomic feasibility of...
TRANSCRIPT

Economic feasibility of Photovoltaic/Diesel/Battery Hybrid power system to replace
Stand-Alone diesel generators in off-grid remote ar eas of Zambia .
Kapambwe Elias
Master of Science Thesis KTH School of Industrial Engineering and Management
Energy Technology EGI-2011-003MSc EKV827 Division of Heat and Power Technology
SE-100 44 STOCKHOLM

Master of Science Thesis EGI-2011- 003MSc EKV827
Economic feasibility of
Photovoltaic/Diesel/Battery Hybrid power system to replace Stand-Alone diesel
generators in off-grid remote areas of Zambia .
Kapambwe
Elias
Approved Date
Examiner Fransson Torsten
Supervisor Jeevan Jayasuriya
Commissioner
Contact person
ABSTRACT Most often fossil-fueled generators and in particular diesel are the first choice for power
generation option when the grid is not available. The reason is that these prime movers
have a reasonable upfront cost. However the threat of global climate change caused
by carbon dioxide emissions from fossil-fuels combustion is one main reason why
there is a growing consensus on the need for alternative methods of power generation.
High operation costs of these power plants are another source of worry. Good
alternative methods of power generation are those employing renewable energy
sources such as solar and wind. These produce very little or no pollution at all. The
major disadvantage of these clean sources of energy is, however, the initial investment
which can be extremely high in most cases.
In tropical regions where sunshine is plentiful, solar photovoltaic can be a good option
as a source of power. But as alluded to earlier, the initial investment is quite prohibitive
particularly in developing countries. But even if 100% solar PV systems may have high
investment costs, the life cycle costs, operation costs as well as the cost of unit energy
production are extremely low compared to the case of 100% diesel or even hybrids (A
hybrid power system is a combination of a fossil-fueled generator and a renewable
energy generator such as solar photovoltaic or wind turbine). Hybrids are a better

option when the investment needed for installation of 100% solar PV systems becomes
a hindrance. The whole essence of a hybrid power system is to cut down on the
generator run time and in doing so reduce on the operation costs of the 100% diesel
case. Reducing on the running time of the fossil-fuel generator reduces emissions as
well. In this study the economic feasibility of either replacing off-grid remote diesel
power plants with 100% solar PV systems or integrating solar PV systems into already
existing diesel generator, in the Zambian scenario, has been conducted at one of the
selected off-grid diesel power plants in one of the remote areas of Zambia. The results
presented here are a reflection of the study of the energy demand by the community -
courtesy of Homer software, a micro power optimization model. Homer has modeled
and categorized cost effective combinations of solar and diesel from which the most
cost effective combination in terms of net present costs, also called the life cycle cost
and the cost of unit energy production has been considered.

ACKNOWLEDGEMENTS Special gratitude goes to the following for the support given when I was going round
collecting data on the status of Diesel power generation, and of Solar Photovoltaic
installation in Zambia, the current prices of Diesel generators as well as solar systems
on the Zambian market: Zambia Electricity Supply Corporation (ZESCO) Head Office
in Lusaka in particular Mr Readly Makaliki; the regional manager for Solwezi Office in
Solwezi, and the branch manager for branch office at Luangwa. Others are Rural
Electrification Authority, Solaris Africa, Suntech, Zain (now airtel)-Zambia Ltd (Head
Office), MTN-Zambia (Head Office), Zamtel (Lamya House), Handyman’s Paradise,
Cummins-Zambia, Zambeef Plc Head office, and Shop rite-Zambia Plc (Manda Hill).
The ministry Head quarters of Education and Health in Lusaka respectively,
Department of Energy at the ministry of Energy and Water Development. Residents of
Luangwa district at the administrative centre as well as those of Mufumbwe district. Not
to forget the staff at Luangwa secondary school in particular Mr and Mrs Mudenda for
the hospitality they showed me when I visited the place. And to all those I may have
not mentioned but assisted me in one or another, I say thank you.

1
TABLE OF CONTENTS ABSTRACT
ACKNOWLEDGEMENTS
TABLE OF CONTENTS………………………………………………………............. ..............1
INDEX OF TABLES…………………………………………………....................................3
INDEX OF FIGURES………………………………………………………………………….4
NOMENCLATURE…………………………………………………………………………….5
1. INTRODUCTION..............................................................................................................7
1.1. Diesel engine generator as a prime mover………………………………………….....7
2. BACKGROUND INFORMATION…………………………………………………………... ..9
2.1. A general over view of electricity generation technologies…………………….........9
3. OBJECTIVES…………………………………………………………………………………14
4. LITERATURE REVIEW……………………………………………………………........ .......15
4.1. Electricity from Reciprocating Engines and other prime movers………..................16
4.1.2. The status of diesel power generation from worldwide overall concept; specific
examples………………………………………………………….............................................18
4.1.3.The Energy scenario and status of diesel power generation in Zambia……….22
4.2. Electricity production from Solar photovoltaics………………………………………..27
4.2.1. Variation in Global Solar Radiation………………………………………………..27
4.2.2. Generation of electricity from Solar PV cells……………………………………..29
4.3. Solar PV installation in rural areas of developing countries………………………..32
4.3.1. Status of Solar PV Technology in Zambia……………………………………….33
4.4. Electricity from Hybrid power systems………………………………………………....36
4.5.”Data collection" on PV panels and electricity storage devices available on the
market……………………………………………………………………………………………..37
4.5.1. Types of Solar PV panels on the market………………………………………....37
4.5.2. Solar electricity storage devices…………………………………………………..39
4.6. Load profiles for selected generator installations (those visited)…………………..39
5. METHODOLOGY……………………………………………………………………………..43
5.1. Assessing operations of diesel generators in areas visited………………………...43

2
5.1.2. Responses from questionnaire about operations of generators……................45
5.2. Selection of the site(s) for the case study………………………………….................47
5.2.1. Reasons for choosing Luangwa secondary school……………………………...47
6. DATA COLLECTION AND PRESENTATION …………………………………………...48
6.1. Current scenario at Luangwa secondary school………………………………….....48
6.2. Life Cycle Cost analysis………………………………………………………………...52
6.2.1. Proposed scenario…………………………………………………………………..59
7 RESULTS………………………………………………………………….. ………………...63
7.1. Considering hybrid points……………………………………………………………...66
7.1.1. Quantities specified for Homer…………………………………………………….70
7.2. Analysis……………………………………………………………................................72
7.2.1. Manual calculation of LCC for case A…………………………………………….72
7.2.2. Homer results………………………………………………………………………..74
7.3. Discussion and Conclusion………………………………………………………….....80
8. REFERENCES……………………………………………………………………………….82
9. APPENDICES………………………………………………………………………………...87
APPENDIX A: Current scenario for energy demand by the school community……….....87
APPENDIX B: Proposed scenario for energy demand by the school community…….....91
APPENDIX C: Detailed calculations of array sizes and battery bank……………………...95
APPENDIX D: Formulas for calculating the present worth factors………………………..106
APPENDIX E: Performance monitoring of some diesel power plants in north western and
Lusaka provinces…………………………………………………….....................................107
APPENDIX F: Typical examples of hybrid power installation in the world…………….....109
APPENDIX G: Daily load calculation worksheet…………………………………………...110

3
INDEX OF TABLES Table 1.1: Carbon dioxide emissions by sector in Zambia in 2004……………………….8
Table 4.1a: Efficiencies and range of power output for typical prime movers…………….17
Table 4.1b: Cost figures of electricity generation technologies……………………………..18
Table 4.1.2: Statistics of diesel generators in USA in 1996………………………………....20
Table 4.1.3a: Installed diesel power generation in Northwestern province……………….24
Table 4.2.1: Daily variation in solar radiation in selected districts of Zambia……………..28
Table 4.3: Estimated number of solar PV systems in selected African countries..............33
Table 4.5.1: Some solar panels available on the market…………………………………....38
Table 4.5.2: Solar electricity storage devices common on the market today…………….. 39
Table 6.1a: Number of households using particular appliances per day at Luangwa
secondary school in the current scenario……………………………………………………..50
Table 6.2: Columns in calculation work sheet for a stand alone electric load…………….57
Table 6.2.1a: Number of households using particular appliances on a given day in the
proposed scenario………………………………………………………………………………..60
Table 7.1.1a: Hourly Load input ………………………………………………………………. 69
Table 7.1.1b: Solar resource in put…………………………………………………………….70
Table 7.1.1c: PV array, diesel generator and inverter sizes considered…………………..70
Table7.1.1d: Annual average fluctuations in diesel fuel pump price……………………...71
Table 7.2.1: Life Cycle Cost analysis for case A……………………………………………..72
Table 7.2.2a: Homer overall optimization results…………………………………………….74
Table 7.2.2b: Homer overall optimization results for 100% diesel………………………….74
Table 7.2.2c: Homer optimization results with diesel price and carbon dioxide tax defined
as sensitivity variables…………………………………………………………………………..75
Table 7.2.2d: Homer optimization results for 100% diesel with diesel price and carbon
dioxide tax as sensitivity variables……………………………………………………………..75
Table 7.2.2e: Comparing initial capital cost, LCC, operation costs, COE and CO2
emissions between cases A, B, C, and D to case E, the base case……………………….76

4
Table 7.2.2f: Comparing LCC, operation costs, and COE between cases B, C, and D case
E, the base case when fluctuations in diesel fuel price and CO2 emission tax are defined
as sensitivity variables……………………………………………………………….................76
INDEX OF FIGURES Figure 4.1a: Specific fuel consumption as a function of diesel generator power………..17
Figure 4.2.1: Variation in solar intensity in Northern hemisphere……………………...….28
Figure 4.2.2: Current PV technology…………………………………………………………..31
Figure 4.5.1: Examples of PV modules common on the market…………………………...38
Figure 4.6a: Load profile for Luangwa district………………………………………………...40
Figure 4.6b: Load profile for Mufumbwe……………………………………………………... 41
Figure 4.6c: Current load profile for Luangwa secondary school ………………................42
Figure 5.1a: Power house and generators at Mufumbwe…………………………………..43
Figure 5.1b: ZESCO branch office at Mufumbwe…………………………………………....44
Figure 5.1c: Power house and generators at Luangwa secondary school…………….....44
Figure 5.1d: Main entrance to Luangwa secondary school…………………………….......45
Figure 6.1a: Daily activities and percentage contribution to energy consumption in the
current scenario ………………………………………………………………………………….51
Figure 6.1b: Current load profile for Luangwa secondary school………………………….51
Figure 6.2a: Extract of combinations for different energy technologies…………………. 55
Figure 6.2b: Variation in daily solar radiation at Luangwa………………………………….56
Figure 6.2.1a: Daily activities that should contribute to energy consumption by both staff
houses and the school in the proposed scenario……………………………………………61
Figure 6.2.1b: Proposed daily load profile for the school community…………………….. 62
Figure 7.1a: Schematic diagram for case A, 100% solar PV system………………………65
Figure 7.1b: Schematic diagram for case B hybrid system…………………………………66
Figure 7.1c: Schematic diagram for case C hybrid system………………………………….67
Figure 7.1d: Schematic diagram for case D hybrid system…………………………………68
Figure7.1e: Schematic diagram for case E, the base case ………………………………...69
Figure 7.2a: Comparing LCC…………………………………………………………………..77

5
Figure 7.2b: Comparing investment needed for installation…………………………………77
Figure 7.2c: Comparing cost of unit energy production……………………………………..77
Figure 7.2d: Comparing O&M costs…………………………………………………………..77
Figure 7.2e: Comparing Carbon dioxide emissions…………………………………………77
Figure 7.2f: Comparing LCC with diesel fuel price and CO2 tax as sensitivity variables...78
Figure7.2g:comparing COE with diesel fuel price and CO2 tax as sensitivity variables…78
Figure 7.2h: Comparing O&M costs with diesel price and CO2 tax as sensitivity variab..78
Figure 7.2i: Percentage contribution of solar and diesel……………………………………78
NOMENCLATURE
AC Alternating current Amperage (A) 0C Degree Celsius
COE Cost of unit energy US$/KWh
CO2 Carbon dioxide
Dept Department
Dec December
DC Direct current Amperage (A)
DVD Digital Video Disc
E East
ERB Energy Regulation Board
Frac Fraction
Genset Generator set
GW Giga watt
Hr Hour
Hz Hertz
im Nominal current
Kg Kilogram
Kg/m3 Kilogram per meter cubic
KW Kilowatt

6
KW/m2 Kilowatt per meter square
KWh/m2/d Kilowatt hour per meter square per day
L Liters
LCC Life Cycle Cost US$
LHV Lower heat value
L/stone Living stone
Min Minimum
Max Maximum
Mj/Kg Mega Joules per Kilogram
MW Mega watt
MWh Mega watt-hour
M/nilunga Mwinilunga
N North
Nom. Nominal
NOx Oxides Nitrogen
Nov November
Oct October
O&M Operation and Maintenance
Pmax Maximum Power Watt (W)
PV Photovoltaic
% Percentage
ppm Parts-per-million
QTY Quantity
Recip. Reciprocating
SFC Specific Fuel Consumption
Sox Oxides of Sulfur
VCR Video Cassette Recorder
Vm Nominal Voltage
Wp Peak watt
W/m2 Watt per square meter
Yr Year
7
1. INTRODUCTION 1.1. Diesel engine generator as a prime mover
Diesel engine generators are internal combustion engines that operate by injection of fine
diesel fuel droplets into a combustion chamber heated by compression. The air heats the
fuel and causes it to evaporate and mix with the available oxygen. The fuel ignites and
spreads through the chamber. Power output is managed by controlling the amount of fuel
injected into the combustion chamber.
As Robert (2005) points out, communities often turn to fossil-fuel generators, usually
diesel, as the first choice considered when the grid is not available. Of course diesel
generators comprise the vast majority of prime movers for standby power generators
because of their reliability, durability and performance under load. Diesel generators also
offer the advantages of availability, portability and what might seem to be a reasonable
upfront cost. They are also depended on for backup power systems in most critical
locations such as hospitals, Government buildings and in telecommunications facilities. In
standby power applications, diesel generators can start and assume full rated load in a
matter of seconds and typically they can go 30,000 hours or more between major
overhauls [Timothy, 2007].
However the inherent problem with diesel generators in developing nations is their fuel
needs. Fuel costs in many developing nations are heavily subsidized and vulnerable to
price spikes. In off-grid remote areas, the basic question is whether the fuel will be
delivered regularly to meet power needs. Other problems often associated with diesel
generators include:
• A shortage of trained maintenance personnel in many rural areas
• A shortage of spare parts for larger generators/motors
• The difficult of transporting the already expensive fuel to remote areas

8
• Short lives for expensive generators
• The constant requirements for expensive and/or scarce fossil fuels
Beyond operations, diesel generators merely intensify local air pollution and global
warming. Depending on the engine and fuel type, diesel generators can produce 5 to 20
times as much NOx (Oxide of Nitrogen), on a ppm basis, as any other lean-burn natural
gas engine. Table 1.1 below illustrates CO2 emissions by sector in Zambia in 2004.
[Source: IEA 2006]
Sectorial Approach Millions of tons of Carbon
Dioxide
Coal Oil Total
Main activity. Producer electricity and heat 0.35 1.70 2.05
Un allocated Auto producers 0.03 0.00 0.03
Manufacturing industries and construction 0.3 0.57 0.87
Transport - 0.86 0.86
Transport-Road - 0.79 0.79
Other sector 0.03 0.18 0.21
Residential - 0.05 0.05
Table 1.1 CO2 emissions by sector in Zambia in 2004

9
2. BACKGROUND INFORMATION
2.1. A general over view of power generation technologies
There are a variety of technologies for generating electricity that exist today. Each
technology has been developed to suit the source of energy to be used and designed to
extract as much as possible the power from the energy source.
Reciprocating internal combustion engines are a widespread and widely known
technology for a range of power-generation applications, including standby and
emergency power, peaking service, intermediate and base-load power, and combined
heat and power (CHP). Spark ignition engines for power generation use natural gas as the
preferred fuel – although they can be set up to run on propane or gasoline. Diesel-cycle,
compression ignition engines operate on diesel fuel or heavy oil, or can be set up in a
dual-fuel configuration that can burn primarily natural gas with a small amount of diesel
fuel. Oil contributes about 5.8% of world electricity production [Black and Veatch 2009 a].
Direct combustion remains the most common technique for deriving energy from biomass
for both heat and electricity production. The predominant technology in the World today
for electricity generation from biomass, at scales above one Megawatt, is the steam-
Rankin cycle. This consists of direct combustion of biomass in a boiler to raise steam
which is then expanded through a turbine. Energy conversion efficiencies are relatively
low being in the range of 15 to 25%. Alternatives to direct combustion technology is the
biomass co-combustion with fossil fuels in existing boilers and the integrated gasification
combined cycle (IGCC). Combustible gas can also be produced from biomass through the
low temperature biological processes called anaerobic digestion in specifically designed
anaerobic digesters or in landfills to produce biogas. Biogas, is typically 60% methane and

10
40% carbon dioxide with a heating value of about 55% that of natural gas. Biogas can be
burned to provide energy to generate electricity.
Wind turbines capture energy by using propeller-like blades that are mounted on a rotor.
The blades are placed on top of high towers in order to take advantage of stronger winds.
The wind causes the propellers to turn, which then turn the attached shaft to generate
electricity. Wind can be used as a standalone source of renewable energy or in
conjunction with other renewable energy systems. Wind energy accounts for 6% of
renewable electricity generation and 0.1% of the total electricity supply worldwide [World
status of wind-diesel application (2002)].
There are two basic categories of technologies that convert sunlight into useful forms of
energy. These are;
• Solar photovoltaic modules: Solar PV modules are solid-state
semiconductor devices with no moving parts that convert sunlight into direct-
current electricity
• Solar Thermal systems: Solar thermal power systems use various
techniques to focus sunlight to heat an intermediate fluid, called the heat
transfer fluid, which is then used to generate steam. The steam is then used to
generate electricity. There are currently three solar thermal power systems
namely; parabolic troughs, power towers, and dish/engine systems.
Hydropower is the largest renewable energy resource used for generating electricity. It
plays an essential role in many regions of the world with more than 150 countries
generating hydroelectric power. The conversion of energy carried by water into
electrical energy is carried out by the turbo-generator, a rotating turbine driven by the
water and connected by a common shaft to the rotor of a generator. Modern hydro
turbines can convert as much as 90% of the available energy in water into electricity.
The essential characteristics of a hydroelectric power site are the effective head (the
height, H, through which the water falls), and the flow rate (The number of cubic
meters of water per second). There are about 700 GW of hydroelectric power capacity

11
in operation worldwide, generating some 2,600TWh/year (about 19% of the world’s
electricity production) [www.Worldenergyoutlook.org. Accessed 08 06 2009]
Geothermal is the only form of renewable energy that is independent of the Sun, having
its ultimate source within the Earth. Geothermal energy, the natural heat within the earth,
arises from the ancient heat remaining in the Earth's core, from friction where continental
plates slide beneath each other, and from the decay of radioactive elements that occur
naturally in small amounts in all rocks. The techniques for exploiting the resource are
analogous to the well-established techniques for extracting oil and gas. One or more bore
holes are drilled into the reservoir, and the hot fluid pumped to the surface is then used in
conversional steam turbines. The technologies for electrical power generation depend
critically not only on the fluid temperature but also the salinity and contents of gases, all of
which affect plant efficiency and design.
Fuel cells are the most efficient and extremely clean systems for generating power. A fuel
cell is an electrochemical device that converts chemical energy of a fuel directly into
electrical energy. It has two electrodes where electrochemical reactions occur in a
reservoir of electrolyte that allows ions to flow between the two electrodes producing DC
electricity. The commercial fuel cell power plants offer the highest net efficiencies in the
range of 50-70% and up to 10MW capacity. The waste heat generated in the form of
steam produced during exothermic electrode reactions/combustion of exhaust gases, can
further be utilized to enhance the overall efficiency to greater than 70%. Fuel Cells can be
classified according to the type of ionic conductor they use. The three major types include;
Phosphoric Acid Fuel (PAFC), Molten Carbonate Fuel Cell (MCFC), and Solid Oxide Fuel
Cell (SOFC).
Among the old technologies used for electricity power generation are those involving fossil
fuels. Fossil fuels are carbon-based fuels found in the earth’s crust that have been formed
over millions of years by decomposing remains of plant and animals under intensive heat
and pressure. They include energy-rich fuels such as coal, petroleum (oil), and natural
gas.

12
Nowadays, the coal used for electricity generation is first milled to a fine powder, which
increases the surface area and allows it to burn more quickly. In these pulverized coal
combustion (PCC) systems, the powdered coal is blown into the combustion chamber
where it is burnt at high temperature. The hot gases and heat energy produced convert
water (in tubes lining the boiler) into steam. The high pressure steam is passed into a
steam turbine containing propeller-like blades. The steam pushes these blades causing
the turbine shaft to rotate at high speed. A generator is mounted at one end of the shaft
and consists of carefully wound wire coils. Electricity is generated when these wound wire
coils are rapidly rotated in a strong magnetic field. Most coal fired electricity is currently
generated at less than 35% efficiency, though some supercritical cycles run at efficiencies
of 35-40% in large-scale applications in the USA. Globally, coal fired power plants supply
nearly 40% of the world’s electricity [Awake, March 2005].
Gas turbines, also referred to as combustion turbines, transform the thermal energy from
hot combustion gases, principally natural gas (natural gas contribute a total of 20.1% of
world electricity production; www.Worldenergyoutlook.org; accessed 8th June 2009 ), into
rotating mechanical energy. Gas turbine technology is used in a variety of configurations
for electric power generation, including simple cycle, combined cycle, or cogeneration. A
modern simple cycle gas turbine can exceed 40% thermal efficiency. To achieve greater
efficiency than 40%, hot exhaust gases from the gas turbine can be directed into a heat
recovery boiler and used to generate steam that can then be used in a steam turbine to
generate additional electricity in a combined cycle generation. The thermodynamic
efficiency for combined cycle gas turbines can be as high as 55%. Integrated Gasification
Combined Cycle (IGCC) is an advanced technology that is currently the cleanest available
coal technology. With potential efficiencies exceeding 40%, IGCC power plants could use
less coal and produce lower emissions of CO2 than conventional power plants [Black and
Veatch, 2009b].
Micro turbines are small combustion turbines approximately the size of a refrigerator of 25
to 500 KW. This technology has evolved largely from automotive and truck turbochargers,
13
auxiliary power units for air planes, and small jet engines. Compared to other technologies
for small-scale power generations, micro turbines offer a number of significant advantages
including, having a small number of moving parts, compact size, light weight, optimal
efficiency and, appropriate to use waste fuels. In fact Micro turbines can burn natural gas,
as well as kerosene, diesel, propane, biomass-based fuels, and other fuels. Electrical
efficiencies of 23 to 26% are achieved by employing a recuperator that transfers heat
energy from the exhaust stream back into combustion air stream.
In a nuclear power plant, the generation process to produce electricity starts by splitting
uranium atoms in a controlled way inside a reactor to produce heat energy. An atom is
made up of protons, neutrons, and electrons. When the atom is split, two or three
neutrons are thrown off at great speed. These neutrons are then slowed down by the
reactor’s graphite core or moderator, to a speed where they are able to hit other uranium
atoms, resulting in another split. These repeated collisions create a ‘chain reaction’ thus
releasing more heat energy. The energy produced is transferred to boilers to produce
steam. The steam drives a turbine which then drives a generator to produce electricity.
Some 443 nuclear power plants producing close to 370GW are in operation worldwide
generating some 16% of global electricity supply.
14
3. OBJECTIVES OF THE PROJECT
The main objective of this study is to determine the costs of integrating solar PV systems
into already existing off-grid stand alone diesel generators in remote areas of Zambia or
totally replace these diesel power plants with 100% solar PV systems. The study,
therefore, investigates the feasibility of the following in the Zambian scenario:
• The life cycle costs of retrofitting existing off-grid stand alone diesel power plants
with solar PV systems i.e. PV-diesel-battery hybrid power systems, considering
various hybrid points, in between 2 extreme points of 100% solar PV with batteries
and 100% diesel-base case, in which solar PV, diesel, and the battery bank share
the daily load
• The investment needed for installation,
• The annual operation costs
• The cost of unit energy production
• The annual carbon dioxide emissions
• The sensitivity of these values against change of diesel fuel price and Carbon
dioxide tax charge

15
4. LITERATURE REVIEW
Diesel engines have historically been the most popular type of reciprocating engines for
both small and large power-generation applications. However, diesel engines are
increasingly restricted to emergency stand-by or limited duty-cycle services, particularly in
developed countries because of air emission concerns. But in off-grid remote areas of
most developing countries, diesel engine generators provide the base load to meet the
electricity demand of the community.
Photovoltaic and other renewable energy technologies can contribute to the economic and
social development of millions of people in the world who do not have access to electricity
for lighting, clean water supply, primary health care, education and other basic services.
Theoretically, solar PV could satisfy global electricity demand thousands of times over yet
its potential remains unrealized because its current performance renders it more
expensive than conventional sources. Though solar PV is little far from being economical
in comparison with conventional fossil fuels to provide electricity, they can be cost
competitive in remote areas where it is uneconomical to extend the grid line.
In line with stand-alone solar PV systems, solar photovoltaic hybrid systems can make a
positive contribution to the sustainability of rural communities in developing countries that
do not have access to electricity grid and which depend on fossil fuel generators. Thus
integrating solar photovoltaic systems with diesel generator for remote and rural areas can
assist in expanding the electricity access in many tropical regions. The role of integrating
renewable energy in a hybrid power system is primarily to save diesel fuel and also to cut
down on operations and maintenance of the generator as well as carbon emissions.

16
4.1 Electricity from Reciprocating engines and other p rime movers.
Reciprocating internal combustion engines represent a wide spread and mature
technology for power generation. Reciprocating engines are used for all types of power
generation, from small portable generator sets to larger industrial engines that power
generators of several megawatts. They typically have low capital cost compared to other
alternatives but have high operating costs due to the need for fuel. Initial cost can be as
much as $2,000 for a 2.5KW generator; this of course varying depending on the type of
generator. Reciprocating internal combustion engines are of two types; the Otto cycle
which is a spark ignition engine and uses natural gas as the preferred fuel (although it can
be setup to run on propane or gasoline), the diesel cycle which is a compression ignition
engine and uses diesel oil, heavy fuel or can run on dual fuel (usually natural gas-about
85%- and diesel).
The efficiency of the Otto cycle ranges from 30-35% while that of diesel cycle may be
around 40% though larger and slow speed diesel cycles may be over 50% [Larry
Goldstein et al, 2003]. One of the most attractive features of a reciprocating engine is its
high part load efficiency. As the load of an engine drops, the efficiency does not
significantly drop until very low loads are reached. Figure 4.1a below summarizes the
specific fuel consumption as a function of its full power for diesel generator sets from a
particular manufacturer, Caterpillar. (All the generator sets shown on this graph are rated
400V, 1500 revolution per minute, 50Hz). The general nature of the curves is driven by
fundamental physics and so they are not particularly different for other manufacturers.
The key feature is that lightly loaded machines are much less efficient than are more
heavily loaded units. Moreover, the increase in specific fuel consumption with a decrease
in load tends to be much larger below about half load than above half load. Thus, it is
obvious that some granularity (the number and power rating of the component systems,
affects the maximum fuel efficiency that can be obtained for a given load profile) should
provide a benefit in fuel economy. Diesel engines exhibit even more favorable part-load

17
characteristics than spark ignition engines. The efficiency curve for diesel engines is
comparatively flatter between 50 and 100% load.
Figur e 4.1a: Specific fuel consumption as a function of g enerator power. [Source:
Diesel Generator Set Optimization for Marine Transp ortation]
www.utexas.edu/researc/com/image/Diesel%20Generator.doc [Accessed on 12th June
2009]
Diesel engines work exactly the same way as those in a car. Piston-cylinders are
connected to a crankshaft. The linear motion of the piston-cylinder transforms to rotational
motion on the crankshaft. The rotating shaft then produces electricity by rotating inside a
magnetic field. Table 4.1a below is a summary of the efficiencies and range of power
output of typical prime movers (other than reciprocating engines)
Prime mover Efficiency % Range of power output
Gas Turbine 30 – 40 500 KW ~ 50MW
Steam Turbine Up to 40 100s of MW
Hydraulic Turbines ~80 to as much as 95 Few MWs to 100s of MWs
Micro turbines 23 – 26 30 – 300 KW
Wind Turbines ~ 59 max. 100W – 5MW
Fuel cells 50 - 70 50 – 500KW
Stirling engines 30-50 -

18
Table 4.1a: Efficiencies and range of power output for typical prime movers.
[Source; Larry Goldstein et al (2003) and Boyle (20 04)]
Table 4.1b shown below compares cost figures of electricity generation from certain
generation methods.
Recip.
Engine
Gas
Turbine
Steam
Turbine
Micro
turbine
Fuel
cells
Wind
Turbines
Hydro
Size(MW) 0.01-5 0.5-50 0.05-50 0.03-
0.30
0.05-
0.5
0.03-5 10s to
100s
Electric
efficiency%
30-37 22-37 5-15 23-26 30-46 Around
25
Up 95
costs $/KW 200-350 600-
1400
300-900 1500-
2300
2800-
4700
~1000 1200-
1600
O&M costs
$/KWh
0.008-
0.018
0.004-
0.01
<0.004 0.013-
0.02
0.02-
0.04
- -
Table 4.1b; Cost figures of electricity generation technologies: [Source Larry
Goldstein et al (2003) and Boyle (2004) b]
4.1.2 The status of diesel power generation from wo rldwide overall concept;
specific examples
In countries around the world, there are many communities not served by the national or
regional electric grids. In many of these communities, power is generated by small diesel
power plants that range in size from about 100KW to several MW. There are hundreds,
perhaps thousands of isolated diesel-powered villages worldwide. The appeal of this
approach is the relatively low capital cost of the generating equipment.
In the state of Alaska alone, for instance, there are approximately 200 diesel-powered
communities. In addition to village power systems, there are hundreds or thousands of

19
diesel power plants providing power to a variety of remote commercial and industrial
facilities including mining operations, military bases, resorts, fish farming, and processing
operations. In 1988, total installed diesel capacity in Alaska was 259 MW, with electricity
consumption growing at 10% annually in villages eligible for state energy support [Virinder
Sigh, 2001]. As at June 1st, 2006, 95% of diesel fuel in Alaska was consumed by
stationary diesel engines (Rural Diesel Generators) [Alaska Energy Technology
Development Laboratory, 2006].
Still in the state of Alaska, in Sitka, diesel generation is used to back-up and supplement
the hydropower electric generation. The load forecast for the 2009, is a total requirement
of 122,132 MWh, which compares to Sitka’s 124,000 MWh of average hydro electric
capability. The fear is that if low rainfall occurs, then Sitka’s hydro electric capability could
drop to 110,000 MWh which could require 12,132MWh of diesel supplement generation to
produce a total of 122,132 MWh. Sitka has used up its available hydro-electric energy
supply and the forecast is that the future growth in power requirements will be increasingly
supplied by supplemental diesel generation until more hydro electric resources can be
developed [Sitka’s power supply plan, 2008]. In Canada, some 300 remote communities
are currently supplied with electricity from diesel generators [Blending Wind and solar into
the Diesel Generator Market, 2001 a]
The United States has also a lot of diesel generators. In 1996, there were 626,000
installed units with a total capacity of 102,000 MW [Blending Wind and solar into the
Diesel Generator Market, 2001 b].The international market for diesel generators continues
to expand dramatically. In1994, for instance, 316,000 new generators were installed at
32,000MW capacity. This was equal to 1/3 of new installations of fossil, nuclear, and
hydro facilities that same year. Table 4.1.2, below shows the total installed diesel
generator capacity in the US in 1996.

20
Size (MW) Installed
units
Installed
capacity(MW) Min Max
0.0022 0.0045 6,235 26.4
0.0045 0.0082 34,543 212.9
0.0082 0.0119 40,262 417.5
0.0119 0.0298 104,448 1,898.2
0.0298 0.0746 153,705 8,104.9
0.0746. 0.1306 108,415 10,918.5
0.1306 0.2238 72,434 13,292.8
0.2238 0.4476 49,690 15,902.5
0.4476 0.7460 38,318 21,467.4
Over 0.7460 24,674 21,467.4
Total 626,489 102,661
Table 4.1.2; Statistics of diesel generators in US [1996]; [Source: Blending Wind and
solar into The Diesel Generator Market, 2001]
Argentina has an installation of about 11 remote Diesel stations in the province of Santa
Cruz producing more than 40,000 MWh per year
In Indonesia, electrification in rural areas has been partially achieved through the use of
isolated diesel systems. About 20% of the country’s generated electricity is produced by
small, isolated diesel power plants employing over 1,800 individual diesel units. Of these
diesel plants, 1,100 were below 1 MW capacity (by 1997) [Barley et al, 1997], and are
widely distributed geographically, making fuel delivery, reliable operation and
maintenance expensive, time consuming and difficult. Regulated tariffs on the generated
electricity result in loss of money on the diesel plants. To limit costs, electrical services are
limited to a few hours per day in some areas. The diesel power plant at Poriti is typical of
many in Indonesia in that electricity services are provided only 12 hours per day. The

21
existing power system consists of two 20KW diesel generators. Similarly the town of
Lonthoir in Indonesia is a large community that is provided with power by using two diesel
engines. Chayun et al (2004), in their case study of retrofitting the existing diesel into
renewable, has also admitted the use of conventional stand-alone diesel generators to
provide electricity to the inhabitants of small and remote Islands of Indonesia.
In the heart of Bay of Bengal lies a cluster of islands known as Andaman and Nicobar (A
and N) Islands. Due to the geographical and topographical peculiarities of these Islands,
including separation by sea over great distances, there is no single power grid for all the
electrified Islands and instead a power house caters independently to the power
requirements of an Island. Power generation in A and N Islands is largely through diesel
fuel, which accounts for 95% of the total generation. There are 41 diesel power houses at
different locations in these Islands having Diesel generation capacity of 6KW to 5000KW.
Muňoz, Narvarte and Lorenzo, in a pilot project to replace diesel generators by small PV-
Hybrid plants in two remote villages in the south of Morocco report that in most of the
villages visited diesel generators supply electricity through local min-grids to the dwellings
during 3 to 4 hours a day. The poor electricity service in terms of availability and quality
has led to some families installing SHS (Solar Home Systems) but yet others resort to the
use of small private diesel generators during the day time [Muňoz. J. et al, 2003].
Young (2005) illustrates the electricity scenario of Montserrat. In Montserrat as at 2005
electricity was being produced from four diesel generator units based at Brades power
station.
The Australian energy industry has a very strong track record for reliable electricity supply.
However the exposure of electricity infrastructure to a range of potential hazards,
including deliberate attack, means that uninterrupted supply can not be guaranteed.
Diesel back-up generation is a common and effective way of protecting Organizations
against the economic and social consequences of electricity disruptions [Energy
Infrastructure Assurance Advisory Group, 2005].

22
While conducting a feasibility study for the viability of a Hybrid, Wind/Diesel power
generation in fossil fuel rich country of Masiral island off the main coast of Oman in the
Arabian sea, in August 2006, Al-Ismaily et al (2006), report that currently all electric power
demand is met by ten (10) diesel-powered generators located at central power stations.
The capacity of the power rating ranges between 265 and 3,136 KW, with total installed
power capacity of more than 8,200 KW.
In their presentation to the 3rd International Conference on “ Sustainable Energy and
Environment (SEE, 2009) at the World Renewable Energy Congress in Asia, Ponechawee
et al(2009), wrote that Utility grid extension in rural Thailand is unworkable because of
dispersed population, ragged terrain or both. Thus electrical energy is usually provided in
these cases by small diesel generators [Ponechawee et al, 2009].
4.1.3. The Energy scenario and status of diesel power generation in Zambia
Zambia’s domestic energy resources include coal and hydro electric power. However, the
most abundant source of energy in Zambia is hydropower with the main catchment areas
developed at the Zambezi and Kafue rivers. Zambia has an installed generating capacity
of 1,776MW of which 1,690 MW is hydroelectric power and approximately 86 MW is
thermal. The Zambezi River has the Kariba North bank and Victoria Falls power stations
while the Kafue River harbors the Kafue Gorge Hydro electric power scheme. Mini-hydro
stations serve rural areas particularly in the northeastern part of the country. These
include Lusiwasi (with power output of 12 MW), Musonda (5MW), Chishimba (6MW), and
Lunzua (0.75MW).
Biomass energy represents more than 70% of the final energy demand in the country.
Households, particularly in rural areas and peri-urban areas use the vast majority of
biomass in form of firewood and charcoal for cooking, brick backing, and space heating.
Refined oil products account for some 8% of the country’s energy demand.

23
Solar power is a possible substitute for energy sources in Zambia because of the bountiful
sunshine. Its use can be competitive especially in remote areas where the grid is not
available. However, the initial high investment cost of solar systems has been highly
prohibitive. The other renewable energy source is wind which, unfortunately because of
low wind speeds, is currently used primarily for water pumping.
In Zambia electricity to remote rural areas that are not served by the grid is mainly
provided by Zambia Electricity Supply Corporation (ZESCO) through the use of diesel
power generators. There are currently nine (9) such diesel power generators installed in
various places in rural areas by ZESCO. Kaputa district in Northern Province has an
installation of two Volvo Penta diesel generators of 267 KW and 181 KW, respectively.
Power production from these two gensets average 200 to 250 KW load amounting to 0.9
million KWh annually. The daily fuel consumption is 1,040 liters. Lukulu in Western
Province has an installation capacity of 832KW. There are two 250KW, and one 320KW
Caterpillar generators at Lukulu. The average monthly fuel consumption is approximately
37,108 liters generating an average of 1,817,044KWh of energy annually. A 640KW
Perkins machine with daily fuel consumption of 1,400 liters is installed at Luangwa district.
Apart from Solwezi and Kasempa (which are on hydro), the rest of the districts in North-
Western Province of Zambia are served by diesel generators. Below in table 4.1.3a is the
installed capacity of diesel power generation in North-Western Province of Zambia. The
table shows the capacity installed in respective districts, number of generators installed,
type of generators, peak demand, and number of clients. Other quantities shown are
diesel fuel storage capacity and daily fuel consumption. [Source: ZESCO Head Office,
Lusaka; ZESCO Regional Office, Solwezi]

24
District
Capacity of Gen Set (kW)
No. of Gen Set Installed
Type of Gen set
Peak Demand (kW)
No. of Clients
Diesel Storage Capacity(liters)
Daily fuel consumption(liters)
Mwinilunga 630
02 Cummins
1000 640 135,000 4,600
630 Cummins
Chavuma 250 01 Cummins
203 200 135,000 2,333.
440 01 Unlec
Zambezi 400 01 Cummins
630 683 135,000 2,333
400 01 Cummins
Kabompo 1200 01 Caterpillar
700 610 135,000 2,000
580 01 Caterpillar
Mumfumbwe
400 01 380 300 45,000 1000
Table 4.1.3a; Installed diesel power generation in N/western province
Diesel power generation from the above stations and managed by ZESCO totals
6.854MW representing 0.39% of the country’s installed capacity of 1,776 MW. In each
location the power produced from the station is distributed to the consumers through a
local mini-grid.
In addition to the generators that ZESCO has installed in rural areas of Zambia, the three
mobile phone service providers, namely, Zain-Zambia Ltd, MTN-Zambia and Zamtel
(Zambia Telecommunication Corporation, a partly state owned company popularly known
as cell-Z), have installed several generators in Zambia as stand by power sources for
continuous network coverage in case of failure by the grid. In places where the grid is not
available, such as the ones mentioned above, the generator provides the base load for
the mobile phone service companies to provide the service to the local people.
Currently, Zain-Zambia has installed a total of 585 generators in all the 72 districts of
Zambia as stand-by power units. The capacities of the generators range from about
12.8KW to 800KW. The 12.8KW generators are the majority in terms of capacity. These

25
generators have a rate of fuel consumption of roughly 2.8litres per hour. Monthly fuel
consumption totals about 200,000 liters [Source: Zain-Zambia, Head office, Lusaka].
MTN-Zambia has also installed a total of 500 generators through out the country, most of
them 16KW and a few 69.6KW capacities. They act as stand by power supply units where
the grid is available. Like for Zain-Zambia, these generators provide the base load where
the gird is not available. Out of the 500 generators installed by MTN, four (4) generators
have the capacity of 200KW. On average the smaller generators may consume as much
as 3liters per hour and the larger ones as much as 5 liters per hour. Most of these
generators are installed in rural areas. Zamtel has installed a total of 245 generators
through out the country. The capacities range from 10KW to 800KW with average monthly
fuel consumption of 35,000 liters [Sources: MTN-Zambia, Head Office, Lusaka; Zamtel,
Lamya House, Lusaka].
Shop rite Plc, a South African firm, is one of the leading super markets in Zambia dealing
in a variety of essential commodities including perishable food stuff. The firm has shops
in all the provincial centers of Zambia. So in order to continue with power supply for
refrigeration of perishable food stuff, the firm has installed a diesel generator at every
shop as stand-by power supply in case of failure by the grid. Of these generators there
are two (2) 280KW Salister diesel generators sets with an average fuel consumption of 70
liters per hour; two (2) 200KW Detroit diesel generator sets with an average fuel
consumption of 40-50 liters per hour; one (1) 200KW Sconio diesel generator set also with
average fuel consumption of 40-50 liters per hour; four (4) 120KW Lister diesel generator
sets with average fuel consumption of 16-22 liters per hour and a 320KW Salister diesel
generator set with average fuel consumption of 70 liters per hour[Source: Shop rite
Checkers, Manda Hill, Great East Road , Lusaka].
Zambeef Plc is another Zambian company dealing in meat products. In the company’s
major out lets, Zambeef Plc has installed a total of 25 generators. The capacities of these
generators are in the range of 200-320KW [Source: Zambeef, Head office, Addis Ababa
road, Lusaka].
26
As a major consumer of hydro electricity due to its medical and diagnostic equipment, the
Ministry of Health has been greatly affected by the power cuts resulting from power
deficits being experienced in the sub-region. Since many of its medical equipment in
various hospitals are highly dependent on electricity for their operations, the Government
of the Republic of Zambia, through the Ministry of Health, has taken steps to put in place
an energy back up system, which includes the installation of generators in first, second
and third level hospitals, where they are not existing and where they are non functional.
As such 23 backup generators had been planned for in the 2008 infrastructure operational
plan and earmarked for purchase. Other district hospitals already running on diesel
include Mufumbwe and Zambezi district hospitals (these have separate generator sets
other than those serving the district, installed by ZESCO), and katondwe mission hospital
in Luangwa district [Source: Ministry of Health Head Quarters, Ndeke house, Lusaka].
The Ministry of Education has also installed a total of 98 generators particularly in rural
schools which are not served by the grid. The majority of these generators are in the
range of 8KW to 60KW capacity [Source: Ministry of Education, Head Quarters. Lusaka].
The table in appendix E shows a summary of the performance monitoring and
maintenance for some selected diesel fueled power plants in Zambia including those
visited [Source: ZESCO Head office, Lusaka]. From the table it can be seen that the major
routine maintenance involves changing of engine oil and fuel filters on regular basis.
Because of the durability of diesel engines, most maintenance is preventive in nature.
Preventive maintenance for diesel engine generators plays a critical role in maximizing
reliability, minimizing repairs and reducing long term costs. Preventive diesel engine
maintenance consists of the following operations:
• General inspection (checking exhaust system, fuel system, DC electrical system,
monitoring of engine performance)
• Lubrication service( checking engine oil level, changing the oil and filter at the
intervals recommended)

27
• Cooling system service(checking the coolant level during shutdown periods)
• Fuel system service( draining fuel filters at recommended intervals; draining
accumulated water vapor from the tank; inspecting charge-piping and hoses for
leakages)
• Servicing and testing starting batteries ( cleaning, checking specific gravity and
electrolyte level)
• Regular engine exercise
4.2. Electricity production from Solar Photovoltaic
4.2.1. Variation in Global Solar Radiation
The performance of a solar photovoltaic cell largely depends on the intensity of solar
radiation reaching its surface. There fore, the daily variation of solar radiation reaching a
given point on the earth’s surface both in terms of intensity and angle of incidence is
cardinal in realizing the electric power out put from these devices.
Figure 4.2.1, below shows the annual variation of solar intensity over the northern half of
the globe. The graph also shows that the equatorial region receives an almost constant
value of 400W/m2. Annual variation of solar intensity increases with increase in latitude,
with almost zero value for months of January, February, March, September, October,
November and December, and higher solar intensity in the months of April, May, June and
July for regions with latitude 90o N.

28
Figure 4.2.1: Variation in solar intensity in North ern hemisphere [Source: Solar
Energy Resource and Availability, 2008].
Table 4.2.1, below shows the daily variation in solar radiation, KWh/m2/day (horizontal
ground) over a few selected districts (including those visited) in Zambia.
Month Kaputa L/ngwa M/nilunga Ndola Chipata Zambezi L/ka L/stone
Jan 4.9 5.38 4.14 5.45 5.54 5.20 5.76 6.19
Feb 5.22 5.52 4.33 5.42 5.56 5.33 5.73 6.21
March 5.44 5.56 4.42 5.83 5.83 5.52 6.11 6.44
April 5.78 5.40 5.28 6.28 6.13 6.04 6.21 6.26
May 6.09 5.19 5.36 5.90 5.70 5.89 5.68 5.66
June 6.02 4.76 5.33 5.56 5.21 5.72 5.22 5.26
July 6.13 4.99 5.50 5.82 5.34 6.01 5.44 5.45
Aug 6.48 5.85 5.78 6.44 6.00 6.36 6.23 6.16
Sept 6.32 6.51 5.83 6.98 6.65 6.44 6.90 6.87
Oct 5.73 6.73 5.42 7.16 7.21 6.18 7.20 7.05
Nov 5.08 6.35 4.50 6.27 6.42 5.67 6.54 6.57
Dec 4.9 5.47 4.14 5.50 5.79 5.31 5.94 6.14
Year 5.68 5.64 5.01 6.05 5.95 5.81 6.09 6.19
Table 4.2.1; Daily variation in solar radiation in selected districts of Zambia [Source:
RETScrean International, Clean Energy Project Analy sis Software].

29
From table 4.2.1 it can be seen that Zambia has high solar intensity levels which are
almost constant through out the year.
4.2.2. Generation of electricity from solar photovoltaic cells
Sunlight is composed of photons i.e. discrete units of light energy. When photons strike a
photovoltaic cell, some of the energy is absorbed by the semiconductor material of which
the photovoltaic cell is made. This energy is transferred to electrons, and with their new-
found energy, the electrons can escape from their associated atoms and flow as current in
an electric circuit. Thus the term photovoltaic refers to the conversion of solar energy
directly into electricity in direct current (DC) form. Photovoltaic is the only technology that
directly converts sunlight to electricity. This is achieved by the solar photo-voltaic cells (PV
cells).
The vital component in a solar PV system is the solar cell, also called Photo-Voltaic cell.
In its simplest form, a photovoltaic cell is a solar-powered battery [Elliott l, 1997]. It is a
small semiconductor device which has a light-sensitive p-n junction. When solar light rays
strike the p-n junction a direct current electromotive force is generated with p-terminal as
positive and n-terminal as negative. The nominal PV cell when exposed to full sun light is
approximately: voltage about 0.45V, DC; current 0.75A, DC and power about 0.33W
[Parulekar, 2005]. The actual power delivered, however varies with intensity of sun light
and the load resistance.
To get the desired voltage, current and power, solar cells need to be connected in series
or parallel. Therefore several solar cells are usually connected together in series to form a
string. Several strings then are connected together in parallel to form a module and
several modules are connected in series or parallel to form an array. The arrays are in
turn installed on the structure e.g. the roof top to form a solar PV collector or a solar panel.
A solar PV panel or solar PV array is only able to deliver a certain amount of DC current at
a certain DC voltage for a given intensity of incident solar radiation. The DC power output

30
depends on the total number of cells and the power produced per cell. In PV systems,
current and voltage are influenced by the circuit connections and external resistance. The
cost of generating electricity from solar photovoltaic systems may be as high as
$6000/KW. As Karekez and Raja (1997) put it, solar devices have no moving parts that
can wear out and they do not consume fuel. As such maintenance is low. The following
points high light some of the predictive and preventive maintenance for solar PV systems;
• The PV array should be washed during the cool of the day, when there is a
noticeable build up of soiling deposits
• Periodical inspection of the system to make sure all wiring and supports stay intact
• On a sunny day near noon on March 21st and September 21st of each year, the
output system should be reviewed to see if performance is close to the previous
year’s reading. A log of these readings should be maintained so as to identify if the
system’s performance is consistent [Endecon Engineering, 2001]
• Routine maintenance includes checking connections, fluid level in batteries,
shading of modules.
Solar cells are long lasting sources of energy which can be used almost anywhere. They
are particularly useful where there is no national grid and also where there are no people
such as remote site water pumping or in space. Compared to other renewable sources of
energy, solar cells possess many other advantages; wind and water power rely on
turbines which are noisy, expensive and liable to breaking down. Solar cells can easily be
installed on roofs which mean that no new space is needed and each user can quietly
generate their own energy. They are usually placed where the electricity is used, meaning
much shorter wire runs than if power is brought in from the utility grid. In addition, using
solar cells eliminates the need for a step-down transformer from the utility line. Few wires
mean lower costs and shorter construction time.
The main burden of solar energy (photovoltaic) is the initial cost. Most types of solar cells
require large areas of land to achieve average efficiency. Air pollution and weather can
also have a large effect on the efficiency of the cells. The silicon used is also very
expensive and the problem of nocturnal down times means solar cells can only ever
31
generate power during daytime. The entire process of solar cell manufacture is still very
expensive as silver used for interconnections of these cells in the panel is a very
expensive metal. A practical problem linked with the use of solar cell panels is regarding
the storage of electricity generated by them. The electricity generated by solar cell panels
is stored during the day with the help of storage batteries which give only direct current.
So there is need to convert DC to AC to operate AC appliances.
The manufacture of solar cells requires toxic metals such as lead, mercury, and cadmium
and produces carbon dioxide, which contributes to environmental hazards. Though the
use of solar cells themselves does not pollute the environment, the process of
manufacturing the cells, disposal of facilities used for storage of electricity produced, and
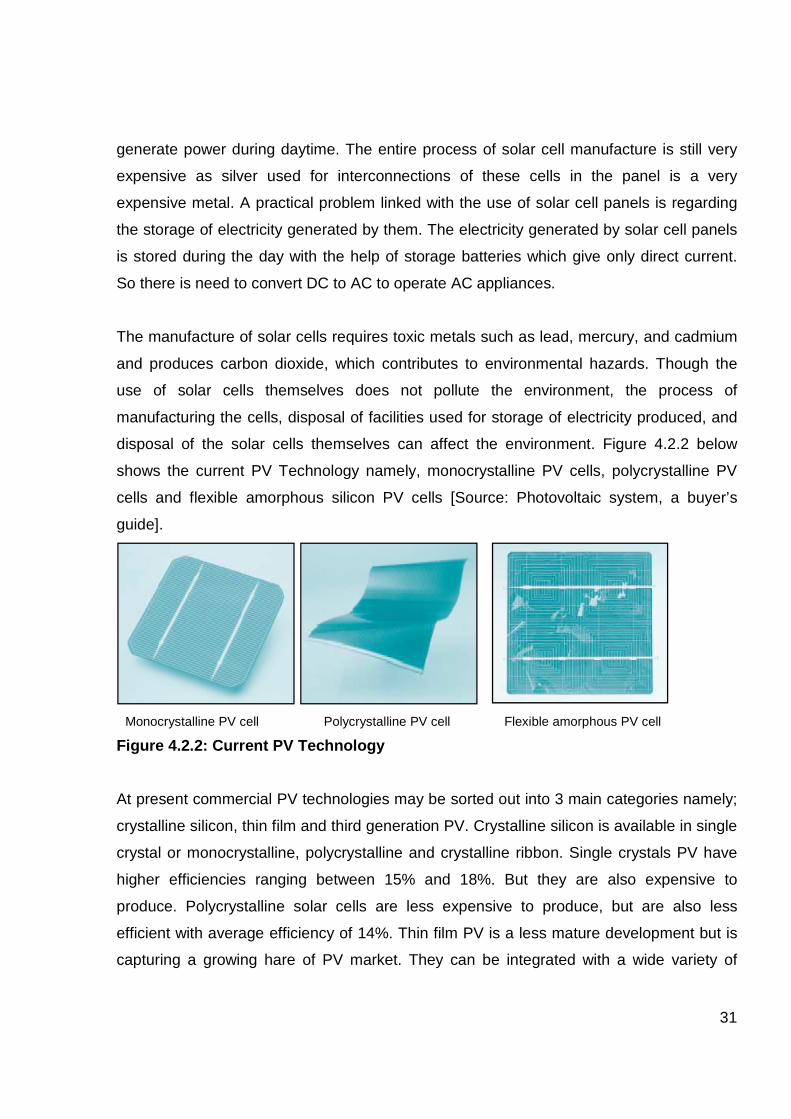
disposal of the solar cells themselves can affect the environment. Figure 4.2.2 below
shows the current PV Technology namely, monocrystalline PV cells, polycrystalline PV
cells and flexible amorphous silicon PV cells [Source: Photovoltaic system, a buyer’s
guide].
Monocrystalline PV cell Polycrystalline PV cell Flexible amorphous PV cell
Figure 4.2.2: Current PV Technology
At present commercial PV technologies may be sorted out into 3 main categories namely;
crystalline silicon, thin film and third generation PV. Crystalline silicon is available in single
crystal or monocrystalline, polycrystalline and crystalline ribbon. Single crystals PV have
higher efficiencies ranging between 15% and 18%. But they are also expensive to
produce. Polycrystalline solar cells are less expensive to produce, but are also less
efficient with average efficiency of 14%. Thin film PV is a less mature development but is
capturing a growing hare of PV market. They can be integrated with a wide variety of

32
useful substances such as plastic and glass that make them suitable for building
integrated PV (BIPV) application that serve double duty as both power sources and
structural components. Key thin film technologies include amorphous silicon, copper
indium selenide and its alloys such as copper indium gallium selenide, cadmium telluride
and mult-junction designs such as gallium arsenide. These have reached a conversion
efficiency of 30%. Thin film solar technologies were originally developed as low cost
terrestrial power generation.
4.3. Solar PV installation in rural areas of developing countries
Solar Photovoltaic, mainly through the use of solar home systems (SHS), has been one of
the primary applications targeted for meeting the access agenda through renewable
energy. By 2004 more than 1.9 million households in developing countries were receiving
electricity from solar home systems [Renewable Global Status, 2005]. Rural electrification
programs in several countries, particularly in Latin America, are explicitly incorporating
large-scale investment in solar home systems for some of the homes to be electrified.
Governments are recognizing geographical rural areas that are “non-viable” for grid-
extension, and enacting explicit policies and subsidies for renewable in these areas to
supplement line extension electrification programs. Examples of countries in Latin
America with such policies include Brazil, Chile, Cuba, Mexico, Bolivia, Guatemala,
Nicaragua, the Dominican Republic, and Peru. Asian examples of countries with explicit
mandates for renewable energy for rural electrification are India, China, Sri Lanka,
Thailand, Philippines, Indonesia, Bangladesh, and Pakistan.
Africa, with its very low rural electrification rates and low per-capita Gross Domestic
Product (GPD), has not seen significant growth in solar home systems with the exception
of a few countries. A good example is that of Morocco and South Africa. Other countries in
Africa include Tunisia, Ethiopia, Uganda, and Kenya. Table 4.3 below shows estimated
number of solar Photovoltaic systems disseminated in selected African countries by 2005.

33
From the table it can be shown that Kenya is one of the leading countries in solar systems
in Southern Africa.
Country Number of
Systems
Estimated installed
capacity (KWp)
Angola 200 10
Botswana 5,700 1,500
Ethiopia 5,000 1,200
Kenya 150,000 3,600
Mozambique 1,000 100
Malawi 900 40
Swaziland 1,000 50
Tanzania 2,000 300
Uganda 3,000 152
Zambia 5,000 400
Zimbabwe 84,500 1,600
Table 4.3; estimated number of solar PV systems in selected African countries
[Source: Renewable Global Status, 2005b].
4.3.1. Status of solar PV Technology in Zambia .
Recent studies such as the “Rural Electrification Master Plan” (REMP) by Japan
International Development Co-operation Agency (JICA) have shown that the use of solar
energy in Zambia is currently limited. Most installations are attributed to government and
donor supported projects with a focus on PV solar systems for provision of small power to
social and health sector infrastructure mostly in the rural areas of the country. Outside the
social and health sectors, major solar projects are limited. The projects include Energy
Services Companies (ESCOs) established in Nyimba, Chipata and Lundazi, in the

34
Eastern province with financing from the Swedish International Development Agency
(SIDA).
From a technological perspective, the use of solar energy has mostly been restricted to
stand-alone PV systems. However some local companies have started to explore solar
thermal applications. For instance, Solartech (Zambia) Ltd is currently involved in the
manufacture of solar stoves and solar geysers. Further to the above, the Ministry of
Energy and Water Development (MEWD) is currently working with United Nations
Industrial Development Organization/Global Environmental Facility (UNID/GEF) to
establish a solar min-grid in Chinsanka in Samfya district of Luapula province. Apart from
this, the solar projects recently implemented in Zambia include the following;
Solar PV systems [ESCOs]
Energy Services Companies (ESCOs) were established in Eastern province with the
support of SIDA around the year 2000. Three ESCOs located in the rural towns of
Nyimba, Chipata and Lundazi are providing solar energy services to private and
commercial customers. Under the project, 400 SHS were installed as follows; Nyimba
Energy Services Company (NESCO)-100 units, Chipata Energy Services Company
(CHESCO)-150 units and Lundazi Energy Services Company (LESCO)-150 units.
Electrification of Chiefs’ Palaces and Rural School s [MEWD]
In 2005, the Ministry of Energy and water Development through the Department of Energy
(DoE) embarked on the project of electrifying chiefs’ palaces and rural schools using solar
energy. The project was a government initiative to provide chiefs’ palaces with electricity.
For those who could not immediately be connected to the national grid, solar home
systems were found to be a suitable alternative. Government carried out the installation of
75/80Wp SHS in 207 locations, which include 165 residents of local leaders and 42
schools using the Rural Electrification Fund (REF) and Solar-Funds from the DoE. In May
2005, 8 schools in Senanga and Mongu in Western province were targeted. The funds
were used to cover the cost of PV systems equipment and installation only.

35
Electrification of Rural Government Institutions [Z AMSIF]
The Zambia Social Investment Fund (ZAMSIF) is a project that was implemented by the
Ministry of Finance and National Planning (MFNP) with support from the World Bank. The
objective of ZAMSIF project was to supply power to Government social infrastructure such
as schools and health centers. Using funds from the World Bank, about 750 SHS of
various sizes were installed in various parts of the country.
Gwembe-Tonga electrification project [ZESCO]
The objective of the Gwembe-Tonga project was to facilitate provision of services
including electricity to people who were displaced during the construction of the Kariba
Dam. Therefore, as part of the project, ZESCO supplied and installed PV systems to
remote areas were the grid could not be extended. Under this project, PV systems were
installed at two (2) rural clinics and a total of five (5) staff houses.
The Rural Electrification Authority (REA) established under the act of Parliament in 2003
is mandated to promote the utilization of the available rural electrification technological
options to enhance the contribution of energy to the development of various economic
activities in rural areas. REA is promoting the utilization of renewable forms of energy
such as solar energy. It has embarked on an aggressive program of installing photovoltaic
solar home systems in rural communities in order to supplement the power supply from
the ZESCO network. REA is currently installing solar home systems in chiefs’ palaces,
selected rural school, rural health centers, and other social facilities in all provinces of
Zambia. 85Wp solar modules have been installed at chiefs’ palaces in all the provinces of
Zambia and in various schools and rural health centers in some provinces under the solar
program of Rural Electrification [MEWD, 2008].
In addition, the Ministries of Education and Health have installed a total of 475 and 584
solar PV systems in various Rural Schools and Rural Health centers respectively, which
are not served by the grid, as a measure to sustain energy back up system.

36
4.4. Electricity production from hybrid power syste ms
The term Hybrid power system is used to describe any power system with more than one
type of generator usually one of the generators employed is a conventional one powered
by a diesel engine, while the other(s) would be renewable for example, solar Photovoltaic,
wind, or hydro. These renewable energy sources provide a realistic alternative to
supplement engine driven generators for electricity generation in off-grid remote areas.
Hybrid power systems capture the best features of each energy resource and can provide
‘grid-quality’ electricity, with a power range from one Kilowatt to several hundred Kilowatts.
They range from small systems designed for one or several homes to very large ones for
remote Island grids or large communities. Hybrid power systems use local energy
resource to provide power. The role of integrating renewable energy in a hybrid power
system is primarily to save diesel fuel. Potential hybrid power systems include
photovoltaic (PV), wind, micro-hydro, river-run hydro, biomass, batteries and conventional
generators or (fuel cell generation combined with micro turbine). In this case the PV and
batteries limit the diesel fuel consumption while the diesel generator allows for smaller PV
and battery components, which reduces the system costs. Thus hybrid power systems
can address limitations in terms of fuel flexibility, efficiency, reliability, emissions and
economics. They are seen as a way of providing power to the many remote communities
in the developing world where the costs for large scale expansion of electrical grid is
prohibitive and the transportation costs of diesel fuel are also very high. Hybrid energy
systems can significantly reduce the total life cycle cost of stand alone power supplies in
many off-grid situations, while at the same time providing a reliable supply of electricity
using a combination of energy sources. Further more, these systems can also be used as
an effective backup solution to the public grid in case of blackouts or weak grids and for
professional energy solutions such as telecommunication stations or emergency rooms at
hospitals. The table in Appendix F illustrates typical examples of hybrid power installations
in the World.
• A typical example of the cost of wind-solar hybrid system of capacity 1.2KW
supplying 3-5KWh per day of 220V AC, 50Hz power can be approx. US$5,900
[Source: www.bergey.com/Products/VPkgHybrid.htm. Accessed 04/05/09

37
• Wind Turbines for Hybrid system in the range of 300W to 750 KW may have
installed cost of $3 to $6 / W. Capital costs of medium penetrating Wind-Diesel
Hybrids may range between $ 1,500 to $2,500 per KW of wind capacity, excluding
diesel units and plant Balance of Support (BOS).
4.5. “Data collection” on solar PV panels and solar electricity storage
devices available on the Zambian market
4.5.1. Types of solar PV panels on the Zambian mark et
While photovoltaic panels are based on a similar structure of cells and enabling
components, there are many variations on the standard solar panel, differing primarily in
the types of photovoltaic cell that they use. Each panel type is manufactured in a different
way and has its own advantages and disadvantages.
The vast majority of solar panels produced today depend on the use of crystalline silicon
as the material in their cells. Crystalline silicon is used in monocrystalline (or single-
crystalline), polycrystalline (or multicrystalline), and ribbon (or thin-layer) silicon panels.
Other panels, like thin-film technologies, depend on amorphous silicon, and still others
use completely different semiconductors known as Group III-IV materials. Panels can also
be enhanced in a number of ways to increase their efficiency or improve their versatility
through the use of multijunction devices, concentrator systems, or building integrated
systems. Table 4.5.1, shown below is a collection of some of the different types of solar
panels available on the market today; their efficiencies, cost, life span as well as the
companies that manufacture them.

38
Type of Panel Efficiency %
Capacity Wp
Cost US$ Life span years
Manufacturer
Moncrystalline silicon
15-18
20 181
Approx. 25
Phaesun 26 210 SunTech(China) 30 238 ET Solar 40 307 Kyocera 54 350 Kyocera 65 440 Kyocera 85 550 Kyocera 130 880 Kyocera
Polycrystalline silicon
12-14 30 84 Approx. 25
Amorphous silicon
5 - 6 14 86 Free Energy, Europe 36 213
45 342
Table 4.5.1; Solar PV panels available on the Zambi an marke; [Source: SunTech
Appropriate Technology/Battery Express; Lusaka, Zam bia.]
Figure 4.5.1 below shows examples of solar PV modules made from, poly-crystalline,
mono-crystalline, and amorphous silicon. Source: [Socrates Kaplanis, 2006]
Poly – crystalline silicon Mono -crystalline silicon Amorphous silicon
Figure 4.5.1. Common Solar PV modules on the marke t.
39
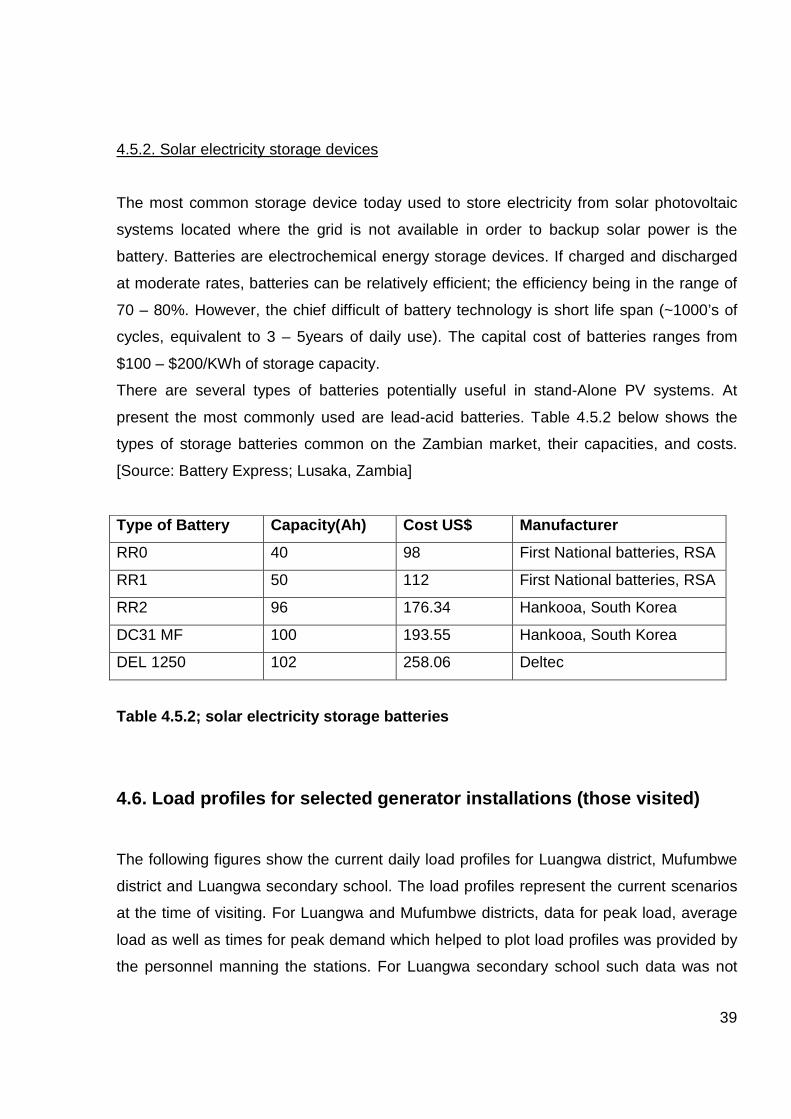
4.5.2. Solar electricity storage devices
The most common storage device today used to store electricity from solar photovoltaic
systems located where the grid is not available in order to backup solar power is the
battery. Batteries are electrochemical energy storage devices. If charged and discharged
at moderate rates, batteries can be relatively efficient; the efficiency being in the range of
70 – 80%. However, the chief difficult of battery technology is short life span (~1000’s of
cycles, equivalent to 3 – 5years of daily use). The capital cost of batteries ranges from
$100 – $200/KWh of storage capacity.
There are several types of batteries potentially useful in stand-Alone PV systems. At
present the most commonly used are lead-acid batteries. Table 4.5.2 below shows the
types of storage batteries common on the Zambian market, their capacities, and costs.
[Source: Battery Express; Lusaka, Zambia]
Type of Battery Capacity(Ah) Cost US$ Manufacturer
RR0 40 98 First National batteries, RSA
RR1 50 112 First National batteries, RSA
RR2 96 176.34 Hankooa, South Korea
DC31 MF 100 193.55 Hankooa, South Korea
DEL 1250 102 258.06 Deltec
Table 4.5.2; solar electricity storage batteries
4.6. Load profiles for selected generator installat ions (those visited)
The following figures show the current daily load profiles for Luangwa district, Mufumbwe
district and Luangwa secondary school. The load profiles represent the current scenarios
at the time of visiting. For Luangwa and Mufumbwe districts, data for peak load, average
load as well as times for peak demand which helped to plot load profiles was provided by
the personnel manning the stations. For Luangwa secondary school such data was not

40
available. So a detailed survey of the energy use by the school community was
conducted.
Figure 4.6a; Load profile for Luangwa district
Luangwa district is located in the Eastern part of the country in Lusaka rural, some 313
Km from the city of Lusaka. At the time of visit the number of customers served by the
generator was 263. Electricity to the customers is supplied for a period of 21 hours per
day starting at 15:00 hours till 12:00 hours the following day. As figure 4.6a above
illustrates, the generator is shut down from 12:00 hours to 15:00 hours daily. The demand
for power increases from about 06:00hours to 12:00hours; and then from 15:00hours to
about 21:00hours. Daily activities that contribute to high demand for power include
welding, battery charging and hammer mills for grinding maize grain.

41
Figure 4.6b; Load profile for Mufumbwe district
Mufumbwe is located in North Western province of Zambia some 270 Km South-West of
the provincial capital, Solwezi. At the time of visit, Mufumbwe, a fast growing rural district,
had a customer base of 300. Electricity is provided to the customers for a period of
18hours daily starting from 06:00 hours to 00:00 hours. Figure 3.6.2 above shows that the
demand for power is highest during the times 06:30 hours to 08:30 hours, then
11:00hours to about 13:00 hours and finally from 18:30 hours to about 21:00 hours. Like
Luangwa district, the daily activities that contribute to high demand for power include
welding, battery charging and hammer mills for grinding maize grain.
Figure 4.6c; Load profile for Luangwa secondary sch ool (Luangwa district)
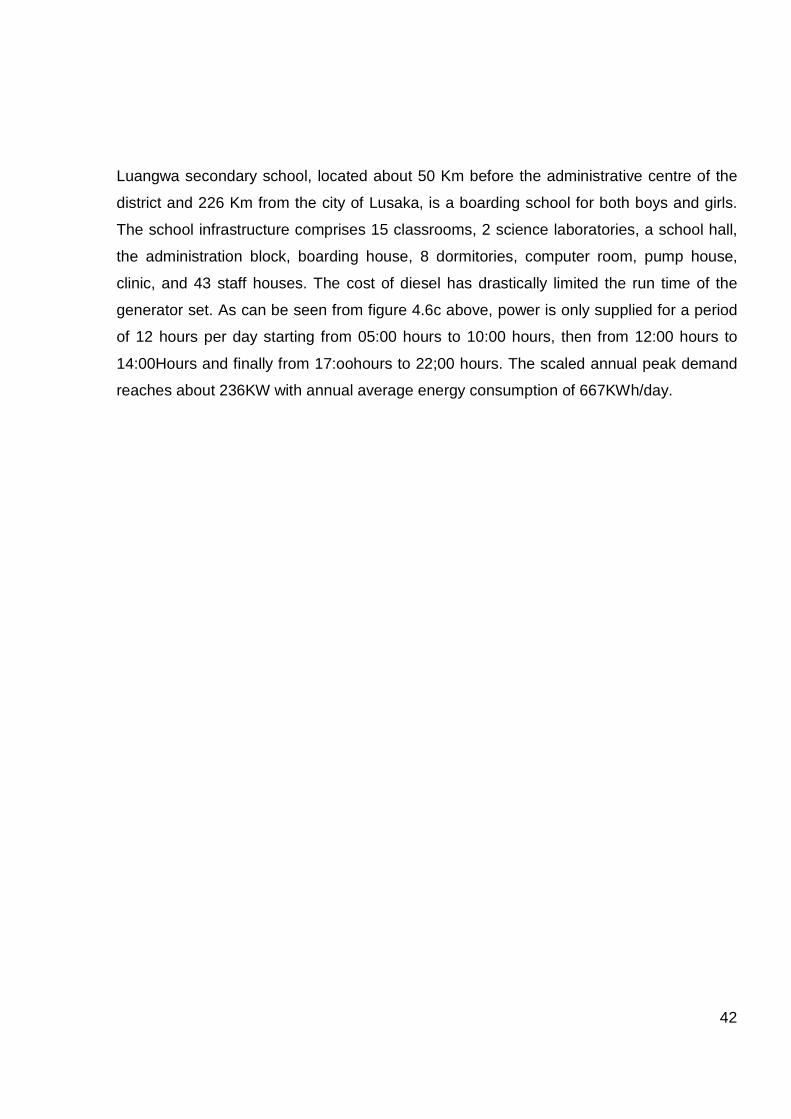
42
Luangwa secondary school, located about 50 Km before the administrative centre of the
district and 226 Km from the city of Lusaka, is a boarding school for both boys and girls.
The school infrastructure comprises 15 classrooms, 2 science laboratories, a school hall,
the administration block, boarding house, 8 dormitories, computer room, pump house,
clinic, and 43 staff houses. The cost of diesel has drastically limited the run time of the
generator set. As can be seen from figure 4.6c above, power is only supplied for a period
of 12 hours per day starting from 05:00 hours to 10:00 hours, then from 12:00 hours to
14:00Hours and finally from 17:oohours to 22;00 hours. The scaled annual peak demand
reaches about 236KW with annual average energy consumption of 667KWh/day.

43
5. METHODOLOGY
5.1. Assessing operations of diesel generators in t he areas visited and
selection of the site for the case study.
Three (3) off-grid diesel power stations in remote areas of Zambia were visited. These are
Luangwa district in Lusaka rural; Mufumbwe district in North western province and
Luangwa secondary school also located in Luangwa district of Lusaka rural some 50Km
from the administrative centre of the district.
To get a general picture of the operations of these generator sets in these areas, a
questionnaire was randomly distributed to a sample of 50 customers. Another
questionnaire was given to the personnel manning the power houses to get the difficulties
they encounter. This was only done to Mufumbwe and Luangwa districts. Customers
picked at random included various shop owners, civil servants, small scale farmers and
fishermen in case of Luangwa district. A personal interview to assess the operation of the
generator set at Luangwa secondary school was conducted separately with the members
of staff. In each of these cases the power house was visited. Figure 5.1a and figure 5.1b
below show the generators and power house and, ZESCO branch office at Mufumbwe.
Figure 5.1 a; Mufumbwe power house showing generat or set. Picture taken on
10/06/2009

44
Figure 5.1 b; Zesco branch office at Mufumbwe; pict ures taken on 10/06/2009
Figure 5.1c below shows the generators and power house at Luangwa secondary school.
Figure 5.1c; power house and generator at Luangwa s econdary school (the
gentleman in the foreground is a member of staff at the school captured studying
the calculation worksheet for daily energy consumpt ion for staff houses; picture
taken on 16 th Sept 2009)
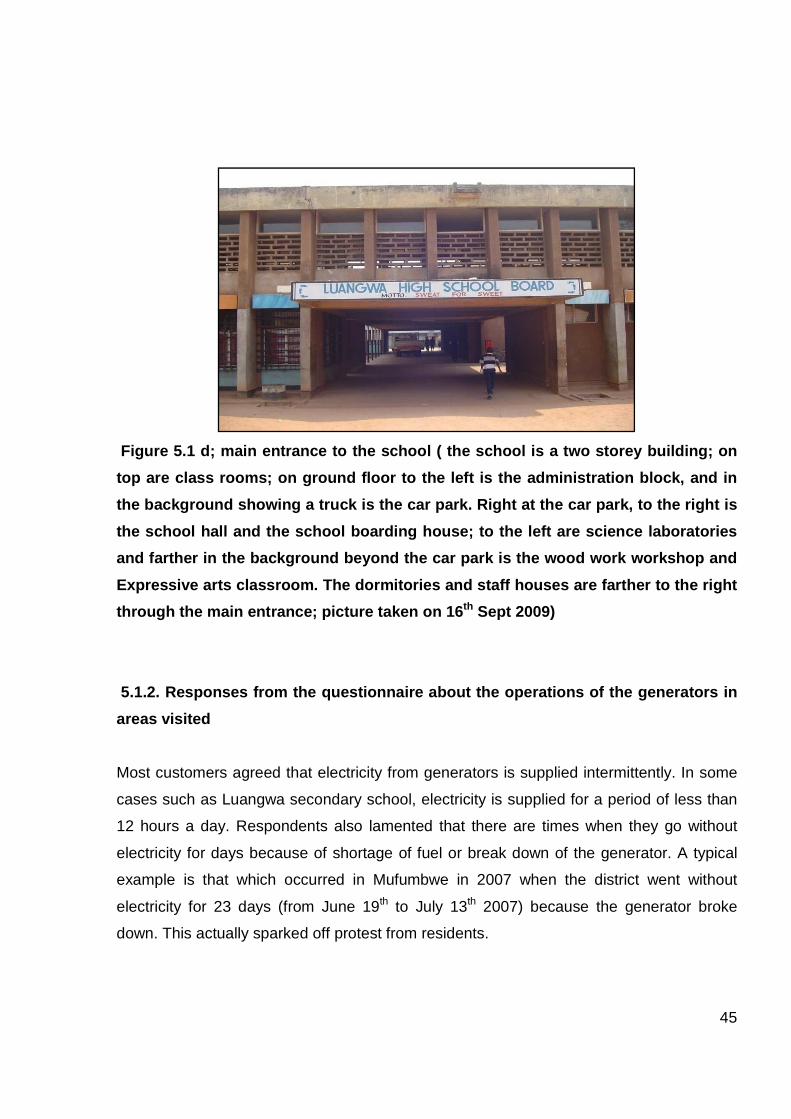
45
Figure 5.1 d; main entrance to the school ( the sc hool is a two storey building; on
top are class rooms; on ground floor to the left is the administration block, and in
the background showing a truck is the car park. Rig ht at the car park, to the right is
the school hall and the school boarding house; to t he left are science laboratories
and farther in the background beyond the car park i s the wood work workshop and
Expressive arts classroom. The dormitories and staf f houses are farther to the right
through the main entrance; picture taken on 16 th Sept 2009)
5.1.2. Responses from the questionnaire about the operations of the generators in
areas visited
Most customers agreed that electricity from generators is supplied intermittently. In some
cases such as Luangwa secondary school, electricity is supplied for a period of less than
12 hours a day. Respondents also lamented that there are times when they go without
electricity for days because of shortage of fuel or break down of the generator. A typical
example is that which occurred in Mufumbwe in 2007 when the district went without
electricity for 23 days (from June 19th to July 13th 2007) because the generator broke
down. This actually sparked off protest from residents.
46
The biggest challenge on the part of the personnel manning the stations is that of
maintenance. Maintenance schedules for generators can be quite tight such that a
machine can not be taken out for maintenance with out compromising the reliability supply
of electricity. In most cases the operators have to rely on external skilled manpower to fix
spare parts. For example the school administration at Luangwa secondary school has to
hire experts every time they need major repairs. Diesel fuel storage capacity is another
problem faced by these power stations. For instance Mufumbwe has a storage capacity of
45,000 liters against a daily fuel consumption of 900 liters per day meaning a constant fuel
supply of 45,000 liters every seven weeks for normal operation. The operations of these
stations are also hampered by lack of transport. Each station has only a small van. Diesel
fuel cost is another major source of concern. On average only 10% is realized as revenue
out of 100% in terms of diesel fuel input. This applies to stations where ZESCO supplies
power to customers. So to save fuel and maintenance costs the time of operation of the
generators have been drastically reduced in these areas.
After a tour of the above diesel power plants mentioned, one station was selected for the
case study. After a careful consideration of all the factors that warrant a hybrid power
system installation as described below, Luangwa secondary school was picked for the
study. At the time of visit Luangwa secondary school had no record of the daily load. So a
detailed survey of the energy consumption had to be conducted. This meant designing a
load calculation work sheet for both staff houses and other school infrastructure. This also
meant going round from house to house to assess the use of household electrical
appliances. The same was done for classrooms, offices, and dormitories.

47
5.2. Selection of the site(s) for the case study-
5.2.1. Reason for choosing Luangwa secondary school
Luangwa secondary school lies with in latitude -15.6o N and longitude 30.4o E. It has a
higher solar isolation averaging 5.64KWh/m2/day annually and an air temperature of
23.8o C annually [RET screen International]. The site is located in Luangwa National park
which means that human life may be at great risk from wild animals particularly at night
when there is no power because the generator is shut down in order to save fuel. The
limited generator run time has also affected studies as pupils can only study up to 22:00
hrs. Therefore there is need for 95% power availability at this site, partly for security
reasons. Being in the valley, mountains and the river are the major barriers to the
extension of the grid, apart from the cost. Though the site has access to the river, the river
course in this region of the valley may not have the potential for hydropower development.
Access to the site is difficult because of poor road infrastructure especially in the rain
season when the road becomes almost impassable. So regular fuel delivery becomes
difficult even if it may be available.
The site is relatively small comprising the school buildings with 15 classrooms, the school
hall which also serves as the dining hall, an administration block housing the staffroom,
the Head’s, deputy Head’s, secretary’s and the school accounting officer’s offices. There
is also the school library, a computer room, two science laboratories, and an industrial arts
room. Being a boarding school, it has 8 dormitories 4 for boys and 4 for girls. There is a
clinic to provide health services to the school community, a school tuck shop and 43 staff
houses accommodating both the teaching and auxiliary staff.

48
6. DATA COLLECTION AND PRESENTATION 6.1. Current scenario at Luangwa secondary school
Climate data
• Latitude -15.6o N
• Longitude 30.4o E
• Elevation 735 m above sea level
• Air temperature annual average 23.8oC
• Earth temperature annual average 25.9oC
• Relative humidity annual average 52.8%
• Atmospheric pressure annual average 93.2Kpa
• Wind speed annual average 3.6m/s
• Daily solar radiation ( horizontal ) annual average 5.64KWh/m2/day
[Source: RET Screen international, clean energy project analysis software]
There are two generators currently; a 400KW Volvo Penta and a 200 KW, Cummins. Only
the 400KW generator was currently in operation at the time of visit. The generator runs for
a period of 11 hours 30 minutes a day starting at 05:30 hrs to 10:00 hours; then from
12:00 hours to 14:00 hours and finally from 17:00 hours to 22:00 hours. All this has been
done to reduce on the cost of fuel and maintenance of the generator. A survey conducted
to determine the current electrical energy consumption by the residents of Luangwa
secondary school brought out the following;
• 70% of the households use electricity for cooking and 30% use biomass (charcoal)
• Of the 70% of the house holds who use electricity for cooking, 27% have 4 plate
cookers, 20% single hot plates and, 53.33% own double hot plates. The school
community does not pay for electricity. The entire cost of electricity is met by the
Government through the ministry of Education.

49
• All house holds have color TV sets with sizes ranging from 14 inch to 21 inch.
However the majority are the 21 inch color TV sets with wattage ranging from 50 to
70W depending on the model
• Luangwa being located in the valley, temperatures are quite high most time of the
year so about 90% of the house holds own portable electric fans with average
wattage 75W
• All house holds have radio cassette recorders with wattage ranging from 45 to 85W
• All house holds own freezers -most common is the 210 lit deep freezer
• 80% of the house holds have electric pressing irons while about 70% have cell
phone chargers
• Of all the house holds with TV sets, 30% also own satellite dishes, most common,
free to air.
• 60% of those who own TV sets also have either DVD player/recorder or VCR
• Only 25.6% of the house holds own electric kettles.
• Each house hold has on average 8 electric light bulbs- mostly 100 W bulbs.
• The use of school facilities such as lighting and computers are restricted by
generator run time
• The school boarding house uses biomass (fire wood) for cooking
To assess the current energy consumption by the school community, a load calculation
worksheet containing common household electrical appliances (appendix G) for daily
energy consumption was distributed to each house hold. The staff was asked to state the
number of hours they use these appliances on average per day as dictated by generator
run time. Table 6.1a below illustrates the number of households using particular
appliances during specific periods on average per day (the figures in this table may vary
from time to time depending on circumstances. The use of appliances is also restricted by
generator run time). Tables 6.1b and 6.1c in appendix A show the current daily energy
consumption for school and for staff houses. Figure 6.1a below shows the current major
activities that contribute to energy consumption and the percentage contribution by each
activity to the total energy consumed per day. Figure 6.1c is the school current load profile
generated by Homer software.

50
Number of house holds using particular appliance s
Appliance Morning
06hr -10hrs
Mid-morning
12 hrs – 14hrs
Afternoon
14hrs – 17hrs
Evening
18hrs – 22hrs
Television set 4 43
Decoder 13
DVD player/recorder 4 18
4 plate cooker 3 8 8
2 plate hot stove 8 16 16
1 plate hot stove 4 6 6
Radio cassette 18 15
Electric kettle** 11
Pressing iron* 12 22
Cell phone
charger***
35
Deep freezer 43 43 43
Portable electric fan 22
Light bulbs 43
Tables 6.1a; Number of households using particular appliances on average per day
–current scenario
* Pressing irons are mainly used at the week end and mid-week after the washing and
mostly in the evenings. The time of use vary from one to two hours depending on the
amount of clothes to iron.
** Electric kettles are used when there is an urgent need e.g. boiling water for tea in the
morning. This can range from 3 – 4 times a week and on average 15minutes at a given
time.
*** Cell phones chargers are used about 2 or 3 times a week for a period of about 1 hour
on average [Source: teaching and auxiliary staff of Luangwa secondary school, 2009 a]

Figure 6.1a: daily activities and
consumption- current scenario
Figure 6.1b ;
The daily sum of electrical energy consumption by the school and staff houses from table
6.1b and table 6.1c in appendix A is 138,325.71 watt
respectively. Thus the daily total sum for both the school and staff houses is
watt-hours
Entertainment
Water pumping
27%
Major contributions to energy consumption by
daily activities and percentage contribution to total
current scenario
; Current load prof ile for Luangwa Secondary School
The daily sum of electrical energy consumption by the school and staff houses from table
6.1b and table 6.1c in appendix A is 138,325.71 watt-hours and 379,804.46 watt
respectively. Thus the daily total sum for both the school and staff houses is
Cooking and
Refrigeration
and use of fan
14%
Entertainment
5%
Water pumping
27%
Computer and
printing
4%
Major contributions to energy consumption by activity-current situation
51
percentage contribution to total energy
ile for Luangwa Secondary School
The daily sum of electrical energy consumption by the school and staff houses from table
hours and 379,804.46 watt-hours
respectively. Thus the daily total sum for both the school and staff houses is 518,130.37
Cooking and
heating
50%
Major contributions to energy consumption by

52
6.2. Life cycle cost (LCC)
Life cycle cost is the cost of owning and running a system or equipment over its life time.
The life cycle cost can be divided into;
• Capital cost: This is the cost paid while purchasing the system or equipment.
• Operation and maintenance cost: This is the cost incurred for running the
equipment. This could be regular maintenance cost or it could be fuel cost
• Replacement cost: This is the cost incurred if any component of the system or the
equipment itself needs to be replaced before the life of the system ends.
Thus the LCC includes all associated costs of the system that can be incurred over its life
time. The life cycle cost can be used to evaluate different designs of PV systems having
the same functionality. The design with lowest LCC is then chosen. In general LCC can be
used to make a decision on the purchase of any other system or appliance. For instance,
LCC can be used to decide whether to buy an expensive refrigerator with high efficiency
or a cheap one with low efficiency.
In order to calculate the LCC, three cost components should be known at the time when
investment decision is made. Of course the component of capital cost is known at the time
of investment but other two cost components, operation and maintenance cost and the
replacement cost occur in future. For these costs, estimation in terms of current value of
money or present worth of future investment is required.
� Time value of money: Since the costs is calculated for the lifetime of the system
(which could be long period e.g. up to 30 years in case of PV systems) it is
important to consider the time value of money. This means that the increase or
decrease on the value of money over the system’s lifetime needs to be considered.
There are two ways in which the value of money over time changes i.e. inflation
and interest (more appropriately termed as discount rate).
� Inflation, i: The inflation, i, is a measure of the decline in the value of money over
time. Thus if inflation rate is, say, 5%, the value of money will decrease by 5% in a
year and compared to today a product would cost 5% more in the next year. If the
cost of a product today is, say, Co, then its cost a year later will be Co (1+i). Two
years later the cost of the same product will be Co (1+i)2 ; where i should be

53
inserted in decimal. If this logic is extended to n years, the future cost of the
product due to inflation rate, i , is given by; C(n) = Co (1+i)2
� Discount rate, d: The value of money over time may increase due to the interest it
can earn. Discount rate gives the rate at which the value of money saved
increases. If, say ‘X’ is the amount of money today, it will have some purchasing
power. The purchasing power of this ‘X’ amount of money will be higher next year
due to the interest that it will earn. This money has increased its value with time.
The increase in value of money over ‘n’ years, M(n) due to discount rate, d can be
expressed as; M(n) = M0 (1+d)n ; where M0 is the amount at present and d is
represented as decimal.
The inflation rate and the discount rate are used to find out the present worth of future
investment, useful in calculating life cycle cost. The future investment could be on
replacement of components (which are one time investment e.g. batteries in a PV system)
or the future investment could be on operation and maintenance (which are recurring in
future e.g. diesel in generator set). Equations for calculating the present worth of future
one time investment and present worth of future recurring investment are shown in
appendix C. [Source: www.Photovoltaic.sandia.gov/docs/A Handbook.html. Accessed
03/02/11]. Evaluation of the LCC for the 100% solar PV system is manually done here by
applying the present worth factor as explained above while evaluation of LCC for the three
hybrid points and the 100% diesel-base case is done using Homer ; a micro power
optimization modeling tool.
HOMER [Hybrid Optimization Model for Electric Renewable] is a computer model
developed by the US national renewable energy [NREL] to assist in the design of micro
power systems and facilitate the comparison of power generation technologies across a
wide range of applications. Homer models a power system’s physical behavior and its life
cycle cost. Homer allows the modeler to compare many different design options based on
their technical and economic merits. Homer performs three principal tasks;
• Simulation
• Optimization
• Sensitivity

54
In simulation, Homer models the performance of a particular micro power system
configuration each hour of the year to determine the technical feasibility and life cycle
cost. The soft ware can simulate a wide variety of micro power system configurations,
comparing any combination of a PV array, one or more wind turbines, a run-of-river hydro
turbine, and up to 3 generators, a battery bank, and an AC-DC converter. Homer models
a particular system configuration by performing an hourly time series simulation of its
operation over one year. Homer steps through the year one hour at a time, calculating the
available renewable power, comparing it to the electric load, and deciding what to do with
surplus renewable power in times of excess, or how best to generate additional power in
times of deficit. When it has finished one year’s worth of calculations, Homer determines
whether the system satisfies the constraints imposed by the user on such quantities as
the fraction of the total electrical demand served, the proportion of power generated by
renewable sources or the emissions of certain pollutants. Homer also computes the
quantities required to calculate the system’s life-cycle cost such as the annual fuel
consumption, annual generator operating hours and the expected battery life time. The
quantity Homer uses to represent the life cycle cost of the system is the total net present
cost [NPC]. This single value includes all costs and revenues that occur within the project
life time with future cash flow discounted to the present. The total net present cost
includes the initial capital cost of the system components, the cost of maintenance and
fuel.
Where as the simulation process models a particular system configuration, the
optimization process determines the best possible system configuration. Thus in the
optimization process, Homer simulates many different system configurations, discards the
infeasible ones (those that do not satisfy the user specified constraints), ranks the feasible
ones according to the total net present cost and presents the feasible ones with the lowest
total NPC as the optimal system configuration. When sensitivity variables are defined as
in puts, Homer repeats the optimization process for each sensitivity variable that is
specified. For example, if wind speed is defined as a sensitivity variable, Homer simulates
the system configuration for the range of wind speeds that are specified. One of the
primary uses of sensitivity analysis is in dealing with uncertainties. If for example a system
designer is unsure of the value of a particular variable, values covering the likely range
can be entered and results varying across that range can be easily seen. Other

55
applications of sensitivity analysis include evaluating trade offs by the system designer,
determining which combinations of technologies are optimal under different conditions by
an energy planner and determining the level of incentive needed to simulate the market
for a particular technology, or what level of emissions penalty would tilt the economics
toward cleaner technologies by a policy analyst. Figure 6.2a shown below is a graphical
illustrating of how Homer models different combinations of energy technologies. [Source:
http://www.nrel.gov/homer. Accessed 5th May 2010]
Figure 6.2a; extract of combination of different en ergy technologies modeled by
Homer
To calculate the life cycle cost per KWh of a solar photovoltaic system, basic components
such as solar panels, batteries, inverters, and charge controllers must be considered.
Kaplanis (2006) proposes three basic factors to take into account when sizing a
photovoltaic system;
1) the solar insolation of the site
2) the daily power consumption (Wh) and the types of electric loads to be
powered
3) the storage system to contribute to the system’s energy independence for a
certain period of time

56
The solar insolation at the site at any time is important because the amount of electrical
energy produced by a PV-array depends primarily on the insolation at a given location and
time. For Luangwa the annual average solar radiation is 5.64KWh/m2/day. Figure 6.2
below shows variation in daily solar radiation for Luangwa generated using homer. The
values shown are daily monthly averages. The red line crossing the bars is the clearness
index.
Figure 6.2b; variation in daily solar radiation at Luangwa
Concerning the loads, Kaplanis (2006) further suggests getting the proper information on
the data according to the appliances to be powered by the PV generator. Such loads
could be domestic appliances like TV sets, lighting, refrigerator, vacuum cleaners washing
machines, coffee machine etc. The power rating on the appliance is used to calculate its
power consumption in watts (where amperage and voltage are shown only; the wattage is
obtained by multiplying amps by voltage).
Next the number of hours the appliance is expected to operate on average per day is
multiplied by the wattage to obtain watt-hour (Wh). For complex loads such as powering
the whole house all different loads in the house on a typical day are estimated and
summed up. This can be extended to a setting where there is more than one house to be
connected to a min-grid. Table 6.2 below illustrates an example of the columns that
should be contained in a calculation worksheet for a stand-alone electric load typical of
house holds as proposed by Kaplanis (2006).
0.0
0.2
0.4
0.6
0.8
1.0
Jan Feb Mar Apr May Jun Jul Aug Sep Oct Nov Dec0
1
2
3
4
5
6
7
Daily
Radi
atio
n (k
Wh/
m²/d
)
Global Horizontal Radiation
Cle
arn
ess
Ind
ex
Daily Radiation Clearness Index

57
Applia
nce
QTY Run
watt
Adjusted
wattage
Hours per
day
Days in
a week
Watt-
Hour
Surge-
watt
Phantom-
loads
A B C D E F G H I
Table 6.2; Columns in a calculation worksheet for a stand-alone electric load
In table 6.2 above
• Column A represents appliances that are to be powered by the PV solar system as
well as hybrid power systems
• Column B is the number of appliances to be powered by the system.
• Column C is called the Run-Watt column. This is the column in which power
consumption of each load is registered. In most cases electrical appliances display
their power ratings on a plate or sticker. This watt-value represents the highest
power that the appliance will ever draw; and this can only happen when the full
range of the appliance is used. But for normal operations, Kaplanis (2006)
suggests reducing the rated power by 25%. Examples of appliances that do not
normally operate on full capacity include refrigerators/freezers, radios, pressing
irons, electric fans, Ovens, radios etc.
• Column D, the adjusted wattage is obtained by dividing the rated wattage by the
adjustment factor. The adjustment factor is related to the efficiency of the inverter
and reflects the actual power consumed from the battery bank to operate AC loads
from the inverter. The adjustment factor adjusts the wattage to compensate for
inverter inefficiency and gives the actual wattage consumed from the battery bank.
Inverters are on average 80-95% efficient. Here 90% inverter efficiency is
assumed.
• Column E gives the information on the time period each appliance is on per day.
Most loads consume power continuously when they are switched on. However,
some loads will turn automatically themselves on and off when they are switched
on and connected to the power source. Such appliances are called ‘duty cycle’
appliances. Good examples of duty cycle appliances are refrigerators and freezers.
A duty cycle is a percentage of time an appliance that is ‘on’ is actually drawing
power. A refrigerator may operate 50 to 60 percent of the time; this, of course
depending on the efficiency. In addition, appliances which create or use heat

58
usually cycle on and off. For instance electric pressing irons and cooking
appliances.
• Column F provides information on how often the load is used per week. For
example appliances such as electric pressing irons, vacuum cleaners, washing
machines are not used on a daily basis. So for such appliances the number of
hours they are used per week is considered.
• Column G gives the power consumed per day by a certain type of load. The total at
the bottom of this column gives the total power (energy in KWh) on average per
day.
• Column H is a critical one and represents the starting surge in watts. Any appliance
with a motor has a starting surge i.e. before the motor attains its operating speed; it
draws higher current than when operating at its rated power. This is especially true
when the motor is started under load. Refrigerators, well pumps and most power
tools have starting surge. For example a power saw that uses 900 watts
continuously might use up to 3,000watts to start the motor. As a rule of thumb,
surge requirements = required watts x 3. Other appliances that may have
starting surge include TV sets, computer monitors, and any appliance with an
internal power supply. According to Kaplanis (2006) the surge effects are relatively
short and last only for a few milliseconds. Hence the behavior does not make much
difference in the amount of energy that an appliance consumes. However, starting
surges are important and inverters must be sized to handle the starting surge of AC
appliances. In the same vain battery banks must be sized to handle the voltage
depression caused by high amp surge. As such surge watts must be added to
inverter capacity.
• Column I represents what are called phantom loads. These are small loads that
continuously draw power. For example, instant-on-television sets and appliances
with digital clocks such as microwave ovens, VCR’s, some personal computers and
any item with remote control. Phantom loads may seem negligible though they use
power 24 hours continuously a day 7 days a week. So it is recommended to keep
power used by phantom loads to a minimum by un plugging them from the power
sources.

59
6.2.1. Proposed scenario
In the proposed scenario, improved biomass stoves for cooking and space heating, and
solar guessers for heating water are recommended in order to reduce on power demand.
The smokeless and wood conserving biomass stoves mainly designed for developing
countries, burn the wood more efficiently and reduce the health impact of smoke from
open fires. The proposal of biomass stoves for cooking is quite appropriate since the
selected site is located in the woodland area. In hybrid points where the generator runs in
the evening electric cookers can be used. The use of solar guessers is being promoted in
Zambia as one way of reducing on electricity bills. For light bulbs to be used in staff
houses, 15W energy saver bulbs are recommended here. The water scheme is to be
operated by the generator because of large inductive motors involved. So the only
addition to appliances common to all households includes the following;
• electric pressing iron
• cell phone charger
• 210 liter deep freezer
• electric fan
A calculation worksheet containing common household electrical appliances for daily
energy consumption was again distributed to each of the 43 staff houses (A sample of the
load calculation work sheet is shown in Appendix D). The occupants were asked to state
the appliances they would probably use at specific times of the day and estimate the time
(the number of hours) they would want to use such appliances on average per day if
power was supplied continuously 24 hours a day . The same was done to the
classrooms, offices, dormitories and other school infrastructure. Here the deputy head
teacher (Lungu) and one senior member of staff (Mudenda) gave estimates for the time
that would be required for say, lights to be left on in the classrooms and when pupils
should use computers for instance. Table 6.2.1a below shows the number of households
for the staff that should use particular appliances at particular times of the day in the
proposed scenario. (Data in this table may vary from time to time depending on
circumstances). Figure 6.2.1a below shows the major daily activities that should contribute
to energy consumption and the percentage each activity should contribute to the total
energy consumed per day. Figure 6.2.1b is the proposed load profile for the school and
staff houses obtained using homer.

60
Number of households using appliances on a typic al day
Appliance Morning
06hrs -10hrs
Mid-morning
10 hrs – 13hrs
Afternoon
13hrs – 18hrs
Evening
18hrs – 23hrs
TV 12 17 43
Decoder 4 6 13
DVD 8 11 17
Radio cassette 11 35
Pressing iron 14 20
Cell phone charger 25 18
Deep freezer 43 43 43 43
Portable electric
fan2
16 27 43
15W energy saver 43
Table 6.2.1a; number of households using particular appliances at particular times
of the day in the proposed scenario
• Each house hold has on average 8 electric bulbs; 6 inside the house and 2 serve
as security lights outside.
• At the time of visit the weather was quite hot being in the hot and dry season and
so almost every house hold was using an electric fan, particularly in the afternoons
and evenings2 [Source: Teaching and auxiliary staff of Luangwa secondary school,
2009 b]
• Ironing of clothes is mainly done at weekends; so it is not a daily activity
(Detailed calculations of the energy consumption by staff houses and the school in the
proposed scenario are shown in tables 6.2.1b and 6.2.1c respectively of appendix A).

Figure 6.2.1a; major daily activities
by the school and staff houses in the proposed scenario
Figure 6.2.1a above shows the
and the percentage of energy each activity
the figure it can be seen tha
energy consumption by the school and staff houses.
of computers. Figure 6.2.1b below shows the daily load profile for the school and staff
houses.
Figure 6.2.1b; proposed d
daily activities that should contribute to
school and staff houses in the proposed scenario
shows the major daily activities both for the
and the percentage of energy each activity contributes to total energy consumed
the figure it can be seen that refrigeration contributes a bigger percentage of the total
energy consumption by the school and staff houses. Lighting comes second and then
Figure 6.2.1b below shows the daily load profile for the school and staff
proposed d aily load profile for the school and staff houses
34%
44%
13%9%
Major activities contributing to daily energy
consumption in the proposed scenario
Lighting
Refrigeration
Use of Computers
Entertainment
61
that should contribute to energy consumption
the school and staff houses
contributes to total energy consumed. From
a bigger percentage of the total
Lighting comes second and then use
Figure 6.2.1b below shows the daily load profile for the school and staff
aily load profile for the school and staff houses
Major activities contributing to daily energy
Lighting
Refrigeration
Use of Computers
Entertainment

62
7. RESULTS
For the purpose of this study the following specifications for the inverter, systems voltage,
battery capacity and round trip efficiency, charge controller efficiency, PV module
characteristics, generator specifications, fuel costs and economics aspects have been
adopted.
System’s components characteristics
Inverter
• Efficiency 0.90
• Inverter DC input voltage 12 V
• Inverter AC output voltage – 3 phase,50Hz 240/400V
Systems voltage (Battery Bus Voltage) 240V
Battery specifications
• Round trip efficiency 0.85
• Battery type; Exide 6E120-15
• Battery amp-hour capacity 942Ah
• Battery Nominal current 13.08A
• Battery Nominal voltage 12 V
Charge controller
• Efficiency 0.90
PV Module characteristics
• Brand name: Entech Inc. concentrating module. EN-430W
• Rated power: Pmax 430.0W
• Short circuit current (isc) 22.9 A
• Open circuit voltage (Voc) 24.5V
• Nominal current (im) 21.3A
• Nominal voltage (Vm) 20.2V
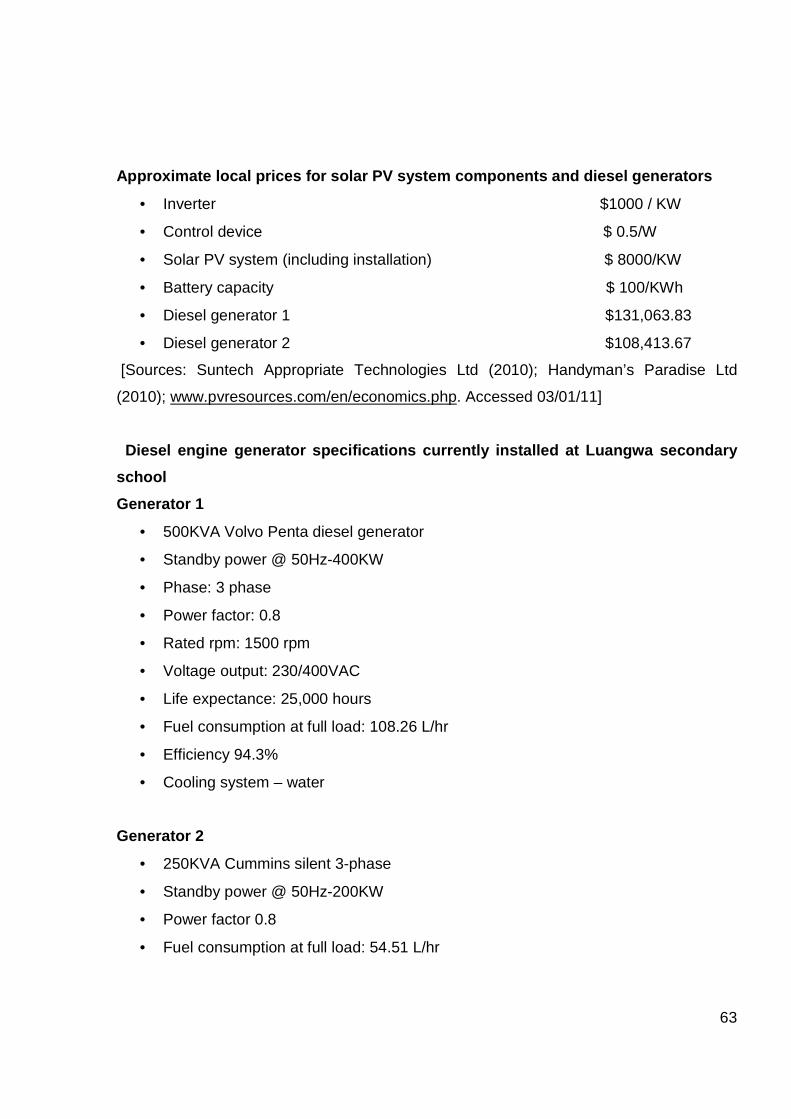
63
Approximate local prices for solar PV system compon ents and diesel generators
• Inverter $1000 / KW
• Control device $ 0.5/W
• Solar PV system (including installation) $ 8000/KW
• Battery capacity $ 100/KWh
• Diesel generator 1 $131,063.83
• Diesel generator 2 $108,413.67
[Sources: Suntech Appropriate Technologies Ltd (2010); Handyman’s Paradise Ltd
(2010); www.pvresources.com/en/economics.php. Accessed 03/01/11]
Diesel engine generator specifications currently in stalled at Luangwa secondary
school
Generator 1
• 500KVA Volvo Penta diesel generator
• Standby power @ 50Hz-400KW
• Phase: 3 phase
• Power factor: 0.8
• Rated rpm: 1500 rpm
• Voltage output: 230/400VAC
• Life expectance: 25,000 hours
• Fuel consumption at full load: 108.26 L/hr
• Efficiency 94.3%
• Cooling system – water
Generator 2
• 250KVA Cummins silent 3-phase
• Standby power @ 50Hz-200KW
• Power factor 0.8
• Fuel consumption at full load: 54.51 L/hr

64
• Life expectance: 25,000 hours
• Rated rpm 1500rpm
Fuel cost and other technical data
• Local cost of diesel fuel US $ 1.49/L [Source: ERB(2010)a]
• Density of diesel fuel 820 Kg/m3
• Carbon content 88%
• Oxidation factor 0.99
• LHV 43.2 MJ/kg
• The cost of operation and maintenance is approximately $30/hour
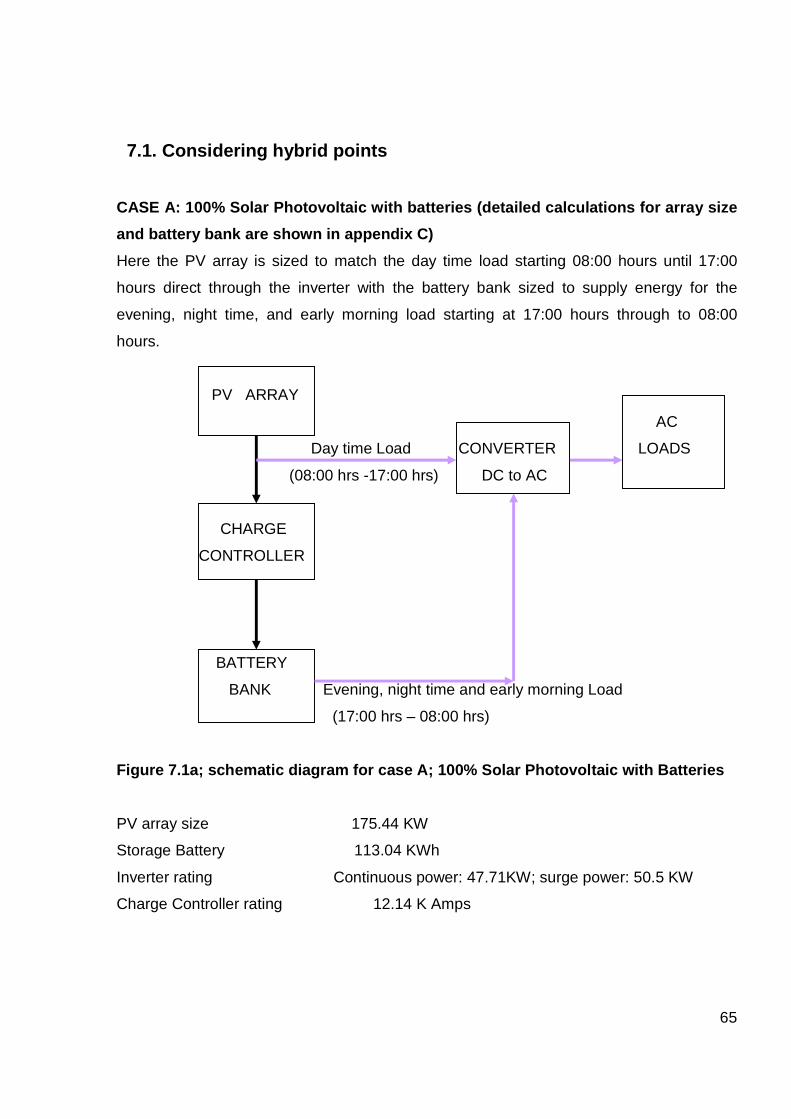
65
7.1. Considering hybrid points
CASE A: 100% Solar Photovoltaic with batteries (det ailed calculations for array size
and battery bank are shown in appendix C)
Here the PV array is sized to match the day time load starting 08:00 hours until 17:00
hours direct through the inverter with the battery bank sized to supply energy for the
evening, night time, and early morning load starting at 17:00 hours through to 08:00
hours.
PV ARRAY
AC
Day time Load CONVERTER LOADS
(08:00 hrs -17:00 hrs) DC to AC
CHARGE
CONTROLLER
BATTERY
BANK Evening, night time and early morning Load
(17:00 hrs – 08:00 hrs)
Figure 7.1a; schematic diagram for case A; 100% Sol ar Photovoltaic with Batteries
PV array size 175.44 KW
Storage Battery 113.04 KWh
Inverter rating Continuous power: 47.71KW; surge power: 50.5 KW
Charge Controller rating 12.14 K Amps

66
CASE B- Hybrid: In this hybrid point the PV array is once again sized to match the day
time load starting 08:00 hours to 17:00 hours. The battery bank is matched to supply
energy to meet the evening load starting at 17:00 hours to 21:00 hours. The diesel
generator picks up from 21:00 hours till 08:00 hours. (Detailed calculations for array
size and battery bank are shown in appendix C)
PV GENERATOR
ARRAY 200 KW
Night time and early morning load
(21:00 hrs - 08:00 hrs)
Day time load CONVERTER AC
(08:00 hrs – 17:00 hrs) DC to AC LOAD
CHARGE
CONTROLLER
Evening load
(17:00 hrs – 21:00 hrs)
BATTERY
BANK
Figure 7.1b; schematic diagram for case B - hybrid
PV array size 108.36 KW
Storage Battery 33.91 KWh
Inverter rating Continuous power: 25KW; Surge power: 50.5KW
Charge Controller rating 7.5 K Amps

67
CASE C Hybrid: In the second hybrid point the solar photovoltaic array is also sized to
meet the day time load directly through the inverter starting at 08:00 hours till 17:00 hours.
Batteries supply the energy for the night time and early morning load through the inverter
starting at 23:00 hours up to 08:00 hours. The generator meets the evening peak demand
starting at 17:00 hours up to 23:00 hours. (Detailed calculations for array size and
battery bank are shown in appendix C)
PV ARRAY GENERATOR
200 KW
Evening load
(17:00 hrs – 23:00 hrs)
Day time load CONVERTER AC
(08:00 hrs – 17:00 hrs) DC to AC LOAD
Night time and early morning load
(23:00 hrs – 08:00 hrs)
CHARGE BATTERY
CONTROLLER BANK
Figure 7.1c; schematic diagram for case C hybrid
PV array size 103.2 KW
Storage Battery 33.91 KWh
Inverter rating Continuous power: 25KW; Surge power: 50.5KW
Charge Controller rating 7.14 K Amps

68
CASE D Hybrid: In this third hybrid point the solar photovoltaic array is again sized to
meet the day time load directly through the inverter starting at 08:00 hours till 17:00 hours.
The generator services the evening, night, and early morning load starting at 17:00 hours
till 08:00 hours. Batteries store energy for use when sun shine on any given day time is
not sufficient. (Detailed calculations for array size and battery bank are shown in
appendix C)
PV ARRAY GENERATOR
200 KW
Evening, night time, and early morning load
(17:00 hrs – 08:00 hrs)
Day time load CONVERTER AC
(08:00 hrs – 17:00 hrs) DC to AC LOAD
(Only when sun shine during day time is not sufficient)
CHARGE BATTERY
CONTROLLER BANK
Figure 7.1d; schematic diagram for case D hybrid
PV array size 56.63 KW
Storage Battery 33.91 KWh
Inverter rating Continuous power: 25 KW; Surge power; 50.5KW
Charge Controller rating 3.93 K Amps

69
CASE E: 100% Diesel also called the base case. The assumption made here is that the
two generators operate 24 hours a day for 365 days of the year sharing the daily load as
shown in the figure 7.1d below.
Generator 1 Generator 2
400 KW 200 KW
Night time load (21:00 hrs – 05:00 hrs) AC
LOAD
Morning, day time, and evening load (05:00 hrs – 21:00 hrs)
Figure 7.1e; schematic diagram for CASE E: 100% die sel-base case
7.1.1. Quantities specified for homer
Load input: Table 7.1.1a below shows the daily hourly load in put specified for Homer.
The load input into Homer is the proposed daily load profile for both staff houses and the
school shown in figure 6.2.1b above.
Table 7.1.1a: Hourly load in put
Hour of the day
Load(KW)
Hour of the day
Load(KW)
00:00 – 01:00 12.171 12:00 – 13:00 10.047
01:00 – 02:00 12.171 13:00 – 14:00 07.798
02:00 – 03:00 12.171 14:00 – 15:00 36.976
03:00 – 04:00 12.171 15:00 – 16:00 37.976
04:00 – 05:00 12.171 16:00 – 17:00 23.106
05:00 – 06:00 12.171 17:00 – 18:00 12.883
06:00 – 07:00 08.161 18:00 – 19:00 23.903
07:00 – 08:00 07.945 19:00 – 20:00 26.322 08:00 – 09:00 09.679 20:00 – 21:00 47.102 09:00 – 10:00 12.479 21:00 – 22:00 43.998
10:00 – 11:00 11.478 22:00 – 23:00 21.869
11:00 – 12:00 09.878 23:00 – 00:00 12.171
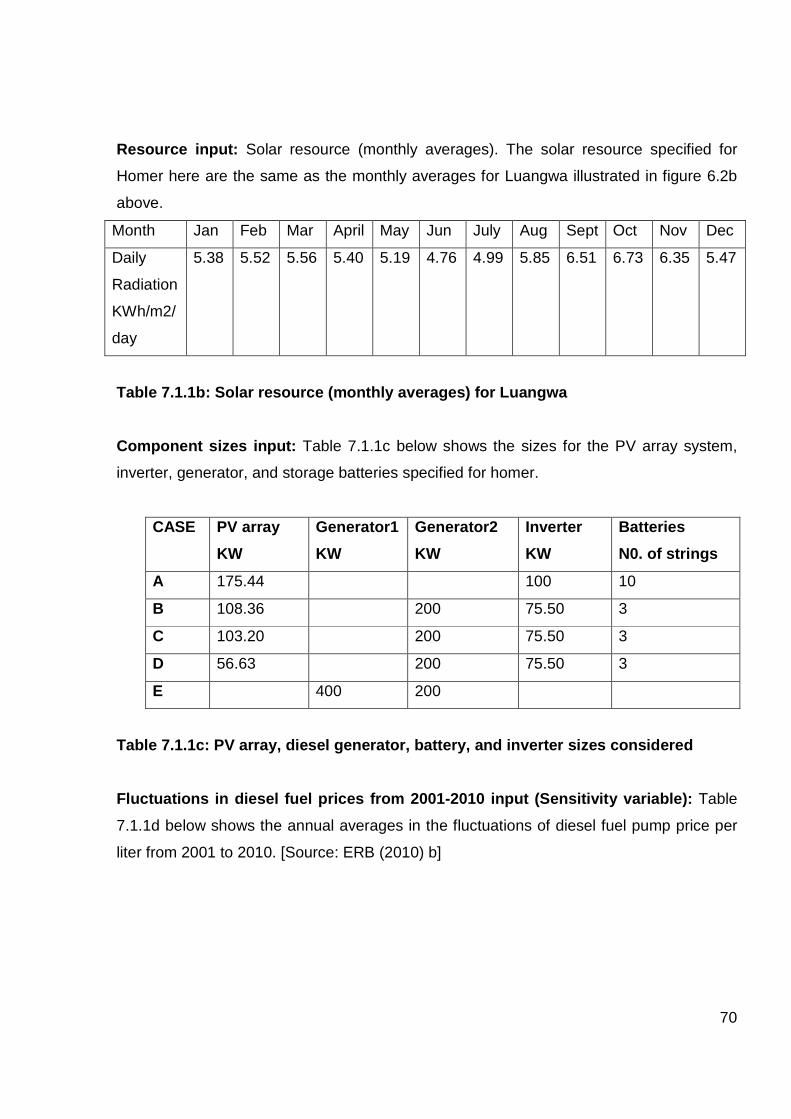
70
Resource input: Solar resource (monthly averages). The solar resource specified for
Homer here are the same as the monthly averages for Luangwa illustrated in figure 6.2b
above.
Month Jan Feb Mar April May Jun July Aug Sept Oct Nov Dec
Daily
Radiation
KWh/m2/
day
5.38
5.52 5.56 5.40 5.19 4.76 4.99 5.85 6.51 6.73 6.35 5.47
Table 7.1.1b: Solar resource (monthly averages) for Luangwa
Component sizes input: Table 7.1.1c below shows the sizes for the PV array system,
inverter, generator, and storage batteries specified for homer.
CASE PV array
KW
Generator1
KW
Generator2
KW
Inverter
KW
Batteries
N0. of strings
A 175.44 100 10
B 108.36 200 75.50 3
C 103.20 200 75.50 3
D 56.63 200 75.50 3
E 400 200
Table 7.1.1c: PV array, diesel generator, battery, and inverter sizes considered
Fluctuations in diesel fuel prices from 2001-2010 i nput (Sensitivity variable): Table
7.1.1d below shows the annual averages in the fluctuations of diesel fuel pump price per
liter from 2001 to 2010. [Source: ERB (2010) b]

71
Year 2001 2002 2003 2004 2005 2006 2007 2008 2009 2010
Diesel fuel
pump price
/ liter (US$)
0.70 0.63 0.68 0.84 1.03 0.99 1.56 1.25 1.35 1.49
Table 7.1.1d; Annual average fluctuations in diesel fuel pump price, 2001-2010
From figure 7.1.1d above, the increase in fuel pump price over a period of 10 years is
$0.70, giving an annual average increase of $0.079 per liter of diesel. If this increment is
assumed constant, then the cost of a liter of diesel in 25 years time would be about $3.47.
Economics
• Annual average inflation rate, i, for year 2011 is 7.53%
• Annual average discount (interest) rate, d, for year 2011 is 6.05%
[Source: www.economywatch.com/economic-statistics/country/zambia/year. Accessed
02/03/11]
• Project life time: 25 years
• Carbon tax is $25/ton (sensitivity variable) assumed fixed.
7.2. Analysis
7.2.1. Manual calculation of LCC for case A 100% so lar PV system
Homer could not model a system configuration consisting of solar photovoltaic, batteries,
and inverter alone and so the life cycle cost (LCC) for case A, 100% solar PV system is
analyzed manually by applying the present worth factor for both present worth of future
one time investment and present worth of future recurrent investment. In this case the life
time of Battery is assumed 12 years and that of inverter and charge controller 15 years.
So replacement of the batteries and, inverter and charge controller are done twice and
once respectively during the life time of the system. Annual operation and maintenance

72
cost is assumed to be 1% of the initial capital cost. The life time of the project is 25 years.
Of course homer calculated other hybrid configurations not initially proposed.
Initial investment costs:
• Cost of Solar Photovoltaic array system; 175.44 KW*$8000/KW = $1,403,520.00
• Cost of Storage Batteries; 113.04KWh*$100/KWh = $11,304.00
• Other components (inverter, charge controller etc) = $172,900.00
• Initial capital cost = $1,587,724.00
Solar PV
Components
Initial capital
Cost (US$)
Present
worth
factor
Worth (US$)
Solar PV system 1,403,520.00 1 1,403,520.00
Battery 11,304.00 1 11,304.00
Battery 12th year 1.182 13,361.33
Battery 24th year 1.396 15,780.38
Other components
(Inverters, charge controller,)
172,900.00 1
172,900.00
Other components 15th year 1.232 213,012.80
Operation and maintenance 15,877.24
Operation and maintenance
recurring at end of year
30.1 477,904.92
Life Cycle Cost (LCC) 2,307,783.43
Annualized LCC 77,729.32
Table 7.2.1; Life cycle cost (LCC) analysis for Cas e A 100% Solar PV System
Cost of unit energy production = Annualized LCC / Annual energy generation
= $ 77,729.32/ 119,803.66KWh = US$ 0.649/KWh

73
� Annualized Life cycle cost is obtained by dividing the Life cycle cost by the present
worth factor i.e. the costs as they occur in the beginning of the year. Here a of
factor of 29.69 was calculated in appendix D.
7.2.2. Homer results
Table 7.2.2a below shows optimization results from homer categorized according to net
present cost (NPC) i.e. according to life cycle cost (LCC). In the table the configuration
highlighted in different colors are the proposed hybrid points. Hybrid point D is highlighted
in red . Hybrid point C is highlighted in blue while hybrid point B is highlighted in green .
The configuration highlighted in purple in table 7.2.2b is the base case (100% diesel).
Table 7.2.2c shows the same hybrid points with the same color codes when diesel fuel
pump price and Carbon dioxide tax are defined as sensitivity variables. Table 7.2.2d
shows the base case (100% diesel) with diesel fuel price and CO2 tax defined as
sensitivity variables.
Table 7.2.2e compares the investment needed for installing solar PV systems into already
existing diesel between cases B,C and D(for case A it is 100% solar PV). The table also
compares the LCC, annual O&M costs, COE, and Carbon dioxide emissions between
cases A, B, C, D, and case E, the base case. Table 7.2.2f compares (for cases B, C, D
and E) the LCC, the COE and the annual O&M costs with diesel fuel price, projected at
US$3.47 per liter in 25 years time, and CO2 tax (assumed fixed) are defined as sensitivity
variables. Figures 7.2a, 7.2b and 7.2d are graphical representations for comparing the
LCC, the investment needed for installation and O&M costs between cases A, B, C, D and
E respectively. The figures on the bar charts are in millions of US dollars (the costs also
include those of diesel generators). Figure 7.2c compares the cost of energy in US$/KWh
between these cases. Figure 7.2e compares the carbon dioxide emissions between cases
A, B, C, D and case E. The figures on this bar chart are in tons of carbon dioxide emitted
per year. Figures 7.2f and 7.2g compare the LCC and COE between cases B, C, D and E
when diesel fuel pump price and CO2 tax are defined as sensitivity variables.

74
PV Gen1 Gen2 Battery Converter Ini tial capital Total NPC COE Renew Diesel Gen1 Gen2 Batt. Lf
(kW) (kW) (kW) (QTY) (kW) ($/kWh) frac (L ) (hrs) (hr s) . (yr)
103.20 200 200 75.5 $ 977,936 $ 2,652,971 1.322 0.75 33,631 1,066 12.0
103.20 200 200 100.0 $ 1,002,436 $ 2,668,526 1.330 0.76 33,000 1,044 12.0
108.36 200 200 75.5 $ 1,019,376 $ 2,677,324 1.335 0.77 31,555 996 12.0
56.63 200 200 75.5 $ 605,376 $ 2,690,147 1.341 0.48 62,144 1,961 12.0
56.63 200 200 100.0 $ 629,876 $ 2,729,286 1.360 0.47 62,375 1,969 12.0
108.36 200 200 100.0 $ 1,043,876 $ 2,748,684 1.370 0.77 32,984 1,044 12.0
175.44 200 200 75.5 $ 1,555,856 $ 3,055,459 1.523 0.97 6,270 199 12.0
175.44 200 200 100.0 $ 1,580,356 $ 3,113,284 1.552 0.96 7,250 229 12.0
56.63 200 60 75.5 $ 597,463 $ 5,086,299 2.535 0.28 51,223 4,868 12.0
56.63 200 60 100.0 $ 621,963 $ 5,191,842 2.588 0.27 153,917 4,955 12.0
103.20 200 60 75.5 $ 970,023 $ 5,377,562 2.681 0.44 135,185 4,351 12.0
103.20 200 60 100.0 $ 994,523 $ 5,457,279 2.720 0.43 136,926 4,407 12.0
108.36 200 60 75.5 $ 1,011,463 $ 5,469,866 2.727 0.45 135,626 4,365 12.0
108.36 200 60 100.0 $ 1,035,963 $ 5,521,525 2.752 0.45 136,320 4,388 12.0
175.44 200 60 75.5 $ 1,547,943 $ 6,272,369 3.127 0.58 126,743 4,080 12.0
175.44 200 60 100.0 $ 1,572,443 $ 6,336,508 3.159 0.58 127,905 4,118 12.0
Table 7.2.2a Homer overall optimization results
PV Gen1 Gen2 Battery Converter Initial capital Total NPC COE Renew Diesel Gen1 Gen2 Batt.Lf.
(kW) (kW) (kW) (QTY) (kW) ($/kWh) frac (L) (hrs) ( hrs) (yr)
400 200 $ 239,478 $ 9,466,403 4.719 0.00 271,629 0 8,759
Table 7.2.2b Homer optimization results for 100% di esel

75
PV Gen1 Gen2 Battery Converter Initi al capital Total NPC COE Renew Diesel G en1 Gen2 Batt.Lf.
(kW) (kW) (kW) (QTY) (kW) ($/kWh) frac (L) (hrs) (hr s) (yr)
175.44 200 200 75.5 $ 1,555,856 $ 3,218,264 1.604 0.97 6,270 199 12.0
175.44 200 200 100.0 $ 1,580,356 $ 3,301,529 1.646 0.96 7,250 229 12.0
108.36 200 200 75.5 $ 1,019,376 $ 3,496,652 1.743 0.77 31,555 996 12.0
103.20 200 200 100.0 $ 1,002,436 $ 3,525,379 1.757 0.76 33,000 1,044 12.0
103.20 200 200 75.5 $ 977,936 $ 3,526,217 1.758 0.75 33,631 1,066 12.0
108.36 200 200 100.0 $ 1,043,876 $ 3,605,129 1.797 0.77 32,984 1,044 12.0
56.63 200 200 75.5 $ 605,376 $ 4,303,737 2.145 0.48 62,144 1,961 12.0
56.63 200 200 100.0 $ 629,876 $ 4,348,866 2.168 0.47 62,375 1,969 12.0
103.20 200 60 75.5 $ 970,023 $ 8,887,662 4.430 0.44 135,185 4,351 12.0
108.36 200 60 75.5 $ 1,011,463 $ 8,991,417 4.482 0.45 135,626 4,365 12.0
103.20 200 60 100.0 $ 994,523 $ 9,012,589 4.493 0.43 136,926 4,407 12.0
56.63 200 60 75.5 $ 597,463 $ 9,012,830 4.493 0.28 151,223 4,868 12.0
108.36 200 60 100.0 $ 1,035,963 $ 9,061,107 4.517 0.45 136,320 4,388 12.0
56.63 200 60 100.0 $ 621,963 $ 9,188,341 4.580 0.27 153,917 4,955 12.0
175.44 200 60 75.5 $ 1,547,943 $ 9,563,280 4.767 0.58 126,743 4,080 12.0
175.44 200 60 100.0 $ 1,572,443 $ 9,657,581 4.814 0.58 127,905 4,118 12.0
Table 7.2.2c Homer overall optimization results wit h diesel price and CO2 tax defined as sensitivity v ariables
PV Gen1 Gen2 Battery Converter Initial capit al Total NPC COE Renew Diesel Gen1 Gen2 Batt. Lf.
(kW) (kW) (kW) (QTY) (kW) ($/kWh) frac (L) (hrs) (hrs) (yr)
400 200 $ 239,478 $ 16,519,313 8.234 0.00 271,629 0 8,759
Table 7.2.2d Homer optimization results for 100% di esel with diesel price and CO2 tax as sensitivity v ariables

76
Type of
hybrid
Investment
needed for
installation
(US$)
Life Cycle Cost
(LCC)
(US$)
Annual
Operation
Costs
(US$/yr)
Cost of
unit energy
production
(US$/KWh)
CO2
emissions
(Kg/year)
Case A 1,587,724.00 2,307,783.43 15,877.24 0.649 Nil
Case B 945,931.00 5,469,866.00 129,636.00 2.727 357,147
Case C 904,491.00 5,377,562.00 126,359.00 2.681 355,986
Case D 531,931.00 5,086,299.00 106,545.00 2.535 398,219
Case E 239,477.00 9,466,403.00 262,770.00 4.719 715,289
Table 7.2.2e; comparing the investment needed for i nstallation, Life cycle cost,
operation and maintenance costs, cost of unit energ y production, and CO2
emissions between cases A, B, C, D and case E, the base case(100% diesel)
Type of
hybrid
Life Cycle Cost
(LCC)
(US$)
Annual Operation
Costs
(US$)
Cost of unit energy
production (COE)
(US$/KWh)
Case B 8,991,417.00 138,565.00 4.482
Case C 8,887,602.00 135,259.00 4.430
Case D 9,012,830.00 116,500.00 4.493
Case E 16,519,313.00 280,652.00 8.234
Table 7.2.2f; comparing the LCC, operation and main tenance costs, and cost of unit
energy production between cases B, C, D and case E, the base case (100%
diesel)when diesel fuel pump price and Carbon dioxi de tax (fixed) are defined as
sensitivity variables

77
Figure 7.2a: comparing LCC Fig ure 7.2b: comparing initial costs
(Millions of US dollars) (Millions of US dollars)
Figure 7.2c: comparing cost of energy Figure 7.2d: comparing O&M costs
(US$/KWh) (Millions of US dollars)
Figure 7.2e: comparing CO2 emissions Figure 7.2f : LCC with diesel fuel price
(Tons of CO2 per year) and CO2 as sensitivity variables
(Millions of US dollars)
2.3
5.5 5.3 5
9.5
0
2
4
6
8
10
Case A Case B Case C Case D Case E
1.59
0.95 0.9
0.53
0.24
0
0.5
1
1.5
2
Case A Case B Case C Case D Case E
0.649
2.727 2.681 2.535
4.719
0
1
2
3
4
5
Case A Case B Case C Case D Case E
0.016
0.129 0.1260.106
0.262
0
0.05
0.1
0.15
0.2
0.25
0.3
Case A Case B Case C Case D Case E
0
0.357 0.3550.398
0.715
0
0.1
0.2
0.3
0.4
0.5
0.6
0.7
0.8
Case A Case B Case C Case D Case E
8.99 8.88 9.01
16.52
0
5
10
15
20
Case B Case C Case D Case E

78
Figure 7.2g: COE with diesel fuel price Figure 7 .2h: Annual O&M costs with diesel
and CO2 tax as sensitivity variables fuel pri ce and CO2 tax as sensitivity
(US$/KWh) Variables (Millions of US dollars)
Figure 7.2i below compares the percentage contribution of solar and diesel by each of the
five cases.
Figure 7.2i: Percentage contribution of solar and d iesel
4.48 4.43 4.49
8.23
0
2
4
6
8
10
Cas B Case C Case D Case E
0.138 0.1350.116
0.281
0
0.05
0.1
0.15
0.2
0.25
0.3
CASE B CASE C CASE D CASE E
100
45 44
28
00
55 56
72
100
0
20
40
60
80
100
120
Case A Case B Case C Case D Case E
Renew.frac
Diesel

79
From table 7.2.2e and figure 7.2c, it can be seen that case A (100% solar PV system)
shows the lowest value for the cost of unit energy production at US$0.649/KWh. Case A
also shows the lowest values for the life cycle cost (LCC) and annual operation and
maintenance costs compared to the other four cases as can be seen from figures 7.2a
and 7.2d respectively. However, figure 7.2b shows that case A has the highest value of
the investment needed for installation compared to the other cases. Table 7.2.2e and
figures 7.2a, 7.2b, 7.2c and 7.2d show that of the three hybrid points, hybrid point D
shows lower values for the investment needed for installation, LCC, operation and
maintenance costs, and the cost of unit energy production. However its carbon dioxide
emissions are quite high compared to the other two hybrid points as can be seen from
figure 7.2e. Of course the base case, case E, shows higher values for all these factors
being considered except for the initial capital cost.
When diesel fuel price and carbon tax (assumed fixed) are introduced as sensitivity
variables, projecting the cost of a liter of diesel to US$3.47 in 25 years time as explained
above in section 7.1.1, all the four cases B, C, D and E register increments in the LCC,
cost of unit energy production, and operation and maintenance costs except for case A
which is not affected by these variables. As can be seen from table 7.2.2f and figures 7.2f
7.2g and 7.2h, the cost of energy for all the four cases almost doubles as does the LCC.
The annual O&M costs also increase. But hybrid point C now shows the lowest cost of
energy and lowest LCC compared to hybrid point B and hybrid point D when diesel fuel
price and CO2 tax are introduced as sensitivity variables. The reason probably could be
due to longer time needed by the generator in hybrid points B and D to operate compared
to hybrid point C. Similarly, the base case register higher values for the life cycle cost,
cost of energy production and operation and maintenance costs compared to the other
four cases when diesel fuel price and carbon dioxide tax are defined as sensitivity
variables.

80
7.3. Discussion and conclusion
Looking at the above analysis, case A (100% solar PV system) has the lowest cost of unit
energy production at US$0.649/KWh. The cost of energy is not affected by the
introduction of diesel fuel pump price and carbon dioxide tax as sensitivity variables. Also
case A has the lowest operation and maintenance costs and lowest LCC. Of course the
investment needed for installation, at US$ 1,587,724 is higher compared to the other
cases. No emissions are produced from this case. The LCC for case A is
US$2,307,783.43 and the annual operation and maintenance cost is US$15,877.24. Case
A, therefore, appears to be feasible as an option for installation at the site. Case A (100%
solar PV system) consists of 175.44KW of EN-430W PV modules, 200 6E120-15 batteries
and 100KW inverter. If a hybrid is to be considered, then hybrid point C is more feasible
because it shows lower cost of unit energy production and lower LCC compared to hybrid
points B and D when diesel fuel pump price and carbon dioxide tax are considered as
sensitivity variables. Also hybrid point C shows lower carbon emissions compared to
hybrid points B and D. Hybrid point C has an initial investment of US$ 904,491.00; a LCC
cost of US$8,887,602.00; annual operation and maintenance cost of US$135,259.00 and
cost of unit energy production of US$4.430 per KWh when diesel fuel price projected at
US$3.47 per liter in 25 years time and carbon dioxide tax (assumed fixed) are defined as
sensitivity variables. Hybrid point C highlighted in blue in tables 7.2.2a and 7.2.2c,
consists of 103.20KW of EN-430W PV modules, 60 6E120-15 batteries , 75.5KW inverter
and a 200KW generator. The generator in this hybrid point runs from 17:00 hours to 23:00
hours.
The costs of retrofitting existing off-grid stand alone diesel power plant at Luangwa
secondary school located in one of the remote off-grid areas of Zambia has been
determined with the help of homer, a micro power optimization model. After comparing the
proposed options to the base case i.e. the current diesel power installation at Luangwa
secondary school in terms of investment needed for installation, life cycle cost, cost of unit
energy production, operation costs, and carbon dioxide emissions, a case of 100% solar
PV system was found to be more feasible as an option for installation at the site. If a

81
hybrid is to be considered then hybrid point C (highlighted in blue in tables 7.2.2a and
7.2.2c above) could be a better option.
The daily energy consumption by the school community was determined by assessing the
use of various house hold electrical appliances both in staff houses and other school
infrastructures. Of course, examining past electric bills could have been a better method
to determine the energy consumption by the school community. But like in many off-grid
remote diesel power plants electric bills are not available.

82
8. REFERENCES
1. Art Thorkildsen (2009), personal communication with Art Thorkildsen, Allied
manager, Barloworld Equipment Zambia Limited, August 12 2009
2. Al-Ismaily, H.A et al (2006); Viability of Hybrid Wind-Diesel Power Generation in
Fossil Fuel Rich Countries; A case study of Masirah Island, Sultanate of Oman;
ISESCO Science and Technology Vision , Volume 2-No. 1, August 2006, pp 49-
52
3. Banda Albert (2010), personal communication with Banda Albert, senior sales
officer; Handyman’s paradise Ltd, stockiest of hardware, building and sanitary
ware; Lumumba 4, Lusaka ,P.O.Box 33518 Zambia, May 17th 2010
4. Bernard Mulenga (2009), personal communication with Bernard Mulenga; senior
manager-Core systems planning and operations; MTN-Zambia Limited, August
12th 2009
5. Black and Veatch (2009); Fossil fuel Generation: Building a world of difference.
February 12, 2009. pp 1-14
6. Boyle Godfrey (2004); Renewable Energy: Power for a sustainable Future;
Oxford University press, UK
7. Chayun et al (2004); Study program in Germany: Uni.oldenburg.PT Gerbang
Multindo Nusantare. Germany cooperation partners: ZREUGmbH and RWE-
Schott solar GmhH. Available at www.renewables2004.de ; accessed 14-04-09
8. Del Chiaro Bernadette et al(2004); The economics of solar homes in California-
how residential photovoltaic incentives can pay off for home owners and the
public; Environmental California Research and Policy Centre, December 2004.
9. Dennis Barley et al (1997); Diesel power plant Retrofitting options to Enhance
Decentralized Electricity supply in Indonesia. A presentation at Wind power ’97
Austin, Texas, June 15-18, 1997.
10. Denis Lenardic (2001); Photovoltaic economics. Available at
www.pvresources.com/en/economics.ph; Last modified February 7th 2011;
Accessed 20th March 2011

83
11. Dokrak Pongchawee et al (2009); Three Years’ Experience (2006-2008) on
PV/Diesel Hybrid Systems in A Rural Elementary School in Thailand; The 3rd
International Conference on ‘Sustainable Energy and Environment (SEE,2009)’;
19-22 May 2009, Bangkok, Thailand.
12. Economy watch Zambia (2010); Economic statistics and indicators for Zambia;
Available at www.economywatch.com/economic-statistics/country/zambia/year.
Accessed 20th March 2011
13. Emission Facts: Average Carbon Dioxide Emissions Resulting from Gasoline and
Diesel Fuel; EPA 420-F-05_001, February 2005
14. Endecon Engineering (2001); a Guide to Photovoltaic System Design and
Installation, 347 Norris Court San Ramon, California, 94583.
15. Energy Infrastructure Assurance Advisory Group (2005); Diesel Fuel and Back-up
Generation-Issues for CEOs and Risk Managers-National Oil Supplies
Emergency Committee, August 2005
16. Feasibility of using Syntroleum Ultra-Clean Fuel in Diesel Generator for Rural
Alaska Power Generation (2006); Alaska Energy Technology Development
Laboratory; University of Alaska Fair banks, June, 2006.
17. Herzog V. Antonia et al (2002), Renewable Energy Sources; Renewable and
Appropriate energy Laboratory (RAEL), University of California, Berkeley USA.
Available at www.socrates.beckeley.edu/~rael. Accessed 04-05-09
18. HOMER: The Micro power Optimization Model. Available at
http://www.nrel.gov/homer . Accessed 10-02-09
19. Howes Ruth et al.(2007); Challenges of Electricity Storage Technologies, a
Report from the APS Panel on Public affairs Committee on Energy and
Environment; May 2007
20. International Energy Agency [IEA] (2006):CO2 Emissions from fuel combustion
1971-2004; IEA Head of Publications service, 9 rue de la Fédération 75739 Paris
Cedex 15 France

84
21. IEA Energy Technology Essentials (2007); Nuclear Power; Consolidated
information on energy technologies from the IEA network, March 2007. Available
at www.iea.org/Texbase/techno/essentials.htm Accessed 04-05-09
22. Lavinthal Aric (2001), The Potential Impacts of solar cells in our Environment, pp
69-79
23. Larry Goldstein et al(2003); Gas-Fired Distributed Energy Resource Technology
Characterizations; A joint project of the Gas Research Institute (GRI) and the
National Renewable Energy Laboratory, October, 2003 available at
http://www.osti.gov/bridge . Accessed: 20-05-09
24. Luis Vega (2004): Wind/PV/Diesel Hybrid Village Power Systems in Hawaii and
Fiji, WREC August to September.
25. Lungu Gideon and Mudenda Adrian (2009), personal communication with Lungu
Gideon and Mudenda Adrian, Deputy head teacher and expressive arts teacher
respectively, at Luangwa secondary school September 19 2009.
26. Makaliki Readily (2009), personal communication with Makaliki Readily; Technical
Services manager-South; ZESCO Limited, September 23 2009, December 23
2009, March 9 2010.
27. Makaliki Readily (2009), E-mail communication with Makaliki Readily; Technical
Services manager-South; ZESCO Limited; 28-12-2009.
28. Mike Nelson (2003); Washington Consumer’s Guide, Solar Electric Systems,
September 2003.
29. Ndolo Dicks (2009), personal communication with Ndolo Dicks, Power
Technician; Zain-Zambia, Head Office Addis Ababa Road, Lusaka, Zambia;
September 9th 2009
30. Parulekar.B.B and Rao. S. (2005); Energy Technology; Romesh Chander
Khanna, 2-B, Nath Market, Nai Sarak, Delhi-110006
31. Poullikkas Andrew (2004); Power Generation Technologies, Fuel Options and
Renewable Sources, Electricity Authority of Cyprus.
32. RETScrean International, Clean Energy Project Analysis Software. Available at
www.retscrean.net .Accessed June 2008.

85
33. Robert Freling and Jeff Lah(2005); Renewable Energy Technology, Optimizing
Energy Sources for the Development of Millennium Project Village, Solar Electric
Light Fund (SELF), July, 2005.
34. Roberto Lira (2005); Reciprocating Engines favoured for 267 MW power plant in
Pavana III, Honduras; Energy News issue-17 pp 12-13
35. Sitka’s power supply plan(2008); Synopsis, Sitka’s power supply plan, Electric
Department, 104 Jarvis street, Sitkaak 99835, October, 2008.
36. Sandia National Labs (1995); Stand Alone Photovoltaic System: Handbook of
Recommended Design Practices; NM Solar Energy Institute; Available at
www.Photovoltaic.sandia.gov/docs/AHandbook.html; Last modified April 23rd
2009. Accessed 2nd March 2011
37. Solar Module retail price Environment (2009); Solar buzz Consultancy report,
May 2009. Available at http://www.solarbuzz.com/Moduleprices.htm. Accessed
December 15 2009.
38. Socrates Kaplanis (2006); The design and integration of possible PV
configurations to determine the most cost effective system for a house hold,
University of Patra, Greece. Available at www.teipat.gr/socrates-
ip2006/files/case_studies_on_PV_systems.pdf. Accessed September 22nd 2009
39. Stephen Karekezi and Timothy Ranja (1997); Renewable Energy Technologies in
Africa, an African Energy Policy, Reserve Network (AFREPREN) Nairobi, Kenya.
40. Suntech Appropriate Technology Ltd, 20 Mungulube Road, off Makishi Road ,
Lusaka, Zambia; Price list for Solar Energy Components; May 22nd 2009
41. Teaching and auxiliary staff of Luangwa secondary school (2009), personal
communication with the teaching and auxiliary staff of Luangwa secondary
school; 18 – 20 September 2009.
42. Team Zeta (2009), Emergency Turnaround and Recovery Strategy: A proposal
for phasing out diesel power stations in Zambia, ZESCO Ltd; 3rd September
2009.
43. Thomas Young (2005); Electricity for Montserrat: Montserrat Utilities Ltd; A
presentation to Ministers, 30th August, 2005. Available at www.mul.ms .Accessed
on 14th July 2009

86
44. Timothy. A. Loehlen (2007); White paper on maintenance is one key to diesel
generator set reliability; power topic number 7004, Cummins Power Generation,
2007.
45. Solar Energy in Zambia (2008); Ministry of Energy and Water Development, final
report prepared by UTILINK Limited, plot 1311, Lubu road Long acres, P.O.Box
31661, Lusaka, Zambia, and 31st October 2008.
46. Understanding the cost of solar energy. Available at
http://greenecon.net/understanding-the-cost-of-solar-
energy/energy_economics.html#comments . Accessed 17/01/2010
47. Vasilis. M. Fthenakis (1999); National Photovoltaic Environmental Health and
Safety; Assistance Centre, Brookhaven National Laboratory Upton NY 11973.
48. Virinder Sigh (2001); Blending Wind and Solar into the Diesel Generator Market,
a research report on Renewable energy Policy project, winter 2001. issue No. 12
49. Watch Tower Bible and Track Society of New York, Inc (2005); Awake magazine
volume 86 no. 5; 25 Columbia Heights Brooklyn. NY 11201-24831; March 2005
50. Worldwide status of wind-diesel application (2002); Available at
www.eere.energy.gov/windpoweringamerica/wksp2002winddiesel4.html
51. Yona Sichalwe (2009), personal communication with Yona Sichalwe, Regional
manager-North western province; distribution and supply (North); ZESCO
Limited, June 8 2009.
52. Zvonko Sankovic (2009), personal communication with Zvonko Sankovic,
Maintenance Manager; Shoprite Checkers Head Office (Manda Hill), Cairo Road
Lusaka, Zambia; September 9th 2009

87
9. APPENDICES Appendix A : Current scenarios for energy consumption by both the school and staff houses Type of school building
Appliance Rated watts
Quantity Run watts (W)
Daily hours of use: from-to
Days /week
Daily watt -hour (Wh)
Offices • Head • Deputy head • Secretary • Accounts
Fluorescent tubes
36 6 216 18hrs – 21hrs 5 462.86
Computers plus Monitors
590 2 1,180 08hrs – 10hrs 5 1,685.71 4 2,360 18hrs – 20hrs 5 3,371.43
Printer 600 2 1,200 09hrs-09:30hrs 4 342.86 Electric fan, portable
75 3 168.75 12hrs- 13hrs 5 120.54 2 112.5 18hrs – 20hrs 5 160.71
Classrooms Fluorescent tubes
36 45 1,620 18hrs – 22hrs 7 6,480.00
Dept stock rooms • Industrial Arts • Civic Education • Mathematics • Languages • Science • Social Science • History • Expressive Art • Entertainment
Fluorescent tubes
36 9 324 18hrs – 22hrs 5 925.71
Light bulbs (100W)
100 5 500 18hrs – 22hrs 5 1,428.57
Computers plus Monitors
590 6 On average 4/day
2,360 18hrs – 20hrs 5 3,371.43
Dormitories[8] Fluorescent tubes
36 64 2,304 18hrs – 22hrs 7 9,216.00
Bulbs in toilets
100 16 1,600 18hrs – 22hrs 7 6,400.00

88
Staffroom Fluorescent tubes
36 2 72 18hrs – 22hrs 7 288.00
TV + Decoder 105 1 105 08hrs – 10hrs 7 210.00 12hrs – 13hrs 7 105.00 18hrs – 22hrs 7 420.00
School Tuck shop Fluorescent tubes
36 1 36 18hrs – 22hrs 7 144.00
Freezer (210litres)
206.4 1 154.5 07hrs -09hrs 7 185.40 12hrs – 14hrs 7 185.40 18hrs – 20hrs 7 185.40
Computer room Fluorescent tubes
36 2 72 18hrs – 22hrs 7 288.00
Computers plus Monitors
590 20 Average 10
5,900 19hrs – 20hrs 5 4,214.29
School Hall Fluorescent tubes
36 8 288 18hrs – 22hrs 7 1,152.00
School Library Fluorescent tubes
36 3 108 18hrs – 22hrs 7 432.00
Light bulbs (100W)
100 1 100 18hrs – 22hrs 7 400.00
School boarding Freezer-210lit 206.4 3 463.5 06hrs – 10hrs 7 1,112.40 12hrs -14hrs 7 556.20 18hrs – 22hrs 7 1,112.40
Fluorescent tubes
36 6 216 18hrs – 22hrs 7 864.00
Clinic Fluorescent tubes
36 7 252 17hrs – 22hrs 7 1,260.00
Refrigerator 368 1 276 08hrs – 10hrs 7 331.20 12hrs – 14hrs 7 331.20 18hrs – 22hrs 7 662.40
Pump house Water pump 16,200 1 16,200 05:30hrs - 09hrs 7 56,700.00 13hrs – 14hrs 7 16,200.00 17hrs – 18hrs 7 16,200.00

89
Staff toilets Fluorescent tubes
36 4 144 18hrs – 22hrs 7 576.00
Car park Fluorescent tubes
36 4 144
18hrs – 22hrs 7 576.00
Total Daily Energy consumption 138,325.91
Table 6.1b: Current daily electrical energy consump tion by the school
Name of appliance
(staff houses)
Rated
watts(W)
Quantity Total run
Watts (W)
Daily hours of use
from - to
Days/
wk
Daily watt-
hours (Wh)
Television set 70 4 280 09hrs - 10hrs 7 280.00
43 3,010 18hrs - 22hrs 7 12,040.00
Decoder 30 13 390 18hrs - 22hrs 7 1,560.00
Deep freezer(210 liters) 206.4 43 6,656.4 06hrs -10hrs 7 15,975.35
12hrs - 14hrs 7 7,987.68
18hrs – 22hrs 7 15,975.35
Electric fan(portable) 75 22 1,237.5 19hrs – 22hrs 7 3,712.50
Cell phone charger 19.2 12 230.4 08hrs-10hrs 3 197.49.
18 345.6 20hrs-22hrs 3 296.23
Light bulbs 100 344 34,400 18hrs – 22hrs 7 137,600.00
DVD player/ recorder 20 4 120 09hrs -10hrs 7 120.00
18 360 18hrs – 22hrs 7 1,440.00
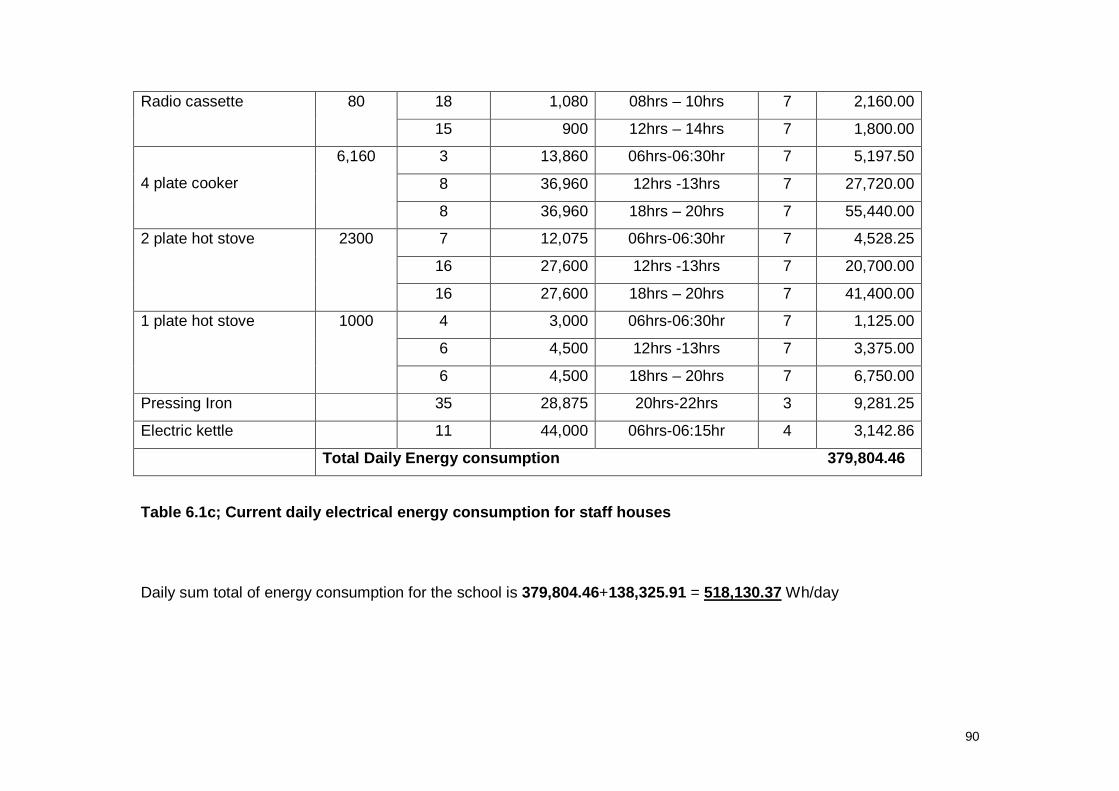
90
Radio cassette 80 18 1,080 08hrs – 10hrs 7 2,160.00
15 900 12hrs – 14hrs 7 1,800.00
4 plate cooker
6,160 3 13,860 06hrs-06:30hr 7 5,197.50
8 36,960 12hrs -13hrs 7 27,720.00
8 36,960 18hrs – 20hrs 7 55,440.00
2 plate hot stove 2300 7 12,075 06hrs-06:30hr 7 4,528.25
16 27,600 12hrs -13hrs 7 20,700.00
16 27,600 18hrs – 20hrs 7 41,400.00
1 plate hot stove 1000 4 3,000 06hrs-06:30hr 7 1,125.00
6 4,500 12hrs -13hrs 7 3,375.00
6 4,500 18hrs – 20hrs 7 6,750.00
Pressing Iron 35 28,875 20hrs-22hrs 3 9,281.25
Electric kettle 11 44,000 06hrs-06:15hr 4 3,142.86
Total Daily Energy consumption 379,804.46
Table 6.1c; Current daily electrical energy consump tion for staff houses
Daily sum total of energy consumption for the school is 379,804.46+138,325.91 = 518,130.37 Wh/day

91
Appendix B : Proposed scenario for energy consumption by both staff houses and other school buildings
Name of appliance
(staff houses)
QTY Rated
watts
(W)
Total run
Watts (W)
Adjusted
Wattage *
(W)
Daily hours of
use:
From-To
Days
/wk
Daily watt -
hours
(Wh)
Surge
watts
(W)
Television set 12 70 840.00 933.33 9hrs -11hrs 7 1,866.67 2,520
17 70 1,190.00 1,322.22 14hrs-17hrs 7 3,966.67 3,570
43 70 3,010.00 3,344.44 18hrs -22:30hrs 7 15,049.98 9,030
DVD 8
20
160.00 177.78 9hrs-11hrs 7 355.56
11 220.00 244.44 14hrs-17hrs 7 733.33
17 340.00 377.77 20hrs-22hrs 7 755.56
Decoder 4
30
120.00 133.33 09hrs-11hrs 7 266.67
6 180.00 200.00 14hrs-17hrs 7 600.00
13 390.00 433.33 18hrs -22:30hrs 7 1,949.98
Deep freezer-210lit 43 206 6,643.50 7,381.67 24hrs 7 106,296.00 19,930.05
Electric fan, portable 16
75
900.00 1,000.00 10hrs-13hrs 7 3,000.00 2,700
27 1,518.75 1,687.50 14hrs-17hrs 7 5,062.50 4,556.25
43 2,418.75 2,687.50 19hrs-22hrs 7 8,062.50 7,256.25
Energy saver 258 15 3,870.00 4,300.00 18hrs-23hrs 7 21,500.00
Energy saver 86 15 1,290.00 1,433.33 18hrs –06hrs 7 17,200.00
Radio cassette 11 85 701.25 799.17 08hrs- 10hrs 7 1,558.33
23 1,466.25 1,629.17 14hrs -17hrs 7 4,887.50

92
Pressing Iron 18 1,100 14,850.00 16,500.00 14hrs -15:30hrs 3 7,955.36
25 20,625.00 22,916.67 20hrs-21:30hrs 3 11,049.11
Phone charger 25 19.2 480.00 533.33 09hrs-10:30hrs 4 457.14
18 345.60 384.00 21hrs -22hrs 4 219.43
Total Daily Energy demand 212,792.29 49,562.55
Table 6.2.1b ; proposed daily electrical energy consumption for st aff houses
* In these calculations an adjustment factor of 0.9 was assumed: So adjusted watts = run watts / adjustment factor.
• Watts used in these calculations were highest rated watts of a given appliance; e.g. DVD’s may vary in wattages
depending on the make and so the highest wattage was used in the calculation of energy consumption.

93
Type of school building
Appliance QTY Rated watts (W)
Total run watts (W)
Adjusted Wattage * (W)
Daily hours of use: from - to
Days/wk
Daily watt -hour (Wh)
Surge watts (W)
Offices Head Deputy head Secretary Accounts
Fluorescent tubes 6 36 216 240.00 18hrs -21hrs 5 514.28 Computers plus Monitors
2 590
1,180 1,311.11 08hrs -13hrs 5 4,682.54 1,440 2 1,180 1,311.11 14hrs-18hrs 5 3,746.03 2 1,180 1,311.11 16hrs -20hrs 5 3,746.03
Printer 2 600 1,200 1,333.33 09hrs -10hrs 5 925.38 2 1,200 1,333.33 15hrs-16hrs 5 925.38
Electric fan, portable*
3 75 168.75 187.50 12hrs-13hrs 5 133.93 2
112.50 125.00 14hrs-20hrs 5 535.71
Classrooms Fluorescent tubes 45 36 1,620 1,800.00 18hrs -06hrs 7 21,600.00 Departmental stock rooms Industrial Arts Civic Education Mathematics Languages Science Social Science History Expressive Art Entertainment
Fluorescent tubes 14 36 504 560.00 18hrs -21hrs 5 1,200.00
Computers plus Monitors
Av4 590 2,360 2,622.22 14hrs -18hrs 5 7,492.06 2,880
Dormitories[8] Fluorescent tubes 64 36 2,304 2,560.00 18hrs -23hrs 7 12,800.00 Energy saver bulb 16 15 240 266.67 18hrs -06hrs 7 3,200.00
Staffroom Fluorescent tubes 2 36 72 80 18hrs -06hrs 7 960.00 TV + Decoder 1 70+35 105 116.67 08hrs -22hrs 7 1,633.38 210
School Tuck shop
Fluorescent tube 1 36 36 40.00 18hrs- 20hrs 6 68.57 Freezer-210lit 2 206.4 309.60 344.00 24hrs 7 4,953.60 1,238.4

94
Computer room Fluorescent tubes 2 36 72 80.00 18hrs-06hrs 7 960.00 Computers plus monitors
10 590 5,900 6,555.56 14hrs-17hrs 5 14,047.62 7,200
School Hall Fluorescent tubes 8 36 288 320.00 18hrs -06hrs 7 3,840.00 School Library Fluorescent tubes 3 36 108 120.00 18hrs -06hrs 7 1,440.00
Fluorescent tube 1 36 36 40.00 18hrs –06hrs 7 480.00 School boarding house
Freezer(210 liters)
3 206.4 464.40 516.00 24hrs 7 7,430.40 1,857.6
Fluorescent tube 6 36 216 240.00 18hrs -07hrs 7 3,120.00 Clinic Fluorescent tubes 7 36 252 280.00 17hrs-08hrs 5 3,000.00
Refrigerator 1 276 306.67 24hrs 7 4,416.00 1,104 Staff toilets Fluorescent tubes 4 36 144 160.00 18hrs -06hrs 7 1,920.00 Car park Fluorescent tubes 4 36 144 160.00 18hrs -06hrs 7 1,920.00 Total Daily Energy demand 111,690.91 15,930
Table 6.2.1c ; proposed daily electric energy demand for the scho ol
Daily sum total for the school and staff houses: 212,792.29 + 111,690.91 = 324,483.2 watt-hour
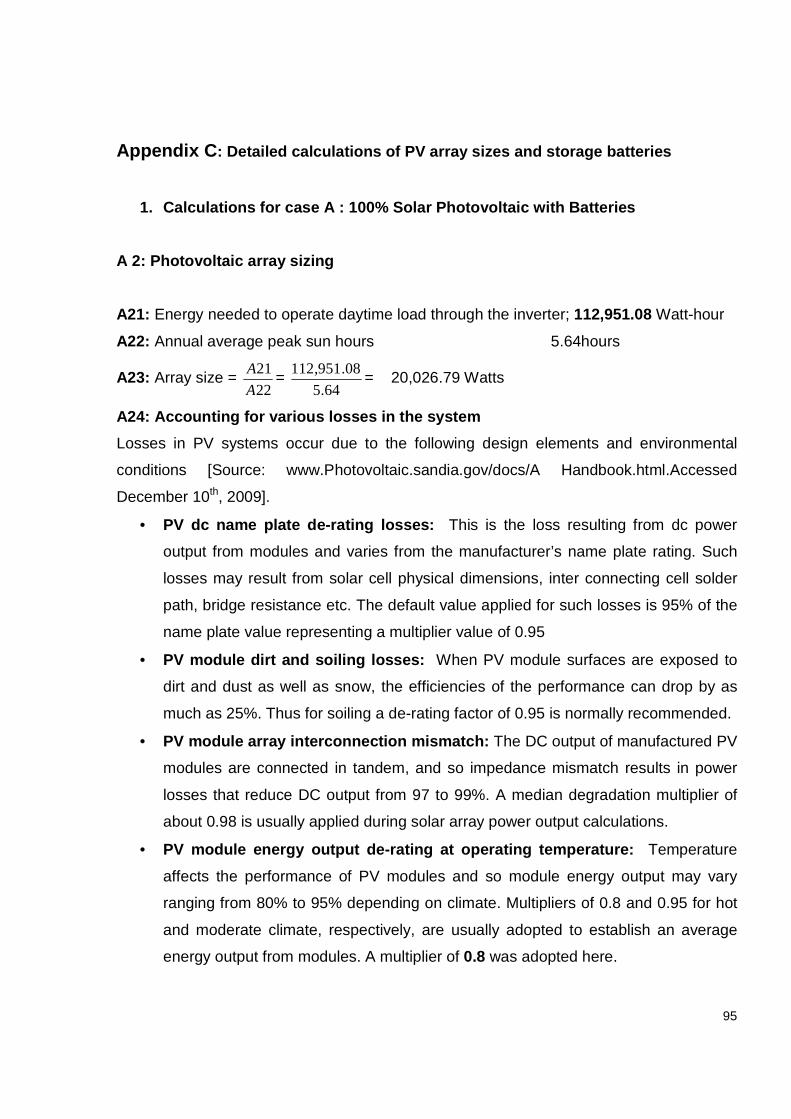
95
Appendix C : Detailed calculations of PV array sizes and stora ge batteries
1. Calculations for case A : 100% Solar Photovoltai c with Batteries
A 2: Photovoltaic array sizing
A21: Energy needed to operate daytime load through the inverter; 112,951.08 Watt-hour
A22: Annual average peak sun hours 5.64hours
A23: Array size = 22
21
A
A=
64.5
08.951,112= 20,026.79 Watts
A24: Accounting for various losses in the system
Losses in PV systems occur due to the following design elements and environmental
conditions [Source: www.Photovoltaic.sandia.gov/docs/A Handbook.html.Accessed
December 10th, 2009].
• PV dc name plate de-rating losses: This is the loss resulting from dc power
output from modules and varies from the manufacturer’s name plate rating. Such
losses may result from solar cell physical dimensions, inter connecting cell solder
path, bridge resistance etc. The default value applied for such losses is 95% of the
name plate value representing a multiplier value of 0.95
• PV module dirt and soiling losses: When PV module surfaces are exposed to
dirt and dust as well as snow, the efficiencies of the performance can drop by as
much as 25%. Thus for soiling a de-rating factor of 0.95 is normally recommended.
• PV module array interconnection mismatch: The DC output of manufactured PV
modules are connected in tandem, and so impedance mismatch results in power
losses that reduce DC output from 97 to 99%. A median degradation multiplier of
about 0.98 is usually applied during solar array power output calculations.
• PV module energy output de-rating at operating temp erature: Temperature
affects the performance of PV modules and so module energy output may vary
ranging from 80% to 95% depending on climate. Multipliers of 0.8 and 0.95 for hot
and moderate climate, respectively, are usually adopted to establish an average
energy output from modules. A multiplier of 0.8 was adopted here.

96
• DC wiring losses: A string of electrical wires that carry the DC output from PV
module to PV module and to inverter are subject to ohmic resistance losses. These
losses could be substantially reduced, of course, by proper sizing of wires and
conduits. DC wiring losses account for 97% to 99% of system performance
efficiency. Therefore a 3% DC voltage drop for PV-Battery charging circuit is
adopted here [Source: www.buildsolar.com/References/pvwiring.htm. Accessed
02/09/11]. This represents a multiplier of 0.97
• AC wiring losses: Similarly AC wiring from inverters to the switch gear or service
power distribution hardware are also subject to voltage drop, conduit loss de-rating
and, conduit solar exposure. These losses likewise could be substantially reduced
by proper engineering design; however, a median loss multiplier value of 0.99 is
generally adopted in calculations
• Inverter and matching transformer losses: These losses are a result of the
conversion of DC power to AC power. The efficiency of the inverters normally
used in solar power range from 88% to 96%. The mean value multiplier by
standard testing condition power rating is a value of 0.92. Here a value of 0.9 has
been adopted and these losses accounted for in the adjusted watts.
• Voltage drop in domestic supply lines between batte ry bank and / or PV
generator and the load: Losses in electricity distribution to customers differ for
customers connected at different voltages. Customers connected to high voltage
may experience approximately 2.6% in voltage drop; customers connected to
medium voltage 6.4% and those connected to low voltage supply experience
approximately 12.2% in voltage drop.
[Source:en.wikipedia.org/wiki/Diesel_generator. Accessed 26/05/10]. Thus voltage
drop in domestic supply lines which usually is low voltage is approximately 12.2%
representing a multiplier of 0.878
A25: Array size taking into account losses as listed above
(A23) / (product of these loss factors)
= 878.0*997.0*99.0*97.0*8.0*98.0*95.0*95.0
79.026,20= 33,670.64 Watts

97
A26: Actual energy to be generated to operate daytime load is (A25)*(A22)
= 33,670.64*5.64 = 189,902.41 watt-hours
A27: Energy needed to operate the evening, night time and early morning load from
batteries through the inverter is 215,278.13 watt-hours
A28: Dividing A27 by A22 i.e. 215,278.13 / 5.64 = 38,169.88 watts
A29: Taking into account all losses as listed in A24 above,
878.0*997.0*99.0*97.0*8.0*98.0*95.0*95.0
88.169,38
= 62,890.78 watts
A210: Taking into account solar charge regulator/ controller efficiency
yrefficiencecontrolleCh
A
arg
29=
9.0
78.890,62 = 69,878.65 Watts
A211: Adjusting upwards to account for battery efficiency
iciencyBatteryeff
A210=
85.0
78.890,69 = 82,224.45 Watts
A212: Actual energy to be generated for the evening, night time and early morning load
through batteries and the inverter; A212*A22 = 82,224.45*5.64 = 463,745.90 watt-hours
A213: Total energy to be generated daily to operate both daytime, evening, night time and
early morning load = 463,745.90+189,902.41= 653,648.31 watt-hours
A214: Multiplying A213 by a factor of 1.5 to allow for extra capacity of solar photovoltaic to
fully charge the batteries. 653,648.31*1.5 = 980,472.47 watt-hours
A215: Selected PV module maximum power Voltage at standard testing conditions 20.2 V
A216: Selected PV module guaranteed power output at STC 430W
A217: Daily energy output per module. (A216)*(A22) = 430*5.64 = 2,425.2 Watt-hours
A218: Number of modules required to meet the daily energy demand (A214) / (A217)
= 20.425,2
47.472,980 = 405 modules! (Rounded up from actual value of 404.28)
A219: Number of modules required per string. (System voltage)/ (A215) = 2.20
240 = 12
modules (rounded up from actual 11.88)

98
A220: Number of strings required in parallel. This is obtained by dividing the number of
modules needed to meet the energy requirement (A218) by the number of modules per
string (A219)
= 219
218
A
A=
12
405= 34 strings (rounded up from actual 33.75)
A221: Number of strings to be purchased. This is obtained by multiplying the number of
modules required per string (A218) by number of strings in parallel (A220)
= (A218)*(A220) = 12*34 = 408 modules!
A222: Nominal rated PV module output. This is the value stated by the manufacturer-
430W
A223: Nominal rated array output. Multiplying the number of modules to be purchased
(A221) by nominal rated module output (A216); 408*430 = 175,440 Watts or 175.44 KW
Note: This value is used to determine the cost of Photovoltaic array system.
A3: Battery sizing
A31: Days of storage here is assumed to be 5.
A32: Allowable depth of discharge. This represents the maximum fraction of capacity that
can be withdrawn from the battery. Here a value of 50% depth of discharge has been
adopted.
A33: Required battery capacity in amp-hour. This is determined by dividing the required
load (energy needed to operate the evening, night time and early morning load) by the
system voltage and then the result divided by the allowable depth of discharge. Therefore
total amp-hour =240
13.278,215 = 897 Ah/day*5(days of storage) = 4,484.96 Ah
Dividing by depth of discharge; 5.0
96.484,4= 8,969.92 Ah
A34: Amp-hour capacity of selected battery [Exide 6E120-15. The battery type is durable
and has long life cycle and rugged construction] is 942 Ah
A35: Number of batteries in parallel. This is also the number of batteries or battery cells
needed to provide the required capacity of 8,969.92Ah. This is obtained by dividing the
required battery capacity by amp-hour capacity of selected battery. So (A33) / (A34)

99
=942
92.969,8 = 10 batteries (rounded up from actual 9.52)
A36: Number of batteries in series. This number provides the necessary DC system
voltage and is determined by dividing the battery bus voltage by the selected battery or
battery cell voltage (This is taken from the manufacturer), in this case 12V
= 12
240 = 20 batteries
A37: The total number of batteries is then obtained by multiplying the number of batteries
in parallel (A35) by the number of batteries in series (A36)
Therefore, (A35)* (A36) =10*20 = 200 batteries!
A38: Total battery amp-hour capacity. This is determined by multiplying the number of
batteries in parallel (A35) by the amp-hour capacity of the selected battery (A34)
Thus, (A34)* (A35) = 10*942= 9,420 Ah
A39: Total battery Kilowatt-hour capacity. The KWh or energy capacity is determined by
first multiplying the total amp-hour capacity (A38) by the battery voltage and then dividing
by 1000.
So (A38)*(12) 9,420*12= 113,040/1000 =113.04 KWh
2. Calculations for case B hybrid
B1: Photovoltaic Array sizing
B11: Energy needed to operate daytime load through the inverter; 112,951.08 Watt-hour
B12: Array size = 22
11
A
B=
64.5
08.951,112 = 20,026.79 Watts
B13: Array size taking into account all losses in the system as mentioned in A24 above
878.0*997.0*99.0*97.0*8.0*98.0*95.0*95.0
79.026,20= 33,670.64 Watts
B14: Actual energy to be generated to operate daytime load is (B13)*(A22)
= 33,670.64*5.64 = 189,902.41 watt-hours
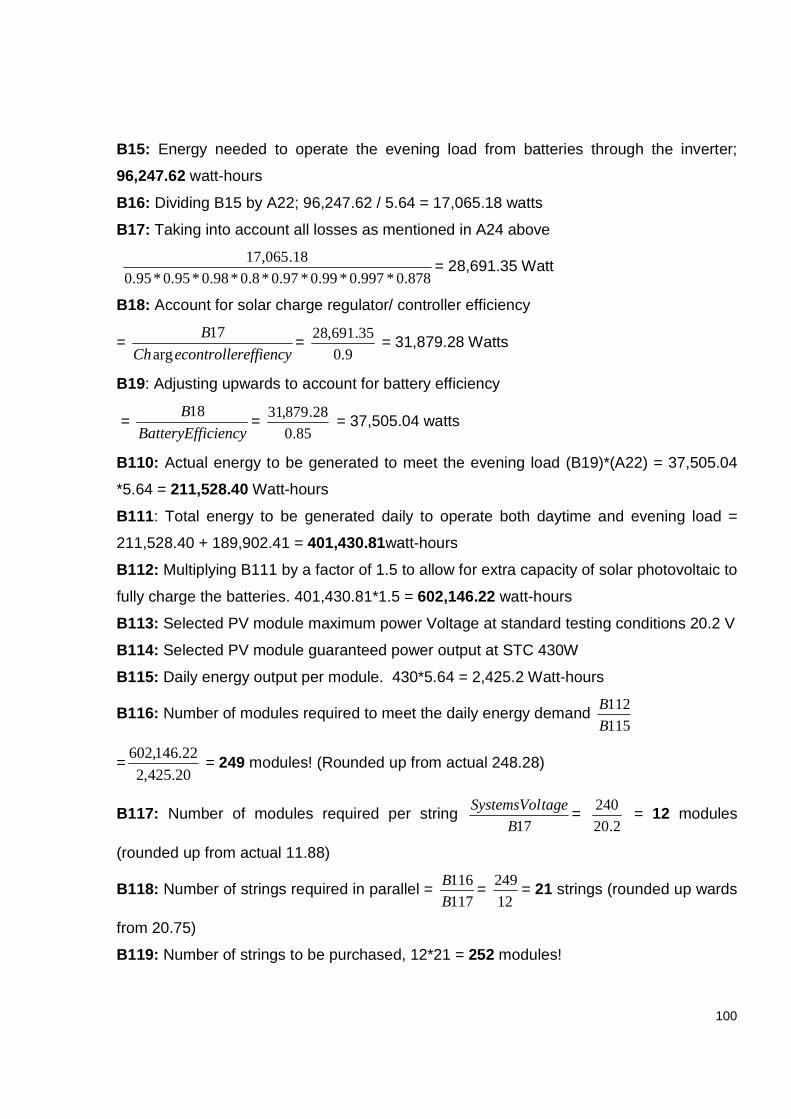
100
B15: Energy needed to operate the evening load from batteries through the inverter;
96,247.62 watt-hours
B16: Dividing B15 by A22; 96,247.62 / 5.64 = 17,065.18 watts
B17: Taking into account all losses as mentioned in A24 above
878.0*997.0*99.0*97.0*8.0*98.0*95.0*95.0
18.065,17= 28,691.35 Watt
B18: Account for solar charge regulator/ controller efficiency
= reffiencyecontrolleCh
B
arg
17=
9.0
35.691,28 = 31,879.28 Watts
B19: Adjusting upwards to account for battery efficiency
= iciencyBatteryEff
B18=
85.0
28.879,31 = 37,505.04 watts
B110: Actual energy to be generated to meet the evening load (B19)*(A22) = 37,505.04
*5.64 = 211,528.40 Watt-hours
B111: Total energy to be generated daily to operate both daytime and evening load =
211,528.40 + 189,902.41 = 401,430.81watt-hours
B112: Multiplying B111 by a factor of 1.5 to allow for extra capacity of solar photovoltaic to
fully charge the batteries. 401,430.81*1.5 = 602,146.22 watt-hours
B113: Selected PV module maximum power Voltage at standard testing conditions 20.2 V
B114: Selected PV module guaranteed power output at STC 430W
B115: Daily energy output per module. 430*5.64 = 2,425.2 Watt-hours
B116: Number of modules required to meet the daily energy demand 115
112
B
B
=20.425,2
22.146,602 = 249 modules! (Rounded up from actual 248.28)
B117: Number of modules required per string 17B
tageSystemsVol=
2.20
240 = 12 modules
(rounded up from actual 11.88)
B118: Number of strings required in parallel = 117
116
B
B=
12
249= 21 strings (rounded up wards
from 20.75)
B119: Number of strings to be purchased, 12*21 = 252 modules!

101
B114: Nominal rated array output, 252*430 = 108,360 W or 108.36 KW
B2. Battery sizing
With generator back up, 3 day autonomy is assumed to be sufficient here.
B21: Required battery amp-hour capacity; 240
62.247,96 = 401.03 Ah Dividing by depth
of discharge and multiplying by days of storage; 5.0
03.401= 802.06*3(days of storage) =
2,406.19 Ah
B22: Amp-hour capacity of selected battery [Exide 6E120-15] with capacity of 942 Ah
B23: Number of batteries in parallel, (B21) / (B22) = 942
19.406,2 = 3 batteries (rounded up
from actual 2.55)
B24: Number of batteries in series, 12
240 = 20 batteries
B25: Total number of batteries, (B23)* (B24) = 3*20 = 60 batteries!
B26: Total battery amp-hour capacity, (B23)* (B22) = 3*942= 2,826 Ah
B27: Total battery Kilowatt-hour capacity 2,826*12= 33,912/1000 = 33.91 KWh
3. Calculations for case C hybrid
C1: Photovoltaic Array sizing
C11: Energy needed to operate daytime load (from 08:00 hrs-17:00hrs) directly through
the inverter; 112,951.08 Watt-hour
C12: Array size = 22
11
A
C=
64.5
08.951,112 = 20,026.79 Watts
C13: Array size taking into account all losses in the system as mentioned in A24 above

102
878.0*997.0*99.0*97.0*8.0*98.0*95.0*95.0
79.026,20= 33,670.64 Watts
C14: Energy to be generated to operate daytime load is (C13)*(A22)
= 33,670.64*5.64 = 189,902.41 watt-hours
C15: Energy needed to operate the nighttime and early morning load (23:00 hrs-08:00
hrs) from batteries through the inverter; 83,631.19 watt-hours
C16: Dividing C15 by A22; 83,611.72 / 5.64 = 14, 828.22 watts
C17: Taking into account all losses as mentioned in A24 above
878.0*997.0*99.0*97.0*8.0*98.0*95.0*95.0
22.828,14= 24,930.40 Watts
C18: Accounting for solar charge regulator/ controller efficiency
= reffiencyecontrolleCh
C
arg
17=
9.0
40.930,24 = 27,700.45 Watts
C19: Adjusting upwards to account for battery efficiency
= iciencyBatteryEff
C18=
85.0
45.700,27 = 32,588.76 watts
C110: Energy to be generated to meet the night time and early morning load (C19)*(A22)
= 32,588.76 *5.64 = 183,800.60 Watt-hours
C111: Total energy to be generated daily to operate daytime, night time and early morning
load = 183,800.60 + 189,902.41 = 373,703.02 watt-hours
C112: Multiplying C111 by a factor of 1.5 to allow for extra capacity of solar photovoltaic
to fully charge the batteries. 373,703.02*1.5 = 560,554.52 watt-hours
C113: Selected PV module maximum power Voltage at standard testing conditions 20.2 V
C114: Selected PV module guaranteed power output at STC 430W
C115: Daily energy output per module. (C114)*(A22) = 430*5.64 = 2,425.2 Watt-hours
C116: Number of modules required to meet the daily energy demand 115
112
C
C
=20.425,2
52.554,560 = 232 modules! (Rounded up from actual 231.14)
C117: Number of modules required per string 113C
tageSystemsVol=
2.20
240 = 12 modules
(rounded up from actual 11.88)

103
C118: Number of strings required in parallel; 117
116
C
C=
12
232= 20 strings (rounded up from
actual 19.33)
C119: Number of strings to be purchased; 12*20 = 240 modules!
C120: Nominal rated array output; 240*430 = 103,200 W or 103.2KW
C2. Battery sizing
With generator back up, 3 day autonomy is assumed to be sufficient here.
C21: Required battery amp-hour capacity is given by; 240
19.631,83 = 348.46 Ah
Dividing by depth of discharge; 5.0
46.348= 696.93*3 day autonomy = 2,090.79Ah
C22: Amp-hour capacity of selected battery [Exide 6E120-15] with capacity of 942 Ah
C23: Number of batteries in parallel; 942
79.090,2 = 3 batteries (rounded up from actual 2.22)
C24: Number of batteries in series; 12
240 = 20 batteries
C25: The total number of batteries; (C23)* (C24) = 3*20 = 60 batteries!
C26: Total battery amp-hour capacity; (C23)* (C22) = 942*3= 2,826 Ah
C27: Total battery Kilowatt-hour capacity; (C26)*(A12) =2,826*12= 33,912/1000
=33.912KWh

104
4. Calculations for case D hybrid
D1: Photovoltaic Array sizing
D11: Energy needed to operate day time load (from 08:00 hrs-17:00 hrs) directly through
the inverter 112,951.08 Watt-hours
D12: Array size = 22
11
A
D=
64.5
08.951,112 = 20,026.79 Watts
In addition to various losses as defined in A26 above, D12 is multiplied by a fudge factor
of 1.5 to allow extra capacity for photovoltaic system to recharge the batteries; so
20,026.79*1.5 = 30,040.19 Watts
D13: Array size taking into account all losses in the system as mentioned above
= 878.0*997.0*99.0*97.0*8.0*98.0*95.0*95.0
79.026,20= 33,670.64 Watts
D14: Array size taking into account solar charge regulator/ controller efficiency
= trollerCharegeCon
D13=
9.0
64.670,33 = 37,411.83 Watts
D15: The watts required by the load are adjusted upwards to account for battery efficiency
= iciencyBatteryEff
D14=
85.0
64.670,37 = 37,745.29 Watts
D16: Actual energy to be generated to meet the daytime load (D15)*(A22) =
37,745.29*5.64 = 212,883.46 Watt-hours
D17: D16 is multiplied by a factor of 1.5 to allow extra capacity for photovoltaic to charge
batteries; 212,883.46*1.5 = 319,325.19 watt-hours
D18: Selected PV module maximum power Voltage at standard testing conditions 20.2 V
D19: Selected PV module guaranteed power output at STC 430W
D110: Daily energy output per module (D18)*(A22) = 430*5.64 = 2,425.2 Watt-hours
D111: Number of modules required to meet the daily energy demand 110
17
D
D
=20.425,2
19.325,319 = 132 modules! (Rounded up from actual 131.67)

105
D112: Number of modules required per string 2.20
240 = 12 modules (rounded up from actual
11.88)
D113: Number of strings required in parallel= 112
111
D
D=
12
132= 11 strings
D114: Number of strings to be purchased, 12*11 = 132 modules!
D115: Nominal rated array output; 132*430 = 56,760 W or 56.76 KW
D2. Battery sizing
With generator back up, 3 day autonomy is assumed to be sufficient here.
D21: Required battery amp-hour capacity is given by; 240
08.951,112 = 470.63 Ah. Dividing
by depth of discharge; 5.0
63.470= 941.26*3day autonomy = 2,823.78 Ah
D22: Amp-hour capacity of selected battery [Exide 6E120-15] with capacity of 942 Ah
D23: Number of batteries in parallel; 942
78.823,2 = 3 batteries (rounded up from actual 2.99)
D24: Number of batteries in series; 12
240 = 20 batteries
D25: The total number of batteries is 3*20 = 60 batteries!
D26: Total battery amp-hour capacity; 942*3= 2,826 Ah
D27: Total battery Kilowatt-hour capacity; 2,826 *12= 33,912/1000 = 33.91 KWh

106
Appendix D: Formulas for calculating present worth factors for future one time
investment and present worth factors for future rec urring investment
FPW –one = Future cost / Future value
= [(1+i)/ (1+d)] n ; where FPW –one is the present worth factor for future one time
investment, i and d are inflation rate and discount rate respectively and n is the number of
years in which the investment is made.
PWone = C0 [(1+i)/ (1+d)] n ; where C0 is the present cost of a product and PWone is the
present worth for the actual one time investment in n years down the line.
PWrec-beg = C0 + C0 [(1+i)/ (1+d)] + C 0 [(1+i)/ (1+d)] 2 + …+ C0 [(1+i)/ (1+d)] n-1 ; where
PWrec-beg is present worth of future recurring investment made in the beginning of the year
e.g. buying diesel for the diesel generator.
PWrec-end = C0 [(1+i)/ (1+d)] + C 0 [(1+i)/ (1+d)] 2 + …+ C0 [(1+i)/ (1+d)] n ; where PWrec-end is
investment made at the end of the year e.g. buying grease for the diesel generator. In the
above equations there are n purchases made in the life time of the system. The equation
can be simplified if (1+i)/ (1+d) is replaced by k and the above equations become;
PWrec-beg = C0 [(1- k n)/ (1- k)] , and PWrec-end = C0k [(1- k n)/ (1- k)] = C0 FPW –rec-end; where
FPW –rec-end = k[(1- k n)/ (1- k)] ; and FPW-rec-beg = [(1- k n)/ (1- k)] ; where n is number of
years.
So with the current inflation rate of 7.53% and interest rate of 6.05% the value of k is
calculated as follows:
k = (1+0.0753)/ (1+0.0605) = 1.014
FPW-rec-beg = [(1- kn)/ (1- k)]; where n is equal to 25 years
FPW-rec-beg = (1-1.4156)/(1-1.014) = 29.69
FPW –rec-end = k[(1- k n)/ (1- k)]; where n is equal to 25 years
FPW –rec-end = 1.014*= (1-1.4156)/(1-1.014) = 30.1

107
Appendix E : Performance monitoring of some diesel power plants in
Northwestern, Western and Lusaka provinces. [Source : ZESCO Head office-Lusaka]
Diesel Power station Quarter(2008) Chavuma Kabompo Mufumbwe Zambezi ThirdQuarter: Oct Installed capacity (KW)
220
580
380
448
Running time(hours)
434
443
478
476
Units generated(KWh)
43840
90670
71,125
72,670
Maximum load(KW)
205
405
276
256
Average load(KW) 190
400
190
180
Maintenance Routine maintenance
Changing of oil and fuel filters
Changing of oil and fuel filters
Changing of oil and fuel filters
Changing of oil and fuel filters
Fuel supply(liters) 34,250
139,300
33,100
61,433
Daily fuel consumption(lit)
609
2,200
1,000
1,000
ThirdQuarter: Nov Installed capacity (KW)
220
580
380
896
Running time(hours)
495
486
476
832
Units generated(KWh)
52,787
117510
72,670
176110
Maximum load(KW)
194
468
256
705
Average load(KW) 180
405
180
600
Maintenance Routine maintenance
Changing of oil and fuel filters
Changing of oil and fuel filters
Changing of oil and fuel filters
Fuel supply(liters) Nil 23,500 31,300 51,641 Daily fuel consumption(lit)
658
1,000
2,000
Third Quarter: Dec

108
Installed capacity (KW)
220 580 380 896
Running time(hours)
507
407
480
832
Units generated(KWh)
53,665
120,890
71,435
176110
Maximum load(KW)
185
442
263
705
Average load(KW) 170
415
190
600
Maintenance Routine maintenance
Changing of oil and fuel filters
Changing of oil and fuel filters
Changing of oil and fuel filters
Changing of oil and fuel filters
Fuel supply(liters) 35,600 33,400 Nil 46,821 Daily fuel consumption(liters)
662
2,000
1,000
2,000
Luangwa district: April – September 2009 Description Installed capacity(KW)
Maximum demand(KW)
Units generated(KWh)
Fuel consumed(Liters)
Lubrication oil used(Liters)
1,280 440 913,572 272,010 306 Lukulu district: January – July 2009 Description Installed capacity(KW
Maximum demand(KW)
Units generated(KWh)
Fuel consumed(Liters)
Lubrication oil used(Liters)
832 488 908,522 259,758 605
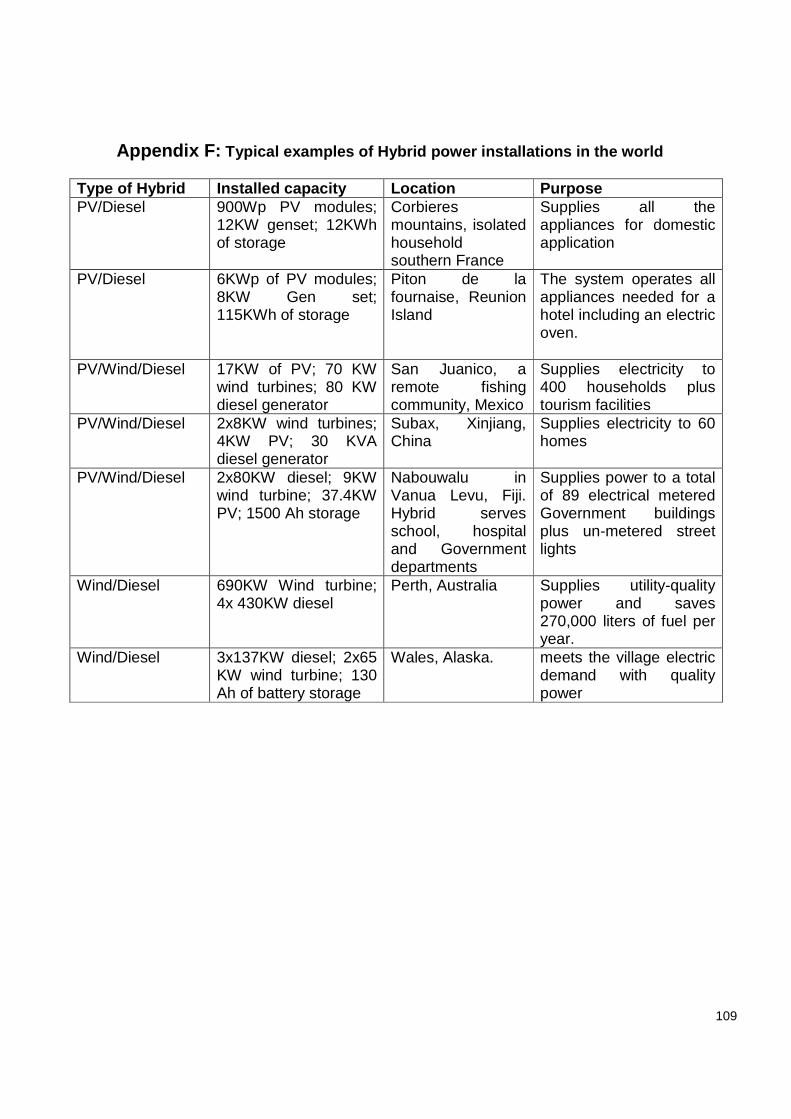
109
Appendix F: Typical examples of Hybrid power installations in t he world
Type of Hybrid Installed capacity Location Purpose PV/Diesel 900Wp PV modules;
12KW genset; 12KWh of storage
Corbieres mountains, isolated household southern France
Supplies all the appliances for domestic application
PV/Diesel 6KWp of PV modules; 8KW Gen set; 115KWh of storage
Piton de la fournaise, Reunion Island
The system operates all appliances needed for a hotel including an electric oven.
PV/Wind/Diesel 17KW of PV; 70 KW wind turbines; 80 KW diesel generator
San Juanico, a remote fishing community, Mexico
Supplies electricity to 400 households plus tourism facilities
PV/Wind/Diesel 2x8KW wind turbines; 4KW PV; 30 KVA diesel generator
Subax, Xinjiang, China
Supplies electricity to 60 homes
PV/Wind/Diesel 2x80KW diesel; 9KW wind turbine; 37.4KW PV; 1500 Ah storage
Nabouwalu in Vanua Levu, Fiji. Hybrid serves school, hospital and Government departments
Supplies power to a total of 89 electrical metered Government buildings plus un-metered street lights
Wind/Diesel 690KW Wind turbine; 4x 430KW diesel
Perth, Australia Supplies utility-quality power and saves 270,000 liters of fuel per year.
Wind/Diesel 3x137KW diesel; 2x65 KW wind turbine; 130 Ah of battery storage
Wales, Alaska. meets the village electric demand with quality power

110
Appendix G: Daily Load calculation work sheet used to assess th e energy demand by the community of Luangwa secondary school .
Daily Load Calculation Work sheet
Name of appliance
QTY
Total rated Watts
Daily hours of use
Days/ Week
Daily Watt-hours
Television set
Decoder
Refrigerator /Freezer
Electric fan
Video cassette recorder
Computer
Monitor
Printer
Fluorescent tubes
Electric Bulbs
DVD recorder/player
Radio/Radio cassette
Speakers
VCD player
Cooking appliance • 4 plate cooker • 2 plate hot stove
• 1 plate hot stove

111
Pressing Iron
Micro wave oven
Electric kettle
Barbing machine
Photocopier
Fax machine
Sawing machine
Cell phone charger
Others
Total