economic evaluation of the lord howe island rodent ... · economic evaluation of the lord howe...
TRANSCRIPT

Gillespie Economics
Gillespie Economics 1
Economic Evaluation of the Lord
Howe Island Rodent Eradication
Project Final Report
www.gillespieeconomics.comau Gillespie Economics
November 2016

Gillespie Economics 2
Gillespie Economics
Disclaimer
All surveys, forecasts, projections, findings and recommendations made in this report are made in
good faith on the basis of information available at the time; and achievement of objectives,
projections or forecasts set out in this report will depend among other things on the actions of the
NSW Government and their agents, over which we have no control. Notwithstanding anything
contained therein, neither Gillespie Economics nor its servants or agents will, except as the law may
require, be liable for any loss or other consequences arising out of the project.
Contact
Dr Rob Gillespie
Principal
Gillespie Economics
PO Box 171
West Ryde, NSW 1685
Telephone: (02) 9804 8562
Mobile: 0419 448 238
Email: [email protected]
Web: gillespieeconomics.com
Gillespie Economics 3
Gillespie Economics
Table of Contents Key Points ................................................................................................................................................................ 5
Executive Summary ................................................................................................................................................ 6
1 Introduction ............................................................................................................................................ 15
1.1 Contextual Background ................................................................................................................................................. 15
1.2 Purpose and Scope of this Consultancy ................................................................................................................. 16
2 Economic Values .................................................................................................................................... 17
2.1 Total Economic Value Framework ............................................................................................................................. 17
2.2 Measures of Economic Value ...................................................................................................................................... 19
3 Overview of Cost Benefit Analysis ....................................................................................................... 20
3.1 Introduction ........................................................................................................................................................................ 20
3.2 CBA Method ....................................................................................................................................................................... 20
3.3 Definition of Society ....................................................................................................................................................... 20
3.4 Valuation of Market and Nonmarket Costs and Benefits ............................................................................... 21
3.5 Risk and Uncertainty ....................................................................................................................................................... 21
3.6 Evaluation Period ............................................................................................................................................................. 22
3.7 Discounting ........................................................................................................................................................................ 22
3.8 Consideration of the Distribution of Costs and Benefits ................................................................................. 22
3.9 Consideration of Other Objectives of Government ........................................................................................... 23
3.10 Key Steps in Cost Benefit Analysis ............................................................................................................................ 23
4 Cost Benefit Analysis of the Rodent Eradication Project ................................................................. 25
4.1 Scope and Objectives of the Analysis ..................................................................................................................... 25
4.2 Constraints .......................................................................................................................................................................... 25
4.3 Specification of the "With" and "Without" Rodent Eradication Project .................................................... 25
4.3.1 The "Without" Rodent Eradication Project Scenario. ................................................................................. 25
4.3.2 The "With" Rodent Eradication Project Scenario ......................................................................................... 27
4.3.3 Comparison ............................................................................................................................................................... 33
4.4 Identification of Incremental Costs and Benefits ................................................................................................ 33
4.5 Quantification and Valuation of the Costs and Benefits ................................................................................. 34
4.5.1 Direct Costs ................................................................................................................................................................ 34
4.5.2 Biodiversity ................................................................................................................................................................. 35
4.5.3 Tourism........................................................................................................................................................................ 40
4.5.4 Palms and Vegetables ........................................................................................................................................... 48
4.5.5 Health and Toxicity ................................................................................................................................................. 49
4.5.6 Wastage and Amenity ........................................................................................................................................... 52
4.5.7 Research ...................................................................................................................................................................... 52
4.6 Results ................................................................................................................................................................................... 52
4.7 Distribution of Costs and Benefits ............................................................................................................................ 55
4.8 Sensitivity analysis ........................................................................................................................................................... 60
5 Impacts of the Rodent Eradication Project on the Lord Howe Island Economy ........................... 62
5.1 Introduction ........................................................................................................................................................................ 62
5.2 Economic Activity Impacts ........................................................................................................................................... 62
5.3 Mitigation Measures ....................................................................................................................................................... 64
6 Conclusion............................................................................................................................................... 66
7 References ............................................................................................................................................... 67
8 Appendices ............................................................................................................................................. 69
Gillespie Economics 4
Gillespie Economics
Table List
Table ES1 - Potential Additional Costs and Benefits of the LHI REP
Table ES2 - Present Value of Incremental Costs and Benefits (@7% discount rate)
Table 4.1 - Potential Incremental Costs and Benefits of the LHI REP
Table 4.2 - Implicit Prices Per Household Per Annum for Five Years for Protection of a Native Species
Table 4.3 - Probability Assumptions
Table 4.4 - Special LHI Distribution Partners.
Table 4.5 - May to August Demand for Beds (2012/13) and Demand from the REP
Table 4.6 - Present Value of Incremental Costs and Benefits (@7% discount rate)
Table 4.7 - Tour Operators and Shops that are Normally Open in July
Table 4.8 - Present Value of Incremental Costs and Benefits Outside LHI (@7% discount rate)
Table 4.9 - Present Value of Incremental Costs and Benefits to LHI Residents (@7% discount rate)
Table 4.10 - CBA Sensitivity Testing (Present Value $Millions and Benefit Cost Ratio)
Table 5.1 - Changes in Short Term Economic Activity on LHI as a result of the REP
Table 5.2 - Changes in Long Term Economic Activity on LHI as a result of the REP
Table A1.1 - Main Types of Environmental Valuation Techniques
Table A2.1 - Probability of Species Extinctions From the REP
Table A2.2 - Risk Table
Figures
Figure 2.1 - Components of Total Economic Value of Lord Howe Island and Surrounds: Use and Nonuse
Values
Figure 4.1 - Aerial Application Method
Figure 4.2 - Indicative Treatment Areas by Method
Figure 4.3 - Native Species on LHI 'With' and 'Without' the REP
Figure 4.4 - Seasonal Arrivals Trends 2012/13 Financial Year
Figure A1.1 - Measures of Economic Value
Figure A3.1 - Annual Demand and Supply for LHI Tourism Visitation in Peak and Off-Peak Periods
Figure A3.2 - Tourism Economic Values under Base Levels of Demand
Figure A3.3 - Tourism Economic Values under Increased Levels of Demand
Boxes
Box 3.1 - Steps in Cost Benefit Analysis
Appendix List
Appendix 1 - Measures of Economic Value
Appendix 2 - Probability of Species Extinctions from the REP
Appendix 3- Tourism Economics for Lord Howe Island
Appendix 4 - Estimation of Demand and Supply Curves for LHI Tourism

Gillespie Economics 5
Gillespie Economics
Key Points
Investing in the Rodent Eradication Plan (REP) will create net benefits for Australia. It is justified
on economic efficiency grounds.
The REP will provide net benefits to the residents of Lord Howe Island and those living
elsewhere in Australia.
The REP will create net benefits by improving biodiversity, tourism opportunities and the
profits of the Kentia Palm and fresh vegetable industry on Lord Howe Island.
These results are robust to variations in assumptions that underpin the analysis.
It is likely that there will be minimal or no reduction in visitation to Lord Howe island when the
rodent baiting takes place. At worst, reductions will be off-set by intending tourists re-
scheduling their visits..
It is reasonable to expect that there will be minimal or no reduction in visitation at the time of
the REP, or at least in the off-peak period overall (allowing for tourists rescheduling their visits
in the off-peak period).
The short term impacts of the REP on tourist demand for accommodation will be more than
offset by the demand for accommodation of the REP workforce.
Where the REP workers have similar spending patterns to tourists, then impacts on tour
operators, food providers and shops will also be offset.
Where the REP workers spending patterns are different to those of tourists, tour operators, and
to a lesser extent food and shopping providers may be worse-off in the short term i.e. July
2017.
These potential short term impacts would be offset if there was an increase in off-peak
visitation by 0.4% (29 people) because of the eradication of rodents. Increases in visitor
numbers due to the REP are likely to be considerably greater than this.
Potential short term impacts of the REP on tourism operators, shops and food outlets could be
reduced by:
promoting local purchases to the REP workers;
giving REP workers tour and restaurant vouchers; and,
mandating the use of tourist operators’ vehicles and boats where required for REP
operations.

Gillespie Economics 6
Gillespie Economics
Executive Summary
Introduction
The Lord Howe Island Group (Lord Howe Island (LHI) and outlying islands, islets and rocks) has
outstanding natural features and values, and is on the Register of the National Estate. It is also
listed as a World Heritage Area (WHA) and is located within the Lord Howe Island Marine Park
(NSW) and the Lord Howe Commonwealth Marine Reserve (under Commonwealth authority).
The environmental, tourism and industry values associated with the LHIG, and in particular LHI, are
being adversely impacted by introduced species of rats and mice, despite an ongoing rodent
control program.
"With" and "Without" the Rodent Eradication Project
The LHI Rodent Eradication Project (REP) is a proposal to eradicate introduced rodents from LHI
using cereal baits laced with the anticoagulant Brodifacoum dispersed from helicopters in the
uninhabited areas, and a combination of hand broadcasting, bait stations and bait trays in the
settled area.
"Without" the REP, the current rodent control program would continue with ongoing control costs,
continued presence of poison in the environment, continued impacts on the Kentia Palm and
nursery industry, further degradation of World Heritage values (including endemic and threatened
species) and the potential for the LHIG to be inscribed on the “World Heritage in Danger List”.
Cost Benefit Analysis
Cost Benefit Analysis (CBA) provides a comparison of the additional costs and benefits "with" the
REP, relative to "without" the REP. Costs are measured in terms of reductions in producers’ net
revenues (producers’ surpluses) and benefits to consumers (consumers’ surpluses), while benefits
are measured in terms of increases in producers’ and consumer’s surpluses.1
Provided the present value2 of additional benefits exceed the present value of additional costs (i.e.
a net present value (NPV) of greater than zero or a benefit cost ratio (BCR) of greater than one), a
project is considered to improve the wellbeing of society and hence is desirable from an economic
efficiency perspective.
1 Consumer surplus is the difference between what an individual would be willing to pay (demand) for a good or service
(the total benefit to the consumer) and what they have to pay (the cost to the consumer i.e. consumer expenditure or price
times quantity). In the market model, it is the area between the demand curve and the price line. Producer surplus is the
difference between the revenue (consumer expenditure) received for a good or service (total benefit to producer) and the
costs (supply) of the inputs used in the provision of the good or service (economic cost to producer). In practical terms, it is
the net revenue (before tax) that is earned by producer of goods and services (James and Gillespie 2002). In the market
model, it is the area between the price line and the supply curve. 2 The present value of a benefit or cost arising in the future takes into account the value of time through the process of
‘discounting’. Discounting acts in the opposite way to ‘compounding’ where an amount received now is worth more in the
future.

Gillespie Economics 7
Gillespie Economics
Additional Costs and Benefits of the REP
Relative to the "without" REP scenario of ongoing rodent control program, the REP would have the
following additional costs and benefits to the Australian community.
Table ES1 - Potential Additional Costs and Benefits of the LHI REP
Category Costs Benefits
Direct costs REP direct implementation costs Avoided ongoing rodent control costs -
LHI and residents
Biodiversity Potential for species extinction from the
REP
Costs of returning extant species to LHI
Biodiversity improvements
- prevention of additional extinctions
- increased abundance of species
- return of extant species to LHI
Tourism Foregone tourism business during REP
implementation
Additional demand for accommodation
during REP implementation
Additional tourism business after REP
implementation
Palms and vegetables Increased productivity for Kentia Palm
and vegetable industry and avoided
direct costs
Increased productivity of other
vegetable gardens
Health and toxicity Potential impacts on other species,
water and human health
Reduced impacts to humans, livestock
and pets from constant presence of
rodent poison
Elimination of health impacts from
rodents for residents and tourists
Wastage and amenity Elimination of spoiled foodstuffs and
the presence of rodent excrement on
LHI
Research Research benefits of the program
Estimation of the Additional Costs and Benefits of the REP3
Direct costs
The LHI REP has estimated capital costs of $10.6M, although approximately $1.5M of this is already
spent and hence in accordance with NSW Treasury (2007) is excluded from the analysis.
Incremental ongoing biodiversity monitoring costs associated with the REP are estimated at
$50,000 per year for 10 years, with ongoing rodent detection (quarantine) costs of $30,000 per
year. "With" the implementation of the REP, the LHIB would avoid ongoing rodent control costs of
$85,000 per annum and residents would avoid private bait costs of $4,800 per annum.
3 All values reported here are pre-discounting and pre application of probability weights.

Gillespie Economics 8
Gillespie Economics
Biodiversity
The biodiversity benefits of the REP include:
avoiding seven additional extinctions on LHI over the next 20 years4;
the ability to return four species that are extant from LHI due to the predation of rats and mice
such as the Kermadec petrel, White-bellied storm petrel, phasmid and wood feeding
cockroach; and an
increase in abundance of plants, birds, reptiles and insects.
Based on benefit transfer from a choice modelling study of environmental improvements
(including protection of species from extinction) in three NSW catchments, a conservative value of
$8M per species prevented from extinction or returned to LHI is adopted. Because of the
uncertainty associated with future species outcomes, the benefit estimate was weighted by the
probability of REP success (95%)5 and the probability of species extinctions in the absence of the
REP or successful reestablishment (which ranged from 50% to 100% for the individual species). The
cost of reestablishment of species, subject to successful eradication of rodents, was estimated at
$50,000.
In addition to benefits from protection of species, a further benefit of the REP would be an increase
in abundance of flora and fauna. This benefit remains unquantified in this analysis, although
studies have found that the community are willing to pay for increases in species abundance. For
example, Blamey et al (2000) found that Brisbane households on average were willing to pay $1.69
each to avoid each 1% decrease in the population size of non-threatened species in the Dessert
Uplands of Queensland6.
Toxikos (2010) and Pacific Environment Limited (2015) found that the potential risks of the REP to
soil, water and the marine environment were negligible because of the physical chemical
properties of Brodifacoum. While there are risks to a number of species from primary and
secondary poisoning, with the implementation of a range of mitigation measures, the Office of
Environment and Heritage found that the likelihood of species extinctions on LHI as a result of the
REP would be extremely small i.e. 1*10-4
to 1*10-6
.
Tourism
Tourism supply and demand for current peak and off-peak periods visitation to LHI were estimated
based on visit numbers, expenditure estimates per visit, the responsiveness of demand to changes
in price (known as ‘price elasticity’) for places such as LHI and the proportion of expenditure likely
to be net revenue based on the National Input-Output Table.
4 A 20-year time frame is referred to here as this is the basis on which nonmarket valuation studies used in this report are
based. 5 All benefits that are contingent on the successful eradication of rodents are weighted by the probability of success of the
REP, estimated at 95%. Some costs i.e. costs returning extant species, are also contingent on success of the REP and hence
are weighted accordingly. 6 Using this value estimate to estimate values for LHI was deemed inadvisable due to the differences between the ecological
settings pertaining to the two cases.

Gillespie Economics 9
Gillespie Economics
"Without" the REP, further degradation of World Heritage values of LHI would occur with this
potentially resulting in the LHIG being inscribed on the “World Heritage in Danger List”. If this
occurred, it would have the effect of 'signalling' a decline in the value of the LHI experience. This
would be expected to result in a reduction in tourism demand in both the peak and off-peak
periods. Whether LHIG is inscribed on the “World Heritage in Danger List” or not, the Lord Howe
Island Tourism Association (2015) has identified the "potential increase in negative consumer
perception of degeneration of pristine environment" as a key threat to tourism.
While some decline in tourism demand is expected to be associated with further degeneration of
the environment of LHI "without" the REP, for the purpose of the analysis it has conservatively been
assumed that "without" the REP demand in the peak and off-peak periods would remain constant7
over the analysis period.
"With" the REP, two separate potential impacts were identified - short term effects during the REP
and long term effects after the REP.
Short term effects include the potential for reduced tourist visitation during the REP and increased
demand for accommodation from the non-local workforce.
The REP is proposed to be undertaken during the winter months when tourism is least and the
group assumed to be most sensitive to knowledge of the REP i.e. families with children, visit less.
Other groups are likely to be less sensitive and, in any case, have greater flexibility to adjust the
time of their travel to other non-peak periods. Therefore, in the absence of any survey of
prospective visitors to LHI, it is reasonable to expect that there will be minimal or no reduction in
visitation at the time of the REP, or at least in the off-peak period overall (allowing for some
substitution for an alternative off-peak times).
However, for the purpose of this analysis it is conservatively assumed that 50% of visitors who
would otherwise have visited during the month of July (when the REP is likely to be implemented)
i.e. 293 visits and 2,051 visitor nights, would not visit and would not alter the timing of their
booking. This impact was represented by a reduction in off-peak demand resulting in an associated
reduction in annual benefits to tourists and annual net revenues to tourism providers of $490,000
and $130,000, respectively. Offsetting this short term impact would be additional REP workforce
demand for 3,050 bed nights and net revenues to accommodation providers of $122,000. If these
workers have similar spending habits to tourists, then impacts on tour operators, food providers
and shops will also be offset. However, to the extent that the REP workforce expenditure pattern is
different to that of tourists, tour operators, and to a lesser extent food and shopping providers may
be worse-off in the short term i.e. July 2017, if assumed reductions in tourists eventuate.
Consultations with the LHI community elicited a range of views on the potential long term tourism
impacts of the REP. However, evidence supports an increase in tourism demand post rodent
eradication and economic principles indicate benefits to tourism providers from an increase in
demand, even when constraints on visitor numbers apply. While a review of case studies suggests
7 All other things being equal (ceteris paribus).
Gillespie Economics 10
Gillespie Economics
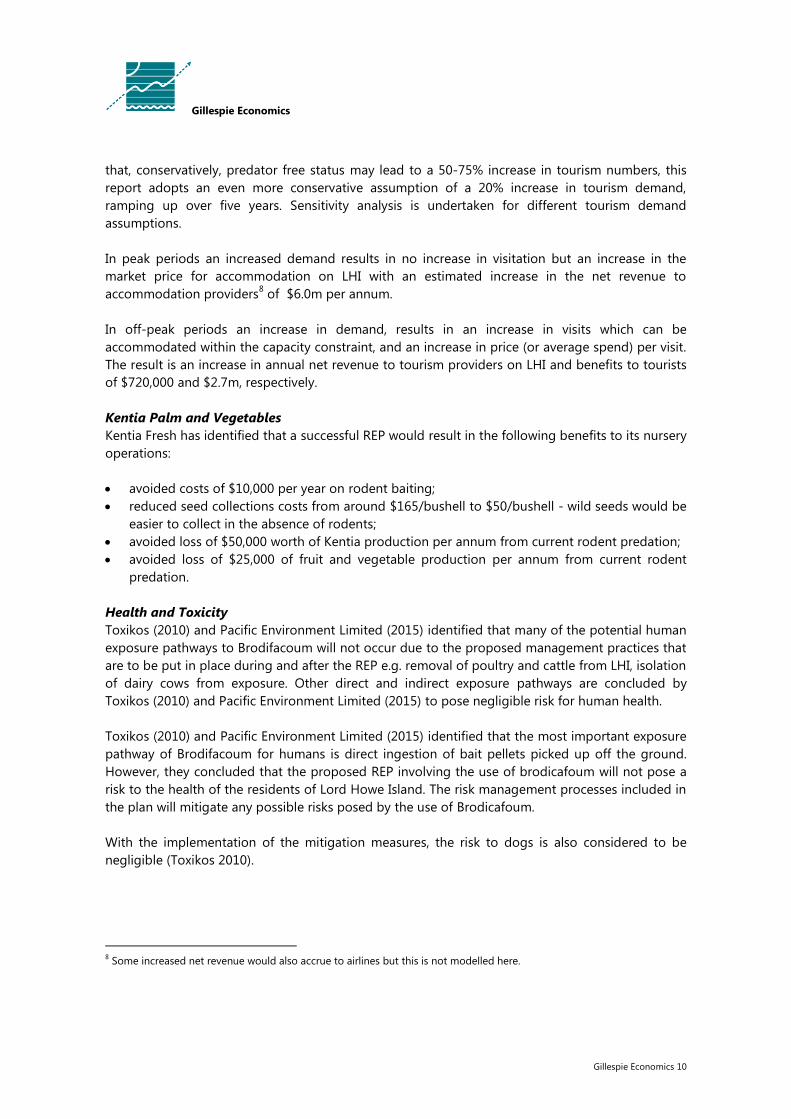
that, conservatively, predator free status may lead to a 50-75% increase in tourism numbers, this
report adopts an even more conservative assumption of a 20% increase in tourism demand,
ramping up over five years. Sensitivity analysis is undertaken for different tourism demand
assumptions.
In peak periods an increased demand results in no increase in visitation but an increase in the
market price for accommodation on LHI with an estimated increase in the net revenue to
accommodation providers8 of $6.0m per annum.
In off-peak periods an increase in demand, results in an increase in visits which can be
accommodated within the capacity constraint, and an increase in price (or average spend) per visit.
The result is an increase in annual net revenue to tourism providers on LHI and benefits to tourists
of $720,000 and $2.7m, respectively.
Kentia Palm and Vegetables
Kentia Fresh has identified that a successful REP would result in the following benefits to its nursery
operations:
avoided costs of $10,000 per year on rodent baiting;
reduced seed collections costs from around $165/bushell to $50/bushell - wild seeds would be
easier to collect in the absence of rodents;
avoided loss of $50,000 worth of Kentia production per annum from current rodent predation;
avoided loss of $25,000 of fruit and vegetable production per annum from current rodent
predation.
Health and Toxicity
Toxikos (2010) and Pacific Environment Limited (2015) identified that many of the potential human
exposure pathways to Brodifacoum will not occur due to the proposed management practices that
are to be put in place during and after the REP e.g. removal of poultry and cattle from LHI, isolation
of dairy cows from exposure. Other direct and indirect exposure pathways are concluded by
Toxikos (2010) and Pacific Environment Limited (2015) to pose negligible risk for human health.
Toxikos (2010) and Pacific Environment Limited (2015) identified that the most important exposure
pathway of Brodifacoum for humans is direct ingestion of bait pellets picked up off the ground.
However, they concluded that the proposed REP involving the use of brodicafoum will not pose a
risk to the health of the residents of Lord Howe Island. The risk management processes included in
the plan will mitigate any possible risks posed by the use of Brodicafoum.
With the implementation of the mitigation measures, the risk to dogs is also considered to be
negligible (Toxikos 2010).
8 Some increased net revenue would also accrue to airlines but this is not modelled here.

Gillespie Economics 11
Gillespie Economics
Cost Benefit Analysis Results
The present value of the incremental costs and benefits of the REP9, using a 7% discount rate and a
30 year evaluation period, consistent with NSW Treasury Guidelines, is provided in Table ES2. The
REP is estimated to provide net social benefits of $142M and a benefit cost ratio of 17.0. This
indicates that the aggregate welfare of the community is improved by implementing the REP i.e.
the incremental benefits of the REP exceed the incremental costs.
There are incremental biodiversity benefits, incremental tourism benefits and incremental benefits
to the Kentia Palm and vegetable industry from implementation of the REP.
There are benefits that remain unquantified in the analysis i.e:
increased species abundance;
increased productivity of private vegetable gardens;
reduced risk to humans, livestock and pets from constant presence of rodent poison;
elimination of potential health impact from rodents for residents and tourists;
elimination of spoilt foodstuffs and the presence of rodent excrement on LHI;
research benefits from the REP.
If these were able to be quantified they would increase the net benefits of the REP. However, the
magnitude of these benefits is unlikely to affect the central CBA result that the REP improves the
well-being of the community.
9 With all costs and benefits that are contingent on successful eradication of rodents weighted by the probability of the REP
being successful i.e. 95%.

Gillespie Economics 12
Gillespie Economics
Table ES2 - Present Value of Incremental Costs and Benefits (@7% discount rate) Category Costs $ Benefits $ Net Benefits Direct costs REP direct implementation costs Avoided ongoing rodent control costs Capital costs $7,658,155 LHIB $845,425 Ongoing costs $620,823 Residents $47,742 ($7,385,812)
Biodiversity Potential for species extinction from REP $1,055 Prevention of additional extinctions $40,599,970
Costs of returning extinct species to LHI $38,774 Return of extinct species to LHI $27,537,371
Increased abundance of species $68,098,566
Tourism Foregone tourism during REP implementation
Additional accommodation during REP implementation
Net revenue $113,686 Accommodation net revenue $106,773
Tourist benefits $427,457 Net revenue to tours, food outlets and shops NQ
Tourist benefits NA
Additional tourism business after REP implementation
Net revenue $57,175,022
Tourist benefits $23,153,099 $79,893,751
Palms and vegetables
Increased productivity for Kentia Palm industry and avoided direct costs $982,682
Increased productivity of other vegetable gardens NQ $982,682
Health and toxicity Any impact to other species, water and human health NQ
Reduced impact to humans, livestock and pets from constant presence of rodent poison NQ NQ
Elimination of health impacts from rodents for residents and tourists NQ NQ
Wastage and amenity
Elimination of spoiled foodstuffs, rodent excrement for residents
NQ NQ
Research Research benefits of the program NQ NQ
Total Total costs $8,859,951 Total benefits $150,448,082 $141,588,132
Net Present Value $141,588,132
Benefit Cost Ratio 17.0
Note: Reporting of calculations should not be misconstrued as conveying false accuracy
Gillespie Economics 13
Gillespie Economics
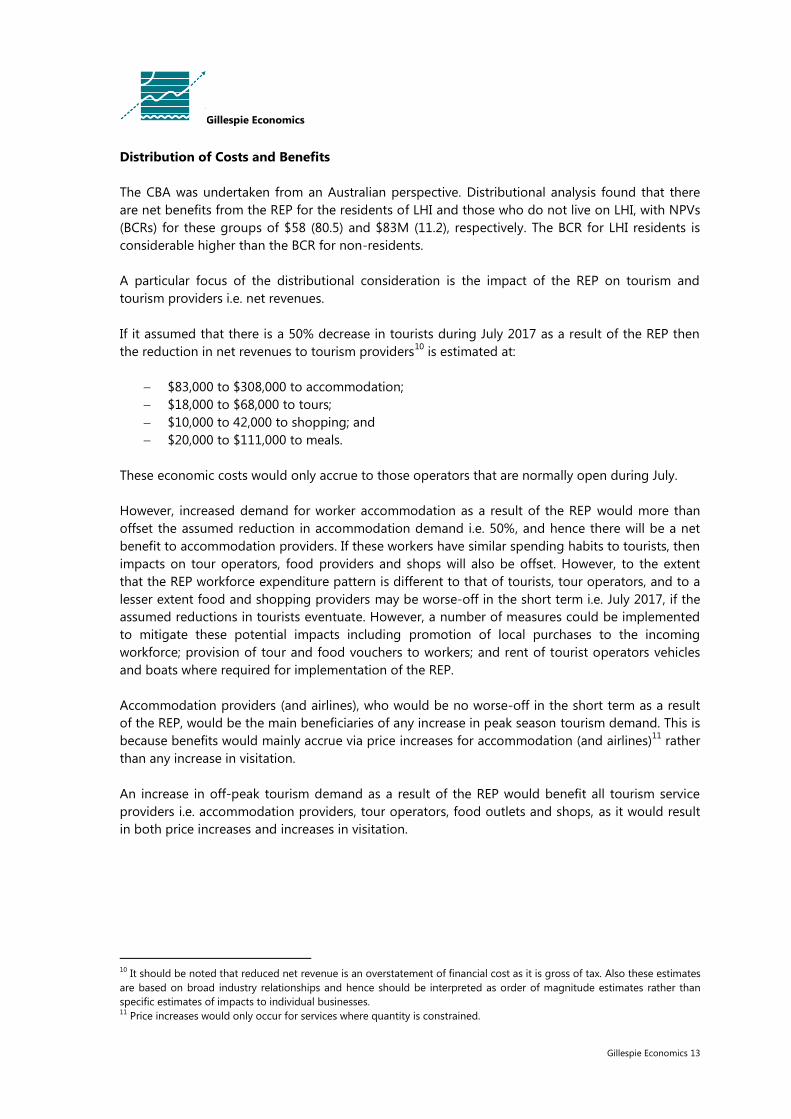
Distribution of Costs and Benefits
The CBA was undertaken from an Australian perspective. Distributional analysis found that there
are net benefits from the REP for the residents of LHI and those who do not live on LHI, with NPVs
(BCRs) for these groups of $58 (80.5) and $83M (11.2), respectively. The BCR for LHI residents is
considerable higher than the BCR for non-residents.
A particular focus of the distributional consideration is the impact of the REP on tourism and
tourism providers i.e. net revenues.
If it assumed that there is a 50% decrease in tourists during July 2017 as a result of the REP then
the reduction in net revenues to tourism providers10
is estimated at:
$83,000 to $308,000 to accommodation;
$18,000 to $68,000 to tours;
$10,000 to 42,000 to shopping; and
$20,000 to $111,000 to meals.
These economic costs would only accrue to those operators that are normally open during July.
However, increased demand for worker accommodation as a result of the REP would more than
offset the assumed reduction in accommodation demand i.e. 50%, and hence there will be a net
benefit to accommodation providers. If these workers have similar spending habits to tourists, then
impacts on tour operators, food providers and shops will also be offset. However, to the extent
that the REP workforce expenditure pattern is different to that of tourists, tour operators, and to a
lesser extent food and shopping providers may be worse-off in the short term i.e. July 2017, if the
assumed reductions in tourists eventuate. However, a number of measures could be implemented
to mitigate these potential impacts including promotion of local purchases to the incoming
workforce; provision of tour and food vouchers to workers; and rent of tourist operators vehicles
and boats where required for implementation of the REP.
Accommodation providers (and airlines), who would be no worse-off in the short term as a result
of the REP, would be the main beneficiaries of any increase in peak season tourism demand. This is
because benefits would mainly accrue via price increases for accommodation (and airlines)11
rather
than any increase in visitation.
An increase in off-peak tourism demand as a result of the REP would benefit all tourism service
providers i.e. accommodation providers, tour operators, food outlets and shops, as it would result
in both price increases and increases in visitation.
10
It should be noted that reduced net revenue is an overstatement of financial cost as it is gross of tax. Also these estimates
are based on broad industry relationships and hence should be interpreted as order of magnitude estimates rather than
specific estimates of impacts to individual businesses. 11
Price increases would only occur for services where quantity is constrained.

Gillespie Economics 14
Gillespie Economics
Sensitivity Testing
The sensitivity analysis indicates that the CBA results are not sensitive to substantive changes in
key variables. The primary drivers of the CBA results are the estimated benefits from biodiversity
improvements and the increased demand for tourism arising from these biodiversity
improvements. Even under the extreme scenario of no increase in tourism demand, the REP would
still have net benefits because of the biodiversity benefits it will provide.
Economic Activity Impacts
Any changes in expenditures (and revenue) impact economic activity on LHI. These are not
measures of costs and benefits from an overall community and CBA perspective. However, changes
in economic activity on LHI is of particular interest to stakeholders.
In the short term, there will be in the order of $400,000 spent on local labour to assist in the REP
implementation and post REP monitoring. Reduced expenditure on tourism business is estimated
at between zero and $527,000, depending on the impact of the REP implementation on visitation.
The maximum estimate of reduced tourism expenditure on accommodation during the REP
implementation ($307,000) is more than offset by the accommodation demand by nonlocal
workers ($455,000) and if these workers have the same expenditure patterns as tourists then
maximum assumed impacts on tour operators, food providers and shops will also be more than
offset. Expenditure on tour operators is the expenditure category where worker expenditure is
most likely to be different from tourist expenditure. Overall in the short run the REP
implementation will result in an increase in expenditure in the local economy.
In the long run, there is expected to be increased expenditure on LHI from an increase in peak and
off-peak tourism expenditure. There will also be increased profitability to the Kentia Palm Nursery.
Local labour will experience some reduction in direct output as wages associated with the ongoing
rodent control program will no longer be spent and there will be a reduction in expenditure on
labour involved in Kentia Palm seed collection. However, overall in the long run the REP
implementation is expected to result in a substantial increase in expenditure in the local economy.
Conclusion
CBA of the REP indicates that it will have net benefits to Australia and hence is justified on
economic efficiency grounds. It will provide net biodiversity benefits, net tourism benefits and net
benefits to the Kentia Palm and fresh vegetable industry. The REP will also have net benefits to
residents of LHI and net benefits to residents in the rest of Australia.
It is reasonable to expect that there will be minimal or no reduction in visitation at the time of the
REP, or at least in the off-peak period overall (allowing for some substitution for an alternative off-
peak times). Nevertheless, the maximum assumed short term impacts to tour operators, food
outlets and shops as a result of the REP implementation would be offset in present value terms if
there was a sustained increase in off-peak visitation by 0.4% (29 people) because of the eradication
of rodents.

Gillespie Economics 15
Gillespie Economics
1 Introduction
1.1 Contextual Background
Lord Howe Island (LHI) is an unincorporated part of NSW that is administered by the Lord Howe
Island Board (LHIB). The Island contains a small settlement of approximately 350 inhabitants that
covers 15% of the Island.
LHI has outstanding natural features and values with 75% of its area, and all of the outlying islands,
islets and rocks protected, under the Permanent Park Preserve, a similar status to a national park.
The Lord Howe Island Group (LHIG) is on the Register of the National Estate, is listed as a World
Heritage Area (WHA) and is located within the Lord Howe Island Marine Park (NSW) and the Lord
Howe Commonwealth Marine Reserve (under Commonwealth authority).
In addition to its natural and heritage values, LHI also generates significant financial values through
the provision of tourism accommodation and a range of tourism and recreation activities that
include:
Marine activities such as beach and reef walking, swimming, snorkelling, scuba diving, fish
feeding, surfing, underwater photography, windsurfing, sea-kayaking, fishing, sightseeing
cruises and eco tours, and other water sports and beach activities; and
Terrestrial activities such as hiking, bird watching, bike riding, sightseeing, eco tours, lawn
bowls and golf.
Financial values are also generated via the export and local sale of the Lord Howe Kentia Palm.
The natural, heritage, tourism and industry values identified above are being impacted by
introduced species of rats and mice. Rodents have contributed to the extinction of a number of
species on the Island and are a recognised threat to at least 13 bird species, 2 reptiles, 51 plant
species, 12 vegetation communities and numerous threatened invertebrates on the Island (DECC
2007).
Any impact on the natural values of the Island diminishes tourism and recreation values since these
are inextricably linked to the Islands unique biodiversity and World Heritage values.
Predation by rodents on Kentia Palm production reduces values associated with this commercial
activity, via reduced production and added costs.
In addition, rodents impose costs to residents and tourism operators via the need to bait to reduce
visual presence of rodents, the spoiling of food stuffs and potentially health impacts to residents
and tourists alike.
The LHIB currently implements a limited rodent control program at a cost of $85,000 per year.
However, it is not reducing the rodent population sufficiently to limit landscape scale ecological
impacts and there is a risk that continuation of the current approach will result in bait shyness
and/or resistance in the rodent population.

Gillespie Economics 16
Gillespie Economics
An alternative to this scenario is being proposed by the LHIB: The LHI Rodent Eradication Project
(REP). This is a proposal to eradicate introduced rodents from the LHIG using cereal baits laced
with the anticoagulant Brodifacoum dispersed from helicopters in the uninhabited areas, and a
combination of hand broadcasting, bait stations and bait trays in the settled area.
As well as eradicating introduced rodents the introduced Masked Owl will also be eliminated.
1.2 Purpose and Scope of this Consultancy
The purpose of the consultancy is to provide a robust, plain English economic evaluation of the
proposed LHI REP that will address ongoing community concerns about the potential impacts to
tourism and the economy, and identify whether the proposal will provide net benefits to the
Australian community.
It draws on previous specialist studies, summary results of previous community consultations
relevant to the study, some additional consultations with key stakeholders, economic principles
and a review of the economic valuation literature.
There are two potential frameworks available to assess the economic impacts of the proposal:
cost benefit analysis (CBA) which examines the additional costs and benefits of the LHI REP to
impacted stakeholders, relative to "without" the REP, and determines whether it is likely to
have net benefits to the community;
economic activity analysis which examines the impact of a proposal on the LHI economy in
terms of economic activity indicators such as expenditure and business turnover. These
indicators are not equivalent to the measures of net benefit used in CBA.
CBA is the primary way that economists evaluate the desirability of a proposal and this technique
will form the core of this economic evaluation. However, consideration will also be given to the
consequences of the proposal for economic activity on LHI.
Gillespie Economics 17
Gillespie Economics
2 Economic Values
2.1 Total Economic Value Framework
Economic values are anthropocentric in nature and so relate to anything from which individuals
gain satisfaction (DEST et al 1995), whether or not that value can be easily determined or observed.
LHI and its associated marine resources have many economic values that can contribute to the
enjoyment (or wellbeing) of society. These economic values may be associated with goods and
services that are traded in markets e.g. tourism, as well as goods and services that are outside the
market system e.g. biodiversity conservation, provided these contribute satisfaction to individuals
in society.
Combined, all the economic values that can be obtained from a resource are often referred to as
total economic value (TEV) (Young 1992).
The mechanisms that link resources to individual and community well being are direct use of the
resources (for example, commercial and non commercial recreation), indirect use of a resource (i.e.
ecosystem service values such as carbon sequestration) and nonuse (such as the preservation of
natural ecosystems, species or special areas) (James and Gillespie 2002).
A typology of potential economic values associated with LHI and its surrounds is presented
diagrammatically in Figure 2.1. Broadly, the main economic values associated with LHI can be
summarised as:
use values associated with tourism and recreation;
use values associated with Kentia Palm and vegetable production; and
nonuse values associated with the conservation of the natural environment.
The first two dot points are represented by use values in Figure 2.1. The latter point is represented
by nonuse values in Figure 2.1.

Gillespie Economics 18
Gillespie Economics
Figure 2.1 - Components of Total Economic Value of Lord Howe Island and Surrounds: Use and Nonuse Values
* includes option, vicarious and quasi-option values
Adapted from Young (1992), p. 23.
DIRECT USE
VALUES
INDIRECT USE
VALUES (or
ECOSYSTEM
SERVICE VALUES)
Regulation of
surface and
groundwater
flow
Fish stock
recruitment
and protection
Carbon
sequestration
Waste
treatment and
assimilation
OPTION VALUES*
Future uses
Future drug
development
Genes for plant
breeding
Substitute for
depleted
resources
Nature
documentaries
and books
Development of
new technology
BEQUEST
VALUES
Altruism
Between
generation
equity
EXISTENCE
VALUES
Satisfaction
that a
resource
exists
USE VALUES NONUSE VALUES
TOTAL ECONOMIC VALUE
MARKET BASED
Agricultural
production
Accommodation
Fishing charter
boat operations
Commercial diving
Marine tours
Commercial
fishing
Island tours
Guided walks
NONMARKET
Recreational
fishing
Recreational
boating
Swimming
Walking
Research
Education
Surfing

Gillespie Economics
Gillespie Economics 19
2.2 Measures of Economic Value
The conceptual framework for identifying and estimating economic values is the supply and
demand, or market, model. Appendix 1 provides a detailed explanation of this framework.
The net benefits to consumers from a good or service are referred to as consumers’ surplus and
are estimated by the difference between what an individual would be willing to pay (WTP)
(demand) for a good or service (the total benefit to the consumer) and what they have to pay (the
cost to the consumer i.e. consumer expenditure or price times quantity) (Edwards 1990).
The net benefits to producers are referred to as producers’ surplus and is estimated as the
difference between the revenue (consumer expenditure) received for a good or service (total
benefit to producer) and the costs of the inputs used in the provision of the good or service
(economic cost to producer) (Edwards 1990). In practical terms, it is the net revenue (before tax)
that is earned by producers of goods and services (James and Gillespie 2002).
Use values associated with tourism and recreation on LHI include:
benefits to tourists (i.e. consumers) as measured by their WTP for the experience over and
above what they actually have to pay (consumers’ surplus); and
benefits to tourism operators (i.e. producers) as measured by net revenue (producers’ surplus).
Use values associated with Kentia Palm and vegetable production relate to the net revenue
(producers’ surplus) from production.
Nonuse values associated with the conservation of the natural environment are measured by the
WTP of the community for conservation over and above what they actually have to pay.
While some studies have attempted to measure the TEV of environmental resources (e.g.
Constanza et al. 1997), this is problematic since economic valuation methods for nonuse values can
only be used to estimate a change in TEV as a result of a project or policy rather than total values.
Also, what is relevant from a policy perspective is how components of TEV are likely to change
"with" and "without" a policy. Hence, only a subset of total economic values may require
investigation. This is the focus of CBA which is discussed in Section 3 and applied to the REP in
Section 4.

Gillespie Economics 20
Gillespie Economics
3 Overview of Cost Benefit Analysis
3.1 Introduction
This Section provides some background information on the CBA method and key parameters used
in the CBA of the REP. The application of CBA to the REP is then provided in Section 4.
3.2 CBA Method
Economic assessment is primarily concerned with identifying changes in aggregate wellbeing
(consumers’ and producers’ surpluses) from alternative uses of resources. CBA is the standard
technique applied to consider these wellbeing changes. It provides a comparison of the additional
costs and benefits to society "with" a project, policy or program, relative to "without" the project,
policy or program. Costs are measured in terms of reductions in producers’ surplus (i.e. net
revenues) and consumers’ surplus (i.e. benefits to consumers), while benefits are measured in terms
of increases in producers’ or consumers’ surpluses.
Taking into account the timing of the benefits and costs through the process of discounting,
provided the present value of additional benefits exceed the present value of additional costs (i.e. a
net present value (NPV) of greater than zero or a benefit cost ratio (BCR) of greater than one), a
project, policy or program is considered to improve the wellbeing of society and hence is desirable
from an economic efficiency perspective.
3.3 Definition of Society
CBA includes the consideration of costs and benefits to all members of society i.e. consumers,
producers and the broader society as represented by the government.
The most inclusive definition of society includes all people, no matter where they live or to which
government they owe their allegiance (Boardman et al. 2001). However, in practice most analysts
define society at the national level12
based on the notion that the citizens of a country share a
common constitution that sets out fundamental values and rules for making collective choices and
that the citizens of other countries have their own constitutions that make them distinct societies
(Boardman et al. 2001).
The CBA of the REP reported here is undertaken from a national (Australian) perspective (as
funding arises from both national and state sources). It is recognised that some tourism benefits of
the REP accrue to international tourists, however, the international market remains a small
percentage of arrivals to LHI (LHI Tourism Association 2015). While biodiversity values from the REP
may accrue to households outside of NSW, the studies from which estimates for biodiversity values
12
While most applications of CBA are performed at the national level, "to incorporate national distinctions in a CBA is far
easier said than done. Thus many CBAs end up estimating the net benefits for global society, if only implicitly" (Bureau of
Transport Economics 1999, p. 2).

Gillespie Economics 21
Gillespie Economics
were obtained only surveyed NSW households and it is not appropriate to extend these values
outside of the population that was surveyed. Hence, only biodiversity values for NSW households
are included in the analysis, implicitly and conservatively assuming that no values are held by
households outside of NSW.
3.4 Valuation of Market and Nonmarket Costs and Benefits
Valuation of costs and benefits first requires quantification of the physical impacts of policies,
which relies on the assessment of other experts e.g. tourism experts to identify impacts on
visitation, ecologists to identify impacts on species extinctions etc. Only once the magnitudes of
physical effects are identified can they be valued using market and nonmarket valuation methods.
For the CBA of the REP, physical quantification of impacts relied on expert advice from the NSW
Office of Environment and Heritage and the Lord Howe Island Board, consultations with affected
stakeholders and review of other studies.
Valuation of all impacts is neither practical nor necessary. Only those impacts which are likely to
have a material bearing on the outcome of the analysis need to be considered in CBA (NSW
Government, 2012). Where benefits and costs cannot be quantified these items should be included
in the analysis in a qualitative manner (NSW Treasury, 2007; NSW Government, 2015). The focus in
the CBA of the REP was on the main impacts of the REP.
3.5 Risk and Uncertainty
The net present value (NPV) estimates presented in some ex-ante cost benefit analyses are based
on future values being achieved with certainty. However, future values are subject to risk and
uncertainty. In economic analysis, there is a difference between risk and uncertainty. Risk is
measurable; it refers to situations with known probabilities. Uncertainty in contrast is vague; as it is
characterised by a lack of information on the likelihood of occurrence of different impacts.
One way of incorporating risk into a CBA is to use expected values instead of certain values. This
requires the range of potential outcomes being assigned probabilities. Expected values are the
certain values multiplied by the probability of their occurrence. Where outcomes require a
sequence of future events to occur, expected values will depend upon the product of the
probabilities of each sequential event. The result is an expected net present value (ENPV).
When uncertainty is encountered in an economic appraisal, the most commonly applied technique
is sensitivity analysis. This involves changing the values of critical variables in the analysis to
determine how the overall CBA results might be affected.
For the REP CBA, where probability information was available, expected values were calculated. For
these and other variables, sensitivity testing was also undertaken.

Gillespie Economics 22
Gillespie Economics
3.6 Evaluation Period
All costs and benefits attributable to a project, policy or program should be included in the CBA in
the year that they occur and hence the period covered by the evaluation needs to be long enough
to capture them. Due to the discounting of future costs and benefits to present values, once a
project period of more than 30 years is reached, the analysis will be relatively insensitive to the
choice of a longer project period (NSW Treasury 2007). The analysis period used for the REP CBA is
30 years.
3.7 Discounting
Costs and benefits occurring in different time periods require discounting to present value so that
the benefits can be compared to costs on a common basis. Discounting reflects the fact that
individuals and society prefers a dollar today than a dollar in the future.
There are two main approaches to determining the appropriate discount rate:
the social time preference rate (STPR) - consumer’s rate of time preference i.e. society’s view of
what at the margin is an appropriate tradeoff for individuals between now and the future.
the social opportunity cost of capital (SOC) - represents real return on capital or producer’s rate
of discount (NSW Treasury 2007).
In NSW, the discount rate set by the NSW Treasury is 7% with sensitivity testing at 4% and 10%.
The lower figure is indicative of STPR and the higher figure indicative of SOC (NSW Treasury 2007).
These are the discount rates used in the REP CBA.
3.8 Consideration of the Distribution of Costs and Benefits
While CBA, undertaken at different scales, can provide qualitative and quantitative information on
how costs and benefits are distributed, welfare economics and CBA are explicitly neutral on intra
and intergenerational distribution of costs and benefits. There is no welfare criterion in economics
for determining what constitutes a ‘fair and equitable’ distribution of costs and benefits. Judgments
about intra and intergenerational equity are subjective and are therefore left to decision-makers.
Nevertheless, it should be noted that the costs and benefits included in a CBA are defined and
valued based on the values held by individuals in the current generation. There is no way to
measure the value that future generations may hold for impacts of current day projects as they are
not here to express it. However, as identified by Boardman et al. (2001) this is not considered a
serious problem for CBA because:
Few policies involve impacts that only appear in the far future. Consequently, the WTP of
people alive today can be used to predict how future generations will value them;
Most people alive today care about the wellbeing of their children, grandchildren and great
grandchildren, whether or not they have yet been born. They are therefore likely to include the
interests of these generations to some extent in their own valuations of impacts. Because

Gillespie Economics 23
Gillespie Economics
people cannot predict with certainty the place that their future offspring will hold in society,
they are likely to take a very broad view of future impacts; and
Discounting used in CBA also reduces the influence of costs and benefits that occur a long way
into the future.
Furthermore, increased wealth generated by projects that have a net benefit to the current society
can be used to improve the services (e.g. health, school and community services) and the
environment (e.g. protected areas) that are passed on to future generations.
As identified by the Productivity Commission (2006), a policy option that provides the highest net
benefit, as indicated by CBA, would also be consistent with the principles of ecologically
sustainable development.
3.9 Consideration of Other Objectives of Government
CBA does not address other objectives of governments. Decision-makers therefore need to
consider the economic efficiency implications of a project, as indicated by CBA, alongside the
performance of a project in meeting other often conflicting goals and objectives of government.
3.10 Key Steps in Cost Benefit Analysis
The key steps in CBA are summarised in Box 3.1.
Gillespie Economics 24
Gillespie Economics
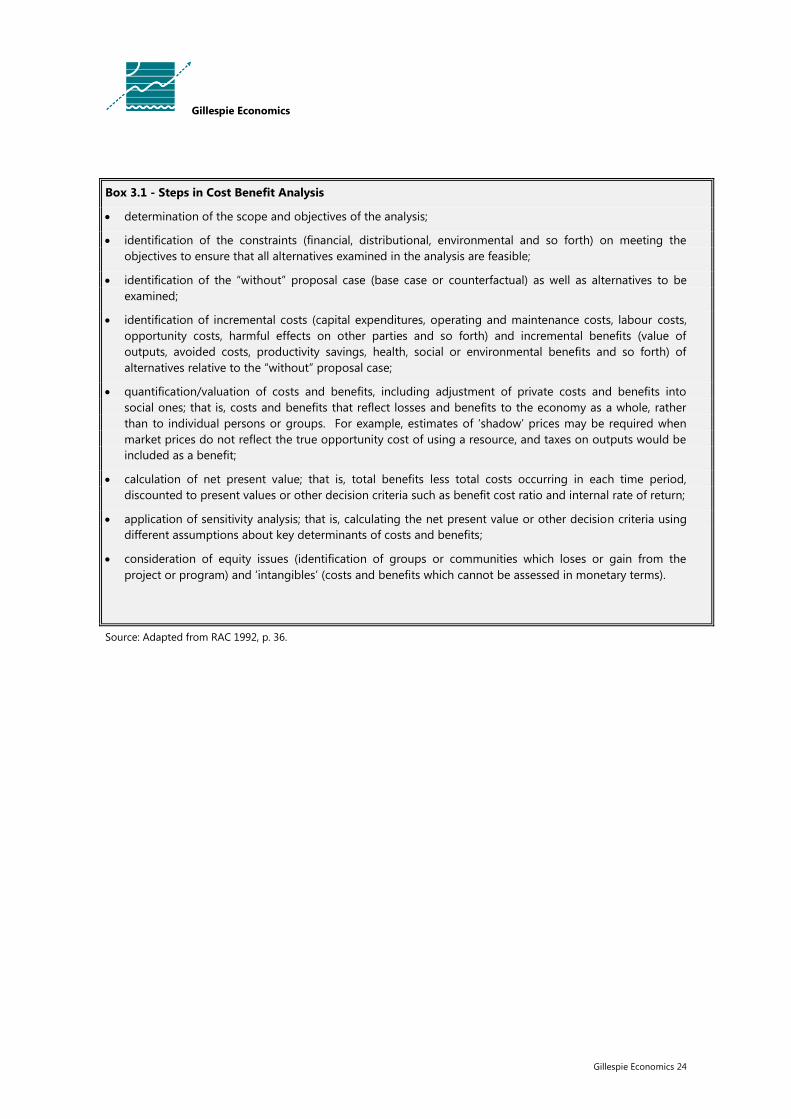
Box 3.1 - Steps in Cost Benefit Analysis
determination of the scope and objectives of the analysis;
identification of the constraints (financial, distributional, environmental and so forth) on meeting the
objectives to ensure that all alternatives examined in the analysis are feasible;
identification of the “without” proposal case (base case or counterfactual) as well as alternatives to be
examined;
identification of incremental costs (capital expenditures, operating and maintenance costs, labour costs,
opportunity costs, harmful effects on other parties and so forth) and incremental benefits (value of
outputs, avoided costs, productivity savings, health, social or environmental benefits and so forth) of
alternatives relative to the “without” proposal case;
quantification/valuation of costs and benefits, including adjustment of private costs and benefits into
social ones; that is, costs and benefits that reflect losses and benefits to the economy as a whole, rather
than to individual persons or groups. For example, estimates of ‘shadow’ prices may be required when
market prices do not reflect the true opportunity cost of using a resource, and taxes on outputs would be
included as a benefit;
calculation of net present value; that is, total benefits less total costs occurring in each time period,
discounted to present values or other decision criteria such as benefit cost ratio and internal rate of return;
application of sensitivity analysis; that is, calculating the net present value or other decision criteria using
different assumptions about key determinants of costs and benefits;
consideration of equity issues (identification of groups or communities which loses or gain from the
project or program) and ‘intangibles’ (costs and benefits which cannot be assessed in monetary terms).
Source: Adapted from RAC 1992, p. 36.

Gillespie Economics 25
Gillespie Economics
4 Cost Benefit Analysis of the Rodent
Eradication Project
4.1 Scope and Objectives of the Analysis
The objective of this CBA is to examine whether the LHI REP improves or reduces the aggregate
well-being of the Australian society and hence whether it is desirable from an economic efficiency
perspective. In doing this, it is also an objective of this analysis to identify the specific costs and
benefits to the residents of LHI.
4.2 Constraints
If the benefits of the LHI REP exceed the costs, then on economic efficiency grounds, it is desirable
to go ahead with the investment. However, it is understood that if the REP poses an unacceptable
health risk to the people of LHI or the environment then it will not proceed. In this respect, a
Human Health Risk Assessment has been prepared by Toxikos (2010) and reviewed by Pacific
Environment Limited (2015), and the results of these reports have been relied on in this CBA.
However, an additional Human Health Risk Assessment is currently being undertaken under the
guidance of the NSW Government Chief Scientist. Environmental risks are considered in various
Commonwealth and State environmental approvals processes.
4.3 Specification of the "With" and "Without" Rodent
Eradication Project13
A starting point for the CBA of the LHI REP is the specification of the base case or "without" REP
scenario and the "with" REP scenario. The former is necessary because the costs and benefits of the
"with" REP scenario are additional to what would have happened had the REP not gone ahead.
4.3.1 The "Without" Rodent Eradication Project Scenario.
The base case or 'without' REP scenario for this analysis is the continuation of the current rodent
control program. Control is distinct from eradication. It aims to keep the negative effects of
rodents within acceptable limits, but its ongoing nature brings with it a continuing financial cost. It
also brings an increased potential for negative impacts to the environment and on human health
caused by the ongoing presence of poison in the environment (LHIB 2009). This is because even
with the rodent control program (covering approximately 10% of the island) in place, neither the
rat or mouse population is being reduced to a level that reduces landscape scale ecological
impacts. Rodent population estimates from the entire island range from 63,000 to 150,000 rats and
140, 000- 210,000 mice (30 -74 rats per hectare and 67-100 mice per hectare) (LHIB 2016e).
13
The description of the "with" and "without" scenarios is based on LHIB (2016d).
Gillespie Economics 26
Gillespie Economics
Since the 1920s numerous methods of control have been tried on LHI including a bounty on rat
tails, hunting with dogs, introduction of cats and owls and the use of various poisons including
barium chloride, diphacinone, warfarin. The prolonged use of warfarin has led to house mice
becoming resistant to this poison (LHIB 2009).
Over time, the bait that the LHIB has used for rodent control has changed from warfarin to
coumatetralyl, largely due to the LHIB being unable to source commercial quantities of warfarin as
a consequence of rodents being largely resistant to it on the mainland. The coumatetralyl based
bait currently used (in the product Ratex at a concentration of 0.38g/kg) is a first generation
anticoagulant that has similar mode of action as warfarin. The LHIB has an Australian Pesticides and
Veterinary Medicines Authority Minor Use Permit to apply the bait in stations with 200gm of bait
which is replenished five times per annum (approximately every 10 weeks) in order to reduce
resistance build up in rodent populations. The LHIB rodent control baiting contract covers the
servicing of 1,400 stations over 30 baiting areas across the island.
In addition to the LHIB rodent control contract, coumatetralyl is also supplied by the LHIB to
residents who wish to use it on their properties. In 2015, the Board purchased 192 x 15 kg buckets
(total of 2880kg) of Ratex grain bait containing coumatetralyl for use in its rodent control program
to be used by both Board and leaseholders on the Island for rodent control. In the 6 months from
January to the beginning of July 2016, the Board has used and provided to residents approximately
700kg of Ratex grain bait for rodent control on Lord Howe Island.
In addition, many Island residents also purchase Brodifacoum based rodenticides such as Talon™
and Tomcat™ (generally at concentrations of 50 mg/kg) to control rats and mice around their
properties. As residents can purchase this locally or directly from the mainland, exact quantities
used are unknown but it is estimated to be around 400kg per year over the 54 ha residential area.
This equates to approximately 7.4kg/ha per year of Brodifacoum based products alone.
Anecdotal evidence suggests that a large percentage of residents in the settlement areas use
commercially available Brodifacoum based rodenticides in off label situations (i.e. not in
accordance with product label conditions) for their individual rodent control programs. This
includes the use of Brodifacoum products in the open, away from buildings, in gardens or in
combination with other products. Project Staff assisting with baiting through the settlement areas
during the LHIB’s scheduled baiting program have shown that as many as 1 in 3 residents are using
Brodifacoum products such as Talon™ and Tomcat™ (50ppm Brodifacoum) exclusively or in
conjunction with LHIB provided bait, Ratex- coumatetralyl. The main reason given by residents for
this supplementary baiting is the perceived view that the bait provided by the LHIB is not as
effective at controlling rodents, particularly mice, as the Brodifacoum based commercially available
products.
The present control baiting program is primarily limited to the settlement area. It does not occur in
the other parts of the Island with the exception of small areas of high conservation value.
Widespread control is simply not practical given the large area and rugged terrain. There is also a
significant risk that through ongoing control (and the continuous presence of poison baits) the
island group’s rodent populations will develop bait shyness or a resistance to current rodenticides.

Gillespie Economics 27
Gillespie Economics
Mice have already developed a resistance to warfarin. The suite of second-generation
anticoagulants, which includes Brodifacoum, is the only tool currently available for effectively
eradicating rodents from islands. Resistance to these poisons, if it develops, will make eradication
impossible and will greatly restrict control. Studies show that within benign laboratory conditions,
rats succumb to the bait as expected while mice currently take approximately three weeks.
If eradication is not attempted, the above ongoing rodent control will be required, although the
rodenticide used may change periodically. Continued rodent control program will be associated
with:
ongoing impacts to biodiversity including population declines and potential extinctions as a
result of rodent predation and competition;
the continuous presence of poison baits in the environment, essentially in perpetuity. This
presents ongoing risks of poisoning for non-target species and high probability that rodents
will develop a resistance to poison;
potential further degradation of World Heritage values (including endemic and threatened
species) and the potential for the LHIG to be inscribed on the “World Heritage in Danger List”;
and
ongoing socio-economic impacts associated with rodents (LHIB 2016e).
4.3.2 The "With" Rodent Eradication Project Scenario
The "with" REP scenario is as follows.
Baiting Protocol
The Pestoff 20R bait (20mg/kg Brodifacoum) will be distributed at a total nominal dose rate of 20
kg/ha (12kg first application + 8kg/ha second application) of bait. This equates to 0.4 g of
Brodifacoum/ ha. At this application rate, approximately 42 tonnes of cereal based bait (containing
a total of 840 g of Brodifacoum) will be required to cover the total island group’s three dimensional
surface area of 2,100 ha.
Area to be baited
Rats and mice occur throughout LHI, including the settlement. LHI is the only island in the LHIG
that is known to contain rodents. However, ship rats are able to swim over 500 m and both rats
and mice are difficult to detect at low densities. It is therefore possible that either species occur on
offshore islands and islets close to the main island. To minimise the risks of operational failure, the
main island and all nearby islands and islets, other than Balls Pyramid and its associated islets, will
be baited. The 23 km distance between Balls Pyramid and the main island renders the chances of
invasion by rodents very low.
Number of bait applications
The proposal is for aerial and hand baiting to be carried out twice, with the applications separated
by about 14 -21 days (depending on the weather) although the number of applications in and
around dwellings may be more as it is dependent on the rate of removal by rodents of distributed
baits. This will maximise the exposure of rodents to the bait. The proposed application rate for the
first bait application is 12 kg of bait per hectare, and 8 kg per hectare for the second application.

Gillespie Economics 28
Gillespie Economics
Most rodents will be killed by bait from the first bait application, however it is beneficial to carry
out a second bait application to eliminate the likelihood of any gaps in the distribution of baits,
ensure bait is available long enough to ensure that all individuals receive a lethal dose and to
target:
individuals that may have been denied access to bait distributed in the first application (by
more dominant individuals that will now be dead), and
any surviving young that have recently emerged from the nest.
The operation is programmed to take place in winter 2017 (June-August), when the availability of
natural food for rodents is low and breeding is greatly reduced or absent. This is also a period
when most seabirds are absent from the LHIG. Bait application will be timed to avoid periods of
predicted heavy rainfall (as this may prematurely dissolve the bait) and therefore weather will
influence the actual timing of the two bait applications.
Weather forecasts of rainfall and wind speeds will be obtained from the Bureau of Meteorology
station on LHI from June onwards. A forecast of less than 15 knots and four fine days (three fine
nights) without significant rainfall (less than 6 mm daily) is preferred for each application.
Operational wind speeds to cease operations will be developed in conjunction with the helicopter
operator and any permit conditions issued by the Australian Pesticides and Veterinary Medicines
Authority. The NZ Code of Practice requirement is that no aerial baiting will occur on buffer
boundaries in winds greater than 20 km/h.
Aerial baiting
Aerial baiting will be conducted throughout the LHI Permanent Park Preserve and other areas of
the main island excluding the settlement area and identified buffer zones which will be baited by
hand or bait stations. In all areas baited aerially, 10 mm baits (approximately 2g each) will be
broadcast at a density of 12 kg/ha (one bait every two square metres) for the first application and
8kg/ha for the second application.
The bait will be dispersed using a purpose built spreader bucket slung below a helicopter. A
rotating disc throws the bait 360oconsistently to 35 m (note outlier pellets may be thrown to 45 m);
enabling a swathe of up to 70 m to be baited in a single pass.
Overlapping (50%) each swathe will ensure that there are no gaps in the distribution of baits.
Application rates are adjusted to account for the 50% overlap (i.e. for the first application 6kg/ha
on each swathe with 50% overlap will be applied to achieve a 12kg/ha application rate) (see Figure
4.1).

Gillespie Economics 29
Gillespie Economics
Figure 4.1 - Aerial Application Method
Bait overlaps by 50%
Helicopter flight path
2
Each bait application will take approximately two days to complete dependent on weather.
In order to achieve the required baiting density on the cliffs and steep slopes (particularly around
Mt Gower and Mt Lidgbird) several horizontal flight lines will be flown at approximately 50m
vertical spacing along these areas to ensure adequate bait coverage. Baiting around the coast line
will occur above the mean high water mark to minimise bait entry into the marine environment. A
deflector arm can be attached to the spreader bucket to restrict the arc of the swathe to 180oand
will be used particularly when baiting the edge of buffer zones and to minimise bait entry into the
marine environment when baiting coastal areas. The dose rate, bait direction and swathe width can
all be controlled within set limits and will be adjusted as required for specific requirements for
different types of flight lines (inland, coastal or buffer zone). Other aerial dispersal options include
the turning off or removal of the spinning motor on the spreader bucket which will result in bait
trickling vertically below the helicopter for narrow areas if required. The combination of techniques
will enable all terrains on the LHIG to be effectively baited. The exact method of distributing bait
aerially on LHI will be finalised in consultation with the helicopter contractors.
Buffer zones for aerial application to individual properties will be agreed with the relevant
occupiers and in accordance with relevant regulations and considering outliers from the bait swath.
The LHIB has committed that aerial baiting would be no closer than 30m to dwellings. In these
buffer zones bait will either be applied by hand or if agreement to the contrary is not reached, then
the buffer zone will extend to 150 m, and will be baited by hand. This will be covered in a Property
Management Plan for each property. 30m buffer zones will also be established around
containment areas for the dairy herd.

Gillespie Economics 30
Gillespie Economics
GPS will be used to guide the helicopter along a set of pre-determined flight lines designed to
ensure that all areas are adequately baited. Computer-generated plots of the actual path flown will
be inspected after the flight to confirm that this has been done. Any identified gaps will be treated.
Flight-path height will be set at an altitude that ensures effective and safe baiting. It will be
determined in discussion with the helicopter operator, and take into account topography, weather
conditions, aircraft safety and the need to avoid significant disturbance to roosting birds. This
baiting technique is similar to (and is based on) established techniques for other island pest
eradications undertaken worldwide. In Australia this technique has been used on islands such as
Montague and Broughton islands in New South Wales and Hermite Island in Western Australia. It
was also used on World Heritage listed Macquarie Island in Tasmania over autumn and winter
2011.
The aerial baiting technique has been trialled on LHI with non toxic bait and a custom built
spreader bucket (LHIB, 2007). The trials have shown aerial baiting to be an effective technique that
could be utilised in an operation on Lord Howe Island. The trial provided an opportunity to
establish the correct flight configuration: air speed and settings to produce the required flow rate
to achieve the on grounds density of bait during operations. Methodologies for loading
procedures, and determination of bait usage on flight runs were developed for use in future
baiting operations.
Further detailed calibration of the equipment with non toxic baits (i.e. helicopter, spreader bucket,
GPS equipment etc) will be undertaken immediately prior to the operation as part of an
operational readiness check overseen by an international eradication expert from the New Zealand
Department of Conservation’s Island Eradication Advisory Group.
Hand broadcasting of bait
Hand broadcasting of bait will be conducted concurrently with aerial baiting. It will be undertaken
throughout the settlement area where agreed by residents under individual Property Management
Plans and in buffer and exclusion zones (i.e. the lagoon foreshore and Ned’s Beach). In the
settlement area, either 10mm (2g each) or 5.5 mm Pestoff baits (0.6 g each) will be hand-broadcast
at a density of 12 kg/ha for the first application of bait and at 8kg/ha for the second application
(one pellet every 2 square metres for 10 mm pellets or one pellet every half square metre for 5.5
mm pellets).
Provisional areas to be hand-baited are shown in Figure 4.2 however this is subject to completion
of individual Property Management Plans.

Gillespie Economics 31
Gillespie Economics
Figure 4.2 - Indicative Treatment Areas by Method
Source: LHIB (2016e)
Trained personnel will move through such areas and apply bait at the designated rate. All
personnel will carry a GPS unit capable of continuously tracking their path. Computer-generated
plots of their paths will be used to check baiting coverage. The aim will be to distribute baits in

Gillespie Economics 32
Gillespie Economics
garden beds and other areas of vegetation around dwellings, rather than broadcast on lawns.
These details will be contained in the individual property management plans which will be
established between property occupiers and the LHIB.
It is essential that all hand-broadcast bait be out in the open so it is subject to degradation by
weathering. No bait will be hand-broadcast directly in or under buildings where it will not be
subject to weathering.
Bait stations
Commercially available or specifically designed bait stations will be used where aerial or hand
broadcasting cannot be undertaken. Bait stations will also be placed within all areas containing
livestock (i.e. dairy herd, horses and goats). These bait stations used in livestock areas will be
designed specifically to be able to withstand interference and trampling by stock. Where
practicable, and with the agreement of householders, small amounts of bait in open containers
(‘bait trays') similar to commercial products currently available, will be placed within buildings
including kitchens, pantries, pet food storage areas etc. Where possible, bait trays will also be put
in accessible roof spaces and under-floor cavities.14
All bait trays and bait stations will be monitored regularly and bait replenished as necessary for
approximately 100 days after the second baiting (this could be longer if surviving rats or mice are
detected). Bait take will provide an indication of rodent activity. Bait in these locations will not be
exposed to weathering, and so any remaining bait will be removed after approximately 100 days or
after mice or rats are no longer detected.
When using bait stations or trays it is important that they are set close enough together that
individual rats and mice come across at least one station during their nightly movements. Rats are
wide-ranging and can be eradicated using a grid spacing of 25 m. Mice, however, are not as wide-
ranging, and require a grid spacing as close as 10 m.
It is expected that the combination of hand broadcasting and setting and arming of bait stations
will take approximately 5 days each application (coinciding with the aerial application) dependant
on results of the property management plan process and actual staff numbers.
Property Management Plans
The Property Management Plans include the agreed baiting methods for each lease on the Island,
including the settlement area. They are discussed and negotiated with the leaseholders / residents
individually and consider mitigation of specific risks and areas of concern on individual properties
(such as presence of children, pets, drinking water and vegetable gardens). The property
management plans include details of where and how hand baiting or baits would occur on the
individual property.
14
There is a potential for currently registered Brodifacoum products to be used in accordance with label conditions by
residents in some dwellings. This will be considered on a case by case basis assessing higher palatability of pellets vs. higher
dosage, quality control and resident acceptability.

Gillespie Economics 33
Gillespie Economics
Elimination of survivors
The settlement area and other selected areas of LHI will be monitored for the presence of rodents
throughout the 100-day period of the baiting operation. Detection of surviving rodents will be
evidenced by bait take from bait trays and bait stations and observations of droppings or rodent
activity. Residents will be asked to report any such evidence to the project team. In addition,
trained detector dogs will be deployed throughout the settlement area to find and locate any
surviving rodents. In the unlikely event that rodents are detected, action will be taken to eliminate
them. A Contingency Plan will be developed prior to the REP to guide selection of appropriate
actions in the event that surviving rodents are detected. This could include targeted hand baiting
or bait stations.
Ongoing Monitoring
Monitoring of the rodent-free status of LHI following the eradication of rats and mice will be
achieved by monitoring for rodent activity at bait stations, in tracking tunnels strategically placed
at stratified locations across the island and with the use of rodent detector dogs. This will form part
of the island’s permanent rodent detection and prevention system initiated as an integral part of
the island’s biosecurity program which will be upgraded in parallel with the REP.
4.3.3 Comparison
A fundamental starting point for the CBA is that "with" the REP, rodents will be eliminated from
Lord Howe Island. "Without" the REP the control program will need to continue with periodic
changing of poison due to increasing bait shyness and resistance over time. However, under the
"without" REP scenario the rodent population is likely to remain unchanged in the long run. If
alternative poisons do not become available over time to counteract bait shyness and resistance,
adverse impacts on the environment, tourists and residents would escalate over time as the control
program becomes less effective in controlling rodent populations.
4.4 Identification of Incremental Costs and Benefits
Relative to the "without" scenario of continuing the control program, the REP is likely to have a
range of potential incremental costs and benefits as shown in Table 4.1.
The main potential economic benefits of the REP relate to avoided ongoing rodent control costs,
biodiversity improvements, tourism benefits and benefits to the Kentia Palm and vegetable
industry. The main potential costs are the direct costs of implementing the REP, any reductions in
tourism (short term) as a result of the REP and any risks to non-target species and human health.
Each of the potential incremental costs and benefits identified in Table 4.1 are investigated,
quantified and, where possible, valued in the following subsection.
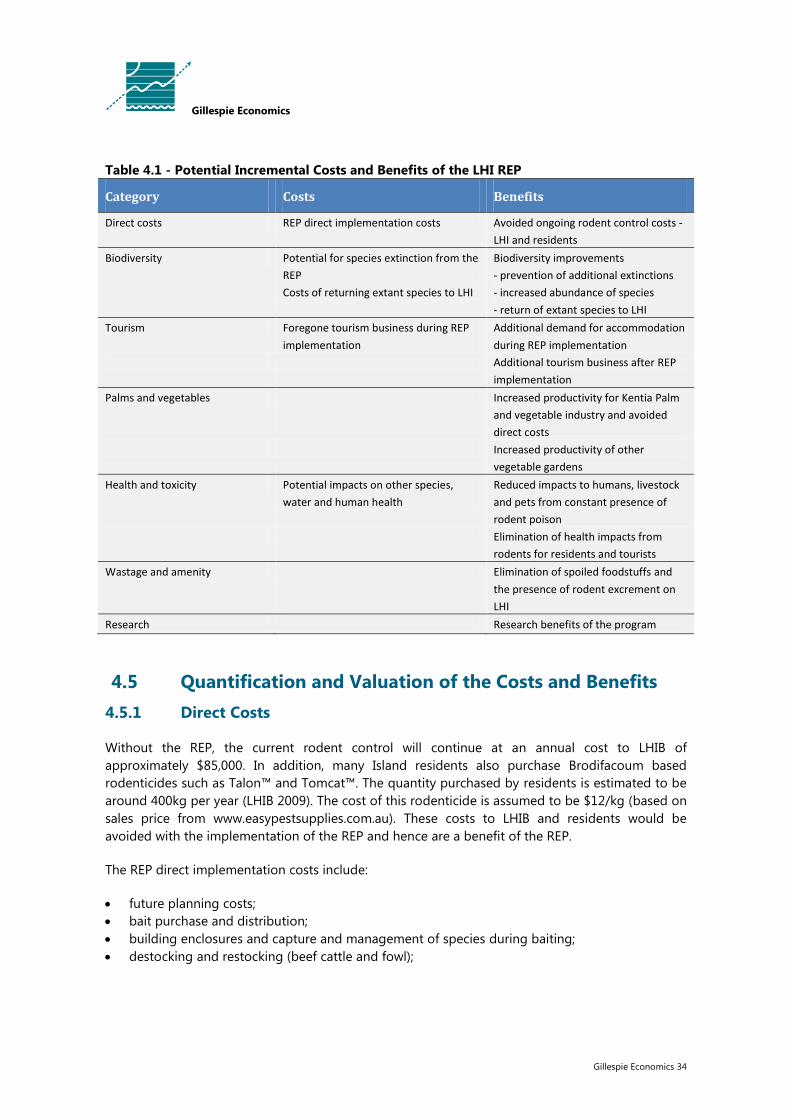
Gillespie Economics 34
Gillespie Economics
Table 4.1 - Potential Incremental Costs and Benefits of the LHI REP
Category Costs Benefits
Direct costs REP direct implementation costs Avoided ongoing rodent control costs -
LHI and residents
Biodiversity Potential for species extinction from the
REP
Costs of returning extant species to LHI
Biodiversity improvements
- prevention of additional extinctions
- increased abundance of species
- return of extant species to LHI
Tourism Foregone tourism business during REP
implementation
Additional demand for accommodation
during REP implementation
Additional tourism business after REP
implementation
Palms and vegetables Increased productivity for Kentia Palm
and vegetable industry and avoided
direct costs
Increased productivity of other
vegetable gardens
Health and toxicity Potential impacts on other species,
water and human health
Reduced impacts to humans, livestock
and pets from constant presence of
rodent poison
Elimination of health impacts from
rodents for residents and tourists
Wastage and amenity Elimination of spoiled foodstuffs and
the presence of rodent excrement on
LHI
Research Research benefits of the program
4.5 Quantification and Valuation of the Costs and Benefits
4.5.1 Direct Costs
Without the REP, the current rodent control will continue at an annual cost to LHIB of
approximately $85,000. In addition, many Island residents also purchase Brodifacoum based
rodenticides such as Talon™ and Tomcat™. The quantity purchased by residents is estimated to be
around 400kg per year (LHIB 2009). The cost of this rodenticide is assumed to be $12/kg (based on
sales price from www.easypestsupplies.com.au). These costs to LHIB and residents would be
avoided with the implementation of the REP and hence are a benefit of the REP.
The REP direct implementation costs include:
future planning costs;
bait purchase and distribution;
building enclosures and capture and management of species during baiting;
destocking and restocking (beef cattle and fowl);

Gillespie Economics 35
Gillespie Economics
dog boarding or muzzling;
dairy cows separated from bait and milk tested prior to human consumption;
preparation and implementation of property plans;
additional quarantine measures for incoming boats and planes;
additional research as part of environmental approvals;
administration costs;
ongoing monitoring.
All costs will be borne by LHIB (funded from Government grants), including preparation and
implementation of property plans. LHI estimate capital costs at $10.6M, although approximately
$1.5M of this has already been spent and hence in accordance with NSW Treasury (2007) is
excluded from the analysis.15
Incremental ongoing biodiversity monitoring costs associated with
the REP are estimated at $50,000 per year for 10 years, with ongoing rodent detection (quarantine)
costs of $30,000 per year. In this respect, LHIB have resolved to implement an improved Biosecurity
Strategy for LHI, regardless of whether the REP is implemented. Only incremental rodent
quarantine costs as a result of the REP are therefore included in the CBA.
4.5.2 Biodiversity
The population of rodents on LHI is estimated at around 63,000 to 150,000 for rats and 140,000 to
210,000 for mice (LHIB 2016e). Both species have had, and continue to have, significant adverse
impacts on the biodiversity of LHI. Ship rats are implicated in the extinction of at least five endemic
birds and at least 13 invertebrates. They are also a recognised threat to at least 13 other bird
species, 2 reptiles, 51 plant species, 12 vegetation communities and numerous threatened
invertebrates (LHIB 2009).
The impact of house mice on biodiversity of LHI is not as well understood, however, evidence
elsewhere shows that they eat eggs of small birds, reduce seedling recruitment of some plants, and
compete with native seed-eating fauna. On other islands, mice have been implicated in declines of
invertebrates, and in some cases this has greatly affected nutrient recycling processes (LHIB 2009).
Continuation of the current control program is anticipated to result in additional extinctions on LHI
over the next 20 years, particularly of invertebrates (LHIB 2016e). The OEH estimate additional
extinctions of five land snails and two plants species over the next 20 years16
under the base case.
The practice of using off-label rodenticide by residents has also been demonstrated to
indiscriminately poison birdlife on the Island as a secondary poison occurrence.
The biodiversity benefits of implementing the REP therefore include:
avoiding additional extinctions on LHI;
the ability to return extant species (due to the predation of rats and mice) such as the
Kermadec petrel, White-bellied storm petrel, phasmid and wood feeding cockroach;
15
In accordance with normal practice those costs are sunk costs and are omitted from the analysis as they cannot now be
avoided or changed and therefore do not influence the net benefits of the alternatives being evaluated. 16
20 years is used here as the choice modelling study from which WTP values are transferred was based on this time frame.
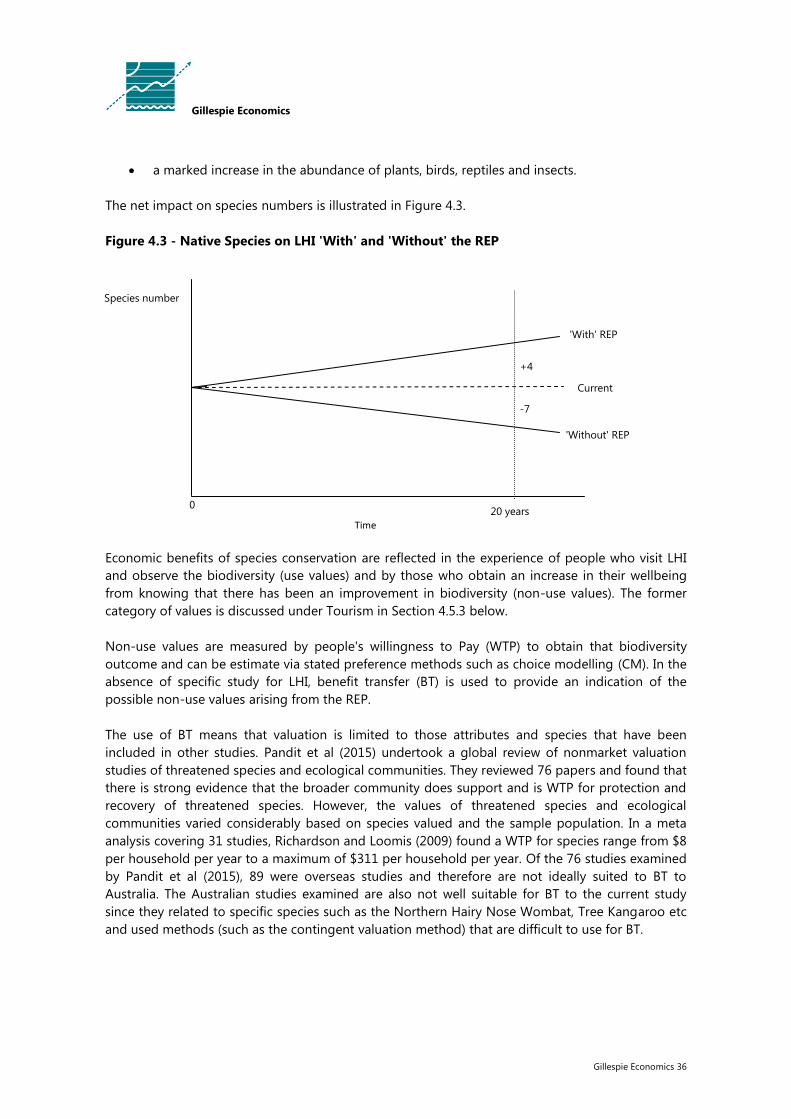
Gillespie Economics 36
Gillespie Economics
a marked increase in the abundance of plants, birds, reptiles and insects.
The net impact on species numbers is illustrated in Figure 4.3.
Figure 4.3 - Native Species on LHI 'With' and 'Without' the REP
Economic benefits of species conservation are reflected in the experience of people who visit LHI
and observe the biodiversity (use values) and by those who obtain an increase in their wellbeing
from knowing that there has been an improvement in biodiversity (non-use values). The former
category of values is discussed under Tourism in Section 4.5.3 below.
Non-use values are measured by people's willingness to Pay (WTP) to obtain that biodiversity
outcome and can be estimate via stated preference methods such as choice modelling (CM). In the
absence of specific study for LHI, benefit transfer (BT) is used to provide an indication of the
possible non-use values arising from the REP.
The use of BT means that valuation is limited to those attributes and species that have been
included in other studies. Pandit et al (2015) undertook a global review of nonmarket valuation
studies of threatened species and ecological communities. They reviewed 76 papers and found that
there is strong evidence that the broader community does support and is WTP for protection and
recovery of threatened species. However, the values of threatened species and ecological
communities varied considerably based on species valued and the sample population. In a meta
analysis covering 31 studies, Richardson and Loomis (2009) found a WTP for species range from $8
per household per year to a maximum of $311 per household per year. Of the 76 studies examined
by Pandit et al (2015), 89 were overseas studies and therefore are not ideally suited to BT to
Australia. The Australian studies examined are also not well suitable for BT to the current study
since they related to specific species such as the Northern Hairy Nose Wombat, Tree Kangaroo etc
and used methods (such as the contingent valuation method) that are difficult to use for BT.
Time
'Without' REP
'With' REP
Species number
0 20 years
Current
-7
+4

Gillespie Economics 37
Gillespie Economics
Two Australian studies using a state of the art non-market valuation method (i.e. Choice Modelling
- CM) and including a protection (from extinction) of native species attribute are those by Van
Beuren and Bennett (2000) and Mazur and Bennett (2009).
Van Beuren and Bennett (2000) in a survey of Australian households found an average WTP of
$0.68/household/year (for 20 years) i.e. $7.20 per household (present value), per species protected
from extinction. Aggregating per household benefits to the community requires adjustment for the
survey response rate since not all the originally targeted respondents participated in the survey
and it is difficult to determine the preferences of non-respondents. A conservative approach is
therefore to assumed that non-respondents were unwilling to pay for environmental
improvements (Greyling and Bennett 2012).
The response rate for the questionnaire was 16%. Adopting a conservative approach and
aggregating to this percentage of Australian households gives an economic value estimate of
$8.5M per species protected from extinction in Australia.
Mazur and Bennett (2009) undertook a CM study to acquire information about different NSW
community (local resident, distance rural and distance urban) attitudes and preferences for
environmental improvements provided by a range of potential natural resource management
(NRM) strategies in three NSW catchments (Lachlan, Namoi and Hawkesbury-Nepean).
The attributes used to describe different environmental improvements included an attribute for the
number of native species protected (from extinction in each of the catchment). The context for
elicitation for these values was a decline in native species numbers from the status quo over a 20-
year period without any natural resource management (NRM) actions and an increase in native
species numbers relative to the status quo with NRM actions. This is the same as the context for
the LHI REP. Community average WTP (implicit prices) estimates per household per annum for five
years per species protected are provided in Table 4.2. Households from three different community
types were sampled: Rural communities near the areas where the species lived, urban communities
distant from the areas and rural communities located at a distance. Statistically significant values
range from $2.43 to $6.97 per household per annum for five years.
Table 4.2 - Implicit Prices Per Household Per Annum for Five Years for Protection of a Native
Species
Catchment
Community Type
Local Rural Distant Urban Distant Rural
Hawkesbury-Nepean $6.97** $5.25** $4.97**
Lachlan $4.51* $8.11** $7.45**
Namoi $2.50* $2.43* $1.79
*Statistically significantly different from zero at the 5% level
** Statistically significantly different from zero at the 1% level
Source: Mazur and Bennett (2009) and Greyling and Bennett (2012).

Gillespie Economics 38
Gillespie Economics
Response rates for the questionnaires varied from 30% for Sydney households to 60% for rural
households (Greyling and Bennett 2012). Conservatively, aggregating the lowest value per species
across NSW households using the lowest response rate gives an economic value of $8M per
species protected from extinction in the region. This is the value used in this analysis.
However, there is risk and uncertainty associated with the future species outcomes from
implementation of the REP. One way that this can be addressed is to weight the certain benefit
estimate by the probability of it being realised (Greyling and Bennett 2012) to estimate the
expected benefit. For example, a certain benefit estimate of $8M for native species protection from
actions with a 50% probability of success results in an expected benefit estimate of $4M.
The probability of re-establishing species post REP or avoiding additional extinctions has two
components, the probability that the REP will eliminate rodents and the probability that once this
occurs species can be re-established. These probabilities are multiplicative.
Probabilities assumed in this analysis are based on experience of other island eradication projects
and expert judgements of OEH ecologists. They are identified in the following table.
Table 4.3 - Probability Assumptions
Event Probability
Success of REP in eradicating rodents 95%
Success of reintroducing species LHI Phasmid - Dryococelus australis 100%
LHI Wood-feeding Cockroach - Panesthia lata 100%
Kermadec Petrel - Pterodroma neglecta 95%*
White Bellied Storm Petrel - Fregetta grallaria 95%*
Additional Extinctions "without" the REP Four species of land snails -Whitelegge's land snail - Pseudocharopa whiteleggei -Masters' charopid land snail - Mystivagor mastersi -Mt Lidgbird charopid land snail - Pseudocharopa lidgbirdi -Magnificient Helicarionid land snail - Gudeoconcha sophiae magnica
100%
One species of land snail - Lord Howe placostylus - Placostylus bivaricosus
50%
Phillip Island Wheat Grass - Elymus multiflorus var. Kingianus 75%
LHI Passionfruit - Passiflora herbertiana ssp. insulae-howei 50%
*If actions are taken to actively attract this species. Hence a cost of these actions is included in the CBA.
The cost of reestablishment of species, subject to successful eradication of rodents, was estimated
at $50,000 (OEH ecologists, pers. comms).
In addition to benefits from protection of species, a further benefit of the REP would be an increase
in species abundance including:

Gillespie Economics 39
Gillespie Economics
a marked increase in birds, reptiles and insect density, diversity and distribution - this boost in
diversity will increase food resources for predatory terrestrial vertebrates and potentially lead
to population increases which will enrich the experience of both island residents and tourists;
and
increases in the abundance of plants, seeds and seedlings, thereby enhancing the process of
forest regeneration (LHIB 2016e).
This benefit remains unquantified in this analysis, although studies have found that the community
are WTP for increases in species abundance. For example, Blamey et al (2000) found that Brisbane
households were WTP $1.69 each to avoid each 1% decrease in the population size of non-
threatened species in the Dessert Uplands of Queensland. This value is not readily transferable to
LHI.
Notwithstanding the potential species benefits of the REP, concern has been raised in relation to
the potential impacts on soil, water, the marine environment and impact on non-target species.
Each of these is considered in below.
The Brodifacoum bait is cereal based and designed to rapidly breakdown following the absorption
of water, or after rain. Because of the physical chemical properties of Brodifacoum, it is unable to
contaminate groundwater. When Brodifacoum breaks down it binds strongly and rapidly to soil
particles with very slow desorption. It doesn't leach from the soil. It is non-toxic to plants, because
it is not transported from water or soil into the plant (Toxicos 2010). Soil residual concentrations
decline rapidly over time. After aerial application of Talon 20P (0.002% Brodifacoum) over an island
off New Zeland, Brodifacoum was not detected in soil when randomly sampled 2, 12, 34 or 210
days post application (Toxicos 2010). Other studies have also found rapid reduction in residual soil
concentrations. Notwithstanding, additional tests on LHI will be conducted to test Brodifacoum
residues in soil (LHIB 2009).
The REP is designed to ensure that the bait is directed onto land. Nevertheless, it is inevitable that
a small amount of bait will enter the marine environment, particularly where cliffs come right to the
shoreline. Most of this bait will fall within a few metres of the shoreline and will be subjected to the
mechanical effects of wave actions, resulting in disintegration within a few minutes. This, together
with the high dilution factor, and the insolubility of Brodifacoum in salt water, means that the
potential risk to marine organisms is negligible. The amount of Brodifacoum assimilated into the
marine environment will be many orders of magnitude lower than the concentrations known to be
toxic to fish (Toxicos 2010).
Research indicates that the LHI woodhen will ingest baits and poisoned rodents in amounts that
would be fatal and LHI pied currawongs consume rodents and so would be susceptible to
secondary poisoning. To minimise the impact on these two threatened species, a substantial
proportion17
of each population will be taken into captivity on LH and will remain there until baits
have disintegrated and pose no further risk (LHIB 2009). Consequently, the likelihood of extinction
of the LHI woodhen and LHI pied currawong is considered by LHIB and OEH to be highly
17
80-85-% and 50-60%, respectively.

Gillespie Economics 40
Gillespie Economics
improbable and very unlikely, respectively. (Refer to the probabilities attached to these likelihoods
in Appendix 2).
4.5.3 Tourism
Background
Tourism is the main industry on LHI, and is estimated to account for some 90% of total visitation.
The industry on LHI is comprised of the accommodation sector, tour operators, and other service
providers (Lord Howe Island Tourism Association 2015). There are 22 licensed tourist
accommodation properties ranging in size and standard and around 14 tour operators catering for
a range of activities from fishing, diving, walking, to more specialist areas such as bird watching
and environmental regeneration. Services include bike and water sports hire, retail, transport and
food and beverage (Lord Howe Island Tourism Association 2015). Individual operators will have
interests in various sectors including accommodation and tour operations, with considerable cross-
over of the type of services supplied (Lord Howe Island Tourism Association 2015). However, the
majority of tourism operators don’t provide accommodation (Bill Monks pers. coms.).
There is also a small core of LHI specialists, who facilitate direct bookings with the public, and in
some cases wholesale to the trade (see Table 4.4).
Table 4.4 - Special LHI Distribution Partners.
Specialist LHI distributors.
Oxley Travel Qantas Holidays
SPACIFICA Travel All About Travel
Norfolk- Pacific Holidays Pinetrees Travel Agency
Traveldale Holidays.
Plus any major group with whom the wholesalers have preferred agreements.
Source: Lord Howe Island Tourism Association (2015).
The island attracts approximately 15,500 visitors per year consisting of leisure, visiting friends and
relatives and business travellers (Lord Howe Island Tourism Association 2015).
The maximum number of tourists on the Island at any one time is constrained to 400 (excluding
children under 5) (although bed numbers are higher at about 500) (Lord Howe Island Tourism
Association 2015). In this analysis, it is assumed that this constraint is reached in the peak periods
of November to April. The remaining months are collectively referred to as the off-peak period in
the remainder of this analysis.
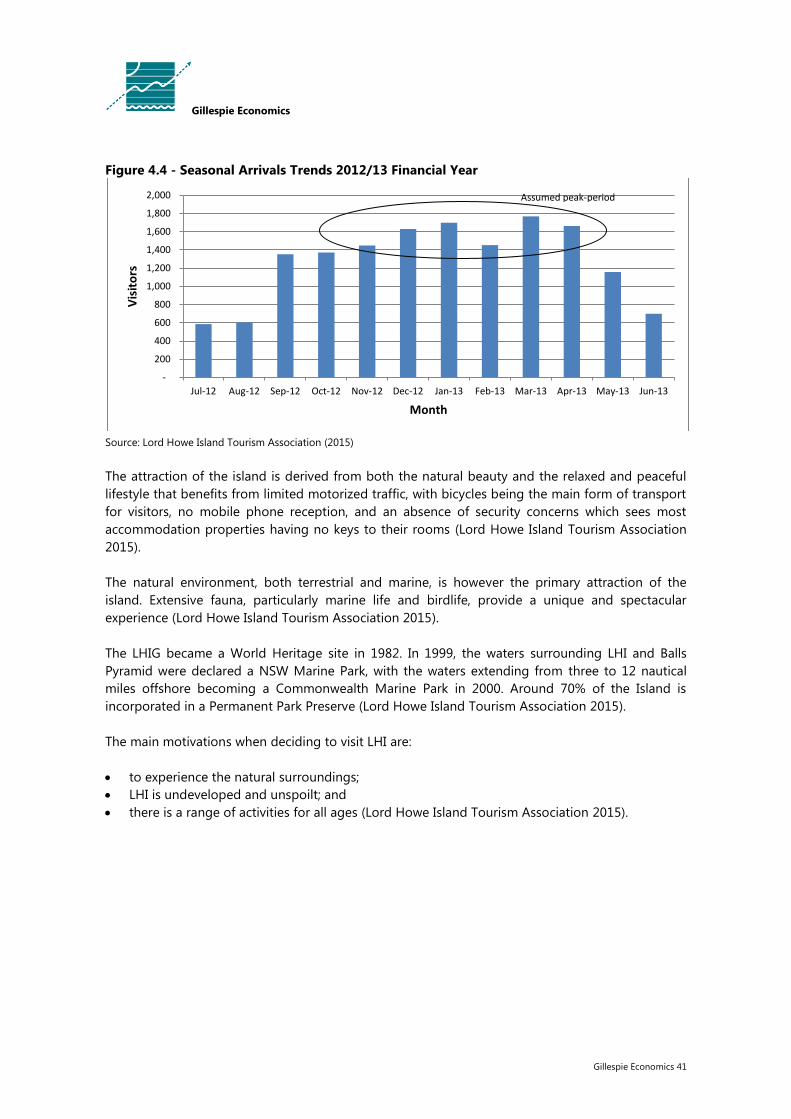
Gillespie Economics 41
Gillespie Economics
Figure 4.4 - Seasonal Arrivals Trends 2012/13 Financial Year
Source: Lord Howe Island Tourism Association (2015)
The attraction of the island is derived from both the natural beauty and the relaxed and peaceful
lifestyle that benefits from limited motorized traffic, with bicycles being the main form of transport
for visitors, no mobile phone reception, and an absence of security concerns which sees most
accommodation properties having no keys to their rooms (Lord Howe Island Tourism Association
2015).
The natural environment, both terrestrial and marine, is however the primary attraction of the
island. Extensive fauna, particularly marine life and birdlife, provide a unique and spectacular
experience (Lord Howe Island Tourism Association 2015).
The LHIG became a World Heritage site in 1982. In 1999, the waters surrounding LHI and Balls
Pyramid were declared a NSW Marine Park, with the waters extending from three to 12 nautical
miles offshore becoming a Commonwealth Marine Park in 2000. Around 70% of the Island is
incorporated in a Permanent Park Preserve (Lord Howe Island Tourism Association 2015).
The main motivations when deciding to visit LHI are:
to experience the natural surroundings;
LHI is undeveloped and unspoilt; and
there is a range of activities for all ages (Lord Howe Island Tourism Association 2015).
-
200
400
600
800
1,000
1,200
1,400
1,600
1,800
2,000
Jul-12 Aug-12 Sep-12 Oct-12 Nov-12 Dec-12 Jan-13 Feb-13 Mar-13 Apr-13 May-13 Jun-13
Vis
ito
rs
Month
Assumed peak-period

Gillespie Economics 42
Gillespie Economics
Economics of Tourism on LHI
The conceptual supply and demand framework for peak period tourism and off-peak period
tourism on LHI is provided in Appendix 3.
In both peak and off-peak periods there is:
a benefit to tourists as indicated by their WTP for a visit above their actual expenditure; and
a benefit to tourism providers by way of normal net revenue (producer surplus).
However, in peak periods where demand exceeds the capacity constraint on accommodation,
additional revenue can be earned by accommodation suppliers (with no additional cost) via
increased prices.18
These values of tourism to LHI are estimated in Appendix 3 based on a variety of data sources.
The net economic benefits of the current levels of tourism on LHI during peak periods are
estimated at $16.7m per annum, comprising:
normal net revenue of $2.9m:
$2.2m to accommodation
$252,000 to tours
$142,000 to shopping
$283,000 to meals
additional revenue from price increases of $3.1m; and
benefits to tourists of $10.7m per annum.
The net economic benefits of current levels of tourism on LHI during off-peak periods is estimated
at $7.8m per annum, comprising:
normal net revenue of $1.6m:
$1.0m to accommodation;
$222,000 to tours;
$125,000 to shopping; and
$249,000 to meals.
benefits to tourists of $6.2m per annum
18
Price effects would only occur for services where quantity is constrained.
Gillespie Economics 43
Gillespie Economics
Impact of the 'With' and 'Without' REP Scenarios
"Without" REP Scenario
A key motivation for visits to LHI is to experience the natural, undeveloped and unspoilt
surroundings, as epitomised by its WHA listing, Marine Park declarations of surrounding waters
and incorporation of around 70% of the Island in a Permanent Park Preserve.
Rodents are identified as a threat to LHIs Outstanding Universal WH values. Rodents have resulted
in a reduction in biodiversity via extinctions on LHI and a reduction in species abundance.
Under the 'without' REP scenario further degradation of World Heritage values could potentially
result in the LHIG being inscribed on the “World Heritage in Danger List”. This would have a
'signalling' effect to the tourism market of a decline in values and tourism experience and would be
expected to result in a reduction in tourism demand in both the peak and off-peak periods.
Whether LHIG is inscribed on the “World Heritage in Danger List” or not, the Lord Howe Island
Tourism Association (2015) has identified the "potential increase in negative consumer perception
of degeneration of pristine environment" as a key threat to tourism.
While some decline in tourism demand is expected to be associated with further degeneration of
the environment of LHI, for the purpose of the analysis it has conservatively been assumed that
"without" the REP, demand in the peak and off-peak periods remains constant19
over the analysis
period i.e. 30 years. Hence, the values reported above for current visitation levels are assumed to
continue.
"With" REP Scenario
'With' the REP, two separate potential impacts have been identified - short term effects during the
REP implementation and long term effects after the REP implementation.
Short Run Effects
a) Reduced Tourism Demand
The REP is proposed to be undertaken during the winter months when tourism is least.
Accommodation providers will be obliged to inform prospective tourists at the time of taking their
booking or when a decision to proceed is made (for those who already hold a booking).
The LHIB has suggested the following simple statement to inform guests that book for a holiday
during the proposed project period (June – August 2017) about the REP. This will be refined down
to the proposed month of REP implementation in the near future:
19
All other things being equal (ceteris paribus).
Gillespie Economics 44
Gillespie Economics
“The eradication would help to retain Lord Howe Island’s position as a unique paradise and World
Heritage listed island destination. It is currently planned over two blocks of 2-5 days in winter of 2017
but a final decision has not yet been made. If it goes ahead it will be safe for people and the
environment and there will be minimal disruptions for guests. A confirmed scheduled can be provided
closer to the time” (LHIB 2016b).
With the above information provided to prospective tourists, the empirical question is the
sensitivity of tourist bookings to this information.
The most sensitive group is likely to be families with children, particularly small children. However,
the Lord Howe Island Tourism Association (2015) identifies that family groups predominate in the
peak seasons of Christmas, Easter and September school holiday periods. At other times, there are
larger proportions of younger and older couples. These groups are likely to be least sensitive to the
knowledge that the REP may occur while they are present. These groups are also likely to have
greater flexibility in the time of year that they visit LHI. If they are sensitive to the information
provided they could change the off-peak time of year that they visit, to an off-peak time when the
REP is not occurring at little or no costs.
Therefore, in the absence of any survey of prospective visitors to LHI, there is a reasonable
argument to support minimal or no reduction in visitation at the time of the REP, or at least in the
off-peak period overall (allowing for some substitution for an alternative off-peak times). However,
for the purpose of this analysis it is conservatively assumed that 50% of visitors who would
otherwise have visited during the month of July (when the REP is likely to be implemented) i.e. 293
visits and 2,051 visitor nights (Lord Howe Island Tourism Association 2015), would not visit and
would not alter the timing of their booking.
This can be represented by a reduction in demand and an associated reduction in the average
spend per visitor. Refer to Appendix 3 for detailed calculations. The result is a decrease in both
normal net revenue to tourism providers and benefits to tourists in the off-peak period, estimated
at:
$130,000 foregone normal net revenue
$83,000 to accommodation;
$18,000 to tours;
$10,000 to shopping; and
$20,000 to meals.
$489,000 foregone benefits to tourists.
A caveat on the estimation of foregone normal net revenue to tourism providers is that it is based
on a fixed ratio of net revenue to revenue for each sector impacted. While this is reasonable for
large changes in demand for sectors such as accommodation and tours, for small changes in
revenue there may be no or very little change in costs i.e. most costs in the short run are fixed.
Hence, the change in net revenue may approximate the change in revenue. This is less likely for

Gillespie Economics 45
Gillespie Economics
shopping and meals where costs are likely to vary proportionally with revenue. Nevertheless, on
this basis, an upper limit estimate of foregone net revenue would be $527,494, comprising:
$308,000 to accommodation;
$68,000 to tours;
$42,000 to shopping;
$111,000 to meals.
b) Increased REP Worker Demand for Accommodation
The LHIB is expecting demand for accommodation from the non-local workforce required at the
time of the eradication. While there is uncertainty over the exact size and makeup of the project
workforce it is expected that up to 3,050 bed nights will be required during implementation of the
REP (LHIB 2016a). Table 4.5 indicates historic demand for beds from May to August and the
estimated demand from the REP workforce over this time period. The REP workforce demand will
be equivalent to an increase demand for bed nights of 15% over May to August. In total the REP
demand for bed nights is 74% of the bed nights in July, when any impacts of the REP
implementation on tourism would occur.
Table 4.5 - May to August Demand for Beds (2012/13) and Demand from the REP
May June July August
Total May to August
Total REP Bed Nights
as a % of July Bed Nights
Historic Visitors 1,158 699 586 605 3,048 586
Historic Bed Nights* 8,106 4,893 4,102 4,235 21,336 4,102
REP Bed Nights 600 900 930 620 3,050 3,050
REP Bed Nights as a % of Historic Bed Nights
7% 18% 23% 15% 15% 74%
Source: Historic data based on Lord Howe Island Tourism Association (2015) and excludes locals.
* This relates to occupied beds assuming an average stay of 7 nights per visitor.
**Qantas data for July visitation in 2014, 2015 and 2016 is 730, 641 and 639. This is higher than reported in Lord Howe
Island Tourism Association (2015) however includes locals.
Assuming the same ratio of net revenue to revenue as for foregone tourism, REP demand for
accommodation will result in an increase in net revenue to accommodation providers of between
$122,000 (based on a fixed ratio of producer surplus to revenue) and $455,000 (based on revenue
approximating net revenue). Consequently, the assumed decline in tourism demand for
accommodation during July as a result of implementation of the REP ($83,000 to $308,000) is more
than offset by the increased demand for accommodation from the non-local REP workforce,
between May and August ($122,000 to $455,000) i.e. there will be a net benefit to accommodation
providers.

Gillespie Economics 46
Gillespie Economics
If these workers have similar spending habits to tourists, then impacts on tour operators, food
providers and shops will also be more than offset. However, to the extent that the REP workforce
expenditure pattern is different to that of tourist, tour operators, and to a lesser extent food and
shopping providers may be worse-off in the short term i.e. July 2017, if assumed reductions in
tourists eventuate.
Long Run Effects
Consultations with the LHI community elicited a range of views on the potential tourism impacts of
the REP including that it would have:
ongoing negative impacts from negative community perceptions around poisoning and/or
actual negative impacts on fauna from poisoning;
positive impacts on tourism as a result of being rodent free and improved biodiversity and
abundance;
no impacts on tourism due to the constraints on tourism numbers.
However, evidence supports an increase in tourism demand post rodent eradication and economic
principles indicate benefits to tourism providers from an increase in demand even when constraints
on visitor numbers apply.
Morgan and Simmons (2014) review the evidence of the impact of eradication on Tourism. They
find that on Ulva Island, New Zealand, tourism post rodent eradication has been consistently 2-3
times the level prior to predator eradication, although this also coincided with the upgrade and
opening of walking tracks. Visitation to Tiritiri Matangi, a small island of Auckland, New Zealand,
trebled from 13,000 in 1995 to 37,000 in 2014 post predator eradication. However, this also
coincided with track upgrades, tree planting, school visits from Auckland and animal relocations.
These may not have occurred without the predator eradication.
Zealandia, where predators in valley in Karori, Wellington were eliminated in 1999 and new species
have been introduced, has had visitor numbers double since 2002 to over 80,000.
Maungatutari, a forested mountain in the Waikato, where predators were eliminated in 2006
experienced visitation 50% higher than the far more established walking destination of Mt
Pirongia, and this is expected to grow two and a half times as many visitors. Again, the increase in
visitation is at least partly associated with the provision of infrastructure.
Morgan and Simmons (2014) identify that there is a growing demand for predator-free tourist
destinations as part of a growing demand for unique eco-tourist experiences. The ecotourism
market segment is growing far faster than tourism generally. Evidence from eradications around
the world indicates that removing predators improves the lot of native fauna and flora (Jones 2010,
St Clair et al 2010, Croll et al 2016), and this can potentially provide a stimulus for the tourism
industry.

Gillespie Economics 47
Gillespie Economics
A particular segment that that has been growing quickly and is now one of the dominant sectors in
the world tourism market is bird watching (Jones and Buckley 2001). This segment is where places
with bird diversity and abundance and hence is attracted to predator free locations (Jones and
Buckley 2001). Lord Howe Island is recognised internationally as one of nine Endemic Bird Areas in
Australia (Jones and Buckley 2001).
Morgan and Simmons (2014) undertook an online survey to test whether "Predator-Free" status
would alter the likelihood of people visiting Stewart Island/Rakiura. The survey was circulated
through local and international birding communities and other tourism networks. It asked local and
international respondents whether they had previously visited Stewart Island/Rakiura. It then
explained the predator free status, and asked whether that would change their likelihood of
visiting. The purpose of the questions was to estimate the proportionate increase in tourism that
predator-free status would generate. The results indicated that predator free status would increase
the likelihood of visiting from 36% to 87% i.e. more than double.
Conservatively Morgan and Simmons (2014) suggest that predator-free status would lead to a 50-
75% increase in tourism numbers, although the time frame over which this would occur is not
identified.
The Lord Howe Island Tourism Association (2015) states that the LHI destination will not grow if it
depends on the existing visitor profile and that growth in the future needs to come from new
segments, requiring and effective new brand campaign to reposition the destination. The new
positioning has to be cognisant of the key attributes that provides the unique selling points for LHI.
"A pristine, stress free natural environment, which is safe, unpolluted, unrushed, and where
you can enjoy simple pleasures that leave you relaxed and refreshed. And is reinforced by the
supporting evidence of Abundant flora and fauna, world class diving, and many adventure
activities to challenge, where everything is easily accessed on the island, and you have the
ability to escape from the modern day pressures of traffic, high-rise and mobiles. Messaged
well, and consistently, this is a powerful and compelling argument for experiential seekers to prefer
LHI. It does however require to be told well, and frequently" (Lord Howe Island Tourism Association
2015, p. 6)
The REP provides an opportunity to add significantly to tourism marketing for LHI and reinforce
one of the Islands key selling points - abundant flora and fauna. With adjustment of existing
marketing efforts to emphasis the rodent free status of LHI, there would seem to be compelling
evidence that tourism demand for LHI would increase relative to the base case of continued
control, although the exact magnitude and timing is uncertain. For the purpose of analysis,
conservatively, a growth in demand of 20% in both peak and off-peak periods is assumed, ramping
up over a 5-year time frame. This is considerable less than suggested by the analysis of Morgan
and Simmons (2014). Section 4.8 considers the sensitivity of the analysis results this assumption
and identifies the threshold level i.e. the level of increased tourism demand, required to offset
assumed short term impacts.
Gillespie Economics 48
Gillespie Economics
An increase in demand in both peak and off-peak periods can be represented by shifts in the
respective demand curves. Refer to Appendix 3 for detailed calculations. In peak periods an
increased demand results in no increase in visitation but an increase in the market price for a visit
from an increase in accommodation prices. The additional net revenue to accommodation
providers20
estimated at $6.0m per annum.
In off-peak periods an increase in demand, results in increase visits which can be accommodated
within the capacity constraint, and an increase in price (or average spend) per visit.
The result is an increase in both the annual net revenue and benefits to tourists during off-peak to:
$2.4m net revenue to producers comprising:
$1.5m to accommodation;
$320,000 to tours;
$179,000 to shopping; and
$359,000 to meals.
$8.9m in benefits to tourist.
The additional benefits of a 20% increase in off-peak tourist are:
$719,000 net revenue to producers comprising:
$457,000 to accommodation;
$98,000 to tours;
$55,000 to shopping; and
$110,000 to meals.
$2.7m in benefits to tourists.
4.5.4 Palms and Vegetables21
Kentia Fresh acquired the former Kentia Palm Nursery from the LHIB in May 2014 under a 25 year
lease arrangement. It has been rebuilding the infrastructure of the Nursery with the dual objective
of:
Rekindling the production and sale (domestic and export) of kentia seedlings, which was
discontinued when the LHIB ceased operations at the Nursery in 2012. This enterprise includes:
collection of seeds from the Kentia Palm forests on LHI;
planting kentia seeds in boxes using plastic bags as an internal liner with approximately
600 seeds planted in between layers of peat/perlite growing mix. These are stored in a
darkened shed for approximately four months; and
20
Some increased net revenue would also accrue to airlines but this is not modelled here. 21
This section is based on Maxwell (2016).
Gillespie Economics 49
Gillespie Economics
moving boxes to igloos for a further six months or so during the germination phase.
Establishing a fruit and vegetable growing operation to supply the demands on the Island and
reduce the need to import supplies by both sea and air transport. Kentia Fresh has built
approximately 1000m2 of covered growing spaces (poly-houses and a glasshouse) to grow
tomatoes, cucumbers, eggplants, capsicums and various fruits and herbs for the local shops,
restaurants and residents. It has also restored an organic garden to complement covered
growing spaces with the capacity to produce vegetables in the rich, volcanic, island soil.
Kentia Fresh has identified a number of impacts on its operations from rodents that would
continue "without" the REP:
cost of $10,000 per year on baiting;
additional costs of seed collection due to low seed levels across all the collection areas as a
result of predation of rodents. Costs of collection are in the order of $165/bushell when in the
absence of predation it is estimated that they would be approximately $50/bushell. It is
assumed that 120 bushells/year are collected.
loss of 25% of potential Kentia production from rodent predation equating to foregone
revenue of $50,000 per year22
;
loss of 25% of fruit and vegetable production from rodent predation equating to foregone
revenue of $25,000 per year23
The costs would be avoided "with" successful implementation of the REP.
These are costs associated with the current production levels and enterprises and to the extent that
planned expansions occur they will understate the impacts of the "without" REP scenario. Other
unquantified impacts include disruption to the vegetable planting program, damage to irrigation
equipment during dryer period and psychological impacts of losses. If rodents ultimately effect the
viability of Kentia Fresh then economic costs of the "without" REP scenario will be even greater.
4.5.5 Health and Toxicity
Human health
Theoretical exposure pathways for humans are identified below, along with consideration of
potential impacts:
direct ingestion of rodent bait - the amount of bait required to be ingested by a child at one
time to cause health effects is quite large i.e. 200 pellets would need to ingested to reach the
No Observed Effect Level (NOEL) i.e. the dose that has no effect on the body. Over a 4-5 week
period that the bait will be in a physical form able to picked up by a child (4-5 weeks), it would
require ingestion of 6-7 small pellets every day by a small child to acquire a dose equivalent to
the 42 days of exposure NOEL (Toxicos 2010). A recalculation by Pacific Environment Limited
22
It is assumed that the marginal cost savings associated with the loss of production is minimal. 23
It is assumed that the marginal cost saving associated with lost production is minimal since vegetables are sold on LHI
only and losses primarily occurs as the vegetables ripen.

Gillespie Economics 50
Gillespie Economics
(2015) using the Acceptable Exposure Levels (AEL) changes these estimates to 20 pellets/day
for the single acute exposure and <1 pellet per day, every day, for the repeated exposure.
These are conservative calculations and give a 10-fold safety margin when compared to the
NOELs. As noted by Toxikos, while intoxication seems unlikely, the presence of an indicator dye
in the bait which will stain lips and mouth, in conjunction with an education campaign and
parental supervision will minimise risk from the direct ingestion of bait. Furthermore, human
studies have demonstrated the complete efficacy of antidote treatment (Vit K) for cases of
human intoxication by Brodifacoum (Pacific Environment Limited 2015);
inhalation of dust containing Brodifacoum - a reasonable maximum estimate of the amount of
Brodifacoum that might be inhaled during the REP is 5 million times less that the dose that
does not affect the body (Toxicos 2010). Pacific Environment Limited (2015) identified an error
in Toxicos's assumed concentration of Broadifacoum in the air. However, adjusting the
calculations for the correct value, the estimated exposure to a 2-3 year old child would be
25,000 times less than the acute AEL.
ingestion of soil contaminated by Brodifacoum from bait - it is unlikely that all soil incidentally
ingested would be contaminated soil. Soil residue data from New Zealand when incorporated
into the intake calculations results in negligible doses of Brodifacoum. Furthermore,
Brodifacoum is tightly bound to organic carbon in soil which significantly lowers the amount
that may be absorbed by the body (Toxicos 2010). Conservative assumptions used by Toxikos
for soil ingestion, soil concentrations of Broadifacoum and estimates of child ingestion of
Broadifacoum are insignificant when compared to the 42-day AEL (Pacific Environment Limited
2015);
dermal exposure to bait and contaminated soil - potential for dermal absorption of
Brodifacoum is low. When it is bound to soil the potential for dermal absorption is even lower
(Toxicos 2010). Pacific Environment Limited (2015) found that the conservative assumptions
used by Toxikos for soil contamination of the hands of a child and dermal absorption result in
insignificant effects compared to the 42 day AEL.
ingestion of water (groundwater and tank water) that may become contaminated by bait -
because of its physical chemical properties, Brodifacoum is unable to contaminate
groundwater and in any case groundwater on LHI is not used for drinking. Contamination of
tank water is unlikely due to hand broadcasting in the settlement area. Birds eating bait and
depositing droppings on roofs and gutters, or birds picking baitup and discarding it onto roofs
are unlikely to place significant amounts of Brodifacoum onto the roof to the extent that tank
water would be unsafe to drink (Toxicos 2010). Pacific Environment Limited (2015) found that
Toxikos's estimates of the amount of Broadifacoum a child might ingest through drinking tank
water is insignificant compared to the 42 day AEL.
consumption of :
vegetables and fruit - Brodifacoum does not contaminate vegetables and fruit because it is
not transported from water or soil into the plant. The surface of a plant could become
contaminated if the bait was physically broadcast onto the plant, however, this should not
occur as bait will be hand broadcast in the settlement areas. Even if the surface of plants
were contaminated bait particles can be easily washed off during food preparation
(Toxicos 2015). Pacific Environment Limited (2015) confirmed that uptake into plants is
considered to be negligible.
poultry produce - will be removed from LHI prior to the REP.
Gillespie Economics 51
Gillespie Economics
fish that have ingested bait inadvertently distributed to shore waters - it is unlikely that fish
will have much of an opportunity to eat bait that might fall into the ocean before it
disintegrates and it is also unlikely that humans will catch such fish in numbers where it
may become a health issue. In New Zealand there has been a very large accidental spill of
Brodifacoum into the sea with no measurable levels in fish flesh (Toxicos 2010). Pacific
Environment Limited (2015) considered that all the assumptions used by Toxicos in its
analysis are conservative and appear reasonable. The estimated daily dose of Brodifacoum
from high end consumption of fish is insignificant compared to the 42 day AEL.
meat and dairy produce - beef cows will be removed from LHI prior to the REP. Dairy cows
will be isolated and protected from ingestion of Brodifacoum.
wild ducks - these are not consumed by residents of LHI (Toxikos 2010).
Toxikos (2010) identified that many of the potential human exposure pathways to the proposed
bait will not occur because they are hypothetical due to the proposed management practices that
are to be put in place during and after the REP e.g. removal of poultry and cattle from LHI, isolation
of dairy cows from exposure. Toxikos (2010) identifies that other direct and indirect exposure
pathways pose negligible risk for human health.
Toxicos (2010) identify that the most important exposure pathway is direct ingestion of bait pellets
picked up off the ground. However, substantially quantities would need to be ingested to have any
impacts and with toxic signs apparent several days before the onset of any life threatening effects
the toxicity of Brodifacoum is easily treated with Vitamin K. As identified by Pacific Environment
Limitied (2015) the proposed REP involving the use of Brodicafoum will not pose a risk to the
health of the residents of Lord Howe Island. The risk management processes included in the plan
will mitigate any possible risks posed by the use of Brodicafoum.
Livestock
Having livestock present during the eradication poses a substantial risk to the success of the
operations. Stock feed provides an ideal harbour and food source for rodents. If rodents have
access to this feed or any spillage they may not take baits. There is also a risk that livestock may
consume baits. Consequently, the proposal is to, as far as possible, destock LHI prior to the
eradiation (LHIB 2009).
This will be done largely through orderly culling and butchering. Replacement breeding stock will
then be brought to the island when the breakdown of bait in the paddocks is complete (LHIB
2009). This imposes a cost on stock owners which will be compensated for by the LHIB. The cost of
destocking and compensation is included in the costs of the REP and hence no addition costs
require inclusion in the CBA.
Dogs
Dogs are at risk from both primary and secondary poisoning from Brodifacoum. This a risk that
under the "without" REP scenario will continue into the future, although there are no known
incidences of anticoagulant poisoning from the current control operations. However, this may be
partly due to ongoing management of dogs by their owners.
Gillespie Economics 52
Gillespie Economics
Under the "with" REP scenario, the risk will be heightened for a period of up to 100 days due to the
more extensive bait distribution, and then all risks to dogs will be eliminated. To assess this
heightened by short term risk to each dog, owners will be provided with a sample of non-toxic bait
many months prior to the operations. Any dogs that have a propensity to eat baits may need to be
muzzled and/or kept on a leash during the period that bait is present on the ground. The option of
removing the dogs from LHI for the duration of the risk period and housing them in boarding
kennels on the mainland will be available to any concerned residents, at no cost to them (LHIB
2009). The cost of these mitigation actions that reduce the risk of harm to dogs to a negligible
level24
will be borne by the LHIB and are included in the direct costs of the REP.
With the implementation of the mitigation measures, the risk to dogs over the 100 days is
considered negligible while under the base case the risk is also considered negligible but ongoing.
4.5.6 Wastage and Amenity
Rodents can lead to spoilage and destruction of stored food products and result in a reduction in
residential amenity through dispersal of rodent excrement. These costs of the "without" scenario
are avoided with implementation of the REP. While these impacts can potentially be estimated via
methods such as the value of spoiled goods, no quantitative information on this was available.
Consequently, this benefit (avoided cost) of the REP remains unquantified in the analysis.
4.5.7 Research
The benefits of research associated with the REP can be thought of in terms of reducing the costs
of future Island REPs. Alternatively, it may improve the likelihood of success of future Island REPs.
This benefit may accrue in NSW, the rest of Australia or in other parts of the World.
The magnitude of this benefit to Australia is difficult to estimate and remains unquantified in this
analysis.
4.6 Results
The present value of the additional costs and benefits of the REP is provided in Table 4.6. The REP
is estimated to have net social benefits of around $142m and a benefit cost ratio of 17.0 This
indicates that the aggregate welfare of the community is improved by implementing the REP i.e.
the incremental benefits of the REP exceed the incremental costs.
There are incremental biodiversity benefits, incremental tourism benefits and incremental benefits
to the Kentia Palm and vegetable industry from implementation of the REP.
There are benefits that remain unquantified in the analysis i.e:
24
Particularly, because in the unlikely event of poisoning, the affected dog will be treated with a course of vitamin K
injections administered under veterinarian supervision.

Gillespie Economics 53
Gillespie Economics
increased species abundance;
increased productivity of private vegetable gardens;
reduced risk to humans, livestock and pets from constant presence of rodent poison;
elimination of health impact from rodents for residents and tourists;
elimination of spoilt foodstuffs and presence of rodent excrement on LHI;
research benefits from the REP.
If these were able to be quantified they would increase the net benefits of the REP. However, the
magnitudes of the benefits are unlikely to be material to the CBA results.
The main potential unquantified cost of the REP relates to toxicity risks to humans, dogs and
aquatic species.25
However, expert reports on toxicity (Toxikos 2010; Pacific Environment Limited
2015) examined all the theoretical exposure pathways for humans and found that many were
theoretical due to the proposed management practices during the REP and others pose negligible
risk for human health. The studies also found that the risk to marine organisms is negligible. The
risk to dogs will heighten for a period of up to 100 days with implementation of the REP but then
all risks to dogs will be eliminated.
25
Toxicity risk to terrestrial species has be explicitly addressed.

Gillespie Economics
Gillespie Economics 54
Table 4.6 - Present Value of Incremental Costs and Benefits (@7% discount rate)
Category Costs $ Benefits $ Net Benefits Direct costs REP direct implementation costs Avoided ongoing rodent control costs Capital costs $7,658,155 LHIB $845,425 Ongoing costs $620,823 Residents $47,742 ($7,385,812)
Biodiversity Potential for species extinction from REP $1,055 Prevention of additional extinctions $40,599,970
Costs of returning extinct species to LHI $38,774 Return of extinct species to LHI $27,537,371
Increased abundance of species $68,098,566
Tourism Foregone tourism during REP implementation
Additional accommodation during REP implementation
Net revenue $113,686 Accommodation net revenue $106,773
Tourist benefits $427,457 Net revenue to tours, food outlets and shops NQ
Tourist benefits NA
Additional tourism business after REP implementation
Net revenue $57,175,022
Tourist benefits $23,153,099 $79,893,751
Palms and vegetables
Increased productivity for Kentia Palm industry and avoided direct costs $982,682
Increased productivity of other vegetable gardens NQ $982,682
Health and toxicity Any impact to other species, water and human health NQ
Reduced impact to humans, livestock and pets from constant presence of rodent poison NQ NQ
Elimination of health impacts from rodents for residents and tourists NQ NQ
Wastage and amenity
Elimination of spoiled foodstuffs, rodent excrement for residents
NQ NQ
Research Research benefits of the program NQ NQ
Total Total costs $8,859,951 Total benefits $150,448,082 $141,588,132
Net Present Value $141,588,132
Benefit Cost Ratio 17.0
Note: NA = not applicable, NQ = not quantified
Reporting of calculations should not be misconstrued as conveying false accuracy

Gillespie Economics
Gillespie Economics 55
4.7 Distribution of Costs and Benefits
As identified in Section 3.1, CBA is only concerned with the single objective of economic efficiency.
CBA and welfare economics provide no guidance on what is a ‘fair, equitable’ or ‘preferable’
distribution of costs and benefits. Nevertheless, CBA can provide qualitative and quantitative
information for the decision-maker on how economic efficiency costs and benefits are distributed.
Table 4.6 above is reproduced below for Australians residing off LHI and those residing on LHI.
From Table 4.8 it can be seen that the main costs and benefits that accrue to non-residents of LHI
are:
the capital cost of the REP which is funded by various government grants and ultimately tax
payers of NSW and Australia;
the costs of returning species to LHI which is assumed to be funded by the OEH and ultimately
tax payers of NSW and Australia;
the benefits of avoided extinctions, return of species and increased species abundance which
accrues to households of NSW that are WTP to for this biodiversity outcome; and
benefits to tourists associated with additional tourists to LHI during off-peak periods.
From Table 4.9 it can be seen that the main costs and benefits that accrue to residents of LHI are:
ongoing costs of biodiversity monitoring and rodent detection which are assumed to be
funded by the LHIB and ultimately LHI residents;
avoided ongoing costs of rodent control which accrue to both the LHIB (and ultimately LHI
residents) and residents directly;
decreased net revenues to tourism providers during the REP - if there is a reduction in tourist
demand.
increased net revenues to tourism providers from increased demand for worker
accommodation;
increased net revenues to tourism providers from additional tourism demand after the REP
implementation; and
increased net revenues to the Kentia Palm and vegetable growing industry.
For both groups of stakeholders, those resident on LHI and those outside of LHI, there are net
benefits from the REP.
A particular focus of the distributional consideration is the impact of the REP on tourism and
tourism providers i.e. net revenues to tourism providers.
As identified in Section 4.5.3, there is a reasonable argument to support minimal or no reduction in
visitation at the time of the REP, or at least in the off-peak period overall (allowing for some
substitution for an alternative off-peak times). However, if it assumed that there is a 50% decrease

Gillespie Economics 56
Gillespie Economics
in tourists during July 2017 as a result of the REP then the reduced net revenues to tourism
providers26
is estimated at:
$83,000 to $308,000 to accommodation;
$18,000 to $68,000 to tours;
$10,000 to 42,000 to shopping; and
$20,000 to $111,000 to meals.
These economic costs would only accrue to those operators that are normally open during July.
Refer to Table 4.7.
Table 4.7 - Tour Operators and Shops that are Normally Open in July
Accommodation Open in July (Yes/No) Leanda Lei Open
Blue Peter (part of Arajilla) Open but can vary yearly
Ocean View Open
Lorhiti Open
Arajilla Closed
Pine Trees Closed
Blue Lagoon Closed
Pandanus Closed for redevelopment. Expected reopening in Sep 17
Ebb Tide Open
Waimarie Open
Treehouse Open
Admiralty Open
Beachcomber Open
Banyan Open
Bowker Beach House Open
Lagoon Landing Open
Hideaway Open
Earls Anchorage Open
Capella Closed
Somerset Open
Milky Way Open
Howena Open
Tours
Fish Lord Howe Generally closed for ~6 weeks
Sea to Summit Open
Oblivienne Open
LHI Environmental Tours Open
Pro Dive Closed
Howea divers Closed
26
It should be noted that reduced net revenue is an overstatement of financial cost as it is gross of tax. Also these estimates
are based on broad industry relationships and hence should be interpreted as order of magnitude estimates rather than
specific estimates of impacts to individual businesses.

Gillespie Economics 57
Gillespie Economics
Marine Adventure Closed
LHI Nature Tours Open
Islander Cruises Closed
Divine Seafoods Unclear
Blue Billy Closed
Chasing Thyme Open
Wilson’s Tours Open
Ron’s Ramble Open
Shops / Galleries
Iskland Showcase Open
Izaak’s Studio Open
Ginny’s Shed Open
Abemama Open
Beach Boutique Open
However, increased demand for accommodation would arise from REP workforce and this demand
would more and offset the reduction in accommodation demand if there was a 50% decline in
tourist demand. Net beneficiaries would be those accommodation providers normally open in
winter or who choose to be open due to the net increase in demand.
If these workers have similar spending habits to tourists, then impacts on tour operators, food
providers and shops will also be more than offset. However, to the extent that the REP workforce
expenditure pattern is different to that of tourist, tour operators, and to a lesser extent food27
and
shopping providers may be worse-off in the short term i.e. July 2017, if assumed reductions in
tourists eventuate. However, a number of mitigation measures discussed in Section 5 should
ensure minimal short term impacts for tour operators, food providers and shops.
Based on the supply and demand models presented in Appendix 3, accommodation providers (and
airlines), who would be no worse-off in the short term as a result of the REP, would be the main
beneficiaries of any increase in peak season demand. This is because benefits would mainly accrue
via price effects for accommodation rather than any increase in visitation.
An increase in off-peak increase in tourism demand as a result of the REP would benefit all tourism
service providers as it would result in both price effects and increases in visitation.
The 20% increase in off-peak visitation levels modelled in Appendix 3 does not reach the capacity
constraint. However, if this level of demand were to be reached either in the off-peak period as a
whole or individual months then benefits from increases in demand past this point would accrue to
accommodation providers only.
27
Workers will still need to purchase food but may not frequent restaurants as often as tourists.

Gillespie Economics 58
Gillespie Economics
Table 4.8 - Present Value of Incremental Costs and Benefits Outside LHI (@7% discount rate)
Note: NA = not applicable, NQ = not quantified
Reporting of calculations should not be misconstrued as conveying false accuracy
Category Costs $ Benefits $ Net Benefits Direct costs REP direct implementation costs Avoided ongoing rodent control costs Capital costs $7,658,155 LHIB LHI Ongoing costs LHI Residents LHI ($7,658,155)
Biodiversity Potential for species extinction from REP $1,055 Prevention of additional extinctions $40,599,970 Costs of returning extinct species to LHI $38,774 Return of extinct species to LHI $27,537,371 Increased abundance of species NQ $68,098,566
Tourism Foregone tourism during REP implementation Additional accommodation during REP implementation
Net revenue LHI Accommodation net revenue LHI Tourist benefits $427,457 Net revenue to tours, food outlets and shops NQ Tourist benefits NA Additional tourism business after REP implementation Net revenue LHI Tourist benefits $23,153,099 $22,725,642
Palms and vegetables Increased productivity for Kentia Palm industry and avoided direct costs
LHI Increased productivity of other vegetable gardens
LHI
Health and toxicity Any impact to other species, water and human health
NQ Reduced impact to humans, livestock and pets from constant presence of rodent poison
LHI Elimination of health impacts from rodents for residents
and tourists LHI
Wastage and amenity
Elimination of spoiled foodstuffs, rodent excrement for residents LHI
Research Research benefits of the program NQ
Total Total costs $8,125,442 Total benefits $91,290,439 $83,164,998
Net Present Value $83,164,998
Benefit Cost Ratio 11.2
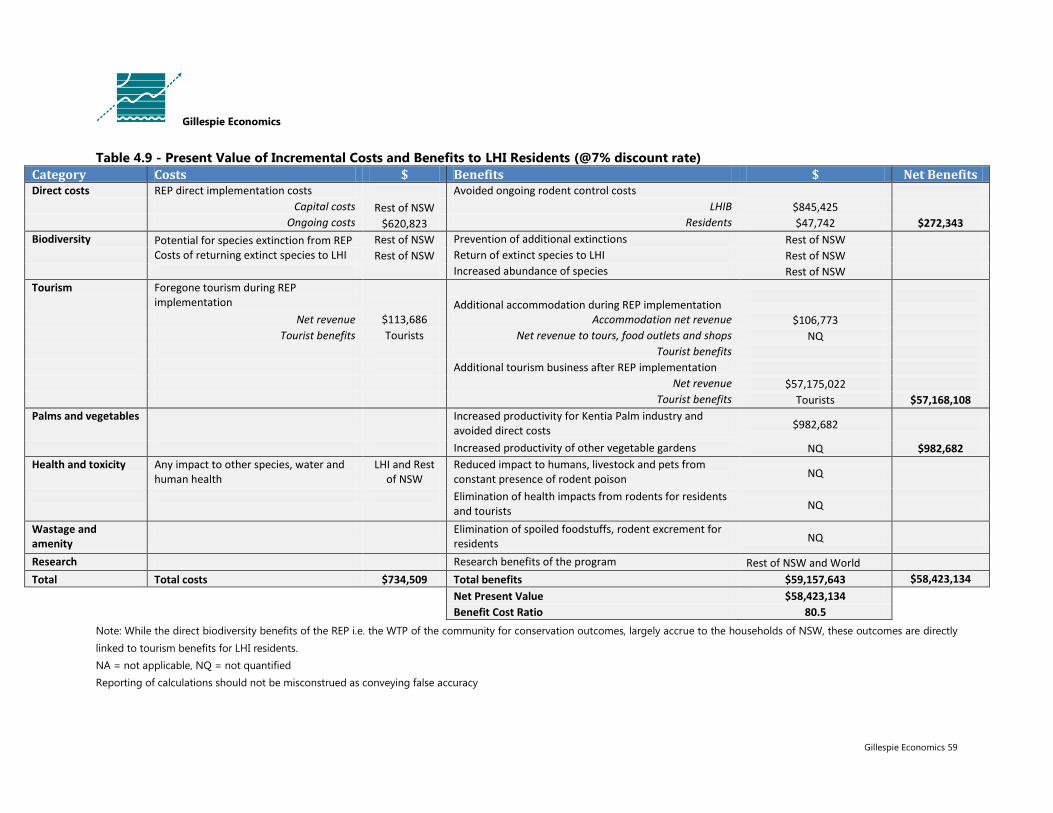
Gillespie Economics 59
Gillespie Economics
Table 4.9 - Present Value of Incremental Costs and Benefits to LHI Residents (@7% discount rate)
Category Costs $ Benefits $ Net Benefits Direct costs REP direct implementation costs Avoided ongoing rodent control costs Capital costs Rest of NSW LHIB $845,425
Ongoing costs $620,823 Residents $47,742 $272,343
Biodiversity Potential for species extinction from REP Rest of NSW Prevention of additional extinctions Rest of NSW
Costs of returning extinct species to LHI Rest of NSW Return of extinct species to LHI Rest of NSW
Increased abundance of species Rest of NSW
Tourism Foregone tourism during REP implementation Additional accommodation during REP implementation
Net revenue $113,686 Accommodation net revenue $106,773
Tourist benefits Tourists Net revenue to tours, food outlets and shops NQ
Tourist benefits
Additional tourism business after REP implementation
Net revenue $57,175,022
Tourist benefits Tourists $57,168,108
Palms and vegetables Increased productivity for Kentia Palm industry and avoided direct costs
$982,682
Increased productivity of other vegetable gardens NQ $982,682
Health and toxicity Any impact to other species, water and human health
LHI and Rest of NSW
Reduced impact to humans, livestock and pets from constant presence of rodent poison NQ
Elimination of health impacts from rodents for residents and tourists NQ
Wastage and amenity
Elimination of spoiled foodstuffs, rodent excrement for residents NQ
Research Research benefits of the program Rest of NSW and World
Total Total costs $734,509 Total benefits $59,157,643 $58,423,134
Net Present Value $58,423,134
Benefit Cost Ratio 80.5
Note: While the direct biodiversity benefits of the REP i.e. the WTP of the community for conservation outcomes, largely accrue to the households of NSW, these outcomes are directly
linked to tourism benefits for LHI residents.
NA = not applicable, NQ = not quantified
Reporting of calculations should not be misconstrued as conveying false accuracy

Gillespie Economics 60
Gillespie Economics
4.8 Sensitivity analysis
The CBA results reported in Section 4.6 are based on the assumptions outlined in Section 4.5. There is
uncertainty surrounding the likelihood of events specified with probabilities and the values attributed to
different outcomes. This Section tests the sensitivity of the results to changes in values of critical variables.
The results under different scenarios are summarised in the following Table.
Table 4.10 - CBA Sensitivity Testing (Present Value $Millions and Benefit Cost Ratio)
4% Discount
Rate 7% Discount
Rate 10% Discount
Rate CENTRAL ANALYSIS $285 $142 $116
17.6 17.0 15.2
Increases by 50%
REP costs $278 $138 $112
12.3 11.9 10.6
Avoided ongoing rodent control costs $286 $142 $116
17.7 17.0 15.2
Biodiversity costs $285 $142 $116
17.6 16.9 15.1
Biodiversity benefits $351 $176 $149
21.4 20.8 19.2
Tourism costs (short term impacts ) $285 $141 $116
17.1 16.5 14.7
Tourism benefits i.e. increased demand by 30% $369 $182 $144
22.5 21.5 18.6
Kentia Palm Benefits $286 $142 $116
17.7 17.0 15.2
Decrease by 50%
REP costs $292 $145 $119
31.0 29.9 26.9
Avoided ongoing rodent control costs $284 $141 $116
17.6 16.9 15.1
Biodiversity costs $285 $142 $116
17.7 17.0 15.2
Biodiversity benefits $219 $108 $83
13.8 13.1 11.1
Tourism costs (short term impacts ) $286 $142 $116
18.2 17.5 15.7
Tourism benefits i.e. increase demand by 10% $202 $101 $88
12.8 12.4 11.7
Kentia Palm Benefits $284 $141 $115
17.6 16.9 15.1
Additional scenario
Tourism benefits i.e. increase demand by 5% $160 $81 $74
10.3 10.2 10.0
The sensitivity analysis indicates that the CBA results are not sensitive to substantive changes in key
variables. The primary drivers of the CBA results are the estimated benefits from biodiversity
improvements and increased demand for tourism arising from the REP.

Gillespie Economics 61
Gillespie Economics
The biodiversity benefits are based on BT of values from a study of catchments in NSW. The most
conservatively low value from this study was applied to the CBA of the REP. These values also related to
local extinction or presence of species rather than global extinction of species and hence to the extent
that the REP would avoid global extinction of species this approach would understate benefits. The
estimate of biodiversity benefits also conservatively excluded the benefit of increase abundance of
species.
Tourism benefits were based on an assumption of a 20% increase in demand post REP, which was
considerably less than the conservatively low estimate of tourism increases post eradication suggested by
case studies. However, even if it were assumed that there would be no tourism benefits, the REP would
still provide net benefits to the Australian community because of the level of biodiversity benefits.
A sustained increase in off-peak demand of 0.4% (29 visitors) post REP would be required to offset the
maximum assumed short term impacts to tour operators, shops and meal providers.
Gillespie Economics 62
Gillespie Economics
5 Impacts of the Rodent Eradication Project on
the Lord Howe Island Economy
5.1 Introduction
CBA of the LHI REP is concerned with the costs and benefits to stakeholders in the community, including
those residing off the Island. Cost and benefits are in terms of changes in first round producer and
consumer surpluses with secondary impacts assumed in aggregate to be zero across the Australian
community. In this framework, reductions in expenditure are benefits e.g. avoided costs of the ongoing
rodent control, while increases in expenditures are costs e.g. costs of implementing the REP.
However, changes in expenditures and revenue impact economic activity on LHI. These are not measures
of costs and benefits from an overall community and CBA perspective. However, changes in economic
activity on LHI is of particular interest to stakeholders.
5.2 Economic Activity Impacts
All activities associated with the REP that involve changes in short term and long term impacts on
economic activity on LHI are summarised in Tables 5.1 and 5.2, respectively.
In the short term, there will be in the order of $400,000 spent on local labour to assist in the REP
implementation and post REP monitoring. Reduced expenditure on tourism business is estimated at
between zero and $527,000, depending on the impact of the REP implementation on visitation. The
maximum estimate of reduced tourism expenditure on accommodation during the REP implementation
($307,000) is more than offset by the accommodation demand by nonlocal workers ($454,689) and if
these workers have the same expenditure patterns as tourists then maximum assumed impacts on tour
operators, food providers and shops will also be more than offset. Expenditure on tour operators is the
expenditure category where worker expenditure is most likely to be different from tourist expenditure.
Overall in the short run the REP implementation will result in an increase in expenditure in the local
economy.

Gillespie Economics 63
Gillespie Economics
Table 5.1 - Changes in Short Term Economic Activity on LHI as a result of the REP
Reductions in
Economic Activity
$ Increases in
Economic Activity
$
LHI Labour Force REP direct implementation
expenditure on LHI e.g.
local labour
$300,000 for
local labour *
$100,000 for
monitoring**
Tourism operators Reduced tourism business
output during REP
implementation
$0 to $527,494
comprising:
- $307,780 to
accommodation
- $67,589 to tours
- $41,506 to shopping
- $110,619 to meals
Additional output for
accommodation during
REP implementation
Additional output for tour
operators, food providers
and shops
$454,689
NQ
Total Short Term
Impacts
$0 to $527,000 $854,689 plus
*50% local labour for implementation - wage @ $30/hr
**$50,000 pa for two years
In the long run, there is expected to be increased expenditure on LHI from an increase in peak and off-
peak tourism expenditure. There will also be increased profitability to the Kentia Palm Nursery. Local
labour will experience some reduction in direct output as wages associated with the ongoing rodent
control program will no longer be spent and there will be a reduction in expenditure on labour involved in
Kentia Palm seed collection. However, overall in the long run the REP implementation is expected to result
in a substantial increase in expenditure in the local economy.

Gillespie Economics 64
Gillespie Economics
Table 5.2 - Changes in Long Term Economic Activity on LHI as a result of the REP
Reductions in
Economic Activity
$ Increases in Economic
Activity
$
LHI labour Reduced ongoing rodent
control output
$50,000 pa
Reduced expenditure on
Kentia Palm seed collection
$13,110 pa
Tourism operators Additional off-peak tourism
business output after REP
implementation
$2,765,556 pa
- $1,613,636 to
accommodation
- $354,355 to tours
- $217,610 to
shopping
- $579,954 to
meals
Increased peak period
output to accommodation
providers tourism business
after REP implementation
$6,024,058 pa
Kentia Palm Nursery Increased output of Kentia
Palms and Vegetables
$75,000 pa
Long Term Impacts $63,110 pa $8,864,61 pa
Where changes in economic activity involve expenditure there would also be some flow-on economic
activity impacts. For example, additional off-peak tourism as a result of the REP would flow to
accommodation providers which would also created additional demand for employees, who would spend
some of their additional income on the island etc. Other types of economic activity may have little flow-on
effects e.g. increased tourism accommodation output in peak periods, which is essentially additional
profit, and requires no additional expenditure to realise.
5.3 Mitigation Measures
In both the short term and long term the economic activity impacts on the LHI economy from the REP are
likely to be positive.
Notwithstanding, should impacts arise from reduced tourism visitation at the time of REP implementation
these are most likely to felt by tourism operators and to a lesser extent food providers (mainly
restaurants) and shops.
Short term impacts on tourism operators, shops and food outlets could be minimised through:
promotion of local purchases to the incoming workforce;
provision of tour and restaurant vouchers to workers;
Gillespie Economics 65
Gillespie Economics
mandating the rental of tourist operators’ vehicles and boats where required for implementation of
the REP.
Reduced ongoing expenditure on LHI labour from cessation of the rodent control program and decreased
expenditure on seed collection may be able to be offset through provision of alternative employment
opportunities that arise from increased tourism demand and productivity of the Kentia Palm nursery.

Gillespie Economics 66
Gillespie Economics
6 Conclusion
The CBA of the REP reported here indicates that the project will provide net benefits to the people of
Australia and hence is justified on economic efficiency grounds. It will provide net biodiversity benefits,
net tourism benefits and net benefits to the Kentia Palm and fresh vegetable industry. The REP will also
provide net benefits to residents of LHI and net benefits to residents in the rest of Australia.
It is reasonable to expect that there will be minimal or no reduction in visitation at the time of the REP, or
at least in the off-peak period overall (allowing for some substitution for an alternative off-peak times).
Nevertheless, the conservatively high assumed reduction in visitation as a result of the REP
implementation would be offset in present value terms by a sustained 0.4% (29 people) increase in off-
peak demand because of the eradication of rodents. This is far short of the 50-75% increase in demand
following eradications programs suggested by case studies.
A key driver of the CBA results is the estimated value for biodiversity benefits. This was based on BT from
another study undertaken in another context. Future similar studies of Island rodent eradication programs
would gain from undertaking a primary nonmarket valuation study e.g. choice modelling study, to
estimate community WTP for the specific biodiversity benefits of specific rodent eradication programs.
The results of a primary travel cost method study would also provide information relating to the demand
curve for visits that could be used to inform the demand and supply models for tourism.

Gillespie Economics 67
Gillespie Economics
7 References
Arche Consulting Pty Ltd (2010) Lord Howe Island Marine Park Profile of Local Businesses, prepared for the
Department of Environment Climate Change & Water
BDA Group and Gillespie Economics (2007) The economic and social impacts of Protected Areas in
Australia, report to the Department of the Environment and Water Resources.
Blamey, R., Rolfe, J., Bennett, J. and Morrison, M. (2000) Valuing remnant vegetation in Central Queensland
using choice modelling, The Australian Journal of Agricultural and Resource Economics, 44:3, pp. 439-456.
Boardman, A., Greenberg, D., Vining, A. and Weimer, D. (2001) Cost-Benefit Analysis: Concepts and
Practice, Prentice Hall, USA.
Bureau of Transport Economics (1999) Facts and furphies in Benefit Cost Analysis: transport,
Commonwealth of Australia.
Costanza, R, d'Arge, R, de Groot, R, Farber, S, Grasso, M, Hannon, B, Limburg, K, Naeem, S, O'Neill, RV,
Paruelo, J, Raskin, RG, Sutton, P & van den Belt, M (1997), The value of the world's ecosystem services and
natural capital, Nature, vol. 387, pp. 253–260.
Croll, D., Newton, K., McKown, M., Holmes, N., Williams, J., Young, K., Buckelew, S., Wolf, C., Howald, G.,
Bock, M., Curl, J. Tershy, B. (2016) Passive recovery of an island bird community after rodent eradication,
Biological Invasions 18, p. 703-715.
Crouch. G. (1994) Price elasticies in international tourism, Hospitality Research Journal, Vol. 17(3), p. 27-39.
Department of Environment and Climate Change (2007) Lord Howe Island Biodiversity Management Plan,
Department of Environment and Climate Change, Hurstville.
Department of Environment, Sports and Territories, Department of Finance and Resource Assessment
Commission (1995) Techniques to Value Environmental Resources: An Introductory Handbook, AGPS,
Canberra.
Driml, S., (1994) Protection for Profit: Economic and Financial Values of the Great Barrier Reef World
Heritage Area and Other Protected Areas. Research Publication No 35, Great Barrier Reef Marine Park
Authority, Townsville.
Edwards, S. (1990) An Economic Guide to Allocation of Fish Stock between Commercial and Recreational
Fisheries, NOAA Technical Report NMFS 94, US Department of Commerce, Washington.
Greyling. T. & Bennett. J. (2012) Assessing environmental protection investments in New South Wales
catchments, Australasian Journal of Environmental Management, 19:4, 255-271.
James, D. and Gillespie, R. (2002) Guidelines for Economic Effects and Evaluation in EIA, prepared for NSW
Department of Urban Affairs and Planning.
Jones, H. (2010) Prognosis for ecosystem recovery following rodent eradication and seabird restoration in
an island archipelago, Ecological Applications 20(5), p. 1204-1216.
Jones, D.N. and Buckley, R. (2001) Birdwatching tourism in Australia, Cooperative Research Centre for
Sustainable Tourism of Australia, Wildlife Tourism Research Report Series No. 10.

Gillespie Economics 68
Gillespie Economics
Lord Howe Island Board (2009) Draft Lord Howe Island Rodent Eradication Plan, Lord Howe Island Board,
Lord Howe Island.
Lord Howe Island Board (2016a) Letter to Lodge Owners - Expression of Interest: Supply of Accommodation
for the LHI Rodent Eradication Project Workforce in Winter 2017.
Lord Howe Island Board (2016b) Letter to Lodge Owners - Rodent Eradication Project – Information for
Lodge Owners.
Lord Howe Island Board (2016d) Human Health Risk Assessment - Scenario Descriptions.
Lord Howe Island Board (2016e) Lord Howe Island Rodent Eradication Project – Draft Public Environment
Report, Lord Howe Island Board, Lord Howe Island.
Lord Howe Island Tourism Association (2015) Lord Howe Island Destination Management Plan 2014-2017.
Maxwell, M. (2016) Letter re Invitation to Comment: Lord Howe Island Rodent Eradication Project EPBC REF
– 2006/7703, Director, Kentia Fresh Pty Ltd
Mazur, K. and Bennett, JU. (2009) Choice Modelling Survey of Community Attitudes to Improvements in
Environmental Quality in NSW Catchments, Environmental Economics Research Hub Research Reports,
Research Report No. 13
Morgan, G. and Simmons, G. (2014) Predator-Free Rakiura: An Economic Appraisal, the Morgan
Foundation.
NSW Government (2012) Guideline for the use of Cost Benefit Analysis in mining and coal seam gas
proposals.
NSW Government (2015) Guideline for the economic assessment of mining and coal seam gas proposals
NSW Treasury (2007) Treasury Guidelines for Economic Appraisal, Website: www.treasury.nsw.gov.au.
Pandit, R., Subroy, V., Garnett, S.T., Zander, K.K. and Pannell, D. (2015) A review of non-market valuation
studies of threatened species and ecological communities. Report to the National Environmental Science
Programme, Department of the Environment, Canberra. 18 December 2015.
Productivity Commission (2006) Waste Management, Productivity Commission Inquiry Report No. 38,
Commonwealth of Australia
Resource Assessment Commission (1992) Methods for Analysing Development and Conservation Issues: The
Resource Assessment Commission Experience, Research Paper Number 7.
Richardson, L. and Loomis, J. (2011) Total Economic Valuation of Threatened, Endangered and Rare
Species: An updated meta-analysis, Ecological Economics, 68, 1535-1548.
St Clair, J., Poncet, S., Sheehan, D., Szekely, T. and Hilton, G. (2011) Responses of an island endemic
invertebrate to rodent invasion and eradication, Animal Conservation 14, p. 66-73.
Toxicos (2010) Human Health Risk Assessment on the Use of Brodifacoum for the Lord Howe Island Rodent
Eradication Plan, prepared for the Lord Howe Island Board.
Young, M. (1992) Sustainable Investment and Resource Use: Equity, Environmental Integrity and Economic
Efficiency, Unesco, Paris and Parthenon Publishing Group.

Gillespie Economics 69
Gillespie Economics
8 Appendices
Appendix 1 - Measures of Economic Value
The economic values of market goods and services to the community are measured by consumers’ and
producers’ surplus. The conceptual framework for providing an understanding of consumers’ and
producers’ surplus is the supply and demand, or market, model. (Refer to Figure A1.1.)
$/unit Supply
Consumers’
Surplus
Market Price
Producers’
Surplus
Demand
Total Cost of
Production
Quantity Quantity/Yr
Figure A1.1 - Measures of Economic Value
The market supply curve (which comprises the summation of individual firm's supply curves) indicates the
costs of extra production i.e. the costs to society of producing an extra unit of a good or service. Firms aim
to operate on the upward sloping part of their marginal cost curve above the minimum average variable
cost, this upward slope reflecting diminishing returns to inputs, and hence that it costs more to produce
each additional unit of output28
. The area under the supply curve is the total cost of production (Edwards
1990).
The market demand curve (which comprises the summation of individual's demand curves) indicates the
maximum amount that consumers are willing to pay for incremental increases in the quantity of the good
or services. The demand curve is normally downward sloping because the more someone consumes of a
good, the less they are willing to pay for an extra unit of the good. This concept is generally known as
diminishing marginal utility. The area under the demand curve is the total willingness to pay for a good
(Edwards 1990).
28
Provided the marginal cost of producing an extra unit of output is less than the market price then it is still profitable to produce.

Gillespie Economics 70
Gillespie Economics
The interaction of demand and supply in a competitive market determines the price for a good and the
quantity that is produced and consumed in any given time period.
This market model provides the basis for identifying and estimating the net economic values to
consumers and the net economic values to producers, referred to as consumers’ surplus and producers’
surplus, respectively.
Consumers’ surplus is the difference between what an individual would be willing to pay (demand) for a
good or service (the total benefit to the consumer) and what they have to pay (the cost to the consumer
i.e. consumer expenditure or price times quantity) (Edwards 1990). In Figure A1.1 it is the area between
the demand curve and the market price.
Producers’ surplus is the difference between the revenue (consumer expenditure) received for a good or
service (total benefit to producer) and the costs (supply) of the inputs used in the provision of the good or
service (economic cost to producer) (Edwards 1990). In practical terms, it is the net revenue (before tax)
that is earned by producers of goods and services (James and Gillespie 2002). In Figure A1.1 it is the area
between the market price and the supply curve.
The market model presented in Figure A1.1 indicates the potential for the presence of both producers’
and consumers’ surpluses for market goods and services. However, the existence of consumer surplus for
market goods will depend on how responsive demand is to changes in its price. This is known as price
elasticity of demand. Where demand is perfectly elastic the demand curve is horizontal and there will be
no consumers’ surplus associated with the good. However, where demand is not perfectly elastic i.e. there
is some slope to the demand curve, then it will be relevant to measure both producers’ surplus and
consumers’ surplus.29
A key determinant of price elasticity of demand is the presence of close substitutes. Goods and services
with close substitutes have higher price elasticity of demand and hence lower levels of consumers’
surplus.
Even where goods and services are provided outside a market, the concepts of demand and supply can
still be conceptualised and provide the basis for modelling and estimating economic values. For
nonmarket use values, such as recreational fishing, swimming, snorkelling etc., and nonuse values such as
protection of biodiveristy, the concept of a demand curve exists as if it were a market good (Driml 1994).
The only difference is that the demand curve is not readily identifiable from market transactions and
therefore needs to be derived from observing consumer behaviour using nonmarket valuation methods.
These are listed in Table A1.1. For nonmarket use and nonuse values the relevant measure of net benefit is
consumers’ surplus only.
29
Elasticity is also a relevant concept for supply, with higher price elasticity of supply resulting in a smaller producer surplus.
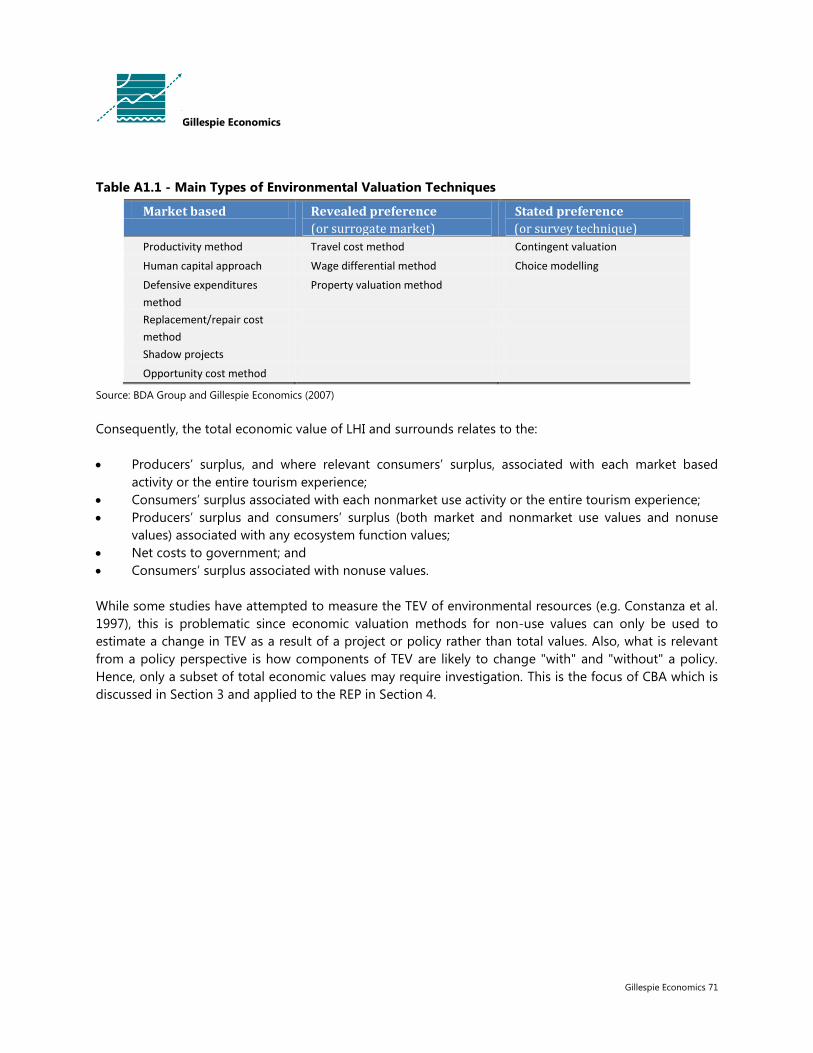
Gillespie Economics 71
Gillespie Economics
Table A1.1 - Main Types of Environmental Valuation Techniques
Market based Revealed preference
(or surrogate market)
Stated preference
(or survey technique)
Productivity method Travel cost method Contingent valuation
Human capital approach Wage differential method Choice modelling
Defensive expenditures
method
Property valuation method
Replacement/repair cost
method
Shadow projects
Opportunity cost method
Source: BDA Group and Gillespie Economics (2007)
Consequently, the total economic value of LHI and surrounds relates to the:
Producers’ surplus, and where relevant consumers’ surplus, associated with each market based
activity or the entire tourism experience;
Consumers’ surplus associated with each nonmarket use activity or the entire tourism experience;
Producers’ surplus and consumers’ surplus (both market and nonmarket use values and nonuse
values) associated with any ecosystem function values;
Net costs to government; and
Consumers’ surplus associated with nonuse values.
While some studies have attempted to measure the TEV of environmental resources (e.g. Constanza et al.
1997), this is problematic since economic valuation methods for non-use values can only be used to
estimate a change in TEV as a result of a project or policy rather than total values. Also, what is relevant
from a policy perspective is how components of TEV are likely to change "with" and "without" a policy.
Hence, only a subset of total economic values may require investigation. This is the focus of CBA which is
discussed in Section 3 and applied to the REP in Section 4.

Gillespie Economics 72
Gillespie Economics
Appendix 2 - Probability of Species Extinctions from the REP
Table A2.1 - Probability of Species Extinctions From the REP
Species Probability
description
Comment
Woodhen G Some woodhens have died from secondary Brodifacoum poisoning (control program)
on LHI and they have been shown to consume non toxic PestOff in trials.
Weka (a similar species in NZ) deaths from poisoning during eradications have been
recorded in the low to very high range but no local extinctions. There are some
recorded individual deaths of NZ Kiwis from poisoning during eradications but
generally no observable impacts.
With mitigation (captive management) in place, extinction is highly improbable. No
woodhen deaths or illness were recorded during the captive trial.
Woodhens have been bred extensively in captivity thereby further reducing
likelihood of extinction
Currawongs F No currawong deaths or illness from secondary Brodifacoum poisoning have been
recorded on the island. There are records of currawongs eating rodents but only a
small component of the diet for some individuals.
With mitigation (captive management) in place, extinction is very unlikely. No
currawong deaths or illness were recorded during the captive trial
No captive breeding known
Golden
Whistler
H Several NZ studies show no observable impacts from poisoning to similar (surrogate)
insectivorous species during eradications.
Silvereye G Several NZ studies show no observable impact from poisoning to NZ Silvereyes (a
similar species). Individual deaths from poisoning have been recorded during
eradications.
LHI Gecko G The Gecko is currently not considered endemic as it also occurs on Norfolk Island.
However there is some current genetic work underway that suggests the two island
populations are distinct species.
Some other studies of other species of geckoes during eradications have shown some
individual deaths but no extinctions
Balls Pyramid will not be baited so there is an insurance population
LHI Skink G The Skink is currently not considered endemic as it also occurs on Norfolk Island.
However there is some current genetic work underway that suggests the two island
populations are distinct species.
Some other studies of other species of skinks during eradications have shown some
individual skink deaths but no extinctions
Balls Pyramid will not be baited so there is an insurance population
LHI
woodfeeding
Cockroach
H Some evidence that other cockroach species consume baits but are not susceptible
to poisoning.
Balls Pyramid will not be baited so there is an insurance population

Gillespie Economics 73
Gillespie Economics
Table A2.2 - Risk Table
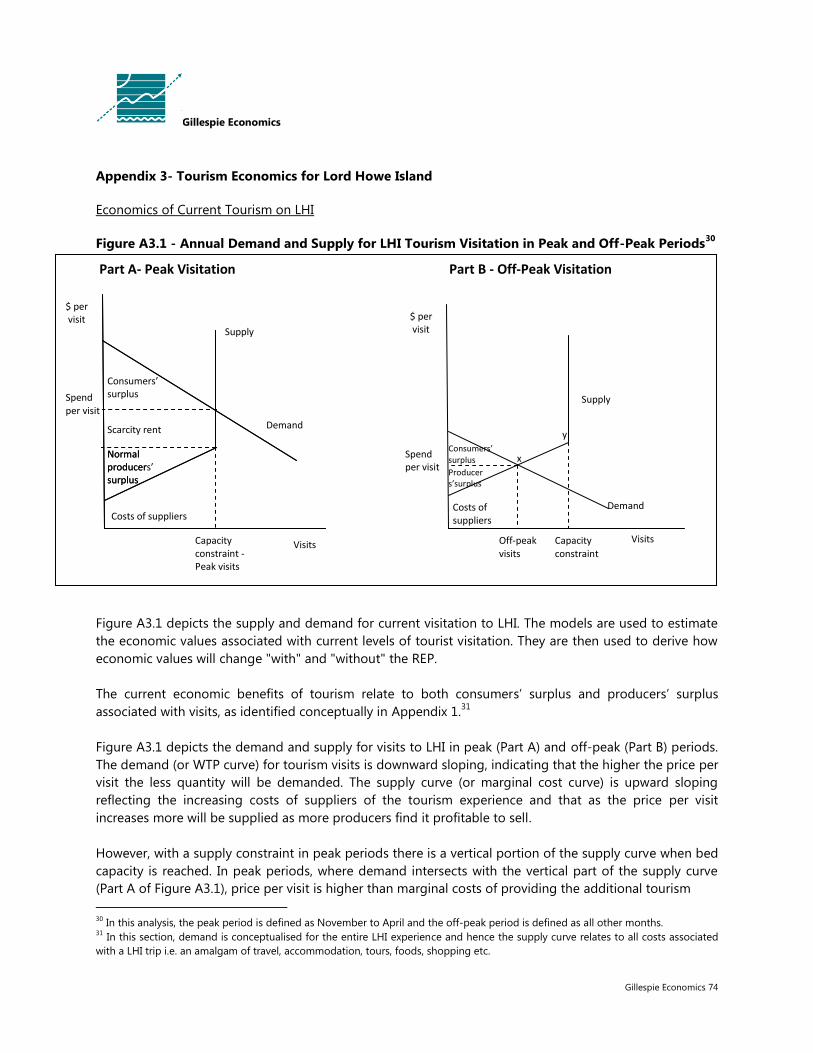
Gillespie Economics 74
Gillespie Economics
Appendix 3- Tourism Economics for Lord Howe Island
Economics of Current Tourism on LHI
Figure A3.1 - Annual Demand and Supply for LHI Tourism Visitation in Peak and Off-Peak Periods30
Figure A3.1 depicts the supply and demand for current visitation to LHI. The models are used to estimate
the economic values associated with current levels of tourist visitation. They are then used to derive how
economic values will change "with" and "without" the REP.
The current economic benefits of tourism relate to both consumers’ surplus and producers’ surplus
associated with visits, as identified conceptually in Appendix 1.31
Figure A3.1 depicts the demand and supply for visits to LHI in peak (Part A) and off-peak (Part B) periods.
The demand (or WTP curve) for tourism visits is downward sloping, indicating that the higher the price per
visit the less quantity will be demanded. The supply curve (or marginal cost curve) is upward sloping
reflecting the increasing costs of suppliers of the tourism experience and that as the price per visit
increases more will be supplied as more producers find it profitable to sell.
However, with a supply constraint in peak periods there is a vertical portion of the supply curve when bed
capacity is reached. In peak periods, where demand intersects with the vertical part of the supply curve
(Part A of Figure A3.1), price per visit is higher than marginal costs of providing the additional tourism
30
In this analysis, the peak period is defined as November to April and the off-peak period is defined as all other months. 31
In this section, demand is conceptualised for the entire LHI experience and hence the supply curve relates to all costs associated
with a LHI trip i.e. an amalgam of travel, accommodation, tours, foods, shopping etc.
Part A- Peak Visitation Part B - Off-Peak Visitation
$ per visit
Capacity constraint - Peak visits
Demand
Supply
Normal producer surplus
Scarcity rent
Costs of suppliers
Consumers’ surplus
Visits
Spend per visit
Demand
Supply
Visits Capacity constraint
Off-peak visits
Spend per visit
$ per visit
Consumers’ surplus
Producer s’surplus
Costs of suppliers
x
y
Normal producers’ surplus

Gillespie Economics 75
Gillespie Economics
experience. Hence, in addition to a normal producer surplus there is a scarcity rent (an extra producer
surplus that does not induce increased production). However, this scarcity rent only accrues to operations
that lack competition or have capacity constraints applied to it e.g. accommodation providers32
and
airlines. It is assumed that no scarcity rent accrues to tour operators as there are no capacity limits or
limits on new entrants and minimal costs of entry for new participants.33
The net benefit of visits in peak periods therefore comprises:
normal producer surplus to suppliers i.e. accommodation providers, tour operators, shops and
restaurants. This is estimated based on visitor expenditure on these items34
using a fixed ratio of
producer surplus to revenue for these sectors sourced from the National Input-Output Table35
.
scarcity rent that accrues from the provision of accommodation in peak periods. This is estimated by
the sum of the annual bed tax levied by LHIB i.e. $750 per bed per annum ($300,000 per annum in
total), and the annualised value that beds trade for in the market i.e. $7,000 per bed per annum based
on a trade value of $100,000 per bed and a discount rate of 7%36
.
consumer surplus to tourists. This is estimated on the basis of an assumed price elasticity of demand
of -0.8.37
Refer to Appendix 4 for more detail on the estimation process.
In off-peak periods, demand intersects with the supply curve to the left of the vertical section of the
supply curve and hence normal producer surplus is generated across all suppliers of the tourism
experience, that supply services during this time. A segment of higher cost suppliers represented by the
portion of the supply curve between x and y (in Figure A3.1) close down during this period. Normal
producer surplus is estimated in the same way as outlined above for peak periods.
On this basis, the current net economic benefits of tourism on LHI during peak periods is estimated at
$16,692,035 per annum, comprising:
normal producer surplus of $2,911,673:
$2,234,311 to accommodation
$252,395 to tours
32
The scarcity rent that accrues to accommodation providers in peak periods is implicitly recognised by the LHIB via its bed tax,
which is essentially a scarcity rent tax 33
It should be noted that some scarcity rent may potentially accrue to tour operators to the extent that the restriction on the
number of Island residents provides a de facto restriction on competition in the tour operator market. 34
This is based on annual average tourist expenditure on the Island of $27M with accommodation share of expenditure adjusted
upwards in peak periods and downwards in off-peak periods based on the relationship between peak and off-peak rates for
accommodation published on the LHI website. 35
Gross operating surplus in the National Input-Output Table has been used as a proxy for producer surplus. 36
Tourism expenditure information was based on expenditure on the Island and so excluded expenditure on airfares. Also, no
information was available on potential scarcity rent accruing to airlines. Consequently, the producer surplus and scarcity rent
accruing to the airline was excluded from the analysis. This has the effect of understating the benefits of tourism and the REP and
the short term costs of the REP. 37
Price elasticity of demand would be expected to be less than 1 given the uniqueness of LHI and the limited substitutes. In addition,
studies (e.g. Crouch (1994) suggest an average price elasticity of demand for international tourism (which is likely to be a better
indicator for LHI than domestic tourism) of around -0.6 to -0.8.
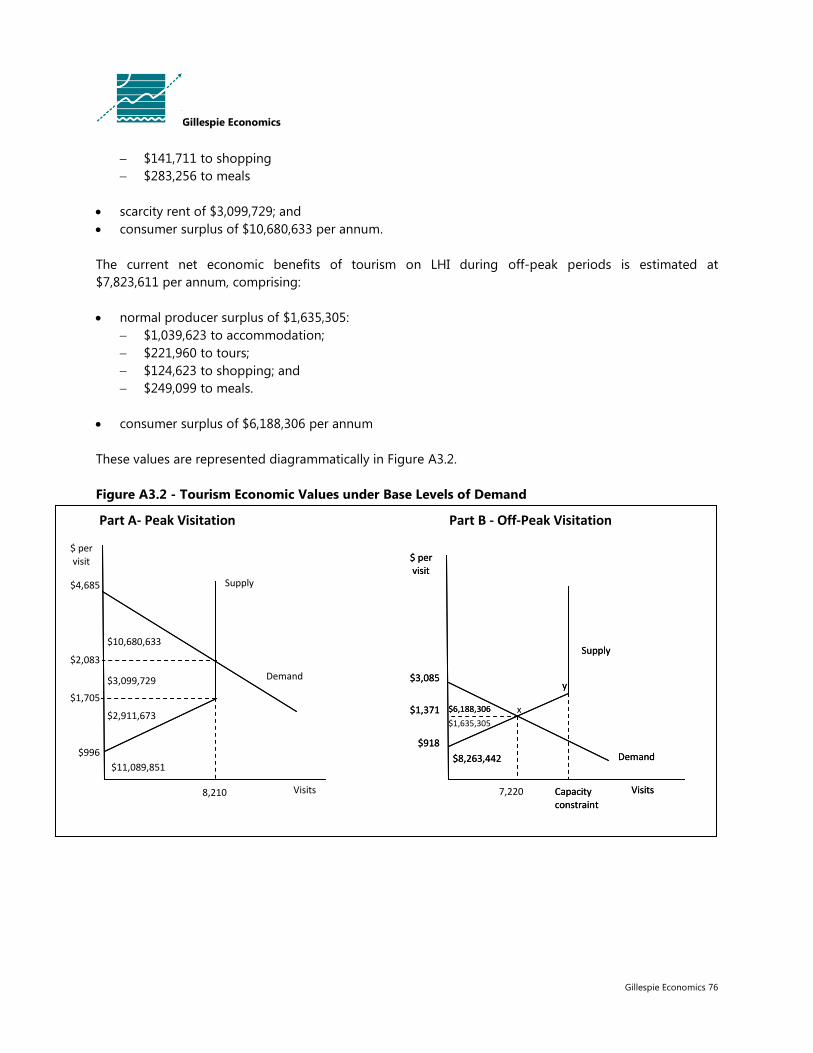
Gillespie Economics 76
Gillespie Economics
$141,711 to shopping
$283,256 to meals
scarcity rent of $3,099,729; and
consumer surplus of $10,680,633 per annum.
The current net economic benefits of tourism on LHI during off-peak periods is estimated at
$7,823,611 per annum, comprising:
normal producer surplus of $1,635,305:
$1,039,623 to accommodation;
$221,960 to tours;
$124,623 to shopping; and
$249,099 to meals.
consumer surplus of $6,188,306 per annum
These values are represented diagrammatically in Figure A3.2.
Figure A3.2 - Tourism Economic Values under Base Levels of Demand
Part A- Peak Visitation Part B - Off-Peak Visitation
7,220
$1,635,305
x $2,911,673
8,210
$ per visit
$3,099,729
$996
$11,089,851
$2,083
$4,685
$1,705
Demand
Supply
Visits
$10,680,633
$6,188,306
Supply
$ per visit
Visits Capacity constraint
Demand $8,263,442
y
$1,371
$3,085
$918
$6,188,306
Supply
$ per visit
Visits Capacity constraint
Demand $8,263,442
y
$1,371
$3,085
$918
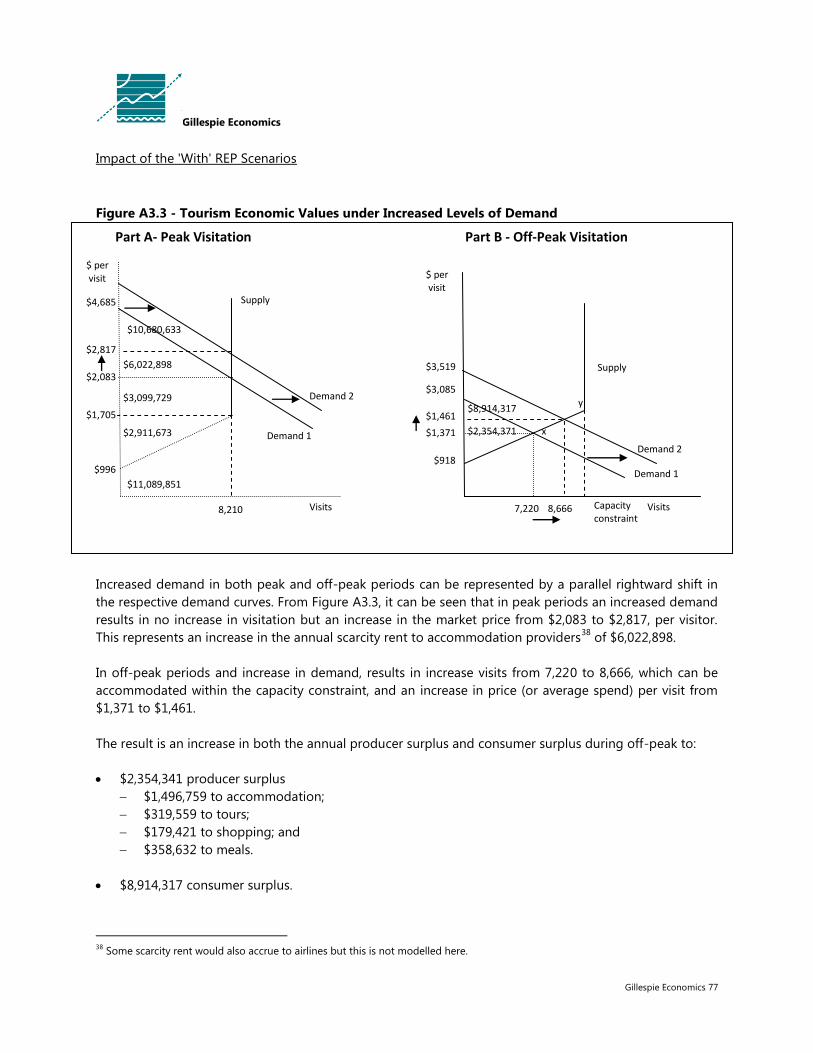
Gillespie Economics 77
Gillespie Economics
Impact of the 'With' REP Scenarios
Figure A3.3 - Tourism Economic Values under Increased Levels of Demand
An increase in demand in both peak and off-peak periods can be represented by a parallel rightward shift
in the respective demand curves. In the peak period
Note: Figure is not to scale.
Increased demand in both peak and off-peak periods can be represented by a parallel rightward shift in
the respective demand curves. From Figure A3.3, it can be seen that in peak periods an increased demand
results in no increase in visitation but an increase in the market price from $2,083 to $2,817, per visitor.
This represents an increase in the annual scarcity rent to accommodation providers38
of $6,022,898.
In off-peak periods and increase in demand, results in increase visits from 7,220 to 8,666, which can be
accommodated within the capacity constraint, and an increase in price (or average spend) per visit from
$1,371 to $1,461.
The result is an increase in both the annual producer surplus and consumer surplus during off-peak to:
$2,354,341 producer surplus
$1,496,759 to accommodation;
$319,559 to tours;
$179,421 to shopping; and
$358,632 to meals.
$8,914,317 consumer surplus.
38
Some scarcity rent would also accrue to airlines but this is not modelled here.
Part A- Peak Visitation Part B - Off-Peak Visitation
$2,911,673
8,210
$ per visit
$3,099,729
$996
$11,089,851
$2,083
$4,685
$1,705
Demand 1
Supply
Visits
$10,680,633
Demand 2
$2,817
$6,022,898 Supply
$1,371
$3,085
$918
$ per visit
y
Visits Capacity constraint
Demand 1
7,220
$3,519
Demand 2
8,666
$1,461
x
$8,914,317
$2,354,371

Gillespie Economics 78
Gillespie Economics
The additional benefits are:
$719,066 producer surplus
$457,136 to accommodation;
$97,599 to tours;
$54,798 to shopping; and
$109,532 to meals.
$2,726,012 consumer surplus.

Gillespie Economics 79
Gillespie Economics
Appendix 4 - Estimation of Demand and Supply Curves for LHI Tourism
Tourism data suggest approximately $27M in annual tourist expenditure on the Island, comprising
expenditure on accommodation, tour operators, meals and shopping.
Based on monthly visit estimates and an average spend per visit, average tourism expenditure was
allocated across each month. This monthly expenditure was broken down by accommodation, tour
operators, meals and shopping based on the LHI Visitor Experience data. In recognition that
accommodation is more expensive in peak periods than non-peak periods, accommodation expenditure
was adjusted upwards in peak periods and downwards in off-peak periods based on the relationship
between peak and off-peak rates for accommodation published on the LHI website.
The result was $17M of expenditure for the 8,210 visits in peak periods at an average spend of $2,083 per
visit. For off-peak visitation the result was $10M of expenditure for the 7,220 visits at an average spend of
$1,371 per visit.
The price per visit and quantity of visits for peak and off-peak periods was therefore identified and a linear
demand curve with a price elasticity of -0.839
was fitted through this equilibrium point.
The scarcity rent that accrues from the provision of accommodation in peak periods was estimated by the
sum of the annual bed tax levied by LHIB i.e. $750 per bed per annum and $300,000 per annum in total,
and the annualised value that beds trade for in the market i.e. $7,000 per bed per annum based on a trade
value of $100,000 per bed and a discount rate of 7%40
.
Normal producer surplus to suppliers i.e. accommodation providers, tour operators, shops and restaurants
was estimated based on visitor expenditure on these items using a fixed ratio of producer surplus to
revenue for these sectors sourced from the National Input-Output Table41
.
A linear supply curve that generated the estimated level of producer surplus was then fitted through the
equilibrium point for the off-peak period.
For the peak period, a linear supply curve that generated the estimated level of normal producer surplus
was fitted through the appropriate point on the vertical part of the supply curve i.e. the average spend per
visit less spend per visit attributable to the scarcity rent.
To estimate the impact of changes in demand on normal producer surplus, scarcity rent and consumer
surplus, the demand curves were shifted horizontally by changing the demand curve constant so that the
39
Price elasticity of demand would be expected to be less than 1 given the uniqueness of LHI and limited substitutes. In addition,
studies (e.g. Crouch (1994) suggest an average price elasticity of demand for international tourism (which is likely to be a better
indicator for LHI than domestic tourism) of around -0.6 to -0.8. 40
Tourism expenditure information was based on expenditure on the Island and so excluded expenditure on airfares. Also, no
information was available on potential scarcity rent accruing to airlines. Consequently, the producer surplus and scarcity rent
accruing to the airline was excluded from the analysis. This has the effect of understating the benefits of tourism and the REP and
the short term costs of the REP. 41
Gross operating surplus in the National Input-Output Table has been used as a proxy for producer surplus.
Gillespie Economics 80
Gillespie Economics
new equilibrium number of visits (for the off-peak period this was the equilibrium if the visitor restriction
did not apply) resulted in the appropriate percentage increase or decrease in visitors.
The new area of producers surplus, scarcity rent and consumer surplus were them measured and
compared to the values under the "without" REP scenario.