economic evaluation manual - nz transport agency
TRANSCRIPT

Economic evaluation manual (volume 2)
© NZ Transport Agency
www.nzta.govt.nz
First edition, Amendment 0
Effective from January 2010
ISBN 978-0-478-35259-7 (print)
ISBN 978-0-478-35258-0 (online)

Copyright information
This publication is copyright © NZ Transport Agency. Material in it may be reproduced for personal or in-house use without formal permission or charge, provided suitable acknowledgement is made to this publication and the NZ Transport Agency (NZTA) as the source. Requests and enquiries about the reproduction of material in this publication for any other purpose should be made to: NZ Transport Agency Private Bag 6995 Wellington 6141
The permission to reproduce material in this publication does not extend to any material for which the copyright is identified as being held by a third party. Authorisation to reproduce material belonging to a third party must be obtained from the copyright holder(s) concerned.
Disclaimer
This manual is intended to provide guidance and processes to assist approved organisations under the Land Transport Management Act 2003 (LTMA) obtain the best value for money spent and to provide procedures for the economic evaluation of land transport activities. Accordingly, the NZTA disclaims any responsibility when these procedures are used for applications in other sectors. All reasonable measures have been taken to ensure the quality and accuracy of that information.
However, the NZTA may change, delete, add to or otherwise amend information contained in this manual. While the NZTA has taken care to provide accurate information, this manual is a general guide and is not a substitute for expert advice applicable to specific situations. Where there is a specific query concerning any of the processes or obligations contained in the LTMA, independent professional advice should be sought. This manual has been prepared carefully and in good faith, but the NZTA is not liable for any errors, costs or losses arising from use of this manual or the information contained within this manual.
More information
Published 2010 ISBN 978-0-478-35259-7 (print) ISBN 978-0-478-35258-0 (online)
If you have further queries, call our contact centre on 0800 699 000 or write to us: NZ Transport Agency Private Bag 6995 Wellington 6141
This document is available on the NZTA’s website at www.nzta.govt.nz.

Page i
The NZ Transport Agency’s Economic evaluation manual (volume 2) First edition, Amendment 0 Effective from January 2010
Document management plan
1) Purpose
This management plan outlines the updating procedures and contact points for the document.
2) Document information
Document name The NZ Transport Agency’s Economic evaluation manual (volume 2).
Document availability This document is located in electronic form on the NZ Transport Agency’s website at www.nzta.govt.nz.
Document owner Investment & Revenue Strategy
Document sponsor National Manager, Investment & Revenue Strategy
3) Amendments and review strategy
All corrective action/improvement requests (CAIRs) suggesting changes will be acknowledged by the document owner.
Comments Frequency
Amendments (minor revisions)
Updates incorporated immediately they occur. As required.
Review (major revisions)
Amendments fundamentally changing the content or structure of the document will be incorporated as soon as practicable. They may require coordinating with the review team timetable.
At least annually.
Notification All users that have registered their interest by email to [email protected] will be advised by email of amendments and updates.
Immediately.
4) Other information (at document owner’s discretion)
There will be occasions, depending on the subject matter, when amendments will need to be worked through by the review team before the amendment is actioned. This may cause some variations to the above noted time frames.
5) Distribution of this management plan
Copies of this manual management plan are to be included in the NZ Transport Agency intranet at the next opportunity and sent to: [email protected].

Page ii
The NZ Transport Agency’s Economic evaluation manual (volume 2) First edition, Amendment 0 Effective from January 2010
Record of amendment
Amendment number
Description of change Effective date Updated by

Page iii
The NZ Transport Agency’s Economic evaluation manual (volume 2) First edition, Amendment 0 Effective from January 2010
Foreword
A significant function for the NZ Transport Agency (NZTA) is the investment of resources from the National Land Transport Fund to activities proposed by approved organisations, eg regional councils or territorial authorities, and the agency itself. These activities are assessed and prioritised through the NZTA investment and revenue strategy for inclusion in the National Land Transport Programme.
The procedures described in this manual have been developed to assist approved organisations evaluate the economic efficiency of activities for which they seek funding from the NZTA, within the value for money framework of the NZTA’s overall investment and revenue strategy.
The development of evaluation procedures is an ongoing process. The NZTA will revise the economic evaluation procedures in this manual in the light of research and information from across the sector in order to continually improve the procedures to meet the above objectives. The NZTA welcomes suggestions from approved organisations and others for further improvements.
The procedures in this manual have been developed pursuant to the Land Transport Management Act 2003. The NZTA’s primary objective is to undertake its functions in a way that contributes to an affordable, integrated, safe, responsive and sustainable land transport system. In meeting this objective, the NZTA must exhibit a sense of social and environmental responsibility in a manner that seeks value for money.
The NZTA would like to thank all those who have contributed to the development of the procedures in this manual.
Geoff Dangerfield Chief Executive


Page v
The NZ Transport Agency’s Economic evaluation manual (volume 2) First edition, Amendment 0 Effective from January 2010
Content
Document management plan i
Record of amendment ii
Foreword iii
1.0 Introduction 1–1
2.0 Transport demand management strategies and programmes 2–1
2.1 Overview 2–1
2.2 Strategies providing improved transport options 2–2
2.3 Pricing strategies 2–7
2.4 Parking and land use management strategies 2–9
2.5 TDM programmes 2–11
3.0 Evaluation of transport demand management activities 3–1
3.1 Overview 3–1
3.2 Method of evaluation 3–2
3.3 Impacts considered 3–4
3.4 Stages of analysis 3–7
3.5 Do-minimum 3–8
3.6 Travel impacts 3–9
3.7 Cost of transport demand management programmes 3–10
3.8 Benefits of transport demand management programmes 3–12
3.9 Period of analysis 3–20
3.10 Cost benefit analysis 3–21
3.11 Incremental analysis 3–22
3.12 Sensitivity analysis 3–23
3.13 Monitoring 3–24
3.14 Selecting the appropriate evaluation method 3–25
3.15 References 3–26
4.0 Demand estimates and modal share 4–1
4.1 Overview 4–1
4.2 Demand estimates 4–2
4.3 Forecasting the demand 4–4
continued

Page vi
The NZ Transport Agency’s Economic evaluation manual (volume 2) First edition, Amendment 0 Effective from January 2010
4.4 Sensitivity testing of the demand estimates 4–6
4.5 Reporting of estimates 4–7
4.6 References 4–9
5.0 Evaluation of transport services 5–1
5.1 Overview 5–1
5.2 Method of evaluation 5–2
5.3 Impacts considered 5–3
5.4 Stages in analysis 5–4
5.5 Do-minimum 5–5
5.6 Benefits and costs 5–6
5.7 Period of analysis 5–7
5.8 Cost benefit analysis 5–8
5.9 Alternatives and options 5–10
5.10 Sensitivity analysis 5–11
5.11 Additional information required if simplified procedures are used 5–12
6.0 Funding gap analysis of transport services 6–1
6.1 Overview 6–1
6.2 Service provider costs 6–2
6.3 Service provider revenue 6–5
6.4 Cash flow analysis 6–6
6.5 Funding gap 6–7
6.6 Sensitivity testing of the funding gap 6–9
7.0 Benefits and costs of transport services 7-1
7.1 Overview 7-1
7.2 Transport service user benefits 7-3
7.3 Road traffic reduction benefits 7-14
7.4 Accident cost savings 7-18
7.5 Disbenefits during implementation/construction 7-21
7.6 Other benefits and national strategic factors 7-22
7.7 Costs to government 7-23
7.8 Present value of benefits and costs 7-25
7.9 Reporting of benefits and costs 7-28
continued

Page vii
The NZ Transport Agency’s Economic evaluation manual (volume 2) First edition, Amendment 0 Effective from January 2010
7.10 Feasibility evaluation of freight transport proposals 7-29
7.11 References 7-32
8.0 Evaluation of walking and cycling 8-1
8.1 Overview 8-1
8.2 Method of evaluation 8-3
8.3 Stages in analysis 8-4
8.4 Travel impacts 8-5
8.5 Do-minimum 8-7
8.6 Benefits – general 8-8
8.7 Facility user benefits 8-9
8.8 Disbenefits during implementation/construction 8-12
8.9 Other benefits and national strategic factors 8-13
8.10 Costs 8-14
8.11 Period of analysis 8-15
8.12 Cost benefit analysis 8-16
8.13 Alternatives and options 8-17
8.14 Sensitivity analysis 8-18
8.15 Cycle demand analysis 8-19
8.16 References 8-22
9.0 Evaluation of education, promotion and marketing 9-1
9.1 Overview 9-1
9.2 Travel impacts 9-2
9.3 Costs 9-5
9.4 Benefits 9-6
9.5 Period of analysis 9-8
9.6 Cost benefit analysis 9-9
9.7 References 9-11
10.0 Evaluation of parking and land use 10-1
10.1 Overview 10-1
10.2 Travel impacts 10-2
10.3 Business impacts 10-3
10.4 Equity impacts 10-4
10.5 Costs 10-5
continued

Page viii
The NZ Transport Agency’s Economic evaluation manual (volume 2) First edition, Amendment 0 Effective from January 2010
10.6 Benefits 10-6
10.7 References 10-8
11.0 Evaluation of private sector financing and road tolling 11-1
11.1 Overview 11-1
11.2 Method of evaluation 11-2
11.3 Stages of analysis 11-4
11.4 Do-minimum 11-5
11.5 Travel impacts 11-6
11.6 Costs 11-7
11.7 Benefits 11-8
11.8 Period of analysis 11-10
11.9 Financial evaluation 11-11
11.10 Cost benefit analysis 11-13
11.11 Alternatives and options 11-15
11.12 Sensitivity and risk analysis 11-16
11.13 References 11-17
12.0 Risk analysis 12-1
12.1 Overview 12-1
12.2 Benefit risks 12-2
12.3 Cost risks 12-5
13.0 Simplified procedures 13-1
13.1 Overview 13-1
SP8 Freight transport services SP8–1
SP9 New passenger transport services SP9–1
SP10 Existing passenger transport services SP10–1
SP11 Walking and cycling facilities SP11–1
SP12 Travel behaviour change SP12–1
A15 Travel demand elasticities A15–1
A15.1 Introduction A15–1
A15.2 References A15–3

Page 1–1
The NZ Transport Agency’s Economic evaluation manual (volume 2) First edition, Amendment 0 Effective from January 2010
1.0 Introduction
Description This volume, volume 2 of the NZ Transport Agency’s (NZTA) Economic evaluation manual, covers economic efficiency evaluation of demand management and transport services activities for land transport including:
freight transport services new and improved passenger transport services walking and cycling travel behaviour change parking and land use pricing and financial incentives.
The procedures in this volume are broadly similar to the procedures the NZTA uses to evaluate road infrastructure activities, which are presented in the NZTA’s Economic evaluation manual volume 1 (EEM1).
Chapter 2 of this volume describes the various types of transport demand management strategies and programmes.
Chapter 3 describes the basis for evaluating transport demand management activities.
Chapter 4 describes methods for estimating how various types of changes to transport systems affect travel behaviour.
Chapters 5, 6 and 7 provide detailed methodology for transport services evaluations.
Chapter 8 provides evaluation methods for walking and cycling.
Chapter 9 provides evaluation methods for education, promotion and marketing.
Chapter 10 provides evaluation methods for parking and land use activities.
Chapter 11 provides evaluation methods for activities involving private sector financing and road tolling.
Chapter 12 provides guidance on risk analysis.
Chapter 13 provides simplified procedures.
Reference to EEM1 Basic concepts of economic evaluation and the specific procedures required by the NZTA defined in EEM1 are not repeated in this volume. The evaluator should refer to EEM1 for these aspects.
Input to the NZTA’s allocation process
The numerical cost benefit analysis and guidance on assessment, quantification and reporting of non-monetised impacts covered by this manual is designed to be an input to the economic efficiency assessment factor used by the NZTA in its funding allocation process.
The guidance on monetised and non-monetised impacts, business benefits and equity impacts provided in the manual can also be an input to the effectiveness assessment factor of the allocation process.

Page 1–2
The NZ Transport Agency’s Economic evaluation manual (volume 2) First edition, Amendment 0 Effective from January 2010
1.0 Introduction continued
Simplified procedures The following simplified procedures are provided to simplify the evaluation of freight and passenger transport, walking, cycling and travel behaviour change (TBhC) activities (see chapter 13 of this volume):
SP8 – Freight transport services. SP9 – New passenger transport services. SP10 – Existing passenger transport services. SP11 – Walking and cycling facilities. SP12 – Travel behaviour change.

Page 2–1
The NZ Transport Agency’s Economic evaluation manual (volume 2) First edition, Amendment 0 Effective from January 2010
2.0 Transport demand management strategies and programmes
2.1 Overview
2.1 Overview 2–1
2.2 Strategies providing improved transport options 2–2
2.3 Pricing strategies 2–7
2.4 Parking and land use management strategies 2–9
2.5 TDM programmes 2–11
Introduction Transport demand management (TDM), includes various strategies that encourage more efficient and sustainable travel and transport behaviour. TDM has the objective of encouraging motor vehicle users to use alternative, more sustainable, means of transport when appropriate, while also reducing total vehicle kilometres travelled. TDM is an increasingly common response to urban traffic congestion and pollution issues, and to reduce general issues associated with vehicle dependency.
TDM strategies are briefly described in the first three sections of this chapter.
Typically, individual strategies only affect a small portion of total travel but their cumulative impacts can be significant when implemented as a package of complementary measures. Typical TDM packages are described in the last section of the chapter.
Acknowledgement The principle source of information for this chapter is the Victoria Transport Policy Institute’s Online TDM encyclopaedia (www.vtpi.org/tdm/index.php). The encyclopaedia provides further information, including references and case studies, on the various strategies and programmes and how they can be implemented.
In this chapter Section Page

Page 2–2
The NZ Transport Agency’s Economic evaluation manual (volume 2) First edition, Amendment 0 Effective from January 2010
2.2 Strategies providing improved transport options
Introduction TDM strategies that provide improved transport options include those that increase the number and quality of types of travel. Typical strategies are briefly described in the following sections.
Alternative work schedules
Examples of alternative work schedules (also called variable work hours):
Flexitime allows employees some flexibility in their daily work schedules. For example, rather than all employees working 8:00am to 5:00pm, some might work 7:30am to 4:30pm and others 9:00am to 6:00pm.
Compressed work week (CWW) is when employees work fewer but longer days, such as four 10–hour days each week (4/40), or nine-hour days with one day off every two weeks (9/80).
Staggered shifts are used to reduce the number of employees arriving and leaving a worksite at one time. For example, some shifts may be 8:00am to 5:00pm, others 8:30am to 5:30pm and others 9:00am to 6:00pm. This has a similar effect on traffic as flexitime, but does not give individual employees as much control over their schedules.
Car sharing Car sharing refers to car rental services intended to substitute for private vehicle ownership. Car sharing is common in Europe and is being developed in some Australian and North American cities. It is considered a cost effective alternative to owning a vehicle driven less than about 10,000 kilometres per year. There are typically eight to 15 members per vehicle. Some small businesses use car sharing. It makes occasional use of a vehicle affordable, even for low income households, while providing an incentive to minimize driving and rely on alternative travel options as much as possible.
Cycle infrastructure improvements
Cycle transport is effective at meeting sustainable transport goals. There are many specific ways to improve and encouraging cycling, including:
roadway improvements cycle lanes and paths (particularly if they provide a shortcut or allow cyclists to
avoid heavy traffic) secure and weather protected cycle parking shower facilities at workplaces.

Page 2–3
The NZ Transport Agency’s Economic evaluation manual (volume 2) First edition, Amendment 0 Effective from January 2010
2.2 Strategies providing improved transport options continued
Cycle and walking promotion
This includes a variety of measures and activities that support and promote cycling and walking, such as:
cycling and walking events and activities, particularly on trails and cycling routes
cycling and walking commute campaigns. These could involve contests as to which workers and worksites commutes most by non-motorised modes
education programmes that teach cycling skills cycling maps showing recommended cycling routes and facilities, roadway
conditions (shoulders, traffic volumes, special barriers to cycling, etc) hills, recreational facilities, and other information helpful to cyclists
cycles provided by employers and community organizations to rent or loan reimbursement of employee cycling expenses programmes to encourage provision of secure parking, showers and other
cycling-related facilities at workplaces programmes to encourage use of cycles for deliveries and other commercial
uses tourist promotion materials highlighting cycling and walking.
Cycle/passenger transport integration
Cycling and passenger transport are complementary modes. Cycling is ideal for relatively short (less than five kilometres) trips with multiple stops on lower traffic roads, while passenger transport is most effective when travelling longer distances along busy corridors. Coordination can be enhanced by cycle racks and storage lockers near passenger transport stops, racks for carrying cycles on buses and pool vans, and cycle routes to passenger transport stops.
Guaranteed ride home
Guaranteed ride home provide an occasional subsidised ride home to commuters who use alternative modes. For example, guaranteed ride home may provide a taxi ride or use of a company car if an employee must return home in an emergency or stay at work later than expected. This addresses a common objection to the use of alternative modes.
High occupancy vehicle priority
High occupancy vehicles (HOV) include buses, minibuses, and cars with two, three, four or more passengers depending on the scheme. HOV facilities include dedicated traffic lanes and queue-jumping lanes at highway on-ramps. Recent innovation in traffic light controls allows buses to receive preferential treatment in urban arterial traffic. HOV priority measures are efficient use of road space, an incentive for mode shift, and a way to minimise private vehicle traffic while providing access to areas of intense activity, such as shopping districts and employment centres. HOV facility use depends on its specific location and how well it integrates with other public transport and rideshare promotion efforts. In general, HOV facilities are considered most effective in attracting additional HOV users where they save more than 10 minutes per trip.

Page 2–4
The NZ Transport Agency’s Economic evaluation manual (volume 2) First edition, Amendment 0 Effective from January 2010
2.2 Strategies providing improved transport options continued
Non-motorised transport
Non-motorised transport (also known as active transport and human powered transport) includes walking, cycles, skates, skateboards, scooters and wheelchair use. These modes provide both recreation (they are an end in themselves) and transport (they provide access to goods and activities), although users may consider a particular trip to serve both. For example, some people will choose to walk or cycle rather than drive because they enjoy the activity, although it takes longer. There are many specific ways to improve non-motorised transportation, such as:
improved footpaths, crosswalks, paths and bike lanes correcting specific roadway hazards to non-motorized transport improved road, path and footpath maintenance universal design (transport systems that accommodate people with disabilities
and other special needs) develop pedestrian oriented land use and building design street furniture (eg benches) and design features (eg human-scale street
lights) traffic calming, speed reductions and vehicle restrictions safety education, law enforcement and encouragement activities bike/public transport integration and public transport oriented development cycle parking addressing security concerns of pedestrians and cyclists.
Park and ride facilities Park and ride facilities allow suburban commuters to leave their vehicle while ridesharing or taking public transport. Their effectiveness depends significantly on TDM goals. Car ‘park and ride’ use reduces urban traffic congestion and downtown parking demand, but provides only minor reductions in air pollution andenergy consumption since a major portion of car emissions occur during the first few kilometres that a vehicle is driven. In some circumstances, park and ride facilities may encourage urban sprawl by reducing the cost of long distance commutes.
Passenger transport service improvements
There are many potential ways to improve passenger transport, including additional routes, bus lanes, park and ride facilities, increased service frequency, express bus service, shuttle services, reduced fares, improved information, more bus pullouts and shelters, and various comfort improvements. Each of these can have a role in encouraging a shift from car to public transport. Various new public transport fare payment methods allow faster boarding and eliminate barriers, particularly the need to have exact change.
Pedestrian infrastructure improvements
Many strategies can help create a more pedestrian friendly environment, including better footpaths, crosswalks, and other street design features that accommodate pedestrians, and traffic calming strategies to reduce traffic speeds and volumes.

Page 2–5
The NZ Transport Agency’s Economic evaluation manual (volume 2) First edition, Amendment 0 Effective from January 2010
2.2 Strategies providing improved transport options continued
Personal security Fear of assault, theft and vandalism can discourage walking, cycling and public transport travel. These problems can be addressed through various measures and design strategies such as neighbourhood watch and community policing programmes, special police patrols (including police on foot and cycles), pedestrian escorts, and monitoring of pedestrian, cycle, public transport and park and ride facilities. Public transport agencies can implement special programmes to increase rider security.
Ridesharing Ridesharing includes carpooling, vanpooling and subscription express bus. Rideshare programmes typically provide car and vanpool matching, and vanpool sponsorship. They may be managed at the firm, site or regional level.
Shuttle services Shuttle services include a variety of transport services that use small buses or vans to provide public mobility. They are a type of public transport.
Circulating shuttles carry passengers for short trips along busy corridors, including business districts, employment and education campuses, and parks or recreation areas.
Demand responsive para-transit includes various types of flexible route transport service using small buses, vans or shared taxis.
Special mobility services to provide mobility to people with disabilities. Mobility to work programmes, often involving special reverse – commute
shuttle services between low-income neighbourhoods and suburban employment centres.
Taxi service improvements
Taxi refers to for hire car travel supplied by private companies. Taxi service can be an important backup option for other alternative forms of public transport, such as allowing pedestrians to carry large loads back from a store, providing an emergency ride home (when a cyclist has a mechanical problem), or carrying non-drivers to destinations not served by public transport. Taxi service can be improved by:
increasing the quality of taxi vehicles (comfort, carrying capacity, reliability, safety), improving support services (such as radio dispatch), driver skill and courtesy
improved taxi vehicles, including accommodating people in wheelchairs and/ or with large packages
allowing shared taxi trips (more than one passenger) providing taxi stands in appropriate positions, curb access and direct telephone
lines.

Page 2–6
The NZ Transport Agency’s Economic evaluation manual (volume 2) First edition, Amendment 0 Effective from January 2010
2.2 Strategies providing improved transport options continued
Telework Telework includes various activities that substitute telecommunications (telephone, fax, email, websites, video connections, etc) for physical travel:
Telecommuting refers to employees who work from home or another location (such as a neighbourhood telework office) in order to reduce commute travel.
Distance learning refers to use of telecommunications by teachers and students as a substitute for physical meetings.
Teleshopping (internet shopping) refers to use of telecommunications to facilitate retail purchases and avoid physical visits to a store.
Telebanking (internet banking) refers to use of telecommunications to perform banking and bill payment transactions.
Electronic government (e-government) refers to use of telecommunications by government agencies to provide services that would otherwise require visiting a government office.
Internet business to business (B2B) refers to internet interactions between businesses, such as bidding, sales and planning.
Traffic calming Traffic calming includes a variety of roadway design features that reduce vehicle traffic speeds and volumes. Traffic calming activities can range from minor modifications of an individual street to comprehensive redesign of a road network. Traffic calming is becoming increasingly accepted by transport professional organisations and urban planners to provide a more liveable environment more conducive to walking and cycling.

Page 2–7
The NZ Transport Agency’s Economic evaluation manual (volume 2) First edition, Amendment 0 Effective from January 2010
2.3 Pricing strategies
Introduction Pricing involves various transport price adjustments to encourage more efficient travel patterns.
Commuter financial incentives
Commuter financial incentives include several types of incentives that encourage alternative commute modes:
Parking cash out means that commuters who are offered subsidised parking are also offered the cash equivalent if they use alternative travel modes.
Travel allowances are a financial payment provided to employees instead of parking subsidies. Commuters can use this money to pay for parking or for another travel mode.
Public transport and rideshare benefits are free or discounted public transport fares provided to employees.
Reduced employee parking subsidies means that commuters who drive must pay some or all of their parking costs (parking pricing).
Company travel reimbursement policies that reimburse cycle or public transport mileage for business trips when these modes are comparable in speed to driving, rather than only reimbursing automobile mileage.
Improved transport charging mechanisms
A variety of methods can be used to collect transport charges. They differ significantly in terms of their costs (fee collection typically absorbs 10 – 30 percent of total revenues), convenience, and price adjustability (prices that can vary by time, location, vehicle type or other factors).
Consumers generally prefer pricing techniques that are easy to understand, convenient and quick to use, accept a variety of denominations (coins, bills, credit cards and prepaid vouchers), and allows them to pay for just the amount of vehicle travel or parking they use. Many of the concerns and objections to pricing relate to the methods used to collect fees.
Road tolls Tolls are a common way to fund and bring forward road infrastructure improvements. Such tolls are a fee for service, with revenues used to offset activity costs. This is considered more equitable and economically efficient than other roadway improvement funding options, which cause non-users to help pay for improvements. Tolling is often proposed in conjunction with private sector involvement (ie road facilities built by private companies and funded by tolls). Tolls are usually set to maximize revenues with success measured in terms of cost recovery.
In New Zealand, road tolling is allowed for new roads, part of a new road or an existing road or part of an existing road that is physically or operationally integral to the new road, and where there is available to road users a feasible, untolled, alternative route. The tolling revenue can only be applied to the new road or part of it. A demand management plan may be required for any proposed road tolling scheme. See sections 46 and 48 of the Land Transport Management Act 2003 (LTMA).
Road tolling under the current New Zealand provisions is unlikely to have major overall TDM effects because it can only be applied to an activity that will increase road capacity and, therefore, encourage private vehicle use, rather than discourage it. Road tolling can have equity impacts because the road facility is only made available to those road users that can afford to pay.

Page 2–8
The NZ Transport Agency’s Economic evaluation manual (volume 2) First edition, Amendment 0 Effective from January 2010
2.3 Pricing strategies continued
Other road pricing strategies
The LTMA does not provide for charging for use of existing roads, which has been used for both TDM and revenue purposes in other countries. The New Zealand government is currently investigating the feasibility and desirability of introducing some form of congestion pricing:
Congestion pricing refers to road pricing used as a demand management strategy to reduce congestion. It is a type of responsive pricing, meaning that it is intended to change consumption patterns. Congestion pricing often involves time-variable tolls, with higher charges during congested periods and lower or no charges when roads are uncongested.
Cordon tolls are fees paid by motorists to drive in a particular area, usually a city centre. Area tolls apply to travel within an area. Cordon or area tolls can involve congestion pricing.
High occupancy toll (HOT) lanes are HOV lanes that also allow access to low occupancy vehicles if drivers pay a toll. This is a type of managed lane. This allows more vehicles to use HOV lanes while maintaining an incentive for mode shifting, and raises revenue.

Page 2–9
The NZ Transport Agency’s Economic evaluation manual (volume 2) First edition, Amendment 0 Effective from January 2010
2.4 Parking and land use management strategies
Introduction This includes various management strategies that affect parking and land use.
Access management Access management refers to coordination between roadway design and land use planning to improve transport. It includes the appropriate placement and design of driveways and side streets to minimise conflicts and hazards along arterials, and the design and location of development to improve access by different modes and minimize traffic problems. Access management can help increase mobility and safety for non-motorised travel, improve public transport service efficiency, and create more efficient land use.
Car free planning Car free planning involves designing particular areas for minimal automobile use. Examples include:
developing urban districts (such as a downtown or residential neighbourhoods) where private vehicle traffic is restricted. such restrictions can be part-time or full-time, and often include exceptions for delivery vehicles, taxis and vehicles for people with disabilities
housing developments where residents are provided with opportunities to lessen the need for private vehicle use
pedestrian oriented commercial streets where driving is discouraged or prohibited
resorts and parks that encourage or require non-automotive access car free days and car free events temporary restrictions on driving, such as during a major sport event that
would otherwise create excessive traffic problems.
Cycle parking Cycle parking, storage and changing facilities are important ways to provide convenience and security for cyclists at destinations. Inadequate facilities and fear of theft are major deterrents to cycle transport. Effective cycle parking requires a properly designed rack in an appropriate location for the type of use.
Location efficient development
Location efficient development consists of residential and commercial development located and designed to maximise accessibility. This usually means that it is close to good public transport services and common destinations such as stores and schools, has good walking and cycling conditions and other features that are intended to reduce car dependency.
New community design
New community design (also called neo-traditional design or traditional neighbourhood development) is a set of development practices to create more attractive and efficient communities. It includes higher density, more clustered, infill development; greater consideration of pedestrians in roadway design; more mixed land use and housing types, increased emphasis on public spaces; and less land devoted to roads and parking facilities. These features can improve accessibility and reduce per capita car travel.

Page 2–10
The NZ Transport Agency’s Economic evaluation manual (volume 2) First edition, Amendment 0 Effective from January 2010
2.4 Parking and land use management strategies continued
Parking management Parking management can help address a wide range of transport problems. Parking management includes various strategies that result in more efficient use of parking resources, such as:
shared parking (multiple users sharing a parking facility) more accurate parking requirements allow reduced parking in exchange for TDM programmes cash out free parking separate parking from decisions on building purchases or leases (parking is
sold or rented separately) address spillover problems resulting from restricted/priced parking develop overflow parking plans regulate parking facilities for efficiency parking maximums allow in lieu fees as an alternative to in-site parking tax parking facilities or their use improved parking facility design.
Public transport oriented development
Public transport oriented development refers to residential and commercial areas designed to maximize access by public transport and non-motorised transport. A public transport oriented neighbourhood has a centre with a rail or bus station, surrounded by relatively high density development, with progressively lower density spreading outwards. For example, the neighbourhood centre may have a public transport station and a few multi-storey commercial and residential buildings, surrounded by several blocks of townhouses and small lot single family residential housing and larger lot single family housing farther away. Public transport oriented neighbourhoods typically have a diameter of 0.4 to 0.8 kilometre (stations spaced 0.8 to 1.6 kilometre apart), which represents pedestrian scale distances.
Smart growth Smart growth is a general term for land use practices that create more resource efficient and liveable communities, with more accessible land use patterns that reduce the amount of mobility required to reach goods and services. Smart growth is an alternative to urban sprawl.

Page 2–11
The NZ Transport Agency’s Economic evaluation manual (volume 2) First edition, Amendment 0 Effective from January 2010
2.5 TDM programmes
Introduction A TDM programme is a framework for implementing a package of TDM strategies. Such a programme should have stated goals, objectives, a budget, staff, and a clear relationship with stakeholders. Possible responsibilities associated with a TDM programme are:
coordinating TDM planning, evaluation and data collection implementing marketing programmes responding to problems and complaints providing ride matching, shuttle services, special event transportation
management, and other special services providing parking management and parking brokerage services, co-ordinates
shared parking supporting pedestrian and cycle improvements monitoring effectiveness.
TDM programmes should use complementary and coordinated strategies for maximum effectiveness. A general rule is that TDM programmes should include a balance of improved travel choice and incentives to reduce private vehicle travel.
Travel behaviour change
Travel behaviour change (TBhC) is a generic classification of programmes that aim to encourage voluntary change in personal or private travel behaviour by providing consumer information and encouragement for people to utilise modes of travel other than private vehicle and to reduce the overall requirement for travel. Such programmes generally employ education, promotion, and/or marketing-based techniques. A TBhC programme may include improvements to services and infrastructure and in some cases financial incentives where these are provided to encourage alternative mode use on a voluntary basis.
The Land Transport New Zealand/Energy Efficiency and Conservation Authority Travel behaviour change guidance handbook (2004) provides a classification of measures that are within the TBhC concept, measures that may be associated with a TBhC programme and measures that are normally evaluated separately and independently. The handbook also provides advice on developing and implementing TBhC programmes, and evaluating, assessing and monitoring the programmes.
TBhC programmes may be targeted at the travel patterns and behaviour of the community at large, or at individuals within households, workplaces or schools.
Business travel management
Business travel management includes commute trip reduction (see below) but also incorporates measures aimed at travel during the course of work, including business and delivery travel, travel by clients, shoppers, tourists and other visitors to the business site.
Commute trip reduction
Commute trip reduction (also called employee trip reduction or vehicle trip reduction) programmes give commuters resources and incentives to reduce their car trips. Commute trip reduction programmes include a wide range of specific activities, including marketing, promotion, financial incentives, improvements to alternative modes and parking management.

Page 2–12
The NZ Transport Agency’s Economic evaluation manual (volume 2) First edition, Amendment 0 Effective from January 2010
2.5 TDM programmes continued
Campus transport management
College, university and similar campuses are particularly appropriate for transport demand management, since they can provide central coordination and support. An increasing number of colleges offer free or discounted public transport passes to all students and staff, rideshare and vanpooling programmes, cycle and pedestrian improvements, parking price increases, coordination for recreation activity transport, and other support services. Such programmes are often cheaper to the campus than providing increased parking capacity and dealing with local traffic congestion, and are valued by students.
School trip management
School trip management encourages parents, students and staff to reduce car trips and use alternative modes for travel to and from schools. This includes education and promotion efforts, improved walking and cycling facilities, organising ‘walking school buses’ (a parent walks a group of students to and from school), ‘bike trains’ (the cycling equivalent of walking school buses), ridesharing, public transport improvements, parking management, including ‘park and stride’ (no parking zones around schools that may not be entered by private vehicles dropping off children – vehicles park outside the zone and children walk), and other strategies that encourage reduced driving.
Freight transport management
Freight delivery can be managed to increase efficiency and address specific problems from freight vehicles. Heavy trucks can be prohibited in congested areas during peak periods.
Marketing Marketing is important for many TDM strategies. Public attitudes can have a major effect on the use of alternative modes. TDM programmes are more effective if users receive positive recognition and encouragement. These are all components of marketing. TDM marketing includes:
educating public officials and businesses about TDM strategies they can implement
informing potential participants about TDM options they can use promoting benefits overcoming barriers to the use of alternative modes providing encouragement to participants.
Tourist transport management
Tourist transport management involves improving transport options and reducing car traffic in resort areas. Tourist travel has predictable patterns and needs, and occurs in unique environments that are particularly sensitive to degradation by excessive light vehicle traffic. Tourist transport management can preserve the environmental amenities that attract visitors to an area, whether it is an historic city centre or a pristine natural environment. Tourist transport management programmes can include a variety of specific strategies to improve transport options, integrate alternative transport into tourist activities, provide disincentives to driving, and promote alternative modes.
Page 3–1
The NZ Transport Agency’s Economic evaluation manual (volume 2) First edition, Amendment 0 Effective from January 2010
3.0 Evaluation of transport demand management activities
3.1 Overview
3.1 Overview 3–1
3.2 Method of evaluation 3–2
3.3 Impacts considered 3–4
3.4 Stages of analysis 3–7
3.5 Do-minimum 3–8
3.6 Travel impacts 3–9
3.7 Cost of transport demand management programmes 3–10
3.8 Benefits of TDM programmes 3–12
3.9 Period of analysis 3–20
3.10 Cost benefit analysis 3–21
3.11 Incremental analysis 3–22
3.12 Sensitivity analysis 3–23
3.13 Monitoring 3–24
3.14 Selecting the appropriate evaluation method 3–25
3.15 References 3–26
Introduction Chapter 2 describes the wide range of the transport demand management (TDM) strategies, which may involve infrastructure, education, promotion and marketing, policing, work/study place policies, new transport services or service improvements, pricing and financial incentives, parking management, and land use design/management.
Most TDM programmes include a combination of positive incentives and negative incentives. This approach has cumulative and synergetic impacts (the total impacts are greater than the sum of the impacts of the individual strategies). It is, therefore, important to evaluate a TDM programme as a package, rather than each activity or strategy individually.
In this chapter Section Page

Page 3–2
The NZ Transport Agency’s Economic evaluation manual (volume 2) First edition, Amendment 0 Effective from January 2010
3.2 Method of evaluation
Consumer surplus-based evaluation
All TDM programmes have the objective of changing travel or transport behaviour. Therefore, TDM evaluation needs to use values that are perceived by users (rather than just the national resource costs from the NZ Transport Agency’s (NZTA) Economic evaluation manual volume 1 (EEM1)). This requires a consumer surplus based evaluation, which is a method of measuring the value that consumers place on a change in the price or quality of the goods they consume (in this case travel is considered a ‘good’).
The basic technique for evaluating consumer impacts of price changes is to use the incremental cost to consumers who don’t change their travel, plus half the change in price times the number of trips that increase or decrease. This is known as the ‘rule of half’, which represents the midpoint between the old price and the new price.
For example, if a $1 highway toll increase causes annual vehicle trips to decline from three million to two million, the reduction in consumer surplus (the total net cost to consumers) is $2.5 million ($1 x two million for existing trips, plus $1 x one million x ½ for vehicle trips foregone). Similarly, if a 50c per trip public transport fare reduction results in an increase from 10 million to 12 million annual public transport trips, this can be considered to provide $5.5 million in consumer surplus benefits (50c x 10 million for existing trips, plus 50c x two million x ½ for added trips).
The rule of half assumes that a new user who was just discouraged from using a service before the service change (or implementation of a new service) will receive the full benefit of the service change or introduction and a user who is just marginal after the service change will receive nearly zero benefits. Hence, on average, new users receive half the unit benefits.
Consumer surplus impacts of transport changes that do not involve pricing can be evaluated using market surveys and other techniques that reveal consumer perceived costs, known as willingness to pay (WTP).
For purposes of economic evaluation, corrections are often required to the perceived benefit values derived from WTP surveys because some values (eg private vehicle operating costs and parking costs) tend to be misperceived.
TDM packages The procedure for evaluating roading packages in section 3.9 of EEM1, involving analysis of the timing of individual components, is not appropriate to TDM packages unless the package contains substantial infrastructure or passenger transport components.
If a TDM package contains substantial infrastructure or passenger transport components then a composite evaluation is necessary. Road infrastructure components of a package should be evaluated using the procedures in EEM1 and the passenger transport and other TDM components evaluated using relevant procedures in this volume. The results are then aggregated, taking care to avoid double counting of benefits.
Procedures for composite evaluation of packages involving travel behaviour change (TBhC) are given in section 9.6.

Page 3–3
The NZ Transport Agency’s Economic evaluation manual (volume 2) First edition, Amendment 0 Effective from January 2010
3.2 Method of evaluation continued
There are essentially two types of consumer preference surveys – revealed preference (RP) surveys and stated preference (SP) surveys:
RP surveys observe actual behaviour under varying conditions, for example the modes of travel used by household members relative to the level of service of passenger transport. This information is then analysed to identify and quantify the factors that influence travel decisions.
SP methods ask individuals how they would respond to various situations. Two techniques used in SP analyses are contingent valuation and conjoint analysis. Contingent valuation (attitudinal) surveys ask respondents directly how they would respond to various situations, or asks them to rate or rank their preferences for various levels of service, facility or situation. This often gives values several times higher than what they would be in reality because people often do not do what they say they would do. This type of survey tends to be better suited to evaluating relative preferences and for estimating the maximum possible response to an action, than to predicting actual changes in travel.
Conjoint analysis (hypothetical choice) surveys require respondents to make choices between hypothetical alternatives with varying attributes. It is necessary to have forced trade-offs so that a better environment might be coupled with higher costs or a higher travel time. This forces the respondent to relate the value of each component of preference.
SP surveys need to be stratified by audience: current users versus potential users. Current users should be asked to respond to questions about factors that would provide for a more comfortable or attractive journey through different types of environments, facilities or levels of service.
For potential users, it is important to create scenarios based on constructed markets. For example, questions could be what mode they would choose for work and non-work trips based on the quality of the transport environment, including travel by private vehicle, passenger transport, walking, and cycling. It would query residents about the degree to which they perceive different levels of service or facilities will improve the conditions of their commute, recreational activities and so forth. By measuring how demand might change, one can ascertain the preferences of current non-users, some of whom would become users if certain improvements were made.
Evaluators may wish to consult other sources for guidance as to the design and implementation of SP surveys to derive WTP values. The NZTA may be able to provide some assistance in this regard.

Page 3–4
The NZ Transport Agency’s Economic evaluation manual (volume 2) First edition, Amendment 0 Effective from January 2010
3.3 Impacts considered
Introduction Evaluation of TDM activities considers not only direct impacts but also additional costs and benefits to participants and society that may influence transport choice. All impacts should be considered, regardless of where they occur. Impacts within a particular area or analysis period may be highlighted, but costs and benefits that occur outside the jurisdiction should not be ignored. For example, a community’s TDM programme may alleviate traffic congestion and parking demand in adjacent areas. These additional benefits should be mentioned even if they are not the primary consideration in decision making, since such benefits may justify support from other levels of government.
Impacts included in the economic efficiency evaluation of TDM activities are:
Impact Section
Costs:
activity costs, including service provider costs any service provider revenue road capital, maintenance and operating cost savings parking cost savings to government.
3.7
Impacts
Benefits:
vehicle operating cost (VOC) savings travel time cost savings trip reliability generated traffic spillover effects walking and cycling costs accident cost savings health benefits transport service user benefits parking user cost savings other user benefits carbon dioxide reduction other monetised and non-monetised environmental impacts community liveability improvements increased consumer travel options adjustment for public transport fares disbenefits during implementation/construction land use benefits national strategic factors.
3.8

Page 3–5
The NZ Transport Agency’s Economic evaluation manual (volume 2) First edition, Amendment 0 Effective from January 2010
3.3 Impacts considered continued
Business benefits Benefits to businesses are economic transfers rather than national economic benefits and are therefore not included in the economic efficiency calculation. However, they can be an important factor in ‘selling’ a TDM programme and obtaining funding for workplace based programme and they should, therefore, be quantified where appropriate and reported as part of the overall evaluation (separately from the economic efficiency calculation).
Potential benefits to employers from workplace TDM programmes include:
Reduced overhead costs. Increased competition and need to build shareholder value place more pressure on businesses to lower their cost of doing business as well as increase revenues and/or margins. Strategies such as telecommuting and parking management can make a difference. Telecommuting can reduce office space requirements. Parking management can eliminate the need to build additional parking.
Enhanced employee recruitment and retention. A shrinking labour force has increased competition for qualified applicants. Similarly, the cost of replacing an employee in productivity and direct costs can be very expensive.
Expanded employee benefits at low/no cost. Employers can take advantage of changes in the tax treatment of commute to work fringe benefits to benefit employees and reduce costs. Employers can provide employees with a tax free benefit and/or offer to subtract the cost of transit, vanpool, or parking as a pre-tax payroll deduction option.
Enhanced corporate image. Implementation of trip reduction strategies can enhance an employer’s environmental image and their neighbourhood relations.
Reduced localized transportation problems. Employers are well aware of the value of banding together to address common problems. Overseas, employers are joining transport management associations (TMA) to address access and mobility problems in their immediate area.
Expanded service hours. Work hour schedules such as flexitime, staggered work hours, compressed work weeks enable organizations to provide additional coverage with the same total number of employers.
Lower absenteeism and tardiness. Employees may make better time commitments to their carpool partner or to meet the bus. Telework may allow work to be accomplished when travel to the office isn’t possible.
Increased employment opportunities for the disabled and others unable to use traditional transport. Telework provides an alternative to having to use physicaltransport.
Reduced employee stress. Employee health is significantly related to the distance and duration of the trip. People who are exposed to high levels of traffic congestion arrive at work with higher blood pressure than people who are not exposed. The more sensitive long distance commuters are to the effects of commuting on family life, the greater the inclination to try alternatives to solo driving.
Enhanced employee productivity. One of the oft-cited benefits of telework is productivity increase.

Page 3–6
The NZ Transport Agency’s Economic evaluation manual (volume 2) First edition, Amendment 0 Effective from January 2010
3.3 Impacts considered continued
Equity impacts A TDM programme can have a wide range of equity impacts, depending on programme design and the conditions in which it is implemented.
The Land Transport Management Act 2003 requires that the needs of persons that are transport disadvantaged be considered in preparing land transport programmes. Some TDM programmes increase vertical equity by improving mobility options for such persons.
Some TDM programmes also benefit lower income people by providing financial savings to non-drivers (such as parking cash out and public transport fare discounts).
Equity impacts of TDM activities should be quantified where appropriate and reported as part of the overall evaluation (separately from the economic efficiency calculation).

Page 3–7
The NZ Transport Agency’s Economic evaluation manual (volume 2) First edition, Amendment 0 Effective from January 2010
3.4 Stages of analysis
Introduction At every stage of the economic efficiency evaluation, the analysis is carried out for the TDM activities, the do-minimum and any other options.
Stage Description See
1 Develop alternative TDM packages (including staging and sequence if appropriate).
2 Complete the activity description, including the TDM package, the do-minimum, and the alternatives and options considered.
EEM1, section 5.2
3 Select the evaluation method appropriate to the activity Section 3.14
4 Assess travel impacts:
a. target population b. uptake c. demand estimates and modal share.
Chapter 4
5 If there is service provider, determine service provider costs, service provider revenue, and the funding gap.
Chapter 6
6 Quantify the net costs to government. Section 3.7
7 Quantify all national economic benefits and disbenefits that have monetary values.
Section 3.8
8 Describe, and quantify where possible, any significant non-monetised impacts.
Section 3.8
9 List any national strategic factors relevant to the preferred option. If possible determine the monetary value(s) of any national strategic factors.
Section 3.8
10 Describe business benefits, equity impacts (particularly those relating to transport disadvantaged) and any other significant effects not covered in stages 7 and 8.
Section 3.3
11 Discount the service provider costs and funding gap (stage 4) and net costs to government (stage 5) over the period of analysis to obtain the present value (PV) of these costs.
EEM1, appendix A1
12 Discount all monetised benefits (stage 6 plus stage 8 if monetised) over the period of analysis and sum them to obtain the PV of net national economic benefits.
EEM1, appendix A1
13 Where options being evaluated are mutually exclusive, use incremental analysis to select the preferred option.
EEM1, section 2.10
14 Determine the national benefit cost ratio (BCRN) and the government benefit cost ratio (BCRG).
Section 3.10
15 Perform sensitivity tests on the preferred option. Section 3.12
16 If the PV of the net government costs is greater than one million, undertake a detailed risk analysis.
Chapter 12
Stages

Page 3–8
The NZ Transport Agency’s Economic evaluation manual (volume 2) First edition, Amendment 0 Effective from January 2010
3.5 Do-minimum
Introduction A TDM evaluation is based on incremental impacts compared with a do-minimum case. The do-minimum is the likely conditions that would exist in the absence of the proposed TDM programme including, for example, likely traffic for each mode, social and economic conditions. This is equivalent to the do-minimum described in section 2.8 of EEM1.
It is important that the do-minimum is fully described in any analysis.
Examples When evaluating a high occupancy vehicle (HOV) lane, the do-minimum could either be no additional lane, or an additional general use lane. Similarly, when evaluating road pricing, the do-minimum could be the same road capacity provided with a different funding source, less road capacity, or something in-between.
Exceptions For activities involving no pricing or infrastructure changes, eg ‘pure’ TBhC or only small infrastructure changes, eg some walking and cycling activities, there is no need to investigate/assess the benefits and costs of a do-minimum. For these activities, only the incremental costs and benefits of the activity need to be evaluated.
Note: For TBhC it is still necessary to have some information on the current and future conditions without the activity as a basis for estimating the numbers of people changing their travel behaviour.

Page 3–9
The NZ Transport Agency’s Economic evaluation manual (volume 2) First edition, Amendment 0 Effective from January 2010
3.6 Travel impacts
Introduction TDM programmes affect travel behaviour in various ways, including changes in trip scheduling, route, mode, destination, and frequency, plus traffic speed, mode choice and land use patterns. Different types of travel changes provide different types of impacts, eg a shift from driving to non-motorised travel has significantly different impacts than a shift to public transport.
In order to evaluate the benefits associated with a TDM activity, it is necessary to estimate the likely impact that the activity will have on travel behaviour including changes in mode share. Methods for estimating the demand for a service or facility and modal share are provided in chapter 4 and appendix A15.
A well managed and properly supported TDM programme can affect a significant portion of total travel. Comprehensive TDM programmes can achieve cost-effective reductions in private vehicle travel compared with no TDM efforts, although most programmes have only small effects because they focus on particular types of trips (such as commuting), cover a limited geographic scope, or are limited to strategies that can be implemented by a particular government agency.
A well managed commute trip reduction programme can reduce vehicle trips to a particular worksite if implemented within a regional TDM strategy that includes components such as road tolling, major public transport improvements and walking and cycling promotion and facilities improvement. Other types of trips can also be reduced using appropriate TDM strategies. Land use management strategies such as access management, smart growth and location efficient planning can reduce per capita vehicle travel in a specific area.

Page 3–10
The NZ Transport Agency’s Economic evaluation manual (volume 2) First edition, Amendment 0 Effective from January 2010
3.7 Cost of transport demand management programmes
Introduction Costs of TDM activities are the costs to government (the NZTA and local government) and the service provider costs and revenue (where a service provider is involved). Service provider costs and revenue are addressed in section 6.2 and section 6.3 respectively.
Note: Increases in costs to consumers are defined as disbenefits in this manual. Costs of a TDM activity depend on whether additional system capacity is required, such as additional road space, parking space, or additional public transport vehicles or infrastructure. This often depends on whether the additional trips occur during peak periods (when there is no additional capacity) or off-peak periods (when additional capacity is available).
Activity costs Activity costs include the costs of:
investigation and design implementation/construction (including property and supervision) promotion and education maintenance operating monitoring.
The estimated costs for activity development (investigation and design) should be identified separately from those for implementation. Cost estimates for initial indicative evaluations for TDM activity development funding can be obtained from past experience or judgement. The implementation cost estimate will be refined and the evaluation reconfirmed based on the completed plan before implementation funding is approved.
The cost of annual expenditure required to maintain the benefits of the TDM package over the evaluation period following completion of the activity should be estimated based on local experience and knowledge.
Activity operating cost is the cost of operating the new (or improved) facility or service. This is the cost to government plus the net cost to the service provider (service provider cost minus service provider revenue).
The cost of monitoring a TDM activity is not included in the cost benefit evaluation of a activity, except where an initial survey is an integral part of the activity and then it should be costed as such.
The marginal cost of carpooling is nearly zero if a vehicle has an extra seat that would otherwise travel empty (there is a small increase in fuel consumption and emissions). The incremental cost increases if the rideshare vehicle must drive out of its way to pick up riders, or if a larger vehicle (eg a van) is purchased just to carry passengers.
Similarly, if a public transport system has excess capacity, shifts from driving to public transport may have minimal incremental cost. If peak travel results in increased operating costs (including extra vehicles), then the net cost to government of this must be assessed.

Page 3–11
The NZ Transport Agency’s Economic evaluation manual (volume 2) First edition, Amendment 0 Effective from January 2010
3.7 Cost of transport demand management programmes continued
Activity costs continued
Notes:
The impact on mode choice of any increase in fare resulting from purchase of extra vehicles must also be evaluated.
If increased patronage results in uncomfortably crowded vehicles, then this disbenefit should be included in the evaluation.
Road capital, maintenance and operating cost savings
Reduced vehicle travel can reduce the need to add roadway capacity, reduce some roadway operations, maintenance and renewal costs, and reduce some traffic service costs, such as policing and emergency response.
Shifts from vehicle to bus transport may increase some road maintenance costs (heavy vehicles tend to cause high levels of road wear).
Parking cost savings to government
Reduced vehicle travel may result in a reduction in the demand for parking facilities. The parking cost savings of park and ride is the difference in cost between a parking space at the worksite and at the urban fringe.
The parking cost saving to government is the net cost to government. This is the service provider costs minus service provider revenue (refer to section 6.2 and section 6). Usually this cost will be zero unless government is providing subsidised parking.
The timing of any parking cost saving must be carefully assessed. Reductions in vehicle trips may provide little parking cost savings in the short-run if there is abundant parking supply. However, over the long term, the excess parking spaces or their land can be used for other purposes.
Page 3–12
The NZ Transport Agency’s Economic evaluation manual (volume 2) First edition, Amendment 0 Effective from January 2010
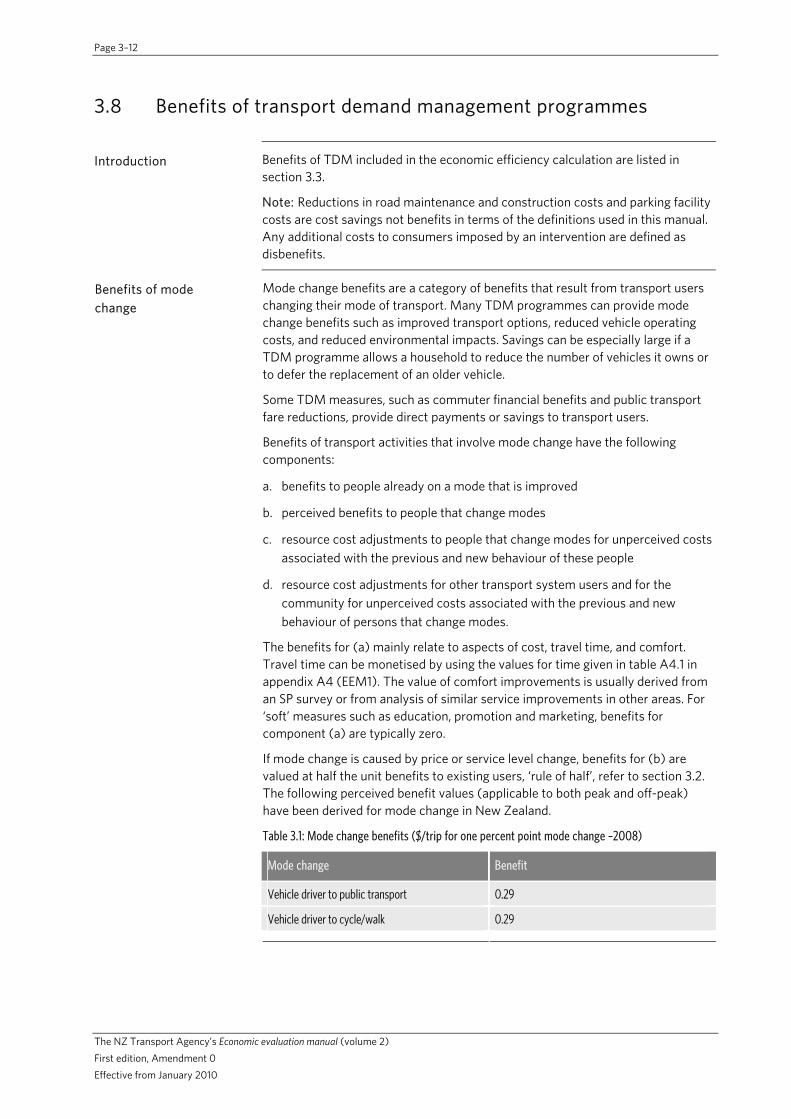
3.8 Benefits of transport demand management programmes
Introduction Benefits of TDM included in the economic efficiency calculation are listed in section 3.3.
Note: Reductions in road maintenance and construction costs and parking facility costs are cost savings not benefits in terms of the definitions used in this manual. Any additional costs to consumers imposed by an intervention are defined as disbenefits.
Mode change benefits are a category of benefits that result from transport users changing their mode of transport. Many TDM programmes can provide mode change benefits such as improved transport options, reduced vehicle operating costs, and reduced environmental impacts. Savings can be especially large if a TDM programme allows a household to reduce the number of vehicles it owns or to defer the replacement of an older vehicle.
Some TDM measures, such as commuter financial benefits and public transport fare reductions, provide direct payments or savings to transport users.
Benefits of transport activities that involve mode change have the following components:
a. benefits to people already on a mode that is improved
b. perceived benefits to people that change modes
c. resource cost adjustments to people that change modes for unperceived costs associated with the previous and new behaviour of these people
d. resource cost adjustments for other transport system users and for the community for unperceived costs associated with the previous and new behaviour of persons that change modes.
The benefits for (a) mainly relate to aspects of cost, travel time, and comfort. Travel time can be monetised by using the values for time given in table A4.1 in appendix A4 (EEM1). The value of comfort improvements is usually derived from an SP survey or from analysis of similar service improvements in other areas. For ‘soft’ measures such as education, promotion and marketing, benefits for component (a) are typically zero.
If mode change is caused by price or service level change, benefits for (b) are valued at half the unit benefits to existing users, ‘rule of half’, refer to section 3.2. The following perceived benefit values (applicable to both peak and off-peak) have been derived for mode change in New Zealand.
Table 3.1: Mode change benefits ($/trip for one percent point mode change –2008)
Mode change Benefit
Vehicle driver to public transport 0.29
Vehicle driver to cycle/walk 0.29
Benefits of mode change

Page 3–13
The NZ Transport Agency’s Economic evaluation manual (volume 2) First edition, Amendment 0 Effective from January 2010
3.8 Benefits of transport demand management programmes continued
Benefits of mode change continued
The resource cost adjustments (c) for the people that change modes result from replacing a private vehicle trip with a public transport, cycle or walk trip. Adjustments are required for passenger transport fares, parking charges, vehicle operating costs, accident costs, health benefits and associated environmental impacts.
Resource cost adjustments (d) are required for other user’s vehicle operating costs, travel time costs, accident costs, and associated environmental impacts.
Disbenefits Some TDM programmes may increase consumers’ cost by:
increasing fees for parking, road or vehicle use increasing transaction costs increasing travel time by introducing delays or speed reductions reducing comfort.
These can be perceived as disbenefits by consumers and will be taken into account in forming a view on overall benefits of mode change.
Vehicle operating cost savings
It is normally considered that vehicle users only perceive the fuel component of vehicle operating costs (VOC) and, therefore, a resource cost correction is required for the difference between the perceived costs and the total resource cost avoided for trips that change mode. Such a correction is about $0.11/km for New Zealand vehicles in 2008 values.
If a TDM activity provides sufficient information to make people aware of the difference between their perceived value of VOC and the resource cost, then the resource cost correction can be taken as zero.
Valuing travel time for TDM
People that change modes do not always consider additional travel time as a cost. The value that people assign to travel time is highly variable, depending on factors such as comfort and enjoyment. For example, some people prefer public transport or rideshare travel as being less stressful than driving in traffic. Other people enjoy walking or cycling for recreation and exercise, and will choose these modes even if the trips take longer. In other words, consumers sometimes consider time spent travelling by alternative modes to have a lower cost per minute than driving.
Travel time savings (or increases) for people that change modes do not need to be assessed directly when using a consumer perceived cost approach because travel time changes and related impacts are considered to be fully included in the perceived net benefit. This includes effects such as differences in travel time by different modes, differences in the value of that time, other time costs such as waiting, transfers, changing etc and trip time reliability.
If transport models are used to provide inputs for evaluation of TDM packages, it is important that they use consumer surplus analysis to measure the incremental costs and benefits of travel time changes.
Travel time, vehicle operating cost and CO2 benefits to other road users
Travel time, VOC and CO2 benefits to people that change travel behaviour are addressed above, there are also travel time, VOC and CO2 benefits experienced by other road users as a result of the TDM activity.

Page 3–14
The NZ Transport Agency’s Economic evaluation manual (volume 2) First edition, Amendment 0 Effective from January 2010
3.8 Benefits of transport demand management programmes continued
Table 3.2: Average benefits to other road users for travel time, VOC and CO2 ($/vehicle km - 2008)
Time period Region Benefit
Auckland 1.41
Wellington 1.08
Christchurch 0.10
Peak
Other 0.00
Off-peak All regions 0.00
Travel time, vehicle operating cost and CO2 benefits to other road users continued
Reduced road traffic is likely to make private vehicle travel more appealing for other potential road users, which will partially offset the above benefits. This generated traffic effect should be valued as a disbenefit equivalent to 50 percent of the above benefits.
Trip reliability Trip reliability for road users is usually improved as traffic is reduced.
Trip reliability of passenger transport can be assessed using the techniques in section 7.2.
Generated traffic Generated traffic is the additional travel that results from improved capacity. This consists of a combination of diverted trips (trips shifted in time, route and destination), and induced travel (shifts from other modes, longer trips and new trips). Over the long run, generated traffic often fills a significant portion (50 – 90 percent) of added urban roadway capacity.
It is important to consider generated traffic when evaluating road traffic reduction strategies. Generated traffic does not eliminate the benefits of capacity expansion activities, but it can significantly change the nature of their benefits. It often means that road traffic reduction benefits are smaller and shorter lived than projected, that the benefits consist of increased consumer mobility and urban fringe property values, and induced vehicle travel can exacerbate problems such as downstream congestion, road accidents, emissions, urban sprawl and overall private vehicle dependency. Evaluation that ignores the effects of generated traffic tends to overstate the true benefits of roadway capacity expansion and understate the benefits of TDM programmes.
Not all road traffic reduction strategies cause induced or generated traffic. Some types of TDM programmes do not contribute to generated traffic and so tend to be particularly effective at providing long-term road traffic reduction benefits. Programmes that increase the costs of driving or make alternative travel options more attractive under urban peak conditions can change the point of congestion equilibrium. For example, congestion pricing, parking pricing, distance-based charges, HOV priority and grade separated public transport improvements can reduce overall road traffic levels. Roadway capacity expansion or flexitime (which frees up peak period road space) is likely to generate road traffic, and so will provide relatively little long-term road traffic reduction benefit, depending on circumstances.

Page 3–15
The NZ Transport Agency’s Economic evaluation manual (volume 2) First edition, Amendment 0 Effective from January 2010
3.8 Benefits of transport demand management programmes continued
Spillover effects Some TDM activities have spillover impacts that should be considered in evaluation. For example:
road tolling may shift vehicle travel and congestion problems to untolled roads traffic calming may shift traffic impacts to other roads parking charges in one area may increase parking problems in nearby areas,
and may shift economic activity to areas that offer free parking.
These and any other spillover impacts should be taken into account in the evaluation of TDM activities.
Cycle operating costs The resource cost value of operating a cycle is approximately $0.05/kilometre. It can be assumed that people changing to cycling correctly perceive cycle costs and, therefore, the resource cost correction to the perceived value is zero.
Walking costs These can be ignored because they are likely to be small and also are likely to be correctly perceived by people changing to walking.
TDM programmes that reduce total vehicle kilometres of travel, reduce traffic speeds, or provide an incentive for safer driving tend to be particularly effective at reducing road accidents. Programmes that reduce traffic congestion without reducing total kilometres travelled, by shifting travel times and routes, have mixedsafety benefits. Although accidents tend to decline, collisions that do take place tend to be more severe (and therefore have higher resource cost) because they occur at higher speeds.
Accident costs can be considered in three parts:
a. internal costs that are borne by people in making travel choices
b. internal costs that are borne by family and friends of the people making travel choices
c. externality costs (not perceived) borne by others/society (hospital costs, lost productivity, etc).
People, in general, perceive only (a) and (b) of the accident risk or cost associated with use of private vehicles, so the resource cost correction is item (c).
Table 3.3 is based on the Ministry of Transport’s Surface transport costs and charges: main report.
Table 3.3: Resource cost corrections to motor vehicle accident cost savings ($/km – 2008)
Marginal overall cost Private vehicle Motorcycle Bus
Rural 0.02 0.22 0.17
Urban off-peak 0.03 -0.18 0.07
Motor vehicle accident cost savings
Urban peak -0.03 0.02 -0.14

Page 3–16
The NZ Transport Agency’s Economic evaluation manual (volume 2) First edition, Amendment 0 Effective from January 2010
3.8 Benefits of transport demand management programmes continued
Cycle/walk accident costs
It is assumed that people that change to walking and cycling have a fairly clear perception of the associated accident risk.
If most internal costs are perceived (and included in the perceived benefit of changing travel behaviour), then the resource cost correction would be equal to the externality costs. However, it is assumed that this is offset by the fall in the average per kilometre accident cost per pedestrian or cyclist that studies show is a result of an increase in the number of pedestrians and cyclists.
The resource cost correction is therefore taken as zero.
Health benefits Regular physical activity is associated with an improvement in a wide range of health conditions, including heart disease, mental health and diabetes. The health benefits of walking and cycling have been researched, and this indicates significant benefits associated with these activities.
Health benefits of cycling and walking can be considered in three components in the same way as accident costs (but they are a benefit rather than a disbenefit). Total health benefits of cycling have been assessed as $1.30/km and of walking $2.60/km. It is assumed that people that change to walking or cycling do not perceive the wider savings to society (externalities) of their improved health, eg hospital cost savings, so a resource cost correction is required at least for this. Further information on the health benefits of walking and cycling is contained in section 8.6.
For purposes of evaluation, it is assumed that half of the total health benefits are internal to people that use cycling and walking and are perceived. A resource cost correction is required for the other half, ie the resource cost correction is $1.30/km for walking and $0.65/km for cycling
Transport service user benefits
Transport service user benefits are described in section 7.2.
Public transport fares are perceived by users as a disbenefit in their assessment of the net benefit of changing modes. However, the fares are, in fact, a financial transfer rather than a resource cost. A resource cost correction is required to correct for this misperception. The correction comprises using the tax inclusive amount of the fare as an explicit benefit. The tax inclusive fare is used because this is the perceived cost.
Parking user cost savings
Reduced vehicle usage results in a reduction in demand for parking facilities. The resource cost of providing parking includes the opportunity cost of using the land for parking, the capital cost of the parking facilities and the provision of security and other administration.
Motorists are usually charged a fee for the use of a parking facility. The charge differs depending on the destination of a journey and the time of day that the journey is made. The Ministry of Transport Surface transport costs and charges: main report found that, for central business districts (CBD) in all major New Zealand urban areas, charges to users in commercial parking facilities approximate to the resource costs of the parking spaces. However, there are situations where the user pays no charge or less than the resource cost.
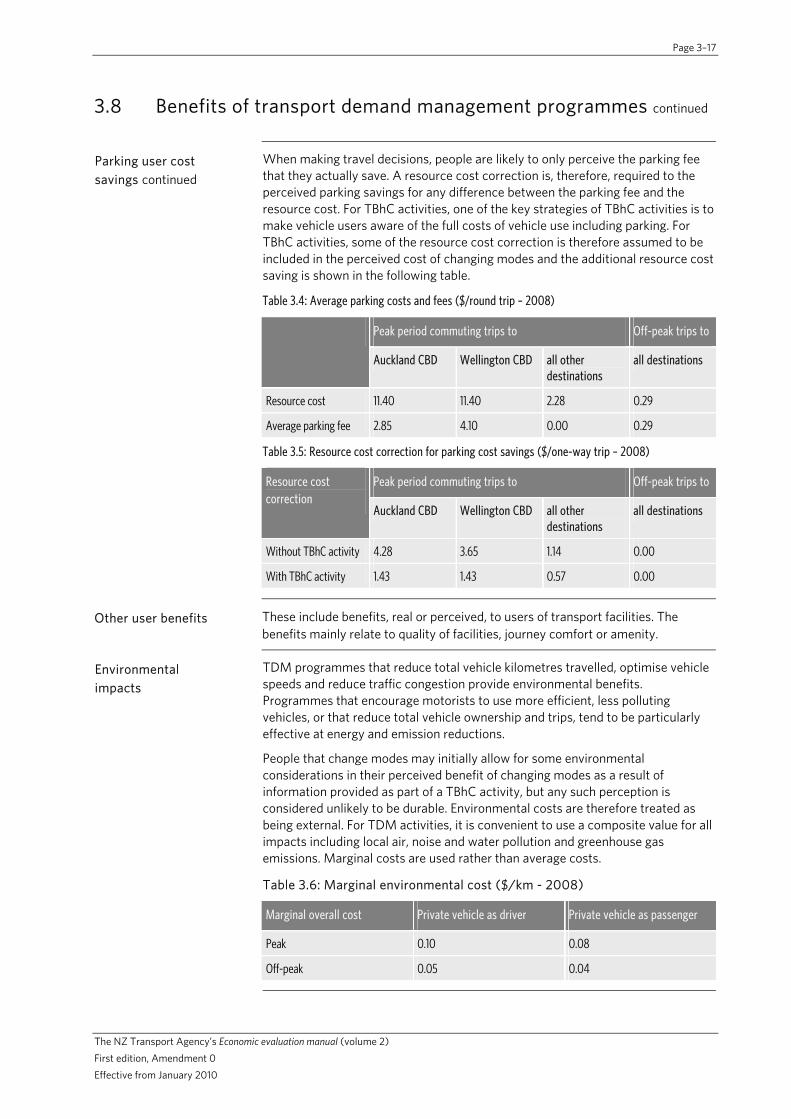
Page 3–17
The NZ Transport Agency’s Economic evaluation manual (volume 2) First edition, Amendment 0 Effective from January 2010
3.8 Benefits of transport demand management programmes continued
When making travel decisions, people are likely to only perceive the parking fee that they actually save. A resource cost correction is, therefore, required to the perceived parking savings for any difference between the parking fee and the resource cost. For TBhC activities, one of the key strategies of TBhC activities is to make vehicle users aware of the full costs of vehicle use including parking. For TBhC activities, some of the resource cost correction is therefore assumed to be included in the perceived cost of changing modes and the additional resource cost saving is shown in the following table.
Table 3.4: Average parking costs and fees ($/round trip – 2008)
Peak period commuting trips to Off-peak trips to
Auckland CBD Wellington CBD all other destinations
all destinations
Resource cost 11.40 11.40 2.28 0.29
Average parking fee 2.85 4.10 0.00 0.29
Table 3.5: Resource cost correction for parking cost savings ($/one-way trip – 2008)
Peak period commuting trips to Off-peak trips toResource cost correction
Auckland CBD Wellington CBD all other destinations
all destinations
Without TBhC activity 4.28 3.65 1.14 0.00
With TBhC activity 1.43 1.43 0.57 0.00
Parking user cost savings continued
Other user benefits These include benefits, real or perceived, to users of transport facilities. The benefits mainly relate to quality of facilities, journey comfort or amenity.
TDM programmes that reduce total vehicle kilometres travelled, optimise vehicle speeds and reduce traffic congestion provide environmental benefits. Programmes that encourage motorists to use more efficient, less polluting vehicles, or that reduce total vehicle ownership and trips, tend to be particularly effective at energy and emission reductions.
People that change modes may initially allow for some environmental considerations in their perceived benefit of changing modes as a result of information provided as part of a TBhC activity, but any such perception is considered unlikely to be durable. Environmental costs are therefore treated as being external. For TDM activities, it is convenient to use a composite value for all impacts including local air, noise and water pollution and greenhouse gas emissions. Marginal costs are used rather than average costs.
Table 3.6: Marginal environmental cost ($/km - 2008)
Marginal overall cost Private vehicle as driver Private vehicle as passenger
Peak 0.10 0.08
Off-peak 0.05 0.04
Environmental impacts

Page 3–18
The NZ Transport Agency’s Economic evaluation manual (volume 2) First edition, Amendment 0 Effective from January 2010
3.8 Benefits of transport demand management programmes continued
Community liveability Community liveability refers to the environmental and social quality of an area as perceived by residents, employees, customers and visitors. This includes:
accident risk noise local pollutants (eg dust) preservation of unique cultural and environmental resources (eg historic
structures, mature trees, traditional architectural styles) attractiveness of streets opportunities for recreation and entertainment, and the quality of social interactions, particularly among neighbours.
A liveable community directly benefits people who live in, work in or visit the neighbourhood, increases property values and business activity, and it can improve public health and safety.
The ease by which residents can travel as pedestrians or by bicycle represents a critical component of community liveability. The compactness and mixture of land uses is another important component as is proximity to busy highways or streets. Some TDM programmes improve community liveability by helping to create more attractive pedestrian conditions, creating more accessible land use patterns, and reducing total vehicle traffic on local streets.
Community liveability is somewhat different from the effects covered in appendix A8 (EEM1), which are in general related to the effects of changes to the road system. Community liveability should be described and quantified as for other impacts. The value of changes in community liveability can be assessed by revealed preference, eg by analysing the effect on house prices, or by stated preference methods. Care must be taken not to double count benefits under community liveability as well as under other categories.
For programmes that seek to improve community liveability by reducing traffic speeds there maybe travel time disbenefits to motorised vehicles. Where the communities have selected this as an objective for the programme, removing the value of small travel time disbenefits can be evaluated as a sensitivity test. This needs to recognise the priority of users and the local context of the transport corridor.
Consumer travel options Some TDM programmes improve transport options by improving alternative modes or providing new pricing options. This provides various types of benefits to consumers and society, including improved access and opportunity, consumer cost savings, increased equity, improved community liveability, and reductions in various external costs. Adequate transport options are a key market principle for economic efficiency and equity.
Some TDM programmes increase consumer options in ways that increase mobility. For example, car sharing makes vehicle use more affordable for lower-income drivers, and public transport improvements may increase personal travel (not every additional public transport trip represents a private vehicle trip reduced).
It is assumed that the benefit of improved consumer options are included in perceived costs.

Page 3–19
The NZ Transport Agency’s Economic evaluation manual (volume 2) First edition, Amendment 0 Effective from January 2010
3.8 Benefits of transport demand management programmes continued
Public transport fares Public transport fares are perceived by users as a cost and, therefore, form part of their assessment of net benefit of changing modes. However, the fares are, in fact, a financial transfer rather than a resource cost.
A resource cost correction is required to correct for this mis-perception. The correction comprises adding back (as a benefit) the amount of the fare. The tax inclusive fare is used because this is the perceived cost.
Disbenefits during implementation/ construction
Subject to the community and transport corridor function, any increased travel time to transport users during activity implementation/construction should be specifically identified and reported as a disbenefit (negative benefit) - refer to section 2.3 (EEM1).
Land use benefits Some TDM programmes increase land use accessibility, while others may encourage more efficient land use patterns that reduce per capita impervious surface coverage (the amount of land paved for roads, paths and parking facilities, or covered by buildings), which helps preserve green space and reduce stormwater management costs.
Land use benefits are, in general, captured in the monetised and non-monetised impacts described in appendix A8 of EEM1 but there may be additional benefits in particular situations.
National strategic factors
National strategic factors are defined in section 2.3 and appendix A10 (EEM1).
The NZTA will consider categories of national strategic factors other than ‘providing for security of access on busy inter-regional routes’ and ‘providing for investment option values’ for TDM activities where promoters can demonstrate that consumers are willing to pay for a benefit not included in current procedures.

Page 3–20
The NZ Transport Agency’s Economic evaluation manual (volume 2) First edition, Amendment 0 Effective from January 2010
3.9 Period of analysis
Introduction The period of analysis for TDM activities should cover the full life of the component parts of the activity but may be less than the standard 30 years used for road activities (section 3.7 of EEM1).
In particular, the period of analysis should be no more than 10 years for TDM activities using promotion/education to change travel behaviour.

Page 3–21
The NZ Transport Agency’s Economic evaluation manual (volume 2) First edition, Amendment 0 Effective from January 2010
3.10 Cost benefit analysis
Introduction Costs and benefits of TDM activities need to be presented in a manner that facilitates decision-making. Although benefits for some TDM activities are defined in a different manner (consumer perception) from than for infrastructure activities(mainly resource costs), the concepts of cost benefit analysis described in EEM1 are still applicable.

Page 3–22
The NZ Transport Agency’s Economic evaluation manual (volume 2) First edition, Amendment 0 Effective from January 2010
3.11 Incremental analysis
Introduction The incremental cost benefit analysis process for evaluation of alternatives and options for TDM activities is the same as the incremental BCR process described in section 2.10 of EEM1.
All effects (positive and negative) for which monetary values have been estimated should be included in the total benefits of the options when undertaking incremental cost benefit analysis.
Scale and scope of TDM options
TDM activities, like most economic programmes, will eventually have diminishing marginal benefit. There is an optimal level of implementation, beyond which incremental costs exceed incremental benefits. TDM programmes need to track these incremental impacts and limit such programmes.
For example, ridesharing programmes may be extremely cost effective when properly implemented, but once the potential rideshare market is satisfied there will be little additional benefit from simply expanding a rideshare programme, eg by sending out more promotional material. Instead, further expansion may require implementation of additional TDM strategies, such as commuter financial incentives, to expand the size of the market.
Similarly, cycling improvements can be cost effective where there is latent demand for this mode, but that does not mean that it is unnecessary to carefully evaluate investments in cycle paths to insure that they are cost effective. There may be better ways to support cycling, such as education and encouragement programmes.

Page 3–23
The NZ Transport Agency’s Economic evaluation manual (volume 2) First edition, Amendment 0 Effective from January 2010
3.12 Sensitivity analysis
Possible significant factors Inputs to TDM evaluations that should be considered for sensitivity testing include:
demand estimates (refer to chapter 4) funding gap (refer to chapter 6) major contributors to benefits commencement of the proposal.
Major contributors to benefits
Major contributors to benefits critical to the outcome of the evaluation are likely to include:
road traffic volumes, particularly model results, growth rates and the assessment of generated traffic
transport service patronage or facility users maximum user charges estimated from consumer surveys.
For each significant factor the following shall be listed:
the assumptions and estimates on which the evaluation has been based an upper and lower bound of the range of the estimate the resultant BCR at the upper and lower bound of each estimate.

Page 3–24
The NZ Transport Agency’s Economic evaluation manual (volume 2) First edition, Amendment 0 Effective from January 2010
3.13 Monitoring
Introduction Monitoring and analysis of activities as they are implemented in order to determine how well they are performing with regard to their intended objectives is particularly important for innovative solutions, such as TDM.
A number of performance indicators can be used to evaluate transport system quality and the effectiveness of a TDM programme. These may include both quantitative measures of mobility and access, and qualitative measures of user acceptance and satisfaction. In most cases, no single indicator is adequate, so a set of indicators that reflect various objectives and perspectives is used.
Travel behaviour change programmes
Chapter 5 of the Land Transport New Zealand/Energy Efficiency and Conservation Authority Travel behaviour change guidance handbook (2004) describes monitoring requirements for TBhC programmes, including the key indicators to be measured and the monitoring methodology. Monitoring results from TBhC programmes are only reliable when there is a sufficient population of people targeted by the programmes. Monitoring of individual activities is unlikely to produce robust results as populations of at least a thousand are required. Reliable reporting can be obtained of programmes where monitoring of multiple TBhC activities is aggregated together.
TDM performance indicators
The following performance indicators maybe suitable for monitoring the effectiveness of more general TDM programmes. These indicators can be defined for a particular time (such as peak hour) and geographic location (such as a particular destination, district or region):
Vehicle trips or peak period vehicle trips, the total number of private vehicles arriving at a destination.
Vehicle trip reduction, the number or percentage of private vehicles removed from traffic.
Vehicle kilometres of travel (VKT) reduced, the number of vehicle trips reduced times average trip length.
Mode split, the portion of travellers who use each transport mode. Mode shift, the number or portion of vehicle trips shifted to other modes. Awareness, the portion of potential users who are aware of a programme or
service. Participation, the number of people who respond to an outreach effort or
request to participate in a programme. Utilization, the number of people who use a service or alternative mode. Average vehicle occupancy (AVO), the number of people travelling in private
vehicles divided by the number of private vehicle trips. Average vehicle ridership (AVR), all person trips divided by the number of
private vehicle trips. This includes public transport users and walkers. Energy and emission reductions, these are calculated by multiplying VKT
reductions times average vehicle energy consumption and emission rates. Cost per unit of reduction, these measures of cost-effectiveness are calculated
by dividing programme costs by a unit of change. For example, the cost effectiveness of various TDM programmes could be compared based on cents per trip reduced, or tonnes of air pollution emission reductions.

Page 3–25
The NZ Transport Agency’s Economic evaluation manual (volume 2) First edition, Amendment 0 Effective from January 2010
3.14 Selecting the appropriate evaluation method
Introduction The NZTA has developed separate methods for evaluating the wide range of potential TDM activities
If the main component of the TDM activity is … Then …
a new transport service or facility or an improvement to an existing transport service or facility (other than for walking and cycling).
refer to chapters 5, 6 and 7 for the methodology.
new or improved walking or cycling facility. simplified procedures (SPs) are provided for freight transport services (SP8), new passenger transport services (SP9), and existing passenger transport services (SP10).
a TBhC programme (that may include passenger transport and infrastructure).
refer to chapter 8 for the methodology.
parking management measures. SP11 is available for the evaluation.
private sector financing and road tolling. refer to chapter 9 for the methodology.
Guidance for selecting the appropriate evaluation method
a combination of any of the above TDM strategies and/or a road infrastructure proposal(s).
SP12 is available for the evaluation.

Page 3–26
The NZ Transport Agency’s Economic evaluation manual (volume 2) First edition, Amendment 0 Effective from January 2010
3.15 References
1. Land Transport New Zealand/Energy Efficiency and Conservation Authority (2004) Travel behaviour change evaluation procedures – technical report.
2. Land Transport New Zealand/Energy Efficiency and Conservation Authority (2004) Travel behaviour change guidance handbook.
3. Ministry of Transport (2005) Surface transport costs and charges: main report.
4. Victoria Transport Policy Institute. Online TDM encyclopaedia. (www.vtpi.org/tdm/tdm12.htm).
5. US Department of Transportation, Federal Highway Administration. Toolbox for regional policy analysis. (www.fhwa.dot.gov/planning/toolbox/).

Page 4–1
The NZ Transport Agency’s Economic evaluation manual (volume 2) First edition, Amendment 0 Effective from January 2010
4.0 Demand estimates and modal share
4.1 Overview
4.1 Overview 4–1
4.2 Demand estimates 4–2
4.3 Forecasting the demand 4–4
4.4 Sensitivity testing of the demand estimates 4–6
4.5 Reporting of demand estimates 4–7
4.6 References 4–9
Introduction This chapter describes the methods to estimate how various types of changes to transport systems are likely to affect travel behaviour and therefore the demand for a mode, service or facility.
In this chapter Section Page

Page 4–2
The NZ Transport Agency’s Economic evaluation manual (volume 2) First edition, Amendment 0 Effective from January 2010
4.2 Demand estimates
Definition A demand estimate is a prediction of the future use of a transport facility, service or mode. Use can be influenced by the user charges, the attractiveness to users, and the availability and quality of alternative routes, services or modes.
Calculating the potential demand for a new or improved service or facility will generally be based on willingness to pay (WTP) values (derived from a stated preference (SP) survey) combined with data on current users, and existing and proposed user charges.
In some cases, it will be possible to calculate the demand based on international or New Zealand experience, including use of validated models.
Elasticity and cross-elasticity
Economists measure changes in consumption (use) using elasticities defined as the percentage change in consumption of a ‘good’ caused by a one percent changein its price or other characteristic (such as traffic speed or comfort).
For example, an elasticity of –0.5 for vehicle use with respect to vehicle operating costs means that each one percent increase in these costs results in a 0.5 percent reduction in vehicle distance or trips. Similarly, public transport elasticity is defined as the percentage change in patronage resulting from each one percent change in transport service, such as bus kilometres or frequency. A negative sign indicates that the effect operates in the opposite direction from the cause (eg an increase in price causes a reduction in travel).
Cross-elasticities refer to the percentage change in the consumption of a good resulting from a price change in another, related good. For example, an increase in the cost of driving tends to reduce demand for parking and increase demand for public transport travel.
Transport elasticities tend to increase over time as consumers have more opportunities to take prices into account when making long-term decisions. For example, if consumers anticipate low private vehicle use prices they are more likely to choose a private vehicle dependent suburban home, but if they anticipate significant increases in driving costs they might place a greater premium on havingalternatives, such as access to public transport and shops within convenient walking distance. These long-term decisions, in turn, affect the options that are available. It may take many years for the full effect of a price change to be felt. Long-run travel demand elasticities are typically two to three times short-run elasticities.
Appendix A15 provides some elasticity and cross elasticity values that may be used for freight or passenger transport services. Reference 1 provides a database of values for a wide range of situations.
Nature of demand The demand for a new or improved service or facility depends on several factors:
current or ‘base’ average user charge the nature of the change in service the WTP of existing users for the service change the responsiveness of demand to changes in user charges (the user charge
elasticity) or another journey attribute (eg in vehicle or walking time).

Page 4–3
The NZ Transport Agency’s Economic evaluation manual (volume 2) First edition, Amendment 0 Effective from January 2010
4.2 Demand estimates continued
Factors affecting price elasticities
The following factors can affect how much a change in prices impacts travel activity.
Type of price change. Vehicle purchase and registration fees can affect the number and type of vehicles purchased. Fuel prices and emission fees affect the type of vehicle used. A road toll may shift some trips to other routes and destinations. Congestion pricing may shift travel times as well as changing mode and the total number of trips that occur. Residential parking fees are likely to affect vehicle ownership. A time-variable parking fee can affect when trips occur.
Type of trip and traveller. Commute trips tend to be less sensitive than shopping or recreational trips. Weekday trips may have very different elasticities than weekend trips. Urban peak period trips tend to be price insensitive because congestion discourages lower value trips. Travellers with higher incomes tend to be less price sensitive than lower income travellers. Business travellers tend to be less price sensitive than those travelling for personal activities.
Quality and price of alternative routes, modes and destinations. Price sensitivity tends to increase if alternative routes, modes and destinations are good quality and affordable.
Scale and scope of pricing, in general narrowly defined transport (eg peak period travel on a particular road) is more sensitive than more broadly defined transport (eg total personal travel), because consumers have more alternativesin the narrowly defined case.
Modal share The mode share is a function of the difference in generalised costs between the modes. The relationship can be used in reverse to determine the change in generalised cost difference that is required to achieve an observed change in mode share.
Because mode share relationships are calibrated to actual behaviour, the generalised cost difference can be equated to the perceived benefit associated with a given change in mode share. Strategic transportation planning models contain such mode share relationships.
Rules Demand estimates must be completed for all TDM economic evaluations.
Proposed activities for new transport services or for major improvements to an existing service, and any activities entailing a subsidy or price change, may require a specially commissioned study to assess WTP and elasticity of demand.
For small alterations to existing services or where the required amount of financial assistance is small, the demand estimates may be produced using WTP values drawn from other comparable services.

Page 4–4
The NZ Transport Agency’s Economic evaluation manual (volume 2) First edition, Amendment 0 Effective from January 2010
4.3 Forecasting the demand
Introduction There are two distinct procedures for forecasting the demand for transport services or facilities, depending on whether the proposed activity is for a new service or facility or an improvement to an existing service or facility.
Note: The estimated future demand for the do-minimum and each option, including the proposal, must be calculated. Section 8.15 can be used to assess demand for a cycle facility when traffic counts have not been carried out in the area.
Procedure for new service or facility
Where a new transport service or facility is proposed, the evaluator could undertake a consumer preference survey and develop a demand estimate using a methodology appropriate to the proposed service or facility.
The basis of the survey and demand estimate and any underlying assumptions, particularly those related to traffic growth rates, shall be clearly stated in the evaluation report.
Forecasting demand for improvements to transport services or facilities involves the following:
Step Action
1 Estimate the WTP and elasticity of demand for the particular quality improvement to an existing service or facility:
If the activity is for a major improvement to an existing service or facility then a specially commissioned SP survey could be undertaken to assess WTP and the elasticity of demand.
If the activity is for a relatively small change to an existing service or facility then inference of the WTP for the specific service quality and its elasticity of demand may be drawn from other comparable services or facilities.
Note: Where information from a comparable service or facility is used, details of the comparison must be provided.
2 Identify the relevant elasticity and cross elasticity values for the user charges and service quality change, either from the SP survey or using values from other sources. Some values applicable to New Zealand are provided in appendix A15 and further information is provided in reference 1.
3 Calculate the demand for the service where there is an increase in the user charge:
Total number of new and existing users:
Qprice = [((P1- Pnew) / P1) x UCE x Q1] + Q1
Where:
Q1 = existing number of users.
P1 = existing average user charge.
Pnew = new average user charge.
UCE = user charge elasticity.
Procedure for improvement to service or facility

Page 4–5
The NZ Transport Agency’s Economic evaluation manual (volume 2) First edition, Amendment 0 Effective from January 2010
4.3 Forecasting the demand continued
Step Action
4 Calculate the demand for the service or facility based on the change in service quality:
Use the relevant elasticity value derived from the SP survey or from an alternative source.
Multiply the elasticity value by the number of new and existing users (Qprice) as calculated in step 3, to derive the total demand for the improved service (Qquality).
5 Determine the proportion of new users transferring from road and from other sources. Use cross-elasticity values for road to alternate services where available or use other sources (ie surveys). Appendix A15 and reference 1 may provide appropriate indicative values.
The diversion rates given in section 9.2 for workplace travel plans with passenger transport improvements may be applicable.
6 Test the results by varying the user charge levels and service quality elasticity for the impact on the demand. From this testing, a more complete demand curve can be derived.
Procedure for improvement to service or facility continued
7 Compare the results of the demand estimate with other similar services, where feasible, to ascertain that the estimate is credible.

Page 4–6
The NZ Transport Agency’s Economic evaluation manual (volume 2) First edition, Amendment 0 Effective from January 2010
4.4 Sensitivity testing of the demand estimates
Introduction The demand estimates will involve making assumptions and estimates, which may involve uncertainty or be subjective in nature. Assessments of the sensitivity of the demand estimates to critical assumptions shall be undertaken on the preferred option.
Required sensitivity tests
There are two sensitivity tests that should be performed on the demand estimates:
Differing levels of user charges. Estimated user demand levels, including growth rates, and the assessment of
diverted road trips and generated demand.
Each of these is described below.
User charges Some testing on the effect of varying user charges on the demand for the proposed service and on service provider revenues must be done in developing the demand forecast.
The final evaluation must report the user charge levels that:
maximise the service provider’s revenue from user charges produce the highest economic return as indicated by the benefit cost ratio
(BCR) maximise welfare (the fare level at which the present value (PV) of road traffic
reduction benefits plus passenger transport user benefits minus costs is maximised).
The evaluation must state any practical or institutional limits on user charges.
Demand levels If significant changes in user charges are envisaged in the proposal, the use of a constant elasticity could result in gross errors. Where significant changes in user charges are envisaged, the elasticity values should be varied and the effect on user demand, the funding gap, the activity benefits and the BCR reported.
In addition, upper and lower bounds of the estimated growth rates for the service should be established and the effect of these on user demand, the funding gap, the activity benefits and the BCR reported.

Page 4–7
The NZ Transport Agency’s Economic evaluation manual (volume 2) First edition, Amendment 0 Effective from January 2010
4.5 Reporting of estimates
Introduction Regardless of what methodology is undertaken to complete a demand forecast, there are several pieces of information that must be derived, and reported in the evaluator’s report, in order to be able to complete the evaluation procedures described in this manual. Each of these is described below.
Assumptions Any assumptions made, particularly regarding future traffic and growth rates, must be clearly stated.
Peak period Reporting of service use, road use and road trips is limited to the peak period. The peak period appropriate to the particular activity shall be defined and justified
Except for freight services, in most cases new or improved transport services will be limited to the peak periods. Where a new or improved passenger transport service includes an off-peak component (such as accident reduction benefits) this shall be fully explained and justified in the evaluation.
Transport service or facility usage
The following data about the users of the service or facility is required:
In the case of an existing service or facility:
– the base or existing number of users
– the one-off change in users as a result of implementing the proposal
– the current trend for number of users. In the case of a new service or facility:
– the projected number of users
– the predicted future trend of use after the initial change or introduction of the new service or facility.
The source(s) of new users of a service or facility:
– transferred from other modes
– transferred from private vehicles as either drivers or passengers
– newly generated trips.
Road trips Where there is an existing road or road network that will be affected by the improvement or implementation of a service or facility, the following data shall be presented:
the existing number of road trips (by vehicle type where relevant) the change in number of road trips (by vehicle type where relevant) the new level of road trips following the implementation of the improved or
new service or facility.
This information may be presented as actual number of road trips, total number of vehicle kilometres and/or total number of vehicle minutes, depending on the nature of the proposal.
The number of private vehicles can be estimated from the average vehicle occupancy rates, while the number of buses may be determined by using the service schedule then dividing by the average loading.

Page 4–8
The NZ Transport Agency’s Economic evaluation manual (volume 2) First edition, Amendment 0 Effective from January 2010
4.5 Reporting of demand estimates continued
User charges In the case of improvements to an existing transport service, the following information is required:
the base (or existing) average user charge the proposed new user charge the maximum charge users would be WTP for the service improvement.
In the case of a new service, the information required is:
the proposed new user charge the maximum charge users would be WTP for the new service.
For the purposes of this manual, the maximum user charge is considered to be that price above which no one would use the service under consideration.

Page 4–9
The NZ Transport Agency’s Economic evaluation manual (volume 2) First edition, Amendment 0 Effective from January 2010
4.6 References
1. Bureau of transport and regional economics. BTRE transport elasticities database online. Canberra. (dynamic.dotars.gov.au/bte/tedb/index.cfm).
2. TRL Limited (2004) The demand for public transport: a practical guide. TRL report TRL593.
3. Wallis I, Booz Allen and Hamilton (2004) Review of passenger transport demand elasticities. Transfund New Zealand research report 248.


Page 5–1
The NZ Transport Agency’s Economic evaluation manual (volume 2) First edition, Amendment 0 Effective from January 2010
5.0 Evaluation of transport services
5.1 Overview
5.1 Overview 5–1
5.2 Method of evaluation 5–2
5.3 Impacts considered 5–3
5.4 Stages in analysis 5–4
5.5 Do-minimum 5–5
5.6 Benefits and costs 5–6
5.7 Period of analysis 5–7
5.8 Cost benefit analysis 5–8
5.9 Alternatives and options 5–10
5.10 Sensitivity analysis 5–11
5.11 Additional information required if simplified procedures are used 5–12
Introduction This chapter provides methods for economic efficiency evaluation of transport services for both freight and passengers.
Note: The simplified procedures SP8, SP9 and SP10 in chapter 13 can be used for freight and passenger transport services where appropriate.
In this chapter Section Page

Page 5–2
The NZ Transport Agency’s Economic evaluation manual (volume 2) First edition, Amendment 0 Effective from January 2010
5.2 Method of evaluation
Consumer surplus basis
Consumer surplus methodology (refer to section 3.2) is used to monetise the transport service user benefits of changes in price as well as non-price impacts (such as journey time, reliability, frequency, and comfort) of a transport service.
For reduced journey time, improved frequency of services and interchange reductions, transport service user time savings are based on the standard values of vehicle occupant time (VOT) given in appendix A4 of the NZ Transport Agency’s (NZTA) Economic evaluation manual volume 1 (EEM1). For this purpose, waiting time is valued at two times the value of VOT. The values in appendix A4 applicable to most transport service users are those for non-work travel purposes (including commuting to and from work). These standard values are derived willingness to pay (WTP) values, ie they are based on consumer surplus methodology.
For other types of non-price transport service impacts (such as improvements to trip quality, comfort transport service user benefits are based on an equivalent change in fare that would be required to produce the same user response to that produced by the change in service quality. This consumer surplus based benefit, which assumes the demand curves are linear, is the same as that which would be derived if the full demand curves for a transport service were available.
Package involving transport services
If transport services are part of a wider package, then a composite evaluation is necessary. This may involve evaluating road infrastructure components using the procedures in EEM1 and the passenger transport components using relevant procedures in this volume, and aggregating the results. The procedure for evaluating the timing of package components in section 3.9 of EEM1 should be used for packages that include significant transport service improvements.

Page 5–3
The NZ Transport Agency’s Economic evaluation manual (volume 2) First edition, Amendment 0 Effective from January 2010
5.3 Impacts considered
Impacts Impacts included in the economic efficiency evaluation of transport service activities are:
Impact Section
Costs:
service provider costs
funding assistance
road maintenance, renewal and construction cost savings
road user charges (RUC) foregone (for freight transport only).
6.2
7.7
7.7
7.7
Benefits:
transport service user benefits
road traffic reduction benefits (vehicle operating cost (VOC) savings, travel time cost savings, CO2 reduction and accident cost savings)
disbenefits during implementation/construction
other monetised and non-monetised impacts
national strategic factors.
7.2
7.3 and 7.4
7.5
7.6
7.6
Travel time delays, and disruption during implementation/construction are considered as negative benefits.
Rule The economic efficiency evaluation of transport services should concentrate on transport benefits. Any downstream benefits that are financial transfers, such as the impact on business and retail profitability, and property prices (other than where the change in property price is used as a proxy to value an impact) must not be included in the economic efficiency calculation.
Business benefits It is not normally necessary, or relevant, to try to identify business benefits for transport service activities. Benefits to businesses are economic transfers rather than national economic benefits and are therefore not included in economic efficiency calculations.
Equity impacts Equity impacts of transport service activities should be quantified wherever possible and reported as part of the evaluation (separately from the economic efficiency calculation) – see section 3.3.

Page 5–4
The NZ Transport Agency’s Economic evaluation manual (volume 2) First edition, Amendment 0 Effective from January 2010
5.4 Stages in analysis
Introduction At every stage of the economic efficiency evaluation, the analysis is carried out for the transport service proposal, the do-minimum and any other options.
Stage Description See
1 Complete the activity description including a description of the do-minimum, alternatives and options.
EEM1, section 5.2
2 Forecast the demand.
Note: The demand estimate is used for calculating fare charges, revenue, user benefits for new and existing transport service users, and road traffic reduction benefits. Care should be taken to ensure assumptions are compatible with economic evaluation requirements.
Chapter 4
3 Determine service provider cost, service provider revenue and the funding gap.
Chapter 6
4 Calculate the annual net cost to government, incorporating:
the funding assistance the local and central government road construction cost savings for freight services only, the road maintenance and renewal cost savings
and RUC foregone.
Section 7.7
5 Calculate the annual transport service user benefits for existing (where there is a pre-existing service) and new transport services.
Section 7.2
6 Calculate the road traffic reduction benefits on an annual basis, including disbenefits during implementation/construction.
Sections 7.3, 7.4 and 7.5
7 Calculate other national economic benefits and disbenefits that have monetary values.
Section 7.6
8 Describe, and quantify where possible, any significant non-monetised effects.
Section 7.6
9 List any national strategic factors relevant to the preferred option. If possible determine the monetary value(s) of any national strategic factors.
Section 7.6
10 Describe equity impacts (particularly those relating to transport disadvantaged) and any other significant effects not covered in stages 5 to 9.
Section 3.3
11 Discount the annual service provider cost, service provider revenue, funding assistance, road construction cost savings, and (for freight services only) the road maintenance and renewal cost savings and RUC foregone over the period of analysis to obtain the present value (PV) of these costs.
Section 7.8
12 Discount the annual monetised benefits (stages 5 to 7) over the period of analysis and sum them to obtain the PV of national economic benefits.
Section 7.8
13 Where options being evaluated are mutually exclusive, use incremental analysis to select the preferred option.
EEM1, section 3
14 Determine the national benefit cost ratio (BCRN) and the government benefit cost ratio (BCRG).
Section 7.8
Stages
15 Perform sensitivity tests on the preferred option. Chapters 4, 5 and 6

Page 5–5
The NZ Transport Agency’s Economic evaluation manual (volume 2) First edition, Amendment 0 Effective from January 2010
5.5 Do-minimum
Definition The do-minimum for evaluation of transport services is usually considered as a continuation of the present transport networks, service levels and the existing road network in the study area.
The do-minimum must include any costs and resulting demand implications of committed road or transport service improvements. All committed investment plans that relate to the do-minimum during the analysis period must be taken into account. Maintenance, renewal/replacement schedules and any planned transport service changes must also be included. Improvements are committed if they have been evaluated in accordance with the NZTA’s evaluation procedures and have been approved for funding.
Any investment plans that are not committed must be included in the evaluation as options.
Any changes to the road system that are committed must be included in the do-minimum.
Scope of do-minimum It is extremely important to:
not overstate the scope of the do-minimum only include, as part of the do-minimum, work that will preserve a minimum
acceptable level of service. In some cases, particularly with respect to the road network, the do-minimum service level may be less than the existing level of service.

Page 5–6
The NZ Transport Agency’s Economic evaluation manual (volume 2) First edition, Amendment 0 Effective from January 2010
5.6 Benefits and costs
Methodology Detailed methodology for calculating benefits and costs of transport services is set out in chapter 7.

Page 5–7
The NZ Transport Agency’s Economic evaluation manual (volume 2) First edition, Amendment 0 Effective from January 2010
5.7 Period of analysis
Length of analysis period may be shorter
The period of analysis for infrastructure activities is usually 30 years from the start of construction.
The period of analysis for freight or passenger transport services with or without infrastructure must take account of the potential for change in the service. An analysis period of 15 years is normally appropriate.

Page 5–8
The NZ Transport Agency’s Economic evaluation manual (volume 2) First edition, Amendment 0 Effective from January 2010
5.8 Cost benefit analysis
Introduction Unlike the vast majority of road infrastructure activities, passenger and freight transport activities will usually involve a private operator providing a service and receiving revenue directly from users.
In this situation, it is necessary to calculate both:
the BCRN as described in section 2.9 of EEM1, and the BCRG as described in section 2.9 of EEM1.
The BCRN for a passenger transport service is:
PV of national economic benefits
National benefit cost ratio for passenger transport services
BCRN = PV of national economic costs
National economic benefits = net transport service user benefits plus net road traffic reduction benefits plus other net monetised benefits minus disbenefits during implementation/ construction.
National economic costs = service provider costs minus road construction cost savings.
The BCRN for a freight service is:
PV of national economic benefits
National benefit cost ratio for freight services
BCRN = PV of national economic costs
National economic benefits = net transport service user benefits (where applicable) plus net road traffic reduction benefits plus other net monetised benefits minus disbenefits during implementation/construction.
National economic costs = service provider costs minus road maintenance, renewal and construction cost savings.

Page 5–9
The NZ Transport Agency’s Economic evaluation manual (volume 2) First edition, Amendment 0 Effective from January 2010
5.8 Cost benefit analysis continued
The BCRG for a passenger transport service is:
PV of national economic benefits
Government benefit cost ratio for passenger transport services
BCRG = PV of net cost to government
National economic benefits = net transport service user benefits plus net road traffic reduction benefits plus other net monetised benefits minus disbenefits during implementation/ construction.
Net cost to government = funding assistance – road construction cost savings.
The BCRG for a freight service is:
PV of national economic benefits
Government benefit cost ratio for freight services
BCRG = PV of net cost to government
National economic benefits = net transport service user benefits (where applicable) plus net road traffic reduction benefits plus other net monetised benefits minus disbenefits during implementation/construction.
Net cost to government = funding assistance minus road maintenance, renewal and construction cost savings plus road RUC foregone.
Application to passenger transport services
Generally, the benefits of passenger transport services are limited to the additional peak period services that remove commuters from private vehicles. Thus the cost of the service should only include the capital costs and the maintenance and operating costs of providing the additional peak period passenger transport services where there are road traffic reduction benefits.
There may be cases where a new or improved passenger transport activity includes an off-peak component. The off-peak component should be evaluated and reported along with an explanation clarifying the reasons for its inclusion and any assumptions in the evaluation.

Page 5–10
The NZ Transport Agency’s Economic evaluation manual (volume 2) First edition, Amendment 0 Effective from January 2010
5.9 Alternatives and options
Introduction In most situations, there is a variety of means (alternatives) of achieving the objective that a transport services activity seeks to address.
Options may include different configurations of the proposal, different fare and service levels and possibly different modes.
Rules Where feasible alternatives to the activity exist, they must be described and included in the evaluation.
Where appropriate, different service levels shall be evaluated as options.
All transport service evaluations shall consider the status quo road or road network, as appropriate, and any practical road improvement activities as alternatives or part of options. The status quo road or road network will normally be part of the do minimum.
Where there is no existing road, a proposed road activity may be considered as an alternative.
All investment plans and proposed service changes that relate to the alternatives and options during the period of analysis shall be taken into account.
Number of options All realistic options shall be evaluated to determine the optimum economic solution.
Incremental analysis The incremental analysis process for evaluation of options for transport services activities is the same as the incremental benefit cost ratio (BCR) process described in section 2.10 of EEM1, with the exception that the components described in this volume are used in the calculation.
The incremental analysis should be presented on an adapted copy of worksheet 5 in EEM1.
All impacts (positive and negative) for which monetary values have been estimated should be included in the total benefits of the options when undertaking incremental analysis.
Target incremental BCR
The target incremental BCR when undertaking incremental analysis of transport services options shall be as specified in appendix A12 in EEM1.

Page 5–11
The NZ Transport Agency’s Economic evaluation manual (volume 2) First edition, Amendment 0 Effective from January 2010
5.10 Sensitivity analysis
Possible significant factors
Inputs to transport service activity evaluations that should be considered for sensitivity testing include:
demand estimates (refer to chapter 4) funding gap (refer to chapter 6) major contributors to benefits commencement of the proposal.
Major contributors to benefits
Road traffic reduction benefits critical to the outcome of the evaluation may include:
traffic volumes, particularly model results, growth rates and the assessment of diverted and generated traffic and transport service users
travel speeds accident reduction.
For each significant factor the following shall be listed:
the assumptions and estimates on which the evaluation has been based an upper and lower bound of the range of the estimate the resultant BCR at the upper and lower bound of each estimate.
Benefit cost ratio of delaying proposal
For the preferred activity option, calculate a revised BCR of delaying the activity for one year.
Incremental analysis The results of incremental analysis shall be sensitivity tested using an incremental BCR 1.0 higher than the target incremental BCR.
Results of sensitivity tests
The results of the sensitivity tests, along with explanation of any assumptions or choice of test, shall be reported in a format similar to worksheet 7 in EEM1.

Page 5–12
The NZ Transport Agency’s Economic evaluation manual (volume 2) First edition, Amendment 0 Effective from January 2010
5.11 Additional information required if simplified procedures are used
Introduction This section details the additional information to be included in an evaluation report on a transport services activity if the simplified procedures are used for activities with a PV funding gap greater than one million.
Demand estimates If the simplified procedures have been used for the evaluation, additional supporting information is to be provided on the demand estimates to comply with the requirements in section 4.5 for reporting of demand estimates.
Disbenefits during implementation/ construction
If the simplified procedures have been used for the evaluation, an addendum is to be included with an allowance for disbenefits during implementation/construction in accordance with section 7.5.
Transport service user benefits, road traffic reduction benefits and roading cost savings
If the simplified procedures have been used for the evaluation, additional supporting information is to be provided on the suitability of the assumptions for:
transport service user benefits in accordance with section 7.2 road traffic reduction benefits in accordance with sections 7.3 and 7.4 road cost savings in accordance with section 7.7.
This particularly applies to the basis for road maintenance and renewal cost savings. If necessary, an addendum should be provided to the relevant parts of the evaluation.
Fit with regional land transport strategy or transport plan
Describe how the activity fits with the relevant regional land transport strategy or transport plan (provide a diagram and refer to the relevant reports where possible).

Page 6–1
The NZ Transport Agency’s Economic evaluation manual (volume 2) First edition, Amendment 0 Effective from January 2010
6.0 Funding gap analysis of transport services
6.1 Overview
6.1 Overview 6–1
6.2 Service provider costs 6–2
6.3 Service provider revenue 6–5
6.4 Cash flow analysis 6–6
6.5 Funding gap 6–7
6.6 Sensitivity testing of the funding gap 6–9
Introduction In the case of transport service activities, service provider costs can be compared with the predicted revenue or increase in revenue (where there is a pre-existing service), using a net present value (NPV) methodology to determine whether or not the activity is viable in a financial sense.
In this chapter Section Page

Page 6–2
The NZ Transport Agency’s Economic evaluation manual (volume 2) First edition, Amendment 0 Effective from January 2010
6.2 Service provider costs
Basis Service provider costs are calculated either from industry standard unit costs or from cost estimates from service providers. The costs include maintenance and operating costs for the new or increased service.
If costs can be obtained, either from industry standard unit costs or other sources (eg service provider) then undertake a full analysis of service provider costs.
If the service provider will only disclose a ‘price’, net of user revenue, for providing the transport service then it can be assumed that the service provider costs are equal to the ‘price’ plus user revenue for use in the economic efficiency evaluation.
Rules Service provider costs must be calculated for the do-minimum and all activity options.
All costs should be presented both graphically and as a table, showing where the costs occur over the life of the proposal.
All costs must be exclusive of good and services tax (GST).
Indicative quotes Indicative quotes may be used when activity costs cannot be calculated, for example if service providers will not divulge costs.
Indicative quotes are most likely to be used when there is a sole service provider. An indicative quote should only be sought after user charges have been fully defined (see chapter 7). Care is required not to form a contract when seeking quotes.
Activity costs Activity costs include:
activity design and supervision costs capital costs disruption costs during construction/implementation operating and maintenance costs costs of decommissioning.
In some cases, costs may be offset by the salvage value of capital assets. Each of these costs is described below in more detail.
Capital costs Capital costs are split into two types:
physical infrastructure costs vehicle, vessel or rolling stock costs.

Page 6–3
The NZ Transport Agency’s Economic evaluation manual (volume 2) First edition, Amendment 0 Effective from January 2010
6.2 Service provider costs continued
Physical infrastructure costs
Physical infrastructure costs include:
land acquisition design construction environmental mitigation costs a contingency allowance for the total physical infrastructure costs.
In the case of the do-minimum, these costs may include essential rehabilitation.
Where expenditure on an activity has already been incurred, it must still be included in the evaluation if the item has a market value which can be realised. Land is an example.
Costs irrevocably committed which have no salvage or realisable value, are termed sunk costs and must not be included in the evaluation, eg investigation, research and design costs already incurred.
Vehicle, vessel or rolling stock costs
Include any capital costs relating to service vehicles or rolling stock. Include a contingency allowance for the total vehicle, vessel or rolling stock costs where the price is not absolutely fixed at the outset.
Disruption costs Include disruption costs to the service provider during construction/ implementation.
Disruption costs may include revenue loss, where services are disrupted to accommodate construction or cost increases such as providing alternative services during the construction period.
Operating and maintenance costs
Estimate operating and maintenance costs for the service over the analysis period.
Maintenance costs shall include routine and periodic maintenance costs as well as refurbishment and replacement costs occurring in the analysis period.
Treatment of depreciation
Depreciation is a non-cash item and shall not be included separately in the cash flows used in the financial analysis to estimate the NPV of a proposal. Only actual cash flows associated with maintenance and asset replacement, (which effectively fully account for depreciation of capital assets), are to be included in the analysis.
Treatment of interest Interest expenses associated with activity financing often represent an actual cash cost outflow. Despite this, interest charges should not be included in the annual cash flow as the required rate of return used in the cash flow analysis already takes account of debt-financing interest.
If interest payments were included in discounted cash flows, the interest charges would be double counted and the proposal’s funding gap would be overstated and the benefit cost ratio (BCR) understated.

Page 6–4
The NZ Transport Agency’s Economic evaluation manual (volume 2) First edition, Amendment 0 Effective from January 2010
6.2 Service provider costs continued
Salvage value of capital assets
In many instances, assets will have a longer life than the analysis period. Except in the case where a 30-year analysis period is used, the salvage value of capital assets should be evaluated where:
items have a market value there is an alternative use (for example, a bus can provide urban passenger
services or could be used for school services or tours, but a road can usually only be a road)
there is a scrap demand for items.
Any costs involved in decommissioning assets must be included in the evaluation.
Note: Salvage values are quite distinct from book values of assets.

Page 6–5
The NZ Transport Agency’s Economic evaluation manual (volume 2) First edition, Amendment 0 Effective from January 2010
6.3 Service provider revenue
Basis This section describes the revenue information to be included in a financial analysis where an activity generates revenue. The process for calculating revenue of an improved service is different from that for a new service. The processes are given below.
GST All revenue shall be exclusive of GST.
Where there is an existing passenger transport service, it is the increase in service provider revenue that is used in calculating the funding gap, as the funding assistance requested will be to facilitate the improved service rather than to fund the existing service.
Using the demand estimate information generated in chapter 4, calculate the change in service provider revenue:
Change in service provider revenue = (Qnew x Pnew) – (Q1 x P1)
Where:
P1 = base average user charge.
Pnew = proposed average user charge.
Q1 = current annual patronage.
Qnew = projected annual patronage.
Existing passenger transport services
For a new passenger transport service, the projected number of new users is multiplied by the proposed average user charge to give the expected annual service provider revenue from a new service.
Using the demand estimate information generated in chapter 4, calculate the annual service provider revenue.
Annual service provider revenue = (Qnew x Pnew)
Where:
Pnew = proposed average user charge.
Qnew = projected annual patronage.
New passenger transport services
Application for freight services
The above concepts for a passenger transport service apply to an improved or new freight transport service except that the projected new freight volume will be determined by the intended (or contracted) use by a limited number of freight consignors at a given or average freight rate (usually $ per tonne)

Page 6–6
The NZ Transport Agency’s Economic evaluation manual (volume 2) First edition, Amendment 0 Effective from January 2010
6.4 Cash flow analysis
Introduction A new or improved transport service will usually involve some initial capital expenditure and then ongoing annual operating and maintenance costs and annual revenue. Analysis of this cash flow is used to determine the financial viability of the proposed service.
For each year, the net cash flow is calculated as:
annual net cash flow = (revenue + funding gap) – (capital costs + operating and maintenance costs)
Net cash flow
Service provider required rate of return
The annual net cash flows are discounted at the service provider’s desired rate of return.
The weighted average cost of capital (WACC) can be used to estimate the service provider’s desired rate of return. WACC is the weighted average of the desired return on equity and the (interest) cost of any debt financing.
The service provider’s WACC should reflect the appropriate risk and norms associated with the industry.
Post-tax rate of return
Evaluators should use a post-tax rate of return. Care must be taken that service provider revenues and costs are calculated accordingly.
Period of financial analysis
The period of this financial analysis should, if possible, be sufficient to allow projected revenue to offset the initial capital cost but should not be unrealistically long taking account of uncertainties in demand for the proposed service.

Page 6–7
The NZ Transport Agency’s Economic evaluation manual (volume 2) First edition, Amendment 0 Effective from January 2010
6.5 Funding gap
Funding gap The funding gap is the deficit in cash flow that needs to be funded by local and central government if the activity is to be financially viable from the service provider’s point of view, based on the best estimate of service provider revenue and the service provider’s desired rate of return.
The funding gap can be defined in a number of different ways:
as a contribution to the capital cost of the activity (spread over the construction period or paid at the end of construction)
spread over the first few operating years of the proposal a combination of these.
Where the funding gap is zero or negative, the activity is commercially viable and no funding assistance should be required from government.
A positive funding gap does not mean that funding assistance is justified from the government (public policy) point of view.
Method The funding gap is determined by trying different values of funding gap until the sum of the PV of the annual net cash flows is zero. The simplest method of determining the value of the funding gap is to use a computer spreadsheet program, such as the ‘goal seek’ function in the Microsoft Excel.
Example calculation In this example of improvement(s) to an existing service, a 12 percent service provider’s required rate of return is used. Different activities may justify lower or higher rates of return.
The period of analysis for this particular activity is 15 years. The revenue flow is the increase or change, in revenue from the base case (pre-existing service levels). The revenue for a new service would be equivalent to the number of users multiplied by the proposed user charge.
The funding gap is included in the table as a payment spread over years 2 to 9 of the proposal.
Different values were inserted for the funding gap until the sum of the last column equalled zero.
As the funding gap is positive, the activity is not commercial and funding assistance is required to make it viable. The value of the funding gap is $1,064,809per year spread over years 2 to 9. The PV of the funding gap is $4,722,845, which does not change irrespective of how the funding gap is defined. However, this PV is at the service provider’s desired rate of return, not the discount rate used in economic evaluation.
The cumulative amount of the funding gap is $8,518,471. This depends on how the funding gap is defined. It is smallest when funding for the gap is provided all at the start of the proposal, eg $5,924,337 if all paid in year 2.

Page 6–8
The NZ Transport Agency’s Economic evaluation manual (volume 2) First edition, Amendment 0 Effective from January 2010
6.5 Funding gap continued
Year Capital cost O&M cost Revenue Funding gap
Annual total SPPWF Net PV
1 -$2,500,000 -$2,500,000 0.8929 -$2,232,143
2 -$2,500,000 -$484,600 $346,000 $1,064,809 -$1,573,791 0.7972 -$1,254,617
3 -$484,600 $356,380 $1,064,809 $936,589 0.7118 $666,645
4 -$484,600 $367,071 $1,064,809 $947,280 0.6355 $602,014
5 -$484,600 $378,084 $1,064,809 $958,292 0.5674 $543,761
6 -$484,600 $389,426 $1,064,809 $969,635 0.5066 $491,247
7 -$484,600 $401,109 $1,064,809 $981,318 0.4523 $443,898
8 -$484,600 $413,142 $1,064,809 $993,351 0.4039 $401,198
9 -$484,600 $425,536 $1,064,809 $1,005,745 0.3606 $362,682
10 -$484,600 $438,302 -$46,298 0.3220 -$14,907
11 -$484,600 $451,452 -$33,148 0.2875 -$9,529
12 -$484,600 $464,995 -$19,605 0.2567 -$5,032
13 -$484,600 $478,945 -$5,655 0.2292 -$1,296
14 -$484,600 $493,313 $8,713 0.2046 $1,783
15 -$484,600 $508,113 $23,513 0.1827 $4,296
16 -$484,600 $523,356 $38,756 0.1631 -
17 -$484,600 $539,057 $54,457 0.1456 -
18 -$484,600 $555,228 $70,628 0.1300 -
19 -$484,600 $571,885 $87,285 0.1161 -
20 -$484,600 $589,042 $104,442 0.1037 -
21 -$484,600 $606,713 $122,113 0.0926 -
Example calculation continued
22 -$484,600 $624,914 $140,314 0.0826 -
PV = $4,722,845 Sum of Net PV = $0

Page 6–9
The NZ Transport Agency’s Economic evaluation manual (volume 2) First edition, Amendment 0 Effective from January 2010
6.6 Sensitivity testing of the funding gap
Introduction The financial analysis will involve making assumptions and estimates, which may involve uncertainty or be subjective in nature. Assessments of the sensitivity of the funding gap to critical assumptions must be undertaken on the preferred activity option.
Required sensitivity tests
There are three sensitivity tests that should be performed on the funding gap analysis:
varying the service provider’s required rate of return varying the timing of capital expenditure varying the length of the analysis period.
Each of these is described below.
Service provider required rate of return
An upper and lower bound of the service provider’s required rate of return shall be indicated along with its effect on the PV of the funding gap of the proposal.
Timing of capital expenditure
Where significant capital expenditure is a feature of the proposal, sensitivity testing shall include the effect on the PV of the funding gap of varying the timing of such expenditure.
Period of analysis The effect of varying the length of the period of analysis on the PV of the funding gap shall be presented.


Page 7-1
The NZ Transport Agency’s Economic evaluation manual (volume 2) First edition, Amendment 0 Effective from January 2010
7.0 Benefits and costs of transport services
7.1 Overview
7.1 Overview 7-1
7.2 Transport service user benefits 7-3
7.3 Road traffic reduction benefits 7-14
7.4 Accident cost savings 7-18
7.5 Disbenefits during implementation/construction 7-21
7.6 Disbenefits during implementation/construction 7-22
7.7 Costs to government 7-23
7.8 Present value of benefits and costs 7-25
7.9 Reporting of benefits and costs 7-28
7.10 Feasibility evaluation of freight transport proposals 7-29
7.11 References 7-32
Introduction This chapter provides the detailed methods for calculating and reporting the benefits and costs of transport service activities
In this chapter Section Page

Page 7-2
The NZ Transport Agency’s Economic evaluation manual (volume 2) First edition, Amendment 0 Effective from January 2010
7.1 Overview continued
Benefits Transport service activities will generally provide:
benefits to new and existing transport service users road traffic reduction benefits (vehicle operating cost (VOC) savings, travel
time cost savings, accident cost savings and reduced CO2) increased consumer travel options other monetised and non-monetised benefits, including reduced environmental
impacts benefits from the point of view of national strategic factors.
Where road capacity is reduced, some of the above may become disbenefits.
In some cases transport service activities will cause disbenefits to road users and the community during implementation/construction.
Double counting Care must be taken not to double count benefits or disbenefits.
Examples:
‘Increased passenger transport patronage’ double counts passenger transport user benefits and road traffic reduction benefits.
‘Saved energy’ benefits are captured in road traffic reduction benefits (vehicle operating costs savings).
‘Discouraging vehicle use in peak periods’ may be mostly captured in road traffic reduction benefits.
‘Economies of scale’ benefits are mostly captured in transport service user benefits and increased consumer travel options.
If road improvements (eg median barriers to be installed) are included in the do-minimum activity costs, then the road traffic reduction benefits of the road improvements shall not be claimed as benefits in the transport service options.
Inter-relationship of user benefits
Evaluators should be aware that where a transport service activity uses road capacity (ie road-based passenger transport services, use of a lane for buses or high occupancy vehicle lanes, etc), the transport service user travel time benefits will be inter-related with road traffic reduction travel time benefits. It may be desirable to evaluate these effects together using a modelling exercise.
Where the transport service user benefits and road traffic reduction benefits are calculated separately, care should be taken not to double count the benefits of an activity for transport service users.

Page 7-3
The NZ Transport Agency’s Economic evaluation manual (volume 2) First edition, Amendment 0 Effective from January 2010
7.2 Transport service user benefits
Introduction Transport service users and potential users may be affected by the following factors:
user charge levels (eg passenger transport fares and freight rates) travel time (eg service frequency, total trip time, interchange time) quality of service (eg reliability, comfort, damage) additional user costs (eg rehandling, inventory costs).
The purpose of this section is to calculate the net transport service user benefits and disbenefits of a transport service proposal, where there is a change in the user charge, the trip time, the quality of service or other user costs.
Transport service user definitions
For the purpose of this analysis, transport service users are both people being moved, and people who are paying for freight to be moved.
Users of a new transport service include those who have transferred from other modes and those who are completely new users (generated trips).
The calculation of net benefits for users of a new transport service can be based on the difference between the proposed and the maximum user charge (at which no one would use the service). The result is then divided in half, based on the rule of half. This approach is most applicable to a new passenger transport service.
Calculate net user benefits for users of a new transport service using the procedure in section 4.3 to determine the projected number of new service users.
Net user benefits = (Pmax - Pnew) × Qnew × ½
User benefits for new transport service
Where:
Pnew = proposed user charge.
Pmax = maximum user charge.
Qnew = projected number of new service users or volume of freight.
User benefits for existing transport service
The quantitative analysis of net transport service user benefits for a change in service is conducted by separating the transport service users into two categories:
existing users new users.
Where an existing service is being improved, existing users receive the full benefit of the improvement, while new users are considered to receive one half of the existing user’s benefit. See section 3.2 for further explanation.
Where existing transport service users may be adversely affected by disruptions during construction and/or the change in demand for the service, these disbenefits should be taken into account in the analysis.
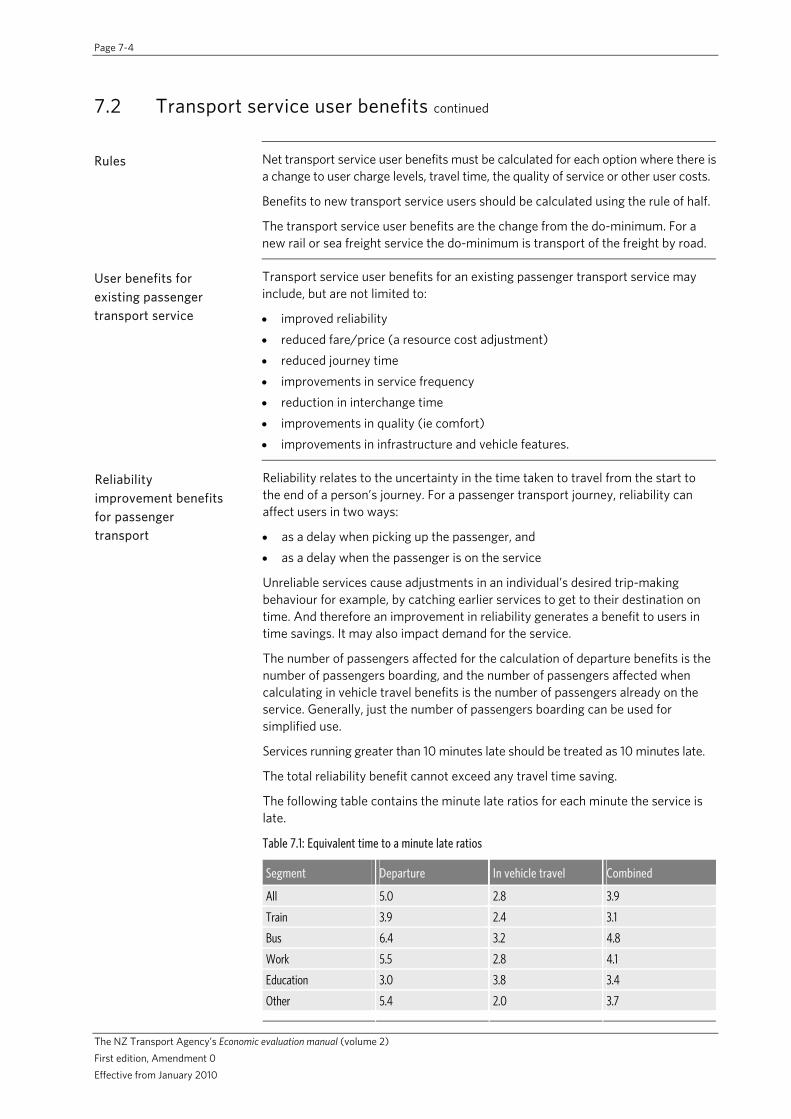
Page 7-4
The NZ Transport Agency’s Economic evaluation manual (volume 2) First edition, Amendment 0 Effective from January 2010
7.2 Transport service user benefits continued
Rules Net transport service user benefits must be calculated for each option where there is a change to user charge levels, travel time, the quality of service or other user costs.
Benefits to new transport service users should be calculated using the rule of half.
The transport service user benefits are the change from the do-minimum. For a new rail or sea freight service the do-minimum is transport of the freight by road.
User benefits for existing passenger transport service
Transport service user benefits for an existing passenger transport service may include, but are not limited to:
improved reliability reduced fare/price (a resource cost adjustment) reduced journey time improvements in service frequency reduction in interchange time improvements in quality (ie comfort) improvements in infrastructure and vehicle features.
Reliability relates to the uncertainty in the time taken to travel from the start to the end of a person’s journey. For a passenger transport journey, reliability can affect users in two ways:
as a delay when picking up the passenger, and as a delay when the passenger is on the service
Unreliable services cause adjustments in an individual’s desired trip-making behaviour for example, by catching earlier services to get to their destination on time. And therefore an improvement in reliability generates a benefit to users in time savings. It may also impact demand for the service.
The number of passengers affected for the calculation of departure benefits is the number of passengers boarding, and the number of passengers affected when calculating in vehicle travel benefits is the number of passengers already on the service. Generally, just the number of passengers boarding can be used for simplified use.
Services running greater than 10 minutes late should be treated as 10 minutes late.
The total reliability benefit cannot exceed any travel time saving.
The following table contains the minute late ratios for each minute the service is late.
Table 7.1: Equivalent time to a minute late ratios
Segment Departure In vehicle travel Combined
All 5.0 2.8 3.9
Train 3.9 2.4 3.1
Bus 6.4 3.2 4.8
Work 5.5 2.8 4.1
Education 3.0 3.8 3.4
Other 5.4 2.0 3.7
Reliability improvement benefits for passenger transport

Page 7-5
The NZ Transport Agency’s Economic evaluation manual (volume 2) First edition, Amendment 0 Effective from January 2010
7.2 Transport service user benefits continued
Note:
The combined value assumes a 50:50 split between departure and in vehicle time delay en route
Calculate the user reliability benefits using the formula below:
Reliability benefit = EL × (VTT($/h)/60) × AML × NPT
Where:
EL = equivalent time to a minute late ratio from table 7.1.
VTT = vehicle travel time ($/h) from the NZTA’s Economic evaluation manual volume 1 (EEM1) section A4.2.
AML = reduction in average minutes late (minutes).
NPT = number of passengers affected.
Reliability improvement benefits for passenger transport continued
The calculation of transport service user benefits for a price change on an existing service is based on the difference between the existing average user charge and the proposed average user charge.
Calculate the price change transport service user benefits using the information in chapter 4 to give the projected new patronage level, as follows:
Change in net total benefits for existing transport service users:
Bpexisting = (P1 – Pnew) × Q1
Net total benefits for new transport service users:
Bpnew = (P1 – Pnew) × (Qnew - Q1) × ½ (rule of half)
Total price change benefits:
Bptotal = Bpexisting + Bpnew
Where:
Pnew = proposed average user charge.
P1 = existing average user charge.
Q1 = existing number of passengers (patronage).
Qnew = projected new number of passengers.
Price change benefits for passenger transport

Page 7-6
The NZ Transport Agency’s Economic evaluation manual (volume 2) First edition, Amendment 0 Effective from January 2010
7.2 Transport service user benefits continued
Increased service frequency may also be described as decreased waiting time, headway reduction, or less queuing time. The benefit of the headway reduction depends on the existing frequency of the service.
Calculate the service frequency transport service user benefits using the information in chapter 4 to give the projected new patronage level, as follows:
Frequency benefit per transport service user:
FB = WTf 2 VOT
Change in net total benefits for existing transport service users:
Bfexisting = FB Q1
Apply the rule of half for the total benefits for new transport service users:
Bfnew = FB (Qnew Q1) ½
Total service frequency benefits:
Bftotal = Bfexisting + Bfnew
Where:
Q1 = existing number of passengers (patronage).
Qnew = projected new number of passengers.
WTf = wait time benefit (in minutes) from table 7.2.
VOT = value of vehicle occupant time ($/minute) for transport service users (by trip purpose) from table A4.1 in appendix A4 (EEM1).
Increased service frequency benefits for passenger transport
Using the existing headway/service frequency (minutes), and the appropriate trip purpose from the table below, identify the benefit in minutes of wait time for improving service frequency. If the proposed new headway/service frequency is significantly less than the existing (ie 20 minutes compared with 40 minutes) an average of the wait time benefit for the two frequencies should be used.
Table 7.2: Increased service frequency benefit
Wait time benefit (minutes) Existing headway (minutes)
Commute Other Combined
5.0 2.4 3.2 2.5
10.0 3.3 4.0 3.3
15.0 4.1 4.8 4.2
20.0 5.0 5.6 5.1
30.0 6.6 7.2 6.8
45.0 9.8 10.6 10.1
60.0 11.7 12.3 11.9

Page 7-7
The NZ Transport Agency’s Economic evaluation manual (volume 2) First edition, Amendment 0 Effective from January 2010
7.2 Transport service user benefits continued
In addition to the wait and/or walk time to transfer time that applies to service frequency benefits, there is a five minute IVT ‘interchange penalty’.
Calculate the interchange reduction transport service user benefits for passenger transport using the information in chapter 4 to give the projected new patronage level, as follows:
Interchange reduction benefit per passenger transport service user:
IB = (WTi × 2 + 5) × VOT
Change in net total benefits for existing passenger transport service users:
Biexisting = IB × Q1
Apply the rule of half for the total benefits for new passenger transport service users:
Binew = IB × (Qnew - Q1) × ½
Total interchange reduction benefits:
Bitotal = Biexisting + Binew
Where:
Q1 = existing number of passengers.
Qnew = projected new number of passengers.
WTi = existing wait and/or walking time to transfer between passenger transport services (minutes).
VOT = value of vehicle occupant time ($/minute) for passenger transport service users (by trip purpose) from table A4.1 in appendix A4 (EEM1).
Interchange reduction benefits for passenger transport
The value of passenger transport service user benefits (other than fare change benefits, increased service frequency benefits and interchange reduction benefits), eg improved comfort, is usually based on a willingness to pay (WTP) value derived from a stated preference (SP) survey or on values derived for similar service improvements in other areas.
Calculate the other transport service user benefits using the information in chapter 4 to give the projected new patronage level, as follows:
Change in net total benefits for existing transport service users:
Boexisting = (Pmax – Pnew) × Q1
Apply the rule of half for the total benefits for new transport service users:
Bonew = (Pmax – Pnew) × (Qnew - Q1) × ½
Total other benefits:
Bototal = Boexisting + Bonew
Where:
Pnew = proposed average user charge (this may be different from the existing user charge).
Pmax = maximum charge users are WTP for improved service.
Q1 = existing number of passengers.
Qnew = projected new number of passengers.
Other passenger transport service user benefits

Page 7-8
The NZ Transport Agency’s Economic evaluation manual (volume 2) First edition, Amendment 0 Effective from January 2010
7.2 Transport service user benefits continued
Infrastructure and vehicle features for passenger transport
Users value infrastructure and vehicle features. Typical user valuations expressed in terms of in vehicle time are provided in tables 7.3, 7.4 and 7.5. These may be converted to generalised costs by multiplying by the value of time given in section A4.2 of EEM1. All values represent the difference between the do-minimum and an improvement. These values have been drawn from SP surveys and are the perceived benefits of a individual feature.
Table 7.3: Vehicle feature values for rail passenger transport services
Rail
Attribute Sub-attribute Valuation (IVT minutes)
Comment
Train attendant 1.6 Driver/staff
Ride 1.2 Quiet and smooth.
CCTV 2.0 Facilities
Onboard toilets 0.6
Information Interior 1.1 Frequent and audible train announcements.
Comfortable 1.5
Layout 0.7 Facing travel direction.
Seating
Maintained 1.5 Clean and well maintained.
Comfort Ventilation 1.5 Air conditioning
Table 7.4: Vehicle feature values for bus services
Bus
Attribute Sub-attribute Valuation (IVT minutes)
Comment
No steps 0.1 Difference between two steps up and no steps. Boarding No show pass 0.1 Two stream boarding, no show pass relative to
single file past driver.
Attitude 0.4 Very polite, helpful, cheerful, well presented compared with businesslike and not very helpful.
Driver
Ride 0.6 Very smooth ride (no jerkiness) compared with jerky ride causing anxiety and irritation.
Litter 0.4 No litter compared with lots of litter.
Windows 0.3 Clean windows with no etchings compared with dirty windows and etchings.
Graffiti 0.2 No graffiti compared to lots of graffiti.
Exterior 0.1 Very clean everywhere compared with some very dirty areas.
Cleanliness
Interior 0.3 Very clean everywhere compared with some very dirty areas.
Vehicle features

Page 7-9
The NZ Transport Agency’s Economic evaluation manual (volume 2) First edition, Amendment 0 Effective from January 2010
7.2 Transport service user benefits continued
Table 7.4: Vehicle feature values for bus services continued
Bus
Attribute Sub-attribute Valuation (IVT minutes)
Comment
Clock 0.1 Clearly visible digital clock showing correct time compared with no clock.
Facilities
CCTV 0.7 CCTV, recorded, visible to driver, and driver panic alarm compared with no CCTV.
External 0.2 Large route number and destination front/side/rear, plus line diagram on side relative to small route number on front/side/rear.
Interior 0.2 Easy to read route number and diagram display compared with no information inside bus.
Information
Info of next stop
0.2 Electronic sign and announcements of next stop and interchange compared with no information next stop.
Type/layout 0.1 Individual-shaped seats with headrests, all seats facing forward compared with basic, double-bench seats with some facing backwards.
Seating
Tip-up 0.1 Tip-up seats in standing/wheelchair area compared with all standing area in central aisle.
Legroom 0.2 Space for small luggage compared with restricted legroom and no space for small luggage.
0.1 Push-opening windows giving more ventilation compared with slide opening windows giving less ventilation.
Comfort
Ventilation
1.0 Air conditioning.
Vehicle features continued
Table 7.5: Infrastructure features values
Bus
Attribute Sub-attribute Valuation (IVT minutes)
Comment
Condition 0.1 Excellent condition, looks like new compared with basic working order but parts worn and tatty.
Size 0.1 Double-sized shelters compared with single-sized.
Seating 0.1 Seats plus shelter versus no shelter and seats.
Cleanliness 0.1 Spotlessly clean compared with some dirty patches.
Litter 0.2 No litter compared with lots of litter.
Graffiti 0.1 No graffiti compared with lots of/offensive graffiti.
Stop/ shelter
Type 0.2 Glass cubicle giving good all-round protection compared with no shelter.
Infrastructure features for passenger transport

Page 7-10
The NZ Transport Agency’s Economic evaluation manual (volume 2) First edition, Amendment 0 Effective from January 2010
7.2 Transport service user benefits continued
Table 7.5: Infrastructure features values continued
Bus
Attribute Sub-attribute Valuation (IVT minutes)
Comment
Roadside machines
0.1 Pay by cash (change given), credit/debit card compared with pay by coins (no change given).
Availability of machines
0.2 At busiest stops compared with none.
Sale of one-day pass
0.1 Sale on bus, same price as elsewhere compared with no sale of one-day pass.
Cash fares 0.3 Cash fares on the bus, driver giving change compared with no cash fares on bus.
Ticketing
Two ticket transfer
2 × 1 ticket transfer
-
Security point 0.3 Two-way communication with staff compared with no security point.
CCTV 0.3 Recorded and monitored by staff if alarm raised compared with no CCTV.
Security
Lighting 0.1 Very brightly lit compared with reasonably well lit
Terminals 0.1 Screen with real-time information for all buses from that stop compared with current timetable and map for route
Maps 0.2 Small map showing local streets and key locations versus no small map.
Countdown signs/Real time information
0.8 Up to the minute arrival times/disruptions, plus audio compared with no countdown sign
Clock 0.1 Digital clock telling correct time compared with no clock.
Contact number
0.1 Free-phone number shown at stop compared with no number.
Location of payphones
0.1 One payphone attached to shelter compared with no payphone.
Information
Simple timetable
0.4 Simpler more user-friendly.
Stations Up to 3.0 Includes bright lighting, CCTV, cleaned frequently, customer service staff walking around at info desk, central electronic sign giving departure times, snack bar, cash-point, newsagent, landscaping, block paving and photo-booths.
Infrastructure features for passenger transport continued
Benefits from multiple features
Experience from other SP surveys indicates that the perceived benefits of multiple features are less than the sum of individual components. When multiple features are combined, the values should be divided by two to adjust for any overestimation.

Page 7-11
The NZ Transport Agency’s Economic evaluation manual (volume 2) First edition, Amendment 0 Effective from January 2010
7.2 Transport service user benefits continued
If there is a significant detrimental effect of the new level of demand on existing transport service users then the disbenefits to existing users should be subtracted from the total user benefits.
Possible negative effects of demand change on existing transport service users include:
the proportion of standing passengers is increased the probability of being left behind has increased.
Example: Assume that the probability of being left behind has increased by 50 percent. Calculate the potential increased waiting time and multiply it by the appropriate value of vehicle occupant time (VOT) value from appendix A4 in the NZ Transport Agency’s (NZTA) Economic evaluation manual volume 1 (EEM1). Multiply by the probability (50 percent) of having to wait, times the total number of existing users.
Service demand disbenefit = (increased waiting time × VOT) × 0.5 × total number of existing users.
Demand change impact on existing passenger transport users
Freight transport user benefits
Transport service user benefits (or disbenefits) for freight could result from differences in:
user charge (freight rate) travel time for the freight service quality other user costs.
The last three points are particularly applicable for goods that are perishable or fragile, or where time and reliability of delivery are important.
If the freight service user is indifferent to modes, ie the user is satisfied that all modes will deliver the product in the same condition in the same time and with the same reliability, there will be no user benefits for transport service activities involving freight movement.
More usually, a freight transport service user will find that, for rail and sea transport, while the user charge may be lower than for road transport, travel time may be greater, service quality may be less, and there may be other user costs such as rehandling and inventory.
User benefits for freight should also take into account flexibility in options for frequency of transport and choice of service providers. In some cases, users transferring freight from road to a rail or sea transport service mode will experience reduced flexibility in the timing and route of services compared with using a road option. Any such reduced flexibility for the transport service user must be included as a disbenefit in evaluations.

Page 7-12
The NZ Transport Agency’s Economic evaluation manual (volume 2) First edition, Amendment 0 Effective from January 2010
7.2 Transport service user benefits continued
A proposed activity for a new rail or sea freight transport service is evaluated against the do-minimum of transport by road. Freight transport user benefits are determined as the differences from the road transport situation. The price of transport by road is assumed to be the maximum user charge (at which no one would use the rail or sea service).
Determine the demand (usually tonnes of freight) that the new service is likely to attract, and the freight rate, by surveying potential users of the proposed service.
Determine the costs to the user of the proposed freight transport service (other than the freight rate) that do not apply to transport of the freight by road. These costs relate to differences in:
travel time for freight service quality other costs such as rehandling.
It may be necessary to disaggregate the freight, freight rate and additional costs by type of commodity.
Calculate net user benefits for users of the proposed new freight transport service as follows:
Net freight service user benefits per year,:
BTotal = [(((Rroad × Droad) – (Rnew x Drail/sea)) x Qnew) – C] × ½
Where:
Rroad = average freight rate for transport of freight by road ($/tonne km).
Rnew = proposed average freight rate for the new rail or sea freight service ($/tonne km).
Droad = net road distance from which freight is removed (km).
Drail/sea = distance of transport by rail or sea (km).
Qnew = projected amount of freight (tonnes/annum).
C = costs to the user of the proposed rail or sea freight transport service (other than the freight rate and the costs of transport from the origin to the rail head/sea port near origin and from the rail head/sea port near the destination to destination) that do not apply to transport of the freight by road.
User benefits for a new rail or sea freight service

Page 7-13
The NZ Transport Agency’s Economic evaluation manual (volume 2) First edition, Amendment 0 Effective from January 2010
7.2 Transport service user benefits continued
The value of freight transport user benefits (other than fare change benefits) for an improvement to an existing service is usually based on a WTP value derived from a survey of existing and potential users.
Calculate freight transport user benefits for users of the improved freight transport service as follows:
Change in net user benefits for existing transport service users:
Bexisting = [((Rroad × Droad) – (Rnew x Drail/sea)) × Q1] – C
Net user benefits for new transport service users:
Bnew = [(((Rroad × Droad) – (Rnew x Drail/sea)) × (Qnew - Q1)) – C] x ½
Total net freight service user benefits per year:
Btotal = Bexisting + Bnew
Where:
Rroad = average freight rate for transport of freight by road ($/tonne km).
Rnew = proposed average freight rate for the new rail or sea freight service ($/tonne km).
Droad = net road distance from which freight is removed (km).
Drail/sea = distance of transport by rail or sea (km).
Q1 = existing amount of freight (tonnes/annum).
Qnew = projected new amount of freight (tonnes/annum).
C = Costs to the user of the rail or sea freight service (other than the freight rate and the cost of transport from the origin to the rail head/sea port near origin and from the rail head/sea port near the destination to destination) that do not apply to transport of the freight by road.
User benefits for improvement to an existing rail or sea freight service

Page 7-14
The NZ Transport Agency’s Economic evaluation manual (volume 2) First edition, Amendment 0 Effective from January 2010
7.3 Road traffic reduction benefits
Introduction Road traffic reduction benefits resulting from transport service activities may include:
travel time cost savings VOC savings CO2 reduction benefits accident cost savings (section 7.4).
Nature of road traffic reduction benefits
Road traffic reduction benefits may be positive or negative.
In the presence of traffic congestion, the removal of some traffic will generally provide positive benefits to remaining road users. Some activities, however, may achieve their improved transport service level by reducing the available road capacity for other road users. The level of traffic congestion to remaining users may then be increased, creating a negative benefit.
Also traffic congestion may be increased where a proposed transport service increases the number of passenger transport vehicles on roads shared with other traffic.
The effect of increased transport output on overall traffic congestion will depend on:
the change in the number of passenger transport vehicles per hour per period their size and performance characteristics the reduction in the number of trips the do-minimum composition of road traffic flow.
Extent of analysis Analysis must be undertaken for the transport service activity and each option, compared against the do-minimum.
Level of detail The level of detail required for this analysis is determined by the size of the proposal. For large scale activities, it is considered important that the travel time benefits and VOC savings are modelled to a reasonable degree of accuracy.
The information contained in this chapter will assist with the determination of the level of detail required.
Time periods With respect to transport services, road traffic reduction benefits shall generally be limited to peak periods. The evaluator shall specify, and justify, the peak period times.
In some cases, for instance with most freight transport services, it may be appropriate to also consider off-peak period road traffic reduction benefits.
Variation of effects It may be necessary to establish the benefits for different activity years, if the do-minimum road option is characterised by increasing traffic congestion. Benefits or disbenefits may be estimated at five or 10-year intervals. Intermediate years may then be interpolated.

Page 7-15
The NZ Transport Agency’s Economic evaluation manual (volume 2) First edition, Amendment 0 Effective from January 2010
7.3 Road traffic reduction benefits continued
Methods for assessing travel time benefits
There are three basic approaches to assessing travel time benefits of transport service activities on road users and other modes:
Speed flow relationship. Modelling using procedures for evaluating road activities (appendices A3 and
A11 in EEM1). Appendix A11 will assist in determining the appropriate modelling to undertake and appendix A3 outlines the methods for calculating travel time saving benefits.
Output using a validated transport model (worksheet A3.11 in EEM1 explains the validation process).
The choice of method depends on the magnitude of the corresponding road impact and the nature of the road(s) or road network affected by the introduction of the transport service.
If an accurate estimate of the benefits of reduced road traffic is wanted, then the procedures in appendices A3 and A11 (EEM1) or output from a transport model should be used.
Definitions The capacity of a road is the maximum flow rate at which vehicles can reasonably be expected to traverse a point under prevailing conditions.
A bottleneck is the point on a road section with the lowest capacity.
Choosing a method for travel time analysis
The following conditions identify when to use basic speed flow relationships for assessing road traffic impacts, and when to use more detailed methods:
If the case to be assessed consists of mainly arterial routes and flow rates are less than 85 percent of capacity (see note below) then use basic speed flow relationships.
If the case to be assessed consists of a variety of road types or a complex road network and a variety of intersections, and bottlenecks with flows that are near to or over capacity then use the detailed procedures in appendix A3 and A11 (EEM1) or output from a validated transport model.
Note: If traffic flows are very near to or over capacity, during some period of the day, then it is advisable to use either the procedures in appendices A3 and A11 (EEM1) or the output from a validated transport model. This is because a small reduction in traffic flow could result in a significant reduction in queuing, which would be ignored if basic speed flow relationships were used. Choosing a method for travel time analysis

Page 7-16
The NZ Transport Agency’s Economic evaluation manual (volume 2) First edition, Amendment 0 Effective from January 2010
7.3 Road traffic reduction benefits continued
Valuing travel time cost savings
Once the change in travel time has been determined using one of the above methods, the value of the travel time cost savings is calculated using the appropriate values given in appendix A4 (EEM1). The increment for traffic congestion (denoted as CRV) may be added to the base values for vehicle occupant time (table A4.1 of appendix A4 in EEM1) when the ‘ruling’ intersection or bottleneck of the corridor affected by the proposed transport service operates at least 80 percent capacity during the peak one hour period.
Note: Any increase in travel time cost is counted as a travel time disbenefit (negative benefit) and subtracted from the numerator of the benefit cost ratio (BCR).
Step Action
1 Obtain a speed flow relationship: If a proven speed flow elasticity function exists, for the route to be analysed then use that
function. If no speed flow elasticity function exists, for the route to be analysed then use flow
detectors, capable of measuring speeds, to measure average speeds and traffic flows at low, medium and high levels of flow (note that the high levels of traffic flow should still be below the road capacity) and interpolate between the observed speed flow values as necessary.
2 From the demand estimates prepared in chapter 4, list the following information for both the peak and non-peak periods, as appropriate: existing number of road trips projected number of road trips following the implementation of the transport service
proposal.
3 For the peak period, subtract the forecasted number of road trips from the existing number of road trips to determine the change in total peak period road trips.
4 Estimate the average existing traffic speed over the peak period.
If this information is not already available, the evaluator may have to measure average speeds on the road(s) being evaluated. Generally accepted methods for measuring average speed include: using loop detectors on the road using a radar gun using a test vehicle to travel the length of road(s) during the appropriate time period(s).
5 Use the speed flow elasticity function from step 1 to determine the average traffic speed for the forecasted flow level at peak after the transport service is implemented.
Subtract the current average traffic speed from the estimated average traffic speed to determine the change in average traffic speed.
6 Use the change in speed calculated in step 5 to determine the change in travel time over the route being analysed.
7 Multiply the change in travel time by the appropriate composite value-of-travel-time value from table A4.3 in appendix A4 (EEM1) to determine the monetised value of the travel time cost savings per road trip.
8 Multiply the travel time cost savings value (step 7) by the number of remaining road users to determine the total benefit.
How to use speed flow relationships
9 Repeat steps 3 to 8 for the off-peak period(s) if appropriate.

Page 7-17
The NZ Transport Agency’s Economic evaluation manual (volume 2) First edition, Amendment 0 Effective from January 2010
7.3 Road traffic reduction benefits continued
How to use speed flow relationships continued
Note: Steps 6 to 8 may also be used in calculating the value of travel time cost savings when the change in travel time has been estimated using the procedures contained in appendices A3 and A11 (EEM1) or with output from a validated transport model.
Vehicle operating cost savings
In congested urban areas, removing road traffic will smooth flows and tend to reduce energy consumption and, to a lesser extent, the wear and tear on vehicles (tyres, clutch, brake blocks, etc). Outside urban areas, where average speeds exceed 70km/h, reducing speeds may reduce vehicle operating costs (VOC) to a greater extent.
For purposes of estimating road traffic reduction benefits, VOC savings may be estimated as being equal to 14 percent of the value of travel time benefits for the same trips.
CO2 reduction benefits
CO2 reduction benefits may be estimated as four percent of the VOC savings.

Page 7-18
The NZ Transport Agency’s Economic evaluation manual (volume 2) First edition, Amendment 0 Effective from January 2010
7.4 Accident cost savings
Introduction A proposed transport service activity may reduce accidents by moving passengers or freight to safer modes of transport, such as buses and rail. While this may be an outcome of a transport service proposal, it is seldom the primary objective.
Accident occurrence (and accident cost) is affected by: trip diversion changes in travel demand a reduction in the number of potential conflicts between different modes.
Nature of accident benefits
Trip diversion from road to rail or bus will generally provide positive benefits to users that change mode. The accident risk (likelihood of having an accident) and accident costs of remaining users will be similar.
A reduction in the number of potential conflicts between modes will generally lead to positive benefits, by reducing the number of conflicts and in many cases the accident severity. Accidents between bus/rail and private motor vehicles tend to be more severe than those between two private motor vehicles.
Accident evaluation procedures
There are three accident analysis methods used by the NZTA: accident-by-accident analysis, accident rate analysis and the weighted accident procedure (refer to appendix A6 of EEM1). Proposed transport services should use accident rate analysis.
Accident rate analysis makes use of predictions of the reported injury accident rate from areas that are similar to the proposed transport service location. For a transport service proposal such as a rail service, accident rates for both road and rail must be used to predict the number of accidents and the subsequent costs. Roads should also be separated into urban and rural sections.
Worksheets A6.7 and A6.8 (EEM1) can be used for analysing urban and rural road routes respectively.
Accident rates and prediction models
Accident prediction models and accident rate equations are not provided for rail, buses or coastal shipping. Accident prediction models and accident rate equations from other sources are permitted, as long as the robustness of these other sources can be demonstrated.
Urban transport services – accident rates
The accident prediction models in appendix A6 (EEM1) can be used to calculate accident rates for urban roads. The models predict accidents between major intersections (or on links). An adjustment factor of two may be used to estimate the total number or reported injury accidents on both the links and at intersections for urban roads with intersections when the frequency of intersections along a road and the volume of crossing traffic is fairly typical. This is based on an assumption that approximately 50 percent of accidents occur at intersections.
On some urban roads, particularly in the middle of towns and cities, intersections are often closely spaced and this factor is not valid. When either of these two factors is atypical, then the evaluation should use the intersection prediction models in A6.2(a) to A6.6(a) of appendix A6 (EEM1) to calculate accident rates at the intersections. If the proportion of the trip on atypical roads is short then this issue can be ignored. A validated transportation model can be used to assist in more complex situations.

Page 7-19
The NZ Transport Agency’s Economic evaluation manual (volume 2) First edition, Amendment 0 Effective from January 2010
7.4 Accident cost savings continued
Rural freight transport services – accident rates
For freight transport service proposal, where the road network affected by the activity is primarily rural in location, accident rate equations for heavy vehicles only are used to estimate the reduction in freight related accidents. This is a subset of the accidents given by the equation in A6.14 of appendix A6 (EEM1).
Heavy vehicle reported injury accidents/year = b0X
Where X is the exposure in 100 million vehicle kilometres, and the coefficient b0 is given in table 7.6.
Table 7.6: Rural mid-block coefficients (b0) for heavy vehicle accidents
Coefficients b0 by terrain type AADT
Level (0% to 3%) Rolling (3% to 6%) Mountainous (>6%)
<= 4000 19 40 50
>4000 19 19 41
Each freight route should be broken down by traffic volume and terrain type. The terrain type can be selected by analysing the route gradient data. The gradient bands for each terrain type should generally be maintained throughout each section. Sections of road that are less steep can occur in rolling or mountainous sections for short lengths. This is allowed provided that the lower gradient length is followed by another rolling or mountainous gradient. The appropriate accident rate is then used for each section.
For each mode that will be affected by the transport service proposal, calculate the accident cost savings as follows:
Step Action
1 If the activity to be assessed consists of predominately radial then arterial, collector and local routes, with a standard density of intersections, and motorways, or rural roads then use this procedure (for each option).
If the activity to be assessed consists of a complex road network or arterial routes with very high or low density of intersections then use output from a validated transport model in conjunction with accident prediction models from appendix A6 (EEM1).
Procedure for accident rate analysis
2 Where the transport service proposal affects urban road(s):
Using worksheet A6.7, record for each mid-block road type (and land use) the length, average annual daily traffic current (AADT), and the predicted AADT after implementation of the transport service proposal. Where there is more than one length of any given mid-block road type and the AADT varies, an average of the AADT values can be used (alternative add rows to the bottom of worksheet A6.7).
Using the coefficients (b0 and b1) provided, calculate the do-minimum accident rate (Adm) for each mid-block road (link) type using the current AADT:
A = b0 × QTb1 × L
Calculate the accident rate (Aopt) for each of the options, using the above accident rate equation and the AADT after implementation.
Intersection adjustment for collector and arterial road links only. Multiply the accident rates (Adm and Aopt) for the appropriate road links by two to derive the adjusted accident rates.

Page 7-20
The NZ Transport Agency’s Economic evaluation manual (volume 2) First edition, Amendment 0 Effective from January 2010
7.4 Accident cost savings continued
Step Action
3 Where the transport service affects rural road(s):
Using worksheet A6.8, record for each section of road the length, AADT, terrain type and the daily number of heavy commercial vehicles that currently use the route and the daily number of heavy vehicle trips that will use the route following implementation of the transport service proposal.
Calculate the HCV exposure (in 100 million vehicle km per year) for both the do-minimum and each option using the current and option number of truck trips.
Multiply the HCV exposure by the appropriate coefficient (b0) to determine the do-minimum and option reported injury accidents per year (Adm and Aopt).
4 For other modes (ie existing transport services):
Develop or obtain accident rates for other modes (ie rail and buses). The accident rate will be based on a factor, such as the total number of passengers, annual tonnage, or similar. The factor selected will depend on the information available about accidents for the mode under consideration.
Calculate the change in the factor being used based on the projected demand for trips on other modes after implementing the transport service (from chapter 4).
Calculate the do-minimum and option number of accidents resulting from the transport service for each ‘other’ mode for the current value of the factor (eg change in number of kilometres travelled, change in number of passengers, etc) and the increased value of the factor.
5 Multiply the do-minimum and option number of accidents for urban and rural roads and ‘other’ modes by the appropriate standard accident costs - ‘all other sites’ costs in table A6.22 in appendix A6 (EEM1) for roads.
Calculate the accident cost savings for each option affected by the implementation of the transport service by subtracting the option accident costs from the do-minimum accident costs for rural and urban roads and on other modes.
Sum the accident cost savings (or cost increases) on urban and rural roads and on ‘other’ modes.
Enter the total accident cost savings for each option into the reporting table in section 7.9.
Procedure for accident rate analysis continued

Page 7-21
The NZ Transport Agency’s Economic evaluation manual (volume 2) First edition, Amendment 0 Effective from January 2010
7.5 Disbenefits during implementation/construction
Disruption to road users
Disbenefits considered in the economic evaluation may be restricted to travel time delays only and don’t need to include vehicle operating costs, accident cost, noise, dust, etc.
Further details on handling disbenefits are contained in section 2.3 of EEM1.
Disruption to existing transport service users
Disruption costs to existing users of transport services during the implementation of a new or improved transport service shall be included in the evaluation as a disbenefit (negative benefit).
Possible disbenefits include:
increased travel time travel discomfort.
Disruption costs to wider community
Determine any significant costs of disruption to the wider community during the implementation/construction process.

Page 7-22
The NZ Transport Agency’s Economic evaluation manual (volume 2) First edition, Amendment 0 Effective from January 2010
7.6 Other benefits and national strategic factors
It is assumed that the benefit of improved consumer travel options is included in the various WTP values used in transport service evaluations.
Other monetised and non-monetised effects are described in section 2.4 and appendices A8 and A9 of EEM1. The values and methodology in EEM1 apply equally to transport service proposals.
Note: CO2 reduction benefits are addressed in section 7.3.
Increased consumer travel options
Other monetised and non-monetised effects
National strategic factors When evaluating transport services it is expected that most, and in many cases
all, of the benefits will relate to the tangible transport service user and road traffic reduction benefits and other monetised effects. However, despite the wide range of factors currently taken into account there may also be certain national strategic factors (NSF) that could be considered for inclusion in the analysis, particularly for large activities. NSFs are described in section 2.3 and appendix A10 of EEM1.
Examples of investment option values (providing for the future) relating to transport service proposals include:
safeguarding rail routes for the future, particularly critical routes provision for capacity expansion within a corridor for light rail or heavy rail to
facilitate constructing additional track at a later date terminal design to enable easy addition of extra ‘berths’ in the future.

Page 7-23
The NZ Transport Agency’s Economic evaluation manual (volume 2) First edition, Amendment 0 Effective from January 2010
7.7 Costs to government
Introduction The costs to government of a transport service incorporate:
funding assistance from government road maintenance, renewal and construction cost savings road user charges (RUC) foregone (for freight transport only).
Road maintenance, renewal and construction cost savings
Some transport service proposals will provide a cost saving to government if:
future planned road construction costs are avoided (freight and passenger services)
the implementation of the activity results in a reduction to road maintenance and renewal expenditure when traffic is removed from the road (freight services only).
Government cost savings have the effect of reducing the denominator of the BCR, potentially making a transport service more attractive.
The proposed transport service and any other options are assessed to determine any planned road construction savings and, in the case of freight services, any road maintenance and renewal savings that will be made as compared to the do-minimum roading option.
Care must be taken when claiming a cost saving from future road construction avoided. The year or years in which the road construction would likely be funded must be assessed.
Note:
Normally road construction cost savings should only be claimed if there are significant road traffic reduction benefits associated with the transport service proposal.
Road maintenance, renewal and improvement cost savings associated with implementation of a freight service are calculated by estimating the total annual amount of freight traffic, measured in terms of equivalent design axles (EDA), removed from the road network. The simplified procedure for freight services provides indicative EDA and $/EDA/km values. However, local values are to be used for activities where the default values provided in these simplified procedures do not represent local conditions. Also, if the amount of the freight traffic removed from the road network varies from year to year, separate calculations are required for each year.
Road user charges foregone
In New Zealand, RUC include:
RUC for all diesel-engined vehicles, and vehicles over 3.5 tonnes petrol excise tax for all petrol-engined vehicles.
For the purposes of this manual, it is assumed that all vehicles used in freight services will be paying road user charges.

Page 7-24
The NZ Transport Agency’s Economic evaluation manual (volume 2) First edition, Amendment 0 Effective from January 2010
7.7 Costs to government continued
Note: For passenger transport services it is not necessary to calculate the loss of RUC.
In the case of a freight service, lost RUC are subtracted from the road maintenance, renewal and construction cost savings to derive the net savings to government.
For freight-based services, it is assumed that heavy commercial vehicles will be removed from the road. Thus, the loss of RUC as a result of the introduction of a freight transport service will be based on the weighted average road user charge for the type of vehicle that is removed.
The funding gap, calculated in chapter 6, indicates the funding assistance desired by the service provider from a commercial point of view.
The manner in which the funding assistance is actually provided is a matter of negotiation between the funder and the service provider taking into account the funder’s funding policy. The actual cash flow of funding assistance, discounted using the appropriate economic present worth factor, is used in the economic evaluation.
Whether the service provider’s desired funding assistance is justified from the government (public policy) point of view is indicated by the calculated government benefit cost ratio (BCRG).
If BCRG is >1.0, then the funding assistance is justified by the monetised benefits and cost savings achieved by the improved or new transport service.
Determine the reduction in RUC revenue as a result of the introduction of a freight service using the following procedure:
Step Action
1 From the demand estimate information generated in chapter 4, list the following for each travel time period:
existing number of road trips by the vehicle type affected by the transport service proposal
the predicted new level of road trips by the vehicle type affected by the transport service proposal.
Note: The travel time period used will depend on the particular freight service being proposed but in most cases will probably be an annual figure.
2 Determine the change in road trips by subtracting the existing number of road trips from the predicted new level of road trips.
3 Using the data from step 1 and consulting with the industry(ies) affected by the proposed freight service, determine the average licensed weight of the vehicle type(s) removed.
4 Using the RUC tables published by the NZTA, establish the RUC (in $/1000km) for the licence weights of the vehicles removed.
5 Determine the length (km) of the road(s) affected by the proposed transport service.
6 Calculate the total number of kilometres of travelling saved:
(change in road trips per annum) × (km per trip)
Divide this by 1000 to find the annual thousands of kilometres saved.
7 Multiply the road user charge ($/1000km) by the annual thousands of kilometres saved to derive the total RUC revenue lost.
Road user charges foregone continued

Page 7-25
The NZ Transport Agency’s Economic evaluation manual (volume 2) First edition, Amendment 0 Effective from January 2010
7.8 Present value of benefits and costs
Introduction All benefits and costs must be discounted over the life of the activity and each option to calculate their present value (PV).
Benefits and costs may:
occur as a single payment or benefit recur uniformly over the life of the proposal increase or decrease arithmetically over the life of the proposal.
Benefits and costs are discounted individually to take this timing into account using a present worth factor from table A1.1 in appendix A1 (EEM1).
Calculating the PV of all the benefits of the transport service proposal and each option involves the following:
Step Action
1 List all the benefits associated with each option, including the transport service proposal. Ensure that the benefits are annual amounts. Adjust them if necessary.
Note: Service provider revenue (and service provider cost) is not included in this part of the evaluation.
2 Determine if each benefit occurs:
once in the analysis period for the proposal/option annually at a uniform amount annually at an arithmetically increasing or decreasing amount.
Then choose step 3, 4 or 5 below to calculate the PV of the benefit.
3 For a one-off benefit:
a. State the time (years from time zero) at which the benefit occurs. b. Select the appropriate single payment present worth factor (SPPWF) from table A1.1 in
appendix A1 (EEM1). c. Multiply the benefit by the present worth factor to find its PV.
4 For a uniformly occurring benefit:
a. Determine the start and end time (years from time zero) for the benefit. For example, a benefit may start three years from time zero and continue until the end of year 15.
b. Select and subtract the present worth factor for the start time of the benefit stream from the present worth factor for the end time of the benefit stream.
c. Multiply the answer to step (c) by the annual benefit amount to determine its PV.
5 Where the benefits grow or decrease arithmetically:
a. Determine the time stream for the benefit. For example, a benefit may start three years form time zero and continue until the end of year 15.
b. Select the appropriate uniform series present worth factors (USPWF) and arithmetic growth present worth factors (AGPWF) for the start of the benefit stream and for the end of the benefit steam.
c. Subtract the USPWF for the start time of the benefit stream from the USPWF for the end time of the benefit stream.
Calculating the present value of benefits

Page 7-26
The NZ Transport Agency’s Economic evaluation manual (volume 2) First edition, Amendment 0 Effective from January 2010
7.8 Present value of benefits and costs continued
Step Action Calculating the present value of benefits continued d. Repeat step (c) for the AGPWF.
e. Determine the appropriate traffic growth rate. For transport service user benefits this will be based on predicted traffic growth rates. Default rates for road-based traffic growth rates are provided in table A2.4 in appendix A2 (EEM1). The traffic growth rate is usually expressed as a percentage of the traffic volume at time zero. For the purposes of this calculation, the traffic growth rate should be expressed as a decimal figure.
Note: The basis for the predicted future growth rate for each mode should have been detailed in developing the demand estimates. If not, do so here.
f. For accident benefits only. Adjust the road traffic growth rate to take account of the downward trend in road-based accidents using one of the factors below: i. if the posted speed limit is 50 or 60km/h then subtract three percent from the traffic
growth rate ii. if the posted speed limit is 70km/h or above then subtract one percent from the
traffic growth rate.
Note: It is possible for the adjusted accident growth rate to be negative if the predicted traffic growth rate is less than three percent (0.03) in 50 or 60km/h areas or one percent (0.01) in 70km/h and above areas.
g. Multiply the traffic growth rate (from step (e) or step (f), for accident benefits) by the AGPWF determined in step (d). Add this figure to the uniform series USPWF calculated in step (c).
Multiply the result of step (g) by the value of the benefit when it first occurs to obtain the PV of the benefit.
6 Sum the PVs of all of the benefits to obtain the total PV of benefits for the transport service and each option.
7 Enter the information into the reporting table in section 7.9.
The procedure for calculating the PV of costs is very similar to that for determining the PV of benefits. Evaluators are referred in part to the preceding procedure where the calculations are the same. Simply substitute the word ‘cost’ where ‘benefit’ appears.
The procedure involves the following steps:
Step Action
1 Using the information from chapter 6 and section 7.7, for the transport service and each option, list the:
annual amount(s) of funding assistance annual amount(s) of road construction cost savings for a freight service, annual amount(s) of lost RUC and road maintenance and renewal
cost savings.
2 Determine if each cost occurs:
once in the analysis period for the proposal/option annually at a uniform amount annually at an arithmetically increasing or decreasing amount.
Then choose step 3, 4, or 5 below, as appropriate, to calculate the PV of cost.
Calculating the present value of costs

Page 7-27
The NZ Transport Agency’s Economic evaluation manual (volume 2) First edition, Amendment 0 Effective from January 2010
7.8 Present value of benefits and costs continued
Step Action
3 For a one-off cost, follow the procedure outlined in step 3 of the procedure for calculating the PV of benefits.
4 For a uniformly occurring cost, follow the procedure outlined in step 4 of the procedure for calculating the PV of benefits.
5 Where the costs grow or decrease arithmetically, follow the procedure outlined in step 5 of the procedure for calculating the PV of benefits.
6 Obtain the PV of the net cost to government:
For passenger services
PV (net cost to government) = PV (funding assistance) + PV (road construction cost savings).
For freight services
PV (net cost to government) = PV (funding assistance) + PV (RUC foregone) – PV (road maintenance, renewal and construction cost savings).
7 Enter the information into the reporting table in section 7.9.
Calculating the present value of costs continued
Complete benefits and costs table
All benefits and costs should be recorded in the benefits and costs PV reporting format in section 7.9.
Indicate basis of benefits
All methods used for deriving transport service user benefits and road traffic reduction benefits must be explained, along with any assumptions employed in their calculation, in the evaluator’s report.
For an improved transport service, report the existing and projected patronage and the improvement, ie existing and projected service frequencies, interchanges eliminated, fare changes and other improvements.
The assumptions and calculations underlying the determination of the road maintenance, renewal and construction cost savings, as appropriate, must also be included in the evaluator’s report.
Where the road maintenance, renewal or construction cost savings vary from time to time, the variations and when they occur must be explained.

Page 7-28
The NZ Transport Agency’s Economic evaluation manual (volume 2) First edition, Amendment 0 Effective from January 2010
7.9 Reporting of benefits and costs
Suggested format for reporting
The PVs of costs and benefits for transport services proposals for each option under consideration should be presented in a format as shown below.
Option description/name
Benefits Time zero value
Year(s) when value exists
PV worth factor
PV
Transport service user benefits (section 7.2)
Demand change disbenefits (section 7.2)
Travel time cost savings (section 7.3)
VOC savings (section 7.3)
Accident cost savings (section 7.4)
Implementation/construction disbenefits (section 7.5)
Other monetised benefits (appendices A8 and A9 of EEM1)
PV of net benefits (f)
Costs
Service provider costs (section 6.2) (a)
Funding assistance (section 7.7) (b)
Road construction cost savings (section 7.7) (c)
Road maintenance and renewal cost savings (freight services only, section 7.7)
(d)
RUC forgone (freight services only, section 7.7) (e)
PV of net economic costs:
passenger transport (b) – (d) freight services (b) – (d) – (e)
(g)
BCRN: (a)/(g)
PV of net cost to government:
passenger transport (c) – (d) freight services (c) – (d) – (e) + (f)
(h)
BCRG: (a)/(h) Transfer PV of accident cost savings, E for the preferred option to E on worksheet 1.

Page 7-29
The NZ Transport Agency’s Economic evaluation manual (volume 2) First edition, Amendment 0 Effective from January 2010
a
bcde
f
g
$/tonne
Economiccost
Freight user cost
Economic cost
Freight user cost
Road Rail/sea
7.10 Feasibility evaluation of freight transport proposals
The feasibility of freight transport activities can be evaluated using composite costs for road transport and rail or sea transport as illustrated in the following diagram:
a Road total economic cost.
b Rail/sea total economic cost.
d Road service provider (internalised) costs
(= Road freight rate = generalised cost to road freight user).
e Generalised cost to rail/sea freight user.
f Rail/sea service provider (internalised) costs.
g Proposed rail/sea freight rate.
a - b Economic benefit.
a - d Road non-internalised costs.
b - c Rail/sea externality costs.
c - d Minimum rail/sea service subsidy.
c – e (= f - g) Actual rail/sea service subsidy.
Composite values for freight transport
c – f (= e - g) Rail/sea freight rehandling, time, etc costs (additional to that for road freight).

Page 7-30
The NZ Transport Agency’s Economic evaluation manual (volume 2) First edition, Amendment 0 Effective from January 2010
7.10 Feasibility evaluation of freight transport proposals continued
Composite values for freight transport continued
The ratio of economic benefits to service subsidy:
BCRG = (a – b) / (c –e)
This uses the simplifying assumption that road cost savings = RUC foregone in the denominator of the BCR. If this is not approximately the case, then either SP8 or the full procedures should be used.
BCRG must be >1.0 for the service subsidy to be justified on public policy grounds.
Internalised service provider costs for heavy commercial road freight vehicles are: vehicle capital, vehicle operating costs, vehicle repairs, vehicle maintenance, driver costs, taxes, Accident Compensation Corporation levies (ACC levies), RUC, overheads and profits.
ACC levies internalise most of road accident costs and RUC internalise most of road maintenance, renewal and improvement costs.
Road transport costs that are not internalised are the costs of environmental impacts plus those road accident costs and road maintenance, renewal and improvement costs that are not covered by ACC levies or RUC.
Average values for internalised road service provider and the non-internalised costs for road transport on rural roads are given in table 7.5.
Table 7.5:Average values for rural road freight transport ($/tonne/km –2008)
State highway Local road (hilly terrain)
Road maintenance 0.000 0.073
Accident costs 0.008 0.008
CO2 emissions 0.002 0.006
Total non-internalised costs 0.010 0.087
Internalised costs 0.210 0.233
Total economic costs 0.220 0.320
Road freight transport
Route-specific issues such as high accident rates and congestion will add additional non-internalised costs. These situations should be evaluated with simplified or full procedures.
Rail/sea freight transport
Service provider costs for rail or sea freight transport activities will need to be obtained from the service provider. Refer to section 6.2 for guidance on these costs.
The NZTA is undertaking research on the value of externalities costs for rail freight and sea freight. A preliminary value is 0.01 $/tonne/km (2008).

Page 7-31
The NZ Transport Agency’s Economic evaluation manual (volume 2) First edition, Amendment 0 Effective from January 2010
7.10 Feasibility evaluation of freight transport proposals continued
Costs additional to road transport
Transport of freight by rail or sea often involves costs to the freight service user that are in addition to those incurred by transporting the freight by road. These additional costs relate to rehandling, freight time, damage, reliability of service, etc. The magnitude of these costs depends on the type of freight. The costs are small for bulk commodities with rail connections at origin and destination, and substantial for commodities requiring rehandling where delivery is time dependant and damage is expensive.
It is these costs that dictate the need for a subsidy for rail or sea freight transport so they must be assessed and used in the economic efficiency calculation.
Freight rates For freight to be transported by rail or sea instead of by road the rail/sea freight rate plus the costs that are additional to road transport need to be less than the road freight rate. The minimum subsidy for rail/sea transport is the subsidy required to achieve this. The rail/sea freight rate ($ per tonne) multiplied by the amount of freight (tonnes) determines the revenue that will be generated by a activity to transport freight by rail or sea.
When evaluating an improvement to a freight transport service, the freight rate and the amount of freight used in the evaluation are the difference between the current values and the projected new values (refer to section 6.3).
Funding assistance If the rail or sea freight transport activity does not involve capital expenditure, then the difference between the rail or sea service provider’s costs in unit rate terms and the proposed freight rate is the calculated rail/sea service subsidy or funding assistance. The actual funding assistance requested may be different from this for various reasons.
Capital expenditure Where the rail or sea freight transport activity involves significant capital expenditure, then a funding gap analysis should be undertaken to investigate the most appropriate way to provide funding assistance (refer to sections 6.5 and 7.7).

Page 7-32
The NZ Transport Agency’s Economic evaluation manual (volume 2) First edition, Amendment 0 Effective from January 2010
7.11 References
1. Australian Transport Council (2006) National guidelines for transport system management in Australia: urban transport.
2. Vincent M (2008) Measurement valuation of public transport reliability. Land Transport New Zealand research report 339.

Page 8-1
The NZ Transport Agency’s Economic evaluation manual (volume 2) First edition, Amendment 0 Effective from January 2010
8.0 Evaluation of walking and cycling
8.1 Overview
8.1 Overview 8-1
8.2 Method of evaluation 8-3
8.3 Stages in analysis 8-4
8.4 Travel impacts 8-5
8.5 Do-minimum 8-7
8.6 Benefits – general 8-8
8.7 Facility user benefits 8-9
8.8 Disbenefits during implementation/construction 8-12
8.9 Other benefits and national strategic factors 8-13
continued
Introduction This chapter describes methods for economic efficiency evaluation of improved facilities for walking and cycling. The improvements may be of two types:
route improvements (provision of new or improved paths, lanes or other facilities for pedestrians or cyclists)
improvements at hazardous sites (provision of overbridges, underpasses, bridge widening or intersection improvements)
The simplified procedure SP11 in chapter 13 can be used for evaluating new or improved walking and cycling facilities.
Cycling and walking promotion is addressed in chapter 9.
Integration with other transport demand management initiatives
For walking and cycling activities to be effective, provision of continuous lanes or paths should be provided with secure cycle parking, signage, maps, education, promotion, marketing and integration of the routes with passenger transport. All these components should be addressed within a walking and cycling strategic plan and an implementation package.
Reference 1 sets out a framework and priorities for development of walking and cycling. Reference 2 provides guidance for cycle network and route planning and reference 3 provides guidance for planning and design for pedestrians.
Because of synergetic impacts, evaluation of walking and cycling should be done at the package level rather than just for individual components.
In this chapter Section Page

Page 8-2
The NZ Transport Agency’s Economic evaluation manual (volume 2) First edition, Amendment 0 Effective from January 2010
8.10 Costs 8-14
8.11 Period of analysis 8-15
8.12 Cost benefit analysis 8-16
8.13 Alternatives and options 8-17
8.14 Sensitivity analysis 8-18
8.15 Cycle demand analysis 8-19
8.16 References 8-22

Page 8-3
The NZ Transport Agency’s Economic evaluation manual (volume 2) First edition, Amendment 0 Effective from January 2010
8.2 Method of evaluation
Consumer surplus basis
Consumer surplus methodology (section 3.2) is used to monetise the user benefits of improvements to walking and cycling facilities.
For reduced journey time, user time savings are based on the standard values of time (VOT) for pedestrians and cyclists given in table A4.1, appendix A4 of the NZ Transport Agency’s Economic evaluation manual volume 1 (EEM1). The values in appendix A4 applicable to most pedestrians and cyclists are those for non-work travel purposes (including commuting to and from work). These standard values are derived willingness to pay (WTP) values, ie they are based on consumer surplus methodology.
For other types of walking and cycling improvements (such as improvements to the quality of the facility and journey comfort) WTP values need to be obtained from consumer preference surveys or from the impacts of similar improvements in other areas.
Because charges are not normally made for use of walking and cycling facilities, travel time is usually the measure used to trade off with improved facilities, etc in consumer preference surveys for walking and cycling. The time value is then monetised using the standard values of time referred to above.

Page 8-4
The NZ Transport Agency’s Economic evaluation manual (volume 2) First edition, Amendment 0 Effective from January 2010
8.3 Stages in analysis
At every stage of the economic efficiency evaluation, the analysis is carried out for the walking or cycling facility proposal, the do-minimum and any other alternatives and options.
Stage Description See
1 Complete the activity description including a description of the do-minimum, alternatives and options.
EEM1, section 5.2.
2 Forecast the demand.
Note: The demand estimate is used for calculating user benefits for new and existing pedestrians/cyclists, and road traffic reduction benefits. Care should be taken to ensure assumptions are compatible with economic evaluation requirements.
Section 8.4.
3 Calculate the costs of the proposal. Section 8.10.
4 Calculate the annual facility user benefits. Section 8.7.
5 Calculate disbenefits during implementation/construction. Section 8.8.
6 Describe, and quantify where possible, any significant non-monetised effects. Section 8.9.
7 List any national strategic factors relevant to the preferred option. If possible determine the monetary value(s) of any national strategic factors.
Section 8.9.
8 Describe equity impacts (particularly those relating to transport disadvantaged) and any other significant impact not covered in stages 4 to 7.
Section 3.3.
9 Discount the costs over the period of analysis to obtain the present value (PV) of these costs.
EEM1, appendix A1.
10 Discount the annual monetised benefits (stages 4 and 5) over the period of analysis and sum them to obtain the PV of net national economic benefits.
EEM1, appendix A1.
11 Where options being evaluated are mutually exclusive, use incremental analysis to select the preferred option.
Section 8.13.
12 Determine the national benefit cost ratio (BCRN). Section 8.12.
13 Perform sensitivity tests on the preferred option. Section 8.14.
Stages

Page 8-5
The NZ Transport Agency’s Economic evaluation manual (volume 2) First edition, Amendment 0 Effective from January 2010
8.4 Travel impacts
Factors influencing demand
Factors influencing demand for walking and cycling include:
availability of facilities type and quality of facility including cycle parking, signage and safety of use location, route length and connectivity of walking and cycling paths or lanes population served by the facilities education, promotion and marketing.
Studies have shown that there is a positive correlation between the number and quality of facilities that are provided and the percentage of people that use cycling for commuting purposes. It has also been observed that, in addition to having walking and cycling facilities, they must connect appropriate origins and destinations, and use of the facilities must be promoted to encourage walking and cycling as alternative commuting modes.
Demand estimate Evaluators are required to make realistic estimates of the demand for a new or improved walking or cycling facility, particularly the number of new pedestrians or cyclists. The worksheet in section 8.15 can be used to estimate the demand for cyclists. Reference 3 provides other methods for assessing demand for walking and cycling.
Education, promotion and marketing are the prime drivers for generating demand for walking and cycling (and change from use of private motor vehicles). The methodology for estimating travel impacts in section 9.2 should be used to estimate the number of private vehicle trips diverted to new or improved walking and cycling facilities where this is part of a package including travel behaviour change (TBhC) activities.
Where a new or improved walking or cycling facility provides a significantly improved quality of service, trips in addition to those diverted from private vehicles may be generated. The total demand for the facility may be estimated using the procedures in section 4.3.

Page 8-6
The NZ Transport Agency’s Economic evaluation manual (volume 2) First edition, Amendment 0 Effective from January 2010
8.4 Travel impacts continued
Where a quality improvement (amenity, comfort or security) is proposed to existing walking and cycling facilities or new walking and cycling facilities is proposed, the value of different levels of quality must be assessed. The valuation should be based on a stated preference (SP) survey or information from similar improvements to facilities in other areas.
Reference 4 describes a SP methodology and study to identify preferences for different types of cycling facilities. The study determined the additional time that cyclists would spend travelling on each type of facility (the incremental attractiveness of that type of facility) compared with a base case of 20 minutes of travel in-traffic with road-side parking. The study gave the values in table 8.1.
Table 8.1: Relative benefit for different types of cycle facilities
Type of cycle facility Relative benefit
On-street with parking (no marked cycle lane) 1.0
On-street with parking (marked cycle lane) 1.8
On-street without parking (marked cycle lane) 1.9
Off-street cycle path 2.0
Demand and use of benefits for different types of facility
The relative benefit values should be used in an incremental analysis, see section 8.13 to choose an appropriate quality of facility.
Walking distances Activities that involve mode change need to be careful not to claim unrealistic walking distances. Statistics on walking provided in reference 1 are based on the 1997/98 New Zealand Travel Survey. The average pedestrian trip length is estimated at one km.
Cycling distances Statistics on cycling provided in reference 1 are based on the 1997/98 New Zealand Travel Survey. The current average cycle trip length is estimated at three km. This applies equally to new and existing users.

Page 8-7
The NZ Transport Agency’s Economic evaluation manual (volume 2) First edition, Amendment 0 Effective from January 2010
8.5 Do-minimum
Definition The do-minimum for evaluation of walking and cycling facilities is usually considered as a continuation of the present transport networks, service levels and facilities in the study area.
The do-minimum shall include any costs and resulting demand implications of committed facility or service improvements. All committed investment plans that relate to the do-minimum during the analysis period must be taken into account. Maintenance, replacement schedules and any planned service changes must also be included. Improvements are committed if they have been assessed in accordance with the NZ Transport Agency’s (NZTA) assessment procedures and have been approved for funding.
Any investment plans that are not committed must be included in the evaluation as options.
Where a particular benefit or cost is unchanged among all the alternatives, options and the do-minimum, it does not require validation or inclusion in the economic analysis.
Scope of do-minimum It is extremely important to:
not overstate the scope of the do-minimum only include, as part of the do-minimum, work which will preserve a minimum
acceptable level of service.

Page 8-8
The NZ Transport Agency’s Economic evaluation manual (volume 2) First edition, Amendment 0 Effective from January 2010
8.6 Benefits – general
Introduction Walking and cycling provide health, access, mobility and transport choice benefits and contribute to the New Zealand Transport Strategy objectives. Walking to and from public transport stops is an essential component of most public transport journeys, and cycling can extend the catchment area of public transport. Walking and cycling contribute to community liveability, support other government strategies for health and active living, are amongst the most environmentally friendly forms of transport, free up road and parking space, can provide benefits to local economies, and can make streets safer for people.
Cycle and pedestrian facilities are non-market goods, making it difficult to ascribe an economic value to their benefits. Either stated or revealed preference methods are, therefore, used to value social and economic benefits.
Of the benefits listed in section 3.3 and described in section 3.8, those most relevant to walking and cycling are: travel time cost savings vehicle operating cost (VOC) savings generated traffic walking and cycling costs accident cost savings health benefits parking user cost savings other user benefits environmental benefits (monetised and non-monetised impacts) community liveability improvements increased consumer travel options. disbenefits during implementation/construction.
The benefits can be grouped into: mode change benefits road traffic reduction benefits facility user benefits.
Combined walking and cycling activities
Activities that combine walking and cycling may claim benefits for both modes but safety issues arising from pedestrian/cycle conflicts must be addressed and if there are additional accidents these must be accounted for in the evaluation.
Mode change benefits Mode change benefits resulting from walking and cycling education, promotion and marketing are covered in section 9.4.
Road traffic reduction benefits
The road traffic reduction benefits of a walking or cycling activity result from the number of private vehicle trips replaced by walking or cycling. These benefits are part of the benefits of changing modes. They are location and time of day dependent.
Road traffic reduction benefits consist of: perceived VOC and travel time savings for people that change modes resource cost corrections for unperceived VOC travel time and VOC savings for other road users parking user cost savings reduced environmental impacts.

Page 8-9
The NZ Transport Agency’s Economic evaluation manual (volume 2) First edition, Amendment 0 Effective from January 2010
8.7 Facility user benefits
Introduction Benefits that apply to walking and cycling, in addition to the mode change benefits, include:
travel time savings to existing users from improvements to facilities perceived benefits to existing users from improved quality of facilities safety benefits to existing users from treatment of hazardous locations.
Travel time cost savings
As explained in section 3.8, differences in travel time (and hence travel time cost) between modes for people that change modes is deemed to be included in the perceived benefits of changing modes. The travel time cost differences for mode changers are therefore included in the benefits calculated in section 9.4.
Where a proposed walking or cycling facility improvement reduces the existing walk or cycle travel time, eg by adding a pedestrian or cyclist priority phase at a signalised crossing, there will be travel time cost savings to existing pedestrians or cyclists and to new pedestrians or cyclists other than those covered by the procedures in chapter 9. The standard values of time for pedestrians and cyclists given in table A4.1 in appendix A4 of the NZTA’s Economic evaluation manual volume 1 (EEM1) may be used to calculate these benefits. These benefits may, however, be offset by increased delays to motor vehicles, which may also be taken into account depending on the road and community context.
Walking and cycling costs
As noted in section 3.8, cycle operating costs and walking costs are assumed to be included in the perceived costs of changing to, and using these modes.
Accident cost savings Reference 5 provides evidence that the accident rate per cyclist or per pedestrian reduces significantly as the number of cyclists or pedestrians increases, and that the overall number of accidents (motor vehicles, cyclists and pedestrians) does not change substantially when private vehicle trips are diverted to cycling or walking. This means that, in most cases, there are no significant negative accident costs associated with diverting private vehicle trips to walking and cycling trips.
Some new or improved walking and cycling facilities effectively eliminate hazards along an established route used by pedestrians or cyclists, eg provision of overbridges, underpasses bridge widening and intersection improvements. In these cases a more detailed analysis of the changes in accident types, numbers and costs should be completed using the procedures in appendix A6 (EEM1).
Reduction or elimination of hazards on a walking or cycling route is likely to be a factor in attracting new users or additional use of the facility. The evaluation should quantify (by surveys/research) the extent to which the hazards are an impediment to new users or additional use and provide supporting information on pedestrian or cycle numbers.

Page 8-10
The NZ Transport Agency’s Economic evaluation manual (volume 2) First edition, Amendment 0 Effective from January 2010
8.7 Facility user benefits continued
Health benefits Health benefits of walking and cycling are described in section 3.8. These benefits relate to people that change modes, eg from private vehicles to walking or cycling (being inactive to being active) and are included in the composite benefit values given in section 9.4.
The calculation of net benefits for users of a new walking or cycling facility is based on the maximum benefit value to a potential user. The result is then divided in half, based on the rule of half.
Calculate net user benefits for users of a new walking and cycling facility using the procedure in section 4.3 to determine the projected number of new service users.
Net user benefits = Pmax × Qnew × ½
Where:
Pmax = WTP value for new facility.
Qnew = projected number of new users.
User benefits for new facility
The value of walking or cycling facility user benefits (other than time saving benefits), eg improved quality, comfort or security, is usually based on a WTP value derived from a SP survey or on values derived for similar facility improvements in other areas.
Calculate the facility user benefits using the information in chapter 4 to give the projected new use level, as follows:
Change in net total benefits for existing users:
Bfexisting = Pmax × Q1
Apply the rule of half for the total benefits for new users:
Bfnew = Pmax × (Qnew - Q1) × ½
Total facility benefits:
Bftotal = Bfexisting + Bfnew
Where:
Pmax = WTP value for improvement of facility.
Q1 = existing number of users.
Qnew = projected total number of users.
User benefits for improved facility

Page 8-11
The NZ Transport Agency’s Economic evaluation manual (volume 2) First edition, Amendment 0 Effective from January 2010
8.7 Facility user benefits continued
A composite benefit of $2.70 per pedestrian per kilometre of new facility may be applied to pedestrians using a new facility. The composition of the benefit is shown in table 8.2.
Table 8.2: New pedestrian facility benefits ($/pedestrian km – 2008)
Benefit Benefit per pedestrian (km)
Health 2.60
Safety 0.00
Composite benefits for footpaths and other pedestrian structures
Road traffic reduction 0.10
Composite benefit 2.70
Where a new facility eliminates or improves a site that is an impediment to safe walking, a benefit of $2.70 may be ascribed to pedestrians using the facility. The benefit is irrespective of the length of work. It uses the average pedestrian trip length of one km times the composite benefit given above.
A composite benefit of $1.45 per cyclist per kilometre of new facility may be used for cyclists using the facility. The composition of this benefit is shown in table 8.3.
Table 8.3: New cycle facility benefits ($/cyclist km - 2008)
Benefit Benefit per cyclist (km)
Health 1.30
Safety 0.05
Road traffic reduction 0.10
Composite benefit 1.45
Composite benefits for cycle lanes, cycleways or increased road shoulder widths
It is assumed that provision of facilities that enhance the cycling environment will encourage existing cyclists to continue using that mode of transport.
Where a new facility eliminates or improves a site that is an impediment to safe cycling, a benefit of $4.35 may be ascribed to cyclists using the facility. The benefit is irrespective of the length of work. It uses the average cycle trip length of three kilometres times the composite benefit given above.
Combined modes Activities that combine walking and cycling may claim benefits for both modes but safety issues arising from pedestrian/cycle conflicts must be addressed and if there are additional accidents these must be accounted for in the evaluation.

Page 8-12
The NZ Transport Agency’s Economic evaluation manual (volume 2) First edition, Amendment 0 Effective from January 2010
8.8 Disbenefits during implementation/construction
Disruption to existing transport service users
Disruption costs to existing users of walking and cycling facilities during the implementation of new or improved facilities shall be included in the evaluation as a disbenefit (negative benefit).
Possible disbenefits include:
increased travel time travel discomfort.
Disruption costs to wider community
Determine any significant costs of disruption to the wider community during the implementation/construction process.
Page 8-13
The NZ Transport Agency’s Economic evaluation manual (volume 2) First edition, Amendment 0 Effective from January 2010
8.9 Other benefits and national strategic factors
Community liveability Community liveability benefits resulting from new or improved pedestrian or cycle facilities are proportional to the change in average distance to such a facility from residences in the community. These benefits will only be significant if a network of facilities is provided.
Increased consumer travel options
It is assumed that the benefit of improved consumer travel options is included in the various WTP values used in the evaluations.
National strategic factors
When evaluating walking and cycling facilities it is expected that most, and in many cases all, of the benefits will relate to the tangible user and road traffic reduction benefits and other monetised effects. However, despite the wide range of factors currently taken into account there may also be certain national strategic factors (NSF) that could be considered for inclusion in the analysis, particularly for large activities. NSFs are described in section 2.3 and appendix A10 of EEM1.

Page 8-14
The NZ Transport Agency’s Economic evaluation manual (volume 2) First edition, Amendment 0 Effective from January 2010
8.10 Costs
Introduction The costs of walking and cycling facilities include the net costs to the NZTA and approved organisations of:
investigation and design implementation/construction, including property and supervision maintenance operating monitoring.
Refer also to section 3.7.

Page 8-15
The NZ Transport Agency’s Economic evaluation manual (volume 2) First edition, Amendment 0 Effective from January 2010
8.11 Period of analysis
Introduction The period of analysis for activities is usually 30 years from the start of construction. For walking and cycling facility a shorter period maybe appropriate.
Example: The facilities may have a life of 10 – 15 years.

Page 8-16
The NZ Transport Agency’s Economic evaluation manual (volume 2) First edition, Amendment 0 Effective from January 2010
8.12 Cost benefit analysis
Introduction It is only necessary to calculate the national benefit cost ratio (BCRN), as described in section 2.9 of EEM1, for walking and cycling facility.
The BCRN for walking and cycling facilities is:
PV of national economic benefits
National benefit cost ratio for walking and cycling facilities
BCRN = PV of national economic costs
National economic benefits = net user benefits plus net road traffic reduction benefits plus other net monetised benefits.
National economic costs = net costs to the NZTA and approved organisations.
Simplified procedure Simplified procedure SP11 provides a standard procedure with worksheets for evaluating the economic efficiency of walking and cycling facilities where the undiscounted cost of the facilities is up to one million, with the exception of signalised crossings over roads.

Page 8-17
The NZ Transport Agency’s Economic evaluation manual (volume 2) First edition, Amendment 0 Effective from January 2010
8.13 Alternatives and options
Introduction In most situations, there is a variety of means (alternatives) of achieving the objective that a walking and cycling facility seeks to address.
Options may include different standards or configurations of the activity and different service levels.
Rules Where feasible alternatives to the activity exist, they must be described and included in the evaluation.
Where appropriate, different service levels shall be evaluated as options.
All walking and cycling facility evaluations shall consider the status quo road or road network, as appropriate, and any practical road improvements as alternatives or part of options. The status quo road or road network will normally be part of the do minimum.
All investment plans and proposed service changes that relate to the alternatives and options during the period of analysis shall be taken into account.
Number of options All realistic options shall be evaluated to determine the optimum economic solution.
Incremental analysis The incremental analysis process for evaluation of options for walking and cycling facility is the same as the incremental benefit cost ratio (BCR) process described in section 2.10 of EEM1, with the exception that the components described in this volume are used in the calculation.
The incremental analysis should be presented on an adapted copy of worksheet 4 (EEM1).
All impacts (positive and negative) for which monetary values have been estimated should be included in the total benefits of the options when undertaking incremental analysis.
Target incremental BCR
The target incremental BCR when undertaking incremental analysis of walking and cycling facility options shall be as specified in appendix A12 in EEM1.

Page 8-18
The NZ Transport Agency’s Economic evaluation manual (volume 2) First edition, Amendment 0 Effective from January 2010
8.14 Sensitivity analysis
Possible significant factors
Inputs to walking and cycling facility evaluations that should be considered for sensitivity testing include:
demand estimates major contributors to benefits.
Major contributors to benefits
Benefits critical to the outcome of the evaluation may include:
pedestrian and cyclist volumes, particularly model results, growth rates and the assessment of diverted and generated traffic
accident reduction.
For each significant factor the following must be listed:
the assumptions and estimates on which the evaluation has been based an upper and lower bound of the range of the estimate the resultant BCR at the upper and lower bound of each estimate.
Incremental analysis The results of incremental analysis shall be sensitivity tested using an incremental BCR 1.0 higher than the target incremental BCR.
Results of sensitivity tests
The results of the sensitivity tests, along with explanation of any assumptions or choice of test, shall be reported in a format similar to worksheet 6 in EEM1.

Page 8-19
The NZ Transport Agency’s Economic evaluation manual (volume 2) First edition, Amendment 0 Effective from January 2010
8.15 Cycle demand analysis
Estimate cycle demand
The worksheet in section 8.15 calculates the demand for a new cycle facility. It is designed to be used when traffic counts have not been carried out or are unreliable or unavailable.
The likelihood multiplier is an adjustment for the likelihood of new cyclists using the facility in each buffer. Cyclists further from the facility are less likely to use it.
The buffer distances are defined as <0.4, 0.4 - 0.8 and 0.8 - ≤1.6 km. These represent the area from the facility which is likely to be affected by the proposal. When calculating the area of each buffer, the areas of buffers between it and the facility need to be excluded.
Cycle demand indicators
The cycle demand indicator table (table 8.4) is based on journey to work from the New Zealand census 2001 to 2006 by territorial authority area. These indicators were prepared excluding ‘worked at home’ and ‘did not go to work’ modes. More localised or recent data should be used if available.

Page 8-20
The NZ Transport Agency’s Economic evaluation manual (volume 2) First edition, Amendment 0 Effective from January 2010
8.15 Cycle demand analysis continued
Cycle demand worksheet
New and existing cyclists
Buffers (km) <0.4 0.4 to <0.8 0.8 to ≤1.6
1 Area (km2)
2 Density per square kilometre
3 Population in each buffer (3) = (1) × (2)
4 Total population in all buffers (Sum of (3))
5 Commute share (single value for all) %
6 Likelihood of new cyclist multiplier 1.04 0.54 0.21
7 Row (7) = (3) x (6)
8 Sum of row (7)
9 Cyclist rate (9) = ((5) x 0.96) + 0.32% %
10 Total existing daily cyclists (10) = (4) × (9)
11 Total new daily cyclists (11) = (8) x (9)

Page 8-21
The NZ Transport Agency’s Economic evaluation manual (volume 2) First edition, Amendment 0 Effective from January 2010
8.15 Cycle demand analysis continued
Table 8.4: Cycle demand indicators
Territory authority area Commute share 2006
Annual growth (2001 – 2006)
Territory authority area Commute share 2006
Annual growth (2001 – 2006)
Far North District 0.7% -11% Manawatu District 2.1% -7%
Whangarei District 1.4% -4% Palmerston North City 5.4% -6%
Kaipara District 1.0% -9% Tararua District 1.5% -10%
Rodney District 0.5% -5% Horowhenua District 2.6% -9%
North Shore City 0.8% -3% Kapiti Coast District 1.7% -5%
Waitakere City 0.9% -4% Porirua City 0.6% -4%
Auckland City 1.5% -1% Upper Hutt City 1.7% -7%
Manukau City 0.6% -7% Lower Hutt City 1.5% -6%
Papakura District 0.8% -7% Wellington City 2.5% 0%
Franklin District 0.5% -9% Masterton District 3.5% -8%
Thames-Coromandel District 3.0% -2% Carterton District 1.8% -9%
Hauraki District 1.5% -11% South Wairarapa District 1.5% -12%
Waikato District 1.1% -7% Tasman District 5.1% 0%
Matamata-Piako District 1.8% -8% Nelson City 6.8% -1%
Hamilton City 3.2% -8% Marlborough District 4.6% -5%
Waipa District 1.3% -8% Buller District 3.9% 8%
Otorohanga District 0.9% -12% Grey District 2.0% -13%
South Waikato District 2.4% -10% Westland District 3.9% -10%
Waitomo District 0.8% -13% Kaikoura District 4.5% -7%
Taupo District 1.7% -7% Hurunui District 1.9% 1%
Western Bay of Plenty District 0.9% -6% Waimakariri District 1.9% -4%
Tauranga City 2.5% -6% Christchurch City 6.1% -3%
Rotorua District 2.2% -6% Selwyn District 2.7% -5%
Whakatane District 2.9% -7% Ashburton District 3.9% -5%
Kawerau District 3.4% -10% Timaru District 3.3% -7%
Opotiki District 1.5% -6% Mackenzie District 3.7% -7%
Gisborne District 3.4% -4% Waimate District 2.2% -8%
Wairoa District 2.3% -2% Chatham Islands Territory 1.1% -
Hastings District 3.3% -6% Waitaki District 2.4% -4%
Napier City 3.7% -2% Central Otago District 3.4% -6%
Central Hawke's Bay District 0.9% -8% Queenstown-Lakes District 2.3% -5%
New Plymouth District 2.5% -4% Dunedin City 1.8% -9%
Stratford District 1.0% -9% Clutha District 1.1% -9%
South Taranaki District 3.0% -7% Southland District 1.5% -6%
Ruapehu District 2.4% -11% Gore District 1.9% -7%
Wanganui District 3.9% -8% Invercargill City 2.2% -10%
Rangitikei District 1.9% -9%

Page 8-22
The NZ Transport Agency’s Economic evaluation manual (volume 2) First edition, Amendment 0 Effective from January 2010
8.16 References
1. Barnes G, Krizek KJ, Mogush P and Poindexter G (2005) Guidelines for analyzing the benefits and costs of bicycle facilities.
2. Fallon CO and Sullivan C (2006) Increasing cycling and walking: An analysis of readiness to change. Land Transport New Zealand research report 294.
3. Francis T, Roozenburg AP and Turner SA (2006) Predicting accident rates for cyclists and pedestrians. Land Transport New Zealand research report 289.
4. Land Transport Safety Authority (2004) Cycle network and route planning guide.
5. Land Transport New Zealand (2006) Pedestrian planning and design guide.
6. Ministry of Transport (2005) Getting there – on foot, by cycle.
7. Transportation Research Board (2006) Guidelines for analysis of investments in bicycle facilities. NCHRP report 552.

Page 9-1
The NZ Transport Agency’s Economic evaluation manual (volume 2) First edition, Amendment 0 Effective from January 2010
9.0 Evaluation of education, promotion and marketing
9.1 Overview
9.1 Overview 9-1
9.2 Travel impacts 9-2
9.3 Costs 9-5
9.4 Benefits 9-6
9.5 Period of analysis 9-8
9.6 Cost benefit analysis 9-9
9.7 References 9-11
Introduction This chapter describes methods for economic efficiency evaluation of improved facilities for walking and cycling. The improvements may be of two types:
route improvements (provision of new or improved paths, lanes or other facilities for pedestrians or cyclists)
improvements at hazardous sites (provision of overbridges, underpasses, bridge widening or intersection improvements)
The simplified procedure SP11 in chapter 13 can be used for evaluating new or improved walking and cycling facilities.
Cycling and walking promotion is addressed in chapter 9.
Integration with other transport demand management initiatives
For walking and cycling activities to be effective, provision of continuous lanes or paths should be provided with secure cycle parking, signage, maps, education, promotion, marketing and integration of the routes with passenger transport. All these components should be addressed within a walking and cycling strategic plan and an implementation package.
Reference 1 sets out a framework and priorities for development of walking and cycling. Reference 2 provides guidance for cycle network and route planning and reference 3 provides guidance for planning and design for pedestrians.
Because of synergetic impacts, evaluation of walking and cycling should be done at the package level rather than just for individual components.
In this chapter Section Page

Page 9-2
The NZ Transport Agency’s Economic evaluation manual (volume 2) First edition, Amendment 0 Effective from January 2010
9.2 Travel impacts
Introduction Overseas experience shows that the most effective (and lowest cost) way to encourage people to change their travel behaviour is to provide them with customised information about what is available locally. Travel plans targeting workplaces, schools, or households and communities are one type of programme for doing this.
The impact on travel is dependent on factors such as:
actual features of the plan commitment of the target population availability of material that assists people’s understanding of the implications
of different forms of travel behaviour availability of suitably trained and experienced people to establish and
manage the proposal.
Cost efficiencies and effectiveness are enhanced when school, business, household and community initiatives are implemented simultaneously rather than separately in an area. These programmes should, therefore, be implemented by geographic area rather than by type.
The target population is the total population of the workplace, school, or community in which the programme is being implemented. It includes the people who do not participate in the programme and those who participate but do not change their behaviour.
Type of programme Definition of target population
Workplace The total workforce (number of employees) at the workplace covered by the travel plan. Make appropriate adjustment if a significant proportion of employees work more or less than the standard five days per week.
School The total school roll. If this is expected to vary significantly in the next few years use an appropriate average.
Household and community
The total population of the community/suburb/area in which the household or community based programme is being implemented.
Target population for travel plans
Diversion rates Standard diversion rates between modes have been derived for TBhC activities based on experience to date. These are described in the following sections.
When conducting initial indicative evaluations for development funding for workplace and school travel plans the diversion rate should be selected based on the proponent’s knowledge of the organisations involved and the area. For the final evaluation for implementation funding the diversion rate will be based on the actual features of the completed plan.

Page 9-3
The NZ Transport Agency’s Economic evaluation manual (volume 2) First edition, Amendment 0 Effective from January 2010
9.2 Travel impacts continued
There are two sets of diversion rates for workplace travel plans:
standard – where no passenger transport improvements are proposed, and alternative – where there are proposed passenger transport improvements.
Within these two sets of diversion rates, a scoring system is used to select the appropriate profile for a given workplace travel plan. The score, out of six, is assigned based on the responses to the questions in the table below.
Yes No
Is parking availability constrained at the workplace? 1 0
Does the proposed workplace travel plan include:
One or more parking management strategies*? 1 0
Improvements to cycling/walking facilities? 1 0
Ridesharing matching service? 1 0
Passenger transport service improvements or company transport? 1 0
Passenger transport subsidies? 1 0
Total score:
*Strategies for managing parking demand include activities such as parking charges, reduced supply
of parking spaces, parking ‘cash-out’ scheme, etc. Use the total score from above in table 9.1. First,
obtain the reduction in the target population of car drivers assigned across the other modes of
transport.
Table 9.1: Workplace diversion rates
Reduction in target population Mode share of the mode change
Score Reduction in car as
driver
Car as passenger
Passenger transport
Cycling Walking
Standard – without passenger transport measures
Low 1 or 2 0.0% 0% 0% 0% 0%
Medium 3 or 4 -5.0% 26% 26% 12% 36%
Alternative – with passenger transport/company measures or improvements
Low 1 or 2 0.0% 0% 0% 0% 0%
Medium 3 or 4 -5.0% 26% 52% 6% 26%
High 5 or 6 -12.9% 26% 57% 8% 26%
Workplace travel plans
The standard diversion rate values are applicable in most situations where no significant passenger transport measures are included in the workplace travel plan. The alternative ‘with passenger transport service improvements’ diversion rate values are applicable when significant passenger transport service improvements (including company provided transport), subsidy schemes, or other similar measures (covered by the last two questions in the scoring table) are part of the workplace travel plan.

Page 9-4
The NZ Transport Agency’s Economic evaluation manual (volume 2) First edition, Amendment 0 Effective from January 2010
9.2 Travel impacts continued
There are two default diversion rate profiles for schools, one for primary and another for intermediate and secondary schools. Assign the change in car passengers across passenger transport, cycling and walking.
Table 9.2: School diversion rates
Reduction in target population Mode share of the mode change
School type Car as driver Car as passenger
Passenger transport
Cycling Walking
Primary 0.0% -9.0% 0% 17% 83%
Secondary/ intermediate
0.0% -9.0% 55% 6% 39%
School travel plans
The standard diversion rate value is applicable for most activities.
The low diversion rate is applicable in situations where:
the activity will implement fewer measures than ‘usual’ household based programmes, eg a community travel awareness campaign on its own would not achieve the standard diversion rate
public transport services and cycling/walking facilities in the area are poor and no significant changes to these are envisaged as part of the travel behaviour change (TBhC) proposal.
Assign the changes in car drivers and car passengers across passenger transport, cycling and walking.
Table 9.3: House hold and community diversion rates
Reduction in target population Mode share of the mode change
Car as driver Car as passenger
Passenger transport
Cycling Walking
Low -1.0% -0.2% 42% 25% 33%
Standard -3.1% -0.5% 39% 25% 36%
Household and community-based activities

Page 9-5
The NZ Transport Agency’s Economic evaluation manual (volume 2) First edition, Amendment 0 Effective from January 2010
9.3 Costs
Introduction Refer to section 3.7 for the components of cost that should be considered.
The availability of suitably trained and experienced people to establish and manage travel plans is an important aspect of this type of intervention. This can be a sizeable part of the cost and must be allowed for.
The cost of annual expenditure required to maintain the benefits of travel plans over the evaluation period following completion of the activity should be estimated based on local experience and knowledge. For household/community based activities this is generally zero unless the activity contains specific plans for follow-up measures. For workplace and school travel plans it is likely that some ongoing maintenance expenditure will be required to maintain benefits.

Page 9-6
The NZ Transport Agency’s Economic evaluation manual (volume 2) First edition, Amendment 0 Effective from January 2010
9.4 Benefits
Introduction The evaluation procedure for TBhC activities include the following main benefit categories:
benefits to people that change their travel behaviour benefits to remaining road users (road traffic reduction and safety) health other monetised impacts including environmental effects.
Road construction, maintenance and operating cost savings
These are assumed to be negligible for the number of private vehicle trips and/or vehicle kilometres that are likely to be removed by TBhC activities.
Composite benefit values have been derived for a range of TBhC activity types and situations. The composite benefit values include benefits to the persons changing their travel behaviour as well as benefits to remaining road users and the general community, such as reduced health costs and accident cost savings, vehicle operating cost (VOC) savings and environmental benefits. Composite benefit values are the average annual benefit for all people in the workforce, school or community targeted by the TBhC activity (and take account of the proportion that do not participate or change their travel behaviour).
The composite benefits also incorporate the default diversion rate assumptions for each TBhC activity type (see section 9.2 Travel impacts) as well as the average trip length for each mode affected by the proposal. If evaluators consider they have strong reasons why a different diversion rate is more appropriate for the situation they can interpolate a composite benefit value (based on the values given below and the particular situation compared with the default diversion rates) for workplace travel plans, or use a computer spreadsheet programme (available from the NZ Transport Agency (NZTA)) to forecast a diversion rate and calculate a composite benefit value for any TBhC proposal.
Table 9.4: Workplace travel plan benefit ($/employee/year - 2008)
Workplace CBD Non-CBD Location
Diversion Low Medium High Low Medium High
Standard 0.00 188.51 0.00 165.51 Auckland
Alternative 0.00 214.47 616.23 0.00 191.47 556.89
Standard 0.00 170.88 0.00 147.88 Wellington
Alternative 0.00 191.97 554.77 0.00 168.97 495.43
Standard 0.00 61.97 0.00 61.97 Christchurch/ other
Alternative 0.00 58.21 196.51 0.00 58.21 196.51
Composite benefit values
Based on 100 percent of changed trips being in peak period.
Standard = without passenger transport improvements or subsidies.
Alternative = with passenger transport improvements or subsidies.

Page 9-7
The NZ Transport Agency’s Economic evaluation manual (volume 2) First edition, Amendment 0 Effective from January 2010
9.4 Benefits continued
Table 9.5: School travel plan benefit ($/student/year – 2008)
School type Location
Primary Secondary/intermediate
Auckland 85.35 141.74
Wellington 82.70 121.17
Christchurch/ other 74.83 77.97
School travel plan benefits
Based on 55 percent of changed trips being in peak period
Table 9.6: Household and community-based activity benefits ($/capita/year - 2008)
Level of diversion Location
Standard Low
Auckland 139.11 42.57
Wellington 158.72 49.25
Christchurch/ other 129.45 39.19
Household/ community-based activity benefits
Based on 15 percent of changed trips being in peak period

Page 9-8
The NZ Transport Agency’s Economic evaluation manual (volume 2) First edition, Amendment 0 Effective from January 2010
9.5 Period of analysis
Introduction A 10-year evaluation period is to be used for travel behaviour change (TBhC) and other education, promotion and marketing-based transport demand management (TDM) programmes. This reflects the assumption that benefits are sustainable largely without maintenance but there is an absence of experience with the durability of benefits beyond about five years. This could be reviewed in future in light of ongoing monitoring of this type of programme.

Page 9-9
The NZ Transport Agency’s Economic evaluation manual (volume 2) First edition, Amendment 0 Effective from January 2010
9.6 Cost benefit analysis
Simplified procedure Simplified procedure SP12 provides a standard procedure with worksheets for evaluating the economic efficiency of all TBhC programmes which may include the total cost of supporting infrastructure improvements and passenger transport service improvements.
Composite evaluation costs
Irrespective of the TBhC package composition, the total costs for all components of the package are included in the denominator of the benefit cost ratio. Where a new or improved passenger transport service is involved, the costs include the ’funding assistance‘ (the cost that needs to be funded by local and central government if the activity is to proceed).
Composite evaluation benefits
For the TBhC components in a package, the appropriate composite benefit value in section 9.4 is used to calculate the ’new user’ benefits for the TBhC target population/area.
The following procedure provides guidance as to the appropriate evaluation method to calculate benefits for existing users, and for new users from the population outside the TBhC target population/area, for:
new or improved passenger transport services new or improved walking or cycling facilities new or improved roading infrastructure of various types.
The numerator of the benefit cost ratio for a composite TBhC package is the sum of the TBhC benefits and the non-TBhC benefits.
Timing of mode shift and mode shift benefits
Gaining the full mode shift and benefits of the mode shift usually takes around three years to obtain and needs to be adjusted for. Maintaining this mode shift then requires constant investment of staff time and marketing resources in support of the activities.
Non-TBhC component Benefits to existing users and non-TBhC target population new users
Comments
New or improved passenger transport service.
Use the appropriate passenger transport service evaluation procedure to:
calculate benefits for existing users (whether inside or outside the TBhC target population area)
calculate benefits for new users and associated externality (remaining road user) benefits for the population located outside the TBhC target population area.
There is potential for double counting of new user benefits. Care must be taken not to count the TBhC benefits of the target population twice.
Treatment of non-TBhC benefits

Page 9-10
The NZ Transport Agency’s Economic evaluation manual (volume 2) First edition, Amendment 0 Effective from January 2010
9.6 Cost benefit analysis continued
Non-TBhC component Benefits to existing users and non-TBhC target population new users
Comments
New or improved cycle infrastructure.
Use the Walking and cycling simplified procedure to:
calculate the cycling benefits for existing users (whether inside or outside the TBhC target population area)
calculate the cycling benefits for any new users from the population located outside the TBhC target population area.
New or improved walking infrastructure
Consider if more walking trips will be created than is given by the TBhC evaluation diversion rates, the Walking and cycling simplified procedure can be used to estimate the additional benefits associated with the extra trips.
There is potential for double counting of new user benefits.
Roading
Bus priority lane/high occupancy vehicle lane
Road capacity improvements
Minor road improvements
Traffic calming
Use the relevant procedure from EEM1 to calculate all benefits associated with the roading component.
Minor road improvements includes improvements such as intersection treatment, parking changes, road crossings.
There is potential for double counting new user benefits where a bus priority lane is proposed – see ‘improvements to passenger transport services’ above.
Treatment of non-TBhC benefits continued

Page 9-11
The NZ Transport Agency’s Economic evaluation manual (volume 2) First edition, Amendment 0 Effective from January 2010
9.7 References
1. Land Transport New Zealand/Energy Efficiency and Conservation Authority (2004) Travel behaviour change guidance handbook.


Page 10-1
The NZ Transport Agency’s Economic evaluation manual (volume 2) First edition, Amendment 0 Effective from January 2010
10.0 Evaluation of parking and land use
10.1 Overview
10.1 Overview 10-1
10.2 Travel impacts 10-2
10.3 Business impacts 10-3
10.4 Equity impacts 10-4
10.5 Costs 10-5
10.6 Benefits 10-6
10.7 References 10-8
Introduction This chapter describes methods for economic efficiency evaluation of parking and land use proposals, which may comprise the whole of a transport demand management (TDM) programme or may be a component of a wider programme. The main focus of this chapter is on parking management with future additions to be made on land use management. Parking and land use strategies are described in section 2.4. Placing limits on parking supply is an important component of land use control for new developments.
Activities that employ parking and/or land use management to encourage alternative mode use may also have components of infrastructure provision/ improvement, passenger transport provision/improvement, or financial incentives/subsidies.
Reference 1 provides further information about parking and land use management.
Parking and land use management may be considered for funding by the NZ Transport Agency (NZTA) depending on the proposal and whether it is integral to the NZTA’s goals.
In this chapter Section Page

Page 10-2
The NZ Transport Agency’s Economic evaluation manual (volume 2) First edition, Amendment 0 Effective from January 2010
10.2 Travel impacts
Parking reduction Overseas experience suggests that the ability to reduce or limit car mode share to an area, workplace or institution is dominated by the availability of private vehicle parking.
A comprehensive parking management programme that includes several strategies (shared parking, more accurate parking requirements, pricing, cash out, etc) can often reduce private vehicle trips and therefore parking requirements. With appropriate parking management motorists still have adequate parking, although they may need to walk somewhat farther and/or pay directly rather than indirectly for parking.
Parking spill-over impacts
Abundant, free parking encourages driving and helps create dispersed, private vehicle-dependent land use patterns. Parking management can significantly reduce private vehicle travel, particularly if implemented as part of a comprehensive TDM programme.
Parking spillover problems can be addressed directly with management, pricing and enforcement strategies. On-street parking can be limited to residents, which can be enforced by issuing permits to residents, or simply in response to complaints. Residential neighbourhoods can be designated ‘parking benefit districts,’ where on-street parking is priced (residents can be exempt), with revenues used for neighbourhood enhancement or to reduce property rates. Another approach is to provide some sort of compensation to residents who experience parking problems.
Parking elasticity Private vehicle travel tends to be quite sensitive to parking supply and price. The price elasticity of parking is –0.1 to –0.3, meaning that a 10 percent increase in parking charges reduces driving by one to three percent. Charging cost-recovery prices (ie rates that recover the full costs of providing parking facilities) reduces drive alone commuting, particularly if implemented with other commute trip reduction strategies.
Parking management can help shift private vehicle travel to alternative modes, and improves access by creating more clustered, multi-modal land use patterns. As the number of parking spaces per employee in a commercial centre declines, use of alternative modes tends to increase.

Page 10-3
The NZ Transport Agency’s Economic evaluation manual (volume 2) First edition, Amendment 0 Effective from January 2010
10.3 Business impacts
Business impacts If building rent represents 20 percent of a business’s total costs, and parking represents 25 percent of rent costs, reducing parking costs by 40 percent results in a two percent reduction in total costs. If the business has a 10 percent profit margin, this increases profits by 20 percent.
Parking restrictions and pricing can reduce business activity in an area and shift travel to more suburban locations, although these impacts depend on specific conditions, including how prices are structured, and the quality of travel and location alternatives. When parking revenues are used to improve local streetscape conditions or to fund transport alternatives they can increase business activity in a downtown area.

Page 10-4
The NZ Transport Agency’s Economic evaluation manual (volume 2) First edition, Amendment 0 Effective from January 2010
10.4 Equity impacts
Parking The equity impacts of parking management depend on the type of measures used, where and how they are applied, and the quality of transport alternatives. Measures that reduce subsidies and charge motorists directly for the parking costs they impose tend to increase fairness (horizontal equity).
Some parking management measures, such as parking cash out and location efficient development can provide significant benefits to lower income and transport-disadvantaged people. Some parking management measures benefit people who are transport disadvantaged by helping to create less private vehicle-dependent land use patterns, and reducing the parking costs they bear through taxes, rents and employment benefits.
Parking pricing can be regressive, but overall equity impacts depend on how revenues are used and the quality of travel choices. If revenues are used to benefit lower income households and there are good travel alternatives to driving, pricing and taxes can be progressive overall.

Page 10-5
The NZ Transport Agency’s Economic evaluation manual (volume 2) First edition, Amendment 0 Effective from January 2010
10.5 Costs
Increased management and transaction costs
Parking management often increases administrative responsibilities for public officials and facility managers, and additional responsibilities and inconvenience on motorists.
Parking charges and restrictions in one area may cause motorists to park in other areas where they create congestion problems. This may increase management and enforcement costs, and create conflicts between neighbours.
Parking cost savings Parking cost savings depend on the ability of facility managers to sell, lease or rent excess parking capacity. For example, if a business has 100 parking spaces, and its commute trip reduction programme reduces demand to 60 parking spaces, it will have 40 parking spaces that are no longer needed. The business will need to sell, lease or rent these spaces, or convert the land to other uses, in order to benefit from this reduced demand.
Some counties use parking brokerage services, sometimes through a transport management association, a chamber of commerce or other organization to help businesses capture parking cost savings.
Reductions in parking facility costs are treated as cost savings and not benefits.

Page 10-6
The NZ Transport Agency’s Economic evaluation manual (volume 2) First edition, Amendment 0 Effective from January 2010
10.6 Benefits
Introduction Benefits of parking management that reduces total private vehicle trips include:
vehicle operating costs savings road accident cost savings transport user cost savings parking user cost savings reduced vehicle emissions other reduced environmental impacts improved community liveability increased transport options.
Parking user savings The magnitude of parking user savings (in financial terms) that result from parking management depends on specific conditions, including the cost per parking space and how much parking can be reduced.
The following gives an example of potential parking user cost savings. If a comprehensive parking management programme can reduce parking requirements by a third, and annualised parking facility costs average $1200 in urban conditions and $600 in suburban conditions, then:
cashing out free parking is equivalent to a three percent wage increase for an employee earning $40,000 per year at an urban location, and a 1.5 percent wage increase for suburban employees
if two parking spaces are currently included with accommodation, then decoupling parking (renting parking spaces separately) provides $100 monthly savings for an urban household that only owns one vehicle, and $200 monthly savings if it owns no vehicles. This represents a 12 – 25 percent reduction from an $800 per month rent or mortgage payment. Suburban households save half this amount, a 10 – 20 percent savings from a $500 per month rent or mortgage payment.
Parking resource cost corrections
As noted in section 3.8, it is necessary to make resource cost corrections to parking charges to recognise the true resource cost involved.
Community liveability Parking management allows greater flexibility in facility location and site design. It gives building managers and developers more options for dealing with parking problems. It gives communities more control over land use, allowing higher density, more walkable urban areas. It can facilitate the preservation of historic buildings and districts, and allows designers to position buildings to meet access, aesthetic and environmental objectives in ways that are impossible if parking requirements are inflexible. Such design flexibility is particularly important for infilling development and areas with high land costs, allowing redevelopment of central business districts and urban communities. Parking management is an important component of efforts to create more efficient and attractive urban conditions (new urbanisation).

Page 10-7
The NZ Transport Agency’s Economic evaluation manual (volume 2) First edition, Amendment 0 Effective from January 2010
10.6 Benefits continued
Reduced environmental impacts
Pavement imposes environmental impacts including reduced groundwater recharge, increased stormwater management requirements, reduced green space and wildlife habitat, and heat island effects. Parking consumes a significant portion of urban land, particularly in commercial and high density residential areas. Parking management can reduce the environmental impacts that result from urban sprawl.

Page 10-8
The NZ Transport Agency’s Economic evaluation manual (volume 2) First edition, Amendment 0 Effective from January 2010
10.7 References
1. Victoria Transport Policy Institute (www.vtpi.org/tdm/tdm12.htm) Online TDM encyclopedia. Parking management (www.vtpi.org/tdm/tdm28.htm). Land use management (www.vtpi.org/tdm/tdm104.htm).

Page 11-1
The NZ Transport Agency’s Economic evaluation manual (volume 2) First edition, Amendment 0 Effective from January 2010
11.0 Evaluation of private sector financing and road tolling
11.1 Overview
11.1 Overview 11-1
11.2 Method of evaluation 11-2
11.3 Stages of analysis 11-4
11.4 Do-minimum 11-5
11.5 Travel impacts 11-6
11.6 Costs 11-7
11.7 Benefits 11-8
11.8 Period of analysis 11-10
11.9 Financial evaluation 11-11
11.10 Cost benefit analysis 11-13
11.11 Alternatives and options 11-15
11.12 Sensitivity and risk analysis 11-16
11.13 References 11-17
Introduction This chapter describes methods for evaluation of activities involving private sector financing, and road tolling activities. Section 2.3 describes road tolling.
Private sector financing and tolling provide alternatives to government funded transport infrastructure. Reference 3 provides guidance on private sector participation in provision of public infrastructure.
In New Zealand, road tolling can currently only be used in conjunction with a new road and this will generally be within a network of otherwise ‘free’ roads. This has implications for:
traffic distribution/assignment environmental impacts economic efficiency financial – toll level and fundability of the new road design of the new road and toll facility.
In this chapter Section Page

Page 11-2
The NZ Transport Agency’s Economic evaluation manual (volume 2) First edition, Amendment 0 Effective from January 2010
11.2 Method of evaluation
Introduction As well as economic efficiency, social and environmental objectives, financial considerations must be taken into account when evaluating activities involving private sector financing and activities with road tolling. An effective community consultation process is essential for road tolling activities.
In principle, the economic efficiency evaluation of toll options is no different from that for other (non-pricing) options for any proposal. However, the following issues warrant particular attention:
the range of options considered the treatment of value of time savings the composition and application of benefit cost ratios.
Consumer surplus Consumer surplus methodology must be used for evaluation of road tolling activities because motorists’ behaviour in response to various levels of tolls (including no toll) must be determined and therefore a measure of the willingness to pay. Stated preference (SP) surveys or possibly, revealed preference (RP) data, need to be used to give a general cost equation (combining travel time, vehicle operating cost (VOC) and toll charge).
Range of options Economic efficiency evaluation of road tolling activities must be undertaken with and without the tolls in place, as alternatives and options are required to be considered under the Land Transport Management Act 2003. As well, financial analysis is required of the toll options.
Financial analysis is used to determine the optimum tolls, choices of debt financing, optimum borrowing, and timeframe for implementing tolls. The imposition of tolls has consequences in terms of changing the demand for the facility, diverting traffic onto other facilities, increasing the costs due to toll collection, and other issues.
Methods of setting tolls
There are a number of approaches to setting charges for a toll road where other routes are ‘free’. Three of the most common approaches are:
a pricing policy where economic welfare as defined by the benefit cost ratio (BCR) is maximised
a revenue maximising pricing policy where service provider revenue is maximised
a ‘network optimisation’ pricing level which seeks to optimise the performance of the network in terms of total travel times or average network speeds.
In practice, all these three considerations and possibly others may need be taken into account in reaching a toll regime which that meets the overall objectives of the proposal.

Page 11-3
The NZ Transport Agency’s Economic evaluation manual (volume 2) First edition, Amendment 0 Effective from January 2010
11.2 Method of evaluation continued
Value of travel time For most transport activities, an average value of time is used in economic efficiency evaluations, ie the same unit values are used for motorists from more affluent households and for those from less affluent households. This is essentially an ‘equity’ approach (to avoid favouring activities used by higher income groups). It also makes the economic evaluation easier. This averaging approach is not of major consequence for most situations.
However, it has important implications for toll roads, particularly when comparing the economic merits of tolled vs. untolled options. An ‘equity’ value of time will substantially over-estimate the perceived disbenefits of tolling. The extent of distortion is directly related to the spread of the behavioural value of travel time.
Evaluation of toll roads (including tolling policies) must use a distribution of values of travel time consistent with users’ willingness to pay (WTP) values established through SP surveys or other means. A consistent distribution of values of travel time must be used in both the traffic modelling and economic efficiency evaluation.
When investigating options and alternatives, behavioural values can be used to calculate initial user benefits, with the overall results adjusted to the average value of travel time between the behavioural and equity values for consistency with other activities.

Page 11-4
The NZ Transport Agency’s Economic evaluation manual (volume 2) First edition, Amendment 0 Effective from January 2010
11.3 Stages of analysis
Stages The following are essential steps for consideration of a road tolling proposal:
ensure that the need for the activity and the benefits to the community have been identified and maximised
explore alternative solutions, including non-capital options identify risks and returns and determine appropriate allocation among
relevant parties establish the nature and extent of community support likely to be required.
Concession agreements
The purpose of private sector activities is to involve private sector funds in community facilities. When considering private sector financing of a facility, a concession agreement, the following steps should be taken:
ensure that any private sector involvement is commercially feasible and offers a more cost-effective solution that the traditional public sector approach
only private sector options that reduce public sector costs should remain in the final set of options under consideration
ensure that any commercial arrangement with the private sector is appropriate and that any probity and accountability requirements have been met
identify the degree to which risks can be shared with, or assumed by, private sector participants.
Options with private sector financing can lead to an earlier start date, depending on the ability of the private sector to raise funds. Also, there is usually an incentive for early completion of privately financed activities since revenue starts to accrue upon completion of work.
Concessionaries may propose arrangements where the government provides substantial initial funding for which repayments are made over time, generally from the activity income. This type of arrangement is, in effect, a loan and should be identified as such.

Page 11-5
The NZ Transport Agency’s Economic evaluation manual (volume 2) First edition, Amendment 0 Effective from January 2010
11.4 Do-minimum
Introduction The do-minimum for evaluating activities with public sector financing and/or road tolling is typically the existing road network with minor improvements and the provision of the new road at a much later date.

Page 11-6
The NZ Transport Agency’s Economic evaluation manual (volume 2) First edition, Amendment 0 Effective from January 2010
11.5 Travel impacts
Introduction The draft Transit New Zealand’s Implementation guide for finance and toll proposals (reference 1) provides guidance on the traffic/toll modelling requirements and methods for assessing toll route feasibility.
Traffic modelling Traffic modelling for a tolled road (and the surrounding road network) is an essential input to evaluation. The main purpose of the assignment part of the traffic modelling is to forecast traffic volumes (and corresponding traffic speeds) on each part of the road network and particularly on the toll road. The toll road traffic volumes in turn determine toll revenues.
For accurate forecasting of route choice between the toll road and alternative routes, it is important to take into account the full range of behavioural preferences of potential users of the toll road. This generally requires more sophisticated choice models and a better understanding of motorists preferences than is the cases in standard traffic models.
Traffic modelling used for road tolling activities should take into account behavioural responses such as:
peak spreading/contraction trip end redistribution modal shift trip generation/suppression.
The split of traffic between the toll road and alternative routes is likely to be sensitive to the level of congestion on the road network and the mix of trip purposes by time of day/day of week. Therefore, detailed traffic modelling must separately consider periods with differing levels of congestion. Expansion or annualisation factors need to be applied separately to the results for each of these periods based on the characteristics of the toll route traffic rather than the traffic volumes in general.

Page 11-7
The NZ Transport Agency’s Economic evaluation manual (volume 2) First edition, Amendment 0 Effective from January 2010
11.6 Costs
Introduction Costs need to be viewed from both an economic and financing point of view.
Affect of public sector financing and tolling
The public sector financing and/or toll charges reduce the effective activity costs to the government.
Even if a activity is totally funded by the private sector, there will still be some costs to government agencies, such as contract preparation and ongoing contract management and monitoring. The cost of these activities should be included in the cost of the option involving private sector financing.
Similarly the additional cost of toll infrastructure and toll collection must be included in the tolling option.

Page 11-8
The NZ Transport Agency’s Economic evaluation manual (volume 2) First edition, Amendment 0 Effective from January 2010
11.7 Benefits
Introduction Once traffic impacts have been determined, the calculation of national economic benefits follows in the normal manner but using the disaggregated WTP values for travel time for benefits or disbenefits (see section 11.2).
Tolled versus untolled roads
When users are required to pay tolls on a route, some will choose to avoid the toll by using alternative routes if they are available. The toll charges change the benefits that would otherwise be received by road users in the following ways:
for those motorists that continue to use the toll road, benefits are reduced by the extent of the toll charge
the benefits to users on the toll road may be increased due to less congestion on the tolled facility
for those that would have used the new road if it was not tolled but decide to divert to a ‘free’ road because of the toll, travel time and perhaps vehicle operating costs are likely to increase
for those that would have continued to use alternative routes even if the new road was not tolled, benefits are likely to be reduced because of more congestion.
Environmental and community benefits may also change with a tolled road compared to leaving the road untolled. Possibilities include:
overall vehicle use use of carpools level of public transport use options to develop public transport overall pollution degree of decentralisation local area traffic management timing of infrastructure provision.
It may not be possible to put values on all these items, but they need to be considered for a tolled facility.

Page 11-9
The NZ Transport Agency’s Economic evaluation manual (volume 2) First edition, Amendment 0 Effective from January 2010
11.7 Benefits continued
Tolls Tolls are payment by road users for the right to travel on a particular road. In economic efficiency terms the tolls can be viewed in three ways:
If the facility is government funded, the tolls are simply a transfer payment between those motorists who pay them and the government.
If the facility is privately financed and the concessionaire (with its toll level proposal) is selected by competitive tendering, then the toll charges also represent a true market price, ie the resource cost, for that part of the activities. Any government contribution or expenditure is also part of the activity cost.
Alternatively, tolls can be related to negative benefits (disbenefits). The effect of the toll is to reduce overall public benefits. If a particular road user would achieve a benefit of say $3 by using a new toll road, but must pay a toll of $2, then the net benefit is only $1 if the tolled road is used. The loss of benefits by those who continue to use the ‘free’ route will be somewhere between zero (because there would be no benefit in using the tolled route even if there was no toll) and the cost of the toll ($2).
The present value (PV) of gross toll collections is the same, regardless of which way they are viewed. Provided that tolls are not double counted, the net PV of the activity (PV of benefits minus PV of costs) is also independent of the way tolls are viewed.
Road traffic reduction Some trips that would use the new route if it was ‘free’ will be deterred from its use by the charges and will continue to use the existing network. Hence the extent of traffic reduction on existing roads, provided by the new route is less than would be achieved if the new route were ‘free’.
Disbenefits during construction
The costs of dislocation and traffic disruption during construction should be included as negative benefits for all options. These may be different for an untolled road compared to a tolled road (particularly if the construction period is different).

Page 11-10
The NZ Transport Agency’s Economic evaluation manual (volume 2) First edition, Amendment 0 Effective from January 2010
11.8 Period of analysis
Introduction Timing of construction start is an important consideration for activities involving private sector financing and/or road tolling. These strategies are often used to allow an earlier start for the activity than that which would apply without these funding sources. The analysis period (see section 3.7 of the NZTA’s Economic evaluation manual volume 1 (EEM1)) for all activity options should be extended to capture the activity benefits over the useful life of all the options.
With activities involving private sector financing, and particularly tolling, there is usually also an incentive for early completion of the activity as revenue starts to accrue upon completion of the proposal.

Page 11-11
The NZ Transport Agency’s Economic evaluation manual (volume 2) First edition, Amendment 0 Effective from January 2010
11.9 Financial evaluation
Introduction Financial analysis is a method to evaluate the viability of an activity by assessing its cash flows. This differs from economic evaluation in the:
scope of investigation range of input methodology used.
Financial analysis views the costs and revenues of the activity from a ‘commercial’ investment point of view, ie the cashflow impact on government and any private sector party. By contrast economic efficiency analysis also considers external benefits and costs of the activity whether or not they involve monetary payments.
Other differences include:
Market prices and valuations are used in assessing benefits and costs in financial analysis, instead of measures such as willingness to pay and opportunity cost used in economic analysis. Market prices include all applicable taxes, tariffs, trade mark-ups and commissions.
The discount rate used in financial analysis represents the weighted average costs of debt and equity capital rather than the estimated social opportunity cost of capital.
The discount rate used in financial analysis and the cashflows to which it is applied are usually specified in nominal terms (allowing for future inflation), as the cost of debt and equity are observed only in nominal terms.
Undertaking an economic evaluation does not remove the need for a financial evaluation.
Feasibility of private sector financing
Where consideration is being given to private sector involvement in financing land transport infrastructure, it is important to ensure that the involvement is commercially feasible and that it offers a more cost-effective solution that the traditional public sector funding approach.
Cash flows to be measured
All incremental costs, revenues and risks associated with an activity and its best alternative should be identified and measured as nominal cashflows in the period in which they occur. Cashflows should be on an after tax basis. An estimate of the asset’s salvage value must be included at the end of the analysis period to represent the asset’s remaining service potential. The salvage value should not be such as to bias the viability of the proposal.
Typical inward cashflows to be considered include:
operating revenues subsidies from external parties operational savings occurring in other areas as a result of the proposal sale of surplus assets residual values of assets.

Page 11-12
The NZ Transport Agency’s Economic evaluation manual (volume 2) First edition, Amendment 0 Effective from January 2010
11.9 Financial evaluation continued
Cash flows to be measured continued
Typical cash outflows to be considered include:
capital costs (including land, equipment, buildings) maintenance and operating costs taxes, were appropriate operating lease payments contract termination payments revenue losses to existing operations affected by the proposal the opportunity cost of resources (including land) that would otherwise be
available for sale or lease.
Treatment of specific items
Financing costs (interest) should be excluded in the cashflows because the opportunity cost of debt is accounted for in the weighted average cost of capital (WACC).
Accounting, depreciation, economic multiplier effect and sunk costs should be excluded in the financial analysis.
The effect of dividend imputation needs to be taken into account in the financial analysis.
Operating leases should be evaluated in the form of a series of regular payments and compared to an outright purchase alternative, with consideration for the value of options such as renewal or purchase rights if these features are present. Financing leases do not form part of a financial analysis as these are merely an alternative means of financing the proposal.
Weighted average cost of capital
The WACC is used in financial analysis. The WACC is the weighted average of the required return on equity and the (interest) cost of any debt financing.
The WACC should reflect the appropriate risk and norms associated with the industry.
Summary measures of commercial merit
The more common measures for evaluating the financial viability of an activity are, for example:
net present value (NPV) of cash flows NPV per $ of capital invested (NPVI) internal rate of return (IRR) of cash flows payback period profitability indices.
Measures used in commercial evaluations will vary between activities and private sector proponents. Specialist advice should be sought on financial evaluations and detailed descriptions of these evaluations are not included here.

Page 11-13
The NZ Transport Agency’s Economic evaluation manual (volume 2) First edition, Amendment 0 Effective from January 2010
11.10 Cost benefit analysis
Introduction As noted in section 11.2, while the basic principles of economic evaluation apply to the evaluation of toll road activities and activities involving private sector financing, some adjustment is required to the composition and application of benefit cost ratios.
Present value of tolls In PV calculations, all government costs and user costs and benefits are presumed to increase with inflation. When this is the case, the discount rate is used to determine the PV of unescalated costs and benefits in economic analysis, and no adjustment is made for inflation.
With private sector financed activities, a rise and fall clause relating to tolls is likely to be included in the conditions. The gross toll collections for each vehicle category for each year of the activity will need to be estimated. If tolls are regularly changed in line with general inflation in the economy, then the normal inflation free discount rate can be used to determine present values only if the escalating effects of the clauses are first removed from the cash flow estimates.
If tolls are not linked to the general economy inflation rate, some other analysis of the PV of toll revenues may be required.
National benefit cost ratio for a toll road
From the national economic point of view tolls are transfer payments and therefore not taken into account in the national benefit cost ratio (BCRN), which is the same irrespective of whether the toll road is private sector funded or not.
PV of national economic benefits BCRN =
PV of cost
National economic benefits = net direct and indirect benefits and disbenefits to all affected transport users plus all other monetised impacts.
PV of costs = activity capital costs plus activity operating costs plus changes in road maintenance and renewal costs minus deferred capital cost on other roads.
The form of the government benefit cost ratio (BCRG) is the same irrespective of whether the toll road is private sector funded or not. However, the value of BCRG for the private sector financing case will depend on the size of the required government contribution.
(PV of national economic benefits – PV of tolls)
Government benefit cost ratio for a toll road
BCRG = PV of net government costs
National economic benefits = net direct and indirect benefits and disbenefits to all affected transport users plus all other monetised impacts.
Net government costs = net costs to the NZTA and approved organisations.
Tolls = gross toll collections.

Page 11-14
The NZ Transport Agency’s Economic evaluation manual (volume 2) First edition, Amendment 0 Effective from January 2010
11.10 Cost benefit analysis continued
The first year rate of return (FYRR) for a road tolled activity is:
(PV of national economic benefits – PV of tolls)1
FYRR = (PV of net government costs)2
First year rate of return for a toll road
1 In the first year of operation. 2 To the end of the first year.
Evaluation criteria for activities with private sector involvement
The option with the highest national economic NPV/capital outlay is the best option, other things being equal. However, technical capacity, financial backing, business acumen, activity life, level of government contribution, non-monetised impacts and other aspects of the different offers and options will all influence the final decision.

Page 11-15
The NZ Transport Agency’s Economic evaluation manual (volume 2) First edition, Amendment 0 Effective from January 2010
11.11 Alternatives and options
Introduction Tolling must be evaluated as an option compared with the case of no tolls.
A number of other options aimed at optimisation of the transport system should also be assessed, including:
revenue maximisation tolls level of tolls and other measures maximising social welfare level of tolls and other measures maximising traffic diversion from sensitive
areas level of tolls and other measures to optimise level of service.
When considering private sector financing options, only options that reduce public sector costs should remain in the final set of options.

Page 11-16
The NZ Transport Agency’s Economic evaluation manual (volume 2) First edition, Amendment 0 Effective from January 2010
11.12 Sensitivity and risk analysis
Introduction Sensitivity analysis applies to both financial analysis and economic efficiency analysis.
Identification of risks Risks are different between options with and without private sector financing and/or operation. Technical capacity, financial backing, business acumen, activity life and government exposure are very important considerations where there is private sector involvement.
Identification, quantification and assignment of risks among relevant parties are essential for activities involving private sector financing and for road tolling activities. This should include preparation of a risk management plan.
For private sector financing, it is essential to ensure that the commercial arrangement with the private sector is appropriate and that any probity and accountability requirements are met. The degree to which risks can be shared with, or assumed by, private sector participants must be identified. Details of likely contractual obligations as they affect pricing, ongoing risk to government, terms of the contract, termination arrangements and debt and equity contributions of each party should be clearly specified.
Test assumptions The impact of risks (their probability or likelihood of occurrence and the consequence) on the results must be tested by sensitivity analysis. Critical assumptions that could be varied should be altered one at a time.
Test affect on cashflows
For financial analysis, analyse the sensitivity to variations associated with cashflows for each option, eg changes to key variables by ±20 percent and different combinations of key variables which taken together represent an alternative, plausible and consistent view of the future.
Calculate and present summary financial measures for the best and worst cases and for specific changes to key variables that are deemed highly probable. Break even points (at which the activity begins to lose money) should be identified.

Page 11-17
The NZ Transport Agency’s Economic evaluation manual (volume 2) First edition, Amendment 0 Effective from January 2010
11.13 References
1. New South Wales Department of State and Regional Development (1997) Guidelines for private sector participation in the provision of public infrastructure.
2. Transit New Zealand (2003) Finance and toll projects – implementation guide. (Draft).
3. Wallis I (2005) Implications of selected urban road tolling policies for New Zealand. Land Transport New Zealand research report No 270.


Page 12-1
The NZ Transport Agency’s Economic evaluation manual (volume 2) First edition, Amendment 0 Effective from January 2010
12.0 Risk analysis
12.1 Overview
12.1 Overview 12-1
12.2 Benefit risks 12-2
12.3 Cost risks 12-5
Introduction The NZ Transport Agency’s (NZTA) Economic evaluation manual volume 1 (EEM1) sets out detailed risk analysis guidelines for roading activities. This chapter identifies how the risk analysis guidelines may be applied to other transport infrastructure and transport services, in particular passenger transport. The guidance modifies the description of the risk categories in worksheet A13(a) in EEM1, summary of risks, to reflect the particular features of passenger transport activities. Because of the diversity of transport, modelling techniques, benefit sources and cost items, this guidance should be adapted to suit the particular context.
This guidance note should be read together with the risk analysis guidelines contained in EEM1. These specify underlying risk management principles, and provide further guidance on how identified risks should be evaluated, managed and reported to the NZTA.
Activities requiring a risk analysis
All evaluations for passenger and freight transport activities with a present value (PV) of the funding gap of greater than one million dollars are required to include a detailed risk analysis. Other types of transport activity with a net cost to government (central plus local) greater than one million dollars must also include a risk analysis as part of the evaluation.
Note: Where an activity with a PV funding gap up to one million dollars warrants it, the NZTA may also request a risk analysis.
In this chapter Section Page

Page 12-2
The NZ Transport Agency’s Economic evaluation manual (volume 2) First edition, Amendment 0 Effective from January 2010
12.2 Benefit risks
Procedure As a general principle, if there is at least a five percent risk that any of the following categories or subcategories could account for a variation in total activity benefits of more than ±10 percent then it should be classified as ‘high risk’.
Age of data source
Data scope As for roading. Refer to A13(a) in EEM1.
Data quality and statistical reliability
Low risk Boarding/alighting counts. Intercept data. Census data of recent origin may provide a reliable source of commuting patronage matrices.
High risk Screenline counts. Typically based on relatively unreliable observation methods and limited in geographic scope.
Strategic model. Because such models may be based on small public transport trip samples, they would usually provide an unreliable, high-risk basis for an activity trip matrix. Convincing evidence that this was not the case would be required in order to reduce the risk classification.
Travel demand validation to counts
As for roading. Refer to A13.5 in EEM1.
Travel composition For models based only on count data, reliable passenger composition estimates may be required for choosing elasticities or other modelling factors. In general, the variations in the passenger mix are not believed to be so large as to make assumptions of this nature a particular risk issue. Classify as low risk unless effects of uncertainties on benefits exceed five percent.
Base travel demand
The growth scenario Passenger transport patronage growth trends are affected by:
population age structure employment vehicle ownership economic factors policy measures other factors.
High city population growth
Development-related traffic as proportion of scheme traffic
As for roading. Refer to A13.5 in EEM1.
Other scenario factors If activity benefits are affected by more than 10 percent classify as high risk, if less than five percent classify as low risk.
Growth forecasts

Page 12-3
The NZ Transport Agency’s Economic evaluation manual (volume 2) First edition, Amendment 0 Effective from January 2010
12.2 Benefit risks continued
Other scenario factors continued Passenger transport patronage trends are more sensitive to economic, strategic and policy factors (eg the past impacts of reduced costs of vehicle ownership in New Zealand), which may not be explicitly represented in forecasting methodologies. In general, this would imply that this aspect of the forecast should be classified as medium or high risk, depending on:
a. the evidence of stability in past growth trends b. the extent to which the modelling methods encompass the major
scenario factors c. views on the sensitivity of future growth trends.
Effects of passenger transport activities on overall passenger transport patronage
Passenger transport improvements will cause diversion of trips from other transport modes (vehicle, walk and cycle), redistribution of travel demand and induced patronage. If such diversions are a significant part of patronage, the patronage risks are likely to be higher. These risks will be further increased if there is uncertainty regarding the extent of passenger transport capacity to be provided as part of the activity (such as might be the case if the required service frequencies were subject to uncertainty).
Diversion from private vehicle Modal change benefits can be a significant element of a passenger transport service proposal, walking and cycling package or travel behaviour change (TBhC) proposal. These benefits are difficult to estimate with precision, being sensitive to the assumed elasticities and/or model coefficients. Stable iterative modelling processes are required, linked to assignment procedures able to measure accurately the impacts of small traffic changes.
Consequently, the risk associated with diversion from vehicle and the associated benefits should be classified as high, unless it can be convincingly demonstrated that these risks are reduced by the particular modelling processes adopted.
Diversion to passenger transport from walk and cycle; redistributed and induced passenger transport patronage
In general, these are likely to have a small effect on the overall level of public transport service benefits. Providing it is demonstrated through sensitivity tests that their effects on benefits are less than five percent of the total, these factors can be considered low risk.
Other sources of patronage and benefits
Some activities may have attributes, which, it may be argued, attract additional patronage or bring additional benefits. These may particularly relate to quality improvements to public transport. The risks associated with these sources should be assessed where they account for more than five percent of the benefits.
Growth forecasts continued
Other future activities
Path derivation method As for roading. Refer to A13.5 in EEM1.
Generalised cost (routeing parameters)
In some circumstances, forecasts will be sensitive to the definition of generalised cost in the models (for example, to the size of the assignment boarding and interchange penalties) and sensitivity tests will be needed to demonstrate the extent of the risk.
Supply relationships Not generally relevant.
Assignment and the choice between alternative passenger transport modes (eg bus, light rail, heavy rail and ferry)

Page 12-4
The NZ Transport Agency’s Economic evaluation manual (volume 2) First edition, Amendment 0 Effective from January 2010
12.2 Benefit risks continued
Proportion of benefits accounted for by accidents
The proportion of benefits accounted for by road accident savings will normally be less than 10 percent and should therefore be classified as low risk.
In exceptional circumstances (for example, the provision of grade separation to replace a level crossing) this may not be the case, and a specific risk assessment should be made. If the proportion of benefits exceeds 20 percent classify as high risk.
Accidents
Proportion of benefits accounted for by environment and planning factors
The proportion of benefits accounted for by environment and planning factors will normally be less than 10 percent and should therefore be classified as low risk. If the proportion of benefits exceeds 20 percent classify as high risk.
Environment and planning

Page 12-5
The NZ Transport Agency’s Economic evaluation manual (volume 2) First edition, Amendment 0 Effective from January 2010
12.3 Cost risks
Procedure As a general principle, if there is at least a five percent risk that any of the following categories or subcategories could account for a variation in total cost of more than 10 percent then it should be classified as ‘high risk’.
Most of the cost risks are comparable with roading activity cost risks although there may be differences in their precise description and nature, which should be allowed for in completing worksheets A13 in EEM1.
Property acquisition
Property economic value As for roading. Refer to A13.6 in EEM1.
Land and property
Knowledge of ground conditions
Complex/unpredictable conditions
Design form
Extent of topographical data
Source and disposal of material
As for roading. Refer to A13.6 in EEM1.
Earthworks
Engineering complexity As for roading. Refer to A13.6 in EEM1.
Signalling and communications Signalling and communications infrastructure should generally be considered a high risk element of engineering costs.
Transport service operating surplus/deficit
Unless a transport service operating surplus/deficit (the balance of revenue and operating costs) forms a large part of total costs, it would normally be classified as low risk.
Other costs
Existence, location and condition
Site flexibility
Cooperation of utilities
As for roading. Refer to A13.6 in EEM1.
Service


Page 13-1
The NZ Transport Agency’s Economic evaluation manual (volume 2) First edition, Amendment 0 Effective from January 2010
13.0 Simplified procedures
13.1 Overview
13.1 Overview 13-1
SP8 Freight transport services SP8–1
SP9 New passenger transport services SP9–1
SP10 Existing passenger transport services SP10–1
SP11 Walking and cycling facilities SP11–1
SP12 Travel behaviour change SP12–1
In this chapter Section Page
Additional information
Where the simplified procedures in this chapter are used for activities with a present value (PV) of the funding gap greater than one million, or for activities where the procedures do not accurately represent the costs and benefits, the evaluator should provide additional or more appropriate information (see section 5.11). If in doubt, contact the NZ Transport Agency (NZTA) before proceeding.
Freight transport services
Simplified procedure SP8 may be used for evaluation of all rail and sea freight transport activities.
The procedure assumes that the primary benefits are road maintenance, renewal and improvement cost savings from removal of freight from the road network. Accident reduction benefits are also taken into account, but transport services user and other road traffic reduction benefits are excluded as being negligible or zero.
The calculation of the do-minimum adopts the simplified procedure for road infrastructure activities from the NZTA’s Economic evaluation manual volume 1 (EEM1). The net road maintenance and renewal cost saving is calculated by estimating the total annual amount of freight traffic, measured in terms of equivalent design axles (EDA), removed from the road network.
A feasibility evaluation worksheet is provided based on transferring freight in net tonne km where the road maintenance, accident and CO2 emissions savings have been combined into a composite road transport cost. This may be used for activities without specific accident or congestion problems.

Page 13-2
The NZ Transport Agency’s Economic evaluation manual (volume 2) First edition, Amendment 0 Effective from January 2010
13.1 Overview continued
New passenger transport services
Simplified procedure SP9 may be used for evaluation of all new passenger transport services.
The procedure assumes that new services will be implemented during the peak period, that the majority of traffic removed will be light vehicles and that there are negligible road maintenance and renewal cost savings. Road traffic reduction benefits are calculated incrementally, as a change from the do-minimum. Thus, only a description of the do-minimum is required for the evaluation.
The procedure simplifies the calculation of transport services user benefits and road traffic reduction benefits (including travel time, vehicle operating cost, accident cost savings and environmental benefits). The road traffic reduction benefit values are based on the assumption that the road corridor in question has at least one point (bottleneck or ‘ruling’ intersection) that operates at least 80 percent capacity during the peak period. If this is not the case, then the marginal changes in travel time will be negligible and road traffic reduction benefits should not be included.
For activities with a PV of the funding gap of less than one million, only the worksheets for the chosen option need be submitted. For activities with a PV of the funding gap over one million dollars, worksheets for all options should be provided.
Existing transport services
Simplified procedure SP10 may be used for evaluation of all improvements to existing passenger transport services.
The procedure assumes that the improvements to services will be implemented in the peak period and that the majority of traffic removed from the road network will be light vehicles. Hence, road maintenance and renewal cost saving is excluded from the analysis. All benefits and costs are calculated incrementally as a change from the do minimum. Therefore, only a description of the do-minimum is required for the evaluation.
This procedure simplifies the calculation of transport services user benefits and road traffic reduction benefits (including travel time, vehicle operating cost, and accident cost savings, reliability and environmental benefits). Thus, there are values for road users, and additional transport service users for the main urban centres of Auckland, Wellington, Christchurch, while other centres will have different values.
The benefit values assume that each trip on the improved service is an ‘average’ length for the urban centre. Thus, for trips shorter than the average, the benefit may be overestimated. Likewise, for trips longer than the average, the benefit may be underestimated. Consider whether this is likely to be significant.
The peak benefit values are based on the assumption that the road corridor in question has at least one point (bottleneck or ‘ruling’ intersection) that operates at least 80 percent capacity during the peak period. If this is not the case, then the off peak benefits should be used.
The additional transport service user benefits are based on the benefits that accrue to both existing and new users as a result of service improvements.
For activities with a PV of the funding gap of less than one million, only the worksheets for the chosen option need be submitted. For activities with a PV of the funding gap over one million dollars, worksheets for all options should be provided.

Page 13-3
The NZ Transport Agency’s Economic evaluation manual (volume 2) First edition, Amendment 0 Effective from January 2010
13.1 Overview continued
Walking and cycling facilities
Simplified procedure SP11 for walking and cycling facilities may be used where the undiscounted capital cost of walking and cycling facilities is up to one million dollars. Where the undiscounted capital cost is greater than one million dollars the economic evaluation must be completed in greater detail on a case-by-case basis. The simplified procedure is not applicable to signalised crossings over roads.
The simplified procedure may be used as part of a composite evaluation also covering travel behaviour change (TBhC) activities and infrastructure and passenger transport service improvements (refer to section 9.6).
Travel behaviour change
Simplified procedure SP12 for TBhC may be used for all cost/size TBhC activities including associated infrastructure up to one million dollars or passenger transport service improvements with a PV of the funding gap of up to one million dollars.
The simplified procedure may be used as part of a composite evaluation also covering walking and cycling facilities, infrastructure and passenger transport service improvements (refer to section 9.6).


Page SP8–1
The NZ Transport Agency’s Economic evaluation manual (volume 2) First edition, Amendment 0 Effective from January 2010
SP8 Freight transport services
This procedure (SP8) provides a simplified method for evaluating the costs and benefits of freight transport services with or without capital expenditure.
This simplified procedure assumes that: 1. cost savings from reduced road maintenance and renewals (net of road user
charges (RUC) foregone) and from reduced road traffic (mainly CO2 and accident cost savings) are the primary reasons for undertaking the proposal
2. there are costs to users of the proposed rail or sea freight service that are additional to that for road transport and which offset the difference between the road freight rate and the rail or sea freight rate
3. the road sections affected by the activity are largely rural. If the road freight traffic spends a significant time traversing urban areas, use the procedures described in sections 7.3 and 7.4 to evaluate road traffic reduction benefits and accident cost savings
4. other benefits are not significant. Indicate on worksheet 1 whether other benefits are important. If they are, then these other benefits should either be included in the benefit cost ratio (BCR) or described on a separate attached sheet
5. freight transport activities that are approved for funding will be established/ constructed in the first year and will operate from the end of year 1
6. an eight percent discount rate and 15 year analysis period are used. 7. a 12 percent service provider rate of return is used for analysis of the funding gap8. all costs are exclusive of goods and services tax (GST).
In cases where the above assumptions are not appropriate, either the simplified procedure should be modified or full procedures used.
The simplified procedure is designed to consider one option at a time. Where it is logical, consider other options to find the optimal solution. In some cases (eg where pavements are weak), it may be necessary to compare the freight transport option with a road reconstruction option for the affected road network. If there is more than one option, use incremental analysis of the costs and benefits of the different options.
Worksheet 8 provides a feasibility evaluation using costs that are internalised to the service provider plus a composite value for non-internalised costs for road freight transport and for sea or rail transport. This may be used for activities without specific accident or congestion issues on the affected roads.
Worksheet Description
1 Evaluation summary
2 Service provider costs
3 Funding gap analysis
4 Freight service user benefit
5 Net cost savings to government
6 Road traffic reduction benefits
7 BCR and incremental analysis
8 Feasibility evaluation
Introduction
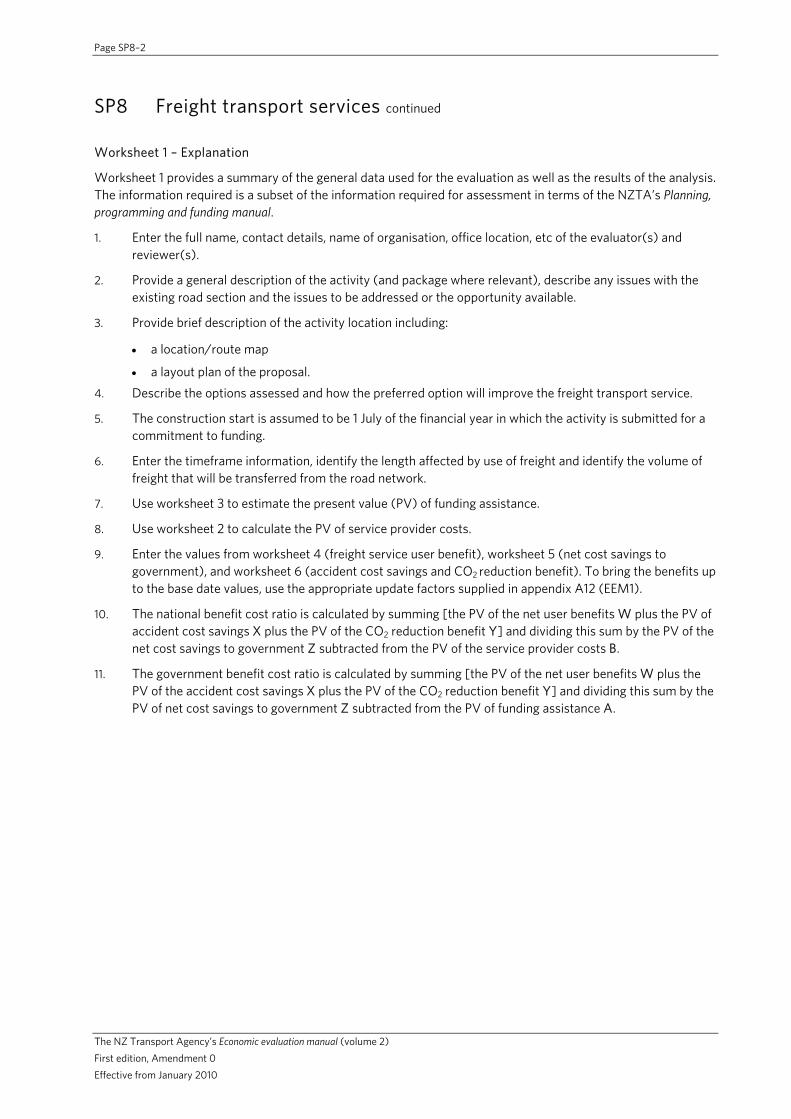
Page SP8–2
The NZ Transport Agency’s Economic evaluation manual (volume 2) First edition, Amendment 0 Effective from January 2010
SP8 Freight transport services continued
Worksheet 1 – Explanation
Worksheet 1 provides a summary of the general data used for the evaluation as well as the results of the analysis. The information required is a subset of the information required for assessment in terms of the NZTA’s Planning, programming and funding manual.
1. Enter the full name, contact details, name of organisation, office location, etc of the evaluator(s) and reviewer(s).
2. Provide a general description of the activity (and package where relevant), describe any issues with the existing road section and the issues to be addressed or the opportunity available.
3. Provide brief description of the activity location including:
a location/route map
a layout plan of the proposal. 4. Describe the options assessed and how the preferred option will improve the freight transport service.
5. The construction start is assumed to be 1 July of the financial year in which the activity is submitted for a commitment to funding.
6. Enter the timeframe information, identify the length affected by use of freight and identify the volume of freight that will be transferred from the road network.
7. Use worksheet 3 to estimate the present value (PV) of funding assistance.
8. Use worksheet 2 to calculate the PV of service provider costs.
9. Enter the values from worksheet 4 (freight service user benefit), worksheet 5 (net cost savings to government), and worksheet 6 (accident cost savings and CO2 reduction benefit). To bring the benefits up to the base date values, use the appropriate update factors supplied in appendix A12 (EEM1).
10. The national benefit cost ratio is calculated by summing [the PV of the net user benefits W plus the PV of accident cost savings X plus the PV of the CO2 reduction benefit Y] and dividing this sum by the PV of the net cost savings to government Z subtracted from the PV of the service provider costs B.
11. The government benefit cost ratio is calculated by summing [the PV of the net user benefits W plus the PV of the accident cost savings X plus the PV of the CO2 reduction benefit Y] and dividing this sum by the PV of net cost savings to government Z subtracted from the PV of funding assistance A.

Page SP8–3
The NZ Transport Agency’s Economic evaluation manual (volume 2) First edition, Amendment 0 Effective from January 2010
SP8 Freight transport services continued
Worksheet 1 – Evaluation summary
1 Evaluator(s)
Reviewer(s)
2 Activity/package details
Approved organisation name
Activity/package name
Your reference
Activity description
Describe the issue to be addressed
3 Location Brief description of location
4 Alternatives and options
Summarise the options assessed
5 Timing
Time zero (assumed construction start date) 1 July
Expected duration of construction (months)
Period of analysis 15 years
6 Economic efficiency
Date economic evaluation completed (mm/yyyy)
Base date for costs and benefits 1 July
Road length over which the freight will be removed kilometres
Freight volume transferred from road network tonnes/year
7 PV of funding assistance $ A
8 PV of service provider costs $ B
9 Economic appraisal data from worksheets 5 and 6
PV net user benefit $ C x update factor = $ W
PV accident cost savings $ D x update factor AC = $ X
PV CO2 reduction benefit $ E = $ Y
PV net savings to government $ F x update factor = $ Z
PV net benefits W + X + Y 10 BCRN =
PV economic costs =
B – Z =
=
PV net benefits W + X + Y 11 BCRG =
PV costs to government =
A - Z =

Page SP8–4
The NZ Transport Agency’s Economic evaluation manual (volume 2) First edition, Amendment 0 Effective from January 2010
SP8 Freight transport services continued
Worksheet 2 – Explanation
Worksheet 2 is used to calculate the service provider costs from the freight transport service activities:
1. Enter the capital cost of the activity in year 1 of column (1) (some of the capital cost can be put in year 2 if the construction duration is more than 12 months). Also enter any decommissioning costs less salvage values into column (1) for the applicable years.
2. Enter the additional annual operating and maintenance costs which would result from the proposal, for years 2 to 15 in column (3). In the case of an expansion of, or improvement to the service, only enter the additional annual operating and maintenance costs which result from the proposal.
3. This column contains discount factors at the rate of eight percent per annum. This rate is set by the Treasury for public sector transport evaluation (chapter 2.6 EEM1).
4. Calculate the present value (PV) of costs per year by multiplying the sum of the capital cost (1) and operations and maintenance (O&M) cost (2), the SPPWF value in column (3).
5. Sum column (4) to calculate the PV of the service provider costs B. Transfer the PV of the service provider costs B, to B in worksheet 1.

Page SP8–5
The NZ Transport Agency’s Economic evaluation manual (volume 2) First edition, Amendment 0 Effective from January 2010
SP8 Freight transport services continued
Worksheet 2 – Service provider costs
Year Capital cost (1)
O&M cost (2)
SPPWF (3)
PV of cost (4) = [(1) + (2)] x (3)
1 0.93
2 0.86
3 0.79
4 0.74
5 0.68
6 0.63
7 0.58
8 0.54
9 0.50
10 0.46
11 0.43
12 0.40
13 0.37
14 0.34
15 0.31
5 PV of the service provider costs B
Transfer the PV of the service provider costs B, to B in worksheet 1.

Page SP8–6
The NZ Transport Agency’s Economic evaluation manual (volume 2) First edition, Amendment 0 Effective from January 2010
This page is blank.

Page SP8–7
The NZ Transport Agency’s Economic evaluation manual (volume 2) First edition, Amendment 0 Effective from January 2010
SP8 Freight transport services continued
Worksheet 3 – Explanation
Worksheet 3 is used to determine whether or not the activity is commercially viable (refer to section 6.5). This worksheet should be set up and completed in a spreadsheet using, eg Microsoft Excel. Goal seek is used in this worksheet, but in order for it to perform correctly, equations from the instructions below need to be entered into the spreadsheet, linking the specified cells as opposed to using an external calculator.
1. Enter the service provider’s required rate of return (percentage per annum). It is generally expected that the required rate of return will reflect the industry norm of 12 percent. If an alternative rate of return is used, then this needs to be explained and justified and the single payment present worth factor (SPPWF) values in column (15) must be changed accordingly.
2. Enter the existing rail/sea freight user charge ($ per boarding). If the activity is for a new service, enter zero.
3. Enter the freight transported per year (tonne). If the activity is for a new service, enter zero.
4. Enter the existing rail/sea freight distance. If the activity is for a new service, enter zero.
5. Enter the growth rate over the last five years in passenger transport patronage in percent per annum. If the activity is for a new service, enter zero.
6. Enter the proposed average user charge ($ per tonne km).
7. Enter the additional tonnes of freight removed from roads from year 2.
8. Enter the proposed rail/sea freight distance.
9. Enter the estimated freight transported growth rate (% per annum).
10. Enter the capital cost of the activity in year 1 in column (10) (some of the capital cost can be put in year 2 if the construction duration is more than 12 months). Also enter any decommissioning costs less salvage values into column (10) for the applicable years.
11. Enter the annual operating and maintenance costs which would result from the proposal, for years 2 to 15 in column (11). In the case of an expansion of, or improvement to an existing service, only enter the additional annual operating and maintenance costs which result from the proposal.
12. Calculate the revenue for year 2 in column (12) using the equation (12) = [(6) x (7) x (8)] – [(2) x (3) x (4)]. Next calculate the revenue for the subsequent years using the formula; revenue in previous year x [1 + (9) – (5)]. Note: Additional revenue from other sources which would result from the proposal, need to be included in the values for revenue for the years to which they relate.
13. Define values in column (13) as dependents of the adjusting cell. The adjusting cell is the chosen cell used by the goal seek function to make the sum of net PV (18) equal zero, eg the evaluator might set values for years 3 to 15 to equal the value for year 2 (the adjusting cell), but decrease over time.
14. Calculate the annual surplus (or deficit) per year using the formula: (14) = [(12) + (13)] – [(10) + (11)].
15. This column contains the discount factor for a service provider rate of return of 12 percent. Refer to section A1.2 of EEM1 for assistance calculating discount factors if the service provider’s rate of return is altered.
16. Calculate the PV of the annual surplus (or deficit) (16) by multiplying the annual surplus (or deficit) (14) by the present worth factors in column (15).
17. Calculate the PV of the annual funding gap (17) by multiplying the annual funding gap (13) by the present worth factors (15).

Page SP8–8
The NZ Transport Agency’s Economic evaluation manual (volume 2) First edition, Amendment 0 Effective from January 2010
SP8 Freight transport services continued
Worksheet 3 – Explanation continued
18. Calculate the sum of the annual net PVs by summing column (16). Use the Microsoft Excel ‘goal seek’ function to find the value for the adjusting cell in column (13), that makes the sum of the annual net PV amounts (18) equal to zero. Based on the example in instruction (13), all values in column (13) should update when the goal seek function is executed, as the values in column (13) were set to depend on the adjusting cell input.
19. Calculate the sum of the funding gap (19) by summing column (13).
20. Calculate the sum of the PV of the funding gap (20) by summing column (17).
21. The funding amount to be included in the economic analysis is the PV of the subsidy provided for the activity (which is discounted at eight percent), not the PV of the funding gap (which is discounted at the service provider’s required rate of return). The subsidy may be the same as the funding gap or it may be provided in a different manner. Enter the proposed subsidy for each year in column (21).
22. This column contains the annual present worth factors for an eight percent discount rate.
23. Calculate the PV of the subsidy for each year by multiplying the subsidy (21) by the discount factors (22).
24. Calculate the PV of funding assistance by summing column (24). Transfer the PV of the funding assistance A, to A in worksheet 1.

Page SP8–9
The NZ Transport Agency’s Economic evaluation manual (volume 2) First edition, Amendment 0 Effective from January 2010
SP8 Freight transport services continued
Worksheet 3 – Funding gap analysis
1 Service provider rate of return per annum 12%
2 Existing rail/sea user charge ($/tonne)
3 Existing freight transported per year (tonne)
4 Existing rail/sea freight distance
5 Existing percentage freight transported growth (over last five years)
6 Proposed average rail/sea user charge ($/tonne)
7 Additional freight transported per year after improvement to service (tonne)
8 Proposed rail/sea freight distance
9 Estimated freight transported growth rate (%/annum)
Year
Capital cost
(10)
O&M cost
(11)
Revenue
(12)
Funding gap
(13)
Annual total
(14)=[(12)+(13)]
– [(10)+(11)]
SPPWF
(15)
Net PV
(16)=(14)×(15)
PV funding gap
(17)= (13)×(15)
1 0.89 2 0.78 3 0.71 4 0.65 5 0.57 6 0.51 7 0.45 8 0.40 9 0.36 10 0.32 11 0.29 12 0.26 13 0.23 14 0.21 15 0.18
18 Sum of net PV = sum of column (16) = $
19 Total funding gap = sum of column (13) = $
20 PV funding gap = sum of column (17) = $
Funding assistance Year Subsidy (21) SPPWF (22) PV subsidy
(23) = (21) × (22)
1 0.93 2 0.86 3 0.79 4 0.74 5 0.68 6 – 15 4.75
24 PV of the funding assistance = $ A
Transfer the PV of the funding assistance A, to A in worksheet 1.
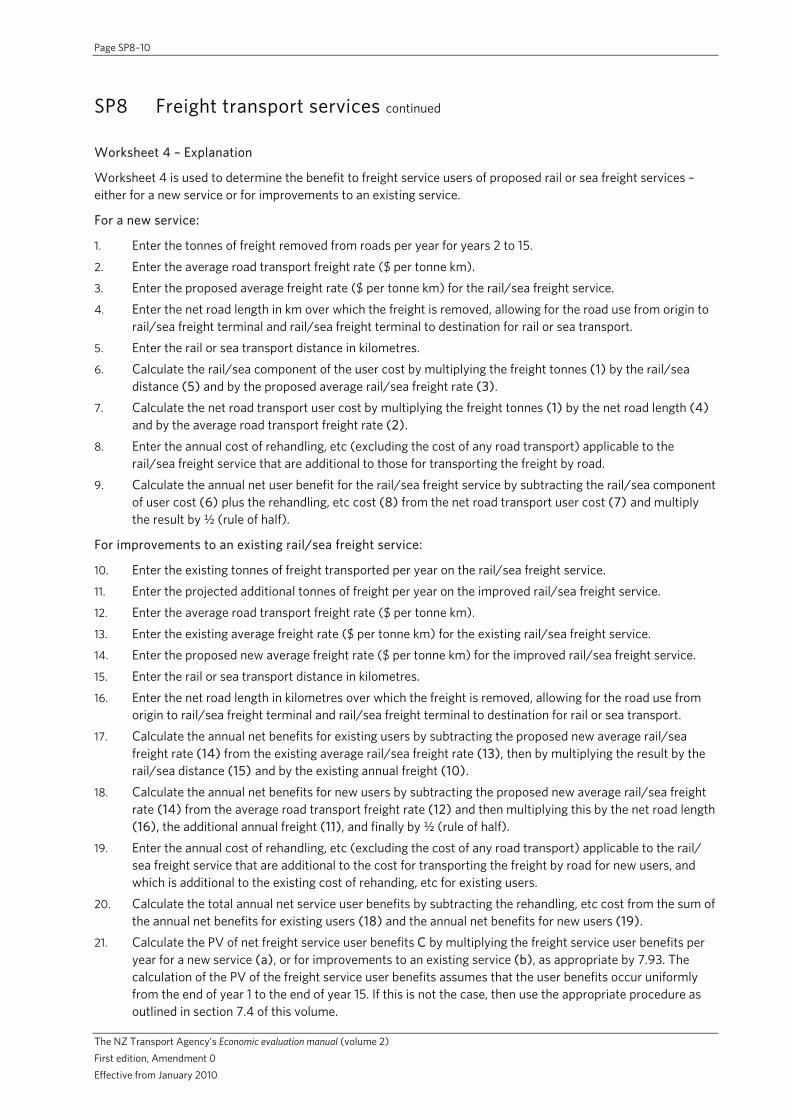
Page SP8–10
The NZ Transport Agency’s Economic evaluation manual (volume 2) First edition, Amendment 0 Effective from January 2010
SP8 Freight transport services continued
Worksheet 4 – Explanation
Worksheet 4 is used to determine the benefit to freight service users of proposed rail or sea freight services – either for a new service or for improvements to an existing service.
For a new service:
1. Enter the tonnes of freight removed from roads per year for years 2 to 15. 2. Enter the average road transport freight rate ($ per tonne km). 3. Enter the proposed average freight rate ($ per tonne km) for the rail/sea freight service. 4. Enter the net road length in km over which the freight is removed, allowing for the road use from origin to
rail/sea freight terminal and rail/sea freight terminal to destination for rail or sea transport. 5. Enter the rail or sea transport distance in kilometres. 6. Calculate the rail/sea component of the user cost by multiplying the freight tonnes (1) by the rail/sea
distance (5) and by the proposed average rail/sea freight rate (3). 7. Calculate the net road transport user cost by multiplying the freight tonnes (1) by the net road length (4)
and by the average road transport freight rate (2). 8. Enter the annual cost of rehandling, etc (excluding the cost of any road transport) applicable to the
rail/sea freight service that are additional to those for transporting the freight by road. 9. Calculate the annual net user benefit for the rail/sea freight service by subtracting the rail/sea component
of user cost (6) plus the rehandling, etc cost (8) from the net road transport user cost (7) and multiply the result by ½ (rule of half).
For improvements to an existing rail/sea freight service:
10. Enter the existing tonnes of freight transported per year on the rail/sea freight service. 11. Enter the projected additional tonnes of freight per year on the improved rail/sea freight service. 12. Enter the average road transport freight rate ($ per tonne km). 13. Enter the existing average freight rate ($ per tonne km) for the existing rail/sea freight service. 14. Enter the proposed new average freight rate ($ per tonne km) for the improved rail/sea freight service. 15. Enter the rail or sea transport distance in kilometres. 16. Enter the net road length in kilometres over which the freight is removed, allowing for the road use from
origin to rail/sea freight terminal and rail/sea freight terminal to destination for rail or sea transport. 17. Calculate the annual net benefits for existing users by subtracting the proposed new average rail/sea
freight rate (14) from the existing average rail/sea freight rate (13), then by multiplying the result by the rail/sea distance (15) and by the existing annual freight (10).
18. Calculate the annual net benefits for new users by subtracting the proposed new average rail/sea freight rate (14) from the average road transport freight rate (12) and then multiplying this by the net road length (16), the additional annual freight (11), and finally by ½ (rule of half).
19. Enter the annual cost of rehandling, etc (excluding the cost of any road transport) applicable to the rail/ sea freight service that are additional to the cost for transporting the freight by road for new users, and which is additional to the existing cost of rehanding, etc for existing users.
20. Calculate the total annual net service user benefits by subtracting the rehandling, etc cost from the sum of the annual net benefits for existing users (18) and the annual net benefits for new users (19).
21. Calculate the PV of net freight service user benefits C by multiplying the freight service user benefits per year for a new service (a), or for improvements to an existing service (b), as appropriate by 7.93. The calculation of the PV of the freight service user benefits assumes that the user benefits occur uniformly from the end of year 1 to the end of year 15. If this is not the case, then use the appropriate procedure as outlined in section 7.4 of this volume.

Page SP8–11
The NZ Transport Agency’s Economic evaluation manual (volume 2) First edition, Amendment 0 Effective from January 2010
SP8 Freight transport services continued
Worksheet 4 – Freight service user benefit
Service user benefit for a new rail/sea freight service
1 Freight removed from roads per year – years 2 to 15 (tonnes)
2 Average road transport freight rate ($ / tonne / km)
3 Proposed average rail/sea freight rate ($ / tonne / km)
4 Net road length (km)
5 Rail/sea distance (km)
6 Rail/sea component of user cost ($)
7 Net road transport user cost ($)
8 Rehandling
9 Annual net service user benefit = $ (a)
Service user benefit for improvements to existing rail/sea freight service
10 Existing freight transported per year (tonnes)
11 Additional freight transported per year after improvement to service – years 2 to 15 (tonnes)
12 Average road transport freight rate ($ / tonne / km)
13 Existing average rail/sea freight rate ($ / tonne / km)
14 Proposed new average rail/sea freight rate ($ / tonne / km)
15 Rail/sea distance (km)
16 Net road length (km)
17 Annual net benefits for existing users ($)
18 Annual net benefits for new users ($)
19 Re-handling cost for rail/sea ($)
20 Total annual net service user benefits = $ (b)
PV of net service user benefit
21 PV of net service user benefit = (a) or (b) × 7.93 = $ C
Transfer the PV of the net service user benefit C, to C on worksheet 1.

Page SP8–12
The NZ Transport Agency’s Economic evaluation manual (volume 2) First edition, Amendment 0 Effective from January 2010
SP8 Freight transport services continued
Worksheet 5 – Explanation
Worksheet 5 is used for calculating the net government cost savings (road maintenance and renewal savings – road user charges (RUC) forgone) associated with the freight transport service proposal.
1. Enter the required raw data into the table on worksheet 5 (the equivalent design axles (EDA) and cost per EDA kilometre can be obtained from table 1 and 2 below). Enter the data for the road sections from which heavy commercial vehicles (HCV) are removed and for the road sections used for the proposed rail/sea freight service. Calculate the total EDA/km (e) by multiplying the EDA of HCV (table 1) (c) by the number of HCV/yr (d). Multiply the $/EDA km (table 2) (a) by the length of the road section (b) then by the total EDA km (e) to obtain the maintenance renewal and cost per section. Calculate the total road maintenance and renewal cost savings per year (f), by summing the maintenance and renewal costs for road sections from which HCVs are removed and subtracting the costs for road sections used for the proposed rail/sea freight service. Check that the road maintenance and renewal cost savings resulting from the removal of the freight traffic are realistic compared with the current cost of maintenance and renewals.
2. Enter the average licensed weight of HCVs used, the RUC per 1000 kilometres (g) and the total vehicle kilometres removed from the road per annum (km) (h). Calculate the RUC forgone per annum (i) by firstly multiplying the total vehicle kilometres removed from the road per annum (h) with the RUC (g), then by dividing the result by 1000. If the amount of freight traffic removed from the road network will vary from year to year, separate calculations are required for each year.
3. To calculate the PV of net cost savings to government F, subtract the RUC forgone (i) from total road maintenance and renewal cost savings per year, then multiply this figure by 7.93. If freight traffic volumes vary by year, the maintenance and renewal cost savings, RUC foregone, and the PV of net savings to government must be calculated for each year.
Table 1: Heavy vehicle types and EDA equivalents
If the HCV traffic moves freight from its origin (freight source) to destination (distribution point) and returns empty to the origin, then use the return trip EDA. If the HCV traffic carries a load on its return trip and the freight transport activity will also carry the return load, then double the laden trip value.
Note: The evaluator will need to assess the appropriate RUC for the vehicles in question.
Caveat on using the table data.
Where the values in tables 1 and 2 above do not accurately represent local conditions, provide additional information that shows what values have been used and whether these have been calibrated to local conditions.
EDA Vehicle type
Laden trip Unladen Return trip
HCVIIa – up to 18 tonnes payload, six wheel truck, three axle trailer 1.38 0.2 1.58
HCVIIb – over 18 and up to 23 tonnes payload, eight wheel truck, two axle trailer 1.94 0.2 2.14
HCVIIc – over 23 and up to 28 tonnes payload, (forestry) 3.3 0.5 3.8

Page SP8–13
The NZ Transport Agency’s Economic evaluation manual (volume 2) First edition, Amendment 0 Effective from January 2010
SP8 Freight transport services continued
Worksheet 5 – Net cost savings to government
1 Road maintenance and renewal cost savings
Name of road section
Type of road*
$/EDA km (table 2)
(a)
Length (km)
(b)
Type of HCV (table 1)**
EDA of HCV (table 1)**
(c)
No of HCV/yr
(d)
Total EDA/km
(e) = (c) x (d)
Type of road*
(a) x (b) x (e)
Total road maintenance and renewal cost savings per year = $ (f)
* LD = local designed pavements; LU = local undesigned pavements; SH = state highway. ** If there is more than one type of HCV, then record each type on a separate line. Continue on a separate page if necessary.
2 RUC foregone
Average licensed weight of HCVs used
Road user charge (per 1000 km) $ (g)
Total vehicle kilometres removed from the road per annum (km) = change in number of road trips per annum × km per trip =
(h)
RUC foregone (per annum) = (g) × (h) / 1000 = $ (i)
3 PV of net cost savings to government Total = [maintenance and renewal cost savings (f) – RUC (i)] × PWF (from end of year 1 to end of year 15) Total = [(f) – (i)] × 7.93 = $ F
Enter the PV of the net cost saving to government F, to F in worksheets 1 and 7.
Table 2: Cost of EDA by road type ($/EDA km - 2008)
Road type EDA cost
Local road, designed pavement (LD) 0.70
Local road, undesigned pavement (LU)* 0.70 – 1.16
State highway (SH) 0.41
* Local road undesigned pavement refers to roads that were previously unsealed and were sealed by simply adding more aggregate and then a seal coat. The value of the $/EDA/km for local road undesigned requires judgement on the part of the local authority and evaluator to assess the EDA value.

Page SP8–14
The NZ Transport Agency’s Economic evaluation manual (volume 2) First edition, Amendment 0 Effective from January 2010
SP8 Freight transport services continued
Worksheet 6 – Explanation
1. The calculation of accident cost savings for the freight transport service is based on accident rate analysis. The analysis assumes that the road network from which the freight transport service activity removes traffic is primarily rural, with a minimal number of intersections. If the road freight traffic would spend a significant amount of time traversing urban areas, the evaluator should use the procedures described in section 7.4 of this volume.
Enter in the name(s) of the section(s), the average annual daily traffic (AADT), the terrain type, the coefficient, the number of HCV removed per year, and the length of the road sections from which road freight is removed. Also enter the name(s) of the section(s), the AADT, the terrain type, the coefficient, the number of HCV per year and the length of road section(s) used for the proposed rail/sea freight service. To get exposure (c) multiply the number of HCV removed per year by the length and then divide this figure by 108. Calculate reported injury accidents per year (AT) by multiplying the coefficient (b0) by exposure (c). Calculate the net reported injury accidents per year for affected road sections (d) by summing the AT values for each section from which HCVs are removed and subtracting the AT values for the road sections used for the proposed rail or sea freight service. Enter the cost per reported injury accident (e) from table 4. Multiply the total reported injury accidents per year for affected corridor (d) by the cost per reported injury accident (e) to determine accident cost savings per year (f).
2. The calculation of the PV of the road traffic reduction savings assumes that the benefits occur uniformly from the end of year 1 to the end of year 15. If this is not the case, please use the appropriate procedure as outlined in section 7.4 of this volume. Calculate the PV of total accident cost savings D by multiplying accident cost savings per year (f) by 7.93.
3. Sum the exposure in column (c) of the table in part 1 to obtain total annual exposure (g). Calculate the CO2 benefit per year resulting from the HCVs removed from the road network by multiplying total annual HCV exposure by 10.2 cents per HCV km. Calculate the PV of CO2 reduction benefits by multiplying CO2 reduction benefit per year by 7.93.
Note: Rail or sea transport produces some CO2 which should be deducted from the CO2 saved by removing HCVs from the road network, but this is approximately 1/5 of the road transport amount (per tonne km of freight). This small adjustment is ignored in this simplified procedure.
Caveat on using table data
Where the values in tables 3 and 4 above do not accurately represent local conditions, provide additional information showing the values that have been used and whether these have been calibrated to local conditions.

Page SP8–15
The NZ Transport Agency’s Economic evaluation manual (volume 2) First edition, Amendment 0 Effective from January 2010
SP8 Freight transport services continued
Worksheet 6 – Road traffic reduction benefits
1 Total accident cost savings
Name of road section
AADT Terrain type
(L, R or M)
Coefficient
(b0)
No of HCV removed/yr
(a)
Length (km)
(b)
Exposure (100 million HCV
km/yr) (c) = [(a) ×
(b)]/108
Reported injury
accidents/yr AT = b0 × (c)
Total reported injury accidents per year for affected corridor (sum of AT values for each section) = $ (d)
Cost per reported injury accident (table 4) $ (e)
Accident cost savings per year = (d) × (e) = $ (f)
2 PV of total accident cost savings
= (f) × 7.93 = $ D
Transfer the PV of the accident cost savings D, to D on worksheets 1 and 7.
3 CO2 reduction benefit Total annual HCV exposure = sum of column (c) from 1 above (g)
CO2 reduction benefit per year = (g) x 0.102 = $ (h)
PV of CO2 reduction benefit = (h) x 7.93 = $ E
Transfer the PV of the CO2 reduction benefit E, to E on worksheets 1 and 7.
Table 3: Rural mid-block equation coefficients (b0) for heavy vehicle accidents
Coefficients b0 by terrain type1
AADT
Level terrain (0 to 3%) Rolling terrain (3 to 6%) Mountainous terrain (>6%)
≤4000 19 40 50
>4000 19 19 41
1The terrain type can be selected by route gradient. The gradient ranges shown should generally be maintained throughout the mid-blocks. Sections of road that are less steep can occur in rolling or mountainous sections for short lengths. Provided that the lower gradient length is followed by another rolling or mountainous gradient, then the entire section can be classified as rolling or mountainous.
Table 4: Accident costs ($/reported injury accident - 2006)
Speed limit and location Accident cost
100km/h near rural 700,000
100km/h remote rural2 1,030,000
2 100km/h remote rural roads are defined as carrying less than 1000 vehicles/day and being more than 20 kilometres from a town with a population of 3000 or more.

Page SP8–16
The NZ Transport Agency’s Economic evaluation manual (volume 2) First edition, Amendment 0 Effective from January 2010
SP8 Freight transport services continued
Worksheet 7 – Explanation
Cost benefit analysis
1. Under benefits, enter the present values for the accident cost savings and CO2 reduction benefits, for each option.
2. Under costs, enter the discounted value of the funding gap and the PV for the net cost savings to government for each option. Subtract the net cost savings to government from the funding gap to obtain the total cost to government for each option.
3. Calculate the BCR for each option by dividing the PV of the total benefits by the PV of the total cost to government.
Incremental analysis
1. Rank the options in order of increasing cost to government.
2. Compare the lowest cost option with the next higher cost option to calculate the incremental BCR.
3. If the incremental BCR is less than the target incremental BCR specified in appendix A12 of EEM1, discard the second (higher cost) option in favour of the first. Compare the first option with the next higher cost option.
4. If the incremental BCR is greater than the target incremental BCR, the second (higher cost) option becomes the basis for comparison against the next higher cost option.
5. Repeat the procedure until no higher cost options are available that have an incremental BCR greater than the target incremental BCR.
Note: If a pavement reconstruction option is being considered in the analysis, consult the NZTA on how to evaluate the choice of the preferred option.

Page SP8–17
The NZ Transport Agency’s Economic evaluation manual (volume 2) First edition, Amendment 0 Effective from January 2010
SP8 Freight transport services continued
Worksheet 7 – BCR and incremental analysis
Time zero
Base date
BCR calculations Do-minimum Option Option Option Option
Benefits
PV accident cost savings (X)
PV CO2 reduction benefit (Y)
PV net user benefit (W)
PV total benefits (W + X + Y)
Total cost to government
PV funding assistance (options) (A)
PV net cost savings to government (options) (Z)
PV total cost to government (funding assistance – net cost savings to government) (A – Z)
BCRG = (W + X + Y)/(A - Z)
Base option for comparison Next higher option Incremental analysis
Option Total costs
(1)
Total benefits
(2)
Option Total costs
(3)
Total benefits
(4)
Incremental costs
(5) = (3) – (1)
Incremental benefits
(6) = (4) – (2)
Incremental BCR
(7) = (6) / (5)
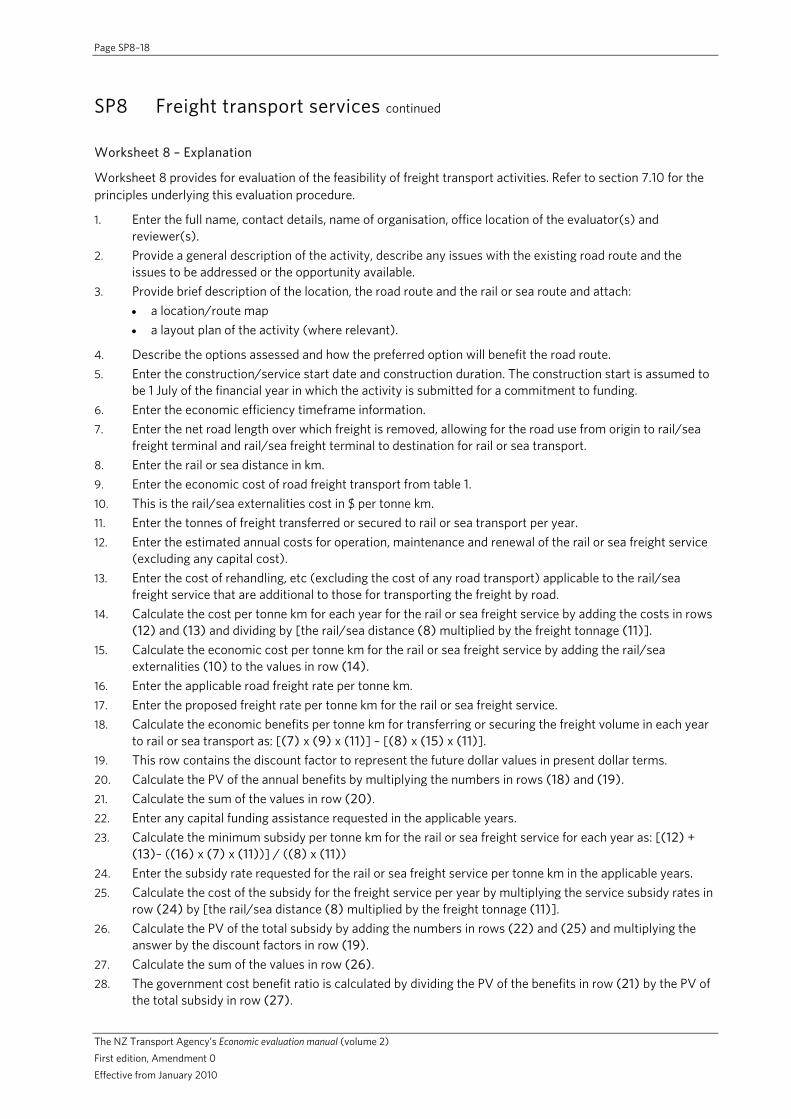
Page SP8–18
The NZ Transport Agency’s Economic evaluation manual (volume 2) First edition, Amendment 0 Effective from January 2010
SP8 Freight transport services continued
Worksheet 8 – Explanation
Worksheet 8 provides for evaluation of the feasibility of freight transport activities. Refer to section 7.10 for the principles underlying this evaluation procedure.
1. Enter the full name, contact details, name of organisation, office location of the evaluator(s) and reviewer(s).
2. Provide a general description of the activity, describe any issues with the existing road route and the issues to be addressed or the opportunity available.
3. Provide brief description of the location, the road route and the rail or sea route and attach: a location/route map a layout plan of the activity (where relevant).
4. Describe the options assessed and how the preferred option will benefit the road route. 5. Enter the construction/service start date and construction duration. The construction start is assumed to
be 1 July of the financial year in which the activity is submitted for a commitment to funding. 6. Enter the economic efficiency timeframe information. 7. Enter the net road length over which freight is removed, allowing for the road use from origin to rail/sea
freight terminal and rail/sea freight terminal to destination for rail or sea transport. 8. Enter the rail or sea distance in km. 9. Enter the economic cost of road freight transport from table 1. 10. This is the rail/sea externalities cost in $ per tonne km. 11. Enter the tonnes of freight transferred or secured to rail or sea transport per year. 12. Enter the estimated annual costs for operation, maintenance and renewal of the rail or sea freight service
(excluding any capital cost). 13. Enter the cost of rehandling, etc (excluding the cost of any road transport) applicable to the rail/sea
freight service that are additional to those for transporting the freight by road. 14. Calculate the cost per tonne km for each year for the rail or sea freight service by adding the costs in rows
(12) and (13) and dividing by [the rail/sea distance (8) multiplied by the freight tonnage (11)]. 15. Calculate the economic cost per tonne km for the rail or sea freight service by adding the rail/sea
externalities (10) to the values in row (14). 16. Enter the applicable road freight rate per tonne km. 17. Enter the proposed freight rate per tonne km for the rail or sea freight service. 18. Calculate the economic benefits per tonne km for transferring or securing the freight volume in each year
to rail or sea transport as: [(7) x (9) x (11)] – [(8) x (15) x (11)]. 19. This row contains the discount factor to represent the future dollar values in present dollar terms. 20. Calculate the PV of the annual benefits by multiplying the numbers in rows (18) and (19). 21. Calculate the sum of the values in row (20). 22. Enter any capital funding assistance requested in the applicable years. 23. Calculate the minimum subsidy per tonne km for the rail or sea freight service for each year as: [(12) +
(13)– ((16) x (7) x (11))] / ((8) x (11)) 24. Enter the subsidy rate requested for the rail or sea freight service per tonne km in the applicable years. 25. Calculate the cost of the subsidy for the freight service per year by multiplying the service subsidy rates in
row (24) by [the rail/sea distance (8) multiplied by the freight tonnage (11)]. 26. Calculate the PV of the total subsidy by adding the numbers in rows (22) and (25) and multiplying the
answer by the discount factors in row (19). 27. Calculate the sum of the values in row (26). 28. The government cost benefit ratio is calculated by dividing the PV of the benefits in row (21) by the PV of
the total subsidy in row (27).

Page SP8–19
The NZ Transport Agency’s Economic evaluation manual (volume 2) First edition, Amendment 0 Effective from January 2010
SP8 Freight transport services continued
Worksheet 8 – Feasibility evaluation
1 Evaluator(s)
Reviewer(s)
2 Activity details
Organisation name
Activity name
Your reference
Activity description
Describe the issue to be addressed
3 Route or location Brief description of location
4 Alternatives and options
Summarise the options assessed
5 Timing
Time zero (construction/service start date) 1 July Construction duration (months)
Economic efficiency
6 Date economic evaluation completed Base date for cost and benefits 1 July
7 Net road length (km) 8 Rail/sea distance (km)
9 Road economic cost ($/tonne km) 10 Rail/sea externalities ($/tonne km) 0.010
Year 1 2 3 4 5 6 11 Freight (tonnes) 12 Rail/sea service provider cost ($) 13 Rehandling cost ($) 14 Rail/sea cost ($/tonne km) 15 Rail/sea economic cost ($/tonne km) 16 Road freight rate ($/tonne km) 17 Rail/sea freight rate ($/tonne km) 18 Benefits ($) 19 Discount factor 0.93 0.86 0.79 0.74 0.68 0.63 20 PV of benefits ($) 21 Sum of row (20) ($) 22 Requested capital subsidy ($) 23 Minimum service subsidy ($/tonne km) 24 Requested service subsidy ($/tonne km) 25 Service subsidy ($) 26 PV of subsidy ($) 27 Sum of row (26) ($)
PV benefits (21) 28 BCRG
PV subsidy =
(27) =
Table 1: Economic cost of road freight transport ($/tonne km – 2008) State highway Local road (hilly terrain) Total economic cost $0.22 $0.32


Page SP9–1
The NZ Transport Agency’s Economic evaluation manual (volume 2) First edition, Amendment 0 Effective from January 2010
SP9 New passenger transport services
This procedure provides a simplified method for appraising the costs and benefits of new passenger transport activities that involve passenger transport services and/or capital infrastructure.
This simplified procedure assumes that:
1. New passenger transport services are provided in the peak period so that commuters change modes from private vehicles to bus or rail. The peak period must be defined and justification be provided.
2. Benefits of providing peak period services accrue to both the passenger transport user and road user.
3. The primary benefits are: road traffic reduction benefits (travel time savings including congestion reduction, vehicle operating cost (VOC) savings, accident cost savings, parking and environmental benefits including CO2 reduction).
4. The activity will not generate road maintenance and renewal cost savings, as the majority of traffic removed from the road network will be light vehicles. There will also be no road construction cost savings.
5. Other benefits (positive or negative) are not significant. However, allowance can be made for other benefits in this procedure.
6. Calculation of benefits and costs is based on incremental changes from the do-minimum to the option, the benefits and costs of the do-minimum are not calculated separately.
7. Activities adopted will be established or constructed in the first year and will be operating by the end of year 1.
8. An eight percent discount rate and 15 year analysis period are used for economic evaluation.
9. A 12 percent service provider rate of return is used for analysis of the funding gap.
10. All costs are exclusive of goods and services tax (GST).
In cases where the above assumptions are not appropriate, either the simplified procedure should be modified or full procedures used. The simplified procedure is designed to consider one option at a time. Where it is logical, consider other options to find the optimal solution. If there is more than one option, use incremental analysis of the costs and benefits of the different options.
For activities with a present value (PV) of the funding gap up to one million, only the worksheets for the chosen option need be submitted. For activities with a PV of the funding gap over one million dollars, worksheets for all options should be provided.
Worksheet Description
1 Evaluation summary
2 Service provider costs
3 Funding gap analysis
4 Passenger transport user benefits
5 Road traffic reduction benefits
6 BCR and incremental analysis
Introduction

Page SP9–2
The NZ Transport Agency’s Economic evaluation manual (volume 2) First edition, Amendment 0 Effective from January 2010
SP9 New passenger transport services continued
Worksheet 1 – Explanation
Worksheet 1 provides a summary of the general data used for the evaluation as well as the results of the analysis. The information required is a subset of the information required for assessment in terms of the NZ Transport Agency’s (NZTA) Planning, programming and funding manual.
1. Enter the full name, contact details, name of organisation, office location of the evaluator(s) and reviewer(s).
2. Provide a general description of the proposal.
3. Provide a brief description of the activity location and route, and attach:
a location/route map
a layout plan of the activity (where relevant).
4. Describe the do-minimum that is usually the least cost option to provide the service. Describe the options assessed and how the preferred option will improve passenger transport.
5. For purposes of the economic efficiency evaluation, the construction start is assumed to be 1 July of the financial year in which the activity is submitted for a commitment to funding.
6. Enter the timeframe information, identify the road length affected by use of passenger transport (kilometres), the estimated traffic growth (percentage per annum) and the peak period traffic flow (vehicles per hours). If peak period traffic flow cannot be expressed as a single figure, a range should be shown.
7. Use worksheets 2 and 3 to calculate the PV of the funding gap assistance.
8. Use worksheet 2 to calculate the PV of service provider costs.
9. Use worksheet 4 to calculate the PV of the passenger transport user benefits.
10. Use worksheet 5 to calculate the PV of road traffic reduction benefits.
11. The national benefit cost ratio is calculated by dividing the PV of passenger transport user benefits plus the PV of passenger transport road traffic reduction benefits by the PV of the service provider costs.
12. The government benefit cost ratio is calculated by dividing the PV of passenger transport user benefits plus the PV of road traffic reduction benefits by the PV of the funding assistance.

Page SP9–3
The NZ Transport Agency’s Economic evaluation manual (volume 2) First edition, Amendment 0 Effective from January 2010
SP9 New passenger transport services continued
Worksheet 1 – Evaluation summary
1 Evaluator(s)
Reviewer(s)
2 Activity/package details
Approved organisation name
Activity/package name
Your reference
Activity description
Describe the issue to be addressed
3 Location
Brief description of location
4 Alternatives and options
Describe the do-minimum
Summarise the options assessed
5 Timing
Time zero (assumed construction start date) 1 July
Expected duration of construction (months)
Period of analysis
6 Economic efficiency
Date economic evaluation completed (mm/yyyy)
Base date for costs and benefits 1 July
Road length affected by use of passenger transport kilometres
Peak period traffic flow vehicles/hour
Estimated traffic growth percentage/annum
7 PV of funding assistance $ A
8 PV of service provider costs $ B
9 PV of passenger transport user benefits $ C x update factor = $ X
10 PV of passenger transport road traffic reduction benefits
$
D x update factor
= $
Y
PV net benefits X + Y 11 BCRN =
PV economic costs =
B =
PV net benefits X + Y 12 BCRG =
PV costs to government =
A =

Page SP9–4
The NZ Transport Agency’s Economic evaluation manual (volume 2) First edition, Amendment 0 Effective from January 2010
SP9 New passenger transport services continued
Worksheet 2 – Explanation
Worksheet 2 is used to calculate the service provider costs from the new passenger transport service.
1. Enter the capital cost of the activity in year 1 of column (1) (some of the capital cost can be put in year 2 if the construction duration is more than 12 months). Also enter any decommissioning costs less salvage values into column (1) for the applicable years.
2. Enter the passenger transport service operating and maintenance costs for years 2 to 15 in column (3).
3. This column contains discount factors at the rate of eight percent per annum. This rate is set by The Treasury for public sector transport evaluation (chapter 2.6 of the NZTA’s Economic evaluation manual volume 1 (EEM1)).
4. Calculate the PV of costs per year by multiplying the sum of the capital cost (1) and operating and maintenance (O&M) cost (2), by the present worth factors in column (3).
5. Calculate the PV of service provider costs by summing column (4). Transfer the present value (PV) of the service provider costs B, to B in worksheet 1.

Page SP9–5
The NZ Transport Agency’s Economic evaluation manual (volume 2) First edition, Amendment 0 Effective from January 2010
SP9 New passenger transport services continued
Worksheet 2 – Service provider costs
Year Capital cost (1)
O&M cost (2)
SPPWF (3)
PV of costs (4) = [(1) + (2)] x (3)
1 0.93
2 0.86
3 0.79
4 0.74
5 0.68
6 0.63
7 0.58
8 0.54
9 0.50
10 0.46
11 0.43
12 0.40
13 0.37
14 0.34
15 0.31
5 PV of the service provider costs B
Transfer the PV of the service provider costs B, to B in worksheet 1.

Page SP9–6
The NZ Transport Agency’s Economic evaluation manual (volume 2) First edition, Amendment 0 Effective from January 2010
SP9 New passenger transport services continued
Worksheet 3 – Explanation
Worksheet 3 is used to determine whether or not the activity is commercially viable (refer to section 6.5). This worksheet should be set up and completed in a spreadsheet using, eg Microsoft Excel. Goal seek is used in this worksheet, but in order for it to perform correctly, equations from the instructions below need to be entered into the spreadsheet, linking the specified cells as opposed to using an external calculator.
1. Enter the service provider’s required rate of return (percentage per annum). It is generally expected that the required rate of return will reflect the industry norm of 12 percent. If an alternative rate of return is used, then this needs to be explained and justified and the single payment present worth factor (SPPWF) values in column (10) must be changed accordingly.
2. Enter the proposed user charge ($ per boarding). 3. Enter the number of new passenger transport users in year 2. 4. Enter the estimated patronage growth rate (percentage per annum). 5. Enter the capital cost of the activity in year 1 of column (5) (some of the capital cost can be put in year 2 if
the construction duration is more than 12 months). Also enter any decommissioning costs less salvage values into column (5) for the applicable years.
6. Enter the passenger transport service operating and maintenance costs for years 2 to 15 in column (6). 7. Calculate the revenue for year 2 in column (7) by multiplying the proposed user charge (2) by the number
of new passenger transport users in year 2 (3). Next calculate the revenue for the subsequent years using the formula; revenue in previous year x [1 + (4)]. Note: Other sources of additional revenue need to be included in the values for revenue for the years to which they relate, ie in-vehicle advertising revenue.
8. Define values in column (8) as dependents of the adjusting cell. The adjusting cell is the cell used by goal seek function to make the sum of net PV (10) equal zero, eg the values for years 3 to 15 equal the value for year 2 (the adjusting cell) but decrease over time.
9. Calculate the annual surplus (or deficit) per year using the formula: (9) = [(7) + (8)] – [(5) + (6)]. 10. This column contains the discount factor for a service provider rate of return of 12 percent. Refer to
section A1.2 of EEM1 for assistance calculating discount factors if the service provider’s rate of return is altered.
11. Calculate the PV of the annual surplus (or deficit) (11) by multiplying the annual surplus (or deficit) (9) by the present worth factors in column (10).
12. Calculate the PV of the annual funding gap (12) by multiplying the annual funding gap (8) by the present worth factors (10).
13. Calculate the sum of the annual net PV by summing column (11). Use the Microsoft Excel ‘goal seek’ function to find the value for the adjusting cell in column (8), that makes the sum of the annual net PV amounts (13) equal to zero. Based on the example in instruction (8), all values in column (8) should update when the goal seek function is executed, as the values in column (8) were set to depend on the adjusting cell input.
14. Calculate the sum of the funding gap (14) by summing column (8). 15. Calculate the sum of the PV of the funding gap (15) by summing column (12). 16. The funding to be included in the economic analysis is the PV of the subsidy provided for the activity
(which is discounted at eight percent), not the PV of the funding gap (which is discounted at the service provider’s required rate of return). The subsidy may be the same as the funding gap or it may be provided in a different manner. Enter the proposed subsidy for each year in column (16).
17. This column contains the annual present worth factors for an eight percent discount rate. 18. Calculate the PV of the subsidy by multiplying the subsidy (16) by the discount factors (17). 19. Calculate the PV of the funding assistance by summing column (19). Transfer the PV of the funding
assistance A, to A in worksheet 1.

Page SP9–7
The NZ Transport Agency’s Economic evaluation manual (volume 2) First edition, Amendment 0 Effective from January 2010
SP9 New passenger transport services continued
Worksheet 3 – Funding gap analysis
1 Service provider rate of return per annum 12%
2 Proposed user charge ($/boarding)
3 New passenger transport users in year 2
4 Estimated patronage growth rate (percent per annum)
Year
Capital cost
(5)
O&M cost
(6)
Revenue
(7)
Funding gap
(8)
Annual total
(9)=[(7)+(8)]
– [(5)+(6)]
SPPWF
(10)
Net PV
(11)=(9)×(10)
PV funding gap
(12)= (8)×(10)
1 0.89 2 0.78 3 0.71 4 0.65 5 0.57 6 0.51 7 0.45 8 0.40 9 0.36 10 0.32 11 0.29 12 0.26 13 0.23 14 0.21 15 0.18
13 Sum of net PV = sum of column (11) = $
14 Total funding gap = sum of column (8) = $
15 PV funding gap = sum of column (12) = $
Funding assistance
Year Subsidy (16) SPPWF (17) PV subsidy
(18) = (16) × (17)
1 0.93 2 0.86 3 0.79 4 0.74 5 0.68 6 – 15 4.75
19 PV of the funding assistance = $ A
Transfer the PV of the funding assistance A, to A in worksheet 1.

Page SP9–8
The NZ Transport Agency’s Economic evaluation manual (volume 2) First edition, Amendment 0 Effective from January 2010
SP9 New passenger transport services continued
Worksheet 4 – Explanation
The calculation of the passenger transport user benefits for a new service is based on the willingness to pay (WTP) of the users for the new service in the peak period, usually expressed as the maximum user charge (fare) they are willing to pay. The proposed user charge is subtracted from the maximum user charge to find the net passenger transport user benefit.
For a new passenger transport service the evaluator may draw on information from existing services to derive a WTP value for the new service. All assumptions must be clearly stated.
Note: that the ‘rule of a half’ applies to the calculation of new passenger transport user benefits.
1. Enter the raw data from (a) to (d). Calculate the passenger transport user benefit for the new service per boarding (e) by subtracting the proposed user charge (c) from the maximum amount users are WTP for the new service (d). Calculate the net passenger transport user benefit in year 2 (f) by multiplying the new passenger transport users in year 2 (a) by the passenger transport user benefit for new service per boarding (e) and then by 0.5.
2. Calculate the PV of passenger transport user benefits by multiplying the net passenger transport user benefit in year 2 (f) by the appropriate Discount factor (DF) factor taken from table 1 (below).
Table 1: Discount factors (DF) for different growth rates for years 2 to 15 inclusive
Passenger growth rate 0% 0.5% 1.0% 1.5% 2.0% 2.5% 3.0% 3.5% 4.0%
DF 7.93 8.20 8.47 8.74 9.01 9.28 9.55 9.81 10.08

Page SP9–9
The NZ Transport Agency’s Economic evaluation manual (volume 2) First edition, Amendment 0 Effective from January 2010
SP9 New passenger transport services continued
Worksheet 4 – Passenger transport user benefits
1 Passenger transport user benefits for a new service
New passenger transport users in year 2 (a)
Estimated passenger growth rate (per annum) (b)
Proposed user charge (per boarding) (c)
Maximum amount users (user charge) are willing to pay for new service (d)
Passenger transport user benefit for new service (per boarding) = (d) – (c) (e)
Net passenger transport user benefit in year 2 = (a) × (e) × 0.5 (f)
2 PV of passenger transport user benefits
This calculation is based on a 15-year analysis period and assumes that the service is operating from years 2 to 15. If a different period is used, refer to chapter 7.
PV = (f) × DF (table 1) = $ C
Transfer the PV of passenger transport user benefits C, to C in worksheet 1.
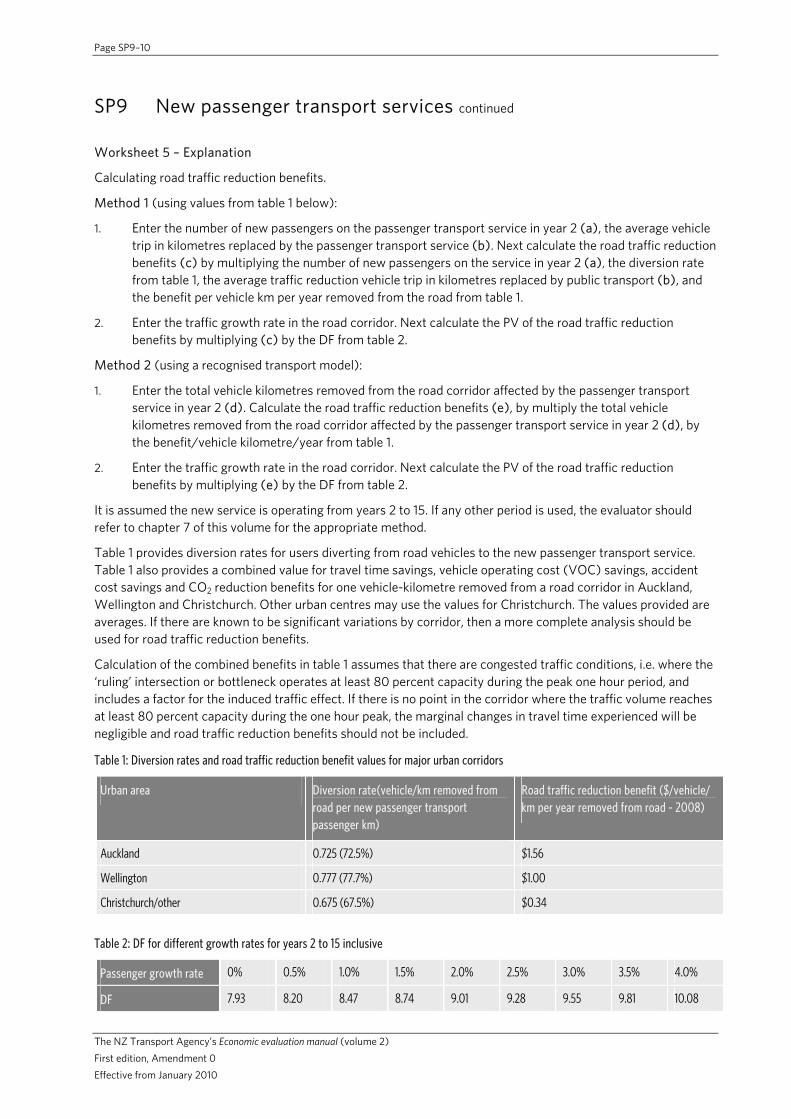
Page SP9–10
The NZ Transport Agency’s Economic evaluation manual (volume 2) First edition, Amendment 0 Effective from January 2010
SP9 New passenger transport services continued
Worksheet 5 – Explanation
Calculating road traffic reduction benefits.
Method 1 (using values from table 1 below):
1. Enter the number of new passengers on the passenger transport service in year 2 (a), the average vehicle trip in kilometres replaced by the passenger transport service (b). Next calculate the road traffic reduction benefits (c) by multiplying the number of new passengers on the service in year 2 (a), the diversion rate from table 1, the average traffic reduction vehicle trip in kilometres replaced by public transport (b), and the benefit per vehicle km per year removed from the road from table 1.
2. Enter the traffic growth rate in the road corridor. Next calculate the PV of the road traffic reduction benefits by multiplying (c) by the DF from table 2.
Method 2 (using a recognised transport model):
1. Enter the total vehicle kilometres removed from the road corridor affected by the passenger transport service in year 2 (d). Calculate the road traffic reduction benefits (e), by multiply the total vehicle kilometres removed from the road corridor affected by the passenger transport service in year 2 (d), by the benefit/vehicle kilometre/year from table 1.
2. Enter the traffic growth rate in the road corridor. Next calculate the PV of the road traffic reduction benefits by multiplying (e) by the DF from table 2.
It is assumed the new service is operating from years 2 to 15. If any other period is used, the evaluator should refer to chapter 7 of this volume for the appropriate method.
Table 1 provides diversion rates for users diverting from road vehicles to the new passenger transport service. Table 1 also provides a combined value for travel time savings, vehicle operating cost (VOC) savings, accident cost savings and CO2 reduction benefits for one vehicle-kilometre removed from a road corridor in Auckland, Wellington and Christchurch. Other urban centres may use the values for Christchurch. The values provided are averages. If there are known to be significant variations by corridor, then a more complete analysis should be used for road traffic reduction benefits.
Calculation of the combined benefits in table 1 assumes that there are congested traffic conditions, i.e. where the ‘ruling’ intersection or bottleneck operates at least 80 percent capacity during the peak one hour period, and includes a factor for the induced traffic effect. If there is no point in the corridor where the traffic volume reaches at least 80 percent capacity during the one hour peak, the marginal changes in travel time experienced will be negligible and road traffic reduction benefits should not be included.
Table 1: Diversion rates and road traffic reduction benefit values for major urban corridors
Table 2: DF for different growth rates for years 2 to 15 inclusive
Urban area Diversion rate(vehicle/km removed from road per new passenger transport passenger km)
Road traffic reduction benefit ($/vehicle/ km per year removed from road - 2008)
Auckland 0.725 (72.5%) $1.56
Wellington 0.777 (77.7%) $1.00
Christchurch/other 0.675 (67.5%) $0.34
Passenger growth rate 0% 0.5% 1.0% 1.5% 2.0% 2.5% 3.0% 3.5% 4.0%
DF 7.93 8.20 8.47 8.74 9.01 9.28 9.55 9.81 10.08

Page SP9–11
The NZ Transport Agency’s Economic evaluation manual (volume 2) First edition, Amendment 0 Effective from January 2010
SP9 New passenger transport services continued
Worksheet 5 – Road traffic reduction benefits
1 Calculating road traffic reduction benefits
Method 1 (using values from table 1 above)
New passengers on passenger transport service in year 2 = (a)
Average length of vehicle trip replaced by passenger transport service (km) = (b)
Road traffic reduction benefits = (a) × diversion rate × (b) × benefit/vehicle km (per year) = $ (c)
Method 2 (using a recognised transport model)
Total vehicle-km removed from road corridor affected by passenger transport service in year 2 = (d)
Road traffic reduction benefits = (d) × benefit/vehicle km (from table 1) = (e)
2 PV of road traffic reduction benefits
Traffic growth rate in road corridor %
PV = (c) or (e) × DF (from table 2) = $ D
Transfer the PV of road traffic reduction benefits D, to D in worksheet 1.

Page SP9–12
The NZ Transport Agency’s Economic evaluation manual (volume 2) First edition, Amendment 0 Effective from January 2010
SP9 New passenger transport services continued
Worksheet 6 – Explanation
Cost benefit analysis
1. Under benefits, enter the discounted values for the passenger transport user benefits and the road traffic reduction benefits for each option. Add together the benefits to obtain the total benefits for each option.
2. Under costs, enter the discounted value of the funding assistance for each option.
3. Calculate the government benefit cost ratio (BCR) for each option by dividing the PV of the total benefits by the PV of the funding assistance.
Incremental analysis
1. Rank the options in order of increasing cost to government.
2. Compare the lowest cost option with the next higher cost option to calculate the incremental BCR.
3. If the incremental BCR is less than the target incremental BCR specified in appendix A12 of EEM1, discard the second (higher cost) option in favour of the first. Compare the first option with the next higher cost option.
4. If the incremental BCR is greater than the target incremental BCR, the second (higher cost) option becomes the basis for comparison against the next higher cost option.
5. Repeat the procedure until no higher cost options are available that have an incremental BCR greater than the target incremental BCR.

Page SP9–13
The NZ Transport Agency’s Economic evaluation manual (volume 2) First edition, Amendment 0 Effective from January 2010
SP9 New passenger transport services continued
Worksheet 6 – BCR and incremental analysis
Time zero
Base date
BCR calculations Do-minimum Option Option Option Option
Benefits
PV of passenger transport user benefits (X)
PV road traffic reduction benefits (Y)
PV total benefit (X + Y)
Total cost to government
PV funding assistance (options) (A)
BCRG = (W + Y)/(A)
Base option for comparison Next higher option Incremental analysis
Option Total costs
(1)
Total benefits
(2)
Option Total costs
(3)
Total benefits
(4)
Incremental costs
(5) = (3) – (1)
Incremental benefits
(6) = (4) – (2)
Incremental BCR
(7) = (6) / (5)


Page SP10–1
The NZ Transport Agency’s Economic evaluation manual (volume 2) First edition, Amendment 0 Effective from January 2010
SP10 Existing passenger transport services
This procedure provides a simplified method for appraising the costs and benefits of activities to improve an existing passenger transport service through the provision of capital infrastructure and/or service improvements.
This simplified procedure assumes that:
1. Service improvements primarily concern existing peak period services and as a result of improvements commuters change modes from private vehicles to bus or rail.
2. The primary benefits are: travel time savings (including congestion reduction), vehicle operating cost (VOC) savings, accident cost savings, parking and environmental benefits (including CO2 reduction), reliability benefits and vehicle and infrastructure benefits.
3. The activity will not generate road maintenance and renewal cost savings, as the majority of traffic removed from the road network will be light vehicles. There will also be no road capital cost savings.
4. Other benefits (positive or negative) are not significant. However, allowance can be made for other benefits in these procedures.
5. The activity will not generate a drop off in existing passengers (ie due to a fare rise).
6. Activities adopted will be established or constructed in the first year and will be operating by the end of year 1.
7. An eight percent discount rate and 15-year analysis period are used.
8. A 12 percent service provider rate of return is used for analysis of the funding gap.
9. All costs are exclusive of goods and services tax (GST).
In cases where the above assumptions are not appropriate, either the simplified procedure should be modified or full procedures used. The simplified procedure is designed to consider one option at a time. Where it is logical to do so, consider other options in order to select the optimal solution. If there is more than one option, the evaluation will involve incremental analysis of the costs and benefits of the different options.
For activities with a total funding gap of less than one million dollars, only the worksheets for the chosen option need be submitted. For activities over one million dollars, worksheets for all options should be provided.
Worksheet Description
1 Evaluation summary
2 Service provider costs
3 Funding gap analysis
4 Net benefits
5 BCR and incremental analysis
Introduction

Page SP10–2
The NZ Transport Agency’s Economic evaluation manual (volume 2) First edition, Amendment 0 Effective from January 2010
SP10 Existing passenger transport services continued
Worksheet 1 – Explanation
Worksheet 1 provides a summary of the general data used for the evaluation as well as the results of the analysis. The information required is a subset of the information required for assessment in terms of the NZ Transport Agency’s (NZTA) Planning, programming and funding manual.
1. Enter the full name, contact details, name of organisation, office location of the evaluator(s) and reviewer(s).
2. Provide a general description of the activity (where relevant), describe the issues with the existing services and the issues to be addressed.
3. Provide a brief description of the activity location and include and attach:
a location/route map.
a layout plan of the proposal.
4. Describe the do-minimum that is usually the least cost option to maintain the current service in an unimproved state. Describe the options assessed and how the preferred option will improve the service.
5. For purposes of economic efficiency, the construction start is assumed to be 1 July of the financial year in which the activity is submitted for a commitment to funding.
6. Enter the timeframe information, identify the length affected by use of passenger transport (kilometres), the estimated traffic growth (percentage per annum) and the peak period traffic flow (vehicles per hours). If peak period traffic flow cannot be expressed as a single figure, a range should be shown.
7. Enter the peak period times, the existing number peak period passengers in the current year, the percentage growth rate per annum in the passenger numbers over the last five years and the operating cost per annum into the appropriate places.
8. Enter the peak period times, the expected number of new peak period passengers, the diversion rate from car drivers to passenger transport service passengers and the estimated rate of growth of passengers using the service per annum into the appropriate places.
9. Enter the proposed user charge for passenger transport service.
10. Use worksheet 3 to estimate the PV of funding assistance.
11. Use worksheet 2 calculate the PV of service provider costs.
12. Use worksheet 4 to calculate the PV of total benefits then apply the update factor from appendix A12.
13. The national benefit cost ratio is calculated by dividing the PV of total benefits by the PV of the service provider costs.
14. The government benefit cost ratio (BCRG) is calculated by dividing the PV of total benefits by the PV of the funding assistance.

Page SP10–3
The NZ Transport Agency’s Economic evaluation manual (volume 2) First edition, Amendment 0 Effective from January 2010
SP10 Existing passenger transport services continued
Worksheet 1 – Evaluation summary
1 Evaluator(s)
Reviewer(s)
2 Activity details
Approved organisation name
Activity name
Your reference
Activity description
Describe the issue to be addressed
3 Brief description of location
4 Alternatives and options
Describe the do-minimum
Summarise the options assessed
5 Timing
Time zero (assumed construction start date) 1 July
Expected duration of construction (months)
Period of analysis 15 years
6 Economic efficiency
Date economic evaluation completed (mm/yyyy)
Base date for costs and benefits 1 July
Length affected by use of PT kilometres
Peak period traffic flow vehicle/hour
Estimated traffic growth percentage/annum
7 Existing passenger transport service Peak period am to am, and pm to pm
Existing peak period passenger numbers in year
Growth rate in passenger numbers over last five years percentage/annum
Operating cost $ per annum
8 Proposed passenger transport service Peak period: am to am, and pm to pm
Number of new passenger transport service passengers in year 2
Diversion rate from car drivers to passenger transport service passengers %
Estimated rate of growth of passengers using service $ percentage/annum
9 Proposed user charge for passenger transport service $
10 PV of funding assistance $ A
11 PV of service provider costs $ B
12 PV of total benefits $ C x update factor = $ X
PV net benefits X 13 BCRN =
PV economic costs =
B =
PV net benefits X 14 BCRG =
PV costs to government =
A =

Page SP10–4
The NZ Transport Agency’s Economic evaluation manual (volume 2) First edition, Amendment 0 Effective from January 2010
SP10 Existing passenger transport services continued
Worksheet 2 – Explanation
Worksheet 2 is used to calculate the service provider costs that result from the activity to the existing passenger transport service.
1. Enter the capital cost of the activity in year 1 of column (1) (some of the capital cost can be put in year 2 if the construction duration is more than 12 months). Also enter any decommissioning costs less salvage values into column (1) for the applicable years.
2. Enter the additional passenger transport service operating and maintenance costs which result from the proposal, for years 2 to 15 in column (3).
3. This column contains discount factors at the rate of eight percent per annum. This rate is set by The Treasury for public sector transport evaluation (Chapter 2.6 of the NZTA’s Economic evaluation manual volume 1 (EEM1)).
4. Calculate the PV of costs per year by multiplying the sum of the capital cost (1) and operating and maintenance (O&M) cost (2), by the present worth factors in column (3).
5. Calculate the PV of service provider costs by summing column (4). Transfer the PV of the service provider costs B, to B in worksheet 1.

Page SP10–5
The NZ Transport Agency’s Economic evaluation manual (volume 2) First edition, Amendment 0 Effective from January 2010
SP10 Existing passenger transport services continued
Worksheet 2 – Service provider costs
Year Capital cost (1)
O&M cost (2)
SPPWF (3)
PV of cost (4) = [(1) + (2)] x (3)
1 0.93
2 0.86
3 0.79
4 0.74
5 0.68
6 0.63
7 0.58
8 0.54
9 0.50
10 0.46
11 0.43
12 0.40
13 0.37
14 0.34
15 0.31
5 PV of the service provider costs B
Transfer the PV of the service provider costs B, to B in worksheet 1.

Page SP10–6
The NZ Transport Agency’s Economic evaluation manual (volume 2) First edition, Amendment 0 Effective from January 2010
SP10 Existing passenger transport services continued
Worksheet 3 – Explanation
Worksheet 3 is used to determine whether or not the activity is commercially viable (refer to section 6.5). This worksheet should be set up and completed in a spreadsheet using, eg Microsoft Excel. Goal seek is used in this worksheet, but in order for it to perform correctly, equations from the instructions below need to be entered into the spreadsheet, linking the specified cells as opposed to using an external calculator.
1. Enter the service provider’s required rate of return (percentage per annum). It is generally expected that the required rate of return will reflect the industry norm of 12 percent. If an alternative rate of return is used, then this needs to be explained and justified and the single payment present worth factor (SPPWF) values in column (13) must be changed accordingly.
2. Enter the existing user charge ($ per boarding). 3. Enter the existing number of passengers per year. 4. Enter the growth rate over the last five years in passenger transport patronage in percent per annum. 5. Enter the proposed user charge ($ per boarding). 6. Enter the estimated total passenger trips per annum from year 2. 7. Enter the estimated patronage growth rate (% per annum). 8. Enter the capital cost of the activity in year 1 of column (8) (some of the capital cost can be put in year 2 if
the construction duration is more than 12 months). Also enter any decommissioning costs less salvage values into column (8) for the applicable years.
9. Enter the additional passenger transport service operating and maintenance costs which would result from the proposal, for years 2 to 15 in column (9).
10. Calculate the revenue for year 2 in column (10) using the equation (10) = [(5) x (6)] – [(2) x (3)]. Next calculate the revenue for the subsequent years using the formula; revenue in previous year x [1 + (7) – (4)]. Note: Additional revenue from other sources which would result from the proposal, need to be included in the values for revenue for the years to which they relate, ie in-vehicle advertising revenue.
11. Define values in column (11) as dependents of the adjusting cell. The adjusting cell is the cell used by goal seek function to make the sum of net PV (16) equal zero, eg the values for years 3 to 15 equal the value for year 2 (the adjusting cell), but decrease over time.
12. Calculate the annual surplus (or deficit) per year using the formula: (12) = [(10) + (11)] – [(8) + (9)]. 13. This column contains the discount factor for a service provider rate of return of 12 percent. Refer to section
A1.2 of EEM for assistance calculating discount factors if the service provider’s rate of return is altered. 14. Calculate the PV of the annual surplus (or deficit) (14) by multiplying the annual surplus (or deficit) (12)
by the present worth factors in column (13). 15. Calculate the PV of the annual funding gap (15) by multiplying the annual funding gap (11) by the present
worth factors (13). 16. Calculate the sum of the annual net PV by summing column (14). Use the Microsoft Excel ‘goal seek’
function to find the value for the adjusting cell in column (11), that makes the sum of the annual net PV amounts (16) equal to zero. Based on the example in instruction (11), all values in column (11) should update when the goal seek function is executed, as the values in column (11) were set to depend on the adjusting cell input.
17. Calculate the sum of the funding gap (17) by summing column (11). 18. Calculate the sum of the PV of the funding gap (18) by summing column (15). 19. The funding to be included in the economic analysis is the PV of the subsidy provided for the activity
(which is discounted at eight percent), not the PV of the funding gap (which is discounted at the service provider’s required rate of return). The subsidy may be the same as the funding gap or it may be provided in a different manner. Enter the proposed subsidy for each year in column (19).
20. This column contains the annual present worth factors for an eight percent discount rate. 21. Calculate the PV of the subsidy by multiplying the subsidy (19) by the discount factors (20). 22. Calculate the PV of the funding assistance by summing column (22). Transfer the PV of the funding
assistance A, to A in worksheet 1.

Page SP10–7
The NZ Transport Agency’s Economic evaluation manual (volume 2) First edition, Amendment 0 Effective from January 2010
SP10 Existing passenger transport services continued
Worksheet 3 – Funding gap analysis
1 Service provider rate of return per annum 12%
2 Existing user charge ($/boarding)
3 Existing passengers per year
4 Existing percentage passenger growth (over last five years)
5 Proposed user charge ($/boarding)
6 Estimated total passenger trips per annum from year 2
7 Estimated patronage growth rate (percent per annum)
Year
Capital cost
(8)
O&M cost
(9)
Revenue
(10)
Funding gap
(11)
Annual total
(12)=[(10)+(11)]
– [(8)+(9)]
SPPWF
(13)
Net PV
(14)=(12)×(13)
PV funding gap
(15)= (11)×(13)
1 0.89 2 0.78 3 0.71 4 0.65 5 0.57 6 0.51 7 0.45 8 0.40 9 0.36 10 0.32 11 0.29 12 0.26 13 0.23 14 0.21 15 0.18
16 Sum of net PV = sum of column (14) = $
17 Total funding gap = sum of column (11) = $
18 PV funding gap = sum of column (15) = $
Year Subsidy (19) SPPWF (20) PV subsidy
(21) = (19) × (20)
1 0.93 2 0.86 3 0.79 4 0.74 5 0.68 6 – 15 4.75
22 PV of the funding assistance = $ A
Transfer the PV of the funding assistance A, to A in worksheet 1.

Page SP10–8
The NZ Transport Agency’s Economic evaluation manual (volume 2) First edition, Amendment 0 Effective from January 2010
SP10 Existing passenger transport services continued
Worksheet 4 – Explanation
For improvements to an existing passenger transport service, road traffic reduction benefits and additional passenger transport user benefits use a benefit value that incorporate road user travel time, accident and VOC savings, and environmental benefits, as well as the benefits of the improved passenger transport services for existing and additional passenger transport users.
1. Enter the base information used to calculate service benefits. Note: The estimated percentage growth rate per annum excludes the existing growth rate per annum.
2. Calculate the road traffic reduction benefit (e) by multiplying the additional passenger trips from year 2 (c) by the relevant $ road traffic reduction benefit from table 1. Next calculate the passenger transport user benefit (f) by multiplying the additional passenger trips from year 2 (c) by the relevant $ passenger transport user benefit from table 1.
3. Enter the relevant equivalent time to a minute late ratio (g) from table 2 and the reduction in the average amount of minutes that the existing service is late (h). Calculate the number of passenger trips per annum (i) by summing the existing passenger trips per year (a) and the additional passenger trips per year from year 2 (c). Calculate the reliability benefit (j) by multiplying the equivalent minutes to late ratio (h) by the average minutes late (h), then by the total passenger trips per annum (i) and finally by the travel time value $0.322 ($/minute 2008). Note: The equivalent time to a minute late ratio (g) multiplied by average minutes late (h), cannot outweigh the total travel time and will need to be capped if exceeded.
4. Enter the relevant attributes with the applicable in vehicle time (IVT) minutes from section 7.2 and calculate the sum of the IVT values (k). Note: If there are multiple attributes, the sum of IVT minutes must be divided by the number of attributes. Calculate the total infrastructure and vehicle benefits (l) by multiplying the number of passenger trips for the period analysed (i) by the sum of IVT minutes (k), then by the travel time value $0.322 ($/minute 2008).
5. Calculate the total benefits in year 2 (m) by summing the road traffic reduction benefit (e), the passenger transport user benefit (f), the reliability benefit (j) and the infrastructure and vehicle benefits (l). Finally calculate the PV of benefits C by multiplying the total benefits in year 2 (m) by the discount factor from table 3. Transfer the PV of total benefits C, to C on worksheet 1.
The calculation of the travel time savings value assumes that during peak periods there are congested traffic conditions (where the ‘ruling’ intersection or bottleneck operate at least 80 percent capacity during the peak one hour period) and includes a factor for induced traffic effect. If there is no point in the corridor where the traffic volume reaches at least 80 percent capacity during the peak then use the off peak rates.
Table 1: Benefits ($/additional passenger boarding - 2008)
Caveat on using the above data
The above values are based on passenger transport trips of average length for each urban area or mode. Where the values in table 1 above do not accurately represent local conditions, you should provide additional information that shows what values have been used and whether these have been calibrated to local conditions.
Road traffic reduction benefits Passenger transport user benefits Urban area Mode Average trip length (km) Peak Off peak Peak Off peak
All 7.70 12.61 0.86 8.59 5.73
Rail 16.50 17.27 1.65 13.18 8.78
Auckland
Bus/ferry 6.60 11.73 0.76 8.02 5.35
All 12.14 13.25 1.25 10.90 7.27
Rail 22.76 17.70 1.99 16.44 10.96
Wellington
Bus/ferry 6.97 11.97 0.89 8.21 5.48
Christchurch All 8.05 2.71 1.24 8.78 5.85
Other All 7.86 2.06 1.00 8.68 5.78

Page SP10–9
The NZ Transport Agency’s Economic evaluation manual (volume 2) First edition, Amendment 0 Effective from January 2010
SP10 Existing passenger transport services continued
Worksheet 4 – Net benefits
1 Base information to calculate service benefits
Existing passenger trips per year (a)
Existing percentage passenger growth rate (over past five years) (b)
Additional passenger trips per year from year 2 (c)
Estimated percentage growth rate (per annum) (d)
2 Road traffic reduction benefit and passenger transport user benefit in year 2
Road traffic reduction benefit (c) × $ road traffic reduction benefit (table 1) = $ (e)
Passenger transport user benefit (c) × $ passenger transport user benefit (table 1) = $ (f)
3 Passenger transport reliability benefit
Equivalent time to a minute late ratio (table 2) (g)
Reduction in average minutes late (h)
Number of passenger trips affected per annum (a) + (c) = (i)
Reliability benefit (g) × (h) × (i) × $0.322 = $ (j)
4 Passenger transport infrastructure and vehicle benefit (halve IVT minutes if multiple attributes)
Attribute IVT minutes Attribute IVT minutes Attribute IVT minutes
Total in vehicle time minutes (IVT) sum of IVT minutes = (k)
Total passenger transport infrastructure and vehicle benefit (i) × (k) × $0.322 = $ (l)
5 Total benefits in year 2 (e) + (f) + (j) + (l) = $ (m)
PV of total benefits (m) × DF (table 3) = $ C
Transfer the PV of total benefits C, to C on worksheet 1.
Table 2: Equivalent minutes to late ratios
Valuation
Departure In vehicle travel Combined
5.0 2.8 3.9
Table 3: Discount factors (DF) for different estimated growth rates for years 2 to 15 inclusive
Passenger growth rate 0% 0.5% 1.0% 1.5% 2.0% 2.5% 3.0% 3.5% 4.0%
DF 7.93 8.20 8.47 8.74 9.01 9.28 9.55 9.81 10.08

Page SP10–10
The NZ Transport Agency’s Economic evaluation manual (volume 2) First edition, Amendment 0 Effective from January 2010
SP10 Existing passenger transport services continued
Worksheet 5 – Explanation
Cost benefit analysis
1. Under benefits, enter the discounted value for the total benefits for each option.
2. Under costs, enter the PV of the operating and maintenance costs for the existing service (before improvements), for the do-minimum and the discounted value of the funding assistance for each option.
3. Calculate the benefit cost ratio (BCR) for each option by dividing the total benefits by the funding assistance.
Incremental analysis
1. Rank the options, including the do-minimum, in order of increasing cost to government.
2. Compare the lowest cost option (usually the do-minimum) with the next higher cost option to calculate the incremental BCR.
3. If the incremental BCR is less than the target incremental BCR specified in appendix A12 of EEM1, discard the second (higher cost) option in favour of the first. Compare the first option with the next higher cost option.
4. If the incremental BCR is greater than the target incremental BCR, the second (higher cost) option becomes the basis for comparison against the next higher cost option.
5. Repeat the procedure until no higher cost options are available that have an incremental BCR greater than the target incremental BCR.

Page SP10–11
The NZ Transport Agency’s Economic evaluation manual (volume 2) First edition, Amendment 0 Effective from January 2010
SP10 Existing passenger transport services continued
Worksheet 5 – BCR and incremental analysis
Time zero
Base date
BCR calculations Do-minimum Option Option Option Option
Benefits
Total benefits (X)
Total cost to government
PV operating and maintenance costs of existing service (for do-minimum)
PV funding assistance (options) (A)
BCRG = X/A
Base option for comparison Next higher option Incremental analysis
Option Total costs
(1)
Total benefits
(2)
Option Total costs
(3)
Total benefits
(4)
Incremental costs
(5) = (3) – (1)
Incremental benefits
(6) = (4) – (2)
Incremental BCR
(7) = (6) / (5)


Page SP11–1
The NZ Transport Agency’s Economic evaluation manual (volume 2) First edition, Amendment 0 Effective from January 2010
SP11 Walking and cycling facilities
This procedure provides a method of evaluating the economic efficiency of walking and cycling facility improvements, with the exception of signalised crossings over roads.
This simplified procedure assumes that:
1. an eight percent discount rate and 30-year analysis period are used
2. construction will be completed in the first year and will be in service by the end of year 1
3. all costs are exclusive of goods and services tax (GST)
4. in cases where the above assumptions are not appropriate, either the simplified procedure should be modified or full procedures used.
The simplified procedure is designed to consider one option at a time. Where it is logical to do so, consider other suitable options in order to select the optimal solution. If there is more than one option, the evaluation will involve incremental analysis of the costs and benefits of the different options. In particular, where a separate dedicated cycleway is proposed the alternative option of providing wider sealed shoulders or cycle lanes on the carriageway must be considered. The preferred option shall have a minimum incremental benefit cost ratio (BCR) of 1.0 and shall be sensitivity tested using a target incremental BCR that is 1.0 higher than the ratio used for choosing the preferred option (refer to appendix A12 of the NZ Transport Agency’s (NZTA) Economic evaluation manual volume 1 (EEM1)).
For walking and cycling facilities, the worksheets for all the options must be submitted together with a summary of the incremental analysis.
To use the worksheets, it is necessary to determine both the current numbers, and growth rate of cycle/pedestrian traffic for the activity. These must be based on local counts and realistic projections or for cyclists, and can be obtained for cyclists using worksheet 7.
Note: All walking and cycling activities are subject to a safety audit to help ensure that safety is improved as a result of the proposal.
Worksheet Description
1 Evaluation summary
2 Cost of the do-minimum
3 Costs of the option
4 Travel time cost savings
5 Benefits for walking and cycling facilities
6 Accident cost savings
7 Cycle demand
8 BCR and incremental analysis
Introduction

Page SP11–2
The NZ Transport Agency’s Economic evaluation manual (volume 2) First edition, Amendment 0 Effective from January 2010
SP11 Walking and cycling facilities continued
Worksheet 1 – Explanation
Worksheet 1 provides a summary of the general data used for the evaluation as well as the results of the analysis. The information required is a subset of the information required for assessment in terms of the NZTA’s Planning, programming and funding manual.
1. Enter the full name, contact details, name of organisation, office location of the evaluator(s) and reviewer(s).
2. Provide a general description of the activity (and package where relevant), describe the issues with the existing facilities and the issues to be addressed.
3. Provide a brief description of the activity location including:
a location/route map
a layout plan of the proposal.
4. Describe the do-minimum that is usually the least cost option to maintain the current facility in an unimproved state. Describe the options assessed and how the preferred option will improve the road section.
5. For purposes of economic efficiency, the construction start is assumed to be 1 July of the financial year in which the activity is submitted for a commitment to funding.
6. Enter the timeframe information, identify the expected duration of construction (months) and identify whether land designation is required.
7. Enter the applicable data to your request into the appropriate spaces provided.
8. Use worksheet 2 to calculate the present value (PV) cost of the do-minimum. This should be the lowest cost option that will keep the road in service. It will provide no improvements.
9. Use worksheet 3 to estimate the preferred option PV cost
10. Enter the benefits values from worksheets 4 (travel time savings), 5 (walking and cycling facility benefits) and 6 (accident cost savings). To bring the benefits up to the base date values, use the appropriate update factors supplied in appendix A12.3.
11. The national benefit cost ratio (BCRN) is calculated by dividing the PV of the net benefits (PV benefits of the do-minimum subtracted from the PV benefits of the option) by PV of the net costs (PV costs of the do-minimum subtracted from the PV costs of the option).

Page SP11–3
The NZ Transport Agency’s Economic evaluation manual (volume 2) First edition, Amendment 0 Effective from January 2010
SP11 Walking and cycling facilities continued
Worksheet 1 – Evaluation summary
1 Evaluator(s)
Reviewer(s)
2 Activity details
Approved organisation name
Activity name
Your reference
Activity description
Describe the issues to be addressed
3 Location Brief description of location
4 Alternatives and options Describe the do-minimum
Summarise the options assessed
5 Timing
Time zero (assumed construction start date) 1 July
Expected duration of construction (months)
Period of analysis
6 Economic efficiency
Date economic evaluation completed (mm/yyyy)
Base date for costs and benefits 1 July
Land designation required Yes No
7 Data (only fill in the applicable data) Existing pedestrian/cycling volumes AADT in year
Estimated new pedestrian/cyclist volume AADT
Estimated motor vehicle volumes AADT
Estimated motor vehicle speed km/h
Pedestrian/cyclist growth rate %
Width available for walking/cycling before m
Width available for walking/cycling after m
Length walked/cycled after works km
Length walked/cycled before works km
Expected reduction in private vehicle travel km per day
8 PV cost of the do-minimum $ A
9 PV cost of the preferred option $ B
10 Benefit values from worksheet 4, 5, 6
PV travel time cost savings $ C x update factor TTC = $ X
PV facility benefits $ D x update factor WCB = $ Y
PV accident cost savings $ E x update factor AC = $ Z
PV net benefits X + Y + Z 10 BCRN =
PV economic costs =
B – A =
=

Page SP11–4
The NZ Transport Agency’s Economic evaluation manual (volume 2) First edition, Amendment 0 Effective from January 2010
SP11 Walking and cycling facilities continued
Worksheet 2 – Explanation
Worksheet 2 is used for calculating the PV cost of the do-minimum. The do-minimum is the minimum level of expenditure necessary to keep a facility open and generally consists of maintenance work.
1. Enter the historic maintenance cost data. The annual and periodic maintenance costs should be obtained from maintenance records.
2. Calculate the PV of annual maintenance costs (a) for the do-minimum by multiplying the annual cost by the discount factor of 11.70.
3. Schedule any periodic maintenance, according to the year in which this work is expected to be undertaken. Apply the appropriate single payment present worth factor (SPPWF) from table 1 below to determine the PV at time zero. Sum the PV of the periodic costs to determine the PV of total periodic maintenance costs (b).
4. Calculate the PV of the annual costs associated with operating the facility (c) for the do-minimum by multiplying the annual cost by the discount factor 11.70. Note: Operating costs must be distinct from, and in addition to, maintenance costs.
5. Sum (a) + (b) + (c) to get PV cost of the do-minimum. Transfer the total to A in worksheet 1.
Table 1: Single payment present worth factors for eight percent discount rate
Year SPPWF Year SPPWF
1 0.93 16 0.29
2 0.86 17 0.27
3 0.79 18 0.25
4 0.74 19 0.23
5 0.68 20 0.21
6 0.63 21 0.20
7 0.58 22 0.18
8 0.54 23 0.17
9 0.50 24 0.16
10 0.46 25 0.15
11 0.43 26 0.14
12 0.40 27 0.13
13 0.37 28 0.12
14 0.34 29 0.11
15 0.32 30 0.10

Page SP11–5
The NZ Transport Agency’s Economic evaluation manual (volume 2) First edition, Amendment 0 Effective from January 2010
SP11 Walking and cycling facilities continued
Worksheet 2 – Cost of the do-minimum
1 Historic maintenance cost data (indicate whether assessed or actual)
Maintenance costs for the site over the last three years Year 1 $
Year 2 $
Year 3 $
Maintenance costs for the site this year $
Assessed further maintenance costs $
2 PV of annual maintenance and inspection costs following the work
Annual cost = $ x 11.70 = $ (a)
3 PV of periodic maintenance costs
Periodic maintenance will be required in the following years:
Year Type of maintenance Amount $ SPPWF PV
Sum of PV of periodic maintenance costs $ (b)
4 PV of annual operating costs
Annual cost = $ x 11.70 = $ (c)
5 PV cost of the do-minimum
(a) + (b) + (c) = $ A
Transfer total do-minimum cost A to A in worksheet 1.

Page SP11–6
The NZ Transport Agency’s Economic evaluation manual (volume 2) First edition, Amendment 0 Effective from January 2010
SP11 Walking and cycling facilities continued
Worksheet 3 – Explanation
Worksheet 3 is used for calculating the PV cost of the walking or cycling facility.
1. Enter the capital cost (including professional services for design and supervision) of the proposed option. The cost is estimated separately on an estimate sheet, which should be attached to this worksheet. Multiply the cost by the discount factor 0.93 and enter at (a).
2. Enter the cost of maintenance for year 1 at (b). As this is assumed to be the year that the proposed option facility is constructed.
3. Enter the cost for annual maintenance and inspections following completion of the facility. Multiply by 10.74 to get the PV of annual maintenance costs (c) for years 2 to 30 inclusive.
4. Enter the costs of periodic maintenance. Determine which years this maintenance will be required (if at all) and enter the year, estimate cost and single payment present worth factor (SPPWF) (from table 1 of worksheet 2). Calculate the PV (estimate cost × SPPWF) for each cost and sum these to obtain the PV of the total periodic maintenance cost (d).
5. The annual costs (for years 2 to 30) associated with the improved facility, but not maintaining capital assets, are specified and multiplied by the discount factor 10.74 to get (e).
6. The sum of (a) + (b) + (c) + (d) + (e) gives the PV total cost of option, B. Transfer B for the preferred option to B on worksheet 1.

Page SP11–7
The NZ Transport Agency’s Economic evaluation manual (volume 2) First edition, Amendment 0 Effective from January 2010
SP11 Walking and cycling facilities continued
Worksheet 3 – Cost of the option
1 PV of estimated cost of proposed work (as per attached estimate sheets)
$ x 0.93 = $ (a)
2 PV of maintenance cost in year 1
= $ (b)
3 PV of annual maintenance costs following completion of the work
(years 2 to 30 inclusive) $ x 10.74 = $ (c)
4 PV of periodic maintenance costs
Periodic maintenance will be required in the following years:
Year Type of maintenance Amount $ SPPWF PV
Sum of PV of periodic maintenance = $ (d)
5 PV cost of additional annual maintenance
$ x 10.74 = $ (e)
6 PV total costs of option
PV total costs = (a) + (b) + (c) + (d) + (e) = $ B
Transfer PV total costs for the preferred option to B, to B in worksheet 1.

Page SP11–8
The NZ Transport Agency’s Economic evaluation manual (volume 2) First edition, Amendment 0 Effective from January 2010
SP11 Walking and cycling facilities continued
Worksheet 4 – Explanation
Worksheet 4 is used for calculating pedestrian and cyclist travel time cost savings.
1. Tick the road type.
2. Enter the data required to complete the travel time cost savings calculations. Default values for travel time costs are found in table 1 below. Note: If it is a cycle facility being evaluated, the relative attractiveness (RA) of the option facility compared to the do-minimum must be adjusted for. For example, if the facility moves cyclists from in traffic with road side parking with no cycle lane, to in traffic with road side parking but with a marked cycle lane, enter the relative attractiveness value of 1.8 into the assigned cell. If the RA is greater than one, travel time cost savings for pedestrians must be calculated separately from cyclists with a RA of one used.
3. Calculate the annual travel time costs for the do-minimum (a) using the formula provided.
4. Calculate the annual travel time costs for the option (b) using the formula provided. The travel speed and route length will be the same for both the do-minimum and the activity option if the work does not either shorten the route or increase travel speeds.
5. Calculate the annual travel time cost savings by subtracting the travel time costs for the option (b) from the do-minimum travel time costs (a) to get (c).
6. Determine the PV of the travel time cost savings, C by multiplying (c) by the appropriate discount factor from table 3. Transfer the PV of travel time cost savings C, for the preferred option to worksheet 1.
Table 1: Travel time cost for standard traffic mixes for all periods combined ($/hr - 2008)
Road type Description Travel time cost
Urban arterial Arterial and collector roads within urban areas carrying traffic volumes greater than 7000 motorised vehicles/day.
19.36
Urban other Urban roads other than urban arterial. 19.31
Rural strategic Arterial and collector roads connecting main centres of population and carrying traffic of over 2500 motorised vehicles/day.
27.67
Rural other Rural roads other than rural strategic. 27.04
Table 2: Benefit factors for different types of cycle facilities
Type of cycle facility RA
On-street with parking, no marked cycle lane. 1.0
On-street with parking, marked cycle lane. 1.8
On-street without parking, marked cycle lane. 1.9
Off-street cycle path. 2.0

Page SP11–9
The NZ Transport Agency’s Economic evaluation manual (volume 2) First edition, Amendment 0 Effective from January 2010
SP11 Walking and cycling facilities continued
Worksheet 4 – Travel time cost savings
1 Road type (tick option being considered)
urban arterial urban other rural strategic rural other
2 Travel time data
Walkers and/or cyclists average annual daily traffic current (AADT) (or volumes affected by the improvement)
Travel time cost (TTC) $
Do-minimum Option
Length of route (km) Ldm Lopt
Mean mode speed VSdm VSopt
Relative attractiveness
3 Annual TTC for the do-minimum
AADT x 365 x Ldm x TTC
VSdm = $ (a)
4 Annual TTC for the option
AADT x 365 x Lopt x TTC
VSopt x RA = $ (b)
5 Value of annual TTC savings
(a) – (b) = $ (c)
6 PV of TTC savings
(c) x DFTTC = $ C
Transfer PV of TTC savings, C for the preferred option to C on worksheet 1.
Table 3: Travel time cost discount factors (DFTTC) for different traffic growth rates for years 2 to 30 inclusive
Traffic growth rate 0% 0.5% 1.0% 1.5% 2.0% 2.5% 3.0% 3.5% 4.0%
Travel time cost discount factors (DFTTC) 10.74 11.30 11.87 12.43 13.00 13.50 14.13 14.69 15.25

Page SP11–10
The NZ Transport Agency’s Economic evaluation manual (volume 2) First edition, Amendment 0 Effective from January 2010
SP11 Walking and cycling facilities continued
Worksheet 5 – Explanation
Worksheet 5 is used to calculate the walking and cycling facility benefits for the various options. Only one category for walking and one category for cycling may be used in an evaluation of a proposal. If an activity contains more categories, they must be submitted as separate evaluations.
Activities that combine walking and cycling may claim benefits for both modes but safety issues arising from pedestrian/cycle conflicts must be addressed, and if there are additional accident costs these must be accounted for in worksheet 6. Make sure the estimates of the new number of pedestrians and/or cyclists generated by the facility are realistic.
1. Use the appropriate benefit calculation.
2. Fill in the appropriate information into the blank fields then calculate the PV of the category by multiplying along the line. The basis of the composite health, safety and environmental benefits used in worksheet 4 is described in chapter 8.
3. Transfer the total(s) (a), (b), (c) or (d) to D on worksheet 1, and (e) or (f) to E on worksheet 1 in the absence of a specific accident analysis.
Required information:
L Length of new facility in kilometres
NPD Number of additional pedestrians per day
NTD Number of additional cycle trips per day
NSD Number of additional and existing cycle trips per day
DF Discount factor (from table 1). The discount factor will be different between walking and cycling categories depending on their individual growth rate
Table 1: Discount factors (DF) for different growth rates for years 2 to 30 inclusive
Growth rate 0% 0.5% 1.0% 1.5% 2.0% 2.5% 3.0% 3.5% 4.0%
DF 10.74 11.30 11.87 12.43 13.00 13.50 14.13 14.69 15.25

Page SP11–11
The NZ Transport Agency’s Economic evaluation manual (volume 2) First edition, Amendment 0 Effective from January 2010
SP11 Walking and cycling facilities continued
Worksheet 5 – Benefits for walking and cycling facilities
Health and environmental benefits for walking facility
1 Health and environment benefits for footpaths and other pedestrian facilities
Benefit = number of additional pedestrians/day × length of new facility in km × 365 × $2.70
L x NPD X 365 x $2.70 x DF = $ (a)
2 Health and environment benefits from improvements at hazardous sites
(provision of overbridges, underpasses, bridge widening or intersection improvements for pedestrians)
Benefit = number of additional pedestrians/day × 365 × $2.70
NPD X 365 x $2.70 x DF = $ (b)
Transfer total (a) or (b) to D on worksheet 1.
Health and environmental benefits for cycling facility
3 Health and environment benefits for cycle lanes, cycleways or increased road shoulder widths
Benefit = number of additional cycle trips/day × length of new facility in km × 365 × $1.40
L x NTD X 365 x $1.40 x DF = $ (c)
4 Health and environment benefits from improvements at hazardous sites
(provision of overbridges, underpasses, bridge widening or intersection improvements for cyclists)
Benefit = number of additional cycle trips/day × 365 × $4.20
NTD X 365 x $4.20 x DF = $ (d)
Transfer total (c) or (d) to D on worksheet 1.
Safety benefits for cycling facility
5 Safety benefit for cycle lanes, cycleways or increased road shoulder widths in the absence of a specific accident analysis
Benefit = number of new and existing cycle trips/day × length of new facility in km × 365 × $0.05
L x NSD X 365 x $0.05 x DF = $ (e)
6 Safety benefit from improvements at hazardous sites in the absence of a specific accident analysis
(provision of overbridges, underpasses, bridge widening or intersection improvements for cyclists)
Benefit = number of new and existing cycle trips/day × 365 × $0.15
NSD X 365 x $0.15 x DF = $ (f)
Transfer total (e) or (f) to E on worksheet 1.

Page SP11–12
The NZ Transport Agency’s Economic evaluation manual (volume 2) First edition, Amendment 0 Effective from January 2010
SP11 Walking and cycling facilities continued
Worksheet 6 – Explanation
These simplified procedures are suitable only for accident by accident analysis (method A in appendix A6). There must be five years or of more accident data for the site and the number and types of accidents must meet the specifications set out in appendix A6.1 and A6.2. If not, either the accident rate analysis or weighted accident procedure described in appendix A6.2 should be used. The annual accident cost savings determined from such an evaluation are multiplied by the appropriate discount factor and entered in worksheet 1 as total E.
1. Enter number of years of typical accident rate records at (3) and the number of reported accidents in the reporting period for each of the severity categories at (4).
2. Redistribution of fatal and serious accident costs. If the number of fatal and serious accidents at the site is greater than the limiting number specified in appendix A6.4, leave line (5) blank and go to line (6). Otherwise, in line (5) enter the ratio of fatal/(fatal + serious) and serious/(fatal + serious) from the table A6.19 series (all movements, all vehicles).
3. Multiply the total fatal + serious accidents (4) by the ratios (5) to get the adjusted fatal and serious accidents (6) for the reporting period. For minor and non-injury accidents, transfer the accident numbers from (4). To get the accidents per year (7), divide (6) by (3).
4. Enter the adjustment factor for the accident trend from table A6.1(a) in line (8). Multiply (7) by (8) to obtain the accidents per year (at time zero) for each accident category (9).
5. Enter the under–reporting factors from tables A6.20(a) and A6.20(b) in line (10). Multiply (9) by (10) to get the total estimated accidents per year (11).
6. Enter the accident costs for 100km/h speed limit (12) and 50km/h speed limit (13) for each accident category (all movements, all vehicles) from the table A6.21 series. Calculate the mean speed adjustment for the do-minimum [((1) – 50) divided by 50] in (14).
7. Calculate the cost per accident for the do-minimum (15) by adding (13) plus (14) and then multiplying this by the difference between accident costs in (12) and (13).
8. Multiply accidents per year (11) by (15) to get cost per accident per year (16). Add the costs for fatal, serious, minor and non-injury accidents in line (16) to get the total accident cost per year (17).
9. Determine the forecast percentage accident reduction for each accident category (18). Determine the proportion of accidents remaining [100% minus the percentage reduction in (18)] and record in (19).
10. Calculate the predicted accidents per year (20) by multiplying the accidents per year of the do-minimum (11) by the percentage of accidents remaining (19).
11. Repeat the calculations from lines (12) through (15), in lines (21) through (24) using the option mean speed (2), to obtain the cost per accident for the option (24).
12. Multiply the predicted number of accidents per year (20) by the cost per accident (24) to get the total accident costs per year for each accident category in line (25). Add together the costs for fatal, serious, minor and non–injury accidents to get total accident costs per year (26).
13. Calculate the annual accident cost savings by subtracting the values in (26) from (17). Multiply the annual accident cost savings (27) – or the total from the accident rate or weighted accident analysis – by the discount factor in table 1 for the appropriate speed limit and traffic growth rate to determine the PV accident cost savings. Transfer this total, E for the preferred option to worksheet 1.
Table 1: Accident cost discount factor (DFAC) for different traffic growth rates and speed limits for years 2 to 30 inclusive
Traffic growth rate 0% 0.5% 1.0% 1.5% 2.0% 2.5% 3.0% 3.5% 4.0%
50 and 60km/h 8.45 8.83 9.21 9.59 9.97 10.35 10.73 11.11 11.49
≥ 70km/h 9.96 10.34 10.72 11.10 11.48 11.86 12.24 12.62 13.00

Page SP11–13
The NZ Transport Agency’s Economic evaluation manual (volume 2) First edition, Amendment 0 Effective from January 2010
SP11 Walking and cycling facilities continued
Worksheet 6 – Accident cost savings
Movement category Vehicle involvement
1 Do-minimum mean speed Road category
Posted speed limit Traffic growth rate
2 Option mean speed
Severity
Do-minimum
Fatal Serious Minor Non-injury
3 Number of years of typical accident rate records
4 Number of reported accidents over period
5 Fatal/serious severity ratio (tables A6.19(a) to (c)) 1 1
6 Number of reported accidents adjusted by severity (4) (5)
7 Accidents per year = (6)/(3)
8 Adjustment factor for accident trend (table A6.1(a))
9 Adjusted accidents per year = (7) x (8)
10 Under–reporting factors (tables A6.20(a) and (b))
11 Total estimated accidents per year = (9) x (10)
12 Accident cost, 100km/h limit (tables A6.21(e) to (h))
13 Accident cost, 50km/h limit (tables A6.21(a) to (d))
14 Mean speed adjustment = ((1) – 50)/50
15 Cost per accident = (13) + (14) x [ (12) – (13) ]
16 Accident cost per year = (11) x (15)
17 Total cost of accidents per year (sum of columns in row (16) fatal + serious + minor + non–injury)
$
Option
18 Percentage accident reduction
19 Percentage of accidents ‘remaining’ [ 100 – (18) ]
20 Predicted accidents per year (11) x (19)
21 Accident cost, 100km/h speed limit (tables A6.21(e) to (h))
22 Accident cost, 50km/h speed limit (tables A6.21(a) to (d))
23 Mean speed adjustment = ((2) – 50)/50
24 Cost per accident = (22) + (23) x [ (21) – (22) ]
25 Accident cost per year = (20) x (24)
26 Total cost of accidents per year (sum of columns in row (25) fatal + serious + minor + non-injury)
$
27 Annual accident cost savings = (17) – (26) $
28 PV accident cost savings = (27) x DFAC $ E
Transfer PV of accident cost savings, E for the preferred option to E on worksheet 1.

Page SP11–14
The NZ Transport Agency’s Economic evaluation manual (volume 2) First edition, Amendment 0 Effective from January 2010
SP11 Walking and cycling facilities continued
Worksheet 7 – Explanation
This worksheet is used to calculate cycle demand for a new cycle facility. The new commuters section of the worksheet calculates the total new daily cyclist commuters. The new other section calculates the total daily new other cyclists. Finally the overall new cyclists is devised.
1. Calculate the area within each buffer distance that is connected to the route. The buffer distances are defined at 0.4, 0.8 and 1.6 kilometres. The buffer represents the distance to the cycling facility.
2. Enter the population density per square kilometre for each of the buffer zones.
3. The population per buffer is calculated by multiplying the area of each buffer (1) by the density per square kilometre (2).
4. Calculate the total population, for all buffers by calculating the sum of row (3)
5. Enter the cycle commute mode share. This value is the same for all buffers. Cyclist commute mode share values can be found in section 8.16.
6. Row (6) contains the likelihood of a new cyclist multiplier for each buffer. This adjusts for the higher likelihood for the populations living closer to the facility, to use the facility.
7. Multiply the population of residents per buffer (3) by the likelihood multiplier (6).
8. Calculate the sum of row (7).
9. Calculate the cyclist rate by multiplying the cyclist commute share (5) by 0.96, then add on 0.32%.
10. Calculate the total number of existing daily cyclists by multiplying the sum in row (4) by the cyclist rate (9).
11. Calculate the total number of new daily cyclists by multiplying the sum in row (8) by the cyclist rate (9).

Page SP11–15
The NZ Transport Agency’s Economic evaluation manual (volume 2) First edition, Amendment 0 Effective from January 2010
SP11 Walking and cycling facilities continued
Worksheet 7 – Cycle demand
New and existing cyclists
Buffers (km) <0.4 0.4 to <0.8 0.8 to ≤1.6
1 Area (km2)
2 Density per square kilometre
3 Population in each buffer (3) = (1) × (2)
4 Total population in all buffers (Sum of (3))
5 Commute share (single value for all) %
6 Likelihood of new cyclist multiplier 1.04 0.54 0.21
7 Row (7) = (3) x (6)
8 Sum of row (7)
9 Cyclist rate (9) = ((5) x 0.96) + 0.32% %
10 Total existing daily cyclists (10) = (4) × (9)
11 Total new daily cyclists (11) = (8) x (9)

Page SP11–16
The NZ Transport Agency’s Economic evaluation manual (volume 2) First edition, Amendment 0 Effective from January 2010
SP11 Walking and cycling facilities continued
Worksheet 8 – Explanation
Benefit cost analysis
1. Under benefits, enter the PVs for the benefits for the do-minimum and for each option. Then subtract the benefits for the do-minimum from the benefits for the options to get the net benefits of each option.
2. Under costs, enter the PVs of the capital and maintenance costs for the do-minimum and each option. Subtract the PV costs for the do-minimum from the costs for the options to get the net costs of each option.
3. Calculate the BCR for each option by dividing the net benefits by the net costs of each option.
Incremental analysis
1. Select the appropriate target incremental BCR from appendix A12.4.
2. Rank the options in order of increasing cost.
3. Compare the lowest cost option with the next higher cost option to calculate the incremental BCR.
4. If the incremental BCR is less than the target incremental BCR specified in appendix A12 of the NZ Transport Agency’s Economic evaluation manual volume 1 (EEM1), discard the second option in favour of the first and compare the first option with the next higher cost option.
5. If the incremental BCR is greater than the target incremental BCR, the second option becomes the basis for comparison against the next higher cost option.
6. Repeat the procedure until no higher cost options are available that have an incremental BCR greater than the target incremental BCR. The highest cost option with an incremental BCR greater than the target incremental BCR is generally considered as the preferred option
7. Undertake a sensitivity test using a target incremental BCR that is 1.0 greater than the ratio used in steps 2 to 5 above. Report the results of this sensitivity test in the report

Page SP11–17
The NZ Transport Agency’s Economic evaluation manual (volume 2) First edition, Amendment 0 Effective from January 2010
SP11 Walking and cycling facilities continued
Worksheet 8 – BCR and incremental analysis
Time zero
Base date
Do-minimum
Option A Option B Option C Option A Option B Option C BCRN
PV of benefits as calculated PV of net benefits
PV travel time cost savings
PV accident cost savings
PV health and environmental benefits
PV total net benefits
PV of costs as calculated PV of net costs
PV capital costs
PV maintenance costs
PV total net costs
BCRN
Target incremental BCR (from appendix A12.4 of EEM1)
Base option for comparison Next higher option Incremental analysis
Option Total costs
(1)
Total benefits
(2)
Option Total costs
(3)
Total benefits
(4)
Incremental costs
(5) = (3) – (1)
Incremental benefits
(6) = (4) – (2)
Incremental BCRN
(7) = (6) / (5)


Page SP12–1
The NZ Transport Agency’s Economic evaluation manual (volume 2) First edition, Amendment 0 Effective from January 2010
SP12 Travel behaviour change
This procedure provides a method of evaluating the economic efficiency of travel behaviour change (TBhC) activities. TBhC activities generally employ education, information and marketing based approaches to achieve voluntary changes in the travel behaviour of individuals.
This procedure may be used to evaluate the following types of TBhC proposal:
community-based, eg travel awareness campaigns, rideshare household-based, eg personalised marketing, ‘living neighbourhoods’ school travel (school travel plans) workplace based (workplace travel plans) substitutes for travel, eg teleworking.
The procedure does not cover the following types of activity even though they may be included within the definition of TBhC in some countries:
Demand management for special events. This is considered to be the responsibility of the sponsoring organisation and local authorities.
Mobility management centres (European model) are a ‘one stop shop’ designed to promote and inform the public about environmentally friendly and safe transport options, selling passenger transport tickets and renting cycles and for individuals seeking advice on their travel options, such as passenger transport, carpooling, car sharing clubs. Essentially, such a centre is a means for delivering components of TBhC programmes rather than a TBhC programme in itself.
Freight management, logistics or any other possible action to change the travel behaviour of commercial vehicle operators or fleets.
The Land Transport New Zealand/Energy Efficiency and Conservation Authority Travel behaviour change guidance handbook (2004) provides further information on development, evaluation and monitoring of TBhC activities.
A composite evaluation is required for a package of measures involving TBhC activities if the cost of supporting infrastructure components (such as walk/cycle paths or minor road improvements) or passenger transport components are over one million dollars and is optional if under one million. This supersedes the advice given in the Travel behaviour change guidance handbook.
This simplified procedure assumes that:
1. an eight percent discount rate and 10-year analysis period are used 2. activities adopted will be completed in the first year and will be in service
by the end of year 1 3. all costs are exclusive of goods and services tax (GST).
In cases where the above assumptions are not appropriate, either the simplified procedure should be modified or full procedures used.
Worksheet Description
1 Evaluation summary
2 Cost of the option(s)
3 Benefits
4 BCR per head
Introduction
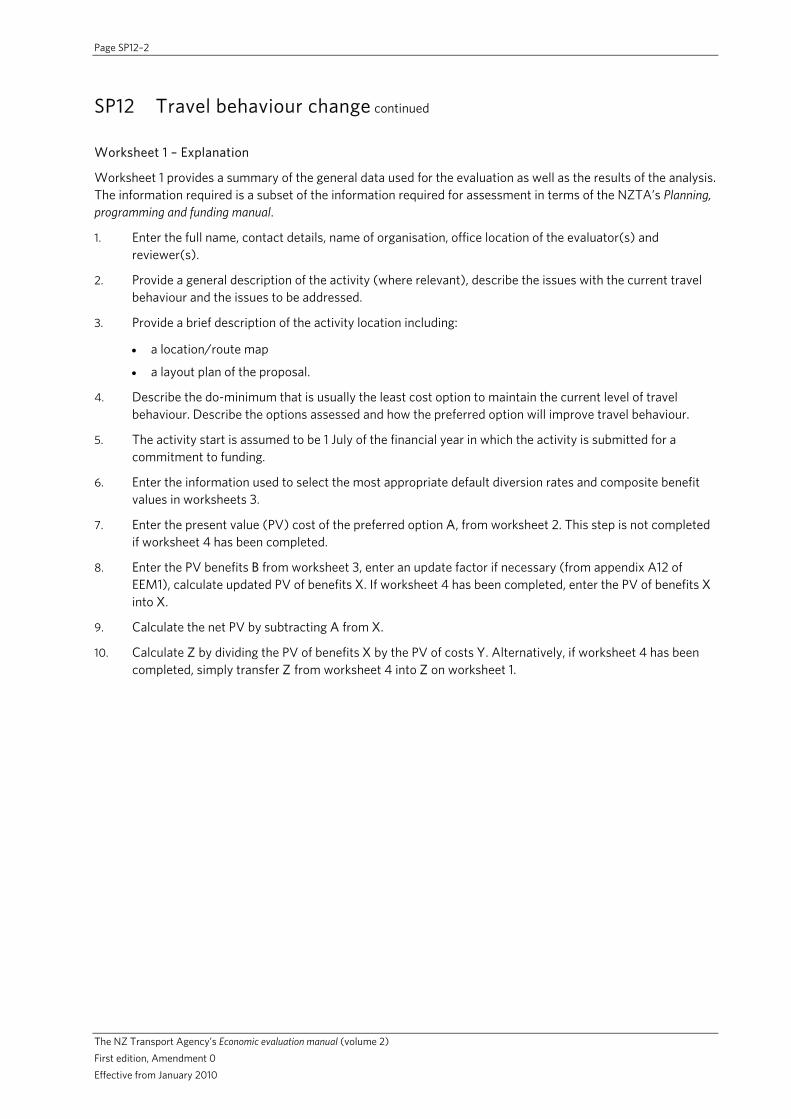
Page SP12–2
The NZ Transport Agency’s Economic evaluation manual (volume 2) First edition, Amendment 0 Effective from January 2010
SP12 Travel behaviour change continued
Worksheet 1 – Explanation
Worksheet 1 provides a summary of the general data used for the evaluation as well as the results of the analysis. The information required is a subset of the information required for assessment in terms of the NZTA’s Planning, programming and funding manual.
1. Enter the full name, contact details, name of organisation, office location of the evaluator(s) and reviewer(s).
2. Provide a general description of the activity (where relevant), describe the issues with the current travel behaviour and the issues to be addressed.
3. Provide a brief description of the activity location including:
a location/route map
a layout plan of the proposal.
4. Describe the do-minimum that is usually the least cost option to maintain the current level of travel behaviour. Describe the options assessed and how the preferred option will improve travel behaviour.
5. The activity start is assumed to be 1 July of the financial year in which the activity is submitted for a commitment to funding.
6. Enter the information used to select the most appropriate default diversion rates and composite benefit values in worksheets 3.
7. Enter the present value (PV) cost of the preferred option A, from worksheet 2. This step is not completed if worksheet 4 has been completed.
8. Enter the PV benefits B from worksheet 3, enter an update factor if necessary (from appendix A12 of EEM1), calculate updated PV of benefits X. If worksheet 4 has been completed, enter the PV of benefits X into X.
9. Calculate the net PV by subtracting A from X.
10. Calculate Z by dividing the PV of benefits X by the PV of costs Y. Alternatively, if worksheet 4 has been completed, simply transfer Z from worksheet 4 into Z on worksheet 1.

Page SP12–3
The NZ Transport Agency’s Economic evaluation manual (volume 2) First edition, Amendment 0 Effective from January 2010
SP12 Travel behaviour change continued
Worksheet 1 – Evaluation summary
1 Evaluator(s)
Reviewer(s)
2 Activity details
Approved organisation name
Activity name
Your reference
Activity description
Describe the issues to be addressed
3 Location Brief description of location
4 Alternatives and options Describe the do-minimum
Summarise the options assessed
5 Timing
Time zero (assumed construction start date) 1 July
Implementation period
6 Economic efficiency Type of TBhC activity (workplace, school or community)
Type of TBhC evaluation (standard or composite)
Geographical location (Auckland, Wellington, Christchurch or other)
CBD or non-CBD location (workplace CBD or non-CBD)
Activity benefits (workplace low, medium or high) (school primary or secondary/intermediate) (community low or standard)
Passenger transport service improvements (workplace yes or no)
School type (primary, intermediate or secondary)
Target population (worksheet 3)
Composite benefit value (worksheet 3)
7 PV cost of the preferred option $ A
8 PV of benefits
$ B x update factor TBhC = $ X
9 Net PV
(X – A) = $ Y
PV net benefits X 10 BCRN =
PV economic costs =
A =
Z

Page SP12–4
The NZ Transport Agency’s Economic evaluation manual (volume 2) First edition, Amendment 0 Effective from January 2010
SP12 Travel behaviour change continued
Worksheet 2 – Explanation
Worksheet 2 is used for calculating the PV cost of a TBhC proposal.
1. Calculate the PV of cost of activities (d) by multiplying the sum of the estimated cost of development (investigation/design) (a), the cost for implementation of the travel plan (b) and the cost of supporting infrastructure or passenger transport service improvements (c) by 0.93. If costs are incurred outside the first year, apply single payment present worth factor (SPPWF) to the annual budgets on a separate sheet. When conducting initial indicative evaluations for activity development funding for workplace and school travel plans, obtain a cost estimate from past experience or judgement. The implementation cost estimate will be refined and the evaluation reconfirmed based on the completed plan before implementation funding is approved. Consider whether a composite evaluation may be required.
2. Calculate the PV of the cost of annual maintenance (e) required to maintain the benefits of the TBhC activity over the remainder of the analysis period following implementation, by multiplying the annual cost by 6.01. This should be based on local experience and knowledge. If the maintenance cost of the activity differs between years, provide annual information on a separate sheet. For household/ community-based activities this is generally zero unless the activity contains specific plans for follow-up measures. For workplace and school travel plans it is likely that some ongoing maintenance expenditure will be required to maintain benefits over the 10-year evaluation period.
3. Enter the costs of periodic maintenance. Determine which years this maintenance will be required (if at all) and enter the year, estimate cost and SPPWF (table 1). Calculate the PV (estimate cost × SPPWF) for each cost and sum these to obtain the PV of the total periodic maintenance cost (f).
4. Sum (d) + (e) + (f) to get total PV of the option A, and transfer to A in worksheet 1.
5. Enter the costs of monitoring. Determine which years monitoring will be required (if at all) and enter the year, estimate cost and SPPWF (table 1). Calculate the PV (estimate cost × SPPWF) for each cost and sum these to obtain the PV of monitoring costs.
Table 1: Single payment present worth factors – for eight percent discount rate
Year 1 2 3 4 5 6 7 8 9 10
SPPWF 0.93 0.86 0.79 0.74 0.68 0.63 0.58 0.54 0.50 0.46

Page SP12–5
The NZ Transport Agency’s Economic evaluation manual (volume 2) First edition, Amendment 0 Effective from January 2010
SP12 Travel behaviour change continued
Worksheet 2 – Cost of the option(s)
1 Cost of activities, provide details if required
Investigation and design $ (a)
Implementation of travel plan $ (b)
Supporting infrastructure or passenger transport service improvements $ (c)
PV cost of activities [(a) + (b) + (c)] x 0.93 = = $ (d)
2 PV cost of annual maintenance following implementation(end of year 1 to end of year 10)
Annual cost $ x 6.01 = $ (e)
3 Periodic maintenance costs
Periodic maintenance will be required in the following years:
Year Type of maintenance Amount $ SPPWF PV
Sum of PV of periodic maintenance = $ (f)
4 PV of the option
(d) + (e) + (f) = $ A
Transfer the PV of the option A to A in worksheet 1.
5 Monitoring costs
Costs of monitoring travel behaviour before and after implementation of the travel plan
Year Type of maintenance Amount $ SPPWF PV
PV monitoring costs = $

Page SP12–6
The NZ Transport Agency’s Economic evaluation manual (volume 2) First edition, Amendment 0 Effective from January 2010
SP12 Travel behaviour change continued
Worksheet 3 – Explanation
Worksheet 3 is used for calculating the PV of benefits for the TBhC proposal.
There are several default diversion rate profiles for workplace travel plans. The appropriate profile is identified by determining a score for the activity based on the anticipated or proposed measures to be included in the workplace travel plan.
Determine the level of diversion
For the workplace travel plan, answer the questions and apply your score to the levels of diversion in the table below it.
For school travel plan, determine whether your school has primary or intermediate/secondary students.
For households/community-based programmes, the standard diversion rate value is applicable for most cases. The low diversion rate is applicable in situations where:
the activity will implement fewer measures than ‘usual’ household based programmes, eg a community travel awareness campaign on its own would not achieve the standard diversion rate
passenger transport services and cycling/walking facilities in the area are poor and no significant changes to these are envisaged as part of the TBhC proposal.
Select composite benefit value
Select and circle the composite benefit value that is applicable to the proposed TBhC activity from the appropriate table. Composite benefit values are the average annual benefit for all people in the workforce, school or community targeted by the TBhC activity (and take account of the proportion that do not participate or change their travel behaviour).
Determine target population
The target population is the total population of the workplace, school or community in which the TBhC activity is being implemented. It includes the people who do not participate in the activity and those who participate but do not change their behaviour.
Calculate the PV of benefits:
1. Multiply the composite benefit by the target population to determine the annual benefit. Note: The composite benefit value is the benefit per annum per person in target population from the appropriate workplace, school or community travel plan benefit tables below.
2. Multiply the annual benefit by the discount factor for the period from the end of year 1 to the end of year 10 to calculate the PV of benefits over the analysis period B. The discount factor adjusts for activities taking three years to implement. Transfer the PV of activity benefits B to B in worksheet 1.
Type of TBhC proposal Definition of target population
Workplace The total workforce (number of employees) at the workplace covered by the travel plan. Make appropriate adjustment if a significant proportion of employees work more or less than the standard five days per week.
School The total school roll. If this is expected to vary significantly in the next few years use an appropriate average.
Household and community The total population of the community/suburb/area in which the household or community-based activity is being implemented.

Page SP12–7
The NZ Transport Agency’s Economic evaluation manual (volume 2) First edition, Amendment 0 Effective from January 2010
SP12 Travel behaviour change continued
Worksheet 3 – Benefits
Workplace travel plans
Questions Yes No
Is car parking availability constrained at the workplace? 1 0
Does the proposed workplace travel plan include:
One or more parking management strategies*? 1 0
Improvements to cycling/walking facilities? 1 0
Ridesharing matching service? 1 0
Passenger transport service improvements or company transport? 1 0
Passenger transport subsidies? 1 0
Total score (sum of ‘yes’ column): 0
Workplace travel plan benefit ($/employee/year – 2008)
Workplace CBD Non-CBD Location
Diversion (score)
Low (1 or 2)
Medium (3 or 4)
High (5 or 6)
Low (1 or 2)
Medium (3 or 4)
High (5 or 6)
Standard 188.51 - 165.51 - Auckland
Alternative 214.47 616.23 191.47 556.89
Standard 170.88 - 147.88 - Wellington
Alternative 191.97 554.77 168.97 495.43
Standard 61.97 - 61.97 -
Christchurch/Other Alternative
0
58.21 196.51
0
58.21 196.51
Standard = without passenger transport improvements or subsidies.
Alternative = with passenger/company transport improvements or subsidies.
School travel plans benefits ($/student on school roll/year – 2008)
Location Primary Secondary/intermediate
Auckland 85.35 141.74
Wellington 82.7 121.17
Christchurch/other 74.83 77.97
Household/community-based activity benefit ($/head of target population/year – 2008)
Standard should be used in most circumstances. Use the low diversion rate if the TBhC activity is to implement fewer measures than ‘usual’ household based activities or where existing passenger transport services and/or cycle/walk facilities are poor.
Location Standard Low
Auckland 139.11 42.57
Wellington 158.72 49.25
Christchurch/other 192.45 39.19
TBhC benefits
1 Benefits per annum = x = $ (a) composite benefit value target population
2 PV of activity benefits = (a) x 5.40 = $ B
Transfer the PV of activity benefits B to B in worksheet 1

Page SP12–8
The NZ Transport Agency’s Economic evaluation manual (volume 2) First edition, Amendment 0 Effective from January 2010
SP12 Travel behaviour change continued
Worksheet 4 – Explanation
This worksheet is designed to provide a very simple solution to calculating the benefit cost ratio (BCR). It does however require the evaluator to know the cost per head. This worksheet removes the requirement to complete worksheets 2 and 3 and the BCR component of worksheet 1.
1. Calculate the benefit value applicable to your activity in worksheet 3 by choosing the correct benefit value based on location, type of activity (workplace, school, community) and diversion. Do not complete the worksheet by multiplying the benefit value by the population. This unaltered benefit value is the benefit per head. Enter this value into (a).
2. Determine the PV of the benefit per head (b) by multiplying the benefit per head (a) by 5.40.
3. Update the PV of the benefits per head X by multiplying the PV of benefits per head (b) by the appropriate update factor from appendix A12.3 in the NZTA’s Economic evaluation manual volume 1 (EEM1).
4. Enter the estimated cost per head per annum (c). Costs may include capital, operating and monitoring costs.
5. Calculate the PV of costs A by multiplying the estimated cost per head per annum (c) by 6.01. If all the cost is expected to be incurred in the current financial year, discounting to the PV isn’t necessary.
6. Calculate the BCR Z by dividing the PV of benefits per head X by PV of costs per head A. Transfer X, A and Z to X, A and Z on worksheet 1.
Worksheet 4 – BCR per head
BCR per head
1 Benefit value per head (a)
2 PV of benefits per head (a) x 5.40 = (b)
3 Updated benefits value per head (b) x update factorTBhC = $ X
4 Estimated cost per head per annum $ (c)
5 PV of costs per head (c) x 6.01 = $ A
6 BCR X/A = $ Z
Transfer X, A and Z to X, A and Z on worksheet 1.

Page A15 – 1
The NZ Transport Agency’s Economic evaluation manual (volume 2) First edition, Amendment 0 Effective from January 2010
A15 Travel demand elasticities
A15.1 Introduction
A15.1 Introduction A15–1
A15.2 References A15–3
In this chapter Section Page
Introduction This appendix provides a sample of travel demand elasticises gathered from international literature reviews.
The demand elasticity values provided are intended to provide a guide to the elasticities for use in the demand estimates.
The elasticities in the table below apply to road/rail modal choice.
Table A15.1: Elasticities for freight commodities
Commodity Range
Food and kindred products -1.04 to –2.58
Lumber and wood products -0.05 to –1.97
Paper products -0.17 to –1.85
Machinery -0.16 to –2.27
Price elasticity estimates for rail freight commodities
Elasticity depends on the level of inter-modal competition. The values in the table above are indicative only and represent the percentage change in rail volume with respect to the percentage change in rail to road price.
Transit time (generally used as a proxy for distance) appears to be a significant determinant of mode choice. The greater the distance, the less likely truck transport will be chosen.
In New Zealand, where inter-modal competition is likely to be significant, it is considered that freight price elasticities would more likely be at the higher end of the ranges identified above. However, it should be noted that other factors may influence a shipper’s decision.
Fares elasticity for passenger transport
The recommended elasticity for ‘real’ fare changes is -0.2 to –0.3 for peak periods in the short term, with a range up to –0.6 in the long term.
It is suggested that, in the absence if any local data, a standard fares elasticity of -0.25 is applied to assess the shorter term effect of fare changes on patronage and revenue in peak periods. Other factors mitigating the use of this elasticity value should be noted.

Page A15 – 2
The NZ Transport Agency’s Economic evaluation manual (volume 2) First edition, Amendment 0 Effective from January 2010
A15.1 Introduction continued
Service elasticity for passenger transport
The recommended ‘standard’ elasticity for service changes (generally measured by passenger transport vehicle kilometres) is 0.25 for peak periods in the short term (0.5 for off-peak periods). However this varies with initial levels of service (service frequency): it is lower for high frequency services, and vice versa. Long term values are about twice these short-term values.
Passenger transport cross-modal effects
A New Zealand study completed in 2003 suggested the following effects on public transport patronage in response to changes in private vehicle travel costs (eg through changes in fuel prices):
Peak: 0.4 extra person public transport trips for each private vehicle trip suppressed.
Off-peak: 0.2 extra public passenger transport trips for each private vehicle tripsuppressed.
Elasticities summaries
Summaries of fare elasticities and cross-elasticities drawn from New Zealand and international literature surveys may be obtained on request from the NZ Transport Agency.

Page A15 – 3
The NZ Transport Agency’s Economic evaluation manual (volume 2) First edition, Amendment 0 Effective from January 2010
A15.2 References
1. Wallis I (2003) Review of passenger transport demand elasticities. Transfund New Zealand research report 248.