economic developments in 2015
TRANSCRIPT

AN
NU
AL
REP
OR
T 20
15EC
ON
OM
IC D
EVEL
OPM
ENTS
IN 2
015
9
11 The International Economic Environment
15 Box Article: Recent Slowdown in Global Trade: Cyclical Bane or Structural Shift?
19 The Malaysian Economy
33 Box Article: Assessing Demand-Supply Conditions in the Malaysian Property Market
44 External Sector
60 Infl ation Developments
64 Box Article: Infl ation and the Cost of Living
70 Box Article: The Impact of Exchange Rate Depreciation on Infl ation in Malaysia
ECONOMIC DEVELOPMENTS IN 2015

AN
NU
AL R
EPOR
T 2015EC
ON
OM
IC D
EVELO
PMEN
TS IN 2015
10

AN
NU
AL
REP
OR
T 20
1511
ECONOMIC DEVELOPMENTS IN 2015
THE INTERNATIONAL ECONOMIC ENVIRONMENT
In 2015, the global economic and fi nancial environment was shaped by three major developments. First, global commodity prices fell sharply to post-crisis lows. This had signifi cant repercussions for the growth prospects of both the commodity-exporting and commodity-importing economies, as well as the infl ation outcomes in these economies. Second, international fi nancial markets experienced heightened volatility driven by policy shifts in major economies, speculative activity, heightened risk aversion, and the drastic fall in the prices of oil and other key commodities. Third, global growth moderated. The modest improvements in the advanced economies were insuffi cient to offset the moderation in growth in emerging economies. Emerging economies, nevertheless, remained the key contributor to global growth with a share of 73%. Against a backdrop of diverse uncertainties arising from elevated concerns over growth, infl ation and external spillovers, the policy outlook became more challenging during the year. Policymakers in many economies also faced fi scal constraints, resulting in continued overdependence on monetary policy to support growth. This was particularly the case in some of the advanced economies, where the policy rates have become negative. As a consequence, monetary policy decisions and measures became a huge driving factor in the fi nancial markets.
Global growth moderated amid heightened international fi nancial market volatility
Global growth moderatedThe global economy entered 2015 with expectations for a better recovery in growth, supported partly by optimism over the positive impact of lower oil prices on demand in the oil-importing countries. Of note, the International Monetary Fund (IMF) began the year with a forecast of 3.5% for global
growth and 3.8% for global trade. As the year progressed, however, it became apparent that the global economy continued to underperform. In some large emerging economies, underlying domestic constraints, including high indebtedness, outweighed the benefi ts to domestic demand from low commodity prices. This was compounded by heightened volatility in the fi nancial markets, which dampened consumer, business and investor sentiments. The improvement in major advanced economies remained modest, weighed down by the lingering legacies of the fi nancial crisis, which included the high private sector indebtedness, strained fi scal positions and slack in the labour markets. As a result, the global growth outlook was successively revised downwards throughout the year. In addition, the growth of global trade saw a particularly large downward revision, registering its slowest pace of expansion in the post-crisis period.
In the US, economic activity gained further traction, driven mainly by an improvement in the labour and housing markets. Of significance, the economy produced more than 200,000 new jobs on average each month. The unemployment rate fell to 5%, the lowest rate since 2008. In the housing market, sales, new construction and prices also trended higher. These developments supported the improvement in household balance sheets. The decline in gasoline prices to an average of
IMF's Global Economic Outlook
Chart 1.1
Source: International Monetary Fund (IMF)
Annual change (%)
f Forecast
2011
2012
20132014
Oct-15 WEO
3.0
3.5
4.0
4.5
5.0
5.5
2010 2011 2012 2013 2014 2015f 2016f 2017f 2018f 2019f 2020f
Successive downward revisions

AN
NU
AL R
EPOR
T 2015EC
ON
OM
IC D
EVELO
PMEN
TS IN 2015
12
USD2.42 per gallon (2014: USD3.36 per gallon) also provided additional impetus to consumption. Notwithstanding the weakness in the commodity-related sectors, investment activity was sustained by spending in the services sector which accounts for almost three-quarters of total investment. Given the gradual strengthening of economic fundamentals, the Federal Reserve (Fed) signalled the imminent start of interest rate normalisation throughout the year. Finally in December, the Fed raised its Federal Funds Rate (FFR) for the first time since 2006, temporarily removing some uncertainty from global financial markets.
In PR China, growth remained on a moderating trend in 2015 as the continued rebalancing
of the economy and the implementation of structural reforms resulted in slowing activity in sectors with excess capacity. The economy faced stronger headwinds arising from weak external demand and higher financial market uncertainty, particularly in the second half of the year. Notably, periodic episodes of sharp corrections in the Chinese equity markets, with unexpected spillovers from policy measures and adjustments, combined with heightened concerns over the global growth prospects, triggered a sharp increase in global risk aversion that pushed the CBOE Volatility Index (VIX) to a four-year high in August. Nevertheless, the impact of economic rebalancing efforts and weaker sentiments on PR China’s overall growth were partly offset by the announcement of pro-growth measures during the year, amid sustained consumer spending and a continued expansion of the services sector.
In Europe, growth improved at a modest pace during the year due to unresolved structural constraints. Growth in the UK economy was supported mainly by a steady improvement in private consumption. Nonetheless, while unemployment fell to its lowest level in almost ten years, wage growth remained subdued. On the other hand, investment activity moderated. In particular, the recovery in the housing market slowed following robust growth in the previous two years. The euro area experienced a more pronounced economic recovery in 2015, supported by both domestic demand and exports. Notably, private consumption rose in all the core euro area economies, supported by a gradual improvement in labour market conditions, low oil prices and favourable credit conditions. Nevertheless, the pace of growth remained uneven and some smaller euro area economies experienced negative growth. Furthermore, the region continued to suffer from bouts of heightened volatility arising from unresolved sovereign debt concerns in Greece. In the second quarter of the year, investor concerns were reignited by a disagreement between international creditors and the ruling Greek government over structural reforms, raising the prospect of a Greek debt default. The situation escalated in late June when the Greek government introduced capital controls and announced a referendum over the bailout conditions. Investor sentiments improved subsequently following the announcement of a third bailout programme in mid-July. Nevertheless, most of the volatility experienced during this period was concentrated in the financial markets.
1
World Economy: Key Economic Indicators
Real GDP Growth(Annual change, %)
Infl ation(Annual change, %)
2014 2015e 2014 2015e
World Growth 3.4 3.1 - -
World Trade 3.4 2.6 - -
AdvancedEconomies
United States 2.4 2.4 1.6 0.1
Japan 0.0 0.5 2.8 0.8
Euro area 0.9 1.6 0.4 0.0
United Kingdom 2.9 2.2 1.5 0.0
Emerging Asia1 6.2 5.8 2.5 1.8
Other Advanced
Asian Economies 3.4 2.0 1.6 0.5
Korea 3.3 2.6 1.3 0.7
Chinese Taipei 3.9 0.7 1.2 -0.3
Singapore 3.3 2.0 1.0 -0.5
Hong Kong SAR 2.6 2.4 4.4 3.0
The People's Republic of China 7.3 6.9 2.0 1.4
ASEAN-4 4.5 4.6 4.7 3.6
Malaysia 6.0 5.0 3.2 2.1
Thailand 0.8 2.8 1.9 -0.9
Indonesia 5.0 4.8 6.4 6.4
Philippines 6.1 5.8 4.2 1.4
India2 7.2 7.6 6.6 4.9
1 Emerging Asia refers to Chinese Taipei, Hong Kong SAR, Indonesia, Korea, Malaysia, Philippines, PR China, Singapore and Thailand
2 For India, GDP data is presented on a fi scal year basise Estimate
Source: International Monetary Fund, National Authorities and Bank Negara Malaysia estimates
Table 1.1

AN
NU
AL
REP
OR
T 20
15EC
ON
OM
IC D
EVEL
OPM
ENTS
IN 2
015
13
In contrast, the Japanese economy registered only a modest rebound in 2015, following stagnation in growth the preceding year. Despite the continued implementation of monetary easing measures, both private consumption and investment activity remained subdued. Export growth was also weighed down by slower demand from Asian economies, amid moderating economic activity in the region.
Economic activity in the emerging economies moderated for the fifth consecutive year, reflecting both external and domestic headwinds. The slowdown in global trade amid weakening external demand and sentiments affected the emerging economies, especially those with high trade openness. This was compounded by stronger headwinds arising from the increased volatility of capital flows and the consequent pressure of local currencies against the US dollar. For the commodity exporters, the significant decline in global commodity prices resulted in a deterioration of the trade and fiscal positions of these economies. Country-specific developments, including political uncertainty in several economies in Latin America and the escalation of conflicts in the Middle East and Russia weighed on growth in these economies. For several large emerging economies, growth was affected by structural reforms, including energy, tax and price reforms, intended to improve fiscal positions and enhance economic competitiveness.
Amid the highly challenging external environment, growth in the rest of Asia also moderated during the year. While domestic demand remained the key driver of growth in the region, weak export performance weighed on the pace of economic expansion. To address the slowing growth momentum, policymakers in several economies in the region lowered policy rates and introduced fiscal stimulus measures, which provided some support to economic activity.
More subdued global inflationGlobal inflationary pressures moderated in 2015, reflecting the lower global commodity prices and subdued global demand conditions.
Crude oil prices declined sharply to an average of USD541 per barrel in 2015 (2014: USD99 per barrel). Higher production by major oil-producing economies and shale oil producers in the US, amid moderating global demand, contributed
to persistent oversupply concerns in the global markets. These concerns intensified further in the second half of the year following the successful conclusion of the Iranian nuclear deal, the commitment of the Organisation of the Petroleum Exporting Countries (OPEC) to not cut the existing production levels, and the worsening sentiments over global growth prospects of several large emerging economies. Consequently, crude oil prices fell to a twelve-year low of USD36 per barrel towards the end of the year.
Prices of non-oil commodities also moderated during the year. In particular, the prices of base metals, such as iron ore, copper and zinc, declined significantly, weighed down mainly by slowing demand from PR China and an increase in supply from new mines. In addition, food prices also moderated as favourable weather conditions supported the production of several agricultural products, including sugar, coffee and soybeans in Latin and North America. The decline in food prices was exacerbated by rising inventory due to softer global demand.
In the advanced economies, inflationary pressures weakened in 2015, weighed down mainly by lower energy prices. Of significance, several major economies experienced episodes of near-zero or negative headline inflation during the year. Core inflation rates, which exclude food and energy prices, remained relatively subdued, amid moderate demand and wage growth. Similarly, inflation in most Asian economies also weakened alongside the decline in commodity prices and moderating economic growth. However, headline inflation rose in Indonesia, reflecting mainly an increase in fuel pump prices, following the implementation of measures to rationalise fuel subsidies.
1 Based on global Brent crude oil 1-month futures price.
Chart 1.2
Indices of Primary Commodity PricesIndex (Jan '05 = 100)
0
50
100
150
200
250
Jul-13 Jan-14 Jul-14 Jan-15 Jul-15 Jan-16
Food Metals Crude oil
Source: International Monetary Fund (IMF)
Jan-13

AN
NU
AL R
EPOR
T 2015EC
ON
OM
IC D
EVELO
PMEN
TS IN 2015
14
More accommodative global policy stanceIn response to the increasingly challenging external environment and moderating domestic economic activity, the overall global policy stance became more accommodative in most regions. In the advanced economies, the uneven growth momentum between economies resulted in a divergence in the direction of monetary policy. While the US raised interest rates for the first time in nine years, the euro area and Japan increased monetary stimulus through their respective asset purchase programmes and negative interest rates. In Asia, several economies reduced key policy rates and introduced targeted fiscal measures to support growth. Additionally, policymakers in the region continued to advance structural reforms to strengthen macroeconomic fundamentals and enhance medium-term growth sustainability.
The divergence in monetary policy stance between the advanced economies became more apparent in 2015. In the US, supported by growing indications of improving labour market conditions, the Fed began to communicate its intention to begin normalising monetary policy during the year. Nevertheless, the Federal Open Market Committee (FOMC) maintained its FFR in the first three quarters, highlighting concerns over the impact of global economic and financial developments on growth and inflation. However, with lower financial market volatility and improvements in US economic activity in the fourth quarter, the FOMC increased the FFR target range by 25 basis points to 0.25 – 0.50% in December. In contrast, amid subdued inflation, the European Central Bank (ECB) continued to implement an asset purchase programme of EUR60 billion per month, which is forecasted to remain until March 2017. In addition, the interest rate on the deposit facility was lowered by 10 basis points to -0.3% towards the end of the year. In Japan, the Bank of Japan (BoJ) continued with its annual asset purchases of JPY80 trillion amid disinflation concerns. To encourage a decline in long-term interest rates, the BoJ supplemented these purchases by extending the maturity of current Japanese government bond purchases to 7–12 years (previous: 7–10 years) from January 2016 onwards and increased the purchases of exchange-traded funds and real estate investment trusts. Across other advanced economies, central banks in Australia, Canada, Denmark, New Zealand, Norway and Sweden also reduced key policy rates following higher downside risks to inflation and growth.
In PR China, the People’s Bank of China (PBoC) lowered the benchmark lending rate and reserve requirement ratio by 125 and 250 basis points to 4.35% and 17.50%, respectively, to help reduce the funding costs for financial institutions, and thereby the financing costs of the corporate sector. Concurrently, the PBoC also continued to undertake financial reforms, including the implementation of deposit insurance, the removal of ceiling rates on deposits and the introduction of a more market-oriented exchange rate framework. To support economic growth, Chinese policymakers announced targeted fiscal measures during the year. These included tax reductions on consumer goods and automobiles, preferential tax policies for SMEs, lower restrictions on the property market and additional funding for infrastructure investments.
Policies in Asia were shaped by domestic concerns amid a more challenging external environment, with several central banks in the region lowering key policy rates. Given more subdued inflationary pressures, Bank Indonesia, the Bank of Thailand and the Reserve Bank of India reduced their key policy rates by 50, 50 and 125 basis points, respectively. Similarly, in Singapore, the Monetary Authority of Singapore reduced the slope of the S$ nominal effective exchange rate policy band in January and October. Amid moderating domestic demand and weak exports, central banks in Korea and Chinese Taipei also lowered their key policy rates by 50 and 25 basis points, respectively. In contrast, following the Fed’s decision to increase the FFR, the Hong Kong Monetary Authority increased the Base Rate by 25 basis points in December.
In addition to monetary easing, a number of Asian economies, including Chinese Taipei, Thailand, Indonesia and Korea, announced fiscal measures to support domestic economic activity. These measures were in the areas of providing financing support for small businesses, higher public investment and rebates to encourage purchases of durable consumer goods. To further strengthen macroeconomic fundamentals and enhance medium-term growth prospects, Asian policymakers also continued with the implementation of structural reforms. In particular, policymakers in the region introduced measures to accelerate infrastructure investment, deregulate labour markets, improve the ease of doing business and promote entrepreneurship.

AN
NU
AL
REP
OR
T 20
15EC
ON
OM
IC D
EVEL
OPM
ENTS
IN 2
015
15A
NN
UA
L R
EPO
RT
2015
ECO
NO
MIC
DEV
ELO
PMEN
TS IN
201
5
Recent Slowdown in Global Trade: Cyclical Bane or Structural Shift?
IntroductionGlobal trade growth experienced a sharp deceleration in 2015, registering its slowest pace of expansion since the 2008 Global Financial Crisis (GFC) (Chart 1). The underperformance of global trade compared to global economic activity is, however, not a recent phenomenon. Global trade elasticity, calculated as the ratio of world trade growth to GDP growth, has been on a declining trend even prior to the GFC (Chart 2), suggesting that the recent trend of subdued growth in global demand only partly explains the modest trade performance in recent years. Several structural shifts could be contributing to a change in the dynamics between global trade and global growth. This article aims to provide possible explanations regarding the cyclical and structural factors that may be weighing on global trade growth and the potential impact of these trends on Asia.
Chart 1
Global Trade in 2015 Expanded at its Slowest Pace Since the Crisis
-10
-8
-6
-4
-2
0
2
4
6
8
10
-15
-10
-5
0
5
10
15
1983
1985
1987
1989
1991
1993
1995
1997
1999
2001
2003
2005
2007
2009
2011
2013
2015
e
World trade volume World real GDP (RHS)
Annual change (%) Annual change (%)
e Estimates
Source: International Monetary Fund (IMF)
Cyclical and Structural FactorsPersistent economic weakness, particularly in several of the major advanced economies is likely to be the key factor in explaining the modest performance of world trade after the GFC.
In the pre-GFC period, the advanced economies collectively accounted for almost two-thirds of total global imports (Chart 3) and almost 60% of global import growth. However, the sharp growth contraction and the impairment of the fi nancial systems experienced by these economies during the crisis resulted in a protracted compression in demand, which constrained the pace of expansion in global trade (Chart 4).
In particular, the weak recovery in investment growth has major implications for global trade activity given that investment goods typically have higher import content relative to consumption goods (Constantinescu et al., 2015). In the advanced economies, while consumer spending has been on a recovering trend, investment growth has remained weak. In Europe, domestic demand has been further weakened by the implementation of fi scal austerity measures and weak investor sentiments amid prolonged concerns surrounding the European sovereign debt crisis.
Chart 2
Trade Elasticity Has Been on a Declining Trend in the Recent Decade
Source: International Monetary Fund (IMF)
0.0
0.5
1.0
1.5
2.0
2.5
3.0
1983
1985
1987
1989
1991
1993
1995
1997
1999
2001
2003
2005
2007
2009
2011
2013
2015
e
Trade elasticity (ratio)
2011-15Average: 1.0
2002-07Average: 1.6
1990-2000Average: 2.1
1983-89Average: 1.4
e Estimates

AN
NU
AL R
EPOR
T 2015EC
ON
OM
IC D
EVELO
PMEN
TS IN 2015
16A
NN
UA
L REPO
RT 2015
ECO
NO
MIC
DEV
ELOPM
ENTS IN
2015
Source: World Trade Organization (WTO)
42 42 36
28 28 33
18 16 15
7 7 93 3 33 3 4
0
10
20
30
40
50
60
70
80
90
100
2005
2007
2014
Chart 3
Pre-GFC, Advanced Regions Had a Higher Shareof Global Trade
% share
Europe
Commonwealth ofIndependent States
South and Central America
Asia North America
Others
It should be highlighted that despite persistent demand weakness in the advanced economies, global trade activity in the post-GFC period did not experience a collapse. A key supporting factor of global trade growth was the recovery in trade in the emerging economies (Marinov and Marinova, 2013), amid a strong growth rebound in these economies in the period immediately after the crisis. Between 2010 - 2011, the emerging economies accounted for almost four-fi fths of global GDP growth. More recently, however, global trade is facing stronger headwinds. In 2015, several large emerging economies experienced a moderation in growth due to a confl uence of factors. This included the signifi cant decline in commodity prices, on-going structural reform measures and country-specifi c factors, which weighed on both the domestic and external demand of these economies. Heightened uncertainty during the year, arising from policy shifts and fi nancial market adjustments in several major economies also adversely affected global sentiments, contributing to a further weakness in global trade, which continued to grow but only at a modest pace.
Beyond these cyclical weaknesses, there are also structural factors at play, in particular the diminishing impact of major catalytic factors that were important drivers of the high global trade growth observed in the 1990s and early 2000s. First, the proliferation of global value chains (GVCs) catalysed a rapid increase in global trade of intermediate goods (WTO, 2011). This was in part spurred by the information and communication technology (ICT) revolution, which greatly reduced the cost of managing, transacting and coordinating production across borders (WTO, 2011). As a result, fi rms were better able to leverage on the comparative advantages of different countries through outsourcing and dispersing the different stages of production internationally.
Second, major trade liberalisation breakthroughs, including the formation of the European Union (EU)1 and the World Trade Organisation (WTO) resulted in the lowering of tariffs and regulatory barriers. This provided further impetus to the expansion of GVCs. For Europe, the more liberalised trade environment between the EU members has contributed to a tripling of intra-European trade from EUR800 billion in 1992 to EUR2.9 trillion in 2014.
Third, the accession of PR China into the WTO in 2001 marked a major shift in the global trade landscape. The opening up of the Chinese economy facilitated a rapid expansion of its manufacturing
Chart 4
Post-GFC Import Demand From the Advanced Economies Has Remained Weak
Source: World Trade Organization (WTO)
Europe Asia North America Others World (annual change, %)
-25
-20
-15
-10
-5
0
5
10
15
20
25
2000
2001
2002
2003
2004
2005
2006
2007
2008
2009
2010
2011
2012
2013
2014
Contribution to growth (percentage points)
1 The European Union (EU) was formed in 1992 upon the signing of the Maastricht Treaty. To date, the EU has 28 member states with Croatia being the latest addition to the union in 2013.

AN
NU
AL
REP
OR
T 20
15EC
ON
OM
IC D
EVEL
OPM
ENTS
IN 2
015
17A
NN
UA
L R
EPO
RT
2015
ECO
NO
MIC
DEV
ELO
PMEN
TS IN
201
5
sector amid large infl ows of foreign direct investment. The offshoring phenomenon accelerated as fi rms became better at maximising the economies of scale offered by the GVCs. This was further supported by low production costs in the host country as they became increasingly adept in manufacturing processes. Subsequently, PR China’s share of world merchandise exports to global trade more than doubled, from 5.8% in 2003 to 12.7% in 2014.
It is hypothesised that the catalytic effects of these factors may have peaked, resulting in a lower elasticity of global trade with respect to global growth. Of late, there are signs of an emerging trend towards more onshoring or re-shoring of manufacturing activity. Anecdotal evidence suggests that multi-national corporations are increasingly relocating production back to the US and Europe2.
Asia’s ExperienceIn the past few decades, given its long history of global orientation and trade openness, Asia has benefi tted tremendously from the rapid expansion of international trade activity. The diversity of resources in the region enabled each economy to specialise at different stages of both regional and global production networks3. This inherent strength of the region was further reinforced by the close geographical proximity of Asian economies to fast-growing PR China amid continued deepening of trade linkages with the Chinese economy (Chart 5). Intra-regional trade rose from 32% of total trade in 1990 to 43% in 2007, while Asia’s merchandise trade grew at an annual average rate of 8.9% in 1990 - 2000 and 16.3% in 2002 - 2007.
As with the advanced economies, trade activity in Asia was adversely affected during the GFC. Nevertheless, the Asian economies experienced a swift rebound in demand in the few years following the GFC. The strong economic recovery could be attributed in part to increasing trade within the Asian region and between Asia and the other emerging economies that also registered favourable growth following the crisis. For example, Asia’s trade with Latin America, the Middle East and Africa increased from 12% in 2007 to 15% of its total trade in 2014. Nevertheless, most recently, a confl uence of headwinds, including the persistent demand weakness in the advanced economies, as well as structural factors, such as maturing GVCs, have contributed to a continued moderation in trade growth in the region.
Furthermore, PR China’s economic transition is posing an additional challenge for Asian economies, in particular for the exporters of raw materials and intermediate goods. The slowdown in PR China’s fi nal demand will affect the export performance of its trade partners. Additionally, PR China’s structural transformation process amid increasingly competitive domestic fi rms have led to import substitution of some of the parts and components that are usually sourced from other economies, including from those in Asia (Kee and Tang, 2015). This is evidenced by the moderation in PR China’s imports of intermediate goods from a pre-crisis average growth of 26.5% to just 3.5% from 2012 to 2014 (Chart 6).
Asia’s ProspectsWith the effect of past trends diminishing, the future direction of global trade will depend on the interplay between the various ongoing and emerging structural shifts in the global economy and trade landscape. These include PR China’s economic transition towards a more consumption-based growth, a rising middle income population in the emerging economies and new multilateral trade agreements. To successfully adapt to this fast evolving environment requires agility. This in turns necessitates economies to have strong institutions, suffi cient policy fl exibility as well as diversifi ed sources of trade and growth.
Following the Asian Financial Crisis, policymakers in Asia undertook wide-ranging structural reforms to strengthen economic resilience and improve their growth prospects. In particular, policymakers
2 A BCG survey of senior US-based manufacturing executives showed that more manufacturers are planning to add production capacity in the US, compared to any other country. The share of manufacturers that are in the process of reshoring producton back to the US is also increasing (Boston Consulting Group, 2015).
3 The varying stages of development among the Asian nations enable each of them to take advantage of its distinctiveness to develop a supportive ecosystem, as explained by the ``fl ying geese model” (Kojima, 2000).

AN
NU
AL R
EPOR
T 2015EC
ON
OM
IC D
EVELO
PMEN
TS IN 2015
18A
NN
UA
L REPO
RT 2015
ECO
NO
MIC
DEV
ELOPM
ENTS IN
2015
embarked on efforts to develop a vibrant manufacturing base, to move up the value chain and to improve effi ciency and competitiveness. At the same time, measures were also implemented to strengthen domestic demand in the region, including increasing labour market fl exibility and enhancing social safety nets.
ConclusionThis article puts forth cyclical and structural factors that have caused the global trade growth and the intensity of trade to decline in recent years. At this point, with the global economy still undergoing some critical transitions, it is diffi cult to conclude whether these trends in global trade will continue. Nevertheless, it is imperative for economies to continuously embark on policy initiatives geared towards enhancing their competitiveness, in order to benefi t from the more globalised world and to position the economy to confront the increasingly challenging global environment.
ReferencesBoston Consulting Group. (2015). `U.S. Is Now the Preferred Location for New Factory Capacity to Serve U.S. Market as Interest in Reshoring Stays Strong´. Accessed on 16 February 2016 at http://www.bcg.com/news/press/10december2015-2015-manufacturing-survey.aspx
Constantinescu, C., Mattoo, A. and Ruta, M. (2015). `The Global Trade Slowdown: Cyclical or Structural?´ IMF Working Paper, No. 15/6. International Monetary Fund, Washington D.C.
Kee, H.L., and Tang H. (2015). `Domestic Value Added in Exports: Theory and Firm Evidence from China´. Policy Research Working Paper WPS 7491. The World Bank Group, Washington, D.C.
Kojima, K. (2000). `The ``Flying Geese´´ Model of Asian Economic Development: Origin, Theoretical Extensions, and Regional Policy Implications´. Journal of Asian Economics 11 (2000) 375–40.
Marinov, M. and Marinova, S. (2013). `The Global Crisis and the World: The Cases of Emerging and Developed Economies´. Emerging Economies and Firms in the Global Crisis. Palgrave Macmillan UK.
World Trade Organisation (2011). `Trade Patterns and Global Value Chains in East Asia: From Trade in Goods to Trade in Tasks´. WTO, Geneva, Switzerland.
Chart 5
PR China’s Importance as a Source of Final Demandfor Asia Has Increased
Note: 2014 final demand for the region estimated based on 2011 figures available on OECD TiVA
Source: OECD Trade in Value Added (TiVA) - October 2015 database and Bank Negara Malaysia estimates
0
2
4
6
8
10
12
14
Hon
g K
ong
SAR
Chi
nese
Tai
pei
Mal
aysi
a
Sing
apor
e
Kor
ea
Thai
land
Indo
nesi
a
2005 2014
% of GDP
Chart 6
PR China’s Imports of Intermediate GoodsHave Declined
Source: UN COMTRADE
-20
-10
0
10
20
30
40
50
1999
2000
2001
2002
2003
2004
2005
2006
2007
2008
2009
2010
2011
2012
2013
2014
Annual change (%)

AN
NU
AL
REP
OR
T 20
15EC
ON
OM
IC D
EVEL
OPM
ENTS
IN 2
015
19
The range of policy measures employed during the year underscored the challenge faced by policymakers in striking a balance between addressing short-term risks and long-term growth challenges. Policy formulation and implementation were further complicated by volatile capital flows and pressures in the foreign exchange markets. The fact that policy space in many countries was more constrained following the strong measures rolled out in the immediate aftermath of the global financial crisis in 2008-2009 also added to some uncertainty in the financial markets. Combined with the on-going imbalances in many major economies, the operating environment in 2015 remained challenging, and this is likely to weigh on prospects for 2016.
THE MALAYSIAN ECONOMY
OverviewDespite the challenging economic environment in 2015, the Malaysian economy grew by 5.0% (2014: 6.0%), supported by the continued expansion of domestic demand. Growth of domestic demand was stronger during the early part of the year, partly reflecting the frontloading of consumption spending prior to the implementation of the Goods and Services Tax (GST) in April 2015. In the second half of the year, as growth in domestic demand moderated, a modest improvement in external demand provided additional impetus to economic growth.
Domestic demand was primarily driven by the private sector. Private consumption continued to expand, albeit at a more moderate pace. Despite
Chart 1.3
Cumulative Movements of Policy Rates(January 2015 - January 2016)
Basis points
Note: Current policy rates as at end January 2016 in parentheses Source: National Authorities
+25
-25
-50 -50 -50
-125-125-140-120-100-80-60-40-20
02040
Hong Kong(0.75%)
ChineseTaipei
(1.625%)
Indonesia(7.25%)
Korea(1.50%)
Thailand(1.50%)
India(6.75%)
PR China(4.35%)
concerns about the rising cost of living and weak sentiments, household spending was supported by continued income growth and stable labour market conditions. This was further supported by an increase in targeted Government transfers to low- and middle-income households, as well as the boost to disposable incomes from the lower fuel prices during the year.
Despite the challenging economic environment, the Malaysian economy registered a growth of 5.0% in 2015
Private investment growth was slower as capital expenditure was affected by the moderation in domestic and global growth, and cautious business sentiments. While the low oil prices affected upstream mining investment, the continued progress of ongoing and new investment projects in the services and manufacturing sectors, especially in the export-oriented industries, provided support to the overall investment performance.
Despite the challenging conditions, the public sector continued to provide support to growth while remaining committed to the steady reduction in fiscal deficit. Measures by the Government to freeze new hiring and cut costs to reduce discretionary spending contributed to the sustained growth in public consumption in 2015. Public investment improved to register a smaller contraction because of higher capital spending by both the public corporations and the Federal Government. Growth was underpinned by ongoing as well as new projects.
On the supply side, all major economic sectors registered more moderate growth, with the exception of the mining sector. The moderation reflected the slower expansion in industries related to domestic demand. However, export-oriented manufacturing and trade-related services industries benefited from the modest improvement in external trade, especially with the major advanced economies.
The external sector remained resilient in 2015. In the first half of the year, the external trade performance was largely weighed down by the decline in commodity prices and the sluggish demand for commodities and commodity-related

AN
NU
AL R
EPOR
T 2015EC
ON
OM
IC D
EVELO
PMEN
TS IN 2015
20
Malaysia - Key Economic Indicators
2013 2014 2015p 2016f
Population (million persons) 30.2 30.6 31.0 31.4
Labour force (million persons) 13.6 14.0 14.2 14.6
Employment (million persons) 13.2 13.5 13.8 14.1
Unemployment (as % of labour force) 3.1 2.9 3.2 3.3 ~ 3.5
Per Capita Income (RM) 32,596 34,945 36,285 37,930
(USD) 10,345 10,677 9,291 8,821
NATIONAL PRODUCT (% change)
Real GDP at 2010 prices1 4.7 6.0 5.0 4.0 ~ 4.5
(RM billion) 955.3 1,012.5 1,062.6 1,106.1
Agriculture, forestry and fi shery 1.9 2.1 1.0 -0.3
Mining and quarrying 1.2 3.3 4.7 3.5
Manufacturing 3.4 6.2 4.9 4.1
Construction 10.8 11.8 8.2 7.9
Services 6.0 6.5 5.1 4.4
Nominal GNI 5.3 8.6 5.2 5.9
(RM billion) 984.8 1,069.3 1,124.7 1,191.0
Real GNI 5.2 6.0 6.8 3.8
(RM billion) 916.9 971.9 1,038.1 1,077.7
Real aggregate domestic demand2 7.3 5.9 5.1 4.3
Private expenditure 8.5 7.9 6.1 5.2
Consumption 7.2 7.0 6.0 5.1
Investment 12.8 11.0 6.4 5.5
Public expenditure 4.1 0.4 2.1 1.6
Consumption 5.9 4.4 4.3 2.0
Investment 1.9 -4.7 -1.0 1.1
Gross national savings (as % of GNI) 30.4 30.3 28.8 28.3
BALANCE OF PAYMENTS (RM billion)
Goods balance 96.6 113.4 108.9 99.5
Exports 637.7 679.9 685.8 707.6
Imports 541.1 566.5 576.9 608.1
Services balance -9.6 -11.2 -20.5 -19.2
Primary income, net -34.0 -37.3 -32.2 -38.0
Secondary income, net -17.5 -17.6 -22.2 -23.1
Current account balance 35.5 47.3 34.0 19.1
(as % of GNI) 3.6 4.4 3.0 1.0 ~ 2.0
Bank Negara Malaysia international reserves, net3 441.9 405.3 409.1 -
(in months of retained imports) 9.5 8.3 8.4 -
PRICES (% change)
CPI (2010=100)4 2.1 3.2 2.1 2.5 ~ 3.5
PPI (2010=100)5 -1.7 1.4 -4.8 -
Real wage per employee in the manufacturing sector 5.8 1.5 3.7 -
1 Beginning 2015, real GDP has been rebased to 2010 prices, from 2005 prices previously2 Exclude stocks3 All assets and liabilities in foreign currencies have been revalued into ringgit at rates of exchange ruling on the balance sheet date and the gain/loss has
been refl ected accordingly in the Bank’s account4 Effective 2011, the Consumer Price Index has been revised to the new base year 2010=100, from 2005=100 previously5 Effective 2015, the Producer Price Index has been revised to the new base year 2010=100, from 2005=100 previously6 Based on average USD exchange rate for the period of January-February 2016p Preliminaryf ForecastNote: Numbers may not necessarily add up due to rounding
Source: Department of Statistics, Malaysia and Bank Negara Malaysia
Table 1.2

AN
NU
AL
REP
OR
T 20
15EC
ON
OM
IC D
EVEL
OPM
ENTS
IN 2
015
21
Malaysia - Financial and Monetary Indicators
FEDERAL GOVERNMENT FINANCE (RM billion) 2013 2014 2015p
Revenue 213.4 220.6 219.1
Operating expenditure 211.3 219.6 217.0
Net development expenditure 40.7 38.5 39.3
Overall balance -38.6 -37.4 -37.2
Overall balance (% of GDP) -3.8 -3.4 -3.2
Public sector net development expenditure 139.4 154.6 161.5
Public sector overall balance (% of GDP) -4.6 -6.0 -8.6
EXTERNAL DEBT1
Total debt (RM billion) 696.6 747.5 833.7
Medium- and long-term debt 357.7 384.3 481.9
Short-term debt 338.8 363.2 351.9
Debt service ratio2 (% of exports of goods and services)
Total debt 18.4 19.1 22.6
Medium- and long-term debt 18.3 18.9 22.4
MONEY AND BANKINGChange in 2013 Change in 2014 Change in 2015
RM billion % RM billion % RM billion %
Money supply M1 37.8 13.0 18.8 5.7 14.0 4.1
M3 107.5 7.9 101.5 7.0 41.5 2.7
Banking system deposits 116.9 8.3 116.4 7.6 29.5 1.8
Banking system loans3 117.7 10.6 114.1 9.3 105.4 7.9
Loan to deposit ratio (%, end of year)4 84.8 86.7 88.7
Loan to fund ratio (%, end of year)4,5 80.7 82.1 83.0
Loan to fund and equity ratio (%, end of year)4,5,6 73.3 74.1 74.6
INTEREST RATES (%, AS AT END-YEAR) 2013 2014 2015
Overnight Policy Rate (OPR) 3.00 3.25 3.25
Interbank rates (1-month) 3.20 3.38 3.45
Commercial banks
Fixed deposit 3-month 2.97 3.13 3.13
12-month 3.15 3.31 3.31
Savings deposit 0.99 1.07 1.04
Base rate (BR) - - 3.86
Base lending rate (BLR) 6.53 6.79 6.79Treasury bill (3-month) 3.00 3.42 2.74Malaysian Government Securities (1-year)7 3.03 3.48 2.59
Malaysian Government Securities (5-year)7 3.66 3.84 3.47
EXCHANGE RATES (AS AT END-YEAR) 2013 2014 2015
Movement of Ringgit (%)
Change against SDR -7.3 -0.7 -15.1
Change against USD -6.8 -6.1 -18.6
1 As defi ned effective from the fi rst quarter of 2014. For more information, please refer to the box article titled `The Redefi nition of External Debt´ in the Quarterly Bulletin on Economic and Financial Developments in the Malaysian Economy in the First Quarter of 2014
2 Includes prepayment of medium- and long-term debt 3 Includes loans sold to Cagamas 4 Deposits exclude deposits accepted from banking institutions. Loans exclude loans sold to Cagamas and loans extended to banking institutions.
Beginning July 2015, loans exclude fi nancing funded by Islamic Investment Accounts 5 Funds comprise deposits and all debt instruments (including subordinated debt, debt certifi cates/sukuk issued, commercial paper and structured notes)6 Equity comprise ordinary and preferred shares, share premium and retained earnings 7 Refers to data from FAST, Bank Negara Malaysia p Preliminary
Source: Ministry of Finance, Malaysia and Bank Negara Malaysia
Table 1.3
Malaysia - Key Economic Indicators
2013 2014 2015p 2016f
Population (million persons) 30.2 30.6 31.0 31.4
Labour force (million persons) 13.6 14.0 14.2 14.6
Employment (million persons) 13.2 13.5 13.8 14.1
Unemployment (as % of labour force) 3.1 2.9 3.2 3.3 ~ 3.5
Per Capita Income (RM) 32,596 34,945 36,285 37,930
(USD) 10,345 10,677 9,291 8,821
NATIONAL PRODUCT (% change)
Real GDP at 2010 prices1 4.7 6.0 5.0 4.0 ~ 4.5
(RM billion) 955.3 1,012.5 1,062.6 1,106.1
Agriculture, forestry and fi shery 1.9 2.1 1.0 -0.3
Mining and quarrying 1.2 3.3 4.7 3.5
Manufacturing 3.4 6.2 4.9 4.1
Construction 10.8 11.8 8.2 7.9
Services 6.0 6.5 5.1 4.4
Nominal GNI 5.3 8.6 5.2 5.9
(RM billion) 984.8 1,069.3 1,124.7 1,191.0
Real GNI 5.2 6.0 6.8 3.8
(RM billion) 916.9 971.9 1,038.1 1,077.7
Real aggregate domestic demand2 7.3 5.9 5.1 4.3
Private expenditure 8.5 7.9 6.1 5.2
Consumption 7.2 7.0 6.0 5.1
Investment 12.8 11.0 6.4 5.5
Public expenditure 4.1 0.4 2.1 1.6
Consumption 5.9 4.4 4.3 2.0
Investment 1.9 -4.7 -1.0 1.1
Gross national savings (as % of GNI) 30.4 30.3 28.8 28.3
BALANCE OF PAYMENTS (RM billion)
Goods balance 96.6 113.4 108.9 99.5
Exports 637.7 679.9 685.8 707.6
Imports 541.1 566.5 576.9 608.1
Services balance -9.6 -11.2 -20.5 -19.2
Primary income, net -34.0 -37.3 -32.2 -38.0
Secondary income, net -17.5 -17.6 -22.2 -23.1
Current account balance 35.5 47.3 34.0 19.1
(as % of GNI) 3.6 4.4 3.0 1.0 ~ 2.0
Bank Negara Malaysia international reserves, net3 441.9 405.3 409.1 -
(in months of retained imports) 9.5 8.3 8.4 -
PRICES (% change)
CPI (2010=100)4 2.1 3.2 2.1 2.5 ~ 3.5
PPI (2010=100)5 -1.7 1.4 -4.8 -
Real wage per employee in the manufacturing sector 5.8 1.5 3.7 -
1 Beginning 2015, real GDP has been rebased to 2010 prices, from 2005 prices previously2 Exclude stocks3 All assets and liabilities in foreign currencies have been revalued into ringgit at rates of exchange ruling on the balance sheet date and the gain/loss has
been refl ected accordingly in the Bank’s account4 Effective 2011, the Consumer Price Index has been revised to the new base year 2010=100, from 2005=100 previously5 Effective 2015, the Producer Price Index has been revised to the new base year 2010=100, from 2005=100 previously6 Based on average USD exchange rate for the period of January-February 2016p Preliminaryf ForecastNote: Numbers may not necessarily add up due to rounding
Source: Department of Statistics, Malaysia and Bank Negara Malaysia
Table 1.2

AN
NU
AL R
EPOR
T 2015EC
ON
OM
IC D
EVELO
PMEN
TS IN 2015
22
manufactured products. In the second half of the year, external trade improved due to a rebound in export growth arising from higher demand for manufactured products and commodities, and the positive valuation effect from the ringgit depreciation. For the whole year, the trade surplus was higher, supported by both manufactured and commodity products.
Domestic demand remained the main source of growthDomestic demand remained the key driver of growth, but its growth moderated to 5.1% during the year (2014: 5.9%). The slower performance reflected the moderation in growth of private sector activity, particularly in the second half of the year. Public sector expenditure, meanwhile, improved marginally following a smaller contraction in public investment.
Private consumption growth moderated to 6.0% in 2015 (2014: 7.0%), as households adjusted their spending due to the increasing cost of living, arising from fiscal reform measures such as the implementation of GST and administrative price adjustments, and the depreciation in ringgit. Similar to other
countries’ experiences in implementing GST, households frontloaded purchases prior to the commencement of the tax in the first quarter of 2015, particularly in the transport, food and beverages, and communication categories. From the second quarter onwards, private consumption growth moderated as households adjusted to the new tax. Upward adjustments to administered prices, including cigarettes, toll rates and public transport fares also contributed to the moderation in spending. In addition, weaker sentiments due to greater uncertainty in the global and domestic environment, and the ringgit depreciation, further weighed down private consumption growth during the second half of the year.
Private consumption expanded at a more moderate pace
Notwithstanding these developments, households received some support from higher disposable income through targeted Government measures to the low- and middle-income households. This included the higher amount of Bantuan Rakyat 1Malaysia (BR1M) cash transfers, the reduction in individual income tax rates for the 2015 assessment year by one to three percentage points and savings derived from the lower fuel prices during the year. Additionally, developments in the labour market continued to remain supportive of wage growth and private consumption. Average nominal wage growth in the manufacturing sector
1
Real GDP by Expenditure (2010=100)2015p 2014 2015p 2014 2015p% of GDP
Annual change (%)
Contribution to growth (ppt)
Domestic Demand1 91.6 5.9 5.1 5.4 4.6
Private sector expenditure 69.2 7.9 6.1 5.3 4.2
Consumption 52.4 7.0 6.0 3.6 3.1
Investment 16.9 11.0 6.4 1.8 1.1
Public sector expenditure 22.4 0.4 2.1 0.1 0.5
Consumption 13.5 4.4 4.3 0.6 0.6
Investment 8.9 -4.7 -1.0 -0.5 -0.1
Gross Fixed Capital Formation 25.8 4.8 3.7 1.3 1.0
Change in Stocks -0.6 0.6
Net Exports of Goods and Services 8.6 12.8 -3.7 1.1 -0.3
Exports 73.0 5.1 0.7 3.9 0.5
Imports 64.4 4.2 1.3 2.8 0.8
Real Gross Domestic Product (GDP) 100.0 6.0 5.0 6.0 5.0
1 Excluding stocksp Preliminary
Note: Figures may not necessarily add up due to roundingSource: Department of Statistics, Malaysia
Table 1.4
1
Real GDP by Kind of Economic Activity (2010=100)
2015p 2014 2015p 2014 2015p
% of GDP
Annual change (%)
Contribution to growth (ppt)1
Services 53.5 6.5 5.1 3.5 2.8
Manufacturing 23.0 6.2 4.9 1.4 1.1
Mining and quarrying 8.9 3.3 4.7 0.3 0.4
Agriculture 8.8 2.1 1.0 0.2 0.1
Construction 4.4 11.8 8.2 0.5 0.3
Real Gross DomesticProduct (GDP) 100.01 6.0 5.0 6.0 5.0
1 Figures may not necessarily add up due to rounding and exclusion of import duties componentp Preliminary
Source: Department of Statistics, Malaysia
Table 1.5

AN
NU
AL
REP
OR
T 20
15EC
ON
OM
IC D
EVEL
OPM
ENTS
IN 2
015
23A
NN
UA
L R
EPO
RT
2015
ECO
NO
MIC
DEV
ELO
PMEN
TS IN
201
5
Impact of Goods and Services Tax on Private Consumption in Malaysia
IntroductionOn 1 April 2015, the Goods and Services Tax (GST) was introduced at a standard rate of 6%. While the GST represents a key component of the Government’s long-term fi scal reform initiatives, a combination of adverse economic developments and shocks after the introduction of the GST has impacted household spending pattern. Similar to the experiences in other countries, the major impact of GST was on the change in behaviour of households towards consumption spending in the period before and after the implementation of the GST.
Frontloading of consumption spending pre-GST implementationPrior to the implementation of GST1, it was observed that households brought forward their purchases of goods in anticipation of higher prices post the tax introduction. In particular, households frontloaded purchases of durable items such as passenger cars, furniture and electrical appliances. Notably, the uncertainty over the impact of GST on car prices led to a marked increase in car sales, particularly in March 2015 (Chart 1). Households also frontloaded purchases of basic necessities, such as food and beverages and household items. This was refl ected in the higher growth of 10.5% in the retail trade index during the fi rst quarter of 2015 (Chart 2). Most retailers, particularly supermarkets, experienced a substantial increase in sales during the last few weeks leading up to the introduction of the GST.
1 GST replaces the Sales and Services Tax in Malaysia to enhance the effi ciency and effectiveness of the existing taxation system.2 Following the introduction of GST, Australia (2000) and New Zealand (1986), for example, experienced a temporary boost in private consumption pre-GST implementation followed by a decline in retail sales during the quarter of GST implementation.
Chart 1
Surge in Car Sales in March 2015 was Followed bya Decline in April 2015
Source: Malaysian Automotive Association (MAA)
-30
-20
-10
0
10
20
Oct
-14
Nov
-14
Dec
-14
Jan-
15
Feb-
15
Mar
-15
Apr
-15
May
-15
Jun-
15
Jul-1
5
Aug
-15
Sep-
15
Annual change (%)Pre-GST Post-GST
2007-2015: 5.4%
14.0
The surge in household spending was also refl ected in other consumption indicators. In February - March 2015, credit card spending increased signifi cantly by 21.8%, while narrow money (M1) rose by 9% (Chart 3). On aggregate, private consumption expanded strongly by 8.8% in the fi rst quarter of 2015, signifi cantly higher than its long-run average growth of 6.7% (1990-2014). This was similar to the experiences in Japan and Singapore, whereby the frontloading of purchases prior to the GST implementation boosted private consumption growth above its long-term average by two to four percentage points.
As expected, the surge in consumption expenditure during the period leading up to the GST introduction was only temporary. As with the experiences of other economies2 that introduced a
Chart 2
Higher Growth of Index of Retail Trade and Its Sub-component in 1Q 2015, before Moderatingin 2Q-3Q 2015
Source: Department of Statistics, Malaysia
Annual change (%)Pre-GST Post-GST
-5
0
5
10
15
20
1Q-1
3
2Q-1
3
3Q-1
3
4Q-1
3
1Q-1
4
2Q-1
4
3Q-1
4
4Q-1
4
1Q-1
5
2Q-1
5
3Q-1
5Overall index of retail trade Sales of food, beverages & tobacco
Sales of other household equipment
2009-2015: 6.2%

AN
NU
AL R
EPOR
T 2015EC
ON
OM
IC D
EVELO
PMEN
TS IN 2015
24A
NN
UA
L REPO
RT 2015
ECO
NO
MIC
DEV
ELOPM
ENTS IN
2015
new consumption tax, private consumption growth in Malaysia moderated during the quarter of implementation (Chart 4; 2Q 2015: 6.4%). Households adjusted to the rise in prices by changing their consumption patterns, particularly by cutting down on discretionary spending. Retail trade experienced a broad-based moderation across most consumer goods, particularly household equipment, food, beverages and tobacco. Credit card spending and M1 also registered lower growth rates of 0.6% and 8.4%, respectively, during April – May 2015. Similarly, after the accelerated growth of 14% in March 2015, passenger car sales contracted by 10.8% in 2Q 2015 compared with the same period in the previous year.
New shocks prolonging the period of adjustment post-GST The macroeconomic environment in which the GST is introduced is a key factor in explaining the duration of the ensuing period of adjustment in household spending. In economies that introduced consumption tax during stable economic growth conditions, household spending typically turned around after about three to six months. In New Zealand, amid fi rm economic conditions, retail sales declined during the quarter of GST implementation, before rebounding in the subsequent quarter. Similarly, consumption growth began to improve six months after the GST was implemented in Australia during a period of sustained economic growth in the late 1990s. Countries that introduced the GST during more volatile economic conditions, however, have tended to experience a more prolonged period of adjustment in consumer spending3.
In the case of Malaysia, the period after the introduction of the GST saw new shocks that complicated the adjustment process. Most of these shocks were exogenous, particularly the decline in commodity prices, weakening of the ringgit, and were precipitated by external events unforeseen during the period prior to the implementation of the GST. These factors were compounded by several factors including, the upward revision of administered prices in the period after the implementation of the GST, culminating in an increase in the cost of living and a steady decline in consumer confi dence. As expected, household spending moderated in second quarter of 2015 to 6.4% and reached a trough of 4.1% in the third quarter, before recovering to 4.9% in the fourth quarter of the year.
It should be noted that when the Government fi rst announced the planned implementation of GST back in October 2013, it also proposed a package of measures designed to help households and businesses to cope with the transition. For households, these included the reduction of individual income tax rates by one to three percentage points and the disbursement of higher cash transfers to low- and middle-income households. Additionally, the exclusion of essential goods and services from
Chart 3
Strong Growth in Credit Card Spending and Narrow Money before Moderating Post-GST
Source: Bank Negara Malaysia
Oct
-14
Nov
-14
Dec
-14
Jan-
15
Feb-
15
Mar
-15
Apr
-15
May
-15
Jun-
15
Jul-1
5
Aug
-15
Sep
-15
Credit card spending M1 (RHS)
0
2
4
6
8
10
12
0
5
10
15
20
25
30
35
Annual change (%) Annual change (%)Pre-GST Post-GST
2007-2015: 11.0%
2007-2015: 10.2%
Chart 4
Moderation in Consumption GrowthPost-GST Implementation
Source: Department of Statistics, Malaysia
2
4
6
8
10
12
1Q-1
4
2Q-1
4
3Q-1
4
4Q-1
4
1Q-1
5
2Q-1
5
3Q-1
5
4Q-1
5
Annual change (%)Pre-GST Post-GST
1990-2014: 6.7%
3 In Canada, when the GST was introduced during an economic recession in January 1991, private consumption growth registered three consecutive quarters of contraction before recovering.

AN
NU
AL
REP
OR
T 20
15EC
ON
OM
IC D
EVEL
OPM
ENTS
IN 2
015
25A
NN
UA
L R
EPO
RT
2015
ECO
NO
MIC
DEV
ELO
PMEN
TS IN
201
5
the GST helped to alleviate some of the burden of adjustments faced by households, particularly the lower income groups. Subsequently, in October 2015, the Government proposed for an increase in the national minimum wage and civil servants’ salaries effective July 2016. Following a new round of shocks to the economy, the Government implemented additional measures in early 2016 to support household consumption. These measures included providing employees with the option to temporarily lower their EPF contribution rate by three percentage points to increase their disposable income.
ConclusionThe introduction of GST in Malaysia led to a temporary change in household spending patterns, and the adjustment process is still continuing at the time of writing. As expected, consumption spending was frontloaded in anticipation of higher prices after the introduction of the GST. The post-GST period has seen a downward adjustment in consumer spending. This period of adjustment could be more prolonged than earlier anticipated, following additional exogenous shocks to the economy in the form of a more subdued global growth environment, a fall in commodity prices and a depreciation of the ringgit exchange rate. These shocks had cumulatively resulted in increased uncertainty and affected business and household sentiments. Nevertheless, looking ahead, the impact of GST is expected to decline, as continued income growth and stable job market conditions provide fundamental support to household spending. Supporting measures by the Government would also provide some impetus to consumption activity. It is envisaged that private consumption will continue to grow in the near to medium term, albeit at a more moderate rate compared to the average growth of 7.1% for the past fi ve years.
ReferencesReserve Bank of Australia. (2000). `Box A: Transitional Effects on Demand of the GST: the Canadian, Japanese and New Zealand Experience´. Semi-Annual Statement on Monetary Policy.
The Treasury of the Australian Government. (2003). `Preliminary assessment of the impact of The New Tax System´. Economic Roundup Autumn 2003.
Statistics New Zealand. (2010). `How GST Affected Retail Sales in the 1980s´.

AN
NU
AL R
EPOR
T 2015EC
ON
OM
IC D
EVELO
PMEN
TS IN 2015
26
Softening Labour Market Conditions
The labour market remained broadly stable in 2015, as the continued expansion across all economic sectors sustained the demand for labour. The unemployment rate edged higher to 3.2% (2014: 2.9%), as more cautious business sentiments led to softer employment prospects towards the second half of the year (Table 1). The labour force participation rate was stable at 67.6% (2014: 67.5%).
The number of workers laid off totalled 21,713 persons, or approximately 0.2% of total employment. Most of the layoffs (retrenchments and voluntary separation scheme (VSS) offerings) in 2015 were mainly attributable to the decline in global oil prices and reorientation of multinational firms’ business strategies. These layoffs were conducted on a global and regional scale, particularly among oil and gas companies and manufacturers in the E&E sub-sector. Among domestic companies, the national airline implemented a large corporate transformation exercise, while financial services firms took steps to enhance their operational efficiency, in line with global trends in the financial services industry.
Total employment continued to expand to 13.8 million workers (2014: 13.5 million workers). The net addition of 226,000 jobs came mainly from the services sector (223,000 jobs), particularly in the distributive trade, education, and human health and social work sub-sectors. The construction sector registered net employment gains of 54,000 jobs, while employment growth in the oil and gas sector remained steady (net gain of 19,000 jobs), despite large scale-backs during the year (Chart 1). In terms of skill levels, employment gains were mainly concentrated in the high-skilled occupations, reflecting a continued shift of the Malaysian economy towards becoming a higher value-added economy (Chart 2). However, demand for low-value
Table 1
Selected Labour Market Indicators
2011 2012 2013 2014 2015pEmployment (‘000 persons) 12,284 12,723 13,210 13,532 13,759
Labour force (‘000 persons) 12,676 13,120 13,635 13,932 14,215
Unemployment rate (% of labour force) 3.1 3.0 3.1 2.9 3.2
Layoffs (persons) 12,689 20,031 14,465 12,406 21,7131
Foreign workers (‘000 persons) 1,573 1,572 2,250 2,073 2,135
p Preliminary1 Constitutes workers affected by retrenchments and voluntary separation scheme (VSS) offerings in the January-October 2015 period and
including layoffs arising from the national airline’s corporate restructuring
Source: Department of Statistics, Malaysia; Ministry of Human Resources; Ministry of Home Affairs; and Bank Negara Malaysia estimates
Chart 1
Net Employment Gains1 by Sectors, 2013-2015
-13
6
8051
-3-18
-44
19
54
223
-50
0
50
100
150
200
350
Manufacturing Mining Construction Services
2013
p Preliminary
1 Net employment gains are the difference between employment level in a given year compared to the previous year
Source: Department of Statistics, Malaysia and Bank Negara Malaysia estimates
2014 2015p
'000 jobs333 314
Chart 2
Employment Growth by Skill Levels, 2011-2015
0
-500
500
1,000
1,500
2,000
1Q 2Q 3Q 4Q 1Q 2Q 3Q 4Q 1Q 2Q 3Q 4Q 1Q 2Q 3Q 4Q 1Q 2Q 3Q 4Q
2011 2012 2013 2014 2015p
Cumulative increase in employment, since 1Q 2011('000 persons)
Low-skilled Mid-skilled High-skilled Total
p Preliminary
Source: Department of Statistics, Malaysia and Bank Negara Malaysia estimates

AN
NU
AL
REP
OR
T 20
15EC
ON
OM
IC D
EVEL
OPM
ENTS
IN 2
015
27
was stable at 5.9% (2014: 4.7%), underpinned by strong wage growth in the export-oriented sectors, while the growth of wages in the domestic-oriented sectors remained modest.
Public consumption recorded a sustained growth of 4.3% in 2015 (2014: 4.4%). Spending on emoluments was lower, partly attributable to the freezing of new hiring for selected positions and the absence of bonus payments to civil servants. Continued efforts to rationalise and optimise Government expenditure resulted in lower discretionary spending, particularly on supply of other materials and rental payments. Nevertheless, total spending on supplies and services was higher during the year, supported by maintenance and minor repair work, and communication and utilities.
Gross fixed capital formation (GFCF) expanded by 3.7% in 2015 (2014: 4.8%), due mainly to slower private sector investment. The environment of low and volatile oil prices had affected investment in the upstream mining sector, resulting in oil and gas firms revising their capital expenditure plans during the year. By type of assets, investment in structures registered a lower growth of 6.9% (2014: 9.9%) mainly due to the slower pace of construction activity in both the residential and non-residential sub-sectors. Growth in machinery and equipment expenditure remained in contraction (-0.3%; 2014: -0.5%) with spending being mainly on transport, office and telecommunication equipment.
Private investment registered a slower growth of 6.4% (2014: 11.0%), weighed down partly by the moderation in domestic demand conditions and weak business sentiments. While investment for new oil and gas explorations moderated in 2015, investment in downstream activities remained steady as reflected by further capacity expansion in the petrochemical manufacturing and oil storage facilities. The overall investment performance continued to be supported by the progress of new
and ongoing projects in the manufacturing and services sectors.
Overall investment activity moderated due to slower growth in private sector capital expenditure
Investment in the manufacturing sector (24% share of private investment) expanded further, supported mainly by the export-oriented industries which benefited from the continued demand of manufactured exports. The manufacturing investment approved by MIDA in 2015 remained high at RM74.7 billion (2014: RM71.9 billion), with projects mainly in the petrochemical, natural gas and E&E sub-sectors.
In the services sector (51% share of private investment), investment was underpinned by capital expenditure in the distributive trade, transport and storage, and tourism-related sub-sectors. This was reflected in the rapid pace of development within the regional corridors, such as the Iskandar region (i.e. oil and gas terminals, and healthcare services). Investment in telecommunication services was supported by the ongoing network expansion and infrastructure upgrades nationwide for the rollout of 4G/LTE networks by major telecommunication service providers. Dwellings investment, however, registered a modest expansion in line with the slower residential construction activity.
Public investment registered negative growth in the first half of 2015 following the near completion of several large projects that were undertaken by the public corporations. However, public investment turned around to register a positive growth in the second half of the year due to higher spending on
production and low-skilled workers remained high, as evidenced by the number of registered foreign workers, which increased to 2.14 million workers (2014: 2.07 million workers). The agriculture and construction sectors registered the highest dependence on foreign labour.
Labour productivity, as measured by real value-added per worker, grew by 3.2% (2014: 3.5%), driven mainly by productivity increases in the manufacturing sector (7.0%; 2014: 3.8%). Labour productivity growth in the construction and services sectors, however, were modest at 3.6% and 2.4%, respectively (2014: 13.4% and 2.5%).
(continued on page 44)

AN
NU
AL R
EPOR
T 2015EC
ON
OM
IC D
EVELO
PMEN
TS IN 2015
282
Investment in the Export-Oriented Industries in Malaysia
IntroductionOver the past decade, Malaysia has successfully attracted large amounts of investment into the export-oriented industries, producing not only a wide range of products but also integrating Malaysia into the global supply chain. Investment in the export sector has been a key success factor in ensuring that Malaysia’s manufactured exports remain competitive in a changing global environment and that the Malaysian economy progressively moves towards high value-added activity. This article looks at the major trends of investments in the export-oriented industries in Malaysia.
Overview of export-oriented industries in the economyInvestment in Malaysia is concentrated in the manufacturing and services sectors (75% of gross fi xed capital formation (GFCF)). Total investment comprises of investment in both the export-oriented and domestic-oriented activities.
Chart 1 provides the export orientation of different sectors within the economy. Broadly, the agriculture, mining and manufacturing sectors are mostly export-oriented, while the construction and services sectors are largely domestic-oriented. Within the manufacturing sector, the export-oriented industries include those involved in the production of electronic and electrical (E&E), petroleum, chemical, rubber, plastic, fabricated metal, iron and steel products. In the services sector, whilst most of the economic activity is related to supporting domestic activity, the logistics, information and communication, as well as distributive trade industries (particularly wholesale trade), also cater to the export sector.
Export Orientation of Selected Industries in Malaysia
Source: Department of Statistics, Malaysia and Bank Negara Malaysia estimates
Note:1 Calculated based on the proportion of an industry’s value-added that is exported using the 2010 Input-Output table. If more than 50% of an industry’s value-added is exported, it is classified as export-oriented; otherwise it is classified as domestic-oriented.2 Primary-related products refer to textiles, wood, petroleum, chemical, rubber and plastic products, while construction-related products refer to non-metallic, basic metal and fabricated metal products.
0% 50% 100%
Sector/industry(% share of GDP, 2015)
Share of value-added used directly orindirectly for exports or domestically1
13%Construction (4.4%)
Chart 1
Exports
Transport, storage and communication 54%
Wholesale and retail trade 64%
Services (53.5%) 41%
Construction-related products 68%
Primary-related2 products 69%
E&E-related products 96%
Manufacturing (23.0%) 74%
Agriculture (8.8%) 61%
Mining (8.9%) 78%
Domestic

AN
NU
AL
REP
OR
T 20
15EC
ON
OM
IC D
EVEL
OPM
ENTS
IN 2
015
29 3
Investment trends for the export-oriented industries Overall, investments in the export-oriented industries account for an estimated amount of 59% of total GFCF in 2014 (see Chart 2). In the manufacturing sector, investments in the export-oriented industries constitute 87% of total manufacturing investment and 16% of GFCF. These export-oriented manufacturing activities are key to ensuring that Malaysia remains fi rmly plugged into the supply chain of high value-added products such as solar components and the semiconductors that are used in the automotive, consumer electronics and cloud computing businesses.
In the services sector, investments in the export-oriented industries represent 35% of services investment and 20% of total GFCF. These investments include, among others, capital spending for the expansion of port facilities, upgrading of logistics equipment and warehousing facilities, as well as the construction of oil and gas storage terminals.
While the growth of investment in the mining sector has been moderating, investments in the export-oriented manufacturing and services industries have recorded strong growth, averaging above 8% from 2011 to 2014 (see Table 1). For the manufacturing sector, investment was driven mainly by capital expenditure in the primary-related and E&E sub-sectors (2011-2014 average growth: 13.6% and 5.6%, respectively). During the same period, investment in the export-oriented services sector was
Chart 2
Percentage Share of GFCF by Economic Activity, 2014
Source: Department of Statistics, Malaysia and Bank Negara Malaysia estimates
Construction1.7%
Export-oriented59.1%
Domestic-oriented40.9%
E&E-related6.9%
Primary-related 6.9%
Construction-related, 1.7%
Wholesale and retail trade, 4.6%
Transport, storage, information and communication
15.4%
Services36.9%
Mining20.2%
Services20.0%
Agriculture3.4%
Manufacturing2.3%
Manufacturing15.5%
1
Table 1
Growth of GFCF in the Manufacturing and Services Sectors
Sectors and sub-sectorsAverage growth
(2011-2014)
Manufacturing 8.3
E&E-related 5.6
Primary-related 13.6
Construction-related -1.8
Services 8.0
Wholesale and retail trade 9.5
Transport and communication 11.1
Overall GFCF 9.6
Source: Department of Statistics, Malaysia and Bank Negara Malaysia estimates

AN
NU
AL R
EPOR
T 2015EC
ON
OM
IC D
EVELO
PMEN
TS IN 2015
30 5
and medical devices, and advanced logistic services, are expected to progress further. These industries would also benefi t from the modest growth in the global economy. This sustained investment will enable the manufacturing and services sectors to move up higher on the value chain and ensure that Malaysia’s exports remain globally competitive.
Export-oriented Manufacturing Focus Across Regional Corridors
Corridor Areas of focus Examples of products
Northern Corridor Economic Region (NCER) E&E and biotechnology• Medical devices• Automotive sensors• Oleochemicals
East Coast Economic Region (ECER) Heavy industry and automotive• Metal products• Automotive components
Iskandar Malaysia Downstream oil and gas• Petrochemical products• Oil and gas refi nery
Sarawak Corridor of Renewable Energy (SCORE) Resource-based products• Aluminium and glass products• Steel products
Sabah Development Corridor (SDC) Resource-based products • Palm oil products
Source: Regional Corridor Authorities
Table 2
4
undertaken mainly by the transport and communications sub-sectors (2011-2014 average growth: 11.1%) to build new infrastructure and upgrade existing equipment.
Continued focus on promoting investment in the export-oriented industriesContinuous efforts by the Government in promoting investment in various export-oriented industries, such as aerospace, E&E, medical equipment and renewable energy, have contributed towards signifi cant progress in these strategic areas. The success of these efforts can be seen in the increase of investments approved in the export-oriented manufacturing industries, mainly in the E&E, petroleum and petrochemical sub-sectors (see Chart 3). This includes investment by manufacturers of semiconductors, solar panels, aircraft components and petrochemical-based products such as resins, polymers and construction chemicals.
Chart 3
Investment Approvals for the Export-orientedManufacturing Sector
Source: Malaysian Investment Development Authority (MIDA) and Bank Negara Malaysia estimates
Petroleum, natural gas and chemicalproducts
E&E-related products
Machinery and equipment Other exports
7.6 12.5 12.0
26.7
39.720.14.0
9.8
11.1
8.9
1.2
2.83.3
4.3
2.6
14.8
9.6
13.4
17.510.4
0
10
20
30
40
50
60
70
2011 2012 2013 2014 2015
RM billion
43.6 28.9 38.5 59.6 61.6
Similarly, in the services sector, further progress has been made in successfully attracting investments to logistic services and in establishing Malaysia as a global and regional operations hub for large multinational corporations (MNCs). In 2014, 234 global corporations were approved to set up operation in Malaysia, with another 224 approvals in 20151.
Investment strategically dispersed across regionsIn the 1980s and 1990s, investment in the export-oriented industries was mainly concentrated in industrial areas located within the Klang Valley, Penang and Johor. However, following strategic measures such as the promotion of regional growth corridors, these export-oriented investment projects are increasingly more geographically dispersed across the nation (see Table 2). These corridors have attracted key investment projects in niche areas and helped to further boost Malaysia’s exports. For instance, the Northern Corridor Economic Region (NCER) has attracted several large MNCs producing higher value-added products such as medical devices and semiconductors for sensors. Similarly, the Iskandar region has attracted investments in E&E manufacturing, as well as in oil and gas storage facilities.
ConclusionDespite the challenges faced by the global economy, ongoing multi-year investments in the export-oriented industries are expected to continue. In particular, investment by industries in the advanced manufacturing and modern services sectors, including manufacturers of automotive sensors
1 Source: Malaysian Investment Development Authority (MIDA)

AN
NU
AL
REP
OR
T 20
15EC
ON
OM
IC D
EVEL
OPM
ENTS
IN 2
015
31 5
and medical devices, and advanced logistic services, are expected to progress further. These industries would also benefi t from the modest growth in the global economy. This sustained investment will enable the manufacturing and services sectors to move up higher on the value chain and ensure that Malaysia’s exports remain globally competitive.
Export-oriented Manufacturing Focus Across Regional Corridors
Corridor Areas of focus Examples of products
Northern Corridor Economic Region (NCER) E&E and biotechnology• Medical devices• Automotive sensors• Oleochemicals
East Coast Economic Region (ECER) Heavy industry and automotive• Metal products• Automotive components
Iskandar Malaysia Downstream oil and gas• Petrochemical products• Oil and gas refi nery
Sarawak Corridor of Renewable Energy (SCORE) Resource-based products• Aluminium and glass products• Steel products
Sabah Development Corridor (SDC) Resource-based products • Palm oil products
Source: Regional Corridor Authorities
Table 2

AN
NU
AL R
EPOR
T 2015EC
ON
OM
IC D
EVELO
PMEN
TS IN 2015
32
Moderate Growth in Major Economic Sectors
On the supply side, all major economic sectors registered a more moderate pace of growth in 2015, attributable mainly to the slower domestic demand. However, growth in external demand, particularly from the advanced economies, had benefited the export-oriented manufacturing industries and trade-related services sub-sectors.
The services sector expanded at a more moderate pace of 5.1% in 2015 (2014: 6.5%). Growth was weighed down by a moderation in the consumption-related sub-sectors and a contraction in the finance and insurance sub-sector. Growth in the consumption-related sub-sectors, particularly the retail and motor vehicles segments, moderated in line with the slower growth in household spending. The finance and insurance sub-sector registered a small contraction, due mainly to lower fee-based income caused mainly by the weaker capital market activity; and lower insurance premium growth during the year. In contrast, the information and communication sub-sector remained robust, driven by strong demand for data communication services. Growth was further supported by better performance of the wholesale segment and the transportation & storage sub-sector, which benefited from the improvement in trade-related activity.
The manufacturing sector expanded by 4.9% in 2015 (2014: 6.2%), attributable mainly to the continued strength of the export-oriented industries. The performance of the export-oriented industries was primarily driven by strong production growth in the E&E cluster, particularly in the consumer-based electrical segment and selected semiconductor components. Growth was further supported by the primary-related cluster due mainly to sustained regional demand for chemical products. The domestic-oriented industries, however, moderated mainly as a result of slower growth in the consumer-related cluster.
The construction sector grew at a moderate pace in 2015 (8.2%; 2014: 11.8%), due mainly to the slower growth in the residential sub-sector. Construction activity in the residential sub-sector was affected by fewer property launches during the year. Nonetheless, growth in the civil engineering sub-sector picked up, reflecting the progress of existing infrastructure projects as well as the commencement of a large petrochemical project in Johor. Growth in the construction sector was also supported by the non-residential sub-sector, which was underpinned by projects in both the industrial and commercial property segments.
In the agriculture sector, growth moderated to 1.0% (2014: 2.1%) due to lower crude palm oil (CPO) output following unfavourable weather conditions. This includes excessive rains in the first quarter of 2015, causing floods in the east coast of Peninsular Malaysia, and the strong haze and El Nino weather phenomenon in the second half of the year, which led to lower yields.
The mining sector recorded a higher growth of 4.7% (2014: 3.3%) as a result of higher production of crude oil (654,200 barrels per day, the highest since 2010). This was driven by new output from the large Gumusut Kakap deepwater oilfield at offshore Sabah, which commenced operations in the fourth quarter of 2014.
Chart 1
Real GDP by Economic Activity
p Preliminary
Source: Department of Statistics, Malaysia
Manufacturing
Mining and quarrying
Contribution to growth (percentage points)
Services Agriculture
Construction
-1
0
1
2
3
4
5
6
2011 2012 2013 2014 2015p

AN
NU
AL
REP
OR
T 20
15EC
ON
OM
IC D
EVEL
OPM
ENTS
IN 2
015
33A
NN
UA
L R
EPO
RT
2015
ECO
NO
MIC
DEV
ELO
PMEN
TS IN
201
5
Assessing Demand-Supply Conditions in the Malaysian Property Market
IntroductionThe Malaysian property market is characterised by unevenness across its sub-segments in recent times, with demand outstripping supply in the housing market, while the offi ce and retail markets are experiencing oversupply. The rapid increase in house prices, particularly in the major urban centres, has been attributable partly to a shortfall in supply. The shortage is particularly evident in the supply of affordable housing. This has increasingly priced out more urban Malaysian households from the housing market. In contrast, the increase in the construction of offi ce buildings and retail malls, particularly in major cities, has raised the potential of overbuilding of commercial properties that could adversely impact the real estate market. This article identifi es the current demand-supply dynamics and the outlook in three property segments in Malaysia – housing, offi ce and retail, with a focus on the key states1 (Kuala Lumpur, Selangor, Johor and Pulau Pinang) and seeks to highlight lessons from the experiences of other countries.
Shortage of supply in the affordable housing marketSince 2005, Malaysia’s housing stock has increased by 35%. Despite this substantial growth, the shortage of housing supply at the national level has persisted. The gap between the housing stock and the number of households widened to 2.5 million units in 2015 from 2.1 million units in 20052 (Chart 1). The worsening shortfall in housing supply refl ected the mismatch between the pace of growth in the supply of new houses and the net increase in the number of households3, particularly in the past fi ve years. Between 2005 and 2008, the number of new houses completed averaged 166,876 units annually, while the number of households increased by about 117,250, implying a surplus supply of housing units of about 49,626 units per year. Over the past fi ve years, however, the annual completion of houses has declined considerably to 80,089 units, far below the 166,000 average net increase in the number of households annually4. This suggests an average shortage of 85,911 housing units per year between 2011 and 2015 (Chart 2).
1 Key states refer to the major employment centres in Malaysia.2 The estimate assumes that all households are looking to own and are able to afford a house. Currently, there are about
two houses for every three households, suggesting some accommodation sharing among households, which underpins the demand for house ownership.
3 This refers to the increase in the number of households at one point in time versus another point in time (i.e. new household formation minus household dissolution through one or two heads of households joining into a single household and/or through the death of a single-person head of household).
4 The lower house-building activity refl ects partly lower property launches and sales by developers.
Chart 1 Chart 2
Widening Housing Supply Shortfall over thepast Decade…
…as New Housing Supply was Unable to MatchIncrease in Number of Households over thepast Five Years
*Housing supply gap = Housing stock – Outstanding number of households OR Completion of new houses – Net increase in number of households
A negative figure suggests a shortfall in housing supply
Source: National Property Information Centre, CEIC and Bank Negara Malaysia estimates
-2.1 -2.5
5.7
7.4
3.7
4.9
-4
-2
0
2
4
6
8
2005 2006 2007 2008 2009 2010 2011 2012 2013 2014 2015
Million
Number of households
Housing stock
Housing supply gap*
117
166167
80
50
-86
-100
-50
0
50
100
150
200
2005-2008 avg. 2011-2015 avg.
'000
Net increase in number of households Completion of new houses
Housing supply gap*

AN
NU
AL R
EPOR
T 2015EC
ON
OM
IC D
EVELO
PMEN
TS IN 2015
34A
NN
UA
L REPO
RT 2015
ECO
NO
MIC
DEV
ELOPM
ENTS IN
2015
5 The oversupply of higher-end residential property is evident particularly in some areas in the key states and in selected property segments (i.e. luxury condominiums).
6 Houses priced from RM540,000 are considered affordable for households earning at least RM15,000 a month (5.4% of Malaysia’s total population in 2014).
7 Another contributing factor to the rapid increase in house prices over the past few years was the use of marketing tools by developers and low real property gains tax (RPGT) rates. For example, the Developer Interest-Bearing Scheme (DIBS) not only artifi cially infl ated property prices, but also encouraged speculators to enter the property market with very small capital outlays. In November 2013, DIBS was prohibited by Bank Negara Malaysia, along with the introduction of more punitive RPGT rates by the Government.
8 The Compound Annual Growth Rate (CAGR) is the average annual growth rate over a specifi ed period of time.
The shortage in housing supply has been particularly acute in the affordable housing category. In 2014, half of Malaysian households earned a monthly income of RM4,585 and below. According to the ``Median Multiple´´ methodology developed by Demographia International and recommended by the World Bank and the United Nations to evaluate urban housing markets, a house is considered affordable if a household can fi nance it with less than three times its annual household income (house price-to-income ratio of 3.0 and below). This suggests that houses priced up to RM165,060 are considered affordable to a median Malaysian household. However, only 21% of new housing launches in Malaysia were priced below RM250,000 in 2014. In contrast, the data points to an oversupply of higher-end properties5 priced above RM500,000. Although property launches in this price category accounts for 36% of total new launches in Malaysia, these houses are only within the reach of 5.4% of the population according to the same methodology6 (Chart 3). While affordable housing initiatives by the Federal and State Governments, Syarikat Perumahan Negara Berhad (SPNB) and Perumahan Rakyat 1Malaysia (PR1MA) have gathered some momentum, the current level of house-building in the affordable housing segment has not been suffi cient to meet the demand. Nonetheless, a substantial amount of affordable housing units built by these initiatives are currently under various stages of construction.
The imbalance between demand and supply, particularly in the affordable housing segment, has contributed to a rapid increase in house prices7. This has compounded housing affordability issues, particularly for the low- and middle-income population. Between 2009 and 2014, average house prices in Malaysia rose by 7.9% in CAGR8 terms, exceeding the growth in average household income of 7.3% over the same period. This contrasts sharply with the period in 2004 to 2007 when incomes were rising more than the growth of house prices (Chart 4). With an uneven pace of growth between house prices and income, the affordability of houses across the key states in Malaysia has progressively declined. Houses in Malaysia, on aggregate, were
Chart 3
Since 2010, New Launches in Malaysia Have BeenIncreasingly Skewed towards Houses Pricedabove RM500,000
Source: National Property Information Centre
0
25
50
75
100
2008 2011 2014
RM250,000 - RM500,000
Above RM500,000
'000 units
72%42% 21%
19%34% 43%
9% 24%
36%
Less than RM250,000
Chart 4
House Prices Have Grown at a Faster Pace thanIncome Levels
Source: National Property Information Centre and Department of Statistics, Malaysia Household Income and Basic Amenities Survey Reports
2.5
7.9
3.2
7.3
0
2
4
6
8
10
2004-2007 2009-2014
Average house prices Average household income
CAGR, %
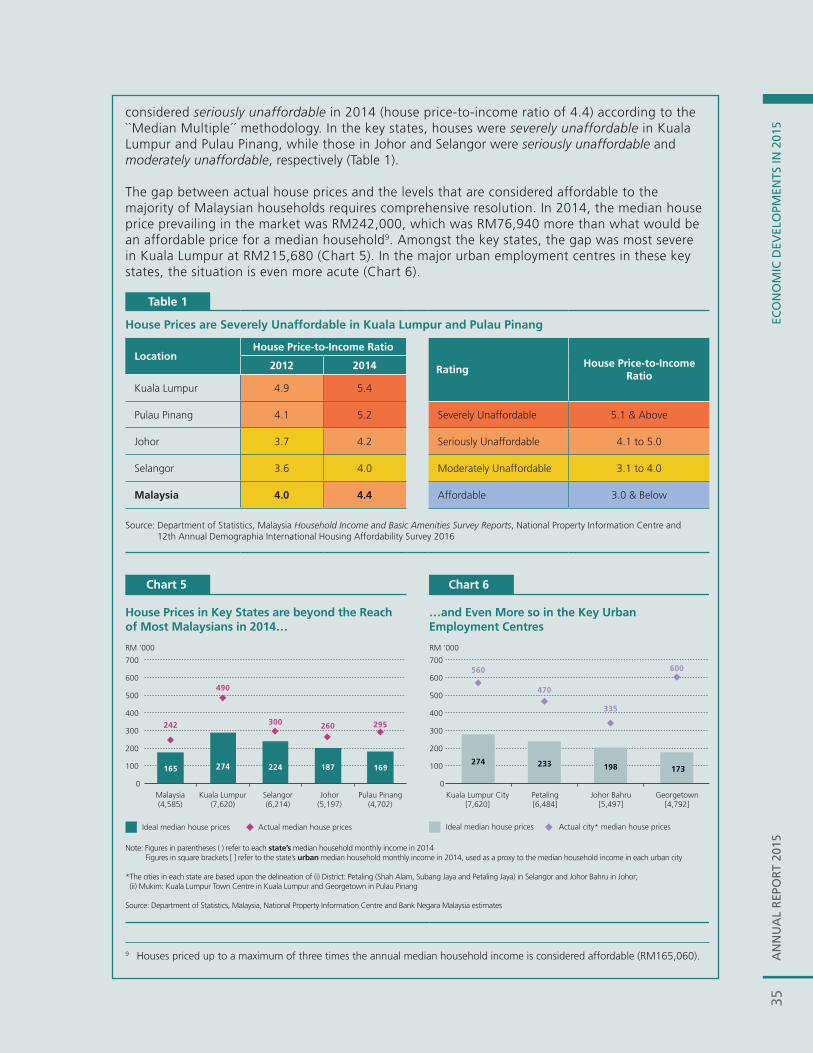
AN
NU
AL
REP
OR
T 20
15EC
ON
OM
IC D
EVEL
OPM
ENTS
IN 2
015
35A
NN
UA
L R
EPO
RT
2015
ECO
NO
MIC
DEV
ELO
PMEN
TS IN
201
5
9 Houses priced up to a maximum of three times the annual median household income is considered affordable (RM165,060).
House Prices are Severely Unaffordable in Kuala Lumpur and Pulau Pinang
LocationHouse Price-to-Income Ratio
RatingHouse Price-to-Income
Ratio2012 2014
Kuala Lumpur 4.9 5.4
Pulau Pinang 4.1 5.2 Severely Unaffordable 5.1 & Above
Johor 3.7 4.2 Seriously Unaffordable 4.1 to 5.0
Selangor 3.6 4.0 Moderately Unaffordable 3.1 to 4.0
Malaysia 4.0 4.4 Affordable 3.0 & Below
Source: Department of Statistics, Malaysia Household Income and Basic Amenities Survey Reports, National Property Information Centre and 12th Annual Demographia International Housing Affordability Survey 2016
Table 1
considered seriously unaffordable in 2014 (house price-to-income ratio of 4.4) according to the ``Median Multiple´´ methodology. In the key states, houses were severely unaffordable in Kuala Lumpur and Pulau Pinang, while those in Johor and Selangor were seriously unaffordable and moderately unaffordable, respectively (Table 1).
The gap between actual house prices and the levels that are considered affordable to the majority of Malaysian households requires comprehensive resolution. In 2014, the median house price prevailing in the market was RM242,000, which was RM76,940 more than what would be an affordable price for a median household9. Amongst the key states, the gap was most severe in Kuala Lumpur at RM215,680 (Chart 5). In the major urban employment centres in these key states, the situation is even more acute (Chart 6).
Chart 5
House Prices in Key States are beyond the Reachof Most Malaysians in 2014…
Note: Figures in parentheses ( ) refer to each state’s median household monthly income in 2014 Figures in square brackets [ ] refer to the state’s urban median household monthly income in 2014, used as a proxy to the median household income in each urban city
*The cities in each state are based upon the delineation of (i) District: Petaling (Shah Alam, Subang Jaya and Petaling Jaya) in Selangor and Johor Bahru in Johor; (ii) Mukim: Kuala Lumpur Town Centre in Kuala Lumpur and Georgetown in Pulau Pinang
Source: Department of Statistics, Malaysia, National Property Information Centre and Bank Negara Malaysia estimates
165274 224 187 169
Malaysia(4,585)
Kuala Lumpur(7,620)
Selangor(6,214)
Johor(5,197)
Pulau Pinang(4,702)
Ideal median house prices Actual median house prices
Chart 6
…and Even More so in the Key UrbanEmployment Centres
Ideal median house prices Actual city* median house prices
274 233 198 173
0
100
200
300
400
500
600
700
Kuala Lumpur City[7,620]
Petaling[6,484]
Johor Bahru[5,497]
Georgetown[4,792]
RM '000
0
100
200
300
400
500
600
700
RM '000
165 274 224 187 169
242
490
300 260 295
274 233 198 173
560
470
335
600

AN
NU
AL R
EPOR
T 2015EC
ON
OM
IC D
EVELO
PMEN
TS IN 2015
36A
NN
UA
L REPO
RT 2015
ECO
NO
MIC
DEV
ELOPM
ENTS IN
2015Moving forward, a substantial increase in the supply of affordable housing is necessary. An estimated 202,571 new houses12 will be required annually between 2016 and 2020 to match the estimated growth in households during this period, approximately 2.5 times the number of houses built annually
10 Alfelt, Gustav, et.al. (2015). There is no general defi nition of how a debt-to-income limit should be designed and its effects can vary depending on its construction. For example, a debt-to-income limit can be introduced to either target individual households or the banks’ lending stock. Furthermore, the defi nition of debt and income may differ across countries.
11 The loan size is based on 30% housing debt service ratio* (using income net of statutory deductions), 35-year loan tenure, housing loan-to-value ratio of 90% and lending rate of 5%.
12 The estimate refl ects a continuation of historical trends in terms of household formation and the capacity of households to exercise choice in owning a house. Net household growth is thus assumed to continue to expand at its long-term average (between 2005 and 2015) of 2.6% annually between 2016 and 2020.
* Most young buyers tend to be indebted with existing debt obligations (i.e. car loan, outstanding credit card repayments), implying a lesser amount of disposable income that can be allocated for a housing loan.
Information Box: Housing Loan Affordability
The assessment of housing affordability can alternatively be measured by the households’ ability to service mortgage loans using their income. The debt-to-income measure, which has been increasingly adopted by a number of countries with high household debt levels, establishes an upper limit to a household’s total loan in relation to its disposable income10. In this approach, we compare the maximum loan11 amount that a bank can extend to a median household against the actual median house prices. The results concur with our fi ndings using the ``Median Multiple´´ approach.
A median household in Kuala Lumpur and Penang has insuffi cient capacity to service a mortgage loan based on the median house prices in these areas (Chart A). In the key urban employment centres, that capacity is even less (Chart B).
Chart A
House Prices in Kuala Lumpur and Penang areUnaffordable to a Median Household
Max. affordables house prices Actual median house prices Max. affordables house prices Actual city* median house prices
261
404 342293 267
242
490
300260
295
0
Malaysia(4,585)
Kuala Lumpur(7,620)
Selangor(6,214)
Johor(5,197)
Pulau Pinang(4,702)
RM '000
Note: Figures in parentheses ( ) refer to each state’s median household monthly income in 2014 Figures in square brackets [ ] refer to the state’s urban median household monthly income in 2014, used as a proxy to the median household income in each urban city
* The cities in each state are based upon the delineation of (i) District: Petaling (Shah Alam, Subang Jaya and Petaling Jaya) in Selangor and Johor Bahru in Johor, (ii) Mukim: Kuala Lumpur Town Centre in Kuala Lumpur and Georgetown in Pulau Pinang
Source: Department of Statistics, Malaysia, National Property Information Centre and Bank Negara Malaysia estimates
Chart B
Even More Severe Situation in the Key UrbanEmployment Centres
404 356308 272
560
470
335
600
0
100
200
300
400
500
600
700
100
200
300
400
500
600
700
Kuala Lumpur City[7,620]
Petaling[6,484]
Johor Bahru[5,497]
Georgetown[4,792]
RM '000
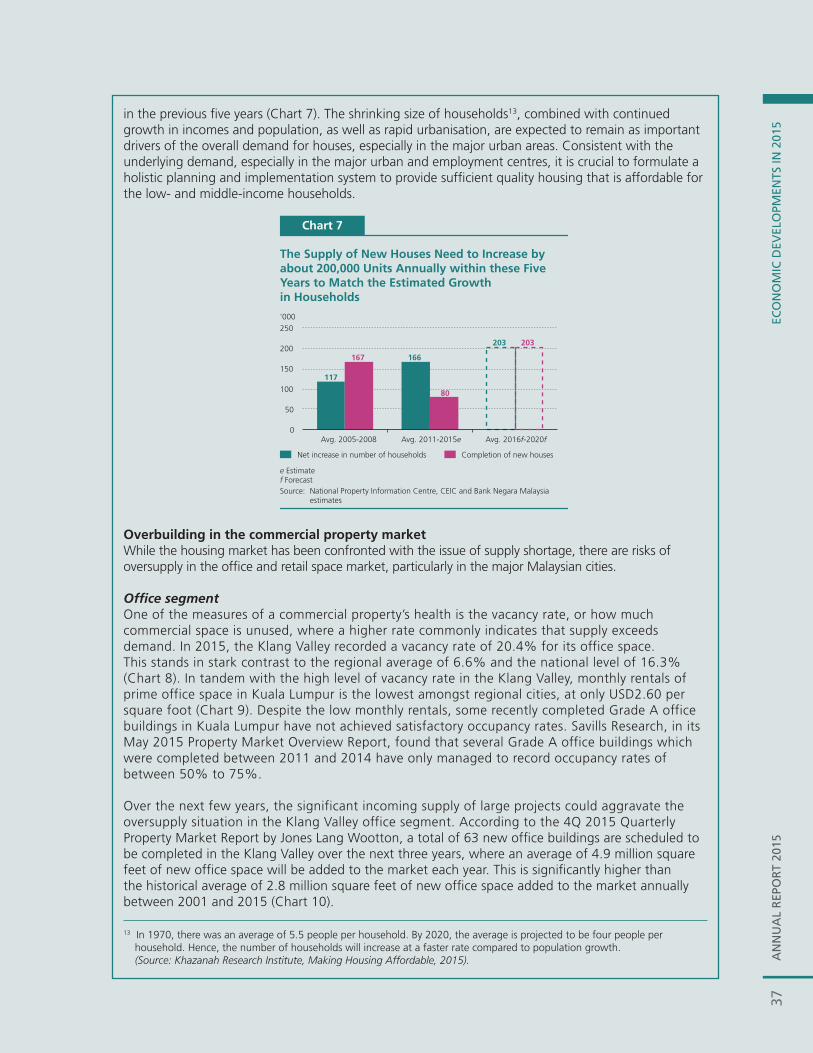
AN
NU
AL
REP
OR
T 20
15EC
ON
OM
IC D
EVEL
OPM
ENTS
IN 2
015
37A
NN
UA
L R
EPO
RT
2015
ECO
NO
MIC
DEV
ELO
PMEN
TS IN
201
5
Overbuilding in the commercial property marketWhile the housing market has been confronted with the issue of supply shortage, there are risks of oversupply in the offi ce and retail space market, particularly in the major Malaysian cities.
Offi ce segmentOne of the measures of a commercial property’s health is the vacancy rate, or how much commercial space is unused, where a higher rate commonly indicates that supply exceeds demand. In 2015, the Klang Valley recorded a vacancy rate of 20.4% for its office space. This stands in stark contrast to the regional average of 6.6% and the national level of 16.3% (Chart 8). In tandem with the high level of vacancy rate in the Klang Valley, monthly rentals of prime office space in Kuala Lumpur is the lowest amongst regional cities, at only USD2.60 per square foot (Chart 9). Despite the low monthly rentals, some recently completed Grade A office buildings in Kuala Lumpur have not achieved satisfactory occupancy rates. Savills Research, in its May 2015 Property Market Overview Report, found that several Grade A office buildings which were completed between 2011 and 2014 have only managed to record occupancy rates of between 50% to 75%.
Over the next few years, the significant incoming supply of large projects could aggravate the oversupply situation in the Klang Valley office segment. According to the 4Q 2015 Quarterly Property Market Report by Jones Lang Wootton, a total of 63 new offi ce buildings are scheduled to be completed in the Klang Valley over the next three years, where an average of 4.9 million square feet of new offi ce space will be added to the market each year. This is signifi cantly higher than the historical average of 2.8 million square feet of new offi ce space added to the market annually between 2001 and 2015 (Chart 10).
Chart 7
The Supply of New Houses Need to Increase byabout 200,000 Units Annually within these FiveYears to Match the Estimated Growthin Households
Source: National Property Information Centre, CEIC and Bank Negara Malaysia estimates
117
166
203
167
80
203
0
50
100
150
200
250
Avg. 2005-2008 Avg. 2011-2015e Avg. 2016f-2020f
Net increase in number of households Completion of new houses
'000
e Estimatef Forecast
in the previous fi ve years (Chart 7). The shrinking size of households13, combined with continued growth in incomes and population, as well as rapid urbanisation, are expected to remain as important drivers of the overall demand for houses, especially in the major urban areas. Consistent with the underlying demand, especially in the major urban and employment centres, it is crucial to formulate a holistic planning and implementation system to provide suffi cient quality housing that is affordable for the low- and middle-income households.
13 In 1970, there was an average of 5.5 people per household. By 2020, the average is projected to be four people per household. Hence, the number of households will increase at a faster rate compared to population growth.
(Source: Khazanah Research Institute, Making Housing Affordable, 2015).

AN
NU
AL R
EPOR
T 2015EC
ON
OM
IC D
EVELO
PMEN
TS IN 2015
38A
NN
UA
L REPO
RT 2015
ECO
NO
MIC
DEV
ELOPM
ENTS IN
2015
Retail segmentSigns of oversupply are also emerging in the retail segment in the major Malaysian urban areas, particularly in Pulau Pinang, Johor and the Klang Valley. Although the vacancy rates in some of these areas have been improving in recent years, the vacancy rates of between 12.4% in the Klang Valley to 28.2% in Pulau Pinang remain relatively higher compared to other regional economies (Chart 11). The high vacancy rate is symptomatic of a mismatch between the demand and supply for shopping malls in Malaysia’s major cities. As an illustration, Johor Bahru, Pulau Pinang and the Klang Valley have amongst the lowest household income and population levels compared to other regional cities (Chart 12). However, the prime retail space per capita in these Malaysian cities is notably higher than in the more populous regional cities such as Shanghai and Beijing, and also those with higher incomes, such as Singapore and Hong Kong (Chart 13).
Chart 10
Klang Valley Office Supply to Increase Significantly between 2016 and 2018
*New supply in 2016-2018 does not include Tun Razak Exchange, Bukit Bintang City Centre and Bandar Malaysia
Source: National Property Information Centre, Jones Lang Wootton and Bank Negara Malaysia estimates
New supply* (LHS)
f Forecast
0
5
10
15
20
25
30
2.0
2.5
3.0
3.5
4.0
4.5
5.0
5.5
1996
1997
1998
1999
2000
2001
2002
2003
2004
2005
2006
2007
2008
2009
2010
2011
2012
2013
2014
2015
2016
f
2017
f
2018
f
Avg. (2001-2015): 2.8 mn sqft
Avg.(2016f-2018f): 4.9 mn sqft
1997:5.1%
1998:20.1%
2001:25.3%
2015:20.4%
Mn sqft %
Avg. (1991-2000): 5.3 mn sqft
Vacancy Rate (RHS)
Chart 9
…and Monthly Rental is the Lowest amongstRegional Cities
Chart 8
Vacancy Rate in Klang Valley is Substantially HigherCompared to National and Regional Averages…
Note: *Regional average refers to simple average for Shanghai, Beijing, Bangkok, Hong Kong and Singapore in 2Q 2015 Source: National Property Information Centre and Colliers International
20.4
10.8
16.3
-10
-5
0
5
10
15
20
25
30
1991 1995 1999 2003 2007 2011 2015
Malaysia
Klang Valley
Other states
Regional average*: 6.6
%
19.8
11.6
8.5 8.4
5.84.7 4.6 3.6 3.0 2.6
0
4
8
12
16
20
Hon
g K
ong
Beiji
ng
Sing
apor
e
Shan
gha
i
Seou
l
Taip
ei
Ho
Chi
Min
h C
ity
Jaka
rta
Han
oi
Man
ila
Kua
la L
umpu
r
Regional average: 8.1
USD/sqft, June 2015
Source: Savills Research
10.6
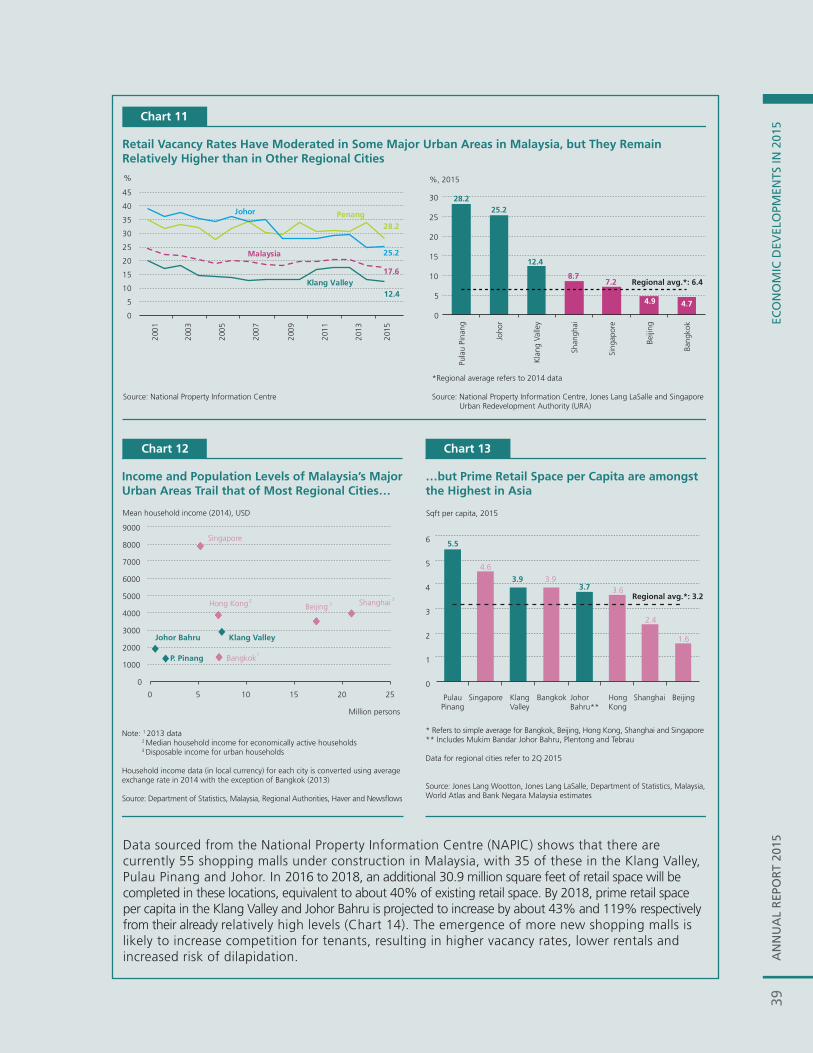
AN
NU
AL
REP
OR
T 20
15EC
ON
OM
IC D
EVEL
OPM
ENTS
IN 2
015
39A
NN
UA
L R
EPO
RT
2015
ECO
NO
MIC
DEV
ELO
PMEN
TS IN
201
5
Data sourced from the National Property Information Centre (NAPIC) shows that there are currently 55 shopping malls under construction in Malaysia, with 35 of these in the Klang Valley, Pulau Pinang and Johor. In 2016 to 2018, an additional 30.9 million square feet of retail space will be completed in these locations, equivalent to about 40% of existing retail space. By 2018, prime retail space per capita in the Klang Valley and Johor Bahru is projected to increase by about 43% and 119% respectively from their already relatively high levels (Chart 14). The emergence of more new shopping malls is likely to increase competition for tenants, resulting in higher vacancy rates, lower rentals and increased risk of dilapidation.
Chart 11
Retail Vacancy Rates Have Moderated in Some Major Urban Areas in Malaysia, but They RemainRelatively Higher than in Other Regional Cities
*Regional average refers to 2014 data
28.225.2
12.4
8.77.2
4.9 4.7
0
5
10
15
20
25
30
Pula
u Pi
nang
Joho
r
Kla
ng V
alle
y
Shan
ghai
Sing
apor
e
Beiji
ng
Bang
kok
Regional avg.*: 6.4
%, 2015
12.4
28.2
25.2
17.6
0
5
10
15
20
25
30
35
40
45
200
1
200
3
200
5
200
7
200
9
201
1
201
3
201
5
Klang Valley
Johor Penang
Malaysia
%
Source: National Property Information Centre Source: National Property Information Centre, Jones Lang LaSalle and Singapore Urban Redevelopment Authority (URA)
Chart 12
Income and Population Levels of Malaysia’s MajorUrban Areas Trail that of Most Regional Cities…
Mean household income (2014), USD
0
1000
2000
3000
4000
5000
6000
7000
8000
9000
0 5 10 15 20 25
Shanghai 3
Beijing 3
Singapore
Hong Kong2
Bangkok1
P. Pinang
Million persons
Klang ValleyJohor Bahru
Note: 1 2013 data 2 Median household income for economically active households 3 Disposable income for urban households
Household income data (in local currency) for each city is converted using averageexchange rate in 2014 with the exception of Bangkok (2013)
Source: Department of Statistics, Malaysia, Regional Authorities, Haver and Newsflows
Chart 13
…but Prime Retail Space per Capita are amongstthe Highest in Asia
* Refers to simple average for Bangkok, Beijing, Hong Kong, Shanghai and Singapore** Includes Mukim Bandar Johor Bahru, Plentong and Tebrau
Data for regional cities refer to 2Q 2015
Source: Jones Lang Wootton, Jones Lang LaSalle, Department of Statistics, Malaysia,World Atlas and Bank Negara Malaysia estimates
Sqft per capita, 2015
5.5
4.6
3.9 3.93.7 3.6
2.4
1.6
0
1
2
3
4
5
6
PulauPinang
Singapore KlangValley
Bangkok JohorBahru**
HongKong
Shanghai Beijing
Regional avg.*: 3.2

AN
NU
AL R
EPOR
T 2015EC
ON
OM
IC D
EVELO
PMEN
TS IN 2015
40A
NN
UA
L REPO
RT 2015
ECO
NO
MIC
DEV
ELOPM
ENTS IN
2015
Oversupply of commercial space may have potential spillover impact on other sectors in the economyThe currently challenging economic conditions could pose additional risks to the demand for commercial space. In the office segment, a prolonged period of low global oil prices would dampen the demand for office space of the oil and gas sector. In the Klang Valley, the oil and gas sector is the largest private sector office-occupier, filling up about 16% of total office space (Jones Lang Wootton, 2015). In the retail segment, the ability of retailers to attract footfall and consumer spending could become more challenging amid weaker consumer sentiments.
The implications of a significant rise in vacancy rates could extend beyond the commercial property sector, with likely spillovers to other sectors of the economy (Chart 15). A sharp increase in vacancy rates may result in tighter cash-flow conditions amongst developers, which are typically owners of commercial properties. This could have adverse consequences for other sub-sectors within the construction sector and other related industries14. Further weakness in these related sectors could potentially affect employment prospects, impacting the ability of some households to service their loans.
In several countries, the disorderly unravelling of commercial property booms had resulted in considerable bank loan losses. In the early 1990s, Sweden, Finland, Norway and Japan experienced an abrupt and severe unwinding of commercial property booms. This had resulted in severe spillovers on other economic sectors in these economies, leading to a decline in economic activity. During the 2008/09 Global Financial Crisis, commercial property was also a major driver of loan losses in Australia, France, Ireland and New Zealand, despite generally accounting for a much smaller share of banks’ loan books compared to residential property. This was attributable to a sharper pace of contraction in commercial property prices compared to house prices (Matua, 2015).
14 These include production-related construction materials and construction-related services.
Chart 14
Prime Retail Space per Capita to Increase Furtherby 2018
5.5
3.9 3.7
5.9 5.7
8.1
0
2
4
6
8
10
Pulau Pinang Klang Valley Johor Bahru*
Sqft per capita
2015 2018f Regional average (2Q 2015)
Note: Population in Pulau Pinang, Klang Valley and Johor Bahru for 2018 is extrapolated using the average population growth in Malaysia between 2011 and 2015
f Forecast * Includes Mukim Bandar Johor Bahru, Plentong and Tebrau Source: Jones Lang Wootton, Department of Statistics, Malaysia and Bank Negara Malaysia estimates

AN
NU
AL
REP
OR
T 20
15EC
ON
OM
IC D
EVEL
OPM
ENTS
IN 2
015
41A
NN
UA
L R
EPO
RT
2015
ECO
NO
MIC
DEV
ELO
PMEN
TS IN
201
5
15 IBS is a construction process that utilises techniques, products, components or building systems that involve prefabricated components and on-site installation.
16 Thanoon, Waleed., et al. (2003).17 House price-to-income ratio of more than 3.0.
Chart 15
Impact of Commercial Space Oversupply maySpill Over to Other Sectors
Developers
ConstructionsectorBanks
Households
Other relatedindustries
1
2
3
4
5
Policy experiences in other countriesThe demand and supply imbalances in both the housing and commercial property markets are not unique to Malaysia. Many other countries have been confronted with similar issues. Their experiences provide valuable lessons in managing the dynamics of demand and supply in the property sector.
Housing marketIn Korea and Singapore, the establishment of a single entity focussed on affordable housing matters resulted in an alleviation of the mismatch between housing demand and supply. The entities in these countries, the Land and Housing Corporation in Korea, as well as the Housing and Development Board (HDB) in Singapore, are responsible for spearheading, centralising and coordinating national and state initiatives related to affordable housing. The consolidation of the various affordable housing entities under one agency had not only allowed for more effective resource planning in these countries, but had also lowered development costs through economies of scale.
Singapore had also successfully reduced its overall construction costs with an extensive adoption of the Industrialised Building Systems (IBS)15 in its public housing projects. The use of IBS in about 80% of all the HDB buildings had resulted in labour cost savings of more than 45% compared to conventional methods16. The construction period of HDB buildings had also been significantly reduced, with improvement in the quality of buildings given lower labour intensity and construction standardisation.
In other countries, the rental market is generally accorded equal priority in national housing policies, serving as an important alternative to homeownership. This is evident particularly in countries with unaffordable house price levels17 (Chart 16). In Switzerland, Germany and Australia, the vibrant private rental markets have contributed towards ensuring suffi cient supply of houses to meet the needs of households with diverse income levels and preferences, as well as the shifting demographics. With changing social preferences in a highly globalised world, renting offers households the fl exibility and mobility to move for career and education opportunities.

AN
NU
AL R
EPOR
T 2015EC
ON
OM
IC D
EVELO
PMEN
TS IN 2015
42A
NN
UA
L REPO
RT 2015
ECO
NO
MIC
DEV
ELOPM
ENTS IN
2015
Commercial property marketTimely and prudent measures could be undertaken to promote the sustainable development of the commercial property sector. The implementation of large projects could be staggered, in tandem with the prevailing and future demand for offi ce and retail space.
In addition, the experience in lower Manhattan in New York City has highlighted the benefi ts of converting old commercial buildings to facilitate a better utilisation of land within the city centre. Between 1995 and 2014, more than 17 million square feet of old commercial buildings were converted into a multitude of other uses, including rental residential units, hotels and restaurants18.While the initial momentum of the conversion was underpinned by the city’s fi nancial incentive programmes19, conversions continued vigorously despite the expiration of the incentives in 2006. These programmes had not only helped to revitalise the city, but also supported the emergence of a residential community within the area. The local authority had also geared its efforts towards reducing the vacancy rates of its offi ce space by providing incentive programmes for businesses to relocate to lower Manhattan20. Refl ecting the success of these incentives, the occupancy rates of offi ce space had improved, with a more diverse tenant base, transitioning from its traditional pool of fi nancial, insurance and real estate companies towards those in the media, technology, non-profi t and education sectors (CBRE, 2014). Commercial to residential property conversions were also successfully implemented in some areas in London, Toronto, Tokyo and Sydney. In these areas, the rising demand for environmentally-friendly buildings, urban policy, offi ce obsolescence and a tight housing market were the most important drivers of the conversion exercises (Remøy and Wilkinson, 2015).
18 CBRE Global Research and Consulting (2014). 19 The redevelopments were initially aided by fi nancial incentive programmes. The 421G programme, which was introduced in
1995, provided tax incentives to encourage developers to convert offi ce buildings constructed before 1975 into residential properties. While some of these residential projects were targeted to the affl uent community, the Lower Manhattan Development Corporation had also allocated over USD50 million to develop affordable housing in the area. This programme was stopped in 2006, as it had effectively revitalised lower Manhattan (Mechanic, 2012).
20 These programmes include the Commercial Rent Tax Special Reduction, the Lower Manhattan Relocation Employment Assistance Programme (LM-REAP) and the Lower Manhattan Energy Programme (LMEP).
Chart 16
Countries with Unaffordable House Prices Generally Have a Strong Focus on the Rental Market
0
1
2
3
4
5
6
7
8
Hon
g K
ong
Ger
man
y*
Switz
erla
nd
Aus
tral
ia
New
Zea
land
Sing
apor
e
Mal
aysi
a
Can
ada
Japa
n US
Irela
nd
House Price-to-Income (HPI) Ratio1
HPI of >3 is considered
unaffordable
0
10
20
30
40
50
60
Switz
erla
nd
Hon
g K
ong
Ger
man
y
Japa
n US
New
Zea
land
Irela
nd
Aus
tral
ia
Can
ada
Mal
aysi
a**
Sing
apor
e***
Renters (% of Households)2
Average of selectedeconomies: 37%
Note:1 Data as at 3Q 2015, with the exception of Switzerland (2012) and Germany (2013)2 2014 data, with the exception of Canada (2011), Japan, New Zealand, Singapore and Switzerland (2013)
* Median house price in Germany refers to the median price of single-family houses in Frankfurt, with a built-up of 150 square metres** For Malaysia, the figure includes households living in quarters***The high homeownership rate in Singapore reflects the dominance of public housing. About 80% of its population lives in Housing Development Board (HDB) units, where 95% are owner occupiers (Phang, 2010)
Source:12th Annual Demographia International Housing Affordability Survey 2016, National Property Information Centre, Department of Statistics, Malaysia, National Authorities, Global Property Guide and Trading Economics
19.0 16.816.7
5.65.2 5.0
4.43.9 3.9
3.52.8
56
49 48
38 3735
31 31 31
24
11

AN
NU
AL
REP
OR
T 20
15EC
ON
OM
IC D
EVEL
OPM
ENTS
IN 2
015
43A
NN
UA
L R
EPO
RT
2015
ECO
NO
MIC
DEV
ELO
PMEN
TS IN
201
5
ConclusionMalaysia is experiencing an undersupply of affordable houses particularly in the major urban areas, but an oversupply of offi ce and retail space in several major cities and towns. Both of these trends, if left unchecked, may lead to deeper imbalances in the property market, with negative spillovers to other parts of the economy. A comprehensive and carefully-designed national planning policy is needed for the property market and will help to support the Government’s aim of delivering more housing, whilst also managing the oversupply of commercial properties. The conversion and repurposing of underutilised surplus commercial space should be a part of that overall strategy, with the cost being borne by property owners rather than taxpayers.
In the housing market, ensuring that the low- and middle-income households have access to quality affordable housing involves not only commitment from the Government, but also the support of the private sector. The experiences of other countries illustrate that constructing more public housing forms only a part of the solution. There is a need for the consolidation of multiple providers of affordable housing across the state and national levels and an equal focus on the rental market. In addition, macroprudential and fi scal measures that are in place, such as the loan-to-value (LTV) measures, Responsible Lending Guideline, higher real property gains taxes (RPGT) and the prohibition of Developer Interest-Bearing Scheme (DIBS), remain instrumental towards maintaining the long-term sustainability of the property market and mitigating potential risks to fi nancial stability.
ReferencesAlfelt, Gustav, Björn Lagerwall and Dilan Ölcer. (2015). `An analysis of the debt-to-income limit as a policy measure´. Sveriges Riksbank Economic Commentaries, No. 8.
CBRE Global Research and Consulting. (2014). `Downtown Manhattan: A market transformed´. Research Note, January 2014.
Jones Lang Wootton. (2015). The Quarterly Subscribers’ Forum, Kuala Lumpur.
Khazanah Research Institute. (2015). `Making Housing Affordable´. Kuala Lumpur: Khazanah Research Institute.
Kragh-Sørensen, Kasper and Haakon Selheim. (2014). `What do banks lose money on during crises?´ Norges Bank Staff Memo, No.3.
Matua, Te. (2015). `Commercial property and fi nancial stability´. Reserve Bank of New Zealand Bulletin, 78 (2).
Mechanic, Marc. (2012). `The future of lower Manhattan´. Lehigh University, Pennsylvania.
Phang, Sock-Yong. (2010). `Lessons from Singapore’s Central Provident Fund´. 4th Global Conference on Housing Finance in Emerging Markets, World Bank, Washington DC.
Remøy, Hilde and Sara Wilkinson. (2015). `Adaptive reuse of offi ces´. 22nd Annual European Real Estate Society (ERES) Conference, Istanbul.
Thanoon, Waleed, Lee Wah Peng, Mohd Razali Abdul Kadir, Mohd Saleh Jaafar and Mohd Sapuan Salit. (2003). `The essential characteristics of industrialised building systems´. International Conference on Industrialised Building Systems, Kuala Lumpur.

AN
NU
AL R
EPOR
T 2015EC
ON
OM
IC D
EVELO
PMEN
TS IN 2015
44
fixed assets by both the public corporations and the Federal Government. As a result, public investment improved during the year, but remained in contraction (-1.0%; 2014: -4.7%). The bulk of development expenditure by the Federal Government was channelled into the economic sectors to enhance the productive capacity and competitiveness of the economy. Of significance, the key projects revolved around developing transportation infrastructure (such as construction and upgrading of roads and railways) and upgrading of facilities to spur trade and industry, particularly in the regional economic corridors. Capital spending in the social services sector was also prioritised to enhance and improve essential services, including better education and housing services. Despite the challenging environment, public corporations continued to undertake capital spending to expand and diversify their business activities, particularly in the oil and gas, transportation and utilities sub-sectors, thus providing support to the overall economy.
EXTERNAL SECTOR
In 2015, Malaysia’s external sector remained resilient despite the environment of greater uncertainty in the global economy. The current account surplus narrowed amid larger deficits in the services and secondary income accounts, but was supported by a still sizeable trade surplus. The level of international reserves remained sufficient to meet short-term external obligations, thus providing ample buffers against external vulnerabilities.
Amidst a challenging global environment, Malaysia’s external position remained resilient in 2015
Broadly, the external trade exhibited diverging trends between the first half and the second half of 2015. In the first half of the year, further declines in commodity prices and sluggish demand for commodities and commodity-related manufactured products resulted in a contraction of 3.1% in Malaysia’s gross exports. In particular, LNG demand from Japan was weak due to warmer-than-average weather, while rubber demand from China was affected by the slowdown in domestic consumption.
Slower regional growth also contributed to lower exports of petroleum products. Given the diversity of Malaysia’s exports, the weak export performance of commodities was partially mitigated by higher exports of E&E and non-resource based manufactured products. Of significance, E&E demand from the US and EU was strong, mainly for semiconductors for green technology and data processing equipments. Exports of semiconductors were partially lifted by the acceleration of solar-related demand in the US as the solar tax incentive was initially set to expire in late 2016. Continued demand for machinery, appliances and parts, manufacture of metal as well as iron and steel products, from both advanced and regional countries also contributed positively to overall export performance.
Gross imports also declined in the first half of the year (1H 2015: -2.6%). Imports of intermediate goods, which accounted for 58.2%
Balance of Payments1
Item (Net)2013 2014 2015p
RM billion
Goods 96.6 113.4 108.9
Services -9.6 -11.2 -20.5
Primary Income -34.0 -37.3 -32.2
Secondary Income -17.5 -17.6 -22.2
Current account balance 35.5 47.3 34.0% of GNI 3.6 4.4 3.0
Capital account 0.0 0.3 -1.2Financial account -20.2 -81.6 -53.3
Direct investment -6.3 -18.5 0.2
Portfolio investment -3.0 -38.5 -28.2
Financial derivatives -0.3 -1.0 -0.5
Other investment -10.7 -23.6 -24.9
Errors and omissions (E&O)2 -0.6 -2.5 24.1
% of total trade 0.0 -0.2 1.6of which:
Foreign exchange revaluationgain (+) or loss (-) 18.6 7.6 57.3
Overall balance 14.6 -36.5 3.7
Bank Negara Malaysia international reserves, net 441.9 405.3 409.1
USD billion equivalent 134.9 115.9 95.3
1 The data is compiled in accordance with the Sixth Edition of Balance of Payments and International Investment Position Manual (BPM6) by the International Monetary Fund (IMF)
2 Includes unrealised foreign exchange revaluation gains/losses on international reserves
p Preliminary Note: Numbers may not necessarily add up due to rounding
Source: Department of Statistics, Malaysia and Bank Negara Malaysia
Table 1.6

AN
NU
AL
REP
OR
T 20
15EC
ON
OM
IC D
EVEL
OPM
ENTS
IN 2
015
45
of gross imports, were weighed down mainly by the sharp decline in fuel-related inputs following lower demand for resource-based manufactured exports. Imports of capital goods, particularly machinery and equipment, were lower in tandem with the more moderate pace of investment activity in the Malaysian economy. Consumption imports, however, registered strong growth due largely to inelastic demand for imported food and beverages, and consumer goods such as medicines, cosmetic and personal care, as well as clothing and textiles.
In the second half of the year, export growth rebounded to 6.8%, due to higher demand for manufactured products and commodities, and the positive valuation effect from the ringgit depreciation. The strong growth of E&E exports was primarily supported by higher demand from the US and Singapore for semiconductor devices and electrical machinery, in line with the launch of a series of new electronic products. The continued growth of the regional economies and strong re-export activity supported the performance of non-E&E manufactured exports and commodities such as petroleum products, timber and timber-related products, palm oil and palm-related products, as well as rubber and rubber products. Despite an improvement in demand, commodity exports continued to decline due to falling prices. While the advanced economies remained an important
export destination for Malaysia, exports to ASEAN economies, which accounted for about one-third of Malaysia’s total exports, provided further resilience against weak global demand.
Import growth was also relatively higher in the second half of the year (2H 2015: 3.2%), supported by higher imports of capital goods, particularly electrical machinery, telecommunication equipment, and rail coaches. Consumption imports remained strong, particularly for food and beverages, garments and footwear. Imports for re-export, particularly metal products, also picked up during this period. Intermediate imports, however, were affected by lower imports of industrial supplies, particularly nickel, copper and stainless steel, as manufacturers drew down their inventories of these inputs.
1
Table 1.7
External Trade
Share2015(%)
2013 2014 2015p
Annual change (%)
Gross exports 100.0 2.5 6.3 1.9
Manufactures 80.2 5.1 7.1 6.5
Electronics andelectrical (E&E) 35.6 2.5 8.1 8.5
Non-E&E 44.6 7.1 6.4 5.0
Commodities 19.2 -4.6 3.9 -13.4
Minerals 10.6 3.7 6.2 -20.6
Agriculture 8.6 -14.4 0.5 -2.7
Gross imports 100.0 6.9 5.3 0.4
Intermediate goods 58.2 4.3 7.6 -2.3
Capital goods 14.0 2.2 -2.4 0.0
Consumption goods 9.1 8.8 5.7 24.1
Trade balance (RM billion) - 71.3 82.5 94.6
p Preliminary
Source: Department of Statistics, Malaysia and Bank Negara Malaysia
Export Performance
Chart 1.4
2013 2014 2015
Source: Department of Statistics, Malaysia
Annual change (%), contribution to growth (percentage points)
E&E Exports (annual change, %)Non E&E Commodities
-10
-5
0
5
10
15
20
1Q 2Q 3Q 4Q 1Q 2Q 3Q 4Q 1Q 2Q 3Q 4Q
Import Performance
Chart 1.5
Source: Department of Statistics, Malaysia
Annual change (%), contribution to growth (percentage points)
Imports (annual change, %)
Consumption goodsCapital goods Intermediate goods
Re-exports &dual-use goods
-10
-5
0
5
10
15
1Q 2Q 3Q 4Q 1Q 2Q 3Q 4Q 1Q 2Q 3Q 4Q
2013 2014 2015

AN
NU
AL R
EPOR
T 2015EC
ON
OM
IC D
EVELO
PMEN
TS IN 2015
46
For the year 2015, growth of exports and imports moderated to 1.9% and 0.4%, respectively (2014: 6.3% and 5.3%, respectively). As the slowdown in imports outpaced the moderation in exports, the trade surplus was higher at RM94.6 billion (2014: RM82.5 billion). The sizeable trade surplus emanated from both manufactured and commodity products. Commodities continued to contribute to the trade surplus, as lower commodity exports were also accompanied by a decline in commodity-related imports, while exports of CPO and LNG have minimal corresponding imports.
The services account registered a larger deficit due mainly to lower net receipts from the travel account and higher net payments for other imported services for trade and investment-related activity. Tourism receipts fell in 2015 as tourist arrivals into Malaysia were lower, while there was an increase in outbound travel. During the year, there was a larger deficit in the secondary income account due to larger outward remittances by foreign workers. The deficit in the primary income account narrowed as the decline in payments accrued to foreign direct investors in Malaysia had more than offset the decline in income receipts accrued to Malaysian companies investing abroad.
With the trade surplus exceeding the deficits in the services and income accounts, the current account balance remained in surplus, although the amount was smaller at RM34.0 billion or 3.0% of GNI (2014: RM47.3 billion, 4.4% of GNI). This was reflected in the narrower
savings-investment (S-I) surplus during the year. Gross national savings (GNS) grew by 0.1% (2014: 8.1%) to 28.8% of GNI (2014: 30.3%), while total gross capital formation expanded at a faster pace of 4.9% (2014: 4.7%). The slower growth in GNS was attributable to both a bigger decline in public savings (-28.7%; 2014: -5.9%) and a more moderate growth in private sector savings (11.2%: 2014: 14.7%). This was due mainly to the lower operating surplus of companies in the commodity-related sectors. On the other hand, public gross capital formation turned around to register a positive growth of 1.9% during the year (2014: -3.2%). Together with the decline in public sector savings, this resulted in a widening of the public S-I deficit to -RM39.7 billion (2014: -RM13.1 billion). Private gross capital formation, however, expanded at a slower pace of 7.5% (2014: 10.1%) arising from
Chart 1.6
Trade Balance by Commodities
Source: Department of Statistics, Malaysia
Others
Petroleum products
Liquefied natural gas (LNG)Crude petroleum
Palm oil
Manufactures
Trade balance
RM billion
-50
0
50
100
150
2010 2011 2012 2013 2014 2015
Current Account Balance
Chart 1.7
Source: Department of Statistics, Malaysia
Goods Services
Primary income Secondary income
Current account balance, % of GNI (RHS)
-8
-4
0
4
8
12
16
20
-80
-40
0
40
80
120
160
200
2008 2009 2010 2011 2012 2013 2014 2015
RM billion % of GNI
Source: Department of Statistics, Malaysia and Ministry of Finance, Malaysia
Chart 1.8
Gross National Savings and Savings-Investment Gap
p Preliminary
0
50
100
150
200
250
300
350
2010 2011 2012 2013 2014 2015p
RM billion
Public Savings
PrivateSavings
Gross National Savings
Gross Capital Formation
Savings-Investment Gap
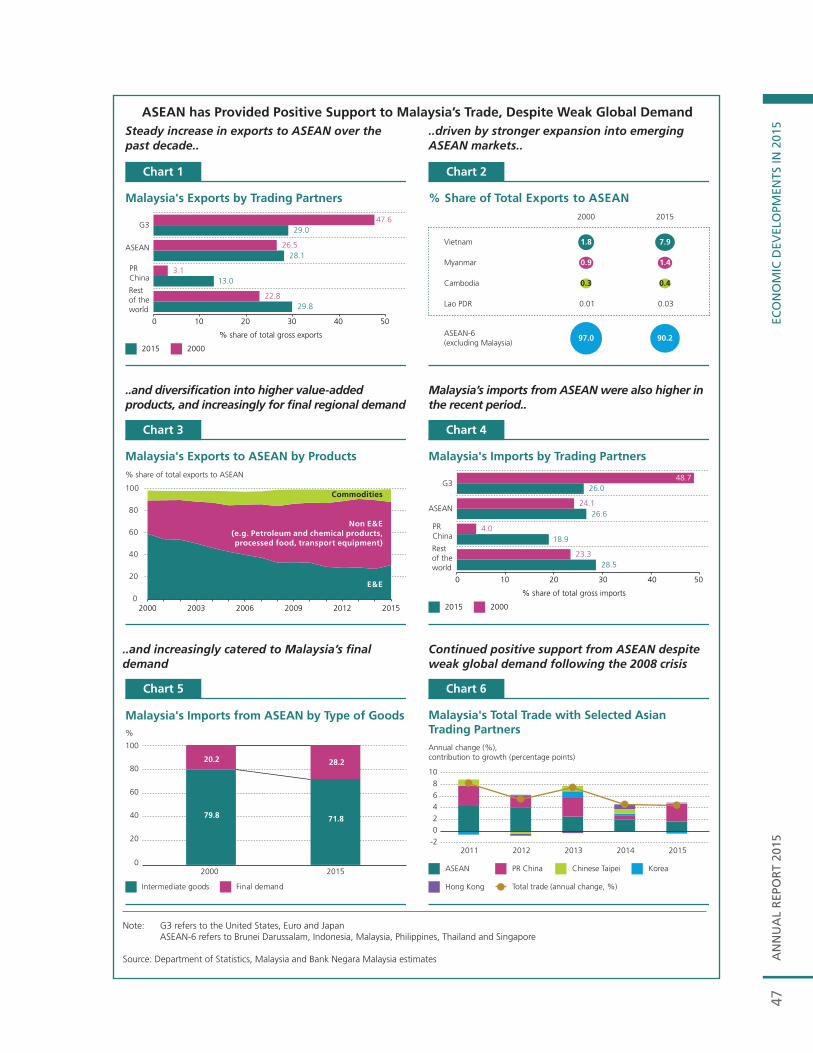
AN
NU
AL
REP
OR
T 20
15EC
ON
OM
IC D
EVEL
OPM
ENTS
IN 2
015
47
ASEAN has Provided Positive Support to Malaysia’s Trade, Despite Weak Global DemandSteady increase in exports to ASEAN over the past decade..
Malaysia’s imports from ASEAN were also higher in the recent period..
..driven by stronger expansion into emerging ASEAN markets..
..and increasingly catered to Malaysia’s fi nal demand
..and diversifi cation into higher value-added products, and increasingly for fi nal regional demand
Continued positive support from ASEAN despite weak global demand following the 2008 crisis
Chart 1
Malaysia's Exports by Trading Partners
29.8
13.0
28.1
29.0
22.8
3.1
26.5
47.6
0 10 20 30 40 50
Restof theworld
PRChina
ASEAN
G3
20002015
% share of total gross exports
Chart 4
Malaysia's Imports by Trading Partners
0 10 20 30 40 50
2015 2000
% share of total gross imports
Restof theworld
PRChina
ASEAN
G3
28.523.3
18.94.0
26.624.1
26.048.7
Chart 2
% Share of Total Exports to ASEAN
Vietnam
Myanmar
Cambodia
Lao PDR 0.01
0.3
1.8
0.9
2000
0.03
0.4
7.9
1.4
ASEAN-6(excluding Malaysia)
97.0 90.2
2015
Chart 5
Malaysia's Imports from ASEAN by Type of Goods
Intermediate goods Final demand
0
20
40
60
80
100
2000 2015
%
20.2
79.8 71.8
28.2
Chart 3
Malaysia's Exports to ASEAN by Products
0
20
40
60
80
100
2000 2003 2006 2009 2012 2015
E&E
Non E&E(e.g. Petroleum and chemical products,processed food, transport equipment)
Commodities
% share of total exports to ASEAN
Annual change (%),contribution to growth (percentage points)
Chart 6
Malaysia's Total Trade with Selected AsianTrading Partners
ASEAN PR China Korea
Hong Kong Total trade (annual change, %)
-2
02
46
8
10
2011 2012 2013 2014 2015
Chinese Taipei
Note: G3 refers to the United States, Euro and Japan ASEAN-6 refers to Brunei Darussalam, Indonesia, Malaysia, Philippines, Thailand and Singapore
Source: Department of Statistics, Malaysia and Bank Negara Malaysia estimates

AN
NU
AL R
EPOR
T 2015EC
ON
OM
IC D
EVELO
PMEN
TS IN 2015
48
the moderation in domestic demand and the more cautious business sentiments. As private savings increased at a faster pace than capital formation, the private sector S-I gap registered a larger surplus of RM73.7 billion in 2015 (2014: RM60.4 billion).
Significant two-way capital flowsAgainst the backdrop of continued uncertainty in global financial markets, the external sector experienced significant two-way cross-border capital flows for most of 2015. There were significant outflows of foreign portfolio funds during the year. Conversely, Malaysia continued to receive a steady inflow of foreign direct investments. Malaysian companies and resident investors also continued to expand their international presence and acquire portfolio assets abroad, albeit at a slower pace. The other investments account recorded a higher net outflow due mainly to higher outflows by the private sector. Overall, the financial account recorded a net outflow of RM53.3 billion (2014: net outflows of RM81.6 billion).
Despite greater headwinds to the global economy, Malaysia remained a competitive destination for foreign entities and multinational corporations to invest in and expand their productive capacity. On the liabilities side, inward direct investment registered a net inflow of RM37.6 billion, equivalent to 3.3% of GNI (2014: net inflow of RM34.6 billion, or 3.3% of GNI). A large proportion of the inflow
reflected foreign direct investment (FDI) which amounted to RM39.5 billion, mainly in the form of equity capital injections and drawdown of intercompany loans, while earnings retained for the purpose of reinvestments were sustained. The bulk of the FDI inflows went into the manufacturing sector, primarily in the E&E industries and for the acquisition of assets in the petrochemical-related industries. Despite lower crude oil prices, FDI into the mining sector remained sizeable, reflecting mainly the injection of working capital to support on-going upstream exploration and extraction activities in oil and gas fields located offshore from Sabah and Sarawak. The remainder of FDI comprised mainly investment in the services sector, particularly in the finance and insurance and information and communication sub-sectors. In terms of source countries, these FDI flows originated mostly from the advanced economies, particularly Japan, the United States and Singapore.
On the assets side, outward direct investment registered a lower net outflow of RM37.4 billion, or 3.3% of GNI (2014: net outflow of RM53.1 billion or 5.0% of GNI). The lower outflows primarily reflected a moderation in direct investment abroad (DIA) by Malaysian companies which amounted to RM39.3 billion during the year. The moderation in DIA was attributed mainly to lower injections of equity capital amid continued extension of inter-company loans to
Chart 1.9
Net Foreign Direct Investment by Sectors1
Mining32.8%
Manufacturing44.8%
Financial services11.4%
Non-financial services8.2%
Others2
2.8%
2015pRM39.5 billion
1 Foreign direct investment as defined according to the 5th Edition of the Balance of Payments Manual (BPM5) by the International Monetary Fund (IMF)2 Refers to agriculture and construction sectorsp Preliminary
Source: Department of Statistics, Malaysia
-
Chart 1.10
Net Direct Investment Abroad by Sectors1
1 Direct investment abroad as defined according to the 5th Edition of the Balance of Payments Manual (BPM5) by the International Monetary Fund (IMF)2 Refers to agriculture, construction and manufacturing sectorsp Preliminary
Source: Department of Statistics, Malaysia
Mining62.2%
Financial services14.0%
Non-financial services13.3%
Others2
10.5%
2015pRM39.3 billion

AN
NU
AL
REP
OR
T 20
15EC
ON
OM
IC D
EVEL
OPM
ENTS
IN 2
015
49
Malaysia-ASEAN Investment Flows Continue
FDI fl ows from ASEAN accounted for about a quarter of total FDI infl ows into Malaysia
Malaysia’s DIA fl ows to ASEAN has been moderating in recent years
FDI from ASEAN is mostly undertaken by subsidiaries of MNCs located in Singapore
DIA to ASEAN is more diversifi ed, mainly to Singapore, Indonesia and Thailand
FDI from ASEAN is channeled mainly into manufacturing and fi nancial services
Bulk of DIA to ASEAN is in the services sector, particularly fi nancial services
Chart 1
Foreign Direct Investment1 in Malaysia
FDI from ASEANFDI from ROW
(5)-5
10152025303540
2008 2009 2010 2011 2012 2013 2014 2015
RM billion
Chart 2
Direct Investment Abroad2 by Malaysian Companies
DIA to ASEANDIA to ROW
-102030405060
2008 2009 2010 2011 2012 2013 2014 2015
RM billion
Chart 4
Malaysia's Direct Investment Position in ASEANby Country
32.7%
29.6%
0100200300400500600700
2008 4Q 2015p
RM billion
231.8
588.4
Indonesia32.3%
Rest of ASEAN10.5% Singapore
48.2%Thailand
9.1%
DIA to ASEANas at 4Q 2015p:RM174.1 billion
(29.6% ofDIA stock)
DIA to ROW DIA to ASEAN
Chart 5
ASEAN Direct Investment Position in Malaysiaby Sector1
Agriculture7.3%
Manufacturing55.2%
Financialservices22.5%
Non-financialservices13.5%
Others3
1.5%
ASEAN FDI as at4Q 2015p:
RM107.7 billion
Chart 6
Malaysia's Direct Investment Position in ASEANby Sector2
Manufacturing7.3%
Others4
16.3%
DIA to ASEANas at 4Q 2015p:RM174.1 billion
Financialservices48.2%
Non-financialservices16.6%
Mining11.5%
Note: ROW refers to rest of the world
1 Foreign Direct Investment as defi ned according to the 5th Edition of the Balance of Payments Manual (BPM5) by the International Monetary Fund (IMF)2 Direct Investment Abroad as defi ned according to the 5th Edition of the Balance of Payments Manual (BPM5) by the International Monetary Fund (IMF)3 Refers to construction and mining sectors4 Refers to agriculture and construction sectors
p PreliminarySource: Department of Statistics, Malaysia
Chart 3
ASEAN Direct Investment Position in Malaysiaby Country
Singapore97.2%
Rest of ASEAN2.8%
FDI from ROW FDI from ASEAN
18.1%
02008 4Q 2015p
255.0
21.2%507.6
100
200
300
400
500
600
RM billion
ASEAN FDI as at4Q 2015p:
RM107.7 billion(21.2% ofFDI stock)

AN
NU
AL R
EPOR
T 2015EC
ON
OM
IC D
EVELO
PMEN
TS IN 2015
50
subsidiaries abroad. The bulk of DIA continued to be channelled into the mining sector. These investments reflected mainly the extension of long-term loans by the national oil company to an affiliated company to facilitate the strategic acquisition of oil and gas-related assets in Western Asia, along with continued investments in production activities in Central Asia. DIA in the services sector was also sizeable, particularly for the continued expansion of finance and insurance and information and communication operations in the Asian region.
Short-term capital flow movements continued to be adversely impacted by the global financial markets conditions, which had been volatile since the third quarter of 2014. For non-resident portfolio investments, there was a significant degree of volatility throughout the year, as uncertainties over the timing and pace of monetary policy normalisation in the US led to a significant rebalancing of exposures by international investors, resulting in broad-based outflows from emerging market economies, including Malaysia. A significant amount of the volatility was also related to the building-up and unwinding of speculative positions in the domestic and off-shore markets. Declining commodity prices and slower growth in EMEs also proved to be a trigger for outflows. Global risk aversion was further exacerbated by periodic bouts of intense volatility, triggered by concerns over the Greek debt crisis in July and the overreaction towards PR China’s stock market correction in August. As a consequence of these developments, non-resident investors pared down their holdings of Malaysian
portfolio assets, resulting in net outflows amounting to RM29.1 billion during the first three quarters of the year.
During the period, the liquidation of equities by non-residents resulted in a decline in foreign participation to a 23.0% share of total equity market capitalisation in September 2015. There was a small net inflow into debt securities in the first half of the year, as the redemption of Bank Negara Monetary Notes (BNMNs) upon maturity were mostly offset by purchases of Malaysian Government Securities (MGS) and the issuances of offshore debt securities by a public corporation in the oil and gas sector as well as the issuance of the 10-year and 30-year sukuk by the Malaysian Government. In the third quarter, however, debt securities recorded a large outflow, attributed mainly to the maturing of some MGS and several foreign currency denominated corporate bonds issued by the public corporations. As a result, non-resident holdings fell to 21.5% of total outstanding public debt securities in September 2015. However, investor sentiment improved slightly towards the end of the year, as the Fed’s decision to raise interest rates removed some uncertainty from the global financial markets. As such, there was a net inflow of portfolio funds in the fourth quarter, mainly into purchases of MGS. For the year as a whole, portfolio investments by non-residents registered a net outflow of RM19.0 billion (2014: net outflow of RM10.4 billion). As at end-2015, foreign participation in the equity market stood at 22.3%, while non-resident holdings of overall public debt instruments stood at 22.1% (end-2014: 24.1% and 23.0% respectively).
Net outflows of portfolio investment by residents moderated to RM9.2 billion during the year (2014: net outflow of RM28.1 billion). These investments mostly represented the diversification strategy of domestic institutional investors, fund managers and financial institutions to acquire financial assets abroad in order to enhance returns and provide a steady dividend stream to their members and shareholders. At the same time, there were also some redemptions of offshore foreign currency debt securities holdings by the domestic financial institutions and corporates, particularly in the second half of the year. Collectively, resident and non-resident portfolio investment recorded a net outflow of RM28.2 billion in 2015 (2014: net outflow of RM38.5 billion).
The other investment account registered higher net outflows of RM24.9 billion for the year as a
Chart 1.11
Portfolio Investments
-60
-40
-20
0
20
40
60
80
100
2009 2010 2011 2012 2013 2014 2015p
RM billion
ResidentNon-resident Net portfolio investment
p Preliminary
Source: Department of Statistics, Malaysia

AN
NU
AL
REP
OR
T 20
15EC
ON
OM
IC D
EVEL
OPM
ENTS
IN 2
015
51
whole (2014: net outflows of RM23.6 billion), due mainly to net outflows in the banking and non-bank private sector (2015: RM23.0 billion; 2014: RM21.6 billion net outflows). In the banking sector, the net outflows were caused mainly by Malaysian banks extending loans to foreign financial institutions abroad. At the same time, maturing deposits of non-resident financial institutions with the domestic banking system, more than offset the amount of maturing deposits held by Malaysian banks with foreign financial institutions abroad. These interbank transactions, which varied in both magnitude and direction every quarter, underscored the strategies of individual banking institutions in managing their own foreign exchange liquidity exposures. It also reflects the growing regional presence of domestic banks. Net outflows recorded by the non-bank private sector moderated, reflecting mainly the lower net extension of trade credits by Malaysian exporters to their trading partners in line with the slower growth in exports. The public sector recorded net outflows of RM1.9 billion (2014: net outflows of RM2 billion) as the repayment of external borrowings had more than offset the drawdown of new loans, particularly by the public corporations.
In 2015, the overall balance of payments registered a surplus of RM3.7 billion (2014: deficit of RM36.5 billion). Errors and Omissions (E&O) amounted to +RM24.1 billion or +1.6% of total trade, mostly reflecting foreign exchange revaluation gains on international reserves. Excluding revaluation gains, the E&O stood at -RM33.2 billion or -2.3% of total trade.
The international reserves of Bank Negara Malaysia amounted to RM409.1 billion (equivalent to USD95.3 billion) as at end-2015 compared to RM405.3 billion (equivalent to USD115.9 billion) as at end-2014. On account of the quarterly adjustment for foreign exchange revaluation changes, the reserves level in ringgit terms had increased due to the weakening of ringgit against most currencies, especially during the first three quarters of 2015. However, underscoring the diversified composition of foreign currency reserve assets, the reserves level in USD terms had correspondingly declined, amid the strengthening of USD against most other currencies during the same period. In general, the lower international reserves in USD terms reflect the relatively higher outflows of non-resident portfolio investment and continued, albeit lower, resident direct investment
and portfolio investment abroad in 2015. These outflows have more than offset the current account surplus and sustained inflows of foreign direct investment during the year.
The progressive liberalisation of foreign exchange administration rules over the years has promoted greater two-way capital flows and has contributed to the deepening of the domestic financial markets. This has also resulted in a greater decentralisation of international reserves, as reflected in the increasing acquisition of assets abroad by Malaysian entities. As at 31 December 2015, the international reserves accounted for about 25% of Malaysia’s total external assets, with the remaining 75% owned by banks and corporations. The availability of external assets enables these entities to meet their external debt obligations without creating a claim on the international reserves. The wide range of monetary policy instruments, and the exchange rate flexibility, has also enabled the economy to reduce its reliance on the Bank’s international reserves in managing external pressures.
At as 29 February 2016, the reserves were at RM410.5 billion (equivalent to USD95.6 billion). The international reserves remain ample to facilitate international transactions and are sufficient to finance 8.3 months of retained imports and are 1.2 times the short-term external debt.
Manageable external debtMalaysia’s external debt stood at RM833.7 billion, equivalent to USD192.2 billion or 72.1% of GDP as at end-2015 (end-2014: RM747.5 billion, equivalent to USD211.8 billion or 67.5% of GDP). The external debt profile remains healthy as more than half was of medium- to long-term tenure (57.8%). By currency, about 36% of the external debt is denominated in ringgit, mainly in the form of non-resident holdings of domestic debt securities and deposits.
As at end-2015, offshore borrowing remained low, accounting for about half of the total external debt and only 40.1% of GDP (Asian Financial Crisis (AFC): 60.0% of GDP). The composition of the offshore borrowing has also changed. While non-bank private corporations were the main borrower during the AFC, their share has declined in recent years as more have sought financing from the more developed domestic financial markets. A large share of offshore borrowing

AN
NU
AL R
EPOR
T 2015EC
ON
OM
IC D
EVELO
PMEN
TS IN 2015
52
2 Malaysia’s international investment position.
is now accounted for by banks arising from their greater regionalisation, whereby offshore subsidiaries and branches of domestic banks increasingly placed funds with their head offices in Malaysia under centralised foreign currency liquidity management operations.
Offshore borrowing, denominated largely in foreign currency, remained manageable. In particular, banks and corporations accounted for about 75% of Malaysia’s external financial assets2 as at end-2015, which are available to meet their external obligations. Their external exposure is also generally hedged, either naturally through foreign currency earnings, or through the use of financial instruments. Furthermore, the offshore borrowing is used mainly to finance the expansion of productive capacity and for better management of financial resources within corporate groups. In the case of intercompany loans, these borrowings are generally on concessionary terms with flexible repayment schedule.
External debt increased by 11.5% in 2015, attributed mainly to the valuation effects from the depreciation of the ringgit against most currencies during the first three quarters of the year. The ringgit depreciation affected mainly offshore borrowing, which increased by RM92.6 billion or 24.9% to RM463.6 billion
(end-2014: RM371.1 billion). Excluding the foreign exchange revaluation changes, offshore borrowing increased at a more moderate pace of 4.0% during the year, contributing two percentage points to the overall increase in the external debt. This reflects, in particular, the net drawdown of intercompany borrowing by several private corporations in the oil and gas sector. The net drawdown of offshore borrowing by the public corporations during the year was attributed largely to the new issuances of international debt securities as well as sukuk by an oil and gas company in the first quarter of 2015.
Chart 1.12
Outstanding External Debt (end-period)
434.3
537.5
602.1
696.6747.5
833.7
0
100
200
300
400
500
600
700
800
900
2010 2011 2012 2013 2014 2015
Other debt liabilities1
Non-resident holdings ofdomestic debt securities
Offshore borrowing (comprising mainly foreign currency loans raised, and bond and notes issued offshore)
RM billion
1Includes non-resident deposits, trade credits, IMF allocation of SDRs and miscellaneous.
Source: Ministry of Finance, Malaysia and Bank Negara Malaysia
1
Table 1.8
Outstanding External Debt
2014 2015
RM billion
Offshore borrowing1 371.1 463.6
USD billion equivalent 105.2 106.9
Medium- and long-term 211.4 285.9
Public sector 93.1 128.3
Private sector 118.3 157.6
Short-term 159.7 177.7
NR holdings of dom. debt securities 223.3 211.3
Medium- and long-term 162.4 184.1
Short-term 60.9 27.2
NR deposits 87.7 81.6
Others2 65.5 77.2
Medium- and long-term 10.5 11.9
Short-term 55.0 65.3
Total external debt 747.5 833.7
USD billion equivalent 211.8 192.2
External Debt (Redefi ned)
Total debt/GDP (%) 67.5 72.1
Short-term debt3/Total debt (%) 48.6 42.2
Reserves/Short-term debt3 (times) 1.1 1.25
Debt service ratio (% of exports of goods and services)
19.1 22.6
External Debt (Previous defi nition)
Total debt/GDP (%) 33.5 40.1
Short-term debt4/Total debt (%) 43.0 38.3
Reserves/Short-term debt4 (times) 2.5 2.35
Debt service ratio (% of exports of goods and services) 11.3 15.6
1 Equivalent to the external debt as previously defi ned, comprised mainly foreign currency loans raised, and bond and notes issued offshore
2 Comprise trade credits, IMF allocation of SDRs and miscellaneous3 Short-term offshore borrowing, NR holdings of short-term
domestic debt securities, NR deposits, short-term trade credits and miscellaneous
4 Equivalent to short-term offshore borrowing 5 Based on international reserves as at 29 February 2016Note: NR refers to non-residents
Source: Ministry of Finance, Malaysia and Bank Negara Malaysia
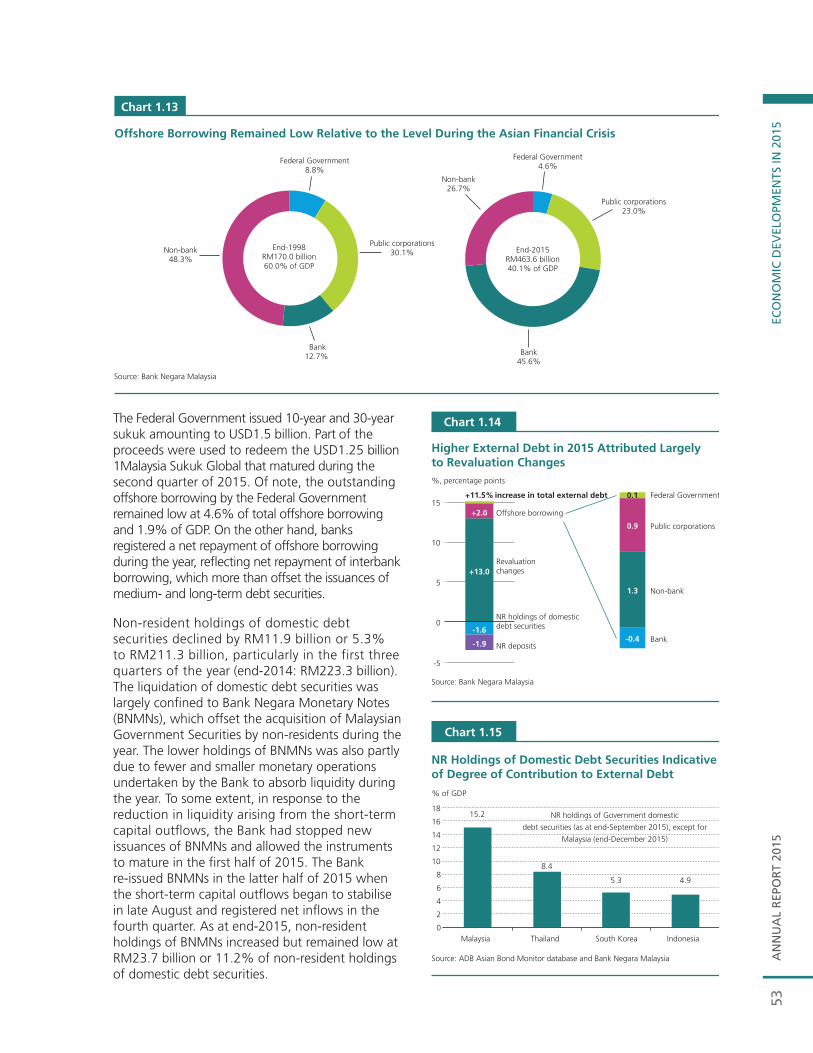
AN
NU
AL
REP
OR
T 20
15EC
ON
OM
IC D
EVEL
OPM
ENTS
IN 2
015
53
The Federal Government issued 10-year and 30-year sukuk amounting to USD1.5 billion. Part of the proceeds were used to redeem the USD1.25 billion 1Malaysia Sukuk Global that matured during the second quarter of 2015. Of note, the outstanding offshore borrowing by the Federal Government remained low at 4.6% of total offshore borrowing and 1.9% of GDP. On the other hand, banks registered a net repayment of offshore borrowing during the year, reflecting net repayment of interbank borrowing, which more than offset the issuances of medium- and long-term debt securities.
Non-resident holdings of domestic debt securities declined by RM11.9 billion or 5.3% to RM211.3 billion, particularly in the first three quarters of the year (end-2014: RM223.3 billion). The liquidation of domestic debt securities was largely confined to Bank Negara Monetary Notes (BNMNs), which offset the acquisition of Malaysian Government Securities by non-residents during the year. The lower holdings of BNMNs was also partly due to fewer and smaller monetary operations undertaken by the Bank to absorb liquidity during the year. To some extent, in response to the reduction in liquidity arising from the short-term capital outflows, the Bank had stopped new issuances of BNMNs and allowed the instruments to mature in the first half of 2015. The Bank re-issued BNMNs in the latter half of 2015 when the short-term capital outflows began to stabilise in late August and registered net inflows in the fourth quarter. As at end-2015, non-resident holdings of BNMNs increased but remained low at RM23.7 billion or 11.2% of non-resident holdings of domestic debt securities.
Chart 1.13
Offshore Borrowing Remained Low Relative to the Level During the Asian Financial Crisis
Federal Government8.8%
Source: Bank Negara Malaysia
Public corporations30.1%
Bank12.7%
Non-bank48.3%
End-1998RM170.0 billion60.0% of GDP
Federal Government4.6%
Public corporations23.0%
Bank45.6%
Non-bank26.7%
End-2015RM463.6 billion40.1% of GDP
+13.0
+2.0
-1.6
-1.9
-5
0
5
10
15+11.5%
%, percentage points
Source: Bank Negara Malaysia
increase in total external debt
Offshore borrowing
Revaluationchanges
NR holdings of domesticdebt securities
NR deposits
Federal Government
Public corporations
Non-bank
Bank
1.3
0.9
0.1
-0.4
Chart 1.14
Higher External Debt in 2015 Attributed Largelyto Revaluation Changes
Chart 1.15
NR Holdings of Domestic Debt Securities Indicativeof Degree of Contribution to External Debt
15.2
8.4
5.3 4.9
0
2
4
6
8
10
12
14
16
18
Malaysia Thailand South Korea Indonesia
% of GDP
Source: ADB Asian Bond Monitor database and Bank Negara Malaysia
NR holdings of Government domestic
debt securities (as at end-September 2015), except for
Malaysia (end-December 2015)

AN
NU
AL R
EPOR
T 2015EC
ON
OM
IC D
EVELO
PMEN
TS IN 2015
54 1
Deciphering Short-term External Debt
Short-term external debt (STED) stood at RM351.9 billion, being equivalent to 30.4% of GDP as at end-2015 (end-2009: RM166.3 billion or 23.3% of GDP), and accounting for 42.2% of the total external debt (end-2009: 42.8%). The upward trend in short-term external debt between 2009 and end-June 2014 refl ected mainly the larger non-resident (NR) holdings of short-term domestic debt securities and deposits. Between July 2014 and end-2015, short-term external debt rose because of the valuation effects of the weaker ringgit exchange rate against most currencies. Measured against the international reserves, the reserves coverage of the short-term external debt declined to 1.2 times as at end-2015 (end-2009: 2.0 times).
Chart 1
Short-term External Debt
Source: Bank Negara Malaysia
0.0
0.5
1.0
1.5
2.0
2.5
0
50
100
150
200
250
300
350
400
2009 2010 2011 2012 2013 2014 2015
OthersIntercompanyloans
NR holdings of short-termdomestic debt securities
Trade creditsNR depositsInterbank borrowing
Reserves/Short-termExternal Debt (RHS)
timesRM billion
Chart 2
Contribution to the Increase in Short-termExternal Debt
Source: Bank Negara Malaysia
-4.0
65.5
169.5
-66.12
24.9
5.5
-100
-50
0
50
100
150
200
2009-June 2014 July 2014-end-2015
RM billion
Total increase: +190.3 +4.9
Other factors1Net borrowing (+)/repayment (-)
Valuation effects
1 Include price changes especially on domestic debt securities held by non-residents, and other adjustments associated mainly with data classification, coverage and updates2 Mainly liquidation of NR holdings of short-term domestic debt securities
Growth1 of Short-term External Debt by Component, 2009-1H 2014
Chart 3
Source: Bank Negara Malaysia
1 Compounded annual growth rate (CAGR)
4.0
11.3
19.6
42.3
14.9 12.4
0
5
10
15
20
25
30
35
40
45
Trade creditsNR deposits
NR holdings of short-termdomestic debt securities
OthersIntercompany loans
CAGR, %
Overall: 15.8
Interbank borrowing
Chart 4
Reserves Coverage of Short-term External Debt1
in Selected Countries
Source: Haver Analytics, Department of Statistics, Singapore and Bank Negara Malaysia
1As at end of 3Q 2015, except for Malaysia (4Q 2015)
0.20.4
1.2
2.4
2.9 3.1
0.0
0.5
1.0
1.5
2.0
2.5
3.0
3.5
Singapore Hong Kong Malaysia Indonesia Thailand SouthKorea
Times

AN
NU
AL
REP
OR
T 20
15EC
ON
OM
IC D
EVEL
OPM
ENTS
IN 2
015
552
Despite the increase, short-term external debt remains manageable. This assessment is based on key characteristics of the external liabilities and the borrowers. Borrowers, especially banks and corporations, have the servicing capacity to meet their debt obligations. Over the years, Malaysian entities have acquired assets abroad amid the progressive liberalisation of the country’s foreign exchange administration rules. Domestic corporations1 and banks accounted for 75% of Malaysia’s RM1.7 trillion in external fi nancial assets2 as at end-2015. In particular, corporate short-term external assets3 amounting to RM174.5 billion exceeded the short-term external debt of RM77.5 billion owed by corporates. For the banks, their short-term external debt (RM247.3 billion) was partially covered by their short-term external assets (RM87.5 billion).
The accumulation of external assets by banks and corporations represents the decentralisation of international reserves, which is also evident in the growing foreign currency deposits in the domestic banking system. About two-third of these deposits is accounted by business enterprises, whose foreign currency deposits has increased at a compounded annual growth rate of 23.0% during 2007-2015 to RM90.4 billion as at end-2015. Consequently, not all of the short-term external debt obligations create claims on the international reserves.
1 Including public corporations.2 Malaysia’s international investment position.3 Trade credits, deposits placed abroad, intercompany loan and other short-term assets.4 Include, among others, insurance claims yet to be disbursed and interest payable on bonds and deposits.
Source: Department of Statistics, Malaysia
RM billion RM billion
Chart 5
Malaysia's International Investment Position
Assets excluding international reserves International reserves
Total liabilities Net IIP (RHS)
-200
-150
-100
-50
0
50
100
150
200
-2,000
-1,500
-1,000
-500
0
500
1,000
1,500
2,000
2001 2003 2005 2007 2009 2011 2013 2015
Chart 6
The Sizeable External Assets of Malaysia's Banksand Corporations Underscore their DebtServicing Capacity
% External assets, excluding reserves,
as a share of countries’ total external assets
72.1
20
30
40
50
60
70
80
2010 2011 2012 2013 2014
Source: Haver Analytics and Department of Statistics, Malaysia
Malaysia South Korea Thailand
Indonesia Phillippines
The adverse effects of exchange rate changes on the short-term external debt are also largely contained. About 25% of the short-term external debt is denominated in ringgit and therefore is not affected by the valuation changes. Of the remaining external debt that is denominated in foreign currency, which is largely hedged, about 70% is held by banks.
Banking sector accounted for the largest share of short-term external debtThe banking sector accounted for about 70% of the short-term external debt. This debt is mainly in the form of interbank borrowings and NR deposits in the domestic banking institutions. To a much lesser extent, the banks’ short-term external debt also includes other short-term external debt comprising short-term loans from offshore banks and miscellaneous payables4.

AN
NU
AL R
EPOR
T 2015EC
ON
OM
IC D
EVELO
PMEN
TS IN 2015
56 3
Non-bank corporations constitute the second largest owners of short-term external debt (22%), mainly in the form of trade credits and intercompany loans. Non-resident controlled companies accounted for about 78.7% of the non-bank corporations’ short-term external debt. Bank Negara Malaysia is the country’s third largest owner of short-term external debt due to the high non-resident ownership of Bank Negara Monetary Notes (BNMNs). The remaining and relatively smaller holdings of short-term domestic debt securities by non-residents are concentrated in the Government’s Treasury Bills.
Borrowers’ debt servicing capacity has shown resilience to exchange rate shocks(a) Banking sector – Prudent and active management of liquidity and foreign exchange risks
Interbank borrowing and the placements of funds by foreign entities constitute short-term debt liabilities of the domestic banking institutions. Partly, this refl ects the banks’ intragroup liquidity management operations which involve the centralised pooling of excess liquidity across the various overseas banking operations. There are also placements of deposits from foreign parent entities in the locally incorporated foreign banks. For banks in Labuan5, which accounted for about 40% of total interbank borrowing and NR deposits placements, their debt refl ects mainly borrowing by non-resident controlled banks from intra-group entities operating in the regional fi nancial centres, namely in Hong Kong and Singapore. The risks associated with these placements and borrowings are prudently managed through the banks’ liquidity management practices. These include, but are not limited to, internal limits on funding and maturity mismatches and the establishment of contingent funding lines with parent banks to absorb foreign currency funding shocks. Of great signifi cance, the risk of maturity mismatch is contained given that the banks’ short-term external assets have grown in tandem with the growth in their short-term external debt.
In addition to foreign currency assets, banks are prudently managing the foreign exchange risks of their debt. This was evident in the banks’ low net open positions relative to total capital, which incorporates foreign exchange exposures across all tenures (short- and long-term) and sources (domestic and abroad).
5 Effective from the fi rst quarter of 2008, entities in Labuan International Business and Financial Centre (Labuan IBFC) have been treated as residents, instead of as non-residents previously, in the compilation of external debt.
Chart 7
Components of Short-term External Debt(% share, end-2015)
Source: Bank Negara Malaysia.
Interbankborrowing
45.8%
NR deposits23.2%
BankingInstitutions
Non-bankcorporations
Other3.7%
Trade credits15.3%
Intercompany loans4.2%
NR holdingsof domestic debt securities
7.7%
BNM

AN
NU
AL
REP
OR
T 20
15EC
ON
OM
IC D
EVEL
OPM
ENTS
IN 2
015
574
(b) Non-bank corporations – availability of export earnings, fl exible and concessionary intercompany loans and hedged external exposuresTrade credits and intercompany loans constitute the bulk of non-bank corporations’ short-term external debt. As with any trade-related activity, trade credit liabilities arise from the deferred settlement of outstanding invoices. These trade credits were normally granted by foreign trade partners to importers with sound fi nancial standing and low credit risk. As bulk of imports areintermediate goods for the production of goods for export, a majority of companies with trade credits have foreign currency export earnings. Available data shows that export earnings of 60% of these companies exceed their respective trade credits. In addition, about half of the remaining companies have export earnings that partially offset their trade credits.
Chart 8
Banking System Foreign Exchange Net Open Position
Source: Bank Negara Malaysia
4
5
6
7
8
2012 2013 2014 2015
% of total capital
M J S D M J S D M J S D M J S D
Source: Department of Statistics, Malaysia, MATRADE and Bank Negara Malaysia
RM bil l ion RM bil l ion
Chart 9
Trade Credit Liabilities vs. Gross Imports
Trade credits, intra-group companies
Trade credits, non-related companies
Gross imports (RHS)
0
100
200
300
400
500
600
700
800
0
50
100
150
200
250
2009 2010 2011 2012 2013 2014 2015
Intercompany loans comprise offshore borrowing by foreign multinational corporations (MNCs) from their parent companies and, to a lesser extent by local companies (approximately 20% of total intercompany loans) from their subsidiaries abroad. BNM has liberalised rules governing these loans since 2008 such that they are no longer subjected to any approval requirements. This has allowed for the more flexible management of financial resources within corporate groups.

AN
NU
AL R
EPOR
T 2015EC
ON
OM
IC D
EVELO
PMEN
TS IN 2015
58 5
Based on a recent BNM survey, a significant proportion of intercompany loans are provided on flexible and concessionary terms. These include, in particular, no fixed repayment schedules and zero or low interest rates that are much lower than the prevailing market rates. These flexibilities and concessionary terms enable corporations to meet their debt obligations without much difficulty.
The foreign currency external debt obligations of corporations are largely hedged, either naturally through foreign currency earnings or through financial instruments, thereby limiting any potential adverse impact from the weaker ringgit on their debt servicing capacity.
(c) BNMNs – An instrument to manage liquidityBNMNs were introduced in 2006 as an instrument for BNM to manage liquidity in both the conventional and Islamic financial markets. The main objective of BNMNs is to increase the efficiency of absorbing excess liquidity from the financial system during period of capital inflows. Subsequently, BNMNs can be unwound during periods of capital outflows, re-injecting the liquidity and thus limiting the changes in liquidity conditions within the domestic financial markets.
NR holdings of BNMNs fell from a peak of RM85.7 billion as at end-August 2014 to RM14.0 billion in mid-August 2015. As at end-2015, NR holdings of BNMNs had again increased but moderately to RM23.7 billion. Partly in response to the reduction in liquidity arising from the short-term capital outfl ows, the Bank had stopped new issuances and allowed the instruments to mature in the fi rst half of 2015. Only in the latter half of 2015 did the Bank re-issue BNMNs when capital fl ows began to stabilise in late August 2015. In addition to BNMNs, the Bank is well-equipped with a host of monetary policy instruments to manage domestic liquidity.
ConclusionMalaysia’s short-term external debt is manageable. Malaysian entities have increasingly acquired assets abroad over the years amid the progressive liberalisation of the foreign exchange administration rules.
Chart 10
Distribution of Short-term Intercompany Loans by Activity, end-2015
Source: Bank Negara Malaysia
18.4%
42.9%
15.9%
22.8%
Foreign MNCs:RM11.7 billion
7.2%
6.1%
5.5%
43.8%
6.0%
15.5%
15.8%
Local companies:RM3.2 billion
Manufacturing Finance andInsurance/Takaful
Wholesale and retail trade,repair of motor vehiclesand motorcycles
Agriculture, Forestryand Fishing
Construction Information andCommunication
Others

AN
NU
AL
REP
OR
T 20
15EC
ON
OM
IC D
EVEL
OPM
ENTS
IN 2
015
596
Given the level of external assets and foreign currency earnings, the external debt obligations of these corporations and banks do not create claims on the Central Bank’s international reserves. Furthermore, fl exible and concessionary intercompany loans enhance the capacity to repay these loans by non-bank corporations while banks actively manage their liquidity and foreign exchange risks. In conclusion, while Malaysia is not immune to global developments, prudent management of external debt will continue to ensure that Malaysia’s short-term external debt remains manageable and that it does not undermine the economy’s resilience against adverse exchange rate shocks.

AN
NU
AL R
EPOR
T 2015EC
ON
OM
IC D
EVELO
PMEN
TS IN 2015
60
exchange markets, particularly in times of higher outflows.
Malaysia has demonstrated its ability to withstand external shocks by drawing on its economic adaptability, financial buffers and robust policy frameworks that have been built over the years
Importantly, despite the challenges posed by the drop in commodity prices and financial markets volatility, Malaysia’s core fundamentals have remained sound, enabling the economy to confront domestic and external challenges during the year. The flexibility of the exchange rate allowed the ringgit to adjust appropriately to the changes in external conditions, acting as an absorber of shocks arising from the turbulent global financial markets. At the same time, the international reserves have acted as a buffer by preventing excessive volatility of the exchange rate and ensuring the smooth functioning of financial markets during periods of large short-term capital flows. It is these factors, together with continued surpluses in the current account, the manageable level of external debt, and the diversified domestic economic structure, that have accorded the country with the capacity to weather external shocks.
INFLATION DEVELOPMENTS
Headline inflation, as measured by the annual percentage change in the Consumer Price Index (CPI), declined to 2.1% in 2015 (2014: 3.2%). Headline inflation was, however, relatively more volatile in 2015. It declined sharply at the beginning of the year to a low of 0.1% in February but increased in the second quarter to peak at 3.3% in July before moderating slightly thereafter. The volatility in headline inflation largely reflected a series of adjustments in domestic fuel prices. For the year as a whole, the lower headline inflation was largely due to the impact of the lower global energy and commodity prices, which more than offset the effects from a weaker ringgit exchange rate, the implementation of GST, and several upward adjustments in administered prices made towards the end of the year.
Non-resident deposits declined to RM81.6 billion (2014: RM87.7 billion), reflecting maturity of deposits placed with the domestic banking institutions.
Overall, Malaysia’s external debt remains manageable. The profile of Malaysia’s external debt remains healthy with more than half being skewed towards the medium- to long-term tenures. Risks from foreign exchange fluctuations were largely contained as about 36% of the external debt is ringgit-denominated while the foreign currency-denominated debt is largely hedged. Debt service ratio remained low at 22.6% in 2015 (2014: 19.1%). International reserves are adequate to meet short-term external debt obligations with a coverage of 1.2 times (see also the White Box on Deciphering Short-term External Debt). It is important to note that not all short-term external debt creates a claim on reserves given the export earnings and external assets of borrowers.
Resilience against external shocks Being a highly open economy with substantial linkages to the global economy and financial markets, Malaysia is certainly not insulated from the heightened uncertainty and risks emanating from external developments. However, Malaysia has demonstrated its ability to withstand external shocks experienced during the year by drawing on its economic adaptability and the safeguards provided by financial buffers and robust policy frameworks that have been built over the course of many years.
Despite considerable volatility of capital flows, the impact on domestic financial markets was not significant, allowing them to function uninterrupted and to maintain effective financial intermediation to support the real economy. Malaysia’s deep and diversified domestic financial markets together with a strong and resilient financial sector were able to accommodate and smoothly intermediate the large volumes of capital flows. The presence of domestic institutional investors was pivotal in providing sustained demand for domestic financial assets as foreign investors rebalanced their exposures. In addition, the Bank’s monetary operations and the judicious use of several policy instruments helped to ensure the availability of sufficient liquidity to support the orderly functioning of the money and foreign

AN
NU
AL
REP
OR
T 20
15EC
ON
OM
IC D
EVEL
OPM
ENTS
IN 2
015
61
Notwithstanding the volatility in headline inflation, core inflation3 was stable averaging 2.3% during the year (2014: 2.3%). The stability of core inflation reflected the moderate domestic demand conditions, the absence of excessive wage pressures, and the benign global inflation environment.
While headline inflation was lower in 2015, price increases during the year were more pervasive. The share of items in the CPI basket with inflation above 4%, increased to 32% in the second quarter following the implementation of GST (11% in the first quarter). It continued to increase further to 41% in the second half of the year as some firms that had initially absorbed the GST started to pass on the GST to consumers. This was compounded by the continued weakening of the ringgit and higher prices of fresh food items. Items with inflation above 4% were mainly food items, alcoholic beverages, and personal care and health products. However, as these items account for less than 50% of the weights of the CPI basket, the higher inflation was offset by lower inflation in other items such as fuel, utilities, and clothing and footwear. Notwithstanding this development in headline inflation, to the extent that different households would have different consumption baskets, the rate of inflation experienced would be different across different income groups and locations (See Box Article on Inflation and the Cost of Living).
In terms of categories, the decline in inflation during the year was due mainly to lower inflation in the transport and housing, water, electricity, gas and other fuels categories. The transport category registered a negative inflation of -4.5% in 2015 (2014: 4.9%) due to the decline in domestic fuel prices. The average prices of RON97 petrol, RON95 petrol and diesel were lower at RM2.33, RM1.98 and RM1.92 per litre, respectively, in 2015 (2014: RM2.78, RM2.15 and RM2.05 per litre, respectively). Domestic fuel prices were lower due to the lower
3 Core inflation attempts to measure the underlying inflation rate. For Malaysia, core inflation is computed by excluding price-volatile and price-administered items whose price movements are more likely to be affected by temporary shocks and volatile supply factors rather than persistent changes in underlying factors affecting demand and supply conditions. In addition, core inflation also excludes the estimated direct impact of GST.
Chart 1.16
Consumer Price Inflation
Headline Inflation Core Inflation
0.0
0.5
1.0
1.5
2.0
2.5
3.0
3.5
4.0
J F M A M J J A S O N D J F M A M J J A S O N D J F M A M J J A S O N D
Annual growth (%)
2013 20152014
Source: Department of Statistics, Malaysia and Bank Negara Malaysia
Chart 1.17
Contribution to Headline Inflation by Components
Core inflation Price-volatile items Fuel
Otherprice-administereditems
GST Headline inflation
Source: Department of Statistics, Malaysia and Bank Negara Malaysia
-2.0
-1.0
0.0
1.0
2.0
3.0
4.0
5.0
J F MA M J J A S O N D J F MA M J J A S O N D J F MA M J J A S O N D
Percentage points
2013 2014 2015
Chart 1.18
Percentage of CPI Items Registering DifferentInflation Ranges
0 < Inflation ≤ 2
80%
60%
40%
20%
0%
20%
40%
60%
80%
J F M A M J J A S O N D
Inflation ≤ 0
Inflation > 6
2 < Inflation ≤ 4
4 < Inflation ≤ 6
Source: Department of Statistics, Malaysia and Bank Negara Malaysia
2015

AN
NU
AL R
EPOR
T 2015EC
ON
OM
IC D
EVELO
PMEN
TS IN 2015
62
global oil prices, which more than offset the impact of the weaker ringgit on imported refined fuels for domestic usage. Inflation in the housing, water, electricity, gas and other fuels category was also lower at 2.5% (2014: 3.4%) due to the downward revisions in electricity tariffs in the first quarter of 2015.
The implementation of GST at 6% on 1 April 2015 led to higher inflation for most categories of
consumer goods and services. The price increases were especially notable in the furnishings, household equipment and routine household maintenance, communication and miscellaneous goods and services categories. While the price increases were broad-based across most CPI categories, the overall impact was still contained as GST contributed only 0.7 percentage point to headline inflation in 2015. This was lower than the initial estimate of 1.0 percentage point. The lower-than-expected impact was partly due to the absorption of GST by some firms at the initial stage of implementation. In addition, the spillover effects from GST were small amidst active enforcement of the Price Control and Anti-Profiteering Act 2011 by the Government to ensure that price increases were not excessive.
Inflation during the year was also influenced by the shortages in the supplies of fresh food amid adverse weather conditions, particularly in the second half of the year. Prices of fresh vegetables rose by 7.7% during the year (2014: 1.6%) as irregular weather and prolonged haze conditions affected the quality and yields of crops. Towards the end of the year, upward adjustments in several administered prices such as toll charges, railway fares and cigarette prices
Chart 1.19
Contribution to Inflation by Categories
Source: Department of Statistics, Malaysia and Bank Negara Malaysia
20152014
Percentage points
-1.0 -0.5 0.0 0.5 1.0 1.5 2.0 2.5 3.0 3.5
Total
Food and non-alcoholic beverages
Housing, water, electricity,gas and other fuels
Alcoholic beverages and tobacco
Miscellaneous goods and services
Restaurants and hotels
Furnishings, household equipmentand routine household maintenance
Communication
Recreation services and culture
Health
Education
Clothing and footwear
Transport
1
Table 1.9
Infl ation by Categories (Pre- and Post-GST Implementation)
Categories
1Q 2015
(Pre-GST)
2Q - 4Q 2015
(Post-GST)
Average infl ation (%)
Food and non-alcoholic beverages 2.5 4.0
Alcoholic beverages and tobacco 10.6 14.4
Clothing and footwear -0.3 0.8
Housing, water, electricity, gas and other fuels 2.1 2.5
Furnishings, household equipment and routine household maintenance 0.3 3.5
Health 3.4 4.8
Transport -7.6 -3.5
Communication -0.9 2.9
Recreation services and culture 0.6 2.1
Education 2.1 2.5
Restaurants and hotels 3.1 4.6
Miscellaneous goods and services 1.6 5.0
Total 0.7 2.6
Source: Department of Statistics, Malaysia and Bank Negara Malaysia
Chart 1.20
Domestic Fuel Prices in 2015
Source: Ministry of Domestic Trade, Co-operatives and Consumerism, and Bank Negara Malaysia
RON97 Petrol RON95 Petrol Diesel
RM per litre
1.60
1.70
1.80
1.90
2.00
2.10
2.20
2.30
2.40
2.50
2.60
J F M A M J J A S O N D
2015

AN
NU
AL
REP
OR
T 20
15EC
ON
OM
IC D
EVEL
OPM
ENTS
IN 2
015
63
5 Bank Negara Malaysia estimates. These prices incorporate both prices of imported and locally sourced raw and intermediate materials.
6 Based on estimation from the Input-Output Tables 2010 for Malaysia, about 20% of the gross output is imported intermediate inputs.
also contributed to the inflationary pressures. However, given that most of these adjustments were implemented towards the end of the year, the impact on overall inflation for 2015 was small.
During the year, the ringgit depreciated by 16.6% against the currencies of Malaysia’s major import partners. However, despite the depreciation, the impact on domestic inflation, both through the direct and indirect channels, was modest. Through the direct channel, the weaker ringgit resulted in an increase in the prices of imported finished goods. Excluding fuel, imported CPI increased by a higher rate of 3.0% in 2015 (2014: 0.9%). This was driven mainly by higher prices of imported food items, which rose by 5.7% (2014: 2.4%). However, the impact on overall inflation was contained as these imported goods only constitute a small share of the CPI basket at 7.2%.
The indirect impact of the weaker ringgit through imports of raw and intermediate inputs was also modest, being offset by the much larger decline in global commodity prices. The IMF Primary Commodity Price Index fell by a double-digit rate of 35.3% in 2015. The decline in prices was registered across most types of commodities due mainly to ample supplies amidst the weak global demand. Global food prices were lower as reflected by the decline of 17.1% in the IMF Food Price Index4 (2014: -4.1%) due mainly to the record high
1
Table 1.10
Adjustments in Administered Prices in 2015
Date Items
Quantum of Adjustment
RM %
1 March 2015 ElectricityAverage of
-1 sen/kWh for households
-3.1
29 June 2015 Cigarettes+RM0.30/pack
of 202.2
15 October 2015 Toll chargesAverage increase of 40% affecting 18 intracity highways
4 November 2015 Cigarettes+RM3.20/pack
of 2023.2
2 December 2015
KTM railway charges
+4 sen/km 36.4
LRT and Monorail railway charges
Average increase of 10% depending on length of commute
production of selected crops and overall low energy costs. Notwithstanding the weaker ringgit, the lower global commodity prices had led to an overall reduction in the costs of inputs for local producers. Prices of both raw and intermediate materials faced by producers, for example, declined by 15.6% and 3.4%5, respectively during the year (2014: -1.0% and 2.6% respectively), resulting in the Producer Price Index (PPI) declining by 4.8% in 2015 (2014: 1.4%). The impact of the weaker ringgit through the indirect channel was also contained by the small share of imported intermediate inputs in the producers’ cost structure6 (See Box Article on The Impact of Exchange Rate Depreciation on Inflation in Malaysia).
Domestically, the more moderate domestic demand pressure due to the slower expansion of private consumption and the absence of excessive wage growth, has also helped contain inflationary pressures during the year. Firms’ production capacity remained more than sufficient to meet the increase in consumer demand, as reflected by the relatively stable capacity utilisation rate of 77% in 2015 (2014: 79%) in the manufacturing sector. Information from the Bank’s surveys also indicated that firms were hesitant to fully pass on the higher cost pressures to consumers given the environment of weaker demand.
4 The IMF Food Price Index includes the price index of cereal, vegetable oils, meat, seafood, sugar, bananas and oranges.
Exchange Rate, Global Commodity Prices,Imported CPI and PPI
Source: Department of Statistics, Malaysia, International Monetary Fund (IMF), Bloomberg and Bank Negara Malaysia
Note: The nominal effective exchange rate (NEER) against import partners is calculated based on the weighted average of the bilateral exchange rates against Malaysia’s top 15 import partners. A positive figure indicates a depreciation in ringgit against Malaysia’s main import partners relative to the year before.
Chart 1.21
NEER against import partners Global commodity prices
Imported CPI (RHS) PPI (RHS)
-8
-6
-4
-2
0
2
4
6
-50
-40
-30
-20
-10
0
10
20
30
J F MA M J J A S O N D J F MA M J J A S O N D J F MA M J J A S O N D
2013 2014 2015
Annual growth (%) Annual growth (%)

AN
NU
AL R
EPOR
T 2015EC
ON
OM
IC D
EVELO
PMEN
TS IN 2015
64A
NN
UA
L R
EPO
RT
2015
ECO
NO
MIC
DEV
ELO
PMEN
TS IN
201
5
Infl ation and the Cost of Living
This article briefl y highlights the differences between Consumer Price Index (CPI) infl ation and the cost of living. It also presents analyses of the differences in infl ation rates across various income groups and across states in Malaysia, and an assessment of the growth in income and expenditure of Malaysian households, using data from the 2014 Household Income and Basic Amenities Survey (HIS/BA), the 2014 Household Expenditure Survey (HES) and the disaggregated state-level CPI data.
I. Differences between CPI infl ation and the cost of livingThe infl ation rate, as measured by the change in the Consumer Price Index (CPI), refl ects the average rate of increase in the price of a basket of goods and services. The CPI is constructed by assuming that there is a single basket of goods and services which represents the consumption basket of all households in the country1. Prices of goods and services that are used to construct the CPI are the average prices collected from retail outlets across the country. Thus, the CPI captures the average increase in prices with the assumption of homogeneity of spending patterns across households and holding the quantity and quality of the goods and services in the consumption basket as constant. As the CPI refl ects average prices in the economy, it provides a good measure of the changes in the overall price level of goods and services in the economy. As such, it is a relevant and useful indicator for the conduct of macroeconomic policies, such as monetary policy, that aim to affect the broader economy.
The cost of living, on the other hand, refers to the amount of expenditure on goods and services incurred by households, including their fi nancial obligations, to maintain a certain standard of living2. This spending or cost of living is determined by both household spending patterns and the prices faced by households. Spending patterns differ across households as the patterns are primarily infl uenced by household income, demography, family structure and area of residence3. Price changes faced by households, in turn, vary by geographical factors.
As the CPI masks the heterogeneity in household spending patterns and the variations in price changes of goods and services faced by households, the inflation rate is considered as an approximation of the rate of increase in the cost of living. To the extent that the dispersion in spending patterns and variation in price changes are insignificant, the CPI is a reasonable gauge of the cost of living. In a situation where the dispersion in spending patterns and price changes are large, the inflation rate could be a weak approximation of the rate of increase in the cost of living. In this regard, the CPI could understate or overstate the cost of living for some segments of households4. Given the heterogeneity in spending patterns and significant variations in the prices of goods and services, a more meaningful analysis of the cost of living requires assessing changes in spending patterns and costs across the various household categories and geographical locations. The most common dimension is to assess the changes in the cost of living over time, across different income groups and across states or regions in a country.
II. An analysis of the cost of living using household surveys and disaggregated CPI dataUsing data from the Household Income and Basic Amenities Survey (HIS/BA) and the Household Expenditure Survey (HES)5 for 2009 and 2014; as well as the disaggregated state-level6 CPI data, this
1 The composition of goods and services in the CPI basket and their respective weights are determined based on the aggregate household expenditure patterns obtained from a nationwide expenditure survey. In Malaysia, the CPI basket is revised every fi ve years based on the Household Expenditure Survey as per international practice. The latest CPI weights, based on the 2014 survey, were released in January 2016.2 The standard of living measures the quality of life or the level of material prosperity enjoyed by individuals.3 Other factors could include education level and ethnicity.4 Empirical studies show that the CPI can also at times overstate the cost of living because of substitution bias. Due to the fi xed CPI basket, it may not capture the substitution to cheaper goods and services, which could effectively lead to a decline in cost of living, despite higher prices.5 Both the HIS/BA and the HES are carried out using a personal interview approach, covering urban and rural areas for all states. The surveys are carried out by probability sampling that represents all households in Malaysia.6 CPI by states is published by the Department of Statistics, Malaysia, with data series available since 2011.

AN
NU
AL
REP
OR
T 20
15EC
ON
OM
IC D
EVEL
OPM
ENTS
IN 2
015
65A
NN
UA
L REPO
RT 2015
ECO
NO
MIC
DEV
ELOPM
ENTS IN
2015
study analyses the cost of living for different groups of households in Malaysia. The HIS/BA is conducted every two to three years to collect statistics pertaining to the pattern of income distribution of Malaysian households. The HES is conducted once every fi ve years to collect comprehensive information on the level and pattern of consumption expenditure of households.
Chart 1 shows the differences in spending patterns across different income groups for households in Malaysia based on the most recent HES survey. The lower income groups allocate more of their expenditure to food, and less to transport, healthcare, education and discretionary spending compared to the higher income groups. Households in highly urbanised states7,8 such as Kuala Lumpur and Selangor spend more on housing, whereas households in the less urbanised states9 such as Pahang and Kelantan spend more on food.
Prices may also vary signifi cantly across different locations. Differences in prices refl ect mainly variations in distribution, labour and rental costs, and relative demand and supply conditions. For example, based on the state-level CPI data published by the Department of Statistics Malaysia, rental rates in the more highly urbanised states are typically higher and increase at a faster rate than the less urbanised states. Similarly, price increases particularly in the food and non-alcoholic beverages, restaurants and hotels, education and recreation services and culture categories are also generally higher in the highly urbanised states. As a result, highly urbanised states such as Kuala Lumpur, Johor, Pulau Pinang and Selangor registered higher infl ation rates (Table 1).
Household infl ation rates for 2015 are derived by combining the information obtained from spending patterns across income groups and the price changes across states (Table 2). The fi ndings show that infl ation rates do vary across households and can be materially different from the national average.
7 Highly urbanised states are states that register urbanisation levels of above 70%. The level of urbanisation is computed in the 2010 Population and Housing Census of Malaysia (Census 2010). These states include Kuala Lumpur, Selangor and Putrajaya, Pulau Pinang, Melaka and Johor. 8 For the purpose of this article, the defi nition of states refers to the 13 states and three federal territories, as categorised in the HIS and HES.9 The less urbanised states are states that register urbanisation levels of below 55%. These states include Sabah, Sarawak, Pahang and Kelantan.
Chart 1
Household Consumption Basket by Income Groups and States
Top 2061-8041-6021-40Bottom 20 Highly urbanised
states
Semi-urbanised
states
Lessurbanised
states
Housing, water, electricity, gas and other fuels Transport Health and Education
By income group By state
Discretionary spending*
*Discretionary spending includes spending on alcoholic beverages and tobacco,clothing and footwear, furnishings, household equipment and routine householdmaintenance, communication, recreation services and culture, restaurants and hotels and miscellaneous goods and services.
Note: 1. The highly urbanised states have urbanisation level of above 70%, semi-urbanised states between 55% to 69% and less urbanised states below 55%. 2. Expenditure in the food and non-alcoholic beverages category includes expenditure for food away from home.
Source: 2014 Household Expenditure Survey, 2010 Population and Housing Census of Malaysia (Census 2010) and Bank Negara Malaysia estimates
0%
20%
40%
60%
80%
100%
Food and non-alcoholic beverages

AN
NU
AL R
EPOR
T 2015EC
ON
OM
IC D
EVELO
PMEN
TS IN 2015
66A
NN
UA
L R
EPO
RT
2015
ECO
NO
MIC
DEV
ELO
PMEN
TS IN
201
5
• Higher infl ation rates in the highly urbanised states. The national average infl ation rate was generally lower than infl ation rates of households in highly urbanised states such as Kuala Lumpur, Selangor and Putrajaya, Pulau Pinang and Johor in 2015. Households in these states account for 43% of the total population of Malaysia. The national average infl ation rate was higher than the infl ation rates experienced by households in some semi- and less urbanised states, namely Perak, Kedah, Perlis, Sabah and Sarawak. Households in these states account for 36% of the total Malaysian population.
• Higher infl ation rates for the lower income groups across most states in Malaysia. Households in the bottom 20% of the income group experienced infl ation rates that were 0.12 to 1.10 percentage points higher than households in the top 20% of the income group. For highly urbanised states, the differentials were higher, averaging 0.6 percentage point (0.4 percentage point for the less urbanised states). As the lower income groups spend a larger share of their expenditure on food, they experienced higher infl ation due to the higher food infl ation in 2015 (3.6%, 2014: 3.3%). The lower income groups also benefi tted less from the decline in domestic fuel prices during the year given the lower share of expenditure on fuel. Thus, the lower income households living in highly urbanised states tend to experience the largest increase in their cost of living10.
The change in the cost of living was also assessed using the actual household expenditure data from the 2014 HES. Based on this analysis, aggregate household expenditure, including for fi nancial obligations11, rose at a compounded annual growth rate (CAGR) of 8.5% during the period 2010 - 2014. The higher expenditure growth relative to the CAGR of CPI of 2.6% for the same period suggests that growth in expenditure was not only driven by higher prices, but also by an increase in the volume of consumption of goods and services. The strong growth in expenditure was observed across all income groups (Chart 2). Aggregate discretionary spending, in particular, rose strongly by 9.0% (Chart 4), contributed mainly by higher spending on restaurants and hotels, recreational services and communication (Chart 5).
10 This fi nding holds for the period 2011-2015.11 Financial obligations include transfer payments such as contribution to the Employee Provident Fund (EPF) and income tax payments; as well as the repayment of loans.
1
Table 1
Infl ation by States based on Level of Urbanisation in 2015
Highly urbanised states
Semi-urbanised states
Less urbanised states
Average infl ation (%)
Total 2.5 1.8 1.4
Food and non-alcoholic beverages 4.2 3.2 3.0
Alcoholic beverages and tobacco 13.4 14.1 13.6
Clothing and footwear 0.6 -0.1 0.1
Housing, water, electricity, gas and other fuels 3.5 2.8 0.3
Furnishings, household equipmentand routine household maintenance 3.1 2.9 2.3
Health 4.9 4.0 4.2
Transport -4.8 -4.9 -4.1
Communication 1.9 2.5 2.3
Recreation services and culture 1.8 0.9 1.0
Education 3.4 2.6 2.2
Restaurants and hotels 4.6 3.3 3.6
Miscellaneous goods and services 4.3 4.1 4.1
Source: Department of Statistics, Malaysia, and Bank Negara Malaysia estimates

AN
NU
AL
REP
OR
T 20
15EC
ON
OM
IC D
EVEL
OPM
ENTS
IN 2
015
67A
NN
UA
L REPO
RT 2015
ECO
NO
MIC
DEV
ELOPM
ENTS IN
2015
CPI Infl ation by States and Income Groups in 2015 (Annual change,%)
Income percentile
Bottom 20 21-40 41-60 61-80 Top 20 Total
MALAYSIA 2.1
Highlyurbanised states
Kuala Lumpur 3.01 2.87 2.78 2.74 2.73 2.78
Infl ation tends to be higher for more urbanised states
Selangor & Putrajaya 2.70 2.51 2.38 2.33 2.16 2.34
Pulau Pinang 2.72 2.56 2.50 2.46 2.30 2.45
Melaka 2.57 2.23 2.31 1.76 1.47 1.92
Johor 3.14 2.92 2.95 2.86 2.49 2.78
Semi-urbanised states
Negeri Sembilan 2.77 2.62 2.56 2.26 1.92 2.30
Perak 2.06 1.95 1.80 1.77 1.60 1.77
Kedah & Perlis 2.25 1.93 1.83 1.62 1.29 1.65
Terengganu 2.04 2.00 1.98 1.97 1.60 1.85
Less urbanised states
Sabah & Labuan 1.08 0.97 0.96 0.82 0.80 0.88
Sarawak 1.54 1.48 1.47 1.43 1.42 1.45
Pahang 2.23 2.03 2.00 1.68 1.64 1.83
Kelantan 2.33 2.08 1.98 1.90 1.69 1.91
Infl ation tends to be higher for lower income groups
Note: 1. The highly urbanised states have urbanisation level of above 70%, semi-urbanised states between 55% to 69% and less urbanised states below 55%.
2. While the urbanisation level is high in Labuan, its infl ation rate is reported together with Sabah as the expenditure patterns and prices of goods and services in the two states are similiar. 3. Household infl ation rates are derived based on the share of household expenditure by category obtained from the 2014 Household Expenditiure Survey and the disaggregated state-level infl ation rates.
Source: 2014 Household Expenditure Survey, Department of Statistics, Malaysia and Bank Negara Malaysia estimates
Table 2
Infl ation higher than national average by 0.2
Infl ation within the national average by +/- 0.2
Infl ation lower than national average by 0.2
The growth in aggregate expenditure was accompanied by an increase in aggregate household income, which increased by a CAGR of 8.8% during the same period. On average, the level of income exceeded that of expenditure for all income groups, allowing households to save a portion of their income (Chart 3). However, a more detailed analysis of the disaggregated data from the 2014 HIS/BA and 2014 HES reveals the following:
• Dissaver households. There are households, mainly from the lower income groups, that spend more than their income.
• The bottom 40% of households12. Financial obligations of these households, including loan repayments, have registered relatively strong growth. Consequently, these households, who only have a relatively small amount of savings13, are vulnerable to both income and price shocks.
12 The bottom 40% of households are households which fall under the bottom 40% of the nation’s income distribution, which is below RM3,649 based on the 2014 HIS/BA.13 About 28% of the bottom 40% of households do not save on a monthly basis, while 11% of them save RM100 or less a month.

AN
NU
AL R
EPOR
T 2015EC
ON
OM
IC D
EVELO
PMEN
TS IN 2015
68A
NN
UA
L R
EPO
RT
2015
ECO
NO
MIC
DEV
ELO
PMEN
TS IN
201
5
• Households earning fi xed incomes, including pensioners. While aggregate income grew at an average of 8.8%, there are segments of the total population who experienced a much lower or no income growth.
The analysis has shown that the infl ation rates experienced by households vary due to differences in spending patterns and price changes. In particular, households in the lower income groups living in highly urbanised states experienced higher infl ation. At the aggregated level, the rise in the cost of living, on average, has been accompanied by a commensurate increase in income. At a disaggregated level, however, analysis of both income and expenditure data shows that there are segments of the society that are vulnerable to the increase in the cost of living, and these are households who dissaved; the bottom 40% of households; and households earning fi xed incomes.
Chart 2
Growth in Average Household Income andExpenditure*
0.0
2.0
4.0
6.0
8.0
10.0
12.0
Total Bottom20
21-40 41-60 61-80 Top 20
CAGR (%)
Income percentile
Source: 2014 and 2009 Household Income and Basic Amenities Survey, 2014 and 2009 Household Expenditure Survey, and Bank Negara Malaysia estimates
*Including financial obligations
Income Expenditure*
Chart 4
Growth in Average Household Expenditure by Type
Source: 2014 and 2009 Household Expenditure Survey and Bank Negara Malaysia estimates
0.0
2.0
4.0
6.0
8.0
10.0
12.0
14.0
16.0
Total Bottom20
21-40 41-60 61-80 Top 20
CAGR (%)
Income percentile
Necessities Discretionary Financial obligations
Chart 5
Contribution to Growth in Discretionary Spending
Source: 2009 and 2014 Household Expenditure Survey and Bank Negara Malaysia estimates
Alcoholic beveragesand tobacco
8%
Clothing andfootwear
9%
Furnishings,household
equipment and routine
household maintenance
9%
Communication10%
Recreational services and culture14%
Restaurantsand hotels
36%
Miscellaneous goodsand services
14%
Chart 3
Average Household Income and Expenditure*RM per month
Income percentile
0
2,000
4,000
6,000
8,000
10000
12,000
14,000
Total Bottom 20 21-40 41-60 61-80 Top 20
*Including financial obligations
Income Expenditure*
Source: 2014 Household Income and Basic Amenities Survey, 2014Household Expenditure Survey, and Bank Negara Malaysia estimates

AN
NU
AL
REP
OR
T 20
15EC
ON
OM
IC D
EVEL
OPM
ENTS
IN 2
015
69A
NN
UA
L REPO
RT 2015
ECO
NO
MIC
DEV
ELOPM
ENTS IN
2015
ConclusionIn addressing the issue of the rising cost of living, the policy approach must be multi-dimensional, including measures to address the challenges of urbanisation such as housing and connectivity, improving fi nancial education and awareness, and enhancing productivity and income. Of importance, greater efforts would need to be directed at increasing the productivity level of Malaysians through the adoption of modern technology and increasing the skills of workers through access to better education and training. This would enable Malaysians to move up the value chain towards higher value-added jobs to achieve higher income and hence, afford a higher standard of living.
ReferencesBoskin M J, E R Dulberger, R J Gordon, Z Griliches, D W Jorgensen (1998). `Consumer Prices, the Consumer Price Index, and the Cost of Living´, Journal of Economic Perspectives, Vol 12, No 1.
Department of Statistics, Malaysia (2014). `Household Expenditure Survey´.
Department of Statistics, Malaysia (2014). `Household Income and Basic Amenities Survey´.
Department of Statistics, Malaysia (2009). `Household Expenditure Survey´.
Department of Statistics, Malaysia (2009). `Household Income and Basic Amenities Survey´.
Jacobs D, Perera D, Williams T (2014). `Infl ation and the Cost of Living´, Reserve Bank of Australia Bulletin (March Quarter).
Phillips B, J Li, M Taylor (2012). `Prices These Days! The Cost of Living in Australia´, AMP.NATSEM Income and Wealth Report, Issue 31, May, Sydney, AMP.
Schultze C, Mackie C (Eds.) (2002). `At What Price?: Conceptualizing and Measuring Cost-of-Living and Price Indexes, Panel on Conceptual, Measurement, and Other Statistical Issues in Developing Cost-of-Living Indexes´, Committee on National Statistics, Division of Behavioral and Social Sciences and Education, National Research Council, National Academy Press, Washington D.C.

AN
NU
AL R
EPOR
T 2015EC
ON
OM
IC D
EVELO
PMEN
TS IN 2015
70A
NN
UA
L R
EPO
RT
2015
ECO
NO
MIC
DEV
ELO
PMEN
TS IN
201
5
The Impact of Exchange Rate Depreciation on Infl ation in Malaysia
IntroductionThe persistent depreciation of the ringgit since September 2014 has raised concerns about the risk of higher infl ation in Malaysia. In general, large and persistent exchange rate depreciation in a small and open economy would entail higher domestic infl ation as imports become more expensive. The Malaysian experience in the past two decades, however, has shown that episodes of persistent exchange rate depreciation may not always result in signifi cantly higher infl ation (Chart 1). The outcome is also dependent on other developments affecting the economy. This is highlighted by the experience that while the ringgit depreciation in the period 1997-1998 resulted in high infl ation, the more recent depreciation episode has instead coincided with periods of low infl ation.
This article is divided into two parts. The fi rst part presents fi ndings from estimations of the exchange rate pass-through (ERPT) to infl ation in Malaysia and the second part provides insights on why infl ation could be high in certain episodes of exchange rate depreciation but low in others.
Chart 1
Exchange Rate and Inflation
Note: The nominal effective exchange rate (NEER) against import partners is calculated based on the weighted average of the bilateral exchange rates against Malaysia’s top 15 import partners. A positive figure indicates a depreciation in the ringgit against Malaysia’s main import partners relative to the year before.
Source: Department of Statistics, Malaysia, Bloomberg and Bank Negara Malaysia
-20
-10
0
10
20
30
40
50
-4
-2
0
2
4
6
8
10
1995
1996
1997
1998
1999
2000
2001
2002
2003
2004
2005
2006
2007
2008
2009
2010
2011
2012
2013
2014
2015
Headline inflation
RM/USD (RHS)
NEER against import partners (RHS)
Annual change (%) Annual change (%)
A. Exchange rate pass-through to infl ation in MalaysiaERPT to infl ation refers to how much domestic prices change in response to changes in the nominal exchange rate. The transmission from the exchange rate to infl ation occurs through two main channels. First is the direct channel via imported fi nished goods in the CPI basket and second is the indirect channel via imported inputs in the production chain (Diagram 1)1.
(i) Direct channel. Fluctuations in the exchange rate directly impact prices of imported fi nished goods. The depreciation of the ringgit, against the currencies of Malaysia’s import partners, increases the costs of importing fi nished goods from these economies.
1 In this article, CPI refers to the Consumer Price Index, CPI-Import is the imported fi nished goods component of CPI excluding fuel, PPI is Producer Price Index, PPI-Import is the imported component of PPI, and PPI-Local is the domestic component of PPI.

AN
NU
AL
REP
OR
T 20
15EC
ON
OM
IC D
EVEL
OPM
ENTS
IN 2
015
71A
NN
UA
L REPO
RT 2015
ECO
NO
MIC
DEV
ELOPM
ENTS IN
2015
(ii) Indirect channel. Exchange rate movements affect input costs of fi rms that use imported inputs in the production of local goods and services. These imported inputs could be in the form of raw materials like wood and wheat, or in the form of intermediate inputs like fabric and metal rods.
In addition, prices of goods and services that are affected by movements of the exchange rate, through either one or both of the channels, could have spillover effects on prices of other goods and services in the CPI. This can consequently lead to a general increase in prices2.
Diagram 1
Transmission Channels from Exchange Rate to Inflation in Malaysia
Source: Department of Statistics, Malaysia and Bank Negara Malaysia
Imported inputs in PPI
Imported finished goods in CPI
Fuel products in CPI
Local finished goods and
services in CPI
CPI
Inflation
Exchange rate
(ER)
• 8.7% of CPI• Depends on global oil prices and ER
• 7.2% of CPI• Depends on global inflation and ER
• 20% of production cost• Depends on global commodity prices and ER
Spil
love
r ef
fect
s to
oth
er p
rice
s
direct
direct
indirect
2 Changes in the exchange rate could also affect domestic infl ation indirectly through the substitution effect. If the exchange rate depreciation makes imported goods more expensive, consumers may switch to domestic products and this can exert upward pressures on prices of domestically produced goods. In addition, the depreciation could also lead to higher demand for exports and result in stronger aggregate demand that can create infl ationary pressures.
3 Pricing strategies of fi rms tend to be different during periods of depreciation and appreciation, which will determine the asymmetric effects of exchange rate pass-through to infl ation. Infl ationary impact during depreciation tends to be larger in size compared to the disinfl ationary impact during appreciation.
4 Unless otherwise stated, the exchange rate in this article refers to the nominal effective exchange rate (NEER). 5 The empirical specifi cation follows a linear Phillips curve equation, which controls for lagged infl ation, global commodity
prices and the output gap. The estimations are carried out using the NEER and results are robust for the nominal bilateral exchange rate (RM/USD).
The conceptual relationship between exchange rate movements and infl ation is illustrated in Chart 2 where depreciation has an infl ationary impact while appreciation has a disinfl ationary impact. The impact of changes in the exchange rate on infl ation can differ in strength between periods of appreciation and depreciation3. This asymmetry arises because fi rms typically react more to pass on the increases in the cost of imports to consumer prices following an exchange rate depreciation but fi rms tend to be less responsive when there is a reduction in costs due to an exchange rate appreciation. In addition, should exchange rate depreciation exceed a certain threshold, fi rms can change their behaviour signifi cantly, resulting in a larger impact on infl ation.
Using historical data over the last two decades, a scatter plot shows a weak positive relationship between the exchange rate4 and infl ation (Chart 3). This suggests that changes in the exchange rate may have a small impact on domestic infl ation. Applying standard methodologies from the literature, the ERPT was empirically estimated5 using the nominal effective exchange rate (NEER) with quarterly data from 1995 to 2015. The results are summarised as follows:

AN
NU
AL R
EPOR
T 2015EC
ON
OM
IC D
EVELO
PMEN
TS IN 2015
72A
NN
UA
L R
EPO
RT
2015
ECO
NO
MIC
DEV
ELO
PMEN
TS IN
201
5(i) Exchange rate pass-through to core infl ation is low. A 10% depreciation in the exchange rate is
associated with an increase in core infl ation between 0.2% and 0.6%6. Over time, the degree of ERPT has remained low and relatively stable7.
(ii) Analysis of disaggregated CPI data shows no signifi cant positive relationship between import content and sensitivity8 to the exchange rate. Conventional wisdom suggests that prices of items with higher import content would be more sensitive to exchange rate changes compared
6 The range refers to short-run ERPT. Variations in the estimates of pass-through arise from different specifi cations of the estimating equation (e.g. number of lags for infl ation, number of lags for exchange rate and the number of control variables, such as demand conditions, and their lags).
7 The ERPT remained stable when comparing two sample periods, 1995-2002 against 2003-2015. Mihaljek and Klau (2008) also conclude that the ERPT in Malaysia has been low and stable when comparing two sample periods, 1994-2000 against 1994-2006.
8 Sensitivity refers to the degree of ERPT for the individual CPI items at the 4-digit level.
Source: Bank Negara Malaysia
Chart 2
Conceptual Relationship between Exchange Rate Changes and Inflation
Change inexchange rate
App
reci
atio
n
Dep
reci
atio
n
ERPTthreshold
Strongerinflationaryimpact abovethreshold
High inflation
Inflation
Somedisinflationaryimpact fromappreciation
Someinflationaryimpact fromdepreciation
Chart 3
Scatter Plot of Exchange Rate Changes and Inflation
Source: Department of Statistics, Malaysia, Bloomberg and Bank Negara Malaysia
-15
-10
-5
0
5
10
15
20
25
30
35
0 1 2 3 4 5 6 7
NEER,Annual change (%)
Core inflation,Annual change (%)
App
reci
atio
nD
epre
ciat
ion
Chart 4
Import Content of CPI Items and Their PriceSensitivity to Exchange Rate Changes
0.00
0.05
0.10
0.15
0.20
0.25
0.30
0 20 40 60 80 100
Sensitivity (%)
Source: Department of Statistics, Malaysia, Bloomberg and Bank Negara Malaysia estimates
Import content (%)
Note: Sensitivity refers to the degree of ERPT for the individual CPI items at the 4-digit level.
Exchange Rate Changes and Inflation
Source: Department of Statistics, Malaysia, Bloomberg and Bank Negara Malaysia estimates
Chart 5
-8
-6
-4
-2
0
2
4
6
8
1 2 3 4 5 6 7Core inflation,
Annual change (%)
App
reci
atio
n D
epre
ciat
ion
NEER,Annual change (%)

AN
NU
AL
REP
OR
T 20
15EC
ON
OM
IC D
EVEL
OPM
ENTS
IN 2
015
73A
NN
UA
L REPO
RT 2015
ECO
NO
MIC
DEV
ELOPM
ENTS IN
2015
to items with lower import content. The scatter plot (Chart 4), however, shows that this relationship is weak9. Examining the individual items of the CPI basket shows that most goods and services have moderate import content10 and estimations of the ERPT for these items indicate that a 10% depreciation is associated with higher infl ation of at most 3%.
(iii) Analysis by stage of processing using disaggregated PPI data suggests that exchange rate pass-through via the indirect channel is also low and incomplete. The ERPT is estimated at two different stages of the production chain, which begins at the fi rm level and ends at the consumer level (Diagram 2). At the fi rst stage of the production chain, the ERPT to input costs is estimated to be low and incomplete, whereby a 10% change in the exchange rate is associated with a 1.3% change in the costs of imported raw and intermediate inputs. At the second stage, the pass-through from input prices to consumer prices is even smaller, whereby a 10% increase in input prices leads to an increase in prices of consumer goods by only 0.4%.
Diagram 2
Exchange Rate, Global Commodity Prices and Prices Along the Production Chain
Note: Numbers in the parenthesis () represent the average of the annual change in the variables during the depreciation episode between October 2014 and December 2015. For local commodity prices, data is from October 2014 to September 2015.
Source: Department of Statistics, Malaysia, International Monetary Fund (IMF), Bloomberg and Bank Negara Malaysia estimates
Exchange rate(9.3%)
Global commodityprices
(–32.2%)
Local commodityprices
(-21.6%)
Prices of local raw andintermediate materials
(-9.1%)
Fixed costs
Local inputs, which is44% of total cost
Imported inputs, whichis 22% of total cost
Rental & machinery
Labour costs
Firms’ cost structure
Consumer goods, atproducer level
(1.3%)
Consumer goods,at retail level
(2.6%)
Firms’ market structurePrices of imported rawand intermediate
materials(0.6%)
Strong pass-through (STAGE 1) Weak pass-through (STAGE 2)
9 This follows from Forbes (2015). In addition, Choudhri and Hakura (2006) and Aron, MacDonald and Muellbauer (2014) fi nd no signifi cant link between ERPT and openness (import-to-GDP ratio, import dependence and number of importers).
10 Source: Input-Output Tables 2010 for Malaysia. Most items in the CPI basket have import content less than 40%.11 The data fi ts a logarithmic trendline as the rising rate of change in the exchange rate coincides with higher infl ation.
(iv) Exchange rate depreciation and appreciation have asymmetric impact on infl ation. It is important to note that estimations of the ERPT capture both periods of depreciation and appreciation. Studies, however, have shown that the size of the impact on infl ation tends to be larger during periods of depreciation compared to periods of appreciation. The asymmetric relationship between exchange rate changes and infl ation (as conceptually illustrated in Chart 2) is also observed in the Malaysian data (Chart 5)11. Empirical estimations to distinguish ERPT during depreciation and appreciation episodes in Malaysia show that ERPT is indeed larger during periods of depreciation.
(v) Lack of robust evidence to suggest threshold effects between exchange rate depreciation and infl ation. Firms tend to absorb the initial increase in costs if they view the depreciation as small or transitory. As the exchange rate depreciation becomes prolonged and exceeds a certain threshold, fi rms may change their price-setting behaviour. At this stage, price sensitivity to the exchange rate depreciation may also increase disproportionately. In the case of Malaysia, however, threshold effects are not conclusively observed. Evidence of threshold effects would indicate that as the size of the exchange rate depreciation becomes larger, infl ation would also increase at a much faster pace and to some extent

AN
NU
AL R
EPOR
T 2015EC
ON
OM
IC D
EVELO
PMEN
TS IN 2015
74A
NN
UA
L R
EPO
RT
2015
ECO
NO
MIC
DEV
ELO
PMEN
TS IN
201
5
non-linearly. Chart 6 shows that core infl ation in Malaysia remained stable, averaging close to 2% when the exchange rate depreciation was below 6%. As the exchange rate depreciation exceeded 6%, core infl ation edged up to average at 3.6%. This, however, was driven mainly by data in the period 1997-1998. Although this observation may seemingly indicate some threshold effects, empirical estimations12 suggest that the results are not statistically signifi cant. This could be primarily due to the fact that from the sample data, Malaysia has limited experience of both high inflation and large exchange rate depreciation.
In summary, the degree of ERPT has remained relatively low in Malaysia. This is consistent with a previous study13 by the Bank in 2011 and general fi ndings for Malaysia in the literature. The low ERPT can be attributed to the following factors:
• Presence of administered-price policies. About 17.5% of the items in the CPI basket are subject to administered-price policies14. The Government also implements other measures to ensure price increases are not excessive. These measures include the issuance of more import permits to increase food supplies during periods of shortages, price reduction campaigns and the enforcement of the Price Control and Anti-Profi teering Act 2011. – This for example has resulted in low sensitivity of fuel infl ation to global oil prices and the exchange
rate. Prior to December 2014, domestic fuel prices were classifi ed as one of the price-administered items. While fuel for domestic consumption is primarily imported from abroad, their prices were not sensitive to changes in global oil prices and the exchange rate due to the presence of fuel subsidies. This contained the ERPT to infl ation. It is, however, important to note that since the removal of the fuel
Chart 6
Average Inflation for Different Magnitudes ofExchange Rate Changes
Source: Department of Statistics, Malaysia, Bloomberg and Bank Negara Malaysia estimates
0.0
0.5
1.0
1.5
2.0
2.5
3.0
3.5
4.0
<0 0-2 2-4 4-6 >6
Core inflation,Average annual change (%)
NEER,Annual change (%)
Contribution to Fuel Inflation
Chart 7
Percentage point
Exchange rateReduction in subsidy
Global oil price Fuel inflation
Source: Ministry of Domestic Trade, Co-operatives and Consumerism, Department of Statistics, Malaysia, Bloomberg and Bank Negara Malaysia estimates
-5
-4
-3
-2
-1
0
1
2
3
4
J F M A M J J A S O N D J F M A M J J A S O N D
2014 2015
12 Estimations are based on threshold regressions from Hansen (1999 and 2000) where the Phillips curve equation is estimated for a series of exchange rate changes that could refl ect potential threshold effects.
13 See Box Article on ``Impact of Ringgit Appreciation on Import Prices and Infl ation´´ in BNM Annual Report 2011.14 The pricing mechanisms of administered items in the CPI are mainly governed by the Price Control and Anti-Profi teering Act
2011, which replaced the Price Control Act 1946. In general, there are two types of price-administered items in the CPI. The fi rst comprises items where the Government determines the retail prices for these goods. Examples include fl our and cooking oil, which are also subsidised by the Government. The second comprises items that require Government approval for changes to be made on their prices. Examples include cigarettes, electricity tariffs and public transport fares. With the administered-price mechanisms in place, the impact of shocks on domestic prices is smaller, less direct and less immediate.

AN
NU
AL
REP
OR
T 20
15EC
ON
OM
IC D
EVEL
OPM
ENTS
IN 2
015
75A
NN
UA
L REPO
RT 2015
ECO
NO
MIC
DEV
ELOPM
ENTS IN
2015
subsidies and the implementation of the managed-fl oat pricing mechanism for fuel prices in December 2014, movements in both global oil prices and the exchange rate have had a more direct and faster impact on domestic fuel prices (Chart 7)15.
• Limited import content. Imported fi nished goods captured in CPI-Import have a low share in the consumption basket of the average household (7.2%). From the supply side, based on the Input-Output Tables 2010 for Malaysia, intermediate imported inputs account for about 20% of total gross output and PPI-Import accounts for 33% of the total PPI basket. Hence, the limited dependency on imports contributes, in part, to the low ERPT to domestic prices.
• Pricing-to-market. Price-setting behaviour of fi rms is greatly infl uenced by global and domestic market structures. These factors include the degree of competition, product differentiation and substitutability, and the strategic reactions of other fi rms. Increased competition, due to greater globalisation and liberalisation of markets, has generally increased the elasticity of demand and supply and, in turn, lowered the pricing power of fi rms. Hence, in response to higher costs amid exchange rate depreciation, fi rms tend to absorb the higher costs by varying their profi t margins or improving cost management by increasing effi ciency or switching to cheaper substitutes. In assessing the impact of these factors, anecdotal evidence in Malaysia suggests that fi rms tend to typically wait for at least six months to assess the strength of demand before reviewing their prices, and either adjust their profi t margins or pass on the higher costs. However, some retailers, notably importers of fi nished goods, tend to fully pass on the higher costs to consumer prices if there are no local substitutes.
B. Infl ation developments in Malaysia during episodes of depreciation Given the low ERPT, expectations are for exchange rate depreciation to have limited impact on inflation. However, past episodes of depreciation have seen different outcomes for inflation. Over the last two decades, Malaysia experienced two episodes of persistent ringgit depreciation. These periods were: (i) April 1997 - December 1998 during the Asian Financial Crisis (AFC); and (ii) October 2014 - December 2015 during the period of a sustained drop in global commodity prices and strengthening of the US dollar. Table 1 and Chart 1 both show that infl ation surged during the fi rst episode but remained relatively subdued in the second episode following the depreciation of the ringgit.
Analysing the stylised facts recorded during these episodes highlights that the fi nal overall impact on infl ation has to be assessed with consideration to other important factors beyond the ERPT. These factors include the trajectory of the exchange rate depreciation, and other determinants of infl ation such as global commodity prices and domestic demand conditions. In the Malaysian experience, these other factors are certainly pivotal in determining the infl ationary impact on the economy, which can be clearly contrasted between these depreciation episodes. In particular, during these two episodes there were some ERPT but the mitigating factors in the current episode, namely the prolonged decline in global commodity prices, played a more signifi cant role in containing the overall impact on infl ation.
April 1997 - December 1998: Sharp ringgit depreciation caused a spike in import costs and led to an acceleration in infl ation During this period, the NEER depreciated by an average of 13.1%16. The depreciation trajectory was sudden and steep amid large and sharp fl uctuations in the exchange rate. Globally, commodity prices were also on a declining trend, but at a more modest pace compared to the more recent period. While domestic demand conditions weakened as the economy contracted sharply following the adverse impact from the AFC, there was notable evidence of demand-driven infl ationary pressures at the onset
15 The net impact on infl ation would, however, depend on the magnitude and direction of the changes in both global oil prices and the exchange rate. See Chart 7.
16 Between April 1997 and December 1998, the NEER had depreciated by 31.9%. The depreciation of 13.1% refers to the average of annual change in the NEER on a monthly basis, which is used as a like-for-like comparison against infl ation. Infl ation is also measured in a similar manner.

AN
NU
AL R
EPOR
T 2015EC
ON
OM
IC D
EVELO
PMEN
TS IN 2015
76A
NN
UA
L R
EPO
RT
2015
ECO
NO
MIC
DEV
ELO
PMEN
TS IN
201
5
of the crisis. In particular, there was a large positive output gap that was refl ected in labour market tightness, strong import growth and supply bottlenecks17. Together with the sharp ringgit depreciation, the domestic developments created a substantial spike in the cost of imports over a short interval of time and these were quickly passed on to consumer prices. Specifi cally, these factors precipitated the marked increase in the prices of imported fi nished goods (CPI-Import), which accelerated by 9.1% in 1998 (1997: 1.8%) and prices of imported inputs (PPI-Import), which surged by 9.3% (1997: 2.8%). The quick and sharp rise in the cost of imports also showed that the moderate decline in commodity prices was insuffi cient to offset the infl ationary impact from the large and sharp ringgit depreciation. As a result, headline infl ation increased signifi cantly from 2.1% in July 1997 to peak at 6.2% in June 1998 (averaging 5.3% in 1998). Both headline and core infl ation remained persistently above 4% throughout 1998.
October 2014 - December 2015: Persistent ringgit depreciation mitigated by downtrend in commodity pricesIn comparison to the AFC, the current depreciation episode differs in two ways: the magnitude of the depreciation was relatively more modest, as the NEER depreciated by an average of 9.3%18 during the period, and the depreciation trajectory was in fact more gradual and persistent with smaller fl uctuations
Table 1
Selected Economic Indicators during the Two Exchange Rate Depreciation Episodes
Average of annual change during the period, %1Episode 1 Episode 2
(Apr 1997 – Dec 1998) (Oct 2014 – Dec 2015)
Headline CPI 4.1 2.2
Core CPI2 4.4 2.3
CPI-Import 5.7 2.5
PPI 7.4 -4.3
PPI-Local 7.5 -6.7
PPI-Import 6.7 0.7
Output gap3 -0.1 0.3
Real GDP -1.0 5.1
NEER against import partners4 13.1 9.3
RM/US Dollar 21.2 13.9
IMF Primary Commodity Price Index -14.4 -32.2
Brent oil price -24.2 -43.5
Global CPI5 4.5 1.1
RON95 petrol price, RM/litre 1.06 2.04
Diesel price, RM/litre 0.65 1.98
1 With the exception of output gap, petrol and diesel prices, all other indicators refer to average of the annual change during the period. Output gap captures the average deviation of actual output from potential output during the period. Prices for RON95 petrol and diesel refer to the average prices during the period.
2 Core CPI infl ation attempts to measure the underlying infl ation. It is computed by excluding price-volatile and price-administered items whose price movements are more likely affected by temporary shocks and volatile supply factors rather than persistent changes in underlying factors affecting demand and supply conditions. In addition, core infl ation also excludes the estimated direct impact of GST.
3 Output gap captures the percentage deviation of actual output from potential output, which is an estimate of the highest level of output that an economy is capable of producing in a non-infl ationary environment.
4 The nominal effective exchange rate (NEER) against import partners is calculated based on the weighted average of the bilateral exchange rates against Malaysia’s top 15 import partners. A positive fi gure indicates a depreciation in the ringgit against Malaysia’s import partners relative to the year before.
5 Global CPI infl ation refers to the aggregate infl ation of Malaysia’s top 15 import partners, weighted by the share of imports from these economies.
Source: Ministry of Domestic Trade, Co-operatives and Consumerism, Department of Statistics, Malaysia, International Monetary Fund (IMF), Bloomberg and Bank Negara Malaysia estimates
17 See BNM Annual Report 1997 and 1998 for details.18 Between October 2014 and December 2015, the NEER had depreciated by 20.5%. The depreciation of 9.3% refers
to the average of annual change in the exchange rate on a monthly basis, which is used as a like-for-like comparison against infl ation. Infl ation is also measured in a similar manner.

AN
NU
AL
REP
OR
T 20
15EC
ON
OM
IC D
EVEL
OPM
ENTS
IN 2
015
77A
NN
UA
L REPO
RT 2015
ECO
NO
MIC
DEV
ELOPM
ENTS IN
2015
in the exchange rate. The depreciation did cause CPI-Import19 to increase by 3.0% in 2015 but the overall impact on infl ation was offset by the drop in fuel prices of 9.0%. Of importance, the large decline of 32.2%20 in global commodity prices during the period played a signifi cant role in mitigating the impact of exchange rate depreciation on infl ation. This is refl ected by the decline in PPI by 4.8% in 2015 and only a small increase in PPI-Import by 0.7%. The mitigating effects from the prolonged downtrend in global commodity prices were also evident in the developments of the other price indices along the production chain (Diagram 2). Prices of imported raw and intermediate materials only increased by 0.6% during this episode following the ringgit depreciation, while prices of local raw and intermediate materials recorded a large decline of 9.1%. In addition, domestic demand conditions remained moderate with no signs of demand-driven infl ationary pressures. Overall, headline infl ation remained modest at 2.1% in 2015 while core infl ation remained relatively stable at 2.3%.
ConclusionAnalyses of data in the past two decades suggest that the exchange rate pass-through to infl ation has generally been low in Malaysia. The low degree of pass-through is due mainly to the prevalence of administered prices in the CPI, moderate dependency on imported goods and pricing-to-market by fi rms. While the pass-through is generally low, the 1997-1998 experience shows that exchange rate depreciation can be accompanied by substantial changes in infl ation. In the more recent period, however, infl ationary pressures have remained moderate despite the persistent depreciation. This is mainly on account of the offsetting impact from the large decline in global oil and commodity prices.
Going forward, the changing economic landscape following reforms towards more market-based pricing could change the infl ation dynamics in Malaysia. Since 2010, there has been a gradual removal of subsidies from key necessities including food items, fuel products and utilities. Of note are the adjustments that have impacted the price-setting behaviour of fi rms, namely the minimum wage policy in 2013 and market-based pricing mechanism for fuel products in 2014. These changes could lead to greater fl exibility of domestic prices, which in turn could make fi rms more responsive not only to changes in the exchange rate but also to global prices. ReferencesAron, J., MacDonald, R., and Muellbauer, J. (2014). `Exchange rate pass-through in developing and emerging markets: A survey of conceptual, methodological and policy issues, and selected empirical fi ndings´. Journal of Development Studies, 50(1), pp. 101-143.
Bank Negara Malaysia Annual Report 1997.
Bank Negara Malaysia Annual Report 1998.
Bank Negara Malaysia (2012). `Propagation of global commodity prices to infl ation in Malaysia´. 2011 Annual Report Box Article.
Bank Negara Malaysia (2012). `Impact of ringgit appreciation on import prices and infl ation´. 2011 Annual Report Box Article.
Caselli, F. and Roitman, A. (2016). `Non-linear exchange rate pass-through in emerging markets´. IMF Working Paper No. 16/1.
Choudhri, E. and Hakura, D. (2006). `Exchange rate pass-through to domestic prices: Does the infl ationary environment matter?´ Journal of International Money and Finance, 25 (4), pp. 614–639.
19 In the breakdown for CPI-Import, prices of food and non-food components rose from 2.0% and -0.8% respectively in December 2014 to reach 7.5% and 1.5% in December 2015.
20 Represents average annual change during the period for the IMF Primary Commodity Price Index.

AN
NU
AL R
EPOR
T 2015EC
ON
OM
IC D
EVELO
PMEN
TS IN 2015
78A
NN
UA
L R
EPO
RT
2015
ECO
NO
MIC
DEV
ELO
PMEN
TS IN
201
5
Forbes, K. (2015). `Much ado about something important: How do exchange rate movements affect infl ation?´ Speech at the 47th Money, Macro and Finance Research Group Annual Conference, Cardiff, UK.
Frankel, J., Parsley, D., and Wei, SJ. (2012). `Slow pass-through around the world: A new import for developing countries?´ Open Economies Review, 23 (2), pp. 213–251.
Ghosh, A. and Rajan, R. (2007). `A survey of exchange rate pass-through in Asia´. Asian-Pacifi c Economic Literature, 21(2), pp. 13–28.
Hansen, B. (1999). `Threshold effects in non-dynamic panels: Estimation, testing, and inference´. Journal of Econometrics, 93(2), pp. 345-368.
Hansen, B. (2000). `Sample splitting and threshold estimation´. Econometrica, 68(3), pp. 575-603.
Ito, T. and Sato, K. (2008). `Exchange rate changes and inflation in post-crisis Asian economies: Vector autoregression analysis of the exchange rate pass-through´. Journal of Money, Credit and Banking, 40(7), pp. 1407 – 1438.
Mihaljek, D. and Klau, M. (2008). `Exchange rate pass-through in emerging market economies: What has changed and why?´ BIS Papers No. 35.
Taylor, J. (2000). `Low infl ation, pass-through, and the pricing power of fi rms´. European Economic Review, 44(7), pp. 1389–1408.
Sek, SK. and Kapsalyamova, Z. (2008). `Pass-through of exchange rate into domestic prices: The case of four East-Asian countries´. The International Journal of Economic Policy Studies, 3, pp. 45-72.