economic consequences of reporting transparency
TRANSCRIPT

Diplom-Ökonom Caspar David Peter
Economic Consequences of Reporting Transparency
Dissertation
zur Erlangung des Grades eines Doktors der Wirtschaftswissenschaften
(Dr. rer. pol.)
an der WHU – Otto Beisheim School of Management
31.3.2015
Erstbetreuer: Professor Dr. Igor Goncharov
Zweitbetreuer: Professor Dr. Thorsten Sellhorn, MBA


Economic Consequences of Reporting Transparency
I
Table of contents
Table of contents ...................................................................................................I
List of tables ...................................................................................................... III
List of abbreviations .......................................................................................... IV
1 Introduction ...................................................................................................... 1
1.1 Transparency and financial reporting ............................................................................. 1
1.2 Outline ................................................................................................................................. 9
2 Does reporting transparency affect industry coordination? Evidence from
the duration of international cartels ................................................................ 11
2.1 Introduction ...................................................................................................................... 11
2.2 Product market coordination .......................................................................................... 16
2.3 Hypothesis development .................................................................................................. 19
2.4 Research design ................................................................................................................ 23
2.4.1 Sample selection .......................................................................................................... 23
2.4.2 Survival analysis ......................................................................................................... 27
2.4.3 Identification strategy ................................................................................................. 31
2.5 Results ............................................................................................................................... 32
2.5.1 Testing of hypotheses 1a and 1b ................................................................................. 32
2.5.2 Testing of hypothesis 2 ................................................................................................ 39
2.6 Robustness tests ................................................................................................................ 44
2.6.1 Cartel duration and selectivity issues ......................................................................... 44
2.6.2 Alternative test variables: Country-level transparency .............................................. 48
2.7 Summary and discussion ................................................................................................. 50
3 Proprietary costs of full portfolio disclosure for UK investment trusts ... 52
3.1 Introduction ...................................................................................................................... 52
3.2 Literature review and institutional setting .................................................................... 58
3.2.1 Literature review ......................................................................................................... 58
3.2.2 Institutional setting ...................................................................................................... 61
3.3 Hypothesis development .................................................................................................. 64
3.4 Research design ................................................................................................................ 68

Table of contents
II
3.4.1 Sample selection .......................................................................................................... 68
3.4.2 Main test ...................................................................................................................... 69
3.4.3 Endogeneity issues ...................................................................................................... 73
3.5 Results ............................................................................................................................... 77
3.5.1 Descriptive statistics ................................................................................................... 77
3.5.2 Empirical results ......................................................................................................... 81
3.6 Summary and conclusion ................................................................................................. 94
4 Private firms’ investment efficiency and local news media coverage ....... 96
4.1 Introduction ...................................................................................................................... 96
4.2 Background ..................................................................................................................... 102
4.2.1 The firm’s external information environment and investment .................................. 102
4.2.2 Investment under uncertainty .................................................................................... 105
4.2.3 The Italian media landscape ..................................................................................... 107
4.2.4 The Italian reporting environment ............................................................................ 108
4.3 Hypothesis development ................................................................................................ 109
4.4 Research design .............................................................................................................. 112
4.4.1 Sample selection ........................................................................................................ 112
4.4.2 Data on news media in Italy ...................................................................................... 113
4.4.3 Empirical strategy ..................................................................................................... 113
4.5 Results ............................................................................................................................. 115
4.5.1 Univariate analysis ................................................................................................... 115
4.5.2 Test of hypothesis 1 ................................................................................................... 119
4.5.3 Test of hypothesis 2 ................................................................................................... 121
4.6 Sensitivity checks and limitations ................................................................................. 128
4.7 Conclusion ....................................................................................................................... 128
5 Summary and conclusion ............................................................................. 130
References ........................................................................................................ 134
Affirmation – Statutory Declaration ............................................................. 144
Curriculum vitae ............................................................................................. 145
Economic Consequences of Reporting Transparency
III
List of tables
Chapter 2
Table 1: Sample distribution across countries .......................................................................... 26
Table 2: Descriptive statistics .................................................................................................. 27
Table 3: Reporting transparency and cartel membership duration .......................................... 33
Table 4: Exogenous shock to reporting quality and cartel membership duration .................... 38
Table 5: Cross-sectional differences in cheating gains and cartel duration ............................. 41
Table 6: Cartel duration and selection bias .............................................................................. 46
Table 7: Alternative measures of reporting transparency ........................................................ 49
Chapter 3
Table 1: Descriptive statistics and correlation matrix .............................................................. 78
Table 2: Differences and determinants of full portfolio disclosure.......................................... 80
Table 3: The association between full portfolio disclosure and demand ................................. 82
Table 2: Differences and determinants of full portfolio disclosure.......................................... 84
Table 4: Cross-sectional differences in performance and demand........................................... 87
Table 5: Cross-sectional differences in portfolio turnover ....................................................... 89
Table 6: Analysis of switches in portfolio disclosure and demand .......................................... 91
Chapter 4
Table 1: Summary statistics of dependent and independent variables ................................... 116
Table 2: Pearson correlation matrix of dependent and independent variables ....................... 118
Table 3: Investment levels and the external information environment .................................. 120
Table 4: Investment sensitivity and the external information environment ........................... 122
Table 5: Investment efficiency and the external information environment ........................... 125
Table 6: Over- and underinvestment and the firm’s information environment ..................... 127

List of abbreviations
IV
List of abbreviations
AIC Association of Investment Companies
CTA Corporate Tax Act
EC European Commission
E.g. Exempli gratia (for example)
Et al. Et alii (and others)
E.U. European Union
GAAP Generally Accepted Accounting Principles
HMRC Her Majesty’s Royal Customs
IAS International Accounting Standard(s)
IFRS International Financial Reporting Standard(s)
Max Maximum
Min Minimum
N Number
NAICS North American Industry Classification System
P. Page
SEC Securities and Exchange Commission
SIC Standard industrial classification
SD Standard deviation
U.K. United Kingdom
U.S. United States (of America)
U.S. GAAP United States Generally Accepted Accounting Principles

Economic Consequences of Reporting Transparency
1
1 Introduction
1.1 Transparency and financial reporting
This dissertation examines the economic consequences of reporting
transparency. Specifically, it integrates theories from accounting, economics,
and finance, to present evidence on the real effects of firms’ reporting and
disclosure activities. It adds to firm-specific and market-wide evidence on the
economic consequences of reporting transparency by presenting evidence on
how reporting transparency affects product market coordination of firms
(chapter 2), product demand for UK investment trusts (chapter 3), and how it is
associated with private firms’ investment efficiency (chapter 4). Thereby, it
speaks to policy makers, regulators, as well as standard setters, and answers the
call for further research on real consequences of reporting transparency by
Leuz and Wysocky (2008).
The concept of reporting transparency comprises the availability of
firm-specific information obtainable to outsiders of the firm.1 The availability
of information plays a central role in efficient resource-allocation decisions
within an economy since information asymmetries and agency costs impede
efficient resource allocation (Bushman et al. 2004; Bushman et al. 2011). A
prominent example of inefficient resource allocation is the “market for lemons”
first introduced by Ackerlof (1970). The seminal paper explores how market
failure arises because outsiders cannot assess ex ante whether insiders report
information truthfully. Under certain conditions, transparency can prevent the
market from collapsing (Grossman and Hart 1980) . Moreover, transparency
can also decrease agency costs arising from the separation of ownership and
1 Bushman et al. (2004) define the term corporate transparency as, “the availability of firm-
specific information to those outside publicly traded firms” (p. 208).

1 Introduction
2
control. Agency costs arise whenever one party (principal) engages another
party (agent) to perform some service on her behalf, since a utility maximizing
agent does not always act in the best interest of the principal (Jensen and
Meckling 1976). Information enables economic agents to reduce contracting
costs if they can rely on the provided information ex-post. In this regard, a
firm’s set of accounting standards forms part of its overall contracting
technology (Watts and Zimmerman 1979, 1986).
Reporting transparency reduces information asymmetries and agency
costs. Hence, information asymmetry and agency costs, both between a firm
and its stakeholders, as well as among stakeholders, is crucially dependent on a
firm’s information environment. Reporting transparency allows investors to
understand the real performance of the firm and enhances their ability to
perceive the real situation of the firm which they base their actions on.
Diamond (1985) suggest in an analytical model, that the firm’s disclosure of
information is welfare increasing since it reduces information costs and
improves risk sharing. Moreover, Diamond and Verrecchia (1991) find that
revealing public information to reduce information asymmetry reduces the
firm’s cost of capital by attracting demand from large investors due to the
increased liquidity of the firm’s shares. On the other hand, enhanced reporting
transparency also bears costs when revealing proprietary information to the
public. These costs are, for example, a decrease in market power or a loss of
competitive edge due to new market entries following the release of proprietary
information (Wagenhofer 1990).
Prior literature identifies differences in reporting transparency across
countries that reflects national institutional characteristics. Hail and Leuz
(2006), for instance, report that variation across countries in disclosure

Economic Consequences of Reporting Transparency
3
requirements, securities regulation, and enforcement mechanisms influences
cost of capital. In the same vein, several studies investigate economic
consequences of the mandatory introduction of International Financial
Reporting Standards (IFRS) in Europe in 2005, which is associated with an
increase in reporting transparency (Daske et al. 2008, 2013; Hail et al. 2014;
Gordon et al. 2012). In summary, these papers suggest that more transparent
reporting benefits firms by increasing liquidity and decreasing cost of capital.2
Chapter two of this dissertation adds to the notion of the
aforementioned work by examining how financial reporting transparency of
firms in different countries affects product markets by using the cartel setting.
Economic theory predicts that transparency might either prolong cartel
duration through increased contracting efficiency or destabilize cartels due to
earlier detection of deviating members. This study exploits variation in
reporting transparency resulting from the use of international accounting
standards (IFRS or U.S. GAAP) as opposed to national GAAP. The results
suggest that following international accounting standards increases firms’
likelihood of exiting the cartel in the next year by 84%. This finding can be
explained by the enhanced ability of cartel members to detect cheating by their
fellow members when their reports are more transparent. Consistent with this
argument, additional tests reveal that transparency lowers cartel duration when
the opportunity costs of cooperation and the likelihood of cheating are high.
This chapter adds to prior studies on the relationship between firms’
competitive environment and the level of reporting transparency (Verrecchia
2001; Berger and Hann 2007) by providing empirical evidence consistent with
2 For a more in-depth analysis of the current state of the literature on the economic
consequences of financial reporting and disclosure regulation refer to, e.g. Leuz and Wysocki
(2008) or Farvaque et al. (2011).

1 Introduction
4
the theoretical predictions in Bagnoli and Watts (2010), that reporting
transparency can affect industry coordination and competition. Secondly, this
study adds to the general notion that reporting transparency affects the
outcomes of implicit contracts by emphasizing the role of accounting
transparency in monitoring an implicit product market contract. Additionally,
this study extends prior economic literature that analyzes cartel duration and its
determinants (Suslow 2005; Zimmerman and Connor 2005; Levenstein and
Suslow 2011) by explicitly considering the effect of transparency on cartel
duration. In the context of economic consequences of reporting transparency,
the results point at the consumer welfare enhancing abilities of reporting
transparency, since it fosters competition by reducing cartel sustainability.
Hence, the analysis sheds light on whether transparent reporting can influence
efficient resource allocation in an economy (Bushman et al. 2011).
Chapter three examines economic consequence of reporting
transparency in the financial industry. More specifically, it examines whether
voluntary disclosures by UK investment trusts affect the demand for the trusts’
share. This chapter exploits the fact that UK investment trusts can choose to
publicly disclose a complete list of stocks under management. However, some
firms disclose their portfolios voluntarily. Since the information about the
investment portfolios is competitively sensitive and proprietary in nature,
revealing the portfolio of investments under management is comparable to
showing a rather complete picture of the trust’s operations. By examining these
voluntary disclosures, the study isolates a feature of the firm’s information
environment that is directly under management’s control. Further, the setting
allows for inferences based on one important part of disclosure in one industry

Economic Consequences of Reporting Transparency
5
and is arguably less noisy in comparison to multi-industry settings (Berger and
Hann 2007; Botosan and Harris 2000; Botosan and Stanford 2005; Leuz 2004).
Most recently, Balakrishnan et al. (2014) find that managers actively
manage the firm’s information environment by providing voluntary disclosure
to reap the benefits of improved liquidity. Their finding is in line with prior
literature that shows investors prefer liquid shares and that voluntary disclosure
can increase liquidity by reducing information asymmetry (Dye 1986; Amihud
and Mendelson 2008, 1986; Diamond and Verrecchia 1991).
Apart from the benefits of voluntary disclosure there are also costs of
revealing (proprietary) information. Proprietary costs represent the
management’s fear to lose the firm’s competitive advantage or bargaining
power to its competitors by revealing sensitive proprietary information (Hayes
and Lundholm 1996; Lambert et al. 2007; Verrecchia 2001; Wagenhofer 1990;
Dye 1986). Although there is theoretical evidence that proprietary costs are
present, empirical evidence is relatively scarce.
Chapter three fills this gap in prior literature by examining the costs and
benefits of voluntary disclosure of full portfolio holdings by UK investment
trusts. This study utilizes the fact that investment trusts trade at a discount. The
discount represents the difference between the market value of the investment
trust’s investments under management and the investment trust’s own share
price. Due to the inelastic supply curve of the investment trust’s shares,
changes in demand translate into changes in the discount. The results show, on
average, voluntary disclosures increase the demand for the trusts’ shares.
However, there are costs for successful trusts that exhibit superior performance
prior to the disclosure of their full portfolios. These trusts suffer from a

1 Introduction
6
decrease in demand by revealing superior stock picking ability and market
timing in the disclosed portfolio information.
This paper contributes to prior literature on voluntary disclosure (see,
e.g. Healy and Palepu 2001; Beyer et al. 2010) by providing evidence on how
voluntary disclosure is associated with changes in product demand.
Furthermore, by utilizing the relation between the investment trust’s discount
and its relation to change in the trust’s demand, it uses an approach in
quantifying proprietary costs which distinguishes this study to prior disclosure
studies (Verrecchia and Weber 2006; Beyer et al. 2010; Bamber and
Youngsoon 1998).
Chapter four investigates how the quality of private firms’ external
information environment affects corporate investment efficiency. The quality
of the firm’s information environment has important implications for
investment because a more transparent information environment can reduce
agency conflicts by enhancing monitoring and it can help the firm to identify
and exploit investment opportunities. To investigate whether the external
information environment is associated with private firms’ investment behavior,
this study exploits variation in the availability of information on the number of
local news media (print and online) at the city-level in Italy. The results
suggest that a higher quality of the information environment reduces
uncertainty about investments which leads to greater responsiveness of firms to
their investment opportunities and higher investment efficiency. Additionally,
the results highlight the importance of news media as an information
dissemination channel for decision relevant information.
This study adds to literature on efficient resource allocation and
corporate transparency (Bushman et al. 2004; Bushman and Smith 2001;

Economic Consequences of Reporting Transparency
7
Francis et al. 2009; Lang and Maffett 2011), by investigating how private
firms’ information environment is associated with corporate investment
efficiency. It also sheds light on the management’s investment decision process
and how managers obtain decision-relevant information (Badertscher et al.
2013; Shroff 2014; Shroff et al. 2014), by showing that regional news media
coverage is an important channel that nourishes private firms’ information
environment. Likewise, it adds to literature in financial economics
investigating the role of news media (Engelberg and Parsons 2011; Fang and
Peress 2009; Peress 2014; Robert et al. 1987). Whereas prior literature focuses
on capital market oriented (listed) firms, this study uses private firms to
explore the role of news media in the firm’s external information environment.
It bears policy implications and speaks to policy makers because it shows a
positive association between communication infra-structures and investment
decisions by private firms that make up the gross of the economy and are
fundamentally important.
Overall, the three empirical studies highlight different aspects of
reporting transparency and its real effects. The findings provide important
implications for efficient resource allocation in an economy. First of all,
chapter two and three show product market related consequences of reporting
transparency induced by transparent reporting and voluntary disclosures,
whereas chapter four highlights the importance of news media as another
distinct channel through which transparency affects the firms’ investment
decisions.
Chapter two presents evidence that reporting transparency is beneficial
for product markets since it shows that it mitigates welfare decreasing
coordination practices among firms. This finding speaks to regulatory

1 Introduction
8
authorities in the field of competition policy. It highlights that capital market
regulation in terms of improved transparency and enforcement complements
competition policy. These benefits also result in potential remedies when the
European Commission or local cartel authorities observe undesired levels of
price coordination but cannot prove them to be illegal (e.g., coordination
between fuel retail companies in Australia and Germany (Bundeskartellamt
2011)).
Chapter three subsumes both, the cost and benefits of reporting
transparency by showing that on average it is associated with positive effects
on demand for transparent trusts but that there are also negative consequences
for trusts with superior performance. This adds to the notion that there is no
“one-size-fits-all” solution when it comes to disclosure regulation. It further
speaks to regulators since, while the majority of the public is eager to see more
transparency, one should always account for potential negative implications of
such regulation.
Chapter four presents evidence that a well-functioning external
communication structure benefits efficient resource allocation by supporting
private firms in the exploitation of investment opportunities. Underdeveloped
communication infra-structures can hinder the flow of firm-specific
information resulting in limited availability of decision relevant information to
economic agents. Moreover, since private firms operate in an opaque
environment compared to publicly listed firms and given that private firms
make up a large proportion of a country’s investment, it is fundamental to
understand the factors that drive efficient resource allocation of private firms.
Therefore, this chapter speaks to policy makers and highlights the importance
of a country’s communication environment.

Economic Consequences of Reporting Transparency
9
1.2 Outline
This thesis comprises five chapters: an introduction, three empirical
research papers, and an overall summary and conclusion. The autonomous
structure of each chapter allows the reader to diverge from the order presented
in this dissertation and to read each of the three studies separately.
Chapter two is co-authored with Professor Igor Goncharov. Therefore,
it uses the first person plural, whereas, the remaining two single authored
studies use the first person singular. The following outline summarizes the
three empirical studies. Additionally, I insert acknowledgements for helpful
comments and suggestions.
Chapter two investigates how financial reporting transparency impacts
product market competition. This study highlights a welfare increasing
consequence of transparent reporting since it shows that financial reporting
transparency negatively affects industry coordination through cartels. This
study greatly benefited from comments and suggestions from Dan Collins,
Antonio De Vito, Begoña Giner, Stefan Hahn, Andreas Hoepner, Allan
Hodgson, Katharina Hombach, Martin Jacob, Sara Keller, Laurence van Lent,
Thomas Loy, Patrick McColgan, Maximilian Müller, Zacharias Sautner,
Thorsten Sellhorn, Michael Stich, Harm Schütt, Jörg Werner, and workshop
participants at the Frankfurt School of Finance, German Monopolies
Commission (Monopolkommission), University of Gießen, WHU – Otto
Beisheim School of Management, the 35th European Accounting Association
meeting, the 27th European Economic Association meeting, and the Workshop
on Empirical Research in Financial Accounting.
Chapter three examines the economic consequences arising from
proprietary costs of voluntary disclosures. It is set in the UK investment trust

1 Introduction
10
industry to show how the voluntary disclosure of full portfolio holdings affects
the demand for the trust’s shares. The results highlight the fact that additional
disclosure increases the demand for shares, on average, but have detrimental
effects on the demand for well performing trusts. This study greatly benefited
from helpful comments and suggestions from Matthias Breuer, Charles
Cullinan (Discussant), Joachim Gassen, Igor Goncharov, Katharina Hombach,
Edith Leung, Maximilian Müller, Harm Schütt, David Veenman, Steven
Young, workshop participants at the 29th EAA Doctoral Colloquium in Paris, at
the University of Giessen, at the ERASMUS University Rotterdam, at WHU –
Otto Beisheim School of Management, at the American Accounting
Associations Meeting 2014, the 37th European Accounting Associations
Meeting, and the 50th British Accounting and Finance Association Meeting. I
also thank Pia Ehlig, Nelli Mirontschenko and Marius Beckermann for
excellent research assistance.
Chapter four investigates how the quality of private firms’ external
information environment affects corporate investment efficiency. It emphasizes
important implications of the firm’s information environment for the
exploitation of investment opportunities. The findings highlight the importance
of news media as an information dissemination channel for decision relevant
information and the importance of communication infra-structures in ensuring
efficient resource allocation in an economy.
This study greatly benefited from comments and suggestions from
Matthias Breuer, Antonio De Vito, Joachim Gassen, Igor Goncharov,
Maximillian Müller, and workshop participants at the Humboldt University,
and WHU − Otto Beisheim School of Management.
Economic Consequences of Reporting Transparency
11
2 Does reporting transparency affect industry coordination?
Evidence from the duration of international cartels3
2.1 Introduction
In every product market, firms have incentives to coordinate their
decisions, raise prices above the competitive level, and share collective profits,
because industry coordination decreases the strategic uncertainties originating
from competitive pressure (Porter 2005; Stigler 1964). However, firms face a
trade-off: Coordination among firms is sustained as long as the gains from
long-term mutual cooperation outweigh the immediate short-term gain from
defection (Seale et al. 2006). While reporting transparency is predicted to
affect this trade-off, there is no prior evidence on whether transparency
facilitates industry coordination through increased contracting efficiency or
impedes industry coordination due to the earlier detection of deviating
members. We exploit an international sample of firms that were indicted by the
European Commission for forming illegal cartels. The cartel setting allows us
to observe the nature and duration of industry coordination, and to examine
how reporting transparency affects industry coordination and competition.
To derive our predictions, we combine theories explaining the
sustainability of cartels with prior literature on the role of accounting
information in contracting (Ball et al. 2008; Beyer et al. 2010; Stigler 1964;
Tirole 1988). The contracting theory perspective views reporting transparency
3 This chapter is based on Goncharov, I. and Peter, C. D. (2014), Does reporting transparency
affect industry coordination? Evidence from the duration of international cartels, Working
paper: Lancaster University - Management School, WHU − Otto Beisheim School of
Management. This paper has not been presented at conferences in its current form, however, it
has been presented and circulated under the titles “The effect of reporting transparency on
cartel duration” and “Reporting transparency and cartel membership” at the following
conferences: the 35th European Accounting Association meeting, the 27th European Economic
Association meeting, the X Workshop on Empirical Research in Accounting and the 50th
British Accounting and Finance Association Meeting.

2 Does reporting transparency affect industry coordination? Evidence from the duration of
international cartels
12
as a mechanism to reduce contracting costs by making information for
monitoring, enforcing, and verifying the cartel agreement readily available
(e.g., Williamson 1973). Leslie (2004) concludes that contracting costs hinder
firms in oligopolistic markets from forming cartels, because it is not cost-
beneficial. Reporting transparency may decrease contracting costs by allowing
for more efficient contracting between agents (Jensen and Meckling 1976;
Lambert 2001; Beyer et al. 2010; Hölmstrom 1979). The use of accounting
information for monitoring and verification purposes in contracting
arrangements is well established (Ball et al. 2008; Beyer et al. 2010; Healy and
Palepu 2001; Watts and Zimmerman 1986). Anecdotal evidence suggests that
access to publicly available information is used in the cartel setting to verify
self-reported numbers and to enforce the cartel agreement (Harrington Jr. 2006;
Harrington and Skrzypacz 2011).4 As a result, reporting transparency may
increase the cartel duration by decreasing the contracting costs of sustaining a
cartel agreement.
Unlike the debt and compensation contracts examined in previous
accounting literature, cartel agreements have no legal standing and depend on
enforcement by the firms subject to the agreement. This is common to many
forms of industry agreement. Furthermore, industry agreements are formed by
otherwise competing firms that have strong incentives to benefit at the cost of
their peers. In this regard, game theory views industry coordination as a
prisoner’s dilemma (Pepall et al. 2005): Each cartel member is tempted to
employ a short-term dominant strategy and deviate from the agreement, since
the opportunity costs of cooperation are high for individual firms (Pepall et al.
4 Both practices have been observed in the “Lysine Cartel”, which used external auditors to
verify self-reported sales, and in the “Carbonless Paper Cartel”, which compared self-reported
sales with actual sales numbers (Harrington and Skrzypacz 2011).

Economic Consequences of Reporting Transparency
13
2005; Roberts 1985). Opaque reporting hides deviations from the cartel
agreement, which lowers the likelihood of punishment by the fellow
conspirators and prevents the breakdown of the cartel (González et al. 2013).
Therefore, reporting transparency may increase the likelihood of detecting
cheating firms, since it facilitates monitoring by fellow cartel members.
Revealing cheating leads to price wars that end the cartel agreement
(Levenstein 1997).5 We hypothesize that reporting transparency can either (1)
increase coordination by giving cartel members additional means to monitor
and sustain the cartel for a longer time span or (2) decrease coordination by
enhancing the cartel members’ ability to detect deviations from the cartel
agreement, which in turn shortens the cartel duration. That is, the effect of
transparency on cartel duration depends on whether the contracting benefits of
transparent information outweigh the costs of discovering deviations from the
cartel agreement.
We test our predictions using a comprehensive international sample of
price-fixing cartels convicted of infringing Article 101 of the Treaty on the
Functioning of the European Union. We obtain data on the duration and
members of the cartel from the European Commission’s website. We apply the
Cox proportional hazard model to investigate how reporting transparency
affects the cartel duration (Cox 1972). We use reporting under internationally
acceptable accounting standards as our proxy for transparent reporting.
Following an international accounting framework has several benefits in the
cartel setting. First, cartel members are domiciled in different countries and
international accounting standards facilitate the comparison of financial
5 For example, in 2013, Uralkali terminated the informal global-pricing cartel, which had
existed for eight years and controlled up to 43% of the world potash market, after discovering
that its partner was selling outside the partnership (Reuters, July 30 2013).

2 Does reporting transparency affect industry coordination? Evidence from the duration of
international cartels
14
information across markets (Brochet et al. 2013). Second, previous literature
shows that international standards demand increased levels of disclosure
compared to local GAAP (Leuz and Verrecchia 2000; Daske and Gebhardt
2006). Third, international accounting standards reduce earnings management,
which can be used to hide cheating behavior (Barth et al. 2008). We designate
IFRS and U.S. GAAP as international accounting standards because the prior
literature finds no difference between the informativeness of IFRS and U.S.
GAAP financial statements (Leuz 2003) and because IFRS and U.S. GAAP are
used in international accounting regulation (Cuijpers and Buijink 2005).6 Our
models incorporate other determinants of cartel duration identified based on
microeconomic and contracting theory (Stigler 1964; Suslow 2005; Levenstein
and Suslow 2011; De 2010).
We find that a higher level of transparency, on average, is associated
with a lower duration of cartel agreements. That is, cartels that apply
international standards exhibit significantly lower durations than those that do
not. This evidence is consistent with the enhanced ability of cartel members to
detect cheating by their fellow members when their reports are more
transparent. As our sample includes voluntary IFRS adopters, we use the
identification strategy in Hail et al. (2014) to shed some light on the causal
relationship between reporting transparency and cartel duration. Specifically,
we follow Bhattacharya and Daouk (2002) and Jayaraman (2012) and employ
the first prosecution under insider trading laws as an exogenous country-level
event that increases reporting quality. We use this shock in a difference-in-
6 We acknowledge that there is also similar disclosure quality under U.K. GAAP as IFRS
(Christensen et al. 2009). Our results are robust to excluding U.K. GAAP firms from the
analysis and to categorizing them as transparent reporters. Furthermore, we report a robustness
test that employs an alternative proxy for reporting transparency that captures the difference
between IFRS and local GAAP.

Economic Consequences of Reporting Transparency
15
differences research design and find that international standards have a stronger
effect on cartel duration after this information shock.
We further investigate the role of reporting transparency in revealing
cheating behavior using cross-sectional differences in the potential gains of
deviating from the cartel agreement. Economic theory predicts that cheating is
more likely to occur when the gains to be made from deviating from the cartel
agreement are high (Lipczynski et al. 2005; Stigler 1964; Friedman 1971).
These gains depend on market segmentation and the number of new
geographic markets a firm can potentially gain when it deviates from the cartel
agreement. As a result, we expect that transparency should lower cartel
duration more for cartels operating in highly segmented markets than for
cartels operating in fewer geographical markets. Our cross-sectional analysis
supports this prediction: Cartels that operate in a greater number of geographic
markets and report transparently have lower durations than cartels operating in
environments with low opportunity costs of cooperation. Furthermore, when
opportunity costs are low, reporting transparency leads to contracting benefits
that allow cartel members to sustain the cartel agreement over a longer time
span.
This is the first study to provide evidence on how reporting
transparency affects industry coordination and product market competition. In
this regard, our contribution is threefold. First, we add to prior work on the
relationship between firms’ competitive environment and the level of reporting
transparency. Prior studies examine the effect of competition on the quantity
and quality of disclosure (Verrecchia 2001; Berger and Hann 2007) or earnings
management (Datta et al. 2013). Consistent with theoretical predictions in
Bagnoli and Watts (2010), we show that the reverse effect is possible and that
2 Does reporting transparency affect industry coordination? Evidence from the duration of
international cartels
16
reporting transparency can affect industry coordination and competition.
Second, our study adds to the literature examining the use of accounting
information in implicit contracts. Ball et al. (2008) show that the transparency
of accounting information can influence non-formal contractual arrangements
such as the ownership structure of the loan syndicates. We contribute to this
stream of literature by pointing to the role of accounting transparency in
monitoring an implicit product market contract. Third, we contribute to prior
economic literature that analyzes cartel duration and its determinants (Suslow
2005; Zimmerman and Connor 2005; Levenstein and Suslow 2011) by
explicitly considering the effect of transparency on cartel duration. From a
policy standpoint, transparent reporting may have positive consumer welfare
implications, since it fosters competition by reducing cartel sustainability.
Therefore, our results are related to the debate on whether transparent reporting
can influence efficient resource allocation in an economy (Bushman et al.
2011).
The paper proceeds as follows. Section 2 reviews literature on industry
coordination, section 3 develops hypotheses, and section 4 reports on the
research design. Section 5 presents the empirical results, which are followed by
robustness tests in section 6. We conclude in section 7.
2.2 Product market coordination
Firms in oligopolistic product markets coordinate their actions because
industry prices and outputs are determined by a firm conditional on the actions
of its rivals. Collusion is widespread because it obviates the uncertainties of
independent actions and reduces the complexity of interdependencies between
firms (Lipczynski et al. 2005; Asch and Seneca 1976). Collusion varies in

Economic Consequences of Reporting Transparency
17
degree, from the sole expectation that the rival will not act independently in its
weakest form, to the strongest degree, where each firm sticks to an agreement
as long as its rivals do so. Joint ventures, trade organizations, and illegal cartels
are the most prominent examples of how firms coordinate their actions within
product markets, and underline the richness of institutions that can promote
industry coordination (Lipczynski et al. 2005). Other examples of industry
agreements include informal expressions of trade practices, agreements to
make similar announcements, and recognized and tolerated international cartels
(Machlup 1952). The trade-off between cooperation to maximize long-term
profits and defection to increase market share and profits at the cost of one’s
competitors is common to all forms of industry coordination.
A cartel is an agreement between firms from the same industry to fix
prices or industry outputs, to allocate territories or to divide profits (OECD
2007). Oligopolists forming a cartel seek to act collectively as if they were a
single monopolist, thus maximizing the joint profit. The optimal outcome is
achieved by determining an industry output at which the industry’s marginal
costs equal the marginal revenues (Lipczynski et al. 2005). By doing this,
cartels violate the cornerstones of competition policy. For example, Article 101
of the Treaty on the Functioning of the European Union prohibits both
horizontal and vertical agreements, such as price fixing, production quotas, and
agreements to share markets.
Cartels pose a severe threat to an economy because they harm
competition and reduce welfare (Lipczynski et al. 2005; Tirole 1988; von
Blanckenburg and Geist 2011). The impact on the general public of
cartelization varies with the size of the cartelized market, the duration of the
conspiracy, and price overcharges. For example, Connor and Bolotova (2006)

2 Does reporting transparency affect industry coordination? Evidence from the duration of
international cartels
18
show that cartel prices in different industries exceed prices under (perfect)
competition by between 7.1% and 49%. As a consequence, cartels are a top
priority of antitrust policy around the globe. The European Commission
imposed fines of €17.4 billion between 1990 and 2013 on firms that formed
cartels.
The key measure of cartel success is cartel duration. Based on evidence
from prior studies, it typically varies from 6.3 to 10.84 years depending on
sample composition (Zimmerman and Connor 2005; 2011; De 2010). The
average cartel duration in our sample is 10.68 years. The European
Commission’s cartel investigations are frequently triggered by an informal or
formal complaint filed by competitors or customers. Critically, most of the
cartels end due to one or more members applying for the leniency (amnesty)
program, which offers reduced fines if a cartel member helps with the
investigation. Many of these applications are the result of some cartel members
deviating from the cartel agreement (De 2010).
The salient feature of cartel agreements is that they are not enforceable
in court, and can only be enforced by cartel members. Enforcement of a cartel
is difficult due to the members’ temptation to deceive their fellow cartel
members by undercutting the agreed-upon collusive price (Suslow 2005;
Stigler 1964). Previous economic studies identify factors that can lead to
deviations from the cartel agreement and affect cartel duration (De 2010;
Levenstein and Suslow 2011; O'Brien et al. 2005; Spagnolo 2005; Suslow
2005; Zimmerman and Connor 2005). For example, De (2010) finds that
demand growth and changes in the political environment destabilize cartels,
while Levenstein and Suslow (2011) report that financial instability, entry of
new cartel members, and changes in antitrust policy reduce cartel duration. In

Economic Consequences of Reporting Transparency
19
summary, prior evidence supports the notion that cartel duration depends on
the internal stability of the cartel agreement. However, none of the
aforementioned studies investigates transparency as a means to either promote
or impede coordination among firms, or the effect of this coordination on
product market competition.
2.3 Hypothesis development
Oligopolistic markets exhibit different forms and degrees of
coordination between firms (Machlup 1952). Firms coordinate their actions to
reduce the uncertainty arising from interdependencies in strategic decisions and
to decrease competitive pressure. However, in order to maximize profits,
individual firms have incentives to deviate from the collusive agreements.
Since cartel agreements are illegal, such deviations from the implicit contract
cannot be prosecuted by official authorities. Rather, cartel members need to
self-enforce the cartel. Thus, the costs of operating a cartel depend on the effort
spent on policing member firms and the likelihood that deviations from the
cartel can be detected (Lanning 1987).
Williamson (1973) interprets collusion as a problem of contracting.
Contractual problems, like moral hazard, are often associated with information
asymmetries and opportunism (Mahoney 2005). Uncertainty and information
asymmetries between the cartel members increase the costs of sustaining a
cartel (Williamson 1973; Stigler 1964). Leslie (2004) concludes that
contracting costs hinder firms in oligopolistic markets from forming cartels,
because doing so is not cost-beneficial. As a result, cartel members seek
reliable information about their fellow members in order to monitor and police
the cartel agreement (Telser 1980; Williamson 1974), and invest in information

2 Does reporting transparency affect industry coordination? Evidence from the duration of
international cartels
20
gathering to improve the monitoring of individual firms’ activities (Levenstein
and Suslow 2006). Collecting such public information can be cost-beneficial
compared to administering costly punishments and initiating price wars
(Levenstein and Suslow 2006). As credibility of information is a critical
determinant of cartel duration (Spar 1994), audited financial statements are
likely to be an incremental source of information for cartel members
(Harrington Jr. 2006). Anecdotal evidence from international cartels shows that
cartel members use such publicly available accounting data. For example, the
“Amino Acid Cartel” hired an accounting firm to monitor sales reports
(Connor 2001; Harrington and Skrzypacz 2007), and the members of the
“Carbonless Paper Cartel” used other cartel members’ financial statement
information to verify the accuracy of internally self-reported sales numbers
(Harrington and Skrzypacz 2011).
Financial statements can reduce contracting costs by providing
transparent, publicly observable, and verifiable information (Ball et al. 2008;
Watts and Zimmerman 1986). Hence, transparent performance measures allow
better screening and more efficient contracting between agents (Jensen and
Meckling 1976; Lambert 2001; Beyer et al. 2010; Hölmstrom 1979).
International accounting standards can help sustain a cartel agreement by
allowing easier comparison of reported performance numbers across countries
(Brochet et al. 2013). For example, international accounting standards can
assist in the monitoring of market shares by unifying revenue recognition
criteria. Furthermore, international accounting standards require greater
disclosure than local GAAP (Daske and Gebhardt 2006). In this regard, IAS
14, which was applicable during our sample period, required geographic and
business segment disclosure, which had the potential to reveal important

Economic Consequences of Reporting Transparency
21
information for the enforcement of cartel agreements. Finally, international
accounting standards lower earnings management and thus reduce the possible
ways to hide cheating (Barth et al. 2013; Barth et al. 2008). Thus, reporting
under an internationally accepted accounting framework may increase the
sustainability of cartel agreements by decreasing contracting costs. We predict
that an increase in reporting transparency positively affects cartel duration:
H1a: The duration of cartel membership increases when a firm reports
transparently.
An alternative line of argument suggests that reporting transparency
may decrease cartel duration because it will lead to the earlier discovery of
non-compliance. Unlike debt or compensation contracts, the cartel contract has
no legal standing and is formed by industry peers. Thus, noncooperation and
cheating at the cost of one’s rivals is a short-term dominant strategy among
cartel members (Pepall et al. 2005; Roberts 1985). That is, there is a strong
temptation for cartel members to undercut the agreed-upon cartel price to
extract one-time gains (Suslow 2005). Furthermore, as cartel agreements are
illegal and unenforceable, cartels lack an effective mechanism by which to
control cheating (Orr and MacAvoy 1965).
Each cartel member’s propensity to deviate from the cartel agreement
depends on the difference between its private return and its share of the cartel’s
collective return. In the short-term, the private returns from cheating exceed the
collective returns (Dick 1996). Successful cheating can only take place if the
cheaters can hide their actions to avoid punishment by their fellow
conspirators. Since cartel members cannot observe each other’s past production
levels, they base their actions on publicly observable information and their own
production history (Abreu et al. 1986). Harrington and Skrzypacz (2011)

2 Does reporting transparency affect industry coordination? Evidence from the duration of
international cartels
22
develop a model in which cartels are stable as long as they truthfully report
their agreed-upon sales figures. Their model explains the cartel practice of
verifying self-reported sales using publicly available information (Harrington
and Skrzypacz 2011, 2007). Levenstein (1997) reports that publicly announced
violations of a collusive agreement frequently lead to price wars that end the
cartels. Therefore, once cheating is detected through more transparent
reporting, price wars are likely to erupt and end the cartel agreement. We
predict that reporting transparency may lower cartel duration because
transparency increases the likelihood that cheating will be detected through
better means of verification of self-reported numbers:
H1b: The duration of cartel membership decreases when a firm reports
transparently.
Cartels are sustained as long as the discounted long-term benefits
outweigh the gains of deviating from the cartel agreement (Friedman 1971;
Levenstein and Suslow 2006). If reporting transparency destabilizes cartels by
revealing cheating, the reduction in cartel duration should be more pronounced
for cartels in which cheating is more likely to occur. Cheating is more likely
when the potential gains to be made from cheating are high, which is the case
when there is a greater number of product or geographical markets that a firm
could capture by deviating from the cartel agreement (Stigler 1964; Levenstein
and Suslow 2006).
To illustrate, consider an example of two cartels that consist of two and
four firms, each having an equal market share of their respective cartel. Each
cartel member has incentives to cheat and capture part of a rival’s market
share. In the case of the cartel that has two members, the maximum
incremental gain of deviating from the cartel agreement is an increase in

Economic Consequences of Reporting Transparency
23
market share of 50%. However, successful cheating can increase the market
share by 75% when a cartel has four members. Similarly, a firm that colludes
with three firms operating in three different countries can gain, through
cheating, a larger geographical market than a firm in a cartel that operates in
just two countries. Additionally, prior literature identifies diversity of business
cultures and geographically dispersed production sites in international cartels
to be factors that increase the information needed to detect cheating
(Zimmerman and Connor 2005). International accounting standards can
facilitate information gathering in the international setting by providing
comparable information that can be used to detect deviations from the cartel
agreement. We expect that transparent cartels operating in a greater number of
geographic markets will have lower durations than transparent cartels operating
in environments with low opportunity costs of cooperation:
H2: Reporting transparency reduces the cartel duration of cartels, and
more so for cartels with high opportunity costs of cooperation.
2.4 Research design
2.4.1 Sample selection
The sample consists of all listed firms that infringed Article 101 of the
Treaty on the Functioning of the European Union and were convicted by the
European Commission between 1980 and 2010. As the information on cartel
cases is disclosed only when the investigation is completed, the dates over
which the cartels operated range between 1981 and 2005. Thus, our sample
period largely precedes the period of mandatory IFRS adoption. Our sample
selection procedure has implications for the interpretation of our results. The
choice to adopt IFRS on a voluntary basis is not random, as prior literature

2 Does reporting transparency affect industry coordination? Evidence from the duration of
international cartels
24
shows that the adoption of non-local GAAP is caused by capital market
pressure and financing needs (Cuijpers and Buijink 2005; Goncharov and
Zimmermann 2007). While these factors can be seen as exogenous to the cartel
setting, we acknowledge the presence of possible selection bias.
Furthermore, we use listed firms that were investigated and found to be
members of cartels. This will lead to selection bias when the factors affecting
the start of an investigation are correlated with reporting transparency and
cartel duration. We note that there is no evidence that the European
Commission uses financial statements to detect cartels. Most successful cartel
investigations were triggered by cartel members breaking the cartel agreement
and applying for the leniency program or by unofficial complaints from
competitors or consumer associations (De 2010). For example, in our sample,
about 50% of cartel members applied for the leniency program. In addition, we
find that in 36% of our sample cases the investigation of the European
Commission was initiated after the ending of the cartel. Thus, at least in some
of our cases, the investigation could not have influenced the cartel duration.7
Our research design addresses the potential sample selection bias in two ways.
First, we use an exogenous enforcement shock to control for the endogeneity of
our transparency proxy, which allows us to identify a causal relationship
between the use of international accounting standards and cartel duration
(Gassen 2014). Second, we construct a proxy for the likelihood of successful
investigation by the European Commission to control for the sample selection
bias.
7 Unfortunately, we cannot separately use in our tests the subsample of firms that ended their
cartel before the start of the investigation due to a lack of variation in our test variables in this
subsample.

Economic Consequences of Reporting Transparency
25
We hand-collect the data about the cartels from the Reports on
Competition Policy and the Commission’s website. We use the Commission’s
reports to calculate a cartel’s duration based on the reported start and end date
of the cartel. Furthermore, we use the reports to gather additional information
about the number of cartel members and their identities, whether a cartel
member is a repeat offender, whether one of the cartel members took part in
the leniency program, whether there was a reduction in the fine, whether a
cartelist was a whistleblower, and each cartel member’s country of origin. We
obtain data on GDP growth in each cartel member’s country from the World
Bank.
The initial hand-collected sample comprises 185 cartel firms. The final
sample consists of the 131 firms for which accounting data are available on
Worldscope. This corresponds to 186 cartel-firm observations, given that
repeat offenders were part of more than one cartel. The total number of
observations in the main analysis is 1,072 cartel-firm-years. Table 1 presents
the sample distribution across countries, and the number of firm-years in which
the cartel members followed international reporting standards.

2 Does reporting transparency affect industry coordination? Evidence from the duration of
international cartels
26
Table 1: Sample distribution across countries
This table presents the distribution of cartel members (firm years) across countries and shows the
frequency of IAS and local GAAP use in each country.
Country N % Cum. IAS
0 1
AUSTRALIA 5 0.47 0.47 5 0
AUSTRIA 11 1.03 1.49 7 4
BELGIUM 24 2.24 3.73 24 0
CZECH REPUBLIC 2 0.19 3.92 2 0
DENMARK 17 1.59 5.50 17 0
FINLAND 36 3.36 8.86 28 8
FRANCE 174 16.23 25.09 101 73
GERMANY 146 13.62 38.71 104 42
GREECE 3 0.28 38.99 3 0
HONG KONG 5 0.47 39.46 5 0
HUNGARY 10 0.93 40.39 0 10
ITALY 36 3.36 43.75 10 26
JAPAN 199 18.56 62.31 140 59
KOREA (SOUTH) 3 0.28 62.59 3 0
LUXEMBOURG 2 0.19 62.78 0 2
NETHERLANDS 75 7.00 69.78 72 3
NORWAY 3 0.28 70.06 3 0
SINGAPORE 1 0.09 70.15 1 0
SOUTH AFRICA 9 0.84 70.99 5 4
SPAIN 44 4.10 75.09 44 0
SWEDEN 25 2.33 77.43 20 5
SWITZERLAND 18 1.68 79.10 2 16
TAIWAN 6 0.56 79.66 6 0
UNITED KINGDOM 80 7.46 87.13 78 2
UNITED STATES 138 12.87 100.00 0 138
Total 1,072 100.00
680 392
Notes: IAS equals 1 if a firm follows international reporting standards according to Daske et al.
(2013, online supplement) or U.S. GAAP; and 0 otherwise.
Table 2 reports descriptive statistics for the experimental and control
variables. The average cartel duration is 10.68 years,8 which is close to the
average of 10.84 years reported in De (2010). The mean cartel fine levied by
the European Commission is €63.41 million. The average (median) cartel has
18.11 (13) member firms, and 37% of the sample firms report under
international accounting standards.
8 The cartel duration remains stable over our sample period and there is a weak correlation
between cartel duration and the time trend variable (Spearman correlation 8%).

Economic Consequences of Reporting Transparency
27
Table 2: Descriptive statistics
This table presents descriptive statistics for the full sample of cartel members from 1981 to
2005.
N=1,072 MEAN SD P25 P50 P75 N
DUR 10.68 5.65 6.00 10.00 14.00 1,072
LN(DUR) 2.22 0.57 1.79 2.30 2.64 1,072
IAS 0.37 0.48 0.00 0.00 1.00 1,072
LENIENCY 0.50 0.50 0.00 0.00 1.00 1,072
LN(FINE) 12.81 26.52 0.47 2.79 10.59 1,072
REPEAT 0.49 0.50 0.00 0.00 1.00 1,072
#MEMBER 18.11 13.31 11.00 13.00 21.00 1,072
LN(SIZE) 15.78 1.54 14.78 15.83 17.01 1,072
#SEG 3.64 2.16 1.00 4.00 5.00 1,072
GDP_GROWTH 2.45 1.83 1.26 2.39 3.72 1,072
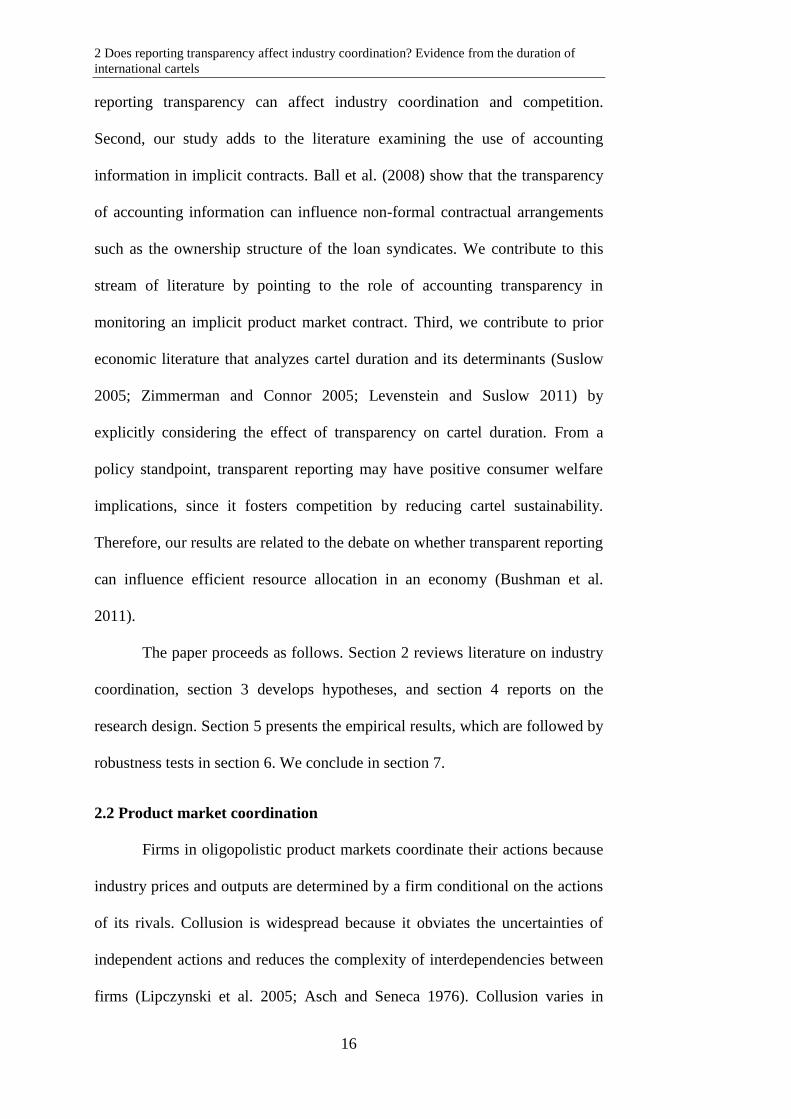
REDUCTION 17.69 28.88 0.00 0.00 30.00 1,072
WHISTLE 0.08 0.27 0.00 0.00 0.00 1,072
ROA 0.08 0.06 0.04 0.08 0.11 1,062
LEV 0.67 0.15 0.58 0.67 0.77 1,072
INFO_EVENT 0.80 0.39 1.00 1.00 1.00 1,072
Notes: DUR measures cartel duration in years. LN(DUR) is the natural logarithm of DUR. IAS
is an indicator variable which equals 1 if a firm follows IFRS or U.S. GAAP; and 0 otherwise.
LENIENCY is an indicator variable which equals 1 if the respective cartel member made use
of the leniency program, and 0 otherwise. LN(FINE) is the natural logarithm of the fine
determined by the European Commission scaled by total assets. REPEAT is an indicator
variable which equals 1 if a cartel firm takes part in a cartel more than once during the sample
period, and 0 otherwise. #MEMBER is number of cartel members. LN(SIZE) is the natural
logarithm of total assets in US$. #SEG is the number of reported segments. GDP_GROWTH
is the percentage change of each country’s GDP. REDUCTION is the relative reduction of the
fine granted by the European Commission for cooperating in the investigation. WHISTLE
equals 1 if the company reported cartel membership to the European Commission; and 0
otherwise. LEV is the firm’s leverage measured as the ratio of total liabilities to total assets.
ROA is the firm’s return on assets calculated as the ratio of earnings before interest and taxes
to total assets.
2.4.2 Survival analysis
We use the survival analysis technique to investigate determinants of
cartel duration measured in years. Since lifetime data often violates the
normality distribution, we estimate our models using Cox proportional hazard
regression. This method is commonly applied in duration analysis because it
does not assume any underlying distribution (De 2010; Jenkins 2004;
Levenstein and Suslow 2011; Cox 1972; Lambert 2007; Cleves et al. 2008).

2 Does reporting transparency affect industry coordination? Evidence from the duration of
international cartels
28
We estimate the hazard rate, which reveals the probability of exit from a state
in the next time period given survival up to that time (De 2010; Levenstein and
Suslow 2011; Cleves et al. 2008). The hazard rate is one plus the marginal
effect of changing the explanatory variable by one unit. We tabulate the
estimated hazard coefficients, which can be transformed into the hazard rate by
calculating the exponential of the coefficient (Cleves et al. 2008). Thus, a
positive coefficient represents a higher hazard rate, which implies a reduction
in the firms’ duration of membership of the cartel. For instance, if the
coefficient of IAS in model (1) is 0.18, firms following an international
accounting standard face a 20% higher hazard of exiting the cartel in the next
year than local GAAP firms (exp(0.18)=1.20 and 1.20–1=0.20). In our baseline
model the hazard function for firm i is given by:
Effects) Fixed +
GDP_GROWTH + SEG +LN(SIZE) +MEMBER+
REPEAT +FINE +LENIENCY + IAS(t)exp(h = h(t)
it8it7it6it5
it4it3it2it10
(1)
where h0(t) denotes the baseline hazard function and t is the elapsed time since
the firm first became part of the cartel. We assume that the cartel is terminated
when the first cartel member exits the cartel.9 Prior evidence shows that
international accounting standards increase transparency by requiring
comparable information to be provided and by mandating more informative
disclosure (Daske et al. 2013; Lang et al. 2012; Byard et al. 2011). We
conjecture that a cartel reports more transparently if at least one cartel member
follows international accounting standards.10 We use a dummy variable IAS
9 In 14 percent of the sample cases, cartels survive for more than one year after the first firm
exits the cartel. Our results are qualitatively similar when we assume that cartel is terminated
when the last firm exits the cartel (see De 2010). 10 Note that we can only observe data on publicly-traded cartel members, and thus we exclude
private firms. However, private firms were only recently required to use IFRS in some
countries. Thus, the coding of our test variable is not affected by our sample selection.

Economic Consequences of Reporting Transparency
29
that equals one if the company follows an international reporting standard
(IFRS or U.S. GAAP), based on Worldscope and Daske et al. (2013). A
positive coefficient on IAS shows that transparency lowers cartel duration as
predicted by hypothesis 1b (Suslow 2005; De 2010). Hypothesis 1a predicts
that transparency reduces contracting costs and increases cartel duration (β1 <
0).
We use a set of control variables predicted to affect cartel duration.
First, changes in the antitrust policy and enforcement affect cartel duration. To
control for changes in the E.U.’s antitrust policy, we focus on the use of the
leniency program, which guarantees a reduction in the fine associated with an
infringement. The introduction of a leniency program was expected to increase
the likelihood of cartel breakdowns because it gives firms incentives to self-
report their own antitrust violations in exchange for a reduction in the fine
(Brenner 2009). However, Harrington and Chang (2009) predict and find that,
if the leniency policy is effective, then the duration of the detected cartels
should increase. In this case, the leniency program gives cartel members a
means to punish defecting cartel members because cartels notifying the
European Commission about the existence of the cartel pay a reduced fine,
while the cheater has to face the full penalty. We use an indicator variable that
equals one for cartel firms that participated in the leniency program and predict
a negative coefficient on LENIENCY. We also use the natural logarithm of
imposed fines as a proportion of total assets (LN(FINE)) to control for changes
in the enforcement of antitrust policies. Higher fines can be a result of stricter
enforcement, which destabilizes cartels, or they can sustain cartels by
increasing the costs of breaking them up (Connor 2004).

2 Does reporting transparency affect industry coordination? Evidence from the duration of
international cartels
30
Second, we control for the cartel’s internal organizational structure.
Repeat offenders most likely experience higher scrutiny from external parties
since they have previously formed cartels (De 2010). Thus, being a repeat
offender is predicted to reduce cartel duration. We use an indicator variable
that equals one if a cartel member is a repeat offender and zero otherwise
(REPEAT). We also control for the number of cartel members (#MEMBER)
because the number of cartel members has been shown to impact cartel
duration (Levenstein and Suslow 2011; Stigler 1964; Posner 1970). While
theory predicts that cartel duration should decrease with respect to the number
of cartel members, empirical evidence so far has been unable to unambiguously
document this effect (De 2010).
Third, we use information from the financial statements of public firms
included in our sample to proxy for characteristics of the cartel firms. We
include the natural logarithm of total assets (LN(SIZE)) to control for size
effects. Larger firms may face higher reputational losses as a result of the
detection of the cartel, which should reduce their incentive to cheat and
increase their monitoring efforts. Financial statements aggregate information
across different segments; some of these segments will be a part of the cartel,
while a firm may compete in other segments outside of the cartel. A higher
number of segments may reduce the informativeness of financial statements in
respect of the segments that are part of the cartel. We use each firm’s number
of reported segments (#SEG) to control for this effect.
Fourth, we note that macroeconomic fluctuations, which impose a
shock of the cartel members’ economic environment, can affect cartel stability.
Cartel stability may decrease because cartel members may not be able to
differentiate the exogenous macroeconomic shock from the actual cheating

Economic Consequences of Reporting Transparency
31
behavior of fellow cartel members (Levenstein and Suslow 2011; Green and
Porter 1984; Suslow 2005). We use GDP growth to control for economy wide
factors influencing cartel duration.
2.4.3 Identification strategy
Our sample includes firms that choose to adopt IFRS. Furthermore,
prior literature shows that high-quality accounting rules lead to higher
transparency only when they are sufficiently enforced (Ball et al. 2003; Daske
et al. 2013). To control for the endogeneity of IAS, we follow the identification
strategy in Hail et al. (2014) and use the first enforcement of insider trading
from Bhattacharya and Daouk (2002) as an exogenous shock that increases
accounting quality. The first enforcement of insider trading has been shown to
improve reporting quality, increase analyst following, increase the scope of
analyst forecasts, and lead to more informative share prices (Bushman et al.
2005; Hail 2007; Fernandes and Ferreira 2009; Jayaraman 2012). Moreover,
the use of insider trading enforcement is advantageous from an econometric
perspective because it shows considerable variation across countries and is
exogenous to individual firms (Bhattacharya and Daouk 2002; Jayaraman
2012). The earliest year of insider trading enforcement in our sample is 1961,
in the United States, and the latest is 1996, in Australia, Greece, and Italy. We
use the difference-in-differences research design to shed light on the causal
effect of reporting transparency on cartel duration, and augment the hazard
model (1) with an indicator variable for the first year of insider trading
enforcement (INFO_EVENT) and an interaction term IAS×INFO_EVENT. We
focus on the interaction term coefficient, which shows whether the cartel

2 Does reporting transparency affect industry coordination? Evidence from the duration of
international cartels
32
duration increases (hypothesis 1a) or decreases (hypothesis 1b) with significant
improvements in the company’s information environment.
2.5 Results
2.5.1 Testing of hypotheses 1a and 1b
To examine whether reporting transparency affects cartel duration, we
first conduct a univariate test and compare the mean cartel duration of firms
that follow international accounting standards against that of firms that report
under local GAAP. Hypothesis 1a predicts that reporting transparency
increases cartel duration by decreasing contracting costs. Hypothesis 1b
predicts that duration decreases because reporting transparency facilitates the
detection of cheating. The results of this analysis are reported in panel A of
Table 3 and show that the mean duration for firms’ following international
standards (9.48 years) is significantly lower than that for firms following local
GAAP (11.37 years; t-stat. 5.43). This evidence supports hypothesis 1b and
suggests that reporting transparency decreases cartel duration.
We next use the hazard model (1) to control for other determinants of
cartel duration. The coefficient on IAS in panel B of Table 3 shows whether
reporting transparency reduces contracting costs and thereby increases each
firm’s stay in the cartel or whether it enables cartel members to detect cheating
earlier since the one-time gains of cheating outweigh the potential benefits of
staying in the cartel. We report the estimated hazard coefficients and associated
z-statistics based on standard errors clustered at the cartel-firm level. We find
that our main test variable IAS satisfies the proportional hazard assumption of
the Cox model (Schoenfeld residuals test χ2 = 0.00, p = 0.97).

Economic Consequences of Reporting Transparency
33
Table 3: Reporting transparency and cartel membership duration
This table examines whether reporting transparency affects cartel membership duration. Panel A
compares the mean cartel duration between the sub-sample of firm-years following international
accounting standards and a sub-sample of firms that follow local GAAP. Panel B reports the results of
Cox proportional hazard model. The dependent variable is the hazard rate. A positive coefficient
implies a positive impact on the hazard rate and thus a lower expected lifetime of the firm in the cartel.
Negative coefficients imply longer expected cartel duration.
Panel A. International accounting standards and average cartel duration
Sample Mean cartel duration t-stat.
International accounting
standards 9.48 years 5.43
Local GAAP 11.37 years
Panel B: Cox proportional hazard model
Predicted
sign (1) (2) (3) (4) (5)
IAS +/– 0.61* 1.01* 1.00* 0.91* 1.01*
(1.84) (1.89) (1.86) (1.78) (1.89)
LENIENCY – –1.12*** –1.71*** –1.79*** –1.71***
(2.88) (4.12) (3.92) (4.12)
LN(FINE) +/– –0.02** –0.06*** –0.06*** –0.05*** –0.06***
(2.03) (3.95) (3.96) (3.85) (3.95)
REPEAT + –0.37 –1.37* –1.41* –1.04* –1.37*
(1.05) (1.94) (1.91) (1.56) (1.94)
#MEMBER +/– –0.01 –0.02 –0.02 –0.02 –0.02
(1.10) (0.92) (0.88) (1.01) (0.92)
LN(SIZE) – –0.31** –0.41 –0.40 –0.41* –0.41
(2.22) (1.60) (1.55) (1.78) (1.60)
#SEG +/– 0.09 0.06 0.05 0.03 0.06
(1.24) (0.67) (0.59) (0.33) (0.67)
GDP_GROWTH + 0.03 0.39* 0.40* 0.31 0.39*
(0.36) (1.90) (1.83) (1.58) (1.90)
WHISTLE + 0.37
(0.51)
REDUCTION – –0.01*
(1.65)
ROA – –0.43
(0.14)
LEV + –0.67
(0.37)
GOOD_CG +/– 6.05***
(4.75)
Country,
industry, and
year fixed effects
No Included Included Included Included
Pseudo R2 6% 36% 36% 36% 36%
N 1,072 1,072 1,072 1,062 1,058
Notes: IAS is an indicator variable which equals 1 if a firm follows IFRS or U.S. GAAP; and 0
otherwise. LENIENCY is an indicator variable which equals 1 if the respective cartel member made use
of the leniency program, and 0 otherwise. LN(FINE) is the natural logarithm of the fine determined by
the European Commission scaled by total assets. REPEAT is an indicator variable which equals 1 if a
cartel firm takes part in a cartel more than once during the sample period and 0 otherwise. #MEMBER is
2 Does reporting transparency affect industry coordination? Evidence from the duration of
international cartels
34
[continued]
number of cartel members. LN(SIZE) is the natural logarithm of total assets in US$. #SEG is the number
of reported segments. GDP_GROWTH is the percentage change of each country’s GDP. REDUCTION
is the relative reduction of the fine granted by the European Commission for cooperating in the
investigation. WHISTLE equals 1 if the company reported cartel membership to the European
Commission; and 0 otherwise. LEV is the firm’s leverage measured as the ratio of total liabilities to total
assets. ROA is the firm’s return on assets calculated as the ratio of earnings before interest and taxes to
total assets. GOOD_CG is an indicator variable which equals 1 if the cartel firm’s country of origin has
high value of the anti-director-rights index; and 0 otherwise. Z-statistics are reported in parentheses and
are based on robust standard errors clustered by cartel-firm. *, **, and *** indicate statistical
significance at the 10%, 5%, and 1% levels, respectively.
We use the introduction of the leniency program by the European
Commission to control for changes in the cartel enforcement environment. Our
results show that the coefficient on LENIENCY is negative and statistically
significant (column (1): coeff. –1.12, z-stat. 2.88). This result supports the
prediction in Harrington and Chang (2009) that the leniency policy, if
effective, should increase the duration of any detected cartel. Furthermore, we
find that levied fines (LN(FINE)) prolong the lifetime of cartels (column (1):
coeff. –0.02, z-stat. 2.03). This finding is consistent with our prediction that
higher fines increase the costs of breaking a cartel up. Finally, we find a
positive and statistically significant coefficient on repeat offenders (REPEAT)
in columns (2) to (5). This suggests that repeat offenders exhibit longer time
spans in cartels, which contradicts our predictions but may be explained by the
fact that repeat offenders are more experienced with cartel coordination and
avoiding prosecution. In all specifications the coefficients on the other control
variables have the predicted signs but are not significant at the conventional
level.
Turning to our test variable, we find a positive and significant
coefficient on the indicator for following international accounting standards
(column (1): coeff. 0.61; z-stat. 1.84). This result supports our univariate
analysis and confirms that higher reporting transparency reveals cheating by

Economic Consequences of Reporting Transparency
35
cartel members, which destabilizes cartels. The exponential of the coefficient
(exp(0.61)=1.84) is the hazard ratio, which equals one plus the marginal effect
for firms following an international standard. Thus, we estimate that the
likelihood of leaving the cartel in the next year increases by 84% (=1.84–1) for
firms following an international reporting standard, holding other control
variables constant. To alleviate concerns that our results may be driven by
country and industry characteristics or changes in cartel regulation over time,
column (2) introduces controls for the country, industry (based on the Fama-
French 10 industry classification), and year fixed effects.11 We find that the
coefficient on IAS remains positive when we use fixed effects. These findings
support hypothesis 1b.
We next use a broader set of control variables to assess the robustness
of our results to other possible determinants of cartel duration. In column (3),
we include an indicator variable to control for the whistleblowing in the cartel
(WHISTLE), as whistleblowers attract the attention of regulators and reduce
cartel duration. The results in column (4) stem from the use of the relative
reduction in the fine, granted to firms that cooperate with the investigation
(REDUCTION), instead of LENIENCY, to more directly model the firm
benefits due to the introduction of the leniency program. Similar to our finding
for LENIENCY, we predict that a reduction in the fine should increase cartel
duration. Column (4) uses return on assets (ROA) and firm leverage (LEV) as
further controls for firm-specific incentives. Financial distress may increase
incentives to cheat since additional profits may help to overcome liquidity
shortfalls or prevent covenant violations (Busse 2002; Levenstein and Suslow
11 Including fixed effects does not allow us to identify the effect of countries with a small
number of data points. Therefore, we replicated our results using countries with at least 20 data
points. These additional tests did not change the inferences of our analysis.

2 Does reporting transparency affect industry coordination? Evidence from the duration of
international cartels
36
2011). We use firm leverage (LEV) as our proxy for proximity to covenant
violations and the availability of financing to cover short-term liquidity needs.
We use ROA as a proxy for the financial health of the company.
Finally, results in González et al. (2013) show that corporate
governance affects price fixing and other types of illegal corporate behavior.
Our previous models control for country fixed effects, and thus cross-country
variation in governance and enforcement. La Porta et al. (1998) show the
importance of the legal protection of investor rights as a country-level
corporate governance mechanism. Therefore, we additionally control for cross-
country variation in investor protection and classify countries into high versus
low investor protection regimes based on the median split of the anti-director-
rights index (La Porta et al. 1998; La Porta et al. 2000).12 The resulting
indicator variable GOOD_CG takes the value of one if the country has high
investor protection and zero otherwise. Column (5) reports a positive and
statistically significant coefficient on GOOD_CG; cartel members from
countries with high corporate governance standards exhibit lower time spans in
cartels. Critically, we continue to find that reporting transparency reduces
cartel duration after including additional control variables.
Overall, our results support hypothesis 1b and show that cartel duration
is negatively associated with the members’ reporting transparency. We next
use the time of the first enforcement of insider trading laws to infer the causal
relationship between our transparency proxy and cartel duration. Prior studies
suggest that higher transparency is only effective when appropriately enforced
(Ball et al. 2003; Daske et al. 2013). Therefore, we use an external shock to
12 We lose 14 cartel-firm-years due to the unavailability of the anti-director-rights index for the
Czech Republic, Hungary, and Luxembourg.

Economic Consequences of Reporting Transparency
37
enforcement, which has been shown to affect reporting quality (Bushman et al.
2005; Hail 2007; Fernandes and Ferreira 2009; Jayaraman 2012). The
interaction term between INFO_EVENT and IAS shows the incremental effect
of transparency for IAS firms after the introduction of insider trading laws. The
positive coefficient of the interaction term is consistent with hypothesis 1b. We
report the results of our identification test in Table 4.
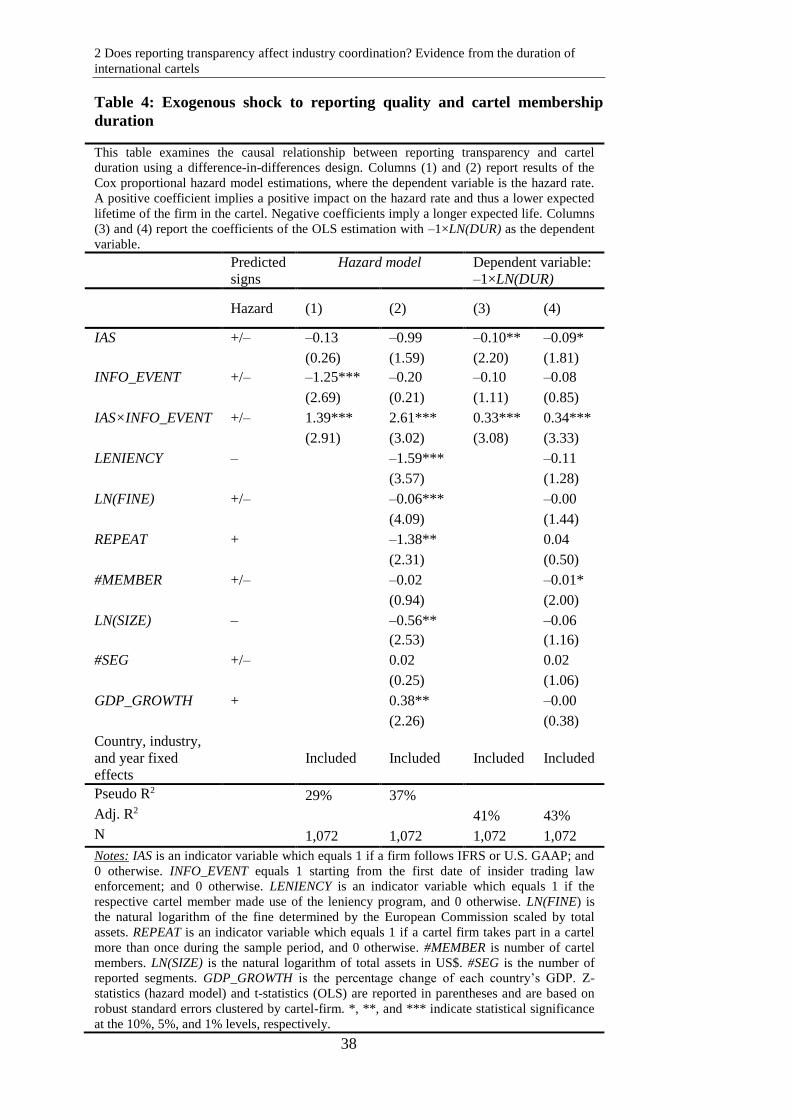
2 Does reporting transparency affect industry coordination? Evidence from the duration of
international cartels
38
Table 4: Exogenous shock to reporting quality and cartel membership
duration
This table examines the causal relationship between reporting transparency and cartel
duration using a difference-in-differences design. Columns (1) and (2) report results of the
Cox proportional hazard model estimations, where the dependent variable is the hazard rate.
A positive coefficient implies a positive impact on the hazard rate and thus a lower expected
lifetime of the firm in the cartel. Negative coefficients imply a longer expected life. Columns
(3) and (4) report the coefficients of the OLS estimation with –1×LN(DUR) as the dependent
variable.
Predicted
signs
Hazard model Dependent variable:
–1×LN(DUR)
Hazard (1) (2) (3) (4)
IAS +/– –0.13 –0.99 –0.10** –0.09*
(0.26) (1.59) (2.20) (1.81)
INFO_EVENT +/– –1.25*** –0.20 –0.10 –0.08
(2.69) (0.21) (1.11) (0.85)
IAS×INFO_EVENT +/– 1.39*** 2.61*** 0.33*** 0.34***
(2.91) (3.02) (3.08) (3.33)
LENIENCY – –1.59*** –0.11
(3.57) (1.28)
LN(FINE) +/– –0.06*** –0.00
(4.09) (1.44)
REPEAT + –1.38** 0.04
(2.31) (0.50)
#MEMBER +/– –0.02 –0.01*
(0.94) (2.00)
LN(SIZE) – –0.56** –0.06
(2.53) (1.16)
#SEG +/– 0.02 0.02
(0.25) (1.06)
GDP_GROWTH + 0.38** –0.00
(2.26) (0.38)
Country, industry,
and year fixed
effects
Included Included Included Included
Pseudo R2 29% 37%
Adj. R2 41% 43%
N 1,072 1,072 1,072 1,072
Notes: IAS is an indicator variable which equals 1 if a firm follows IFRS or U.S. GAAP; and
0 otherwise. INFO_EVENT equals 1 starting from the first date of insider trading law
enforcement; and 0 otherwise. LENIENCY is an indicator variable which equals 1 if the
respective cartel member made use of the leniency program, and 0 otherwise. LN(FINE) is
the natural logarithm of the fine determined by the European Commission scaled by total
assets. REPEAT is an indicator variable which equals 1 if a cartel firm takes part in a cartel
more than once during the sample period, and 0 otherwise. #MEMBER is number of cartel
members. LN(SIZE) is the natural logarithm of total assets in US$. #SEG is the number of
reported segments. GDP_GROWTH is the percentage change of each country’s GDP. Z-
statistics (hazard model) and t-statistics (OLS) are reported in parentheses and are based on
robust standard errors clustered by cartel-firm. *, **, and *** indicate statistical significance
at the 10%, 5%, and 1% levels, respectively.

Economic Consequences of Reporting Transparency
39
Columns (1) and (2) report the results for the proportional hazard
model. We find that the coefficient on the interaction term IAS×INFO_EVENT
is positive and significant at the conventional level (coeff. 2.61; z-stat. 3.02).
This result is in line with our prior findings that transparency reduces cartel
duration, because it reveals deviations from the cartel agreement. An
untabulated joint test of the main and interaction effects suggests that the
overall effect of following international standards in the aftermath of insider
trading enforcement increases the hazard rate. The combined coefficient is
positive and is about two standard errors away from zero (coeff. 1.26; z-stat
1.95).
Table 4 also reports the results of the linear probability model (OLS) to
provide a different presentation of our results. We caution the reader to
interpret these results with care, as OLS assumptions are violated in our setting.
The OLS model uses the natural logarithm of cartel duration as the dependent
variable (LN(DUR)). We multiply the dependent variable by minus one to
enable a similar interpretation of the coefficient signs. We expect and find a
negative and statistically significant coefficient on the interaction term
IAS×INFO_EVENT (coeff. 0.34, t-stat. 3.33). This result suggests that being
more transparent decreases cartel duration and gives further support to
hypothesis 1b.
2.5.2 Testing of hypothesis 2
Our prior results show that reporting transparency, on average,
destabilizes cartels and lowers cartel duration. Hypothesis 2 predicts that, in
this case, the effect of reporting transparency should be more pronounced in
cartels with high gains to be made from cheating, than in cartels with lower

2 Does reporting transparency affect industry coordination? Evidence from the duration of
international cartels
40
potential gains. Furthermore, we argue that potential gains from cheating are a
function of the number of geographic markets that a cartel firm could
potentially acquire by deviating from the cartel agreement. Firms typically
have a strong presence in their home market and look to enter other countries
where their competitors are domiciled. Therefore, we look at the country of
domicile of each cartel member and count the number of different countries in
each cartel. We then assign firms into quintiles based on the number of
different countries in their cartel, and compare those with the highest number
of different countries (4th and 5th quintiles) to those with the lowest number of
countries (1st and 2nd quintiles). We augment equation (1) with dummy
variables capturing a high and low number of different countries
(LOW_CHEAT and HIGH_CHEAT, respectively), and the interactions between
each of these dummy variables and IAS. Table 5 reports the estimation results
without fixed effects in columns (1) and (2) and those after controlling for
fixed effects in columns (3) and (4).

Economic Consequences of Reporting Transparency
41
Table 5: Cross-sectional differences in cheating gains and cartel duration
This table explores whether the effect of reporting transparency on cartel duration is conditional
on cross-sectional differences in potential gains of deviating from the cartel agreement. Panel A
reports results of the Cox proportional hazard model, where the dependent variable is the hazard
rate. A positive coefficient implies a positive impact on the hazard rate and thus a lower expected
lifetime of the cartel. Negative coefficients imply a longer expected life. Panel B tests hypothesis
2 and reports the z-test of the null hypothesis: IAS + IAS×LOW_CHEAT = IAS + IAS×
HIGH_CHEAT (based on the estimates from columns (1) and (2) and columns (3) and (4)). Panel A: Cox proportional hazard models
Predicted
sign (1) (2) (3) (4)
IAS +/– 1.11*** 0.38 1.84** 0.28
(2.67) (0.77) (2.39) (0.49)
LOW_CHEAT +/– 0.27 1.08
(0.51) (1.62)
IAS×
LOW_CHEAT
– –1.25*
(1.71)
–2.43**
(2.47)
HIGH_CHEAT +/– 1.25** 1.23
(2.36) (1.64)
IAS×
HIGH_CHEAT
+ 0.42
(0.61)
1.01
(1.44)
LENIENCY – –1.24*** –1.13*** –2.04*** –1.96***
(3.16) (2.82) (4.13) (4.30)
LN(FINE) +/– –0.02* –0.02** –0.06*** –0.05***
(1.83) (1.97) (3.37) (3.51)
REPEAT + –0.37 –0.24 –1.30* –1.42**
(1.02) (0.71) (1.80) (2.11)
#MEMBER +/– –0.02 –0.05** –0.02 –0.06
(1.27) (2.40) (0.80) (1.61)
LN(SIZE) – – 0.33** –0.27* –0.56* –0.37
(2.43) (1.93) (1.73) (1.24)
#SEG +/– 0.11 0.07 0.06 0.07
(1.50) (0.99) (0.62) (0.77)
GDP_GROWTH + –0.05 –0.00 0.37* 0.30
(0.58) (0.05) (1.76) (1.47)
Country, industry,
and year fixed
effects
No No Included Included
Pseudo R2 7% 9% 38% 39%
N 1,072 1,072 1,072 1,072
Panel B: Z-test of the null hypothesis: IAS + IAS×LOW_CHEAT = IAS + IAS× HIGH_CHEAT
Column (1) vs. (2) Column (3) vs. (4)
Z-test of high vs. low cheating gains 3.57 (p<0.01) 4.12 (p<0.01)
Notes: IAS is an indicator variable which equals 1 if a firm follows IFRS or U.S. GAAP; and 0
otherwise. LOW_CHEAT equals 1 if the number of countries of origin within the cartel is in the
1st and 2nd quintile and 0 otherwise. HIGH_CHEAT equals 1 if the number of countries of origin
within the cartel is in the 4th and 5th quintile, and 0 otherwise. LENIENCY is an indicator
variable which equals 1 if the respective cartel member made use of the leniency program, and 0
otherwise. LN(FINE) is the natural logarithm of the fine determined by the European
Commission scaled by total assets. REPEAT is an indicator variable which equals 1 if a cartel
firm takes part in a cartel more than once during the sample period, and 0 otherwise. #MEMBER
is number of cartel members. LN(SIZE) is the natural logarithm of total assets in US$. #SEG is

2 Does reporting transparency affect industry coordination? Evidence from the duration of
international cartels
42
[continued]
the number of reported segments. GDP_GROWTH is the percentage change of each country’s
GDP. Z-statistics are reported in parentheses and are based on robust standard errors clustered by
cartel-firm. *, **, and *** indicate statistical significance at the 10%, 5%, and 1% levels,
respectively.
Columns (1) and (3) examine the relationship between reporting
transparency and cartel duration for firms with low potential gains to be made
from cheating. In this set-up, the coefficient of the interaction term
IAS×LOW_CHEAT shows the incremental effect of reporting transparency on
cartel duration for cartels with low cheating gains relative to other cartels. The
sum of the coefficients on IAS and IAS×LOW_CHEAT shows the effect of
transparent reporting for the subsample of firms with low potential gains from
cheating. Similarly, the coefficient on IAS×HIGH_CHEAT in columns (2) and
(4) shows the incremental effect of reporting transparency on cartel duration
for firms with high opportunity costs of sustaining the cartel agreement relative
to other firms. The sum of coefficients on IAS and IAS×LOW_CHEAT shows
the effect for cartels with a high cheating likelihood. Hypothesis 2 predicts that
the coefficient on HIGH_CHEAT×IAS will be higher than the coefficient on
LOW_CHEAT×IAS. That is, reporting transparency reduces cartel duration,
and more so for cartels with high opportunity costs of cooperation.
Columns (3) and (4) of Table 5 report a positive coefficient on
HIGH_CHEAT×IAS. Consistent with hypothesis 2 and our prior evidence, we
further find that cartel duration is lower when cartel members report
transparently and have high opportunity costs of cooperation: This effect is
measured by the sum of the coefficients on IAS and on the interaction term
HIGH_CHEAT×IAS and equals 0.79 (z-stat. 1.65) and 1.29 (z-stat. 1.93) in
columns (2) and (4), respectively. We report a formal test of hypothesis 2 at the

Economic Consequences of Reporting Transparency
43
bottom of Table 5. We predict and find that the effect of reporting transparency
is more pronounced when cartel members have high gains to be made from
cheating than when cartel members have low opportunity costs of cooperation
(0.79 in column (2) vs. –0.14 in column (1); z-stat. 3.57). This evidence
supports hypothesis 2.
Finally, we report the results for cartels with low gains to be made from
cheating in columns (1) and (3). We find that the coefficient on the interaction
term IAS×LOW_CHEAT is negative and statistically significant (column (1):
coeff. –1.25; z-stat. 1.71; column (3): coeff. –2.43, z-stat. 2.47). We also find
that the sum of the coefficients on IAS and IAS×LOW_CHEAT is negative,
suggesting that reporting transparency prolongs the duration of cartels with low
opportunity costs of cooperation. However, the sum of coefficients is not
significant at the conventional level. Jointly, these results provide weak support
for hypothesis 1a and show that reporting transparency can have contracting
benefits and prolong the duration of cartels with relatively low potential gains
from cheating.
Overall, we find that transparent reporting prompts an earlier detection
of deviations from the cartel agreement, which initiates the break-up of the
cartel. Such a break-up is likely when cartel firms have high gains to be made
from violating the cartel agreement. However, cartels with low opportunity
costs of coordination may enjoy some contracting benefits as a result of
transparent reporting and thus endure longer.

2 Does reporting transparency affect industry coordination? Evidence from the duration of
international cartels
44
2.6 Robustness tests
2.6.1 Cartel duration and selectivity issues
This analysis uses a sample of convicted cartel members. Hence, our
sample is not random, because it omits firms that participated in the cartel but
were not indicted by the European Commission for their anticompetitive
behavior. As a result, our results may suffer from omitted variable bias if
reporting transparency is correlated with the likelihood of being prosecuted by
the European Commission. We use the two-stage Heckman estimation method
to control for the selection bias.13 In the first stage, we model the likelihood of
being indicted by the European Commission, that is, the likelihood of being
included in our main test sample. We then include the estimate of the inverse
Mills ratio (MILLS) as an additional explanatory variable in equation (1) to
control for the omitted variable problem (Heckman 1979).
itit5
4it3
it2it10
+ effects Fixed +CASES +
ROA +THSALES_GROW +
LN(SIZE) + DIST + = 1) = TProb(DETEC
(2)
Equation (2) is a Probit regression that models the likelihood of being
indicted by the European Commission. The dependent variable (DETECT) is
an indicator variable that equals one for all cartel firm-years and zero for the
(non-cartel) control firms. Ideally, we would like to have used a sample of
control firms that participated in the cartels but were not prosecuted by the
European Commission. However, as such cases are not observable we use a
matched sample of control firms that are similar to our cartel firms in a number
13 We are not aware of prior studies that have used this or some other approach to deal with the
selection bias in the context of the Cox proportional hazard model. The two-stage Heckman
method was developed for linear probability models, but was later shown to be applicable for
the non-linear probit regression (Rivers and Vuong 1988). Furthermore, the use of the two-
stage approach allows us to control for the likelihood that a firm is included in our sample, and
thus to address the omitted variable in the second-stage Cox proportional hazard model.
Economic Consequences of Reporting Transparency
45
of important characteristics. We match the convicted cartel members to firms
from same countries based on the four-digit SIC code, year, and size resulting
in 1,072 control firm-year observations.
The identification restriction of our two-stage model requires us to
identify at least one independent variable in the first-stage regression that is
predicted to explain the detection by the European Commission but is not
correlated to the firm’s duration in the cartel (Lennox et al. 2011). We use the
firm’s distance from the European Commission (DIST) to identify the equation
system, since it is likely to increase the odds of being indicted by the European
Commission but not to influence the cartel’s duration.14 Previous literature
predicts that the proximity of a firm to its regulator affects the effectiveness of
regulation (DeFond et al. 2011). For example, Kedia and Rajgopal (2011) find
that regulation is most effective when it is local. We predict that firms at a
greater geographic distance (based on their headquarters) from the regulator’s
main office in Brussels are less likely to be indicted by the European
Commission.
Equation (2) further controls for the firm size (LN(SIZE)) since larger
firms are more visible to the regulator, competitors, and consumers, increasing
the likelihood of informal complaints. We use the firm’s sales growth
(SALES_GROWTH), which may signal abnormally high product prices set by
the cartel agreement. The firm’s return on assets (ROA) measures profitability,
which may reveal to competitors, consumers, or the regulator that a firm is
abusing its market power. We use the number of cartel cases detected in a
given year (#CASES) to proxy for the stringency of the European
14 We find that DIST is correlated with the likelihood of cartel detection (p < 0.01) and is not
correlated with cartel duration (p = 0.58).

2 Does reporting transparency affect industry coordination? Evidence from the duration of
international cartels
46
Commission’s enforcement. We also include industry and year fixed effects to
control for time-invariant industry and year-specific effects.
Table 6: Cartel duration and selection bias
This table controls for sample selection bias using the two-stage procedure: Panel A reports
results of the first stage probit estimation using a sample of cartel firms (N = 1,072) and a
sample of firms matched by country, year and four-digit SIC code (N = 1,072). The dependent
variable is DETECT which equals 1 for cartel firms indicted by the European Commission for
forming an illegal cartel; and 0 otherwise. Panel B shows the results of the second-stage
proportional hazard model that includes the inverse Mills ratio. In the Cox proportional hazard
model estimations, the dependent variable is the hazard rate and a positive coefficient implies a
positive impact on the hazard rate and thus a lower expected lifetime of the firm in the cartel.
Panel A: First-stage
Predicted
signs Probit
DIST – –0.06**
(2.33)
LN(SIZE) + 0.31***
(4.62)
SALES_GROWTH + 0.68***
(3.50)
ROA + 0.84
(1.03)
#CASES + 0.07
(0.46)
Industry and year fixed
effects
Included
Pseudo R2 17%
N 2,144
Panel B: Second stage
Predicted
signs
Hazard model
(1) (2)
IAS +/– 0.98* –1.08*
(1.77) (1.66)
INFO_EVENT +/– –0.09
(0.08)
IAS × INFO_EVENT +/– 2.66***
(2.91)
LENIENCY – –1.74*** –1.63***
(3.91) (3.22)
LN(FINE) +/– –0.06*** –0.06***
(3.92) (3.93)
REPEAT +/– –1.33* –1.33**
(1.87) (2.29)
#MEMBER +/– –0.02 –0.02
(0.95) (0.93)
LN(SIZE) – –0.51 –0.74**
(1.56) (1.96)
#SEG +/– 0.06 0.03
(0.69) (0.34)
GDP_GROWTH + 0.38* 0.36**
(1.86) (2.25)

Economic Consequences of Reporting Transparency
47
[continued]
MILLS +/– –0.47 –0.75
(0.55) (0.80)
Country, industry, and year
fixed effects
Included Included
Pseudo R2 36% 37%
N 1,072 1,072
Notes: DIST is the distance in miles (in th.) between the firm’s location (headquarter) and the
European Commission’s headquarter in Brussels. LN(SIZE) is the natural logarithm of total
assets in US$. SALES_GROWTH is the firm’s sales growth measured as (Salest– Salest-1)/
Salest-1. ROA is the firm’s return on assets measured as the ratio of earnings before interest
and taxes to total assets. IAS is an indicator variable which equals 1 if a firm follows IFRS or
U.S. GAAP; and 0 otherwise. LENIENCY is an indicator variable which equals 1 if the
respective cartel member made use of the leniency program, and 0 otherwise. LN(FINE) is the
natural logarithm of the fine determined by the European Commission scaled by total assets.
REPEAT is an indicator variable which equals 1 if a cartel firm takes part in a cartel more than
once during the sample period, and 0 otherwise. #MEMBER is number of cartel members.
#SEG is the number of reported segments. GDP_GROWTH is the percentage change of each
country’s GDP. MILLS is the inverse Mills ratio calculated based on the estimates from the
first stage probit regression in panel A. Z-statistics are reported in parentheses and are based on
robust standard errors clustered by cartel-firm. *, **, and *** indicate statistical significance at
the 10%, 5%, and 1% levels, respectively.
Panel A of Table 6 reports the results of the first-stage probit
regression. We find that the proximity to the regulator increases the likelihood
of being indicted. We also find that larger firms and firms with higher sales
growth are more likely to have their cartels detected. We use the coefficient
estimates from this first-stage regression to calculate the inverse Mills ratio
(MILLS), which we include in equation (1) as an additional regressor. Panel B
of Table 6 replicates the results of Tables 3 and 4 after controlling for the
selection bias. We continue to find that transparent reporting under
international accounting standards reduces cartel duration (column (1): coeff.
0.96, z-stat. 1.74). This finding supports hypothesis 1b. Column (2) shows that
this result is not sensitive to our additional control for the voluntary nature of
IFRS adoption using the difference-in-differences research design (coeff. 2.76,
z-stat. 2.90). Untabulated results reveal that we continue to find support for

2 Does reporting transparency affect industry coordination? Evidence from the duration of
international cartels
48
hypothesis 2 after controlling for the inverse Mills ratio.15 Overall, controlling
for a selection bias does not alter our prior inferences.
2.6.2 Alternative test variables: Country-level transparency
We employ two alternative country-level metrics as alternative
measures of reporting transparency. First, we use a proxy for the extent of
countries’ compliance with IFRS, and substitute IASUSE for IAS. IASUSE is
based on Bhattacharya, Daouk, and Welker (2003) and varies between 0 and 2,
where 0 identifies countries that do not use IFRS, 1 is assigned to countries that
use IFRS as the basis for their own reporting standards, and 2 is assigned to
countries that adopt IFRS. Using this variable circumvents the concern that we
assign local GAAP that are very similar to IFRS to the non-IFRS group in our
main tests. Also, this variable does not assume IFRS and U.S. GAAP to be
similar. Second, we use a variable that measures a country’s disclosure level.
Higher scores for this variable correspond to greater disclosure requirements in
annual reports (Bhattacharya et al. 2003). We use an indicator variable for high
disclosure requirements based on the median split (DISCLOSURE). We use
this alternative measure to broadly capture reporting transparency, as it counts
the number of disclosed items in the annual report. Furthermore, greater
disclosure requirements in accounting standards are associated with enhanced
earnings informativeness (Bhattacharya et al. 2003). In line with our previous
results and hypothesis 1b, we predict positive coefficients on IASUSE and
DISCLOSURE.
Table 7 reports positive and statistically significant coefficients on
IASUSE (coeff. 3.27; z-stat. 2.34) and on DISCLOSURE (coeff. 2.79; z-
15 The Z-tests of hypothesis 2 shown at the bottom of Table 5 have a p-value < 0.01 after
controlling for the selection bias.

Economic Consequences of Reporting Transparency
49
stat.1.92).16 This result provides further support for hypothesis 1b and shows
that firms domiciled in countries with accounting standards that are more
comparable to IFRS and with greater disclosure requirements spend less time
in cartels.
Table 7: Alternative measures of reporting transparency
This table shows whether reporting transparency affects cartel duration using alternative
measures of reporting transparency. The table reports results of the Cox proportional hazard
model. The dependent variable is the hazard rate. A positive coefficient implies a positive
impact on the hazard rate and thus a lower expected lifetime of the firm in the cartel. Negative
coefficients imply longer expected cartel duration.
Hazard model
Predicted sign (1) (2)
IASUSE +/– 3.27**
(2.34)
DISCLOSURE +/– 2.79*
(1.92)
LENIENCY – –1.68*** –1.68***
(3.97) (3.97)
LN(FINE) +/– –0.36 –0.36
(1.62) (1.62)
REPEAT + –1.42** –1.42**
(1.99) (1.99)
#MEMBER +/– –0.03 –0.03
(1.10) (1.10)
LN(SIZE) – 0.11 0.11
(1.31) (1.31)
#SEG +/– –0.05*** –0.05***
(4.08) (4.08)
GDP_GROWTH + 0.36* 0.36*
(1.78) (1.78)
Country, industry, and year fixed
effects
Included Included
Pseudo R2 35% 35%
N 1,049 1,055
Notes: IASUSE equals 1 if a cartel firm’s country of domicile uses IFRS as the basis for their
own reporting standards, 2 if countries adopt IFRS, and 0 otherwise according to (Bhattacharya
et al. 2003).DISCLOSURE is an indicator which equals 1 if the disclosure level is greater than
the sample median; and 0 otherwise. The disclosure scores are from Bhattacharya et al.
(2003).IAS is an indicator variable which equals 1 if a firm follows IFRS or U.S. GAAP; and 0
otherwise. LENIENCY is an indicator variable which equals 1 if the respective cartel member
made use of the leniency program, and 0 otherwise. LN(FINE) is the natural logarithm of the
fine determined by the European Commission scaled by total assets. REPEAT is an indicator
16 The number of observations decreases because IASUSE is not available for the Czech
Republic, Greece, Hungary, and Taiwan, and DISLOSURE is not available for the Czech
Republic, Greece, Hungary, and Luxembourg.

2 Does reporting transparency affect industry coordination? Evidence from the duration of
international cartels
50
[continued]
variable which equals 1 if a cartel firm takes part in a cartel more than once during the sample
period, and 0 otherwise. MEMBER is number of cartel members. #SEG is the number of
reported segments. GDP_GROWTH is the percentage change of each country’s GDP.Z-
statistics are reported in parentheses and are based on robust standard errors clustered by cartel-
firm.*, **, and *** indicate statistical significance at the 10%, 5%, and 1% levels, respectively.
2.7 Summary and discussion
This study investigates whether reporting transparency affects product
market coordination and competition. We use cartels, because cartel members
coordinate their product market actions. We conjecture that the application of
international accounting standards (IFRS or U.S. GAAP) increases a cartel’s
reporting transparency. We predict that greater transparency may be beneficial
for the monitoring and enforcing of the cartel agreement, reducing contracting
costs and increasing cartel duration. Alternatively, more transparency may
facilitate the detection of cheating behavior. Since cheating is the short-term
dominant strategy for cartelists, being more transparent would lead to the
(earlier) detection of cheaters, destabilizing the cartel and lowering cartel
duration.
Overall, our results show that, following an internationally accepted
accounting framework on average reduces cartel duration. Thus, transparent
reporting prevents welfare-reducing coordination among firms. Since the
choice to follow IFRS is endogenous, we use an exogenous shock to
enforcement in a difference-in-differences research design and investigate the
causal effect of reporting transparency on cartel duration. Furthermore, we
control for the selection bias stemming from the fact that we only include
indicted cartels in our analysis. We continue to find that following international
reporting standards decreases a firm’s time spent in a cartel. We next use cross-
sectional variation in the potential gains of deviating from the cartel agreement

Economic Consequences of Reporting Transparency
51
to investigate the role of reporting transparency in revealing cheating behavior.
We find that cartels operating across multiple geographical markets have more
to gain from cheating and have lower duration when cheating is revealed
through transparent reporting, relative to cartels with low gains to be had from
cheating. We also find that, when the opportunity costs of cooperation are low,
reporting transparency leads to contracting benefits, which allow firms to
sustain cooperation over a longer period of time.
Our findings are relevant for antitrust authorities because reducing
cartel duration increases product market competition and can therefore be
beneficial for economies through the enhancement of resource allocation and
efficiency. In this regard, our results point to spillover effects between capital
market regulation and product markets, and show that improvements in
reporting transparency and enforcement can complement competition policy.
Furthermore, our results suggest transparency and disclosure as potential
remedies when the European Commission or local cartel authorities observe
undesired levels of price coordination but cannot prove them to be illegal (e.g.,
coordination between fuel retail companies in Australia and Germany
(Bundeskartellamt 2011)).

3 Proprietary costs of full portfolio disclosure for UK investment trusts
52
3 Proprietary costs of full portfolio disclosure for UK
investment trusts17
3.1 Introduction
The large body of literature which examines voluntary disclosure
suggests that managers disclose information if the benefits of disclosure
outweigh its costs (Verrecchia 2001; Healy and Palepu 2001; Dye 1986;
Guercio and Tkac 2002; Leuz and Verrecchia 2000). Among costs associated
with disseminating more information to the public are most importantly
proprietary costs which reflect important information to outside parties, and
especially competitors (Dye 1986; Darrough and Stoughton 1990; Berger and
Hann 2007; Harris 1998).
In this study I examine the costs of voluntary disclosure of full portfolio
holdings by UK investment trusts. The disclosure of information is especially
important in the financial sector since revealing the portfolio of investments is
comparable to showing a rather complete picture of the operations. Recently,
there has been a debate whether disclosures in the financial sector may have
detrimental economic consequences (Goldstein and Sapra 2013). Especially for
investment trusts, which are closed-end, it has been argued that more
transparency is desirable to make them more comparable to their open ended
counterparts. The main argument is that more transparency enables the investor
to better assess the quality of the product provider and its performance.
Furthermore, investors are more likely to invest, if the investment product had
clearer labelling so that the investor exactly knows what she is buying (Beard
17 This chapter is based on Peter, C.D. (2014b), Proprietary costs of full portfolio disclosure for
UK investment trusts, Working paper, WHU − Otto Beisheim School of Management. This
paper has been presented at the American Accounting Associations Meeting 2014, the 37th
European Accounting Associations Meeting, and the 50th British Accounting and Finance
Association Meeting.
Economic Consequences of Reporting Transparency
53
and Idzikowski 2012; Miller 2013). Ultimately, this raises the question whether
more transparency translates into an increasing demand for the product:
investment trusts’ shares.
The UK investment trust industry gives me the opportunity to directly
observe how an increase in transparency through voluntary disclosure affects
product demand. Since investors in open end trust’s trade shares directly with
the trust itself, open end trusts must create new shares to meet investors’
demand or redeem shares from investors that want to sell their shares. In
contrast to this, investment trusts sell a fixed number of shares through an
initial public offering (IPO). After the IPO, the amount of shares outstanding
does not change as long as there are no repurchases or share issues (Yang
2012). Therefore, investors trade shares among existing shareholders and new
investors on the secondary market. Furthermore, the investment trusts’
portfolio does not change as a result of changes in demand or supply of their
shares. Hence, the fixed number of shares outstanding results in a perfectly
inelastic supply function (Malkiel 1977; Wei 2007). With respect to mandatory
disclosure requirements, listing rules on the London Stock Exchange require
investment trusts only to give a comprehensive and meaningful analysis of the
portfolio (LR 15.6.2 (6)). That is why there is no obligation to fully disclose
portfolios publicly, although many trusts do so voluntarily.
Investment trusts have been shown to trade at a discount to their
respective net asset value (NAV). The net asset value discount (from here
onwards: discount) is the difference between the trust’s NAV (value of the
investment portfolio) and the current market value of its shares. Thus, based on
the inelastic supply function, changes in demand for the share are accompanied
by changes in the discount (Malkiel 1977). Previous studies have explained the

3 Proprietary costs of full portfolio disclosure for UK investment trusts
54
discount with liquidity differences between the trusts’ shares and its underlying
investment portfolio. If the trust is more liquid than its investments it trades at
a premium, and if not, it trades at a discount (Datar 2001; Cherkes et al. 2009).
Economic theory puts forward the argument that increased disclosure reduces
information asymmetry and thereby affects a firm’s stock liquidity and cost of
capital (Healy and Palepu 2001). Furthermore, it identifies increasing quantity
and/or quality of voluntary disclosure to be beneficial because it reduces
information asymmetry between insiders and outsiders or buyers and sellers of
a firm’s shares (Leuz and Verrecchia 2000; Botosan 1997). Additionally,
recent evidence suggests that on average individuals invest more into firms
with higher disclosure quality (Lawrence 2013). Based on this line of
argument, I form my first prediction that trusts’ voluntarily disclosing full
portfolio holdings exhibit changes in demand, observable as changes in the
discount.
The superior performance of some trusts has been shown to derive from
the stock picking ability and market timing of the manager (Wermers 2000;
Cuthbertson et al. 2008; Daniel et al. 1997). Releasing full portfolio holdings
may enable competitors or other investors to infer trading strategies or free-ride
on this information. For example, Frank et al. (2004) show that funds
mimicking an actively managed fund achieve returns that are undistinguishable
from those of an active managed one after expenses of the actively managed
fund. Consequently, due to equal performance, investors perceive less
managerial ability. Hence, investors’ updates of managerial ability cause prices
to change and the discount to move (Wei 2007; Berk and Stanton 2007). The

Economic Consequences of Reporting Transparency
55
proprietary costs are therefore observable as the reduction in demand for the
product (the trust’s share) reflected as changes in the discount.18
However, proprietary costs arising through additional disclosures may
negatively affect product demand. Prior literature identifies the management’s
fear of losing the firm’s competitive advantage or bargaining power to its
competitors by revealing sensitive proprietary information as the main driver
behind not disclosing all relevant information voluntarily (Hayes and
Lundholm 1996; Lambert et al. 2007; Verrecchia 2001; Wagenhofer 1990; Dye
1986). Whereas the proprietary costs argument in industrial firms seems to be
less pronounced, several studies from the financial industry suggest that the
release of proprietary information about the investment portfolio harms the
competitive position. This manifests in non-disclosure of informed positions
before investment managers have fully reaped the benefits of their private
information (Huddart et al. 2001; Agarwal et al. 2013; Aragon et al. 2013).
By disclosing the full portfolio holdings trusts reveal their investment
strategy and allow competitors to infer trading strategies. This in turn, may
severely reduce the impact of the managements’ stock picking ability or market
timing. Evidence from the mutual fund setting suggests that by releasing
proprietary information about the fund’s portfolio holdings to the public the
fund loses its informational advantage. Especially, top performing funds suffer
from disclosing more information about their portfolio compared to top
performing funds that disclose less (Parida and Teo 2011; Ge and Zheng 2006;
Brown and Gregory-Allen 2012). Chay and Trzcinka (1999) show that trusts
selling at a discount underperform trusts selling at a premium, suggesting that
18The costs associated with printing or disclosing the portfolio lists are trivial since every trust
has these for regular business activities. Therefore, real costs of disclosing the list do not
interfere with my measure of proprietary costs.

3 Proprietary costs of full portfolio disclosure for UK investment trusts
56
discounts reflect expectations of managerial ability. If the manager loses her
informational advantage through disclosure, future performance may decrease
due to copycat trusts (Frank et al. 2004) or front-running activities by
arbitrageurs (Wermers 2001). Consequently, investors perceive less managerial
ability which ultimately translates into a decrease in demand for the investment
trust’s shares reflected by a change in the discount (Wei 2007; Berk and
Stanton 2007).
Based on these arguments, I expect, information asymmetry to
decrease, however, the loss of the perceived competitive edge of the
investment trust leads to lower demand for the trust’s shares. Therefore,
decreasing information asymmetry by disseminating proprietary information
may lead to a widening of the discount. Nonetheless, it is an empirical question
how the tradeoff between the benefits of less information asymmetry and the
costs of releasing proprietary information affects product demand.
To test whether the release of full portfolio holdings affects product
market demand I exam the association between full disclosure and the trust’s
discount. The results show a positive association between voluntary disclosure
and product demand, on average. This finding is in line with a recent study by
Lawrence (2013) who finds that individuals invest more in firms with clear and
concise disclosures. Next, I identify situations where proprietary information
by the trust is very likely to affect product demand. Using cross-sectional
differences in past returns and portfolio turnover, I examine whether the release
of full portfolio disclosure is associated with an increase in the discount, a
decrease in product demand, respectively. Consistent with the proprietary cost
hypothesis, I find a negative association between releasing full portfolio
holdings and demand for trusts exhibiting superior past performance. The

Economic Consequences of Reporting Transparency
57
results are not sensitive to controlling for investor sentiment which is
associated with movements in the discount (Lee et al. 1991). Furthermore, I
substitute the indicator of full portfolio disclosure with another measure: the
percentage of disclosed investments. I continue to find the negative association
between full disclosure and proprietary information on product market demand.
Furthermore, I use changes in the trusts’ disclosure behavior to identify the
change of expectations about the trust’s future performance that occurs around
the switching year. Using changes in the trust’s disclosure behavior also helps
to mitigate the influence of omitted variables. The results support my prior
findings regarding the positive average association between full disclosure and
product demand. Furthermore, I control for self-selection bias throughout my
analyses. Overall, trusts with high proprietary information exhibit an
incremental decrease in product demand. In summary, my results show a trade-
off between the costs and benefits of fully disclosing portfolios for trusts with
high proprietary information.
This paper contributes to prior literature on voluntary disclosure (see,
e.g. Healy and Palepu 2001; Beyer et al. 2010) by providing evidence on how
voluntary disclosure is associated with changes in product demand.
Furthermore, measuring and quantifying proprietary cost is a challenge for
researchers (Verrecchia and Weber 2006; Beyer et al. 2010; Bamber and
Youngsoon 1998). By using the discount, I circumvent the noisy measure of
the level of competition in an industry as a measure of proprietary costs.
Moreover, information about the investment portfolio is competitively
sensitive and proprietary in nature because it describes the whole business
model of the trust. For example, stock picking ability and investment strategy
are easily observable through the disclosure of full portfolio holdings by

3 Proprietary costs of full portfolio disclosure for UK investment trusts
58
competitors. Hence, my inferences only rely on one important part of
disclosure in one industry and might be less noisy in comparison to multi-
industry settings, which for example use regulatory changes regarding segment
disclosure to infer whether firms try to hide profitable segments or segments in
markets with low levels of competition (Berger and Hann 2007; Botosan and
Harris 2000; Botosan and Stanford 2005; Leuz 2004).
It also adds to the debate on whether financial firms should disclose
more information in the aftermath of the financial crisis (see e.g. Goldstein and
Sapra (2013)). My results suggest that, despite the existing negative effects of
releasing proprietary information, on average disclosing more information
outweighs its costs. Furthermore, this paper adds to research concerning the
‘closed-end fund puzzle’ which is a widely studied anomaly in finance research
(see e.g., the survey by Dimson and Minio-Paluello (2002) or more recently
Cherkes (2012)). My evidence is consistent with liquidity-based theories of
changes in the discount (Datar 2001; Cherkes et al. 2009) because it establishes
a link between voluntary disclosure (a reduction of information asymmetry)
and changes in the discount.
The paper proceeds as follows. Section 2 presents the related literature
and introduces the institutional background. Section 3 describes the hypothesis
development. Section 4 explains the research design. Section 5 presents the
empirical results followed by a summary with concluding remarks in section 6.
3.2 Literature review and institutional setting
3.2.1 Literature review
Theoretical and empirical literature has shown that investors prefer
liquid shares and that voluntary disclosure can increase liquidity by reducing

Economic Consequences of Reporting Transparency
59
information asymmetry (Dye 1986; Amihud and Mendelson 2008, 1986;
Diamond and Verrecchia 1991). This in turn lowers the discount investors
require when purchasing the firm’s shares, leading to lower cost of capital.
However, these benefits of disclosure may come at the cost of revealing
proprietary information. Proprietary costs represent the management’s fear to
lose the firm’s competitive advantage or bargaining power to its competitors by
revealing sensitive proprietary information (Hayes and Lundholm 1996;
Lambert et al. 2007; Verrecchia 2001; Wagenhofer 1990). Dye (1986) uses an
analytical model to study the tension arising from the disclosure of proprietary
and non-proprietary information. The findings suggest that a value maximizing
manager does not diverge from her disclosure behavior unless disclosure
impacts firm value extremely positive (Dye 1986).
While theoretical evidence is well established regarding the proprietary
cost hypothesis, empirical evidence is rare and mainly focuses on segment
reporting (Beyer et al. 2010). For example, Hayes and Lundholms’ (1996)
findings suggest that the cost of finer segment reporting is that the firm’s
competitors will use the information to the disclosing firm’s disadvantage
(Hayes and Lundholm 1996). Harris (1998) investigates management
discretion in segment reporting. She explores whether the number of reported
segments matches the number of segments that could be reported according to
standard industry classifications (SICs) defining the different industries the
firm operates in. Her results suggest that managers try to hide abnormal profits
and market share in less competitive industries in order to keep competitors
from entry (Harris 1998). Berger and Hann (2007) use a change in US segment
reporting rules to investigate why managers conceal segment profits:
examining agency and proprietary cost. The results support the agency motive

3 Proprietary costs of full portfolio disclosure for UK investment trusts
60
(hiding segments with low abnormal profits) but gives mixed results regarding
the proprietary cost motive which is the management’s decision to hide
segment disclosure for segments that exhibit high abnormal profits (Berger and
Hann 2007).
Evidence from the mutual fund industry suggests that by releasing
information about the fund’s portfolio holdings to the public more frequently
the fund loses its informational advantage to its competitors. Especially, top
performing funds suffer from disclosing more information about their portfolio
compared to top performing funds that disclose less which leads to a negative
association between prior performance and actual returns (Parida and Teo
2011; Ge and Zheng 2006; Brown and Gregory-Allen 2012). Two recent
studies from the hedge-fund industry also emphasize the proprietary nature of
information content in the disclosure of portfolio holdings. Agarwal et al.
(2013) findings suggest that funds requesting confidentiality of certain
holdings have large risky portfolios or use unconventional investment
strategies. The concealed positions, however, exhibit superior performance.
They attribute their findings to private information within these holdings as one
reason why funds want to hide those positions (Agarwal et al. 2013). This
supports the notion that portfolio disclosure may increase proprietary costs.
Similarly, Aragon et al. (2013) highlight the importance of reduced disclosure
because they find that fund managers use the confidentiality option to protect
proprietary information. They find that managers seek confidentiality for
positions that have performed well in the past. Moreover, they find that the
investors profit from the gains associated with the confidentiality treatment
(Aragon et al. 2013).

Economic Consequences of Reporting Transparency
61
Management style and expertise are important features of management
ability. Prior studies find that actively managed funds outperform their
benchmarks suggesting that active management adds value and leads to better
performance (Amihud and Goyenko 2013; Daniel et al. 1997). However, there
are also studies questioning whether managers add value by actively managing
the trust (see, e.g., the widely cited Carhart (1997)). Recently, the evaluation of
managers shifted from a return-based view to the security-level analysis or
portfolio-based performance evaluation. These techniques allow researchers
and investors to get insights into asset-allocation and security-selection talents.
Furthermore, it allows decomposing the sources of value added by the
management. Benchmarking is also more precise since every
observation/investment laid out in the portfolio is one potential source of value
added by the management (Wermers 2006). If the manager loses her
informational advantage through disclosure, performance decreases due to
copycats (Frank et al. 2004) or front-running activities by arbitrageurs
(Wermers 2001). Frank et al. (2004) show that funds hypothetically mimicking
a portfolio of an actively managed fund have subsequent returns that are
undistinguishable from those of the active one after expenses (Frank et al.
2004). Consequently, investors perceive less managerial ability due to equal
performance which ultimately translates into a decrease in demand for the
investment trust’s shares reflected by a change in the discount (Wei 2007; Berk
and Stanton 2007).
3.2.2 Institutional setting
The UK investment trust industry displays some opportune features to
investigate the effects of voluntary disclosure on product market demand. First,

3 Proprietary costs of full portfolio disclosure for UK investment trusts
62
investment trusts are similar to any other listed industrial firms.19 They are
directly governed by an independent board of directors and indirectly by their
shareholders possessing voting rights (Cheng et al. 1994). With regards to the
shareholder base of investment trusts, institutional investors account for
approximately two thirds of total ownership. Shareholders are predominantly
long-term oriented and may differ in terms of return objectives, for instance,
fixed income component vs. return generation through capital gains (Dimson
and Minio-Kozerski 1999; Cherkes 2012). They predominantly invest in shares
and securities of other companies, and other unquoted assets. Aiming at capital
appreciation and investment income distributable to their shareholders
investment trusts manage their stock holdings and strive for further investment
opportunities. There is a vast variety in investment strategies ranging from
large/small-cap investments in developed and emerging markets to sector
specific investments in, for example communications, healthcare, or natural
resources (Dimson and Minio-Kozerski 1999). Nevertheless, the trusts are
relatively homogenous in terms of size and complexity (Cherkes 2012). The
industry itself consists of 275 conventional investment trusts with a market
capitalization of 79,245 £m.20
Second, investment trusts are listed closed ended investment companies
with a fixed number of shares. However, one important characteristic sets
investment trusts apart from other collective investment schemes: the net asset
value discount. The law of one price predicts that the same asset is priced the
19 Investment trusts are regulated by The Investment Trust Tax Regulations 2011 (ITR) and the
Corporation Tax Act 2010 (CTA10). The CTA10 has recently been amended. In order to be
recognized as an investment trust, firms apply to the HM Revenue & Customs (HMRC) and
have to fulfill three distinct conditions which are stated in Section 1158 of the CTA10.
Companies fulfilling these categories apply for the investment trust status and are subsequently
approved companies exempted from corporation tax on capital gains. The tax exemption only
applies to investment trusts located in the UK. 20See http://www.theaic.co.uk/aic/statistics/industry-overview; last checked: 31.07.2013.
Economic Consequences of Reporting Transparency
63
same. However, in contrast to open-ended investment trusts they do not always
trade at net asset value, that is at the same value as their underlying assets
(Pratt 1966; Boudreaux 1973). The discount measures the difference between
the market value of the trust and the net asset value of its investments. Unlike
their open-ended counterparts which can cancel and create units of shares
based on investor demand the number of shares stays constant after the trust’s
Initial Public Offering (IPO) (Malkiel 1977; Wei 2007; Dimson and Minio-
Kozerski 1999).21 The shares can only be traded on the secondary market.
Consequently, any shift in the discount reflects a shift in demand for the trust’s
share.
Investment trusts are listed companies and therefore fall under the
Disclosure and Transparency rules (DTR) (2013). They require listed firms to
give fair view of its business and financial situation.22 This requirement is
comparably loose and does not prescribe any exact obligation, which mandates
disclosure of single holdings or portfolio weightings. As a consequence,
investors, financial advisors, and other regulatory bodies such as the Retail
Distribution Review (RDR), call for a coherent framework of full portfolio
disclosure in order to achieve consistency and high quality disclosures.
Because the demanded framework is not incorporated as of today, advisors and
investors are still confronted with infrequent portfolio releases and stale data as
a consequence. Monthly factsheets published on funds’ websites barely
compensate for such information asymmetry. Thus, published information is
often insufficient to properly support investors in their asset allocation and
21 Share repurchases and new issues are possible, though, but come at transaction costs. 22As of April 2013, see for more details on the requirements: Disclosure Rules and
Transparency Rules (DTR), DTR 2: Disclosure and control of inside information by issuers,
DTR 4: Periodic Financial Reporting.

3 Proprietary costs of full portfolio disclosure for UK investment trusts
64
portfolio optimization decisions because most of the trusts only provide
information about their top ten holdings. Furthermore, inconsistencies in terms
of financial reporting activities (e.g. frequency, timing, data provision, and
quality) make a sound comparison across different funds difficult (Beard and
Idzikowski 2012). In my sample, 32 percent of the trusts do not choose to
disclose their full portfolio holdings. This closely matches statistics reported in
a recent analyst review of the UK investment trust industry (Beard and
Idzikowski 2012).
Since 2004 the United States Securities Exchange Commission (SEC)
requires mutual funds to disclose full portfolio holdings quarterly in contrast to
prior semi-annual disclosure. Parida and Teo (2011) compare semi-annually
and quarterly disclosing US mutual funds in the periods 1990-2003 and 2005-
2008. They find that before the change funds disclosing only semi-annually
exhibit better performance than those funds disclosing quarterly. After the
regulatory intervention this difference disappears. They attribute their findings
to the increase in free-riding and copy-cat funds which use the available
information to trade against previously successful funds (Parida and Teo 2011).
My study is different since it focuses on the question whether a trust discloses
full portfolios, at all. On the other hand, their research question focuses on
whether more frequent disclosures influence future performance. Nonetheless,
both studies put forward proprietary costs as one implication of more
(frequent) disclosure which influences the trusts’ future performance.
3.3 Hypothesis development
Economic theory proposes that increased disclosure reduces
information asymmetry and thereby affects a firm’s stock liquidity and cost of
capital (Healy and Palepu 2001). Furthermore, it identifies increasing quantity

Economic Consequences of Reporting Transparency
65
and/or quality of voluntary disclosure to be beneficial because it reduces
information asymmetry between insiders and outsiders or buyers and sellers of
a firm’s shares (Leuz and Verrecchia 2000; Botosan 1997). In the investment
trust industry the voluntary disclosure of full portfolio holdings allows
investors and investment advisors to know exactly what they are invested in. It
reduces the perceived risk and makes trusts more comparable within different
investment categories. It also allows investors and advisors to monitor the trust
and its investment activities more closely (Beard and Idzikowski 2012).
Additionally, recent evidence suggests that on average individuals invest more
into firms with higher disclosure quality (Lawrence 2013). Building on this and
prior evidence, I expect voluntarily disclosing full portfolio holdings to affect
the demand for the investment trust, consequently observable in a changing
discount.
H1: Disclosure of full portfolio holdings affects the demand for the
trust’s shares which ultimately maps into a reduction of the net asset
value discount.
A contrary perspective suggests that by voluntarily disclosing
additional information firms disseminate sensitive information to the markets
which weakens their competitive advantage (Hayes and Lundholm 1996;
Lambert et al. 2007; Verrecchia 2001; Wagenhofer 1990).
Adding to this notion, evidence from the closely related mutual fund
setting suggests that by releasing proprietary information about the fund’s
portfolio holdings to the public the fund loses its informational advantage.
Prior mutual fund literature finds an asymmetric relationship between fund
holdings’ disclosure frequency and fund performance (Parida and Teo 2011;
Ge and Zheng 2006; Brown and Gregory-Allen 2012). Prior “winners”, which
3 Proprietary costs of full portfolio disclosure for UK investment trusts
66
are trusts that exhibit superior performance compared to their peers, suffer
from more frequent disclosure of portfolio holdings by decreasing
performance. Prior “losers” perform better after disclosing their portfolios.
Moreover, exposing the portfolio to the public might attract copycats, free
riders and front-runners which lead to diminishing trust returns (Ge and Zheng
2006; Parida and Teo 2011; Brown and Gregory-Allen 2012; Wermers 2001;
Frank et al. 2004). Furthermore, Agarwal et al. (2013) show that hedge funds
make use of a confidentiality option to hide risky portfolios or nonconventional
investment strategies which exhibit superior performance. Hedge fund
managers hide private information due to proprietary cost arising when
disseminating portfolio holdings to the market and consequently decreasing the
fund’s future performance. In the same vein, Aragon et al. (2013) find that
managers who seek confidentiality to protect proprietary information earn
abnormal returns with these positions, emphasizing benefits of reduced
disclosure.
Berk and Stanton (2007) explain movements in the discount by
investors’ perception of management ability (Berk and Stanton 2007). The
basic notion behind their argument is that if the manager does not add value to
the fund while charging fees the trust trades at a discount (Boudreaux 1973;
Berk and Stanton 2007). Therefore, the perception of investment skill affects
investors’ demand. Revealing the full portfolio of investments may negatively
affect the trust’s performance. If the investors perceive diminishing returns as a
sign of a lack of investment ability they retract from buying these shares.
Consequently, successful funds have lower incentives to disclose full portfolio
holdings.

Economic Consequences of Reporting Transparency
67
To more directly examine the nature of proprietary costs of voluntary
disclosure, I examine investment trusts which bear the highest proprietary
costs. Since past returns are a measure of investment skills I expect proprietary
cost to be highest for trusts with high past performance. I expect the demand
for those investment trusts to decrease because they lose their proprietary
advantage through releasing full portfolio holdings. Therefore, the second
hypothesis is stated as follows:
H2: Disclosure of full portfolio holdings decreases the demand for the
trust’s shares if investment skill (past returns) are highest.
Active management of the investment portfolio entails costly research
to find stocks with superior performance. Hence, Wermers (2000) finds that
mutual funds with higher turnover rates hold investments that outperform funds
with low turnover rates (Wermers 2000). Therefore, higher portfolio turnover
rates may convey some evidence about the manager’s superior private
information. Thus, better (informed) managers’ trade more to take advantage of
their superior information. Grinblatt and Titman (1994) find portfolio turnover
to be associated with finding underpriced stocks (Grinblatt and Titman 1994).
In this case, full portfolio disclosure reveals, apart from the nature of the
investment, also changes (on the single security-level) in the portfolio. Changes
in the trust’s different investments uncover private information about the
fundamental value of the investment and convey this information to the market
(Agarwal et al. 2013). By disclosing greater amounts of the portfolio holdings
firms reveal their investment strategy and allow competitors to make inferences
about trading strategies which severely reduce the impact of the managements’
stock picking ability and market timing. Therefore, I expect more actively
traded trust portfolios to contain more private information. Thus, other

3 Proprietary costs of full portfolio disclosure for UK investment trusts
68
investors may use this information to mimic investment strategies that reduce
the trust’s performance. Consequently, I expect the demand for the invest trust
shares to decline. Subsequently, my third hypothesis is stated as follows:
H3: Disclosure of full portfolio holdings decreases the demand for the
trust if portfolio turnover is highest.
3.4 Research design
3.4.1 Sample selection
I use all conventional UK investment trusts (SIC=6726) with available
data on Worldscope. Currently, there are 398 investment companies members
of the AIC (Association of Investment Companies) in the UK of which 275 are
conventional investment trusts. The hand-collection of investment trusts covers
174 investment trusts for the period from 1993 to 2011. I collected the data on
portfolio disclosures from the trust’s annual reports and I use Worldscope as an
additional data source for balance sheet and income statement items as well as
for stock market data. The final sample used in the analysis covers 142
investment trusts with data available over the period 1993-2011, resulting in
1,534 firm-year observations.
I choose this sample period in order to obtain variation in annual full
portfolio disclosure (FULL) and the percentage of disclosed investments
(%NAV) variable. The cut-off in 2011 is most importantly attributed to the EU
initiative and industry specific incentives beginning in 2012, mainly pushed by
the AIC and Morningstar, which tend to make investment trusts, (1) to disclose
full portfolio holdings, and (2) additionally to do this on a more frequent level
than annually (Beard and Idzikowski 2012).

Economic Consequences of Reporting Transparency
69
To circumvent data availability issues I start the sample period in 1993.
To ensure the integrity of the data time-period I re-estimate the main tests with
time spans varying between 5 and 10 consecutive years. My inferences stay
unchanged.
3.4.2 Main test
I use the net asset value discount to establish a link between proprietary
cost of voluntary disclosure and product market demand. I try to show that
disclosing proprietary information in terms of full portfolio holdings outweighs
the benefits of disclosure such as increase in liquidity and lower cost of capital
(Leuz and Wysocki 2008; Beyer et al. 2010). In my setting, the actual costs of
disseminating proprietary information are a reduction in product market
demand which represents a widening of the net asset value discount.
I test my hypotheses by regressing investment trusts’ net asset value
discounts (DISCOUNTi,t+1) on a binary variable indicating whether the
investment trust fully discloses its investment portfolio (FULL). I model the
relation between DISCOUNTi,t+1 and FULL as a lead-lag relation to
acknowledge the fact that the market adjusts its priors after the release of the
annual report (see e.g. Lawrence (2013), Covrig et al. (2007), or Bradshaw et
al. (2004) for a similar research design). I expect investors to respond to the
release of full portfolios by adjusting their demand for the respective trust, due
to the lead-lag relationship between financial disclosure and individual
shareholdings. Eventually, this relationship allows me to establish a notion of
causality.
I use equation (1) to examine the association between full disclosure of
investment portfolio and the discount in the following year. I expect voluntarily

3 Proprietary costs of full portfolio disclosure for UK investment trusts
70
disclosing information by the trusts to affect the demand for their shares in the
following year.
itit8it7
it6it5it4
it3it2it101ti,
εIMRβLNAGEβ
SIZEβYIELDβOWNERSHIPβ
EXPENSESβRETURNβFULLβαDISCOUNT
(1)
I define the dependent variable, next period’s discount DISCOUNTi,t+1
in line with prior literature as net asset value less market value divided by net
asset value (Gemmill and Thomas 2002; Hwang 2011). To illustrate, if the
trust’s net asset value is 10 and the market value is 9, the trust trades at a
discount of 10%, and if the market value of the trust is 11 and the net asset
value is 10 it trades at a premium of -10%. To calculate the discount I use data
on common equity (WC03051) and market capitalization (WC08001) from
Worldscope. My main test variable is FULL, which is an indicator variable that
takes on the value one if the trust discloses 100% of its investment portfolio;
and zero otherwise. I manually obtain the information on portfolio disclosure
from the trusts’ annual reports. I expect FULL to increase the trust’s liquidity
and decrease the cost of capital which corresponds to an increase in the
demand for the trust’s shares. Therefore, the expected sign for FULL is
negative. Contrary to this notion, I expect FULL to be positive if the
proprietary cost of disclosing full portfolios outweighs the benefits of
disclosure.
The second measure of portfolio disclosures is the percentage of
disclosed investments %NAV calculated by dividing the net asset value of
disclosed investments by the trust’s total net asset value (%NAV). The reason
for using %NAV is that it has more variation and is not as restrictive as FULL.
Nonetheless, I expect %NAV to be consistent with my predictions for FULL.
Economic Consequences of Reporting Transparency
71
Additionally, I employ several control variables from prior literature
which explain the discount. I use raw buy and hold returns (RETURN),
calculated as the change of the stock price over the fiscal year divided by last
year’s stock price, to capture the trust’s performance over the year (Parida and
Teo 2011; Brown and Gregory-Allen 2012). I expect RETURN to be positively
associated with the discount (DISCOUNTi,t+1), since ceteris paribus demand for
well-performing (successful) trusts should be higher than for unsuccessful
ones. To control for agency costs related explanations of the discount I control
for excessive management fees by using the ratio of the sum of management
fee, operating costs, and other costs incurred by the trust, divided by net assets
(EXPENSES) (Malkiel 1977; Khorana et al. 2002). I expect EXPENSES to
have a positive impact on the discount in line with Gemill and Thomas (2002).
I use each trust’s dividend yield (YIELD) to control for arbitrage costs. I expect
YIELD to have a negative sign because the higher the dividend yield the more
valuable is the trust (Pontiff 1996). Furthermore, I control for other trust-
specific characteristics like size (SIZE) measured as the natural logarithm of
the investment trust’s total assets (Pontiff 1996) and institutional ownership,
measured as the percentage of closely-held shares (OWNERSHIP) (Gemmill
and Thomas 2006; Barclay et al. 1993). Larger investment trusts tend to trade
on a smaller discount, on the other hand, investors seem to favor trusts with
less institutional investors. Therefore, I expect SIZE to have a negative sign and
OWNERSHIP to be positively associated with the DISCOUNTi,t+1. To control
for age specific fluctuations in the discount I use LNAGE, the natural logarithm
of the timespan between the incorporation date and the respective firm-year
observation. Older investment trusts are associated with higher discounts
because trusts are often issued in hot periods trading at a premium. Over time,

3 Proprietary costs of full portfolio disclosure for UK investment trusts
72
however, they slide to trade at a discount (Gemmill and Thomas 2002; Lee et
al. 1991).
I modify equation (1) to identify situations in which I find proprietary
costs to be of high importance. More specifically, I use cross-sectional
differences in each trusts’ performance in terms of returns and portfolio
turnover. I expect trusts located in the HIGH_X quintiles of both, returns and
portfolio turnover, to have proprietary information suggesting that disclosing
full portfolio holdings may be detrimental to the demand for their shares.
Therefore, I expect the incremental effect of disclosure while being part of the
top quintile of either returns or portfolio turnover, to be positively associated
with the discount.
itit9it8
it7it6it5
it4itit3
it2it101ti,
εIMRβLNAGEβ
SIZEβYIELDβOWNERSHIPβ
EXPENSESβHIGH_XFULLβ
HIGH_XβFULLβαDISCOUNT
(2)
HIGH_X in equation (2) represents the fifth quintile of the different
experimental variables which I use to capture proprietary cost. The coefficient
of main interest is β3 from the interaction between FULL and HIGH_X which
captures the incremental effect of disclosure conditional on having high
proprietary cost. To test hypothesis 2, I use RETURN to examine the
incremental effect of voluntary disclosure on the demand for the trust’s shares.
I expect firms in the fifth RETURN quintile to have high proprietary cost
because higher stock picking ability and management skills are associated with
high returns. I expect the sign of the coefficient on the interaction β3
(FULL×HIGH_RETURN) term to be positive.
To further evaluate whether full portfolio disclosure bears proprietary
costs which reduce product demand I use cross-sectional differences in the
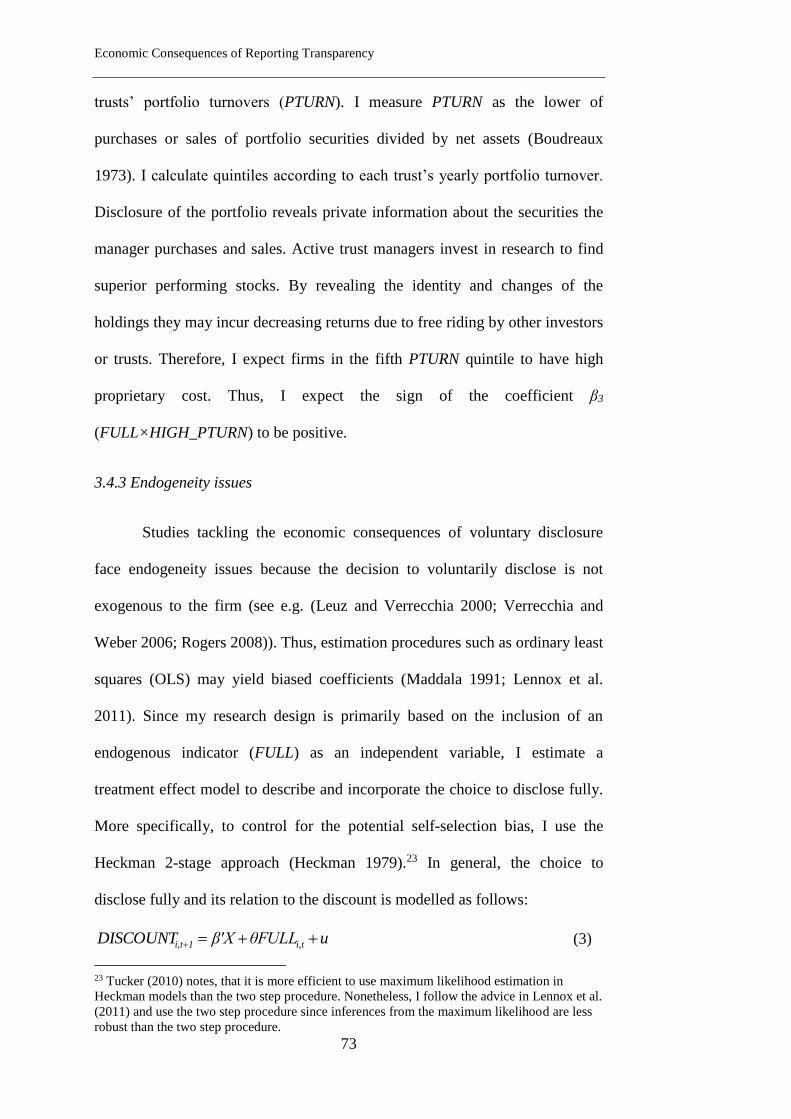
Economic Consequences of Reporting Transparency
73
trusts’ portfolio turnovers (PTURN). I measure PTURN as the lower of
purchases or sales of portfolio securities divided by net assets (Boudreaux
1973). I calculate quintiles according to each trust’s yearly portfolio turnover.
Disclosure of the portfolio reveals private information about the securities the
manager purchases and sales. Active trust managers invest in research to find
superior performing stocks. By revealing the identity and changes of the
holdings they may incur decreasing returns due to free riding by other investors
or trusts. Therefore, I expect firms in the fifth PTURN quintile to have high
proprietary cost. Thus, I expect the sign of the coefficient β3
(FULL×HIGH_PTURN) to be positive.
3.4.3 Endogeneity issues
Studies tackling the economic consequences of voluntary disclosure
face endogeneity issues because the decision to voluntarily disclose is not
exogenous to the firm (see e.g. (Leuz and Verrecchia 2000; Verrecchia and
Weber 2006; Rogers 2008)). Thus, estimation procedures such as ordinary least
squares (OLS) may yield biased coefficients (Maddala 1991; Lennox et al.
2011). Since my research design is primarily based on the inclusion of an
endogenous indicator (FULL) as an independent variable, I estimate a
treatment effect model to describe and incorporate the choice to disclose fully.
More specifically, to control for the potential self-selection bias, I use the
Heckman 2-stage approach (Heckman 1979).23 In general, the choice to
disclose fully and its relation to the discount is modelled as follows:
uθFULLβ'XDISCOUNT i,t1i,t (3)
23 Tucker (2010) notes, that it is more efficient to use maximum likelihood estimation in
Heckman models than the two step procedure. Nonetheless, I follow the advice in Lennox et al.
(2011) and use the two step procedure since inferences from the maximum likelihood are less
robust than the two step procedure.

3 Proprietary costs of full portfolio disclosure for UK investment trusts
74
X is a vector of controls which affect the DISCOUNTi,t+1 and FULL is
an indicator variable that is one if the trust discloses its full portfolio; and zero
otherwise.
υXαZαFULL '
1
'
0it (4)
Equation (4) shows the binary choice (Probit) model. The intuition
behind controlling for the choice of full disclosure by the fund is that it may be
driven by unobservable variables that might be correlated with the discount.
Since full disclosure is endogenous, the error terms (u and ν) in equation (3)
and (4) are correlated. That is why, without controlling for this issue, θ is
biased. Therefore, I calculate the inverse mills ratio (IMR) in order to control
for omitted correlated variables that affect both the choice to disclose fully and
the discount and add it to equation (3), resulting in the following:
IMRθFULLβ'XDISCOUNT i,t1i,t (5)
Since the error term in equation (5) and FULL are uncorrelated, θ is
unbiased. The magnitude of the potential selection bias can be inferred from
the direction and statistical significance of δ. It is also noteworthy that IMR,
FULL, and the control variables are by definition correlated. Therefore, I
calculate the variance inflation factors (VIFs) after the implementation of the
inverse mills ratio to address potential issues regarding multicollinearity.
Naturally, the VIFs are higher when I include the IMR in the different
regression models but they are in general under the critical value of 10 and
only show a level of 11.03 in one specification. Furthermore, my results in
Tables (2) to (6) are robust to the inclusion of the inverse mills ratio and do not
suffer from a selection bias.

Economic Consequences of Reporting Transparency
75
Equation (6) operationalizes equation (4) and gives some insight on the
determinants that drive the decision of full portfolio disclosure in the
investment trust industry.
it9it8it7
it6it5it4
it3it2it10it
εSIZEβEMERGINGβOWNERSHIPβ
GEARβYIELDβRETURNβ
EXPENSESβPAGESβTURNOVERβα)Prob(FULL
(6)
A critical step in the implementation of the Heckman-2-Stage approach
is the identification of an exogenous independent variables which can be
convincingly excluded from the second stage (Lennox et al. 2011). In this case,
I exclude TURNOVER, calculated as the monthly share turnover three months
after fiscal year-end, to capture the liquidity of the trust. TURNOVER is
negatively correlated with the decision to fully disclose but not with next year’s
discount. This also reveals the notion that trusts which are traded more
frequently have lower intentions to disclose their portfolio to their competitors.
Ultimately, it seems as if the benefits of voluntary disclosure are not as
important for trusts with high turnover rates. Nonetheless, I acknowledge the
fact that selection models are fragile. To address the fragility issue, I report my
main results with and without the inclusion of the inverse mills ratio. Without
the inclusion of the inverse mills ratio, the results potentially suffer from the
limitation of biased coefficients that over-/understate the association.
Nonetheless, throughout almost all model specifications the IMR is
insignificant, indicating that a selection bias is not present and the coefficients
are not biased.
I employ several determinants in equation (6) which are associated with
the likelihood to disclose full portfolio holdings. I use the trust’s share turnover
(TURNOVER), calculated as the monthly share turnover three months after
fiscal year-end, to capture the liquidity of the trust. I expect TURNOVER to be

3 Proprietary costs of full portfolio disclosure for UK investment trusts
76
negatively associated with the likelihood of disclosure. I use the number of
pages of the annual report (PAGES) to capture the disclosure quality of the
trust. I expect trusts with higher numbers of pages to be more likely to disclose
full portfolio holdings. To control for agency costs related explanations of the
likelihood of disclosure I control for excessive management fees (Malkiel
1977) by using the ratio of the sum of management fee, operating costs, and
other costs incurred by the trust, divided by net assets (EXPENSES). I expect
EXPENSES to reduce the likelihood of full disclosure. Moreover, I calculate
each trust’s returns (RETURN) as the change of the stock price over the fiscal
year divided by last year’s stock price. I also expect RETURN to decrease the
likelihood of disclosure since I expect well performing trusts to have fewer
incentives to show their list of portfolio holdings. I use the trust’s gearing ratio
(GEAR) to capture the trust’s debt exposure. I expect GEAR, calculated as the
ratio of total debt divided by total assets, to decrease the likelihood of
voluntary disclosure, since more gearing increases risk. I use the indicator
variable EMERGING which captures whether the trust’s investment strategy is
focused on investing in emerging markets. I use investment strategies provided
by Morningstar to identify trusts primarily investing in emerging markets. I
expect EMERGING to positively influence the likelihood of disclosure to
counteract perceived lower transparency of those investments. I use each
trust’s dividend yield (YIELD) to control for arbitrage costs. I expect YIELD to
have a positive sign because the higher the dividend yield the more valuable is
the trust (Pontiff 1996). I control for other trust-specific characteristics like size
(SIZE) measured as the natural logarithm of the investment trust’s total assets
(Pontiff 1996) and institutional ownership, measured as the percentage of
closely-held shares (OWNERSHIP).

Economic Consequences of Reporting Transparency
77
3.5 Results
3.5.1 Descriptive statistics
Table 1 reports descriptive statistics and Pearson correlations for the
main variables used in the regression analysis. In line with prior research the
investment trusts trade on average at a discount around 12% of net asset value.
The share of trusts that disclose full portfolios of their investment portfolio is
68%. Average RETURNS for the trusts equal 8%. The expense ratio is low with
a value of 1% of net assets. The average AGE of the trusts is 44 years.
Table 1 panel B shows the Pearson correlation matrix. In line with the
prediction there is a negative and significant (p < 0.01) correlation between
FULL and the next year’s DISCOUNTi,t+1. This result gives some first support
for the notion that voluntarily disclosing full portfolio holdings decreases the
discount, which means it increases demand for the trusts’ shares. Returns are
also negatively correlated with the discount but are uncorrelated to full
disclosure. Furthermore, OWNERSHIP is positive and significantly correlated
with the discount, but negatively correlated to FULL. EXPENSES are
significantly and positively related to the discount and show a negative
correlation with FULL. The number of pages of the annual report is
uncorrelated with the discount but shows a significant correlation with FULL.
The control variables SIZE, EXPENSES, AGE/LNAGE are strongly correlated
(ρ = 0.4; p < 0.01) which can cause multicollinearity in the regression analysis.
Therefore, I re-estimate equation (1) and (2) with different combinations of
those variables which lead to the same results.

3 Proprietary costs of full portfolio disclosure for UK investment trusts
78
Table 1: Descriptive statistics and correlation matrix
Panel A: Descriptive statistics Mean SD P25 Median P75 N
DISCOUNTi,t+1 0.12 0.10 0.07 0.12 0.17 1534
FULL 0.68 0.47 0.00 1.00 1.00 1534
RETURN 0.08 0.35 –0.13 0.09 0.25 1534
EXPENSES 0.01 0.01 0.01 0.01 0.02 1534
OWNERSHIP 16.65 17.50 0.24 11.97 26.83 1534
PTURN 0.58 0.69 0.25 0.42 0.72 1534
YIELD 0.02 0.02 0.01 0.02 0.03 1534
SIZE 12.10 1.09 11.37 12.05 12.85 1534
AGE 44.35 40.85 11.00 21.00 78.00 1534
LNAGE 3.22 1.18 2.40 3.04 4.36 1534
GEAR 0.13 0.12 0.04 0.11 0.18 1534
TURNOVER 0.03 0.04 0.01 0.02 0.04 1534
PAGES 50.15 13.58 41.00 49.00 56.00 1534
%NAV 89.73 19.40 88 100.00 100.00 1491
Notes Panel A: This table presents the descriptive statistics for the variables used in the
main analyses. DISCOUNTt+1 is the discount calculated as: (net asset value (wc03501)
less market value (wc08001)/net asset value (wc03501)). FULL is an indicator variable
which equals 1 if the trust lists its full portfolio holdings annually; and 0 otherwise.
RETURN is (stock pricet – stock pricet-1/ stock pricet-1). EXPENSES are the sum of
management fees, operating costs, and other costs incurred by the trust, divided by net
assets. OWNERSHIP is the percentage of closely held shares based on WORLDSCOPE
item (wc08021). PTURN is portfolio turnover calculated based on the smaller value of
sales or purchases of investments by the trust divided by net asset value. YIELD expresses
dividend per share as a percentage of share price. SIZE is the natural logarithm of total
assets, AGE is the age of the fund in years and LNAGE expresses the natural logarithm of
AGE. GEAR is the trust’s gearing ratio expressed as (total assets – NAV)/total assets at
fiscal year-end. TURNOVER (DATASTREAM item: UVO) is the monthly share turnover
measured three-month after fiscal year-end. PAGES expresses the number of pages in the
trust’s annual report; %NAV is calculated by dividing the net asset value of disclosed
investments by the trust’s total net asset value.
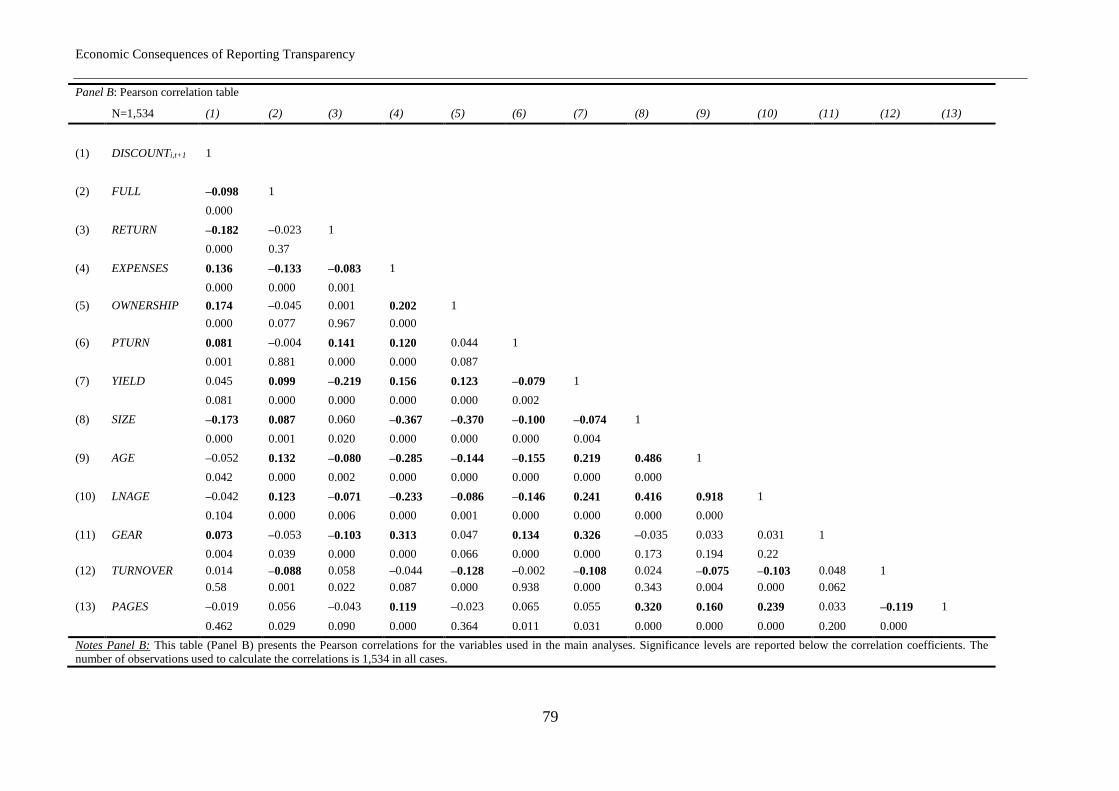
Economic Consequences of Reporting Transparency
79
Panel B: Pearson correlation table
N=1,534 (1) (2) (3) (4) (5) (6) (7) (8) (9) (10) (11) (12) (13)
(1) DISCOUNTi,t+1 1
(2) FULL –0.098 1
0.000
(3) RETURN –0.182 –0.023 1
0.000 0.37
(4) EXPENSES 0.136 –0.133 –0.083 1
0.000 0.000 0.001
(5) OWNERSHIP 0.174 –0.045 0.001 0.202 1
0.000 0.077 0.967 0.000
(6) PTURN 0.081 –0.004 0.141 0.120 0.044 1
0.001 0.881 0.000 0.000 0.087
(7) YIELD 0.045 0.099 –0.219 0.156 0.123 –0.079 1
0.081 0.000 0.000 0.000 0.000 0.002
(8) SIZE –0.173 0.087 0.060 –0.367 –0.370 –0.100 –0.074 1
0.000 0.001 0.020 0.000 0.000 0.000 0.004
(9) AGE –0.052 0.132 –0.080 –0.285 –0.144 –0.155 0.219 0.486 1
0.042 0.000 0.002 0.000 0.000 0.000 0.000 0.000
(10) LNAGE –0.042 0.123 –0.071 –0.233 –0.086 –0.146 0.241 0.416 0.918 1
0.104 0.000 0.006 0.000 0.001 0.000 0.000 0.000 0.000
(11) GEAR 0.073 –0.053 –0.103 0.313 0.047 0.134 0.326 –0.035 0.033 0.031 1
0.004 0.039 0.000 0.000 0.066 0.000 0.000 0.173 0.194 0.22
(12) TURNOVER 0.014 –0.088 0.058 –0.044 –0.128 –0.002 –0.108 0.024 –0.075 –0.103 0.048 1
0.58 0.001 0.022 0.087 0.000 0.938 0.000 0.343 0.004 0.000 0.062
(13) PAGES –0.019 0.056 –0.043 0.119 –0.023 0.065 0.055 0.320 0.160 0.239 0.033 –0.119 1
0.462 0.029 0.090 0.000 0.364 0.011 0.031 0.000 0.000 0.000 0.200 0.000
Notes Panel B: This table (Panel B) presents the Pearson correlations for the variables used in the main analyses. Significance levels are reported below the correlation coefficients. The
number of observations used to calculate the correlations is 1,534 in all cases.

3 Proprietary costs of full portfolio disclosure for UK investment trusts
80
Table 2: Differences and determinants of full portfolio disclosure
Panel A: Univariate t–tests of differences between full portfolio disclosure and non-full
portfolio disclosure trusts.
N=1,534 Non-full portfolio
disclosure
(1)
Full portfolio
Disclosure
(2)
Difference
(1)–(2)
TURNOVER 3.59 2.87 0.71***
PAGES 49.04 50.66 – 1.62**
EXPENSES 1.75 1.35 0.40***
RETURN 0.09 0.07 0.02
YIELD 1.73 2.22 – 0.48***
GEAR 0.13 0.12 0.01**
OWNERSHIP 17.79 16.10 1.69**
EMERGING 0.11 0.19 – 0.08***
SIZE 11.96 12.16 – 0.20***
DISCOUNTt+1 0.14 0.12 0.02***
Notes: This table presents a descriptive analysis of the differences of trusts’ (non-) disclosing
full portfolio holdings. TURNOVER (DATASTREAM item: UVO) is the monthly share
turnover measured three-month after fiscal year-end. PAGES are the number of pages in the
trust’s annual report. EXPENSES are the sum of management fees, operating costs, and other
costs incurred by the trust, divided by net assets. OWNERSHIP is the percentage of closely
held shares based on WORLDSCOPE item (wc08021). RETURN is calculated (stock pricet –
stock pricet-1/ stock pricet-1). YIELD expresses dividend per share as a percentage of share
price at fiscal year-end. SIZE is the natural logarithm of total assets. GEAR is the trust’s
gearing ratio expressed as (total assets - NAV)/total assets at fiscal year-end. EMERGING is
an indicator variable which equals 1 if the trust invests in emerging markets; and 0 otherwise.
DISCOUNTt+1 is calculated as: (net asset value (wc03501) less market value (wc08001)/net
asset value (wc03501)). *; **; *** indicate significance at the 0.10, 0.05, and 0.01 levels,
respectively, using two-tailed t-tests of means.
Tables 2 panel a, contrasts investment trusts which disclose full
portfolio holdings and those that do not. Full disclosers are significantly
different from non-disclosers in terms of PAGES, which indicates the overall
disclosure quality of the trust. Furthermore, they exhibit lower share turnovers
(TURNOVER) and have lower expense ratios. There is no significant difference
in stock returns (RETURN). Non-disclosing trusts tend to have slightly more

Economic Consequences of Reporting Transparency
81
gearing (GEAR) than disclosing ones. OWNERSHIP is slightly different
between the two groups indicating that a higher percentage of closely-held
shares decrease the likelihood of disclosure. Furthermore, disclosing trusts are
larger (SIZE) and invest to a greater extend in emerging markets
(EMERGING). I also observe a significantly higher discount for non-disclosing
funds.
3.5.2 Empirical results
I use equation (1) to establish an association between full disclosure of
portfolio holdings and the demand for the trust’s shares. Anchored on evidence
from prior literature, I expect trusts’ voluntarily disclosing full portfolio
holdings to benefit from disclosure. Hence, they exhibit a positive effect on the
demand for their shares. Table 3 provides empirical evidence for hypothesis 1
regarding the average effect of the association between full portfolio disclosure
and the discount. The main variable of interest is FULL. The results show that
on average full disclosure increases demand for the trusts’ shares. The
coefficient β3 (coeff. –0.079, z-stat.: 1.98) in column (2) is negative and
statistically significantly different from zero (p < 0.05) after controlling for
selection bias by including the inverse mills ratio (IMR). The negative
association between FULL and DISCOUNTt+1 in column (2) supports
hypothesis 1. Moreover, the statistically significant inverse mills ratio suggests
that it is necessary to adjust for selection bias.
Focusing on economic significance, a one standard deviation change
corresponds to a 37 percentage point change in the discount, on average.24
RETURN is also negative and significantly smaller than zero which supports
24 The calculation is as follows: (standard deviation independent variable × coefficient
independent variable)/standard deviation dependent variable.
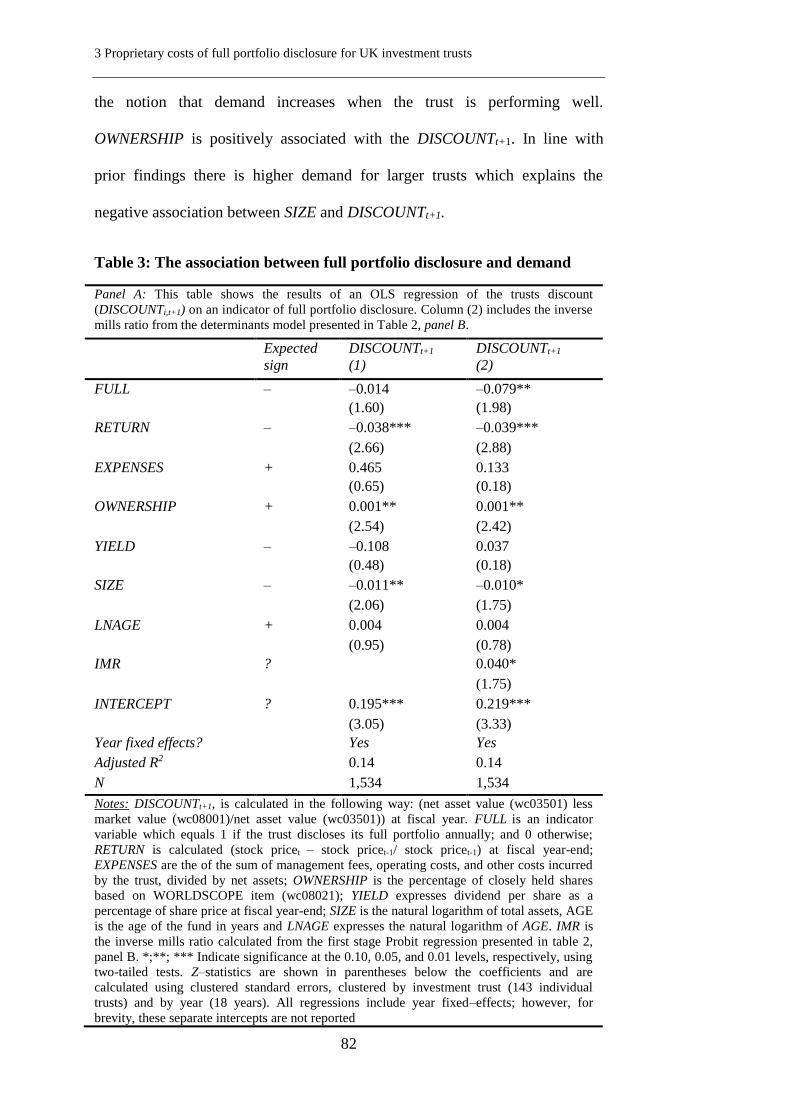
3 Proprietary costs of full portfolio disclosure for UK investment trusts
82
the notion that demand increases when the trust is performing well.
OWNERSHIP is positively associated with the DISCOUNTt+1. In line with
prior findings there is higher demand for larger trusts which explains the
negative association between SIZE and DISCOUNTt+1.
Table 3: The association between full portfolio disclosure and demand
Panel A: This table shows the results of an OLS regression of the trusts discount
(DISCOUNTi,t+1) on an indicator of full portfolio disclosure. Column (2) includes the inverse
mills ratio from the determinants model presented in Table 2, panel B.
Expected
sign
DISCOUNTt+1
(1)
DISCOUNTt+1
(2)
FULL – –0.014 –0.079**
(1.60) (1.98)
RETURN – –0.038*** –0.039***
(2.66) (2.88)
EXPENSES + 0.465 0.133
(0.65) (0.18)
OWNERSHIP + 0.001** 0.001**
(2.54) (2.42)
YIELD – –0.108 0.037
(0.48) (0.18)
SIZE – –0.011** –0.010*
(2.06) (1.75)
LNAGE + 0.004 0.004
(0.95) (0.78)
IMR ? 0.040*
(1.75)
INTERCEPT ? 0.195*** 0.219***
(3.05) (3.33)
Year fixed effects? Yes Yes
Adjusted R2 0.14 0.14
N 1,534 1,534
Notes: DISCOUNTt+1, is calculated in the following way: (net asset value (wc03501) less
market value (wc08001)/net asset value (wc03501)) at fiscal year. FULL is an indicator
variable which equals 1 if the trust discloses its full portfolio annually; and 0 otherwise;
RETURN is calculated (stock pricet – stock pricet-1/ stock pricet-1) at fiscal year-end;
EXPENSES are the of the sum of management fees, operating costs, and other costs incurred
by the trust, divided by net assets; OWNERSHIP is the percentage of closely held shares
based on WORLDSCOPE item (wc08021); YIELD expresses dividend per share as a
percentage of share price at fiscal year-end; SIZE is the natural logarithm of total assets, AGE
is the age of the fund in years and LNAGE expresses the natural logarithm of AGE. IMR is
the inverse mills ratio calculated from the first stage Probit regression presented in table 2,
panel B. *;**; *** Indicate significance at the 0.10, 0.05, and 0.01 levels, respectively, using
two-tailed tests. Z–statistics are shown in parentheses below the coefficients and are
calculated using clustered standard errors, clustered by investment trust (143 individual
trusts) and by year (18 years). All regressions include year fixed–effects; however, for
brevity, these separate intercepts are not reported

Economic Consequences of Reporting Transparency
83
To control for endogeneity of the decision to fully disclose portfolios I
use equation (6) as a first-stage in a two-stage Heckman approach to control for
self-selection (Heckman 1979). Panel B in Table 2 presents the results of the
probit estimation of the determinants of full portfolio disclosure. TURNOVER
is significant and negative which is in line with my expectations that already
liquid trusts have less incentives to increase disclosure to enhance demand. The
marginal effect at the means for TURNOVER is –0.86 (p < 0.1). A one
percentage point increase in TURNOVER thus, decreases the likelihood of full
portfolio disclosure by –0.0086.The coefficient on PAGES is negative but
insignificant showing that having higher disclosure volume in terms of pages in
the annual report does not ultimately lead to the disclosure of full portfolio
holdings. This result does not confirm results from the univariate tests;
however, it highlights the expectation of proprietary information hidden in full
portfolio disclosures. EXPENSES are also negative and significant indicating
that higher expenses in the current year reduce the likelihood of disclosing full
portfolio holdings. The corresponding marginal effect at means is –4.37 (p <
0.05). Therefore if EXPENSES increase by one percentage point for an average
investment trust, the likelihood of full portfolio disclosure decreases by 0.0437.
YIELD on the other hand is positive and statistically significant. A one unit
change in YIELD increases the probability of full portfolio disclosure by 2.76
(p <0.1), which is in line with my prediction. EMERGING is positive and
significantly different from zero indicating a higher probability for firms
investing in emerging markets to disclose their holdings. The marginal effect at
the means for EMERGING is 0.20 (p<0.05). Therefore, compared to an
average investment trust, investing in emerging markets increases the
likelihood of full portfolio disclosure by 0.20.This is not surprising because

3 Proprietary costs of full portfolio disclosure for UK investment trusts
84
investing in emerging markets is associated with more risk and higher
information asymmetry. Based on this first-stage binary choice model I
calculate the inverse mills ratio which I employ in equation (1) and all further
analyses to control for self-selection.
Table 2: Differences and determinants of full portfolio disclosure
Panel B: This table shows the determinants of full portfolio disclosure which is also
the first stage in a two stage Heckman Model. The dependent variable is FULL which
is 1 if the trust discloses its full portfolio annually; and 0 otherwise.
Expected
sign
FULL Marginal effects at
means
TURNOVER – –2.438* –0.856*
(1.68) (1.67)
PAGES + –0.011 –0.004
(1.50) (1.49)
EXPENSES – –12.471** –4.379**
(2.08) (2.10)
RETURN – –0.059 –0.020
(0.62) (0.62)
YIELD + 7.868* 2.762*
(1.91) (1.90)
GEAR – –0.059 –0.020
(0.08) (0.08)
OWNERSHIP – –0.001 –0.000
(0.26) (0.26)
EMERGING + 0.578** 0.203**
(2.15) (2.14)
SIZE + 0.140 0.049
(1.60) (1.61)
INTERCEPT ? –0.005
(0.00)
Year fixed–effects Yes
McFadden’s R2 0.08
N 1,534
Notes: This table presents an analysis of the determinants of disclosing full portfolio holdings.
TURNOVER (DATASTREAM item: UVO) is the monthly share turnover measured three-
month after fiscal year-end. PAGES are the number of pages in the trust’s annual report.
EXPENSES are the sum of management fees, operating costs, and other costs incurred by the
trust, divided by net assets. RETURN is calculated (stock pricet – stock pricet-1/ stock pricet-1).
YIELD expresses dividend per share as a percentage of share price at fiscal year-end. GEAR is
the trust’s gearing ratio expressed as (total assets - NAV)/total assets at fiscal year-end.
OWNERSHIP is the percentage of closely held shares based on WORLDSCOPE item
(wc08021). EMERGING is an indicator variable which equals 1 if the trust invests in emerging
markets; and 0 otherwise. SIZE is the natural logarithm of total assets. *; **; *** Indicate
significance at the 0.10, 0.05, and 0.01 levels, respectively, using two-tailed tests. Z–statistics
are shown in parentheses below the coefficients and are calculated using clustered standard
errors, clustered by investment trust (143 individual trusts) and by year (18 years).

Economic Consequences of Reporting Transparency
85
Table 4 provides regression evidence for hypothesis 2. I use RETURN
quintiles as a proxy for cross-sectional differences in performance to examine
whether proprietary cost arising through disclosure of full portfolios affect the
demand for skilled managed trusts. The coefficient of main interest is β3 which
shows the incremental effect of full disclosure for the top performing trusts in
terms of RETURN. The coefficient is positive and significant (p < 0.01) in all
specifications (p < 0.01). This is in line with my prediction that proprietary
costs are highest for top performing trusts (H2). The release of private
information is associated with a decrease in demand reflected by a positive
association between DISCOUNTt+1 and the interaction term
FULL×HIGH_RETURN. This result is robust to the inclusion of RETURN as
an additional control variable in column (3). The control variables which are
the same as in equation (1) do not switch signs or significance with respect to
DISCOUNTt+1. A joint test of the main and interaction effects reveals that it is
still beneficial for high performing trusts to disclose although the positive net
effect for HIGH_RETURN trusts on product demand decreases (combined
coefficient: –0.007; z-stat = –0.96). A one standard deviation change
corresponds to a 14 percent point change in the discount on average, which is
substantially less than the average effect.25 This adds to the notion that
proprietary costs for well performing trusts reduce the positive effect of
voluntary disclosure.
In order to check the robustness of the results I employ a different way
of measuring disclosure. I use the percentage of disclosed investments
calculated by dividing the net asset value of disclosed investments by the
25 Summary statistics for high return indicator: Mean: 0.1923; Standard deviation: 0.3942;
N=1,534.
3 Proprietary costs of full portfolio disclosure for UK investment trusts
86
trust’s total net asset value (%NAV). I replace the indicator variable to use
variation in the level of portfolio disclosure over time and to be less restrictive
in my measure of disclosure. Since my predictions do not only expect an
association between portfolio disclosures and demand if the full portfolio is
revealed. Moreover, I also predict an association for cross-sectional differences
in the level of portfolio disclosures. The last column (4) in Table 4 shows the
results for this alternative specification. The coefficient for
%NAV×HIGH_RETRUN is also significant and positive (coeff. 0.045; z-stat:
2.71). Due to missing information to calculate %NAV the number of
observations in this regression decreases compared to the number of
observations used in the prior analysis.26 Nonetheless, the incremental value of
disclosing a higher percentage of the net asset value by showing individual
holdings decreases the demand for the trust shares. A joint test of the main and
interaction effect in this specification reveals a negative and statistical
significant association (combined coeff. –.0147; z-stat: 2.10).
Overall, my results indicate that in the presence of proprietary
information disclosing full portfolio holdings is associated with a reduction of
demand for the trust.
26Some trusts describe their portfolio of investments in detail but give either no evidence
whether these top or main investments do or do not represent their whole portfolio nor they do
not give current fair values or percentages of NAV which can be used to calculate % NAV.

Economic Consequences of Reporting Transparency
87
Table 4: Cross-sectional differences in performance and demand
This table shows the results of the test of hypothesis 2. I use cross-sectional variation in the trusts’ stock returns to
identify trusts with high (low) proprietary information. Then I test how the association between high proprietary
information is associated with product demand.
Expected
sign
DISCOUNTt+1
(1)
DISCOUNTt+1
(2)
DISCOUNTt+1
(3)
DISCOUNTt+1
(4)
FULL – –0.021** –0.080* –0.087**
(2.23) (1.86) (2.14)
HIGH_RETURN – –0.041*** –0.042*** –0.024*** –0.059***
(5.27) (5.31) (2.70) (3.35)
FULL
×HIGH_RETURN
+
0.034***
(4.37)
0.035***
(4.30)
0.036***
(3.95)
%NAV – 0.022
(0.70)
%NAV×
HIGH_RETURN
+
0.045***
(2.71)
RETURN – –0.039**
(2.11)
EXPENSES + 0.530 0.229 0.121 1.288*
(0.72) (0.29) (0.16) (1.88)
OWNERSHIP + 0.001** 0.001** 0.001** 0.001**
(2.42) (2.31) (2.40) (2.48)
YIELD – –0.060 0.077 0.050 –0.204
(0.26) (0.36) (0.24) (0.70)
SIZE – –0.011** –0.010* –0.009* –0.010*
(2.14) (1.84) (1.71) (1.71)
LNAGE + 0.005 0.004 0.004 0.007
(1.02) (0.86) (0.81) (1.39)
IMR ? 0.036 0.039* –0.013
(1.50) (2.11) (1.45)
INTERCEPT ? 0.193*** 0.215*** 0.221*** 0.128*
(3.02) (3.27) (3.37) (1.81)
Year fixed-effects? Yes Yes Yes Yes
Adjusted R2 0.14 0.14 0.15 0.15
N 1,534 1,534 1,534 1,491
Notes: The DISCOUNTt+1, is calculated in the following way: (net asset value (wc03501) less market value
(wc08001)/net asset value (wc03501)) at fiscal year-end. FULL is an indicator variable which equals 1 if the trust
discloses its full portfolio annually; and 0 otherwise. %NAV is calculated by dividing the net asset value of disclosed
investments by the trust’s total net asset value. RETURN is calculated (stock pricet – stock pricet-1/ stock pricet-1) at
fiscal year-end. HIGH_RETURN is an indicator variable that takes on the value 1 if the trust performance belongs to
the highest quintile in a given year; and 0 otherwise. EXPENSES are the sum of management fees, operating costs,
and other costs incurred by the trust, divided by net assets; OWNERSHIP is the percentage of closely held shares
based on WORLDSCOPE item (wc08021). YIELD expresses dividend per share as a percentage of share price at
fiscal year-end; SIZE is the natural logarithm of total assets, AGE is the age of the fund in years and LNAGE
expresses the natural logarithm of AGE. IMR is the inverse mills ratio calculated from the first stage Probit
regression presented in table 2, panel B.*; **; *** Indicate significance at the 0.10, 0.05, and 0.01 levels,
respectively, using two–tailed tests. Z–statistics are shown in parentheses below the coefficients and are calculated
using clustered standard errors, clustered by investment trust (143 individual trusts) and by year (18 years).
Table 5 provides regression evidence for hypothesis 3 using cross-
sectional differences in the trusts’ portfolio turnover. Therefore, I calculate

3 Proprietary costs of full portfolio disclosure for UK investment trusts
88
portfolio turnover (PTURN) quintiles to examine whether proprietary cost
arising through disclosure of full portfolios affect the demand for actively
managed investment trusts. Comparable to the prior results, the coefficient for
FULL×HIGH_PTURN is positive and significantly different from zero (p <
0.05) indicating a reduction of demand for high turnover trusts when they
release full portfolio holdings. I use %NAV to substitute for the FULL indicator
as an alternative measure of portfolio disclosure. I find a positive coefficient
albeit it is insignificant. To summarize, the findings suggest that in the
presence of high portfolio turnover releasing full portfolios to the public
decreases in the demand for the trust.

Economic Consequences of Reporting Transparency
89
Table 5: Cross-sectional differences in portfolio turnover
This table shows the results of the test of hypothesis 2. I use cross-sectional variation in the trusts’ portfolio
turnover to identify trusts with high (low) proprietary information. Then I test how the association between
high proprietary information is associated with product demand.
Expected
sign
DISCOUNTt+1
(1)
DISCOUNTt+1
(2)
DISCOUNTt+1
(3)
DISCOUNTt+1
(4)
FULL – –0.021** –0.080* –0.077*
(2.21) (1.93) (1.85)
HIGH – –0.019* –0.020* –0.032** –0.019
(1.73) (1.70) (2.55) (0.70)
FULL
×HIGH_PTURN
+ 0.029**
(2.05)
0.030**
(2.18)
0.026**
(1.97)
%NAV – 0.026
(0.71)
%NAV
×HIGH_PTURN
+ 0.017
(0.56)
PTURN – 0.015***
(3.90)
EXPENSES + 0.505 0.200 0.170 1.290*
(0.68) (0.26) (0.22) (1.87)
OWNERSHIP + 0.001** 0.001** 0.001** 0.001**
(2.50) (2.38) (2.36) (2.48)
YIELD – –0.015 0.124 0.120 –0.171
(0.06) (0.57) (0.54) (0.60)
SIZE – –0.011** –0.009* –0.009* –0.009*
(2.01) (1.72) (1.68) (1.66)
LNAGE + 0.005 0.004 0.004 0.007
(1.02) (0.87) (0.88) (1.41)
IMR ? 0.037 0.034 –0.013
(1.51) (1.42) (1.42)
INTERCEPT ? 0.181*** 0.203*** 0.193*** 0.117
(2.80) (3.04) (2.91) (1.61)
Year fixed-
effects?
Yes Yes Yes Yes
Adjusted R2 0.13 0.13 0.14 0.14
N 1,534 1,534 1,534 1,491
Notes: DISCOUNTt+1, is calculated in the following way: (net asset value (wc03501) less market value
(wc08001)/net asset value (wc03501)) at fiscal year. FULL is an indicator variable which equals 1 if the
trust discloses its full portfolio annually; and 0 otherwise. RETURN is calculated (stock pricet – stock pricet-
1/ stock pricet-1) at fiscal year-end. HIGH_TURN is an indicator variable that takes on the value one if the
trust’s portfolio turnover (PTURN) belongs to the highest quintile in a given year; and zero otherwise.
EXPENSES are the sum of management fees, operating costs, and other costs incurred by the trust, divided
by net assets. OWNERSHIP is the percentage of closely held shares based on WORLDSCOPE item
(wc08021). YIELD expresses dividend per share as a percentage of share price at fiscal year-end. SIZE is the
natural logarithm of total assets. AGE is the age of the fund in years and LNAGE expresses the natural
logarithm of AGE. IMR is the inverse mills ratio calculated from the first stage Probit regression presented
in table 2, panel B. *;**; *** Indicate significance at the 0.10, 0.05, and 0.01 levels, respectively, using two-
tailed tests. Z–statistics are shown in parentheses below the coefficients and are calculated using clustered
standard errors, clustered by investment trust (143 individual trusts) and by year (18 years).

3 Proprietary costs of full portfolio disclosure for UK investment trusts
90
Next, I further investigate the consequences of full portfolio disclosures
on product demand. From the econometric standpoint, using changes in the
indicator variable helps me to identify the change of expectations about the
trust’s future performance that occurs around the switching year. Furthermore,
using the change helps to mitigate the possibility that any other unobserved
variable is responsible for the cross-sectional change in the demand for the
trusts’ shares. I substitute FULL for the indicator variable SWITCHUP
(SWITCHDOWN) in equation (6) which identifies the firm-year of the upward
(downward) switch in disclosure policy and turns one in the year the trust
switches its disclosure policy; and zero otherwise. Thus, I use the indicator
variables SWITCHUP (SWITCHDOWN) to investigate the association between
the discount and trusts increasing (decreasing) their level of portfolio
disclosure. In contrast to FULL it indicates only the specific year of the switch.
I expect increases (decreases) in full portfolio disclosure to be associated with
an increase (decrease) on demand.

Economic Consequences of Reporting Transparency
91
Table 6: Analysis of switches in portfolio disclosure and demand
This table presents the results of the OLS regression of DISCOUNTi,t+1 on indicator variables that indicate either the time of an upward or a downward switch in the trust’s disclosure
behavior. Moreover, the table shows the interaction between an upward (downward) switch in the trust’s disclosure behavior with either RETURN (col. (1)-(3)), HIGH_RETURN
(col. (4)-(6)), and LOW_RETURN (col. (7)- (9)).
Expected
sign
DISCOUNT
(1)
DISCOUNT
(2)
DISCOUNT
(3)
DISCOUNT
(4)
DISCOUNT
(5)
DISCOUNT
(6)
DISCOUNT
(7)
DISCOUNT
(8)
DISCOUNT
(9)
SWITCHUP – 0.029 0.029 0.008 0.008 0.032 0.032
(1.37) (1.34) (0.52) (0.52) (1.03) (1.03)
SWITCHDOWN + –0.027 –0.027 –0.023 –0.023 –0.006 –0.006
(1.23) (1.21) (0.84) (0.86) (0.34) (0.33)
RETURN – –0.036** –0.043*** –0.041***
(2.52) (2.91) (2.80)
HIGH_RETURN – –0.021*** –0.019*** –0.021***
(2.95) (2.68) (2.90)
LOW_RETURN + 0.028** 0.029** 0.029**
(2.35) (2.36) (2.40)
SWITCHUP×
RETURN –
–0.065*
(1.72)
–0.062
(1.61)
SWITCHDOWN
×
RETURN
+
0.038***
(2.66)
0.037**
(2.56)
SWITCHUP×
HIGH_RETURN +
0.124
(1.42)
0.125
(1.42)
SWITCHDOWN
×
HIGH_RETURN
–
0.007
(0.24)
0.010
(0.32)
SWITCHUP×
LOW_RETURN +
–0.017
(0.48)
–0.018
(0.50)
SWITCHDOWN
×
LOW_RETURN
–
–0.122***
(4.05)
–0.122***
(4.05)
IMR –0.008 –0.008 –0.008 –0.008 –0.008 –0.008 –0.008 –0.008 –0.009
(1.41) (1.40) (1.46) (1.43) (1.43) (1.48) (1.45) (1.48) (1.51)
INTERCEPT 0.186*** 0.189*** 0.186*** 0.185*** 0.186*** 0.184*** 0.159** 0.162** 0.161**
(2.94) (2.99) (2.93) (2.87) (2.89) (2.84) (2.49) (2.56) (2.52)
Controls? Yes Yes Yes Yes Yes Yes Yes Yes Yes

3 Proprietary costs of full portfolio disclosure for UK investment trusts
92
[continued]
Year fixed–
effects?
Yes Yes Yes Yes Yes Yes Yes Yes Yes
Adjusted R2 0.14 0.14 0.14 0.14 0.13 0.14 0.14 0.14 0.14
N 1,534 1,534 1,534 1,534 1,534 1,534 1,534 1,534 1,534
Notes: DISCOUNTt+1, is calculated in the following way: (net asset value (wc03501) less market value (wc08001)/net asset value (wc03501)) at fiscal year. SWITCH is an indicator
variable which equals 1 if the trust switches its disclosure policy either upwards or downwards; and 0 otherwise. SWITCHUP is an indicator variable which equals 1 if the trust
switches its disclosure policy to full portfolio disclosure; and 0 otherwise. SWITCHDOWN is an indicator variable which equals 1 if the trust switches its disclosure policy from full
portfolio disclosure to non-full portfolio disclosure; and 0 otherwise. RETURN is calculated (stock pricet – stock pricet-1/ stock pricet-1) at fiscal year-end. HIGH_RETURN is an
indicator variable that takes on the value one if the trust’s portfolio turnover (RETURN) belongs to the highest quintile in a given year; and zero otherwise; Controls include:
EXPENSES are the of the sum of management fees, operating costs, and other costs incurred by the trust, divided by net assets, OWNERSHIP is the percentage of closely held shares
based on WORLDSCOPE item (wc08021), YIELD expresses dividend per share as a percentage of share price at fiscal year-end, SIZE is the natural logarithm of total assets, and
AGE is the age of the fund in years and LNAGE expresses the natural logarithm of AGE. IMR is the inverse mills ratio calculated from the first stage Probit regression presented in
table 2, panel B. *;**;*** Indicate significance at the 0.10, 0.05, and 0.01 levels, respectively, using two-tailed tests. Z–statistics are calculated using clustered standard errors,
clustered by investment trust (143 individual trusts) and year (18 years).

Economic Consequences of Reporting Transparency
93
The sample comprises 53 switching trusts of which 37 increase
disclosures and 16 trusts decrease disclosures. Table 6 shows the results for the
analysis of the switching trusts. Columns (1) to (3) show that there is an
incremental positive (negative) association between switching upwards
(downwards) and the demand for the trust. The negative and significant
coefficient of SWITCHUP×RETURN in column (1) suggests that there is an
incrementally positive association between increasing portfolio disclosure and
the demand for trust (coeff. –0.065, z-stat.: 1.72). On the other hand, the
coefficient of SWITCHDOWN×RETURN in column (2) shows that decreasing
portfolio disclosure is associated with a decrease in demand (coeff. 0.038, z-
stat.: 2.67). In column (3) employ upwards as well as downwards changes
simultaneously to further dissect the association between switching disclosure
behavior and product demand. Although the predicted direction of the
coefficients remains the same, only SWITCHDOWN×RETURN remains
statistically significant (coeff. 0.037, z-stat.: 2.56).
Next, in columns (4) to (6), I substitute RETURN with HIGH_RETURN
to investigate how upwards or downwards changes in the disclosure policy
affect well performing trusts. For instance, the joint coefficient of
HIGH_RETURN and SWITCHUP×HIGH_RETURN in column (4), is positive
which is in line with my predictions (coeff. 0.12, z-stat.: 1.42) but not
significant at the conventional level. At the time of the switch, there seems to
be no statistical significant incremental effect for well performing trusts which
increase disclosure. This might be due to the fact that the general level of
disclosure is high in the investment trust industry and that although proprietary
cost are present the benefits of higher product market demand, outweigh the
costs of releasing proprietary information to competitors.

3 Proprietary costs of full portfolio disclosure for UK investment trusts
94
Then, in columns (7) to (9), I substitute HIGH_RETURN with
LOW_RETURN to investigate how upwards or downwards changes in the
disclosure policy affect weak performing trusts. Throughout columns (7) to (9)
the coefficients of LOW_RETURN are positive and statistically significant
(p<0.05) which is in line with my prediction that low performance is associated
with lower demand for the trusts’ shares. Moreover, the coefficient of the
interaction term SWITCHDOWN×LOW_RETURN in columns (8) and (9) is –
0.122 (z-stat.: 4.05) suggesting that downwards switching trusts that are in the
low return quintile exhibit an increase in demand.
3.6 Summary and conclusion
This study examines voluntary disclosures of full portfolio holdings by
UK investment trusts to explain disclosures in the financial industry. In the
light of the strong theoretical evidence about proprietary costs, I expect the
disclosure of sensitive information about the business strategy to have negative
implications for the disclosing firms. I place the study in the UK investment
trust industry because the disclosure of the portfolio is sensitive and important
information. It may be used by competitors to infer trading and stock picking
strategies. In turn, this may impair the profitability of the trust which decreases
the demand for the trust’s shares. I expect this association to be strongest for
the most successful trusts, where I expect the magnitude of proprietary
information in the disclosures to be highest.
My measure of demand is the net asset discount (DISCOUNTi,t+1).
Changes in the discount correspond to changes in demand for the trust’s share.
My findings consistently show a positive association between disclosures on

Economic Consequences of Reporting Transparency
95
demand, on average. Nonetheless, full portfolio disclosure comes at a price for
successful investment trusts, which is a reduction in demand.
Overall, my results are in line with prior research on disclosure (Beyer
et al. 2010; Leuz and Verrecchia 2000) but also highlight the proprietary costs
aspect of disclosure that has to be taken into account. I show evidence that the
release of proprietary information even in a very transparent industry leads to
decrease in product demand. This adds to the general debate on disclosures in
the financial industry (Goldstein and Sapra 2013), and specifically, to the UK
debate on the transparency of investment management products. My results
address the potential costs that successful investment trusts endure if they
become more transparent due to portfolio disclosure. Nonetheless, this study
partly supports the Association of Investment Companies’ (AIC) view that UK
investment trust should disclose full portfolio holdings27 and it also speaks to
policy makers that support greater transparency on financial markets in the
aftermath of the financial crisis.
27See http://www.theaic.co.uk/aic/news/citywire-news/three-fold-rise-in-trusts-rising-to-
transparency-challenge,last checked 31.7.2013

4 Private firms’ investment efficiency and local news media coverage
96
4 Private firms’ investment efficiency and local news media
coverage28
4.1 Introduction
In this paper I investigate how the quality of private firms’ external
information environment affects corporate investment efficiency29. Bushman
and Smith (2001) suggest that a more transparent information environment can
reduce agency conflicts by enhancing monitoring and that it can help the firm
to identify and exploit investment opportunities. Adding to this notion,
Bushman et al. (2004) argue that underdeveloped communication infra-
structures can hinder the flow of firm-specific information resulting in limited
availability of decision relevant information to economic agents. Since private
firms operate in an opaque environment (Minnis 2011) compared to publicly
listed firms due to the absence of analyst coverage, the quality of the external
information environment is even more critical. Furthermore, private firms
make up a large proportion of a country’s investment and therefore, it is
necessary to understand the factors that drive the efficient resource allocation
of private firms (Claessens 2006; Francis et al. 2009). Although, there is
previous literature on how the quality of the information environment affects
business decisions of public firms and efficient resource allocation within an
economy (Frankel and Li 2004; Francis et al. 2009; Shroff et al. 2014; Beyer et
al. 2010; Bushman et al. 2004; Horton et al. 2013; Armstrong et al. 2012; Lau
et al. 2; Bhat et al. 2006), little is known about whether and how it affects
private firms (Badertscher et al. 2013).
28 This chapter is based on Peter, C.D. (2014a), Private firms’ investment efficiency and local
news media coverage, Working paper: WHU − Otto Beisheim School of Management. 29 I use the term private firms to refer to unlisted large, small and medium sized entities
(SMEs).

Economic Consequences of Reporting Transparency
97
I try to fill this gap by examining whether greater local news media
coverage increases the responsiveness of firms’ investments to their investment
opportunities by reducing uncertainty about the local economic environment
the firms operate in. The intuition is that via a greater number of local news
media, managers have access to a greater range of timely information, which
allows them to make better informed investment decisions. Hence, the
reduction of uncertainty about the economic environment subsequently
translates into more efficient investments.
My analysis is based on theoretical predictions of investment under
uncertainty by Dixit and Pindyck (1994), which has been recently applied to
the private firm setting by Badertscher et al. (2013) and Asker et al. (2014).
Within this theoretical framework, investments can be seen as options.
Additionally, investments are at least partly irreversible, which means that once
executed the investment cannot be taken back without incurring any costs,
since at least some of the investment expenses are sunk. That is why, firms
facing uncertainty about the future outcome of the investment tend to hold back
investments instead of exercising the “option” (Bloom et al. 2007). Therefore,
if greater local news media coverage decreases uncertainty, I expect firms to be
more responsive to investment opportunities which can be interpreted as more
efficient investments (Badertscher et al. 2013; Asker et al. 2014).
Prior literature on the differences in responsiveness of investment
opportunities between public and private firms finds that private firms are more
responsive to investment opportunities than public firms (Asker et al. 2014).
Solely focusing on private firms, Badertscher et al. (2013) find positive
externalities of public firms’ industry presence to affect private firms’
responsiveness to investment opportunities. They attribute their findings to

4 Private firms’ investment efficiency and local news media coverage
98
enhancements in the (industry wide) information environment of private firms
due to information readily accessible via the public firms’ annual financial
statements. I follow this line of research and exploit cross-sectional as well as
time series variation in the number of local news media at the city-level, to
examine whether news media is beneficial to private firms’ information
environment.
To test my prediction, I exploit Italian panel data that provides me with
cross-sectional and time series information about the number local newspaper
in Italian cities. I merge data on Italian private firms from Bureau van Dijk
(BvD) with information on local (city-level) data on news media coverage by
Drago et al. (2014). Private firms make up 99.9% of the Italian landscape of
firms and are an important contributor to the country’s economy.30 Although,
European regulation mandates private firms to disclose financial statements,
their abbreviated financial accounts do not include the level of information.
Furthermore, they are less timely and widely distributed compared to financial
records of publicly listed firms (Feng et al. 2011; Ball and Shivakumar 2005).
Finally, the quantity of disclosure depends on the size category the firm is part
of and is adjusted to the needs of users.31 The reports are publicly (online)
accessible via an internet platform (Registro imprese)32. Overall, prior
literature identifies private firms’ disclosure environment to be weaker than
that of public firms (see e.g. Burgstahler et al. (2006) or Feng et al. (2011)).
Thus, in the absence of financial analysts as an important information
dissemination mechanism, and low informativeness of abbreviated reports,
30 See e.g. http://ec.europa.eu/enterprise/policies/sme/facts-figures-analysis/performance-
review/files/countries-sheets/2013/italy_en.pdf. In the landscape of all firms in Italy 99.9% are
categorized as small and medium sized entities (SME).
31 European Union 2011: Study on Accounting Requirements for SMEs. Report Published
Online:http://ec.europa.eu/enterprise/policies/sme/business-environment/accounting/#h2-2.
32 See: http://www.registroimprese.it/en/web/guest/home.
Economic Consequences of Reporting Transparency
99
local news media may play an important role in the dissemination of
information. Notably, news media and financial analysts have found to be
substitutes if earnings informativeness of financial statements is low (Frankel
and Li 2004). Especially with regard to Italian municipalities, local newspapers
play an important part in the dissemination of information (Drago et al. 2014).
Furthermore, unlike the national newspaper market which is highly
concentrated, the local newspaper market provides a wide range of newspaper
competition across and within municipalities and cities (Drago et al. 2014).
Extant literature in financial economics examines how local news
media is associated with affects business decisions. For example, Fang and
Peress (2009) find that stocks with no mass media coverage, such as
newspapers, exhibit significantly higher returns than stocks with low coverage.
Their findings are amplified if the stock is small, has low analyst coverage, and
if individual ownership is high. More broadly speaking, they find that the
breadth of information dissemination affects stock prices (Fang and Peress
2009). Engelberg and Parson (2011) establish a causal link between local news
coverage and trading behavior. When local news coverage is disrupted due to
extreme weather conditions they do not find the same media coverage trading
pattern as before. Consequently, media coverage improves the efficiency of
stock markets by disseminating information among investors (Engelberg and
Parsons 2011). Both studies highlight the effect of news media as an important
disseminator of information for publicly listed firms that reduces informational
frictions.
Based on the argumentation above, I predict and find that a higher
quality external information environment increases the responsiveness of
firms’ investments to investment opportunities. Furthermore, I find that

4 Private firms’ investment efficiency and local news media coverage
100
investment efficiency increases and that underinvestment, as well, as
overinvestment decreases. To alleviate concerns that my results are driven by
omitted variables I employ city, industry, and year fixed effects in the
regression analysis to eliminate time invariant omitted variables. Furthermore,
the proportion of publicly listed firms has been shown to positively affect
private firms’ responsiveness to investment opportunities (Badertscher et al.
2013). I show that my results are further robust to the inclusion of firm fixed
effects and to the inclusion of the proportion of public listed firms in an
industry. Including this variable further emphasizes that news media is a
distinct and relevant channel of information dissemination.
This study makes several contributions. Investment decisions are one of
the most fundamental decisions a firm makes (Hubbard 1998). Furthermore,
investment is an important driver of efficient resource allocation in an
economy. First, I add to the prior literature on efficient resource allocation and
corporate transparency (Bushman et al. 2004; Bushman and Smith 2001;
Francis et al. 2009; Lang and Maffett 2011), by investigating how private
firms’ information environment is associated with corporate investment
efficiency. I especially add to prior literature, investigating the management’s
investment decision process and how managers obtain decision-relevant
information (Badertscher et al. 2013; Shroff 2014; Shroff et al. 2014), by
showing that regional news media coverage is an important channel that
nourishes private firms’ information environment.
Secondly, I add to the literature on spillover effects by showing that
higher regional news media coverage is associated with more efficient
investment decisions by private firms. This adds to existing evidence of firms
using information in peer firm restatements to alter their investment decisions

Economic Consequences of Reporting Transparency
101
(Durnev and Mangen 2009; Beatty et al. 2013; Gleason et al. 2008) by
introducing a broader setting unrelated to restatements that displays an
alternative channel through which firms obtain decision relevant information.
Third, I add to literature investigating the role of news media in financial
economics (Engelberg and Parsons 2011; Fang and Peress 2009; Peress 2014;
Robert et al. 1987). Whereas prior literature focuses on capital market oriented
(listed) firms, I use private firms to explore the role of news media in the firm’s
external information environment. In the absence of financial analysts as one
important information dissemination mechanism, the private firm setting
allows me to investigate the impact of news media in a straight-forward way. I
also add to prior research that investigates the effect of news media on citizens’
welfare (Drago et al. 2014; Gentzkow et al. 2011). My results suggest that
news media coverage is associated with a more efficient resource allocation
which highlights another benefit of news media next to, for example, the
selection of politicians and their performance. Regarding policy implication,
my results emphasize the importance of communication infra-structures in
ensuring efficient resource allocation in an economy by securing the flow and
availability of decision relevant firm-specific information to economic agents.
The rest of the paper proceeds as follows. Section 2 gives an outlay
about the theoretical background of this study. Section 3 develops the
hypotheses. Section 4 describes the research design, the sample selection, and
variable measurement. Section 5 presents the empirical results. Section 6
describes the potential limitations of this study and section 7 concludes.

4 Private firms’ investment efficiency and local news media coverage
102
4.2 Background
4.2.1 The firm’s external information environment and investment
A key element to effective resource allocation in an economy is the
availability of firm-specific information that is available to outsiders of
publicly traded firms (Bushman et al. 2004). For instance, Francis et al. (2009)
find that corporate transparency facilitates resource allocation across industry
sectors.33 One of the most important management decisions regarding resource
allocation in an economy is investment. Bushman and Smith (2001) argue that
managers can identify new investment opportunities on the basis of
information reported by other firms. Since managers use this information and
evaluate investments based on forecasted and discounted cash flows (Graham
and Harvey 2001), (changes to) the firm’s external information environment
may affect their information set and the following investment decision.
Theories of costly information acquisition and processing suggest that
managers have limited information processing capacities and are not aware of
all decision relevant information (DellaVigna 2009). Thus, a higher quality
external information environment may provide the manager with new
information about the economic environment the firm is situated in.
The external information environment is critical for private firms since
they operate in an opaque environment compared to publicly listed firms
(Minnis 2011) due to weaker disclosure restrictions (Burgstahler et al. 2006).
For instance, Badertscher et al. (2013) predict and find that US private firms
operating in industries with more public firm presence are more responsive to
33 Moreover, prior literature has shown several benefits of transparent information
environments. Thus, more transparent firms exhibit increases in liquidity (Lang and Maffett
2011), higher analyst forecast accuracy (Bhat et al. 2006), less earnings management (Hunton
et al. 2006), and enjoy lower cost of capital (Barth et al. 2013).

Economic Consequences of Reporting Transparency
103
investment opportunities. They attribute their findings to managements’ ability
to make better informed investment decisions while facing less economic
uncertainty due to the industry-wide dissemination of decision relevant
information in public firm disclosures (Badertscher et al. 2013). Similarly,
Asker et al. (2014) document differences between the investment behavior of
public and private firms. They find that public firms invest less and are less
responsive to investment opportunities. They attribute their findings to
managerial myopia.
A related stream of literature suggests that managers learn from
industry wide information transfer. For instance, Beatty et al. (2013) study such
information spillovers and find that firms in industries that exhibit fraudulent
behavior by their peers increase their investment during the fraud period. Their
results suggest that peers use the disseminated information and base in their
own investment decisions. The disseminated “good news”, despite untrue,
result in overinvestment by industry peers. This adds to prior evidence by
Durnev and Mangen (2009), who find firms alter their investment decisions
after restatements of peer firms. They show that restatements convey
information about the investment projects of restating firms’ competitors
(Durnev and Mangen 2009). Moreover, Shroff et al. (2014) find that
multinational companies are more responsive to local growth opportunities in
country-industries that have more transparent information environments. They
attribute their findings to a reduction in agency cost that arise when firms
operate in different countries. Essentially, a more transparent information
environment helps to decrease information asymmetry within the multinational
firm. One of their proxies for the quality of the external information
environment is press coverage (Shroff et al. 2014).
4 Private firms’ investment efficiency and local news media coverage
104
Prior literature identifies news media as an important source of
information and monitoring device. Miller (2006) finds that the press fulfills
this role as a “watchdog” for fraudulent behavior of firms by re-disseminating
information from other information intermediaries and by undertaking original
investigation and analysis. But news media is also an important player in
financial markets. Peress (2014) explores the impact of news media on trading
and price formation. He establishes a causal relationship between trading
volume and news media coverage by using newspaper strikes in several
countries as an exogenous event. He finds a reduction in trading, dispersion of
stock returns, and intraday volatility suggesting that media contributes to the
efficiency of the stock market by improving the dissemination of information
among investors (Peress 2014). With respect to local news media coverage,
Engelberg and Parson (2011) also establish a causal link between differences in
local reporting of S&P 500 index firms’ earnings reports coverage and local
trading behavior. When local news coverage is disrupted due to extreme
weather conditions they do not find the same media coverage trading pattern as
before (Engelberg and Parsons 2011). This study relates to aforementioned
one, by additionally providing insights on the importance of local news media
coverage on trading behavior.
The discussion above highlights the importance of the firm’s
information environment in forming educated investment decisions.
Furthermore, the importance of news media as one part of the external
information environment becomes obvious. Especially, in the private firm
setting where in most cases the manager is the owner or at least one of the few
owners, agency problems due to the dispersion of ownership seem not to play
an important role compared to public firms (Badertscher et al. 2013; Ang et al.

Economic Consequences of Reporting Transparency
105
2000). Since managers of private firms have unconstrained access to
information within their firms they arguably have demand for timely
information about the industry, and especially information about the region
they operate in. Hence, local news media coverage may enable the manager to
grasp a wider range of decision-relevant information in a more timely fashion
that enables her to make better investment decisions or be more precise in the
calculation of the net present value (NPV) of future investments.
4.2.2 Investment under uncertainty
Most corporate investment decisions share three distinct characteristics:
(1) they are partially or completely irreversible, (2) there is uncertainty over the
future benefit (return) from the investment, and (3) the investor has some slack
regarding the timing of the investment, for example to gather additional
information while she postpones the investment in the meantime (Dixit and
Pindyck 1994). The focus of this study lies on (2) and (3) of the above
mentioned characteristics. Thus, I base my analysis on theory about investment
under uncertainty (see e.g. Dixit and Pindyck (1994)).
Essentially corporate finance theory predicts that in the presence of
uncertainty firms hold back investments if the investments are partially
irreversible. A key element in these models is that uncertainty increases the
separation between the marginal product of capital of investment and
disinvestment. Due to this increase, firms tend to “wait and see” instead of
investing because the decision to invest bears cost due to its uncertain outcome.
Thus, higher uncertainty reduces the responsiveness to investment
opportunities (Bloom et al. 2007). Stated differently, corporate investment is
viewed as an option which bears some irreversibility. By not exercising the
4 Private firms’ investment efficiency and local news media coverage
106
option and waiting for additional information to arrive, firms lower the risk of
making an ex post suboptimal decision at the cost of missing a valuable
investment opportunity. On the other hand, if they exercise the option without
further information, they lower the risk of missing a profitable investment
opportunity, at the cost of making an ex post suboptimal decision.
Consequently, the value of waiting for new information about the designated
investment project to arrive is greater when uncertainty is high (Dixit and
Pindyck 1994; Asker et al. 2014; Badertscher et al. 2013). Therefore, if a more
transparent information environment allows firms to reduce uncertainty in their
investment decision process, firms are more likely to be more responsive to
investment opportunities. Consistent with Hubbard (1998) and prior literature
on private firms’ investment efficiency (Asker et al. 2014; Badertscher et al.
2013; Shroff et al. 2014), I infer investment efficiency from the firm’s
responsiveness to its investment opportunities.
Applied to the private firm setting of this study, I argue that the number
of news media in a city is a proxy for the quality of the informational
environment for firms headquartered in that particular city. Since news media
disseminates information about the local economic environment I expect firms
in cities with a higher amount of news media to face less uncertainty regarding
their investment decisions compared to firms located in cities with a lower
number of local news media.

Economic Consequences of Reporting Transparency
107
4.2.3 The Italian media landscape
The availability of information is a key ingredient to investors’, voters’,
and consumers’ decision making. A key player in collecting information are
news media, such as newspapers, television, and radio (Simeon Djankov et al.
2003). The focus of this study is on the Italian newspaper market. In 2011, 52.1
percent of the Italian population aged 6 and over is said to read a newspapers at
least once a week, and 36.7 percent of those read a newspaper at least five days
out of seven. The number of copies distributed every day per one thousand
inhabits is 161.9, which ranks Italy in the lower third within EU comparisons.
For instance, Sweden ranked among the top three EU countries, has 468.6
copies of distributed newspapers per thousand inhabitants.34 The national
newspaper market is highly concentrated and dominated by only few
newspapers that are owned by financial trusts (Durante and Knight 2012). For
example, the Hdp-RCS group35, owns the biggest-circulation national
newspaper, the Corriere della Sera, and the most read sport daily, the Gazzetta
dello Sport (Kelly et al. 2004). Whereas, the national newspapers make up only
a small fraction of the number of all circulating newspapers, 90 percent of the
circulating newspapers are regional and local newspapers. Furthermore,
newspapers are an important source of information on the local level.
Therefore, Italian municipalities present a suitable setting to investigate
whether local news media coverage is associated with firms’ business
decisions, since they are an important source of information on the local level.
Moreover, the market for local news exhibits a wide range of competition
34 Source: http://noiitalia2013en.istat.it/index.php?id=55&no_cache=1&.
user_100ind_pi1[id_pagina]=744&cHash=473a8918df169b6252b8fcc8ca1a653a. 35 Source: http://www.rcsmediagroup.it/en/pages/business/#newspapers.
4 Private firms’ investment efficiency and local news media coverage
108
between newspapers within and across Italian municipalities (Drago et al.
2014).
4.2.4 The Italian reporting environment
In line with the 4th EU directive, listed firms in Italy report their
financial accounts according to the International Financial Reporting Standards
(IFRS). Micro, small and medium sized firms, that are unlisted, are not
permitted to use IFRS for financial reporting purposes. They report under
Italian GAAP. Article 2435-bis of the Italian Civil Code regulate financial
reporting requirements. It allows, especially, small and medium sized firms to
report abbreviated financial statements depending on their legal form and size
criteria. Hence, the information conveyed in these reports is limited.
Nonetheless, every Italian company is required to report its financial
statements not later than four months after the accounting year has ended to the
Registrar of Companies (Registro delle Imprese). On the Registrar of
Companies’ homepage you can get access to the financial statements, however,
it is not free of charge. Furthermore, Italian firms that are not eligible to file
abbreviated accounts, are part of a group, or have to file consolidated financial
statements have to appoint an internal auditor.
Most of the firms in my sample fall into the category of small firms that
have total assets smaller than € 4.4 million, turnover that is lower than € 8.8
million, and less than 50 employees. The most prominent legal form in my
sample is Limited Liability Company (SRL). Reporting requirements for these
firms allow for abbreviated financial statements if they meet the
aforementioned criteria for two consecutive years. Hence, financial reports of

Economic Consequences of Reporting Transparency
109
these firms are rather opaque and are not comparable to the informativeness
and transparency of listed firms’ financial reports.
4.3 Hypothesis development
Bushman and Smith (2001) argue that a more transparent information
environment can reduce agency conflicts by enhancing monitoring and that it
can help the firm to identify and exploit investment opportunities. Furthermore,
communication infra-structures are important since they assure the flow and
availability of decision relevant firm-specific information to economic agents
(Bushman et al. 2004). Theories of costly information acquisition and
processing suggest that managers have limited information processing
capacities and are not aware of the entire range of decision relevant
information (DellaVigna 2009). Thus, a higher quality of the firm’s external
information environment provides the manager with new or additional useful
information about the economic environment. For instance, this information is
useful to form expectations about NPV estimates which are a crucial
determinant in successful investment decisions (Goodman et al. 2013).
Specifically, I assume that a more transparent external information
environment enables the manger to make more precise estimates of the
investment’s net present value (NPV).
Prior evidence suggests that managers use information about their
peers’ economic activities in the process of forming their investment decisions
(Francis et al. 2009). A downside of using information about peers is that, if
that information does not display true nature of the firm’s underlying
economics (e.g. investment or performance) it leads to inefficient resource
allocation. For example, prior literature identifies overinvestment as a
downside of managers using (fraudulent) information in peer firms’ financial
4 Private firms’ investment efficiency and local news media coverage
110
accounts (Beatty et al. 2013; Durnev and Mangen 2009). On the other hand,
recent evidence suggests that a more transparent information environment, for
example, more information about economic developments in an industry or in a
country, is incrementally important to firms and positively affects their
investment due to a reduction in uncertainty related to the outcome of
investments (Badertscher et al. 2013; Shroff 2014).
Private firms constitute 99.9% of the registered firms in the Italian
economy. EU regulation requires them to disclose financial information but
these disclosures contain less information than annual reports of public firms.
Most importantly, size thresholds allow small firms to disclose abbreviated
financial statements that most likely contain only a fracture of the information
content available in financial statements of publicly listed firms. Therefore,
vital information for the strategic decision making process of the managers in
terms of firm-specific and more importantly industry and regional economic
information is missing. Nonetheless, prior evidence suggests that news media
and analyst coverage substitute for missing financial statement informativeness
(Frankel and Li 2004). Furthermore, due to the absence of analyst coverage, an
important group of information intermediaries, information dissemination is
likely to be less efficient in regions and industries dominated by small firms.
Therefore, one of few remaining source of information dissemination is news
media.
Based on the argumentation above, I expect a more transparent
information environment to enrich the manager’s information set. Since I
cannot determine the nature of the information I do not predict how a more
transparent information environment affects the level of investment. There is
the possibility that more information reduces uncertainty and positively affects

Economic Consequences of Reporting Transparency
111
the level of investment since the manager withdraws from the “wait and see”
premise. On the other hand, more information about the outcome of the future
investment may lead to a reduction in the level of investment if that increase in
decision relevant information leads the manager to stop the potential
investment since her updated information set suggests that it is not profitable
(negative expected net present value) anymore. Both scenarios correspond to
the notion of a reduction in uncertainty. Therefore, I do not predict a direction
of how the firm’s information environment is associated with the level of
investment and state hypothesis 1 in the following manner:
H1: The quality of the firm’s information environment is associated
with its level of investment.
A more transparent information environment may also affect the
efficiency of investments. In contrast to the level of investments, prior
evidence suggests that a more transparent information environment is
associated with an increase in firms’ investment efficiency (Shroff 2014;
Shroff et al. 2014; Badertscher et al. 2013). Focusing on evidence of public and
private firms’ responsiveness to investment opportunities, Asker et al. (2014)
find private firms to be more responsive to investment opportunities than
public firms. They (among others) interpret the responsiveness to investment
opportunities as investment efficiency. Prior literature focusing on investment
decisions suggests that improved financial transparency can reduce over-
/underinvestment for public firms (Hope et al. 2013).
With respect to the relative opaqueness of private firms’ operations
(Minnis 2011), I expect the firm’s informational environment to have a positive
effect on investment efficiency. Therefore, I state hypothesis two in the
following way:

4 Private firms’ investment efficiency and local news media coverage
112
H2: The quality of the firm’s information environment is positively
associated with investment efficiency.
4.4 Research design
4.4.1 Sample selection
The starting point of the sampling process are all Italian firm-years with
non-missing unconsolidated financial accounts and non-missing information on
the location of the firm’s headquarter available on the 2014 version of
Amadeus from Bureau van Dijk (BvD).36 Then, I match firms’ location with
data on newspaper and online press market entry and exit on the municipality-
level provided by Dargo et al. (2014) using the ISTAT indicator.37 Moreover, I
drop firms from financial (NAICS: 52) and regulated industries (NAICS: 22)
since they are not suited for investment models (Badertscher et al. 2013).
Finally, I drop observations with missing data for the main analyses and only
keep firms if firm age is greater than zero. I winsorize all variables at the 1st
and 99th percentile in every year to control for outliers.38 The final sample
comprises a maximum of 333,638 individual firms covering the years 2005 to
2010, resulting in a maximum of 1,007,482 firm-year observations.39 The
average number of observations per firm is 4, with a minimum of 1 year and a
maximum of 6 years coverage. Table 1 presents descriptive statistics and the
Pearson correlation matrix of the variables used in the tests.
36 Due to my institutions BvD subscription only the last ten years of data are available, so far. 37 ISTAT indicators can be obtained here: http://www.istat.it/it/archivio/6789. 38 See Mortal and Reisel (2013) for a similar filtering procedure. 39 The number of observations decreases in some tests due to the unavailability of lagged
values, for example in the investment efficiency tests (obs.: 1,007,482).

Economic Consequences of Reporting Transparency
113
4.4.2 Data on news media in Italy
In the following tests I use a dataset originally compiled by Drago et al.
(2014). Specifically, I use the data item: News_TOT from this dataset which
provides me with the total number of local print and online news by newspaper
in a given year per Italian municipality or city. The dataset covers the presence
of local news provided by different national and local newspapers for all Italian
municipalities above 15,000 inhabitants in the period spanning form 1993 to
2010.40 The dataset excludes foreign newspapers and non-news including real
estate listings, all-sport newspapers, and financial newspapers (Drago et al.
2014). Excluding purely financial newspapers from the dataset does not alter
my theoretical underpinnings, since these newspapers most likely do not cover
micro, small and medium sized companies. I stress the fact that, local
newspapers disseminate local news about the industry and the economic
situation in the city or region which is of greater importance to managers
(owners) of private firms than news about capital markets. The benefit of the
dataset set is that it allows me to study news media coverage across Italian
cities and over time.
4.4.3 Empirical strategy
To investigate the relation between changes in the external information
environment of the firm and investment, I specify the following model:
i,c,ti,c,tc,t1ncti,c,t εX'βNEWSβδαy 11 (1)
40 I am deeply grateful to Francesco Drago, Tommaso Nannicini, and Franscesco Sobbrio for
making their dataset publicly available. See http://www.aeaweb.org/articles.php?doi=
10.1257/app.6.3 as the data source (last checked 23.01.2015).

4 Private firms’ investment efficiency and local news media coverage
114
The dependent variable is a firm-level outcome variable y for firm i,
located in city c, in year t. The variable y entails measures of the firm’s
investment activities (INV or INV_NET), calculated as the difference in gross
(or net) fixed assets divided by lagged total assets. The variable NEWS captures
the number of newspapers on the city-level lagged by one year.
The vector of firm level controls (X) includes the following variables
from the standard investment model which have been used in prior literature
measured at t-1 (Badertscher et al. 2013; Asker et al. 2014; Shroff 2014): I
measure the firm’s investment opportunities as the one year change of sales
divided by sales at the beginning of the year. This way of measuring
investment opportunities is widely used in studies investigating corporate
investment (Shin and Stulz 1998; Lehn and Poulsen 1989; Whited and Wu
2006; Whited 2006; Bloom et al. 2007; Badertscher et al. 2013; Asker et al.
2014). I expect investment opportunities to be positively associated with the
level of investments. I use the firm’s return on assets (ROA), measured as the
ratio of earnings before interest and tax (EBIT) to total assets, to control for
profitability. I expect ROA to be positively associated with the level of
investments. Next, I use the firm’s level of cash and cash equivalents
(MONEY), measured as ratio of cash and cash equivalents to total assets. I
expect the firm’s cash holdings to be positively associated with the level of
investments. I use the firm’s leverage (LEV) measured as the ratio of the sum
of non-current and current liabilities divided by total assets, to proxy for firm
risk. Since firms with higher leverage are more risky and more reluctant to
investment due to financial constraints, I expect LEV to be negatively
associated with the level of investment. I measure industry concentration as the
Herfindahl-Hirshman index (HHI) at the four-digit NAICS code level. I expect

Economic Consequences of Reporting Transparency
115
industry concentration to be negatively associated with the level of investments
since more competitive industries are less profitable. Finally, I use the firm’s
size (SIZE), measured as the natural logarithm of total assets and firm age
(AGE) as control variables. I expect both variables to be positively associated
with the level of investments. I also include year- (αt), city- (φc), and industry-
fixed effects (δn) in the tests. The fixed effects ensure that the coefficient of
interest (β1) is not affected by time invariant year-, city-, and industry factors.
The year fixed-effects remove year-specific shocks across all cities that may
influence firm-level investments. Finally, I calculate the dependent and control
variables at fiscal-year end and cluster standard errors at the firm-level41.
4.5 Results
4.5.1 Univariate analysis
Table 1 shows descriptive statistics of all variables used in the
following tests. My primary proxies of investment are the gross change in fixed
investments (INV) and the net change in fixed assets (INV_NET). Both
variables have a mean of 2.7% of total assets during the sample period. This is
lower compared to US based studies which find investments to be around 5%
of total assets (Badertscher et al. 2013; Asker et al. 2014). This may be due to
the large fraction of very small firms in my sample. Furthermore, the average
presence of local news media (NEWS) is 6.569 local newspapers per city.
Profitability (ROA) of the firms during the sample period is low and on average
0.9%, cash holdings (MONEY) are on average 10% of total assets, and leverage
(LEV) is relatively high with 75% of total assets. The high level of leverage is
likely a function of low access to equity markets (Berger and Udell 1998).
41 Clustering at the city-level does not change my inferences.

4 Private firms’ investment efficiency and local news media coverage
116
Table 1: Summary statistics of dependent and independent variables
Mean SD P25 P50 P75 Obs.
Dependent variables (t0)
INV 0.027 0.188 –0.027 –0.005 0.022 999,624
INV_NET 0.027 0.183 –0.024 –0.004 0.018 1,038,183
INV_EFF 0.085 0.162 0.018 0.040 0.083 999,624
INV_NET_EFF 0.080 0.159 0.017 0.037 0.077 1,007,482
INV_EFF_CF 0.085 0.161 0.018 0.040 0.083 999,624
INV_NET_EFF_CF 0.080 0.159 0.017 0.037 0.078 1,007,482
Experimental variables (t-1)
NEWS 6.569 3.624 4.000 5.000 10.000 1,038,183
∆NEWS 0.179 0.447 0.000 0.000 0.000 1,038,183
Control variables (t-1)
INV_OP 0.093 0.161 0.005 0.088 0.145 1,038,183
ROA 0.009 0.100 –0.006 0.007 0.035 1,038,183
MONEY 0.104 0.145 0.008 0.042 0.141 1,038,183
LEV 0.759 0.252 0.627 0.825 0.933 1,038,183
SIZE 13.770 1.549 12.671 13.670 14.749 1,038,183
HHI 0.025 0.036 0.006 0.012 0.026 1,038,183
AGE 2.391 0.823 1.792 2.398 3.045 1,038,183
Notes: The dependent variables investment (INV) and net investment (INV_NET) are
measured in the following ways: ((Fixed assets + Depreciation)t–(Fixed assets +
Depreciation) t–1 )/Total assets–1 and (Fixed assets – Fixed assets–1)/Total assets–1.
INV_EFF(_CF) and INV_NET_EFF(_CF), are the absolute values of the residuals
obtained from a regression of investments on investment opportunities (and cash flow
from operations). See section 4.5.3.2 for a detailed description of the estimation.
NEWS is equals the number of newspapers in the province over the year measure at t-
1. ∆NEWS is the change of NEWS over the last year measured at t-1. Investment
opportunities (INV_OP) is measured as (Salest – Salest–1)/Salest–1) at t-1. Return on
assets (ROA) is measured as EBIT/Total assets at t-1. Cash and cash equivalents
(MONEY) are measured as Cash/Total assets at t-1. The firm’s leverage (LEV) is
measured as (non-current + current liabilities)/Total assets at t-1. The firm’s size
(SIZE) is measured as the natural logarithm of total assets at t-1. I measure industry
concentration as the Herfindahl-Hirshman index (HHI) at the four-digit NAICS code
level at t-1.I measure AGE as the natural logarithm of the firm’s age at t-1. All
variables are winsorized at the 1st and 99th percentiles.
Table 2 shows the Pearson correlation matrix. Notably, NEWS is
negatively correlated with the level of investments (INV and INV_NET)
(p<0.05) but positively correlated (p<0.01) with the measure of investment (in-
) efficiency. The first correlation gives some insights on how NEWS may
influence the level of investment. The second correlation between investment
efficiency and NEWS is opposite to my predictions since a positive correlation

Economic Consequences of Reporting Transparency
117
implies that higher news media presence positively correlates with the absolute
value of deviations from the predicted investment. Furthermore, I find strong
positive correlations (p<0.01) between investment opportunities (INV_OP),
past performance (ROA), the firms’ level of cash holdings, firm size (SIZE),
and age (AGE). These results correspond to the predicted signs.

4 Private firms’ investment efficiency and local news media coverage
118
Table 2: Pearson correlation matrix of dependent and independent variables
(1) (2) (3) (4) (5) (6) (7) (8) (9) (10) (11) (12) (13) (14) (15)
(1) INV 1
(2) INV_NET 0.991 1
(3) INV_EFF 0.815 0.826 1
(4) INV_NET_EFF 0.823 0.832 0.990 1
(5) INV_EFF_CF 0.814 0.826 0.999 0.989 1
(6) INV_NET_EFF_CF 0.822 0.832 0.989 0.999 0.990 1
(7) NEWSt-1 –0.002 –0.001 0.013 0.012 0.013 0.012 1
(8) ∆NEWS t-1 0.008 0.008 0.009 0.009 0.009 0.009 0.216 1
(9) INV_OP t-1 0.023 0.020 0.019 0.019 0.019 0.019 0.010 –0.009 1
(10) ROA t-1 0.061 0.053 –0.018 –0.010 –0.017 –0.011 –0.002 0.010 0.069 1
(11) MONEY t-1 0.000 0.004 –0.005 –0.011 –0.005 –0.011 0.062 –0.009 0.001 0.179 1
(12) LEV t-1 –0.051 –0.052 –0.043 –0.047 –0.043 –0.046 –0.021 –0.023 0.039 –0.399 –0.201 1
(13) SIZE t-1 0.041 0.036 –0.043 -0.032 -0.043 -0.032 -0.018 0.046 0.044 0.046 -0.289 -0.034 1
(14) HHI t-1 -0.004 -0.005 0.001 -0.001 0.001 -0.001 0.019 0.010 -0.020 0.002 0.030 -0.025 0.036 1
(15) AGE t-1 0.034 0.039 -0.005 0.000 -0.006 0.000 -0.005 0.041 -0.088 0.018 -0.066 -0.217 0.336 0.038 1
Notes:. The dependent variables investment (INV) and net investment (INV_NET) are measured in the following ways: ((Fixed assets + Depreciation)t–(Fixed assets + Depreciation)
t–1 )/Total assets–1 and (Fixed assets – Fixed assets–1)/Total assets–1. INV_EFF_(CF) and INV_NET_EFF(_CF), are the absolute values of the residuals obtained from a regression of
investments on investment opportunities (and cash flow from operations). See section 5 for a detailed description of the estimation. NEWS is equals the number of newspapers in the
province over the year measure at t-1. ∆NEWS is the change of NEWS over the last year measured at t-1. Investment opportunities (INV_OP) is measured as (Salest – Salest–1)/Salest–
1) at t-1. Return on assets (ROA) is measured as EBIT/Total assets at t-1. Cash and cash equivalents (MONEY) are measured as Cash/Total assets at t-1. The firm’s leverage (LEV) is
measured as (non-current + current liabilities)/Total assets at t-1. The firm’s size (SIZE) is measured as the natural logarithm of total assets at t-1. I measure industry concentration
as the Herfindahl-Hirshman index (HHI) at the four-digit NAICS code level at t-1.I measure AGE as the natural logarithm of the firm’s age at t-1. All variables are winsorized at the
1st and 99th percentiles. Bold numbers indicate significance levels at p<0.01.

Economic Consequences of Reporting Transparency
119
4.5.2 Test of hypothesis 1
To test whether the external information environment of private firms is
associated with the level of corporate investments, I run a regression of the
level of investments on the number of news media (print and online) at the
city-level. Table 3 shows the OLS estimates. Column (1) uses the firm’s
change in gross fixed assets investments (INV) and column (2) presents the
results for using net fixed assets investments as the dependent variable.
Turning to the control variables, the firm’s investment opportunities (INV_OP)
are positively associated with the level of investments (coeff. 0.0031, t-stat.
15.44). The firm’s return on asset is also positively associated with investment
(coeff. 0.0852, t-stat. 33.73). Moreover, cash holdings (MONEY) are positively
associated with the investments (coeff. 0.0072, t-stat. 5.08), whereas the firm’s
leverage is negatively associated with investment (coeff. -0.0124, t-stat. 11.74).
The firm’s size (SIZE) and age (AGE) are both positive and statistically
significant associated with investments. Industry concentration (HHI) shows
the predicted sign but is not statistically significant at the conventional level in
column (1) and is weakly significant in column (2) (coeff. -0.0206, t-stat. 1.37
and coeff. -0.0265, t.stat. 1.87). Overall, the control variables show the
predicted signs and are significantly associated with the level of investment.
Turning to the experimental variable, NEWS which is the number of
local news media presence at the city-level, I find a negative and statistically
significant association with private firms’ investments in column (1) (coeff. -
0.0015, t-stat.4.05) and column (2) (coeff. -0.0018, 5.07). The negative
association suggests that a more transparent information environment is
associated with a reduction in the level of investment. This may be due to the

4 Private firms’ investment efficiency and local news media coverage
120
fact, that a more transparent local economic environment reveals information
that reduces the net present value of the investment. For example, the economic
development in Italy, as of today, is still in recovery from the financial crisis.42
Applied to local investment decisions by private firms, this may suggest that
higher transparency reveals suboptimal investment opportunities which
subsequently lead to lower levels of investment.
Table 3: Investment levels and the external information environment
This table presents the association between private firms’ investment levels and their
information environment.
Predicted
sign
INV
(1)
INV_NET
(2)
NEWS +/– –0.0015*** –0.0018***
(4.05) (5.07)
INV_OP + 0.0031*** 0.0025***
(15.44) (13.64)
ROA + 0.0852*** 0.0631***
(33.73) (27.46)
MONEY + 0.0072*** 0.0119***
(5.08) (8.95)
LEV – –0.0124*** –0.0136***
(11.74) (13.74)
SIZE + 0.0015*** 0.0007***
(9.95) (5.15)
HHI – –0.0206 –0.0265*
(1.37) (1.87)
AGE + 0.0037*** 0.0051***
(13.38) (19.29)
Year FE? Yes Yes
City FE? Yes Yes
Industry FE? Yes Yes
Adj. R2 4% 4%
N 999,624 1,038,183
Notes: The dependent variables investment (INV) and net investment (INV_NET) are
measured in the following ways: ((Fixed assets+Depreciation)t–(Fixed assets+Depreciation)
t–1 )/Total assets–1 and (Fixed assets – Fixed assets–1)/Total assets–1. NEWS is equals the
number of newspapers in the province over the year measure at t-1. Investment opportunities
(INV_OP) is measured as (Salest – Salest–1)/Salest–1) at t-1. Return on assets (ROA) is
42 See for example the OECD’s economic survey report for Italy, available here:
http://www.oecd.org/eco/surveys/economic-survey-italy.htm .

Economic Consequences of Reporting Transparency
121
[continued]
measured as EBIT/Total assets at t-1. Cash and cash equivalents (MONEY) are measured as
Cash/Total assets at t-1. The firm’s leverage (LEV) is measured as (non-current + current
liabilities)/Total assets at t-1. The firm’s size (SIZE) is measured as the natural logarithm of
total assets at t-1. I measure industry concentration as the Herfindahl-Hirshman index (HHI)
at the four-digit NAICS code level at t-1.I measure AGE as the natural logarithm of the
firm’s age at t-1. All variables are winsorized at the 1st and 99th percentiles.*, **, ***
indicate statistical significance at the 10%,5%, and1% level, respectively. Robust standard
errors are clustered at the firm-level.
4.5.3 Test of hypothesis 2
To further illuminate the association between the external information
environment and private firms’ investment behavior, I turn to the test of
hypothesis two. Hypothesis two suggests that a more transparent information
environment is associated with higher investment efficiency.
4.5.3.1 Firms’ responsiveness to investment opportunities
In a first approach to test this association, I include an interaction term
between the number of local news media and the firm’s investment
opportunities (NEWS×INV_OP) in equation (1), resulting in the following
equation:
i,c,ti,c,t1-tc,
c,t1ncti,c,t
εX'βINV_OP×NEWS
NEWSβδαy
12
1
(1a)
Following prior literature, a positive interaction term (β2) suggests more
efficient investment (Asker et al. 2014; Badertscher et al. 2013). Table 4 shows
the results of the modified equation (1). The coefficient of interest is the
interaction term NEWS×INV_OP. The coefficient of NEWS×INV_OP is
positive and statistically significant in column (1) (coeff. 0.0002, t-stat. 3.01)
and column (2) (coeff. 0.0001, t-stat. 2.58). This result suggests that private
firm investment is more responsive to investment opportunities in cities with
higher news media coverage. In economic terms, I find a 1 one unit increase in

4 Private firms’ investment efficiency and local news media coverage
122
local newspaper coverage increases investment sensitivity by 0.06% from the
mean level.43 The control variables have the predicted signs and remain
statistically significant.
Table 4: Investment sensitivity and the external information environment
This table presents the results of sensitivity of private firms’ investments to their
investment opportunities.
Predicted
sign
INV
(1)
INV_NET
(2)
NEWS +/– –0.0015*** –0.0018***
(4.09) (5.11)
INV_OP + 0.0020*** 0.0016***
(4.91) (4.41)
NEWS×INV_OP +/– 0.0002*** 0.0001***
(3.01) (2.58)
ROA + 0.0852*** 0.0631***
(33.74) (27.46)
MONEY + 0.0072*** 0.0119***
(5.08) (8.94)
LEV – –0.0124*** –0.0136***
(11.73) (13.73)
SIZE + 0.0015*** 0.0007***
(9.93) (5.14)
HHI – –0.0207 –0.0266*
(1.37) (1.87)
AGE + 0.0037*** 0.0051***
(13.38) (19.29)
Year FE? Yes Yes
City FE? Yes Yes
Industry FE? Yes Yes
Adj. R2 4% 4%
N 999,624 1,038,183
Notes: The dependent variables investment (INV) and net investment (INV_NET) are
measured in the following ways: ((Fixed assets + Depreciation)–(Fixed assets +
Depreciation)t–1)/Total assetst–1 and (Fixed assets – Fixed assets t–1)/Total assetst-1. NEWS is
equals the number of newspapers in the province over the year measure at t-1. Investment
opportunities (INV_OP) is measured as (Salest – Salest–1)/Salest–1) at t-1. Return on assets
(ROA) is measured as EBIT/Total assets at t-1. Cash and cash equivalents (MONEY) are
measured as Cash/Total assets at t-1. The firm’s leverage (LEV) is measured as (non-
current + current liabilities)/Total assets at t-1. The firm’s size (SIZE) is measured as the
natural logarithm of total assets at t-1. I measure industry concentration as the Herfindahl-
Hirshman index (HHI) at the four-digit NAICS code level at t-1.I measure AGE as the
natural logarithm of the firm’s age at t-1. All variables are winsorized at the 1st and 99th
percentiles.*, **, *** indicate statistical significance at the 10%, 5%, and 1% level,
respectively. Robust standard errors are clustered at the firm-level.
43 Average responsiveness of investment to investment opportunities:
0.002+0.0002*6.569=0.0033138. An increase of local news media by 1 is accordingly:
1*0.0002.

Economic Consequences of Reporting Transparency
123
4.5.3.2 Firms’ investment efficiency
In a second approach to test the association between investment
efficiency and the information environment, I follow prior literature on
investment efficiency (Goodman et al. 2013; McNichols and Stubben 2008;
Shroff 2014; Biddle et al. 2009; Richardson 2006), and calculate investment
efficiency in the following way.
i,ti.t0i,t εINV_OPβY 1 (1a)
i,ttii.t0i,t εCFOINV_OPβY ,21 (1b)
where the dependent variable Yit is either INV or INV_NET, and
INV_OP is the firm’s lagged sales growth as defined earlier. I add the firm’s
operating cash flow divided by total assets at the beginning of the year (CFO)
in equation (3) to capture the firm’s financial position which may hamper
firm’s investment (Fazzari et al. 1988; Mortal and Reisel 2013). I run the
regression for each industry (four digit NAICS code) year combination. Then I
use the absolute value of the residual as my measure of investment
inefficiency. The residual captures the magnitude of the firm’s deviation from
the expected level on investment according to its investment opportunities
(Biddle et al. 2009).
According to hypothesis two, I expect a negative association between
NEWS and investment inefficiency measured as the absolute value of the
residual from equation (2) and (3). The intuition behind this test is that, a more
transparent local information environment increases the manager’s ability to
adapt her information set to changing economic developments. Thereby, the
newly gained information enables her to decrease the likelihood of
overinvestment and underinvestment, based on a less transparent/incorrect

4 Private firms’ investment efficiency and local news media coverage
124
picture of the local economic situation. Specifically, I assume that a more
transparent external information environment enables the manger to make
more precise estimates of the investment’s NPV, which is a crucial determinant
in successful investment decisions (Goodman et al. 2013). Hence, I expect a
more transparent local information environment to be associated with a
decrease in investment inefficiency which equals an increase in investment
efficiency.
Table 5 columns (1) to (4) show the results of the regression of
investment efficiency on the number of local news media. Throughout the
different ways of calculating investment efficiency in columns (1) to (4) the
coefficient of NEWS is negative and significant at the one percent level (p-
value < 0.01). These results suggest that a more transparent local information
environment increases investment efficiency.

Economic Consequences of Reporting Transparency
125
Table 5: Investment efficiency and the external information environment
This table shows the results from a regression of investment on the firm’s external information environment. Columns (1) to (4) indicate which investment efficiency
variable ((1):INV_EFF, (2): INV_EFF_NET, (3): INV_EFF_CF, (4):INV_EFF_NET_CF), has been used as the dependent variable.
Predicted
sign
INV_EFF
(1)
INV_NET_EFF
(2)
INV_EFF_CF
(3)
INV_NET_EFF_CF
(4)
NEWS – –0.0023*** –0.0023*** –0.0023*** –0.0022***
(7.56) (7.64) (7.53) (7.60)
ROA – –0.0548*** –0.0408*** –0.0534*** –0.0428***
(26.49) (20.60) (25.80) (21.62)
MONEY – –0.0163*** –0.0203*** –0.0161*** –0.0202***
(13.41) (17.21) (13.26) (17.12)
LEV – –0.0258*** –0.0258*** –0.0255*** –0.0254***
(29.44) (30.17) (29.19) (29.76)
SIZE – –0.0068*** –0.0059*** –0.0067*** –0.0058***
(52.33) (46.85) (52.02) (46.43)
HHI – –0.0250** –0.0255** –0.0268** –0.0277**
(1.97) (2.09) (2.12) (2.27)
AGE – –0.0006** –0.0002 –0.0007*** –0.0004
(2.34) (0.96) (3.03) (1.58)
Year FE? Yes Yes Yes Yes
City FE? Yes Yes Yes Yes
Industry FE? Yes Yes Yes Yes
Adj. R2 10% 10% 10% 10%
N 999,624 1,007,482 999,624 1,007,482
Notes: The dependent variables INV_EFF_(CF) and INV_NET_EFF(_CF), are the absolute values of the residuals obtained from a regression of investments on investment
opportunities (and cash flow from operations). See section 4.5.3.2 for a detailed description of the estimation. NEWS is equals the number of newspapers in the province
over the year measure at t-1. Return on assets (ROA) is measured as EBIT/Total assets at t-1. Cash and cash equivalents (MONEY) are measured as Cash/Total assets at t-1.
The firm’s leverage (LEV) is measured as (non-current + current liabilities)/Total assets at t-1. The firm’s size (SIZE) is measured as the natural logarithm of total assets at t-
1. I measure industry concentration as the Herfindahl-Hirshman index (HHI) at the four-digit NAICS code level at t-1.I measure AGE as the natural logarithm of the firm’s
age at t-1. All variables are winsorized at the 1st and 99th percentiles.*, **, *** indicate statistical significance at the 10%, 5%, and1% level, respectively. Robust standard
errors are clustered at the firm-level.

4 Private firms’ investment efficiency and local news media coverage
126
To further investigate the relation between the external information
environment and investment efficiency, I partition the sample into firms that
overinvest and firms that uinderinvest.44 I do so, by using the signed residual
from equations (2) and (3) and define overinvestment as a positive deviation
from the predicted investment and underinvestment as a negative deviation
from the predicted investment level, accordingly. Then I use this definition to
split the sample accordingly. The dependent variable, however, remains the
one from the previous analysis: the absolute value of the residual from equation
(2) or (3). Table 6 shows the results for the two groups. The results suggest that
a more transparent information environment is negatively associated with
overinvestment and underinvestment. The coefficient of NEWS is negative
throughout every specification and statistically significant (p<0.01)
44 See e.g. Feng et al. (2011) who use a comparable research design.

Economic Consequences of Reporting Transparency
127
Table 6: Over- and underinvestment and the firm’s information environment
This table shows the results from a regression of over- (under) investment on the firm’s external information environment. Columns (1) to (4) indicate which investment variable
((1):INV_EFF, (2): INV_EFF_NET, (3): INV_EFF_CF, (4): INV_EFF_NET_CF), has been used to partition the sample into overinvestment and underinvestment buckets,
respectively.
Overinvestment Underinvestment
Predicted
sign
(1) (2) (3) (4) (1) (2) (3) (4)
NEWS – –0.0033*** –0.0031*** –0.0033*** –0.0031*** –0.0014*** –0.0013*** –0.0014*** –0.0013***
(3.39) (3.23) (3.48) (3.23) (9.87) (10.16) (9.86) (10.10)
ROA – –0.0746*** –0.0715*** –0.0512*** –0.0580*** –0.0738*** –0.0540*** –0.0740*** –0.0584***
(10.08) (9.73) (7.46) (8.55) (67.10) (58.32) (65.92) (61.31)
MONEY – –0.0334*** –0.0374*** –0.0346*** –0.0384*** –0.0135*** –0.0189*** –0.0127*** –0.0184***
(8.47) (9.47) (8.89) (9.85) (26.66) (42.86) (24.86) (41.54)
LEV – –0.0777*** –0.0802*** –0.0755*** –0.0777*** –0.0078*** –0.0075*** –0.0075*** –0.0069***
(25.73) (26.32) (25.78) (26.25) (20.10) (21.52) (19.15) (19.64)
SIZE – –0.0219*** –0.0210*** –0.0210*** –0.0202*** –0.0042*** –0.0033*** –0.0042*** –0.0033***
(53.88) (50.92) (52.56) (49.79) (65.46) (57.73) (65.37) (56.77)
HHI – 0.0050 –0.0037 –0.0053 –0.0072 –0.0130** –0.0110** –0.0160*** –0.0149***
(0.13) (0.10) (0.14) (0.19) (2.13) (1.99) (2.59) (2.68)
AGE – 0.0056*** 0.0065*** 0.0050*** 0.0062*** –0.0031*** –0.0035*** –0.0033*** –0.0037***
(7.67) (8.75) (7.05) (8.46) (30.05) (37.82) (31.78) (39.50)
Year FE? Yes Yes Yes Yes Yes Yes Yes Yes
City FE? Yes Yes Yes Yes Yes Yes Yes Yes
Industry FE? Yes Yes Yes Yes Yes Yes Yes Yes
Adj. R2 17% 18% 17% 18% 25% 27% 25% 27%
N 267,187 259,086 271,187 262,782 732,437 748,396 728,437 744,700
Notes: The dependent variables INV_EFF_(CF) and INV_NET_EFF(_CF), are the absolute values of the residuals obtained from a regression of investments on investment
opportunities (and cash flow from operations). See section 4.5.3.2 for a detailed description of the estimation. NEWS is equals the number of newspapers in the province over the year
measure at t-1. Return on assets (ROA) is measured as EBIT/Total assets at t-1. Cash and cash equivalents (MONEY) are measured as Cash/Total assets at t-1. The firm’s leverage
(LEV) is measured as (non-current + current liabilities)/Total assets at t-1. The firm’s size (SIZE) is measured as the natural logarithm of total assets at t-1. I measure industry
concentration as the Herfindahl-Hirshman index (HHI) at the four-digit NAICS code level at t-1.I measure AGE as the natural logarithm of the firm’s age at t-1. All variables are
winsorized at the 1st and 99th percentiles.*, **, *** indicate statistical significance at the 10%, 5%, and 1% level, respectively. Robust standard errors are clustered at the firm-level.

4 Private firms’ investment efficiency and local news media coverage
128
Overall, my results suggest that a more transparent information
environment decreases the level of investments, but increases the firm’s
responsiveness to investment opportunities and its investment efficiency by
reducing the firms’ under- as well as overinvestment.
4.6 Sensitivity checks and limitations
One limitation of the study is that I do not show a causal link between
news media presence in the firms’ information environment and private firms’
investment efficiency. Furthermore, one might argue that the association that I
find is driven by omitted variables. In order to alleviate concerns about time
invariant variables driving my results I exploit the panel characteristics of the
sample and use fixed effects to control for endogeneity. Additional to the
presented results which include city, industry, and year fixed effects, I use firm
and year fixed effects in an untabulated sensitivity analysis. Using firm-fixed
effects assures that my coefficient of interest is not driven by location and firm
specific time invariant omitted variables. My inferences remain unchanged,
however, I acknowledge the potential loss of efficiency due to the fixed effects
specification (Roberts and Whited 2013).
Another concern in the investment literature is that investment
opportunities are measured with bias (see e.g. Kaplan and Zingales (1997)). So
far, I have not used another measure apart from lagged firm-level sales growth.
Therefore, I caution the reader to interpret the results with care.
4.7 Conclusion
This study examines whether private firms external information
environment is associated with investments. I use the number of local news
media in Italy to link the quality of the firm’s information environment with its

Economic Consequences of Reporting Transparency
129
investment behavior. I conjecture that a higher quality of the information
environment reduces uncertainty about investments which is associated with a
greater responsiveness of firms to their investment opportunities. Furthermore,
I expect the information environment to provide the manger with useful
information to make more precise estimates of NPVs, which in turn enables her
to make more efficient investments. To test my predictions I explore cross-
sectional as well as variation over time in the number of local news media in
Italian cities. I use the panel structure of the dataset to control for time
invariant omitted variables that may bias my results. In line with my
predictions, I find firms to be more responsive to investment opportunities in
cities which have a better information environment. Furthermore, I find a
positive association between investment efficiency and the information
environment. Additionally, I find higher quality information environment to
reduce over as well as underinvestment.
My results have policy implication since they show that the
communication infra-structures is an important channel ensuring efficient
resource allocation in an economy by securing the flow and availability of
decision relevant firm-specific information to economic agents.

5 Summary and conclusion
130
5 Summary and conclusion
This dissertation investigates the economic consequences of reporting
transparency and presents evidence on real effects of firms’ reporting and
disclosure activities. It adds to firm-specific and market-wide studies
corroborating the economic consequences of reporting transparency. However,
although policy makers are in favor of increasing reporting transparency, this
study also highlights costs of corporate disclosure activities.
The concept of reporting transparency comprises the availability of
firm-specific information to stakeholders. The availability of firm-specific and
market-wide information plays a central role in efficient resource-allocation
and decision making activities by economic agents. Mainly, information
asymmetries and agency costs deter efficient resource allocation. Since
reporting transparency decreases information asymmetries and agency costs, it
provides a better picture of the firm’s underlying economics. Nonetheless,
reporting transparency can also be costly due to the disclosure of proprietary
information.
Chapter two of this thesis examines how financial reporting
transparency of firms in different countries affects product markets by using
the cartel setting. The cartel setting is especially interesting since economic
theory predicts that transparency prolongs cartels by reducing contracting costs
or it decreases cartel duration by earlier detection of deviating members. This
study utilizes heterogeneity in reporting transparency between international and
local accounting standards. The results suggest that leaving a cartel is more
likely for firms with transparent reporting. This finding can be explained by the
enhanced ability of cartel members to detect cheating by their fellow members
when their reports are more transparent. Consistent with this argument, the

Economic Consequences of Reporting Transparency
131
results further show that transparency lowers cartel duration when the
opportunity costs of cooperation and the likelihood of cheating are high.
This chapter adds to prior studies on the relationship between firms’
competitive environment and the level of reporting transparency by showing
evidence consistent with theoretical predictions that reporting transparency can
affect industry coordination and competition. It emphasizes the role of
reporting transparency in implicit contracts and the monitoring of implicit
product market contracts. Furthermore, it adds to research on cartel duration
which has important welfare and policy implications. It explicitly considers
transparency as one determinant of cartel duration which speaks to competition
authorities by pointing out its consumer welfare implications, since it fosters
competition by reducing cartel sustainability.
Chapter three examines the economic consequences arising from
proprietary costs of voluntary disclosures. It exploits the UK investment trust
industry to show how the voluntary disclosure of full portfolio holdings affects
the demand for the trust’s shares. The discount represents the difference
between the market value of the investment trust’s investments under
management and the investment trust’s own share price. Due to the inelastic
supply curve of the investment trust’s shares, changes in demand translate into
changes in the discount. A decrease in demand in this setting, therefore,
represents the proprietary costs of disclosure. The findings suggest that
additional disclosure increases the demand for shares, on average. However,
exploring cross-sectional variation within the investment trust industry,
negative effects of voluntary disclosure for the demand of trusts with higher
proprietary information occur. This chapter adds to prior research on the cost,
as well as, the benefits of voluntary disclosure. Apart from the benefits of
5 Summary and conclusion
132
transparency promoted by prior research and policy makers, this study
highlights detrimental effects of enhanced disclosure behavior. This study
utilizes the fact that investment trusts trade at a discount as a new approach in
quantifying proprietary costs. This feature distinguishes it from prior studies in
the field of research firms’ voluntary disclosure behavior. It further speaks to
policy makers and regulators of financial markets by showing evidence of
detrimental effects of reporting transparency.
These findings add to the rather long-lasting debate on more
transparency promoted by politicians in the aftermath of the recent financial
crisis. It further adds to reforms introduced by the European Union by showing
that there may not be a “one-size-fits-all” solution in increasing transparency in
financial markets, and that more transparency may not always be equally
desirable for all market participants.45
Chapter four examines whether the external information environment is
associated with private firms’ investment behavior. It uses an Italian setting
which allows exploiting regional newspaper coverage to link the quality of the
private firm’s information environment to investment behavior. The findings
show that a higher quality of the information environment reduces uncertainty
about investments which leads to greater responsiveness of firms to their
investment opportunities and higher investment efficiency. These results shed
some light on the importance of news media as an additional source of
transparency which provides managers with decision relevant information.
Moreover, the results bear policy implications, since they emphasize the
45 See http://eur-lex.europa.eu/legal
content/EN/TXT/HTML/?uri=CELEX:32013L0050&from=EN.

Economic Consequences of Reporting Transparency
133
importance of communication infra-structures in ensuring efficient resource
allocation in an economy.
Overall, these studies provide insights into macro-level as well as firm-
level consequences of reporting transparency. They highlight positive effects of
transparency on efficient resource allocation that can be beneficial to the
welfare of an economy. Nonetheless, especially chapter four presents evidence
on the potential drawbacks of reporting transparency that have to be taken into
account by regulators and policy makers.
Future research may further concentrate on implications of financial as
well as non-financial reporting transparency on market outcomes different
from these investigated in this study. It could be worthwhile to consider labor
market implications of firms reporting transparency. Moreover, the rise of new
technologies in providing and disseminating accounting information is a field
of research that needs to be taken into account to present a more complete
picture of the economic consequences of transparency. Lastly, it is also of great
interest whether fostering transparency leads to desirable long-term effects.

References
134
References
Abreu, D., D. Pearce, and E. Stacchetti. 1986. Optimal cartel equilibria with imperfect
monitoring. Journal of Economic Theory 39 (1):251-269.
Agarwal, V., W. E. I. Jiang, Y. Tang, and B. Yang. 2013. Uncovering hedge fund skill from
the portfolio holdings they hide. Journal of Finance 68 (2):739-783.
Akerlof, G. A. 1970. The market for "Lemons": Quality uncertainty and the market
mechanism. The Quarterly Journal of Economics 84 (3):488-500.
Amihud, Y., and R. Goyenko. 2013. Mutual fund's R2 as predictor of performance. Review of
Financial Studies 26 (3):667-694.
Amihud, Y., and H. Mendelson. 1986. Asset pricing and the bid-ask spread. Journal of
Financial Economics 17 (2):223-249.
———. 2008. Liquidity, the value of the firm, and corporate finance. Journal of Applied
Corporate Finance 20 (2):32-45.
Ang, J. S., R. A. Cole, and J. W. Lin. 2000. Agency costs and ownership structure. The
Journal of Finance 55 (1):81-106.
Aragon, G., M. Hertzel, and Z. Shi. 2013. Why do hedge funds avoid disclosure? Evidence
from confidential 13F filings. Journal of Financial & Quantitative Analysis 48
(5):1499-1518.
Armstrong, C. S., K. Balakrishnan, and D. Cohen. 2012. Corporate governance and the
information environment: Evidence from state antitakeover laws. Journal of
Accounting and Economics 53 (1–2):185-204.
Asch, P., and J. J. Seneca. 1976. Is collusion profitable? Review of Economics and Statistics
58 (1):1.
Asker, J., J. Farre-Mensa, and A. Ljungqvist. 2014. Corporate Investment and Stock Market
Listing: A Puzzle? Review of Financial Studies.
Badertscher, B., N. Shroff, and H. D. White. 2013. Externalities of public firm presence:
Evidence from private firms' investment decisions. Journal of Financial Economics
109 (3):682-706.
Bagnoli, M., and S. G. Watts. 2010. Oligopoly, disclosure, and earnings management. The
Accounting Review 85 (4):1191-1214.
Balakrishnan, K., M. B. Billings, B. Kelly, and A. Ljungqvist. 2014. Shaping liquidity: On the
causal effects of voluntary disclosure. The Journal of Finance 69 (5):2237-2278.
Ball, R., R. M. Bushman, and F. P. Vasvari. 2008. The debt-contracting value of accounting
information and loan syndicate structure. Journal of Accounting Research 46 (2):247-
287.
Ball, R., A. Robin, and J. S. Wu. 2003. Incentives versus standards: Properties of accounting
income in four East Asian countries. Journal of Accounting and Economics 36 (1-
3):235-270.
Ball, R., and L. Shivakumar. 2005. Earnings quality in U.K. private firms: comparative loss
recognition timeliness. Journal of Accounting and Economics 39 (1):83-128.
Bamber, L. S., and S. C. Youngsoon. 1998. Discretionary management earnings forecast
disclosures: Antecedents and outcomes associated with forecast venue and forecast
specificity choices. Journal of Accounting Research 36 (2):167-190.
Barclay, M. J., C. G. Holderness, and J. Pontiff. 1993. Private benefits from block ownership
and discounts on closed-end funds. Journal of Financial Economics 33 (3):263-291.
Barth, M. E., Y. Konchitchki, and W. R. Landsman. 2013. Cost of capital and earnings
transparency. Journal of Accounting and Economics 55 (2-3):206-224.
Barth, M. E., W. R. Landsman, and M. H. Lang. 2008. International accounting standards and
accounting quality. Journal of Accounting Research 46 (3):467-498.

Economic Consequences of Reporting Transparency
135
Beard, J., and S. Idzikowski. 2012. Invetsment trusts: Why transparency matters. Morningstar
Research Paper May, 2012:1-17.
Beatty, A., S. Liao, and J. J. Yu. 2013. The spillover effect of fraudulent financial reporting
on peer firms' investments. Journal of Accounting and Economics 55 (2–3):183-205.
Berger, A. N., and G. F. Udell. 1998. The economics of small business finance: The roles of
private equity and debt markets in the financial growth cycle. Journal of Banking &
Finance 22 (6–8):613-673.
Berger, P. G., and R. N. Hann. 2007. Segment profitability and the proprietary and agency
costs of disclosure. The Accounting Review 82 (4):869-906.
Berk, J. B., and R. Stanton. 2007. Managerial ability, compensation, and the closed-end fund
discount. The Journal of Finance 62 (2):529-556.
Beyer, A., D. A. Cohen, T. Z. Lys, and B. R. Walther. 2010. The financial reporting
environment: Review of the recent literature. Journal of Accounting and Economics
50 (2-3):296-343.
Bhat, G., O.-K. Hope, and T. Kang. 2006. Does corporate governance transparency affect the
accuracy of analyst forecasts? Accounting & Finance 46 (5):715-732.
Bhattacharya, U., and H. Daouk. 2002. The world price of insider trading. Journal of Finance
57 (1):75-108.
Bhattacharya, U., H. Daouk, and M. Welker. 2003. The world price of earnings opacity. The
Accounting Review 78 (3):641-678.
Biddle, G. C., G. Hilary, and R. S. Verdi. 2009. How does financial reporting quality relate to
investment efficiency? Journal of Accounting and Economics 48 (2-3):112-131.
Bloom, N., S. Bond, and J. Van Reenen. 2007. Uncertainty and investment dynamics. The
Review of Economic Studies 74 (2):391-415.
Botosan, C. A. 1997. Disclosure level and the cost of equity capital. The Accounting Review
72 (3):323-349.
Botosan, C. A., and M. S. Harris. 2000. Motivations for a change in disclosure frequency and
its consequences: An examination of voluntary quarterly segment disclosures. Journal
of Accounting Research 38 (2):329-353.
Botosan, C. A., and M. Stanford. 2005. Managers' motives to withhold segment disclosures
and the effect of SFAS No. 131 on analysts' information environment. The Accounting
Review 80 (3):751-771.
Boudreaux, K. J. 1973. Discounts and premiums on closed-end mutual funds: A study in
valuation. The Journal of Finance 28 (2):515-522.
Bradshaw, M. T., B. J. Bushee, and G. S. Miller. 2004. Accounting choice, home bias, and
U.S. investment in non-U.S. firms. Journal of Accounting Research 42 (5):795-841.
Brenner, S. 2009. An empirical study of the european corporate leniency program.
International Journal of Industrial Organization 27 (6):639-645.
Brochet, F., A. D. Jagolinzer, and E. J. Riedl. 2013. Mandatory IFRS adoption and financial
statement comparability. Contemporary Accounting Research 30 (4):1373-1400.
Brown, K., and R. Gregory-Allen. 2012. The potential effects of mandatory portfolio holdings
disclosure in Australia and New Zealand. Working paper: Massey University:1-40.
Bundeskartellamt. 2011. Fuel sector inquiry.
Burgstahler, D., C. Leuz, and L. Hail. 2006. The importance of reporting incentives: earnings
management in European private and public firms. The Accounting Review 81 (5):983-
1016.
Bushman, R. M., J. D. Piotroski, and A. J. Smith. 2004. What determines corporate
transparency? Journal of Accounting Research 42 (2):207-252.
Bushman, R. M., J. D. Piotroski, and A. J. Smith. 2005. Insider trading restrictions and
analysts' incentives to follow firms. The Journal of Finance 60 (1):35-66.
References
136
———. 2011. Capital allocation and timely accounting recognition of economic losses.
Journal of Business Finance and Accounting 38 (1-2):1-33.
Bushman, R. M., and A. J. Smith. 2001. Financial accounting information and corporate
governance. Journal of Accounting and Economics 32 (1-3):237-333.
Busse, M. 2002. Firm financial condition and airline price wars. RAND Journal of Economics
33 (1):298-318.
Byard, D., Y. Li, and Y. Yu. 2011. The effect of mandatory IFRS adoption on financial
analysts’ information environment. Journal of Accounting Research 49 (1):69-96.
Carhart, M. M. 1997. On persistence in mutual fund performance. The Journal of Finance 52
(1):57-82.
Chay, J. B., and C. A. Trzcinka. 1999. Managerial performance and the cross-sectional
pricing of closed-end funds. Journal of Financial Economics 52 (3):379-408.
Cheng, A., L. Copeland, and J. O'Hanlon. 1994. Investment trust discounts and abnormal
returns: UK evidence Journal of Business Finance & Accounting 21 (6):813-831.
Cherkes, M. 2012. The 2012 survey of closed-end funds' literature. Annual Review of
Financial Economics 4.
Cherkes, M., J. Sagi, and R. Stanton. 2009. A liquidity-based theory of closed-end funds.
Review of Financial Studies 22 (1):257-297.
Christensen, H. B., E. Lee, and M. Walker. 2009. Do IFRS reconciliations convey
information? The effect of debt contracting. Journal of Accounting Research 47
(5):1167-1199.
Claessens, S. 2006. Corporate governance and development. The World Bank Research
Observer 21 (1):91-122.
Cleves, M. A., W. Gould, and R. Gutierrez. 2008. An introduction to survival analysis using
Stata. Texas: Stata Press.
Connor, J. M. 2001. Global price fixing: Our customers are the enemy: Kluwer Academic
Publishers.
Connor, J. M. 2004. Global antitrust prosecutions of modern international cartels. Journal of
Industry, Competition and Trade 4 (3):239-267.
Connor, J. M., and Y. Bolotova. 2006. Cartel overcharges: Survey and meta-analysis.
International Journal of Industrial Organization 24 (6):1109-1137.
Covrig, V. M., M. L. Defond, and M. Hung. 2007. Home bias, foreign mutual fund holdings,
and the voluntary adoption of international accounting standards. Journal of
Accounting Research 45 (1):41-70.
Cox, D. R. 1972. Regression models and life-tables. Journal of the Royal Statistical Society.
Series B (Methodological) 34 (2):187-220.
Cuijpers, R., and W. Buijink. 2005. Voluntary adoption of non-local GAAP in the European
Union: a study of determinants and consequences. European Accounting Review 14
(3):487-524.
Cuthbertson, K., D. Nitzsche, and N. O'Sullivan. 2008. UK mutual fund performance: Skill or
luck? Journal of Empirical Finance 15 (4):613-634.
Daniel, K., M. Grinblatt, S. Titman, and R. Wermers. 1997. Measuring mutual fund
performance with characteristic-based benchmarks. The Journal of Finance 52
(3):1035-1058.
Darrough, M. N., and N. M. Stoughton. 1990. Financial disclosure policy in an entry game.
Journal of Accounting and Economics 12 (1–3):219-243.
Daske, H., and G. Gebhardt. 2006. International financial reporting standards and experts’
perceptions of disclosure quality. Abacus 42 (3/4):461-498.
Daske, H., L. Hail, C. Leuz, and R. Verdi. 2008. Mandatory IFRS reporting around the world:
early evidence on the economic consequences Journal of Accounting Research 46
(5):1085-1142.

Economic Consequences of Reporting Transparency
137
———. 2013. Adopting a label: Heterogeneity in the economic consequences around
IAS/IFRS adoptions. Journal of Accounting Research 51 (3):495-547.
Datar, V. 2001. Impact of liquidity on premia/discounts in closed-end funds. The Quarterly
Review of Economics and Finance 41 (1):119-135.
Datta, S., M. Iskandar-Datta, and V. Singh. 2013. Product market power, industry structure,
and corporate earnings management. Journal of Banking and Finance 37 (8):3273-
3285.
De, O. 2010. Analysis of cartel duration: Evidence from EC prosecuted cartels. International
Journal of the Economics of Business 17 (1):33-65.
DeFond, M. L., J. R. Francis, and X. Hu. 2011. The geography of SEC enforcement and
auditor reporting for financially distressed clients: University of Southern California.
DellaVigna, S. 2009. Psychology and economics: Evidence from the field. Journal of
Economic Literature 47 (2):315-372.
Diamond, D. W. 1985. Optimal release of information by firms. Journal of Finance 40
(4):1071-1094.
Diamond, D. W., and R. E. Verrecchia. 1991. Disclosure, liquidity, and the cost of capital.
Journal of Finance 46 (4):1325-1359.
Dick, A. R. 1996. When are cartels stable contracts? Journal of Law and Economics 39
(1):241-283.
Dimson, E., and C. Minio-Kozerski. 1999. Closed-end funds: A survey. Financial Markets,
Institutions & Instruments 8 (2):1-41.
Dixit, A., and R. Pindyck. 1994. Investment under uncertainty. Princeton, NJ (1994):
Princeton university press.
Drago, F., T. Nannicini, and F. Sobbrio. 2014. Meet the press: How voters and politicians
respond to newspaper entry and exit. American Economic Journal: Applied Economics
6 (3):159-188.
Durante, R., and B. Knight. 2012. Partisan control, media bias, and viewer responses:
Evidence from Berlusconi's Italy. Journal of the European Economic Association 10
(3):451-481.
Durnev, A. R. T., and C. Mangen. 2009. Corporate investments: Learning from restatements.
Journal of Accounting Research 47 (3):679-720.
Dye, R. A. 1986. Proprietary and nonproprietary disclosures. The Journal of Business 59
(2):331-366.
Engelberg, J. E., and C. A. Parsons. 2011. The causal impact of media in financial markets.
The Journal of Finance 66 (1):67-97.
Fang, L., and J. Peress. 2009. Media coverage and the cross-section of stock returns. The
Journal of Finance 64 (5):2023-2052.
Farvaque, E., C. Refait-Alexandre, and D. Saïdane. 2011. Corporate disclosure: a review of its
(direct and indirect) benefits and costs. International Economics 128 (0):5-31.
Fazzari, S., R. G. Hubbard, and B. C. Petersen. 1988. Financing constraints and corporate
investment: National Bureau of Economic Research Cambridge, Mass., USA.
Feng, C., H. Ole-Kristian, L. Qingyuan, and W. Xin. 2011. Financial reporting quality and
investment efficiency of private firms in emerging markets. The Accounting Review 86
(4):1255-1288.
Fernandes, N., and M. A. Ferreira. 2009. Insider trading laws and stock price informativeness.
Review of Financial Studies 22 (5):1845-1887.
Francis, J. R., S. Huang, I. K. Khurana, and R. Pereira. 2009. Does corporate transparency
contribute to efficient resource allocation? Journal of Accounting Research 47
(4):943-989.
Frank, Mary M., James M. Poterba, Douglas A. Shackelford, and John B. Shoven. 2004.
Copycat funds: Information disclosure regulation and the returns to active

References
138
management in the mutual fund industry. Journal of Law and Economics 47 (2):515-
541.
Frankel, R., and X. Li. 2004. Characteristics of a firm's information environment and the
information asymmetry between insiders and outsiders. Journal of Accounting and
Economics 37 (2):229-259.
Friedman, J. W. 1971. A Non-cooperative Equilibrium for Supergames. The Review of
Economic Studies 38 (1):1-12.
Gassen, J. 2014. Causal inference in empirical archival financial accounting research.
Accounting, Organizations and Society forthcoming.
Ge, W., and L. Zheng. 2006. The frequency of mutual fund portfolio disclosures. Working
paper: School of Business Administration, University of Michigan:1-36.
Gemmill, G., and D. C. Thomas. 2002. Noise trading, costly arbitrage, and asset prices:
Evidence from closed-end funds. The Journal of Finance 57 (6):2571-2594.
———. 2006. The Impact of corporate governance on closed-end funds. European Financial
Management 12 (5):725-746.
Gentzkow, M., J. M. Shapiro, and M. Sinkinson. 2011. The effect of newspaper entry and exit
on electoral politics. American Economic Review 101 (7):2980-3018.
Gleason, C. A., N. T. Jenkins, and W. B. Johnson. 2008. The contagion effects of accounting
restatements. The Accounting Review 83 (1):83-110.
Goldstein, I., and H. Sapra. 2013. Should banks' stress test results be disclosed? An analysis
of the costs and benefits. Foundations and Trends in Finance 8 (1):1-54.
Goncharov, I., and C. D. Peter. 2014. Does reporting transparency affect industry
coordination? Evidence from the duration of international cartels. Working paper:
Lancaster University - Management School, WHU − Otto Beisheim School of
Management.
Goncharov, I., and J. Zimmermann. 2007. Do accounting standards influence the level of
earnings management? Evidence from Germany. Die Unternehmung 61 (5):371-388.
González, T. A., M. Schmid, and D. Yermack. 2013. Smokescreen: How managers behave
when they have something to hide. Working paper: University of St. Gallen,
University of St. Gallen, and New York University:1-38.
Goodman, T. H., M. Neamtiu, N. Shroff, and H. D. White. 2013. Management forecast
quality and capital investment decisions. The Accounting Review 89 (1):331-365.
Gordon, L. A., M. P. Loeb, and W. Zhu. 2012. The impact of IFRS adoption on foreign direct
investment. Journal of Accounting and Public Policy 31 (4):374-398.
Graham, J. R., and C. R. Harvey. 2001. The theory and practice of corporate finance:
evidence from the field. Journal of Financial Economics 60 (2–3):187-243.
Green, E. J., and R. H. Porter. 1984. Noncooperative collusion under imperfect price
information. Econometrica 52 (1):87-100.
Grinblatt, M., and S. Titman. 1994. A Study of monthly mutual fund returns and performance
evaluation techniques. Journal of Financial & Quantitative Analysis 29 (3):419-444.
Grossman, S. J., and O. D. Hart. 1980. Disclosure Laws and Takeover Bids. The Journal of
Finance 35 (2):323-334.
Guercio, D. D., and P. A. Tkac. 2002. The determinants of the flow of funds of managed
portfolios: Mutual funds vs. pension funds. Journal of Financial and Quantitative
Analysis 37 (04):523-557.
Hail, L. 2007. Discussion of investor protection and analysts’ cash flow forecasts around the
world. Review of Accounting Studies 12 (2-3):421-441.
Hail, L., and C. Leuz. 2006. International differences in the cost of equity capital: Do legal
institutions and securities regulation matter? Journal of Accounting Research 44
(3):485-531.

Economic Consequences of Reporting Transparency
139
Hail, L., A. Tahoun, and C. Wang. 2014. Dividend payouts and information shocks. Journal
of Accounting Research 52 (2):403-456.
Harrington, J. E., and A. Skrzypacz. 2007. Collusion under monitoring of sales. The RAND
Journal of Economics 38 (2):314-331.
———. 2011. Private mononitoring and communication in cartels: Explaining recent
collusive practices. American Economic Review 101 (6):2425-2449.
Harrington Jr, J. E., and M. H. Chang. 2009. Modelling the birth and death of cartels with an
application to evaluating antitrust policy. Journal of the European Economic
Association 7 (6):1400-1435.
Harrington Jr., J. E. 2006. How do cartels operate? In Foundations and trends in
microeconomics. Hanover, MA: Now Publishers Inc., 1-105.
Harris, M. S. 1998. The association between competition and managers' business segment
reporting decisions. Journal of Accounting Research 36 (1):111-128.
Hayes, R. M., and R. Lundholm. 1996. Segment reporting to the capital market in the
presence of a competitor. Journal of Accounting Research 34 (2):261-279.
Healy, P. M., and K. G. Palepu. 2001. Information asymmetry, corporate disclosure, and the
capital markets: A review of the empirical disclosure literature. Journal of Accounting
and Economics 31:405-440.
Heckman, J. J. 1979. Sample selection bias as a specification error. Econometrica 47 (1):153-
161.
Hölmstrom, B. 1979. Moral hazard and observability. The Bell Journal of Economics 10
(1):74-91.
Hope, O.-K., W. B. Thomas, and D. Vyas. 2013. Financial reporting quality of U.S. private
and public firms. The Accounting Review 88 (5):1715-1742.
Horton, J., G. Serafeim, and I. Serafeim. 2013. Does mandatory IFRS adoption improve the
information environment? Contemporary Accounting Research 30 (1):388-423.
Hubbard, R. G. 1998. Capital-market imperfections and investment. Journal of Economic
Literature 36 (1):193-225.
Huddart, S., J. S. Hughes, and C. B. Levine. 2001. Public disclosure and dissimulation of
insider trades. Econometrica 69 (3):665-681.
Hunton, J. E., R. Libby, and C. L. Mazza. 2006. Financial reporting transparency and earnings
management. The Accounting Review 81 (1):135-157.
Hwang, B.-H. 2011. Country-specific sentiment and security prices. Journal of Financial
Economics 100 (2):382-401.
Jayaraman, S. 2012. The effect of enforcement on timely loss recognition: Evidence from
insider trading laws. Journal of Accounting and Economics 53 (1-2):77-97.
Jenkins, S. P. 2004. Survival analysis. Unpublished manuscript, Institute for Social and
Economic Research, University of Essex:1-133.
Jensen, M. C., and W. H. Meckling. 1976. Theory of the firm: Managerial behavior, agency
costs and ownership structure. Journal of Financial Economics 3 (4):305-360.
Kaplan, S. N., and L. Zingales. 1997. Do investment-cash-flow sensitivities provide useful
measures of financing constraints? . Quarterly Journal of Economics 112 (1):169-215.
Kedia, S., and S. Rajgopal. 2011. Do the SEC's enforcement preferences affect corporate
misconduct? Journal of Accounting and Economics 51 (3):259-278.
Kelly, M., G. Mazzoleni, and D. McQuail. 2004. The media in Europe: The euromedia
research group. SAGE Publications Ltd. London: SAGE Publications Ltd.
Khorana, A., S. Wahal, and M. Zenner. 2002. Agency conflicts in closed-end funds: The case
of rights offerings. Journal of Financial and Quantitative Analysis 37 (02):177-200.
La Porta, R., F. Lopez-de-Silanes, A. Shleifer, and R. W. Vishny. 1998. Law and finance.
Journal of Political Economy 106 (6):1113-1155.

References
140
La Porta, R., F. Lopez-de-Silanes, A. Shleifer, and R. W. Vishny. 2000. Investor protection
and corporate governance. Journal of Financial Economics 58:3-27.
Lambert, P. C. 2007. Modeling of the cure fraction in survival studies. Stata Journal 7
(3):351-375.
Lambert, R., C. Leuz, and R. E. Verrecchia. 2007. Accounting information, disclosure, and
the cost of capital. Journal of Accounting Research 45 (2):385-420.
Lambert, R. A. 2001. Contracting theory and accounting. Journal of Accounting and
Economics 32 (1-3):3-87.
Lang, M., K. V. Lins, and M. Maffett. 2012. Transparency, liquidity, and valuation:
International evidence on when transparency matters most. Journal of Accounting
Research 50 (3):729-774.
Lang, M., and M. Maffett. 2011. Economic effects of transparency in international equity
markets: A review and suggestions for future research. Foundations and trends in
accounting 5 (3):175-241.
Lanning, S. G. 1987. Costs of maintaining a cartel. The Journal of Industrial Economics 36
(2):157-174.
Lau, S. T., L. K. Ng, and B. Zhang. 2. Information environment and equity risk premium
volatility around the world. Management Science 58 (7):1322-1340.
Lawrence, A. 2013. Individual investors and financial disclosure. Journal of Accounting and
Economics 56 (1):130-147.
Lee, C. M. C., A. Shleifer, and R. H. Thaler. 1991. Investor sentiment and the closed-end fund
puzzle. The Journal of Finance 46 (1):75-109.
Lehn, K., and A. Poulsen. 1989. Free cash flow and stockholder gains in going private
transactions. The Journal of Finance 44 (3):771-787.
Lennox, C., J. R. Francis, and Z. Wang. 2011. Selection models in accounting research. The
Accounting Review 87 (2):589-616.
Leslie, C. R. 2004. Trust, distrust, and antitrust. Texas Law Review 82 (3):62.
Leuz, C. 2003. IAS versus U.S. GAAP: Information asymmetry-based evidence from
Germany's new market. Journal of Accounting Research 41 (3):445-472.
———. 2004. Proprietary versus non-proprietary disclosures: Evidence from Germany. In
The Economics and Politics of Accounting, edited by C. Leuz, D. Pfaff and A.
Hopwood. Oxford, U.K.: Oxford University Press.
Leuz, C., and R. Verrecchia. 2000. The economic consequences of increased disclosure.
Journal of Accounting Research 38 (Supplement):91-124.
Leuz, C., and P. Wysocki. 2008. Economic consequences of financial reporting and disclosure
regulation: A review and suggestions for future research. Working paper: University
of Chicago - Booth School of Business; University of Miami - School of Business
Administration.
Levenstein, M. 1997. Price wars and the sustainability of collusion: A study of the pre-world
war I bromine industry. The Journal of Industrial Economics 45 (2):117-137.
Levenstein, M., and V. Suslow. 2006. What determines cartel success? Journal of Economic
Literature 44 (1):43-95.
Levenstein, M., and V. Y. Suslow. 2011. Breaking up is hard to do: Determinants of cartel
duration. Journal of Law and Economics 54 (2):455-492.
Lipczynski, J., J. Wilson, and J. Goddard. 2005. Industrial organization. 2nd ed. New York:
Prentice Hall.
Machlup, F., ed. 1952. The economics of seller's competition: Baltimore, MD: John Hopkins
University Press.
Maddala, G. S. 1991. A Perspective on the use of limited-dependent and qualitative variables
models in accounting research. The Accounting Review 66 (4):788-807.
Mahoney, J. T. 2005. Economic foundations of strategy. California: SAGE Publications

Economic Consequences of Reporting Transparency
141
Malkiel, B. G. 1977. The valuation of closed-end investment-company shares. The Journal of
Finance 32 (3):847-859.
McNichols, M. F., and S. R. Stubben. 2008. Does earnings management affect firms’
investment decisions? The Accounting Review 83 (6):1571-1603.
Miller, G. 2013. Promoting trust and tranparency in the UK investment trust industry.
London: SCM Private LLP.
Miller, G. S. 2006. The press as a watchdog for accounting fraud. Journal of Accounting
Research 44 (5):1001-1033.
Minnis, M. 2011. The value of financial statement verification in debt financing: Evidence
from private U.S. firms. Journal of Accounting Research 49 (2):457-506.
Mortal, S., and N. Reisel. 2013. Capital allocation by public and private firms. Journal of
Financial and Quantitative Analysis 48 (01):77-103.
O'Brien, P. C., M. F. McNichols, and L. Hsiou-Wei. 2005. Analyst impartiality and
investment banking relationships. Journal of Accounting Research 43 (4):623-650.
OECD. 2007. Glossary of statistical terms In Glossary of statistical terms Paris: Organisation
for Economic Co-operation and Development.
Orr, D., and P. W. MacAvoy. 1965. Price strategies to promote cartel stability. Economica 32
(126):186-197.
Parida, S., and T. Teo. 2011. The impact of more frequent portfolio disclosure on mutual fund
performance. Working paper: London School of Economics & Political Science (LSE)
- Department of Finance.
Pepall, L., D. J. Richards, G. Norman, and P. Debashis. 2005. Industrial organization:
Contemporary theory and practice. New York: Thomson/South-Western.
Peress, J. 2014. The Media and the diffusion of information in financial markets: evidence
from newspaper strikes. The Journal of Finance:2007-2043.
Peter, C. D. 2014a. Private firms' investment efficiency and local news media coverage.
Working Paper: WHU − Otto Beisheim School of Management.
———. 2014b. Proprietary cost of full portfolio disclosure for UK investment trusts. Working
Paper: WHU − Otto Beisheim School of Management.
Pontiff, J. 1996. Costly arbitrage: Evidence from closed-end funds. The Quarterly Journal of
Economics 111 (4):1135-1151.
Porter, R. 2005. Detecting collusion. Review of Industrial Organization 26 (2):147-167.
Posner, R. A. 1970. A statistical study of antitrust enforcement. Journal of Law and
Economics 13 (2):365-419.
Pratt, E. J. 1966. Myths associated with closed-end investment company discounts. Financial
Analysts Journal 22 (4):79-82.
Richardson, S. 2006. Over-investment of free cash flow. Review of Accounting Studies 11 (2-
3):159-189.
Rivers, D., and Q. H. Vuong. 1988. Limited information estimators and exogeneity tests for
simultaneous probit models. Journal of Econometrics 39 (3):347-366.
Robert, B. T., II, C. Olsen, and J. R. Dietrich. 1987. Attributes of news about firms: An
analysis of firm-specific news reported in the wall street journal index. Journal of
Accounting Research 25 (2):245-274.
Roberts, K. 1985. Cartel behaviour and adverse selection. The Journal of Industrial
Economics 33 (4):401-413.
Roberts, M. R., and T. M. Whited. 2013. Chapter 7 - Endogeneity in Empirical Corporate
Finance. In Handbook of the Economics of Finance, edited by M. H. George M.
Constantinides and M. S. Rene: Elsevier, 493-572.
Rogers, J. L. 2008. Disclosure quality and management trading incentives. Journal of
Accounting Research 46 (5):1265-1296.

References
142
Seale, D. A., R. J. Arend, and S. Phelan. 2006. Modeling alliance activity: Opportunity cost
effects and manipulations in an iterated prisoner’s dilemma with exit option.
Organizational Behavior and Human Decision Processes 100 (1):60-75.
Shin, H.-H., and R. M. Stulz. 1998. Are internal capital markets efficient? The Quarterly
Journal of Economics 113 (2):531-552.
Shroff, N. 2014. Corporate investment and changes in GAAP. Working paper: Massachusetts
Institute of Technology.
Shroff, N., R. S. Verdi, and G. Yu. 2014. Information environment and the investment
decisions of multinational corporations. The Accounting Review 89 (2):759-790.
Simeon Djankov, Caralee McLiesh, Tatiana Nenova, and Andrei Shleifer. 2003. Who Owns
the Media? Journal of Law and Economics 46 (2):341-382.
Spagnolo, G. 2005. Managerial incentives and collusive behavior. European Economic
Review 49 (6):1501-1523.
Spar, D. L. 1994. The cooperative edge: The internal politics of international cartels. Ithaca:
Cornell University Press.
Stigler, G. J. 1964. A theory of oligopoly. The Journal of Political Economy 72 (1):44-61.
Suslow, V. Y. 2005. Cartel contract duration: empirical evidence from inter-war international
cartels. Industrial and Corporate Change 14 (5):705-744.
Telser, L. G. 1980. A theory of self-enforcing agreements. The Journal of Business 53 (1):27-
44.
Tirole, J. 1988. The theory of industrial organization. Massachusetts Institute of Technology,
Cambridge, Massachusetts.
Tucker, J. W. 2010. Accounting and finance research. Journal of Accounting Literature
29:31-57.
Verrecchia, R. E. 2001. Essays on disclosure. Journal of Accounting and Economics 32 (1-
3):97-180.
Verrecchia, R. E., and J. Weber. 2006. Redacted disclosure. Journal of Accounting Research
44 (4):791-814.
von Blanckenburg, K., and A. Geist. 2011. Detecting illegal activities: The case of cartels.
European Journal of Law and Economics 32 (1):15-33.
Wagenhofer, A. 1990. Voluntary disclosure with a strategic opponent. Journal of Accounting
and Economics 12 (4):341-363.
Watts, R. L., and J. L. Zimmerman. 1979. The demand for and supply of accounting theories:
The market for excuses. The Accounting Review 54 (2):273-305.
———. 1986. Positive accounting theory. Englewood Cliffs, NJ: Prentice-Hall.
Wei, B. 2007. Managerial ability, open-end fund flows, and closed-end fund discounts.
Working paper: Duke University.
Wermers, R. 2000. Mutual fund performance: An empirical decomposition into stock-picking
talent, style, transactions costs, and expenses. The Journal of Finance 55 (4):1655-
1703.
Wermers, R. 2001. The potential effects of more frequent portfolio disclosure on mutual fund
performance. Perspective, The Investment Company Institute 7 (3):1-11.
Wermers, R. 2006. Performance evaluation with portfolio holdings information. The North
American Journal of Economics and Finance 17 (2):207-230.
Whited, T. M. 2006. External finance constraints and the intertemporal pattern of intermittent
investment. Journal of Financial Economics 81 (3):467-502.
Whited, T. M., and G. Wu. 2006. Financial constraints risk. Review of Financial Studies 19
(2):531-559.
Williamson, O. E. 1973. Markets and hierarchies: Some elementary considerations. The
American Economic Review 63 (2):316-325.

Economic Consequences of Reporting Transparency
143
———. 1974. The economics of antitrust: Transaction cost considerations. University of
Pennsylvania Law Review 122 (6):1439-1496.
Yang, T. 2012. Essays on closed-end funds, Faculty of Humanities, Manchester Business
School, Manchester.
Zimmerman, J. E., and J. M. Connor. 2005. Determinants of cartel duration: A cross-sectional
study of modern private international cartels. Working paper: Purdue University.

Affirmation – Statutory Declaration
144
Affirmation – Statutory Declaration
Last Name: Peter First Name: Caspar David
Affirmation – Statutory Declaration
According to § 10 part 1 no. 6 of the Doctoral Studies’ Guide Lines
(dated 5th March 2008 as amended on the 8th September 2009)
I hereby declare, that the
Dissertation
submitted to the Wissenschaftliche Hochschule für Unternehmensführung (WHU) − Otto-
Beisheim – Hochschule was produced independently and without the aid of sources other than
those which have been indicated. All ideas and thoughts coming both directly and indirectly
from outside sources have been noted as such.
This work has previously not been presented in any similar form to any other board of
examiners.
Sentences or text phrases, taken out of other sources either literally or as regards contents,
have been marked accordingly. Without notion of its origin, including sources which are
available via internet, those phrases or sentences are to be considered as plagiarisms. It is the
WHU’s right to check submitted dissertations with the aid of software that is able to identify
plagiarisms in order to make sure that those dissertations have been rightfully composed. I
agree to that kind of checking, and I will upload an electronic version of my dissertation on
the according website to enable the automatic identification of plagiarisms.
The following persons helped me gratuitous / non-gratuitous in the indicated way in selecting
and evaluating the used materials:
Last Name First Name Kind of Support gratuitous /
non-gratuitous
Mirontschenko Nelli Data collection gratuitous
Beckerman Marius Data collection gratuitous
Ehlig Pia Data collection gratuitous
Further persons have not been involved in the preparation of the presented dissertation as
regards contents or in substance. In particular, I have not drawn on the non-gratuitous help of
placement or advisory services (doctoral counsels / PhD advisors or other persons). Nobody
has received direct or indirect monetary benefits for services that are in connection with the
contents of the presented dissertation.
The dissertation does not contain texts or (parts of) chapters that are subject of current or
completed dissertation projects.
Place and date of issue: Vallendar, 31.03.2015 Signature ______________________
Economic Consequences of Reporting Transparency
145
Curriculum vitae
Caspar David Peter Burgmeester Oudlaan 50, T Building, Room T10-49
3062 PA Rotterdam, The Netherlands
+31 (0)10 408 2200
www.rsm.nl
Present Employment
2015 – present Assistant Professor, Rotterdam School of Management, Accounting
and Control Group
2015 Lecturer in “Financial Statement Analysis”, WHU – Otto Beisheim
School of Management, Germany (January - February)
2014 Visiting Researcher at the University of Lancaster (November -
December)
2010 - 2014 Doctoral Assistant, Chair of Financial Accounting, WHU – Otto
Beisheim School of Management, Germany
2009 Internship at PwC, Essen (3 month in auditing)
Education
2010 - present Doctoral Studies, WHU – Otto Beisheim School of Management,
Germany
2005 - 2010 Business and Economics (Wirtschaftswissenschaften), Ruhr-Universität
Bochum
Graduation: Diploma (MSc equivalent)
Research Interests
Economic determinants and consequences of financial reporting
Working Papers
“Proprietary Costs of Full Portfolio Disclosure for UK Investment
Trusts”
“Private firms’ investment efficiency and news media coverage”
“Does Reporting Transparency Affect Industry Coordination? –
Evidence from the Duration of International Cartels” (co-authored with
Igor Goncharov)
“Did IFRS Fuel Analysts’ Optimism during the Financial Crisis” (co-
authored with Jürgen Ernstberger and Khaled Kholmy)

Curriculum vitae
146
Conference Presentations
2014: AAA Annual Conference, Atlanta (August)
Presenter and Discussant
The European Accounting Association 37th Annual Congress, Tallin
(May)
BAFA Annual Conference, London (April)
X Workshop on Empirical Research in Financial Accounting, A
Coruna (April)
Presenter and Discussant
2013: GGS Conference - Communication in Capital Markets, Giessen
(October)
2012: Doctoral Seminar at Justus-Liebig University, Giessen (May)
The European Accounting Association 35th Annual Congress, Ljubljana
(May)
The European Economic Association 27th Annual Congress, Malaga
(August)
Doctoral Seminars with Application Procedure
2013: 29th Doctoral Colloquium in Accounting, EAA Paris (May)
2012: 5th International Accounting & Finance Doctoral Symposium, Glasgow
(August)
2011: Capital Market Research, Tilburg (October - November)
Empirical Accounting Research, Humboldt University (September)
Doctoral Workshops
2013: Text Analysis in Financial Markets, Justus - Liebig University
(October)
2012: Doctoral Seminar at Justus - Liebig University, Giessen (November)
Non‐Parametric Econometrics, Mainz (August)
Mechanics of Writing, WHU (June)
Doctoral Seminar at Justus-Liebig University, Giessen (May)
2011: 2nd WHU Doctoral Summer Program in Accounting Research (SPAR),
(July)
Applied Econometrics, WHU (June)

Economic Consequences of Reporting Transparency
147
Teaching
2015 BSc Financial Statement Analysis - Lecturer
2010 - present Supervision of BSc and MSc theses
BSc Financial Statement Analysis - Tutor
MSc Business Statement Analysis - Tutor
Teaching assistant on Financial Statement Analysis - BSc/MSc/MBA
programs
- Development of new teaching materials
- Preparation of exams
- Administrative duties
2012 - 2013 Coordinator of Brown Bag Seminars at WHU
Personal Information
Place of birth: Bochum, Germany
Nationality: German
Languages: German (mother tongue), English (fluent)
Membership in Scientific Organizations
The European Accounting Association (EAA)
The American Accounting Association (AAA)
The British Finance and Accounting Association (BAFA)