economic assessment of sanitation interventions in ... · economic assessment of sanitation...
TRANSCRIPT

The Water and Sanitation Program is a multi-donor partnership, part of the World Bank Group’s Water Global Practice, supporting poor people in obtaining affordable, safe, and sustainable access to water and sanitation services.
Economic Assessment of Sanitation Interventions in Southeast Asia
A Six-Country Study Conducted in Cambodia, Indonesia, Lao PDR, the Philippines, Vietnam and Yunnan Province (China) under the Economics of Sanitation Initiative
January 2015
WATER AND SANITATION PROGRAM: TECHNICAL PAPER

THE WORLD BANKWater and Sanitation ProgramEast Asia & the Pacific Regional OfficeIndonesia Stock Exchange Building Tower I, 9th Fl. Jl. Jend. Sudirman Kav. 52-53Jakarta 12190 IndonesiaTel: (62-21) 5299 3003Fax: (62 21) 5299 3004
The Water and Sanitation Program is a multi-donor partnership, part of the World Bank Group’s Water Global Practice, supporting poor people in obtaining affordable, safe, and sustainable access to water and sanitation services. WSP’s donors include Australia, Austria, Denmark, Finland, France, the Bill & Melinda Gates Foundation, Luxembourg, Netherlands, Norway, Sweden, Switzerland, United Kingdom, United States, and the World Bank.
Water and Sanitation Program (WSP) reports are published to communicate the results of WSP’s work to the development community. Some sources cited may be informal documents that are not readily available.
The findings, interpretations, and conclusions expressed herein are entirely those of the author and should not be attributed to the World Bank or its affiliated organizations, or to members of the Board of Executive Directors of the World Bank or the governments they represent. The World Bank does not guarantee the accuracy of the data included in this work. The boundaries, colors, denominations, and other information shown on any map in this work do not imply any judgment on the part of the World Bank Group concerning the legal status of any territory or the endorsement or acceptance of such boundaries.
The material in this publication is copyrighted. Requests for permission to reproduce portions of it should be sent to [email protected]. WSP encourages the dissemination of its work and will normally grant permission promptly. For more information, please visit www.wsp.org.
© 2015 International Bank for Reconstruction and Development/The World Bank
The World Bank1818 H Street NWWashington DC 20433Telephone: 202-473-1000www.worldbank.org

Economic Assessment of Sanitation Interventions in Southeast Asia
A Six-Country Study Conducted in Cambodia, Indonesia, Lao PDR, the Philippines, Vietnam and Yunnan Province (China)
The Economics of Sanitation Initiative (ESI)


www.wsp.org iii
Economic Assessment of Sanitation Interventions in Southeast Asia
Executive Summary
BACKGROUNDMillennium Development Goal (MDG) target 7C on im-proved drinking water and sanitation has helped sector stakeholders gain political support and drive through im-proved policies in this often neglected sector. The Human Right to Water and Sanitation resolution recognizes that improved drinking water and sanitation are essential for the full enjoyment of life and of all human rights. Although, globally, the sanitation MDG target is well of track, many countries of Southeast and East Asia have made substantial progress (China, Lao PDR, the Philippines, and Vietnam), whereas some are lagging (Cambodia, Indonesia). However, many of these countries have more ambitious national sani-tation targets than the global target would imply, and some define sanitation more strictly than the UN definition and include safe excreta disposal. Most of these countries have a national target for universal access to sanitation before 2030. Therefore, if countries are to reach their national tar-gets and national definitions of sanitation, continued and enhanced efforts are needed.
With economic growth continuing at 5% or more in many countries of Southeast and East Asia, increasing public and private resources are being allocated to urban expansion and renewal, or targeted toward basic services for rural popula-tions. Many countries have recently revised their sanitation strategies in order to rapidly scale up sanitation programs. Hence, these funds need to be spent efficiently on appro-priate services to meet the needs of the greatest number of people, and of specific vulnerable population groups such as the poor, and to demonstrate development impact and value-for-money in order to qualify for further public funds.
However, governments face many issues in responding to their remaining sanitation challenges. External funding is not guaranteed as donors face difficult choices on where
to direct their aid. Much aid remains earmarked or spent through projects that are designed by the donor. Govern-ments and populations must choose between an array of sanitation technologies. There are also many alternative ways in which sanitation programs can be delivered, for ex-ample through public or private providers. Other choices include the degree of demand generation, the consultative approach to technology selection, and the degree of inte-gration with other services. Policymakers therefore need to rationally examine alternative approaches to reaching their national goals, using evidence where available as a basis for their decisions.
The Economics of Sanitation Initiative (ESI), a global ini-tiative of the Water and Sanitation Program, aims not only to provide evidence on the costs and benefits of alternative sanitation approaches, but also to provide a framework to enable policymakers to systematically and rationally con-sider technology and program alternatives and thus make better choices. Supporting these recommendations are eco-nomic estimates from previous ESI studies, which indicate that inadequate sanitation is associated with major prevent-able costs, and hence improved sanitation has a role to play in poverty reduction efforts. Previous studies have assessed the costs of inadequate sanitation in 2006 at 1.3% of gross domestic product (GDP) in Vietnam, 1.5% in the Philip-pines, 2.3% in Indonesia, 5.6% in Lao PDR, and 7.2% in Cambodia.
STUDY OBJECTIVESESI aims to promote evidence-based decision making to in-crease the volume, effectiveness, and sustainability of sani-tation expenditure. The evidence produced is useful for a range of stakeholders, including governments at national and subnational levels, donors, nongovernmental organiza-tions (NGOs), program managers, and the private sector.
Economic Assessment of Sanitation Interventionsiv
Economic Assessment of Sanitation Interventions in Southeast Asia | Executive Summary
The present study aims to generate robust evidence on the costs and benefits of sanitation improvements in different programmatic and geographic contexts in Southeast Asia to:
1. Enable explicit comparison of sanitation options on the basis of their relative costs and benefits.
2. Identify who might be able or willing to pay for sani-tation improvements, and provide further evidence for informing both public and private decisions on the “right” level of sanitation investment.
3. Concretely inform planning agencies or service pro-viders on financing requirements over the project or technology life cycle.
A more explicit understanding of the costs and benefits of sanitation enables decision makers to make better choices. The main focus of economic evaluation is to understand service efficiency—in terms of both economic and financial return on expenditure. However, it is recognized that other types of evidence and other factors will compete for the at-tention of decision makers and thus influence expenditure, policy, and the eventual choice of sanitation program.
Intervention costs are also fundamental in choosing sanita-tion technologies, given the importance of demonstrating to the public the appropriate use of public funds, and the sensitivity of sanitation financiers to new demands on their budgets. In economic analysis, intervention costs include not only direct financial costs but also “opportunity” costs such as the value of land, or donated inputs. Both invest-ment and recurrent expenditures need to be assessed to en-sure that the full consequences of investment decisions for operations and maintenance costs are considered.
Economic analysis conducted in real field settings also pro-vides the opportunity to examine the real added value of sanitation services. For example, the full benefits of a sanita-tion intervention may not be received due to practical fac-tors that affect the initial uptake of the intervention and continued compliance with good practices. Program per-formance therefore needs to be better understood to advise future program design.
STUDY METHODOLOGYThe economic assessment methodology used in this study drew on established cost-benefit and cost-effectiveness anal-ysis techniques, adapted for the case of sanitation. In each
country, steering or advisory groups composed of govern-ment and other sanitation experts were set up to provide inputs to study design and site selection, and to ensure links with policy.
Two types of field-level efficiency assessments were per-formed:
• Onesetofoutputsreflectsidealperformanceassum-ing the intervention is delivered, maintained, and used appropriately—using field data on the costs and benefits of interventions.
• Asecondsetofoutputsreflectsactualperformanceand is adjusted on the basis of observed levels of sani-tation adoption and use at field sites.
The ratios are supplemented by in-depth qualitative assess-ments of sanitation knowledge, behavior, and preferences at the same field locations. National-level benefits of im-proved sanitation were also evaluated. Together with the field-level cost-benefit measures, these enable overall assess-ment of cost-benefit performance.
An economic model was designed that captures and compares all the costs and benefits of interventions over a 20-year pe-riod in US$ at 2008 prices, using the best available sources for each key data input. Costs included investment and recur-rent expenses, whereas monetized local area benefits included health, time savings, water quality, and resource reuse. Seven efficiency measures were calculated in country reports for each field site and each sanitation technology: the benefit-cost ratio (BCR), the internal rate of return, the payback period, the net present value, and the cost per disease episode, death and dis-ability-adjusted life year (DALY) averted. Nonmonetized local area benefits focused on aspects of environmental quality and personal and social welfare. Broader benefits included impacts on tourism and business. This approach utilized primary data where possible (collected from field sites) and supplemented with data from national surveys or international sources. The economic model was configured to enable comparison of outcomes for households both with and without improved sanitation, and comparison of different levels on the sanita-tion ladder. Field data collection (e.g., household surveys and focus group discussions) focused on households with a range of sanitation options, including “no sanitation,” to populate the economic model and enable comparative analysis of eco-nomic efficiency between the modeled options.

www.wsp.org v
Economic Assessment of Sanitation Interventions in Southeast Asia | Executive Summary
Field sites and projects were selected to be representative of each country, or province in the case of Yunnan, China. By sampling a range of representative locations, the study results can be utilized outside the study settings, and hence be more useful for national- and local-level planning. Field assessments were made in 47 sites—25 classified as “rural” and 22 as “urban.”
The type of sanitation evaluated in this study was human excreta management at the household level, focusing on both onsite and off-site sanitation options. Basic hygiene was also included, insofar as it affects health outcomes and intangible factors. In addition to human excreta manage-ment, the study considered interventions jointly address-ing human waste with domestic wastewater management (especially in urban areas) and animal waste management (in the case of biogas generation). The baseline analysis focuses on comparing each sanitation intervention option with no sanitation service. This approach helps decision makers understand why sanitation is necessary for those currently without a service, and also helps justify prevent-ing households from falling back into the “no service” cat-egory (e.g., when regular pit emptying, hardware mainte-nance, and behavior change activities are not conducted, as required).
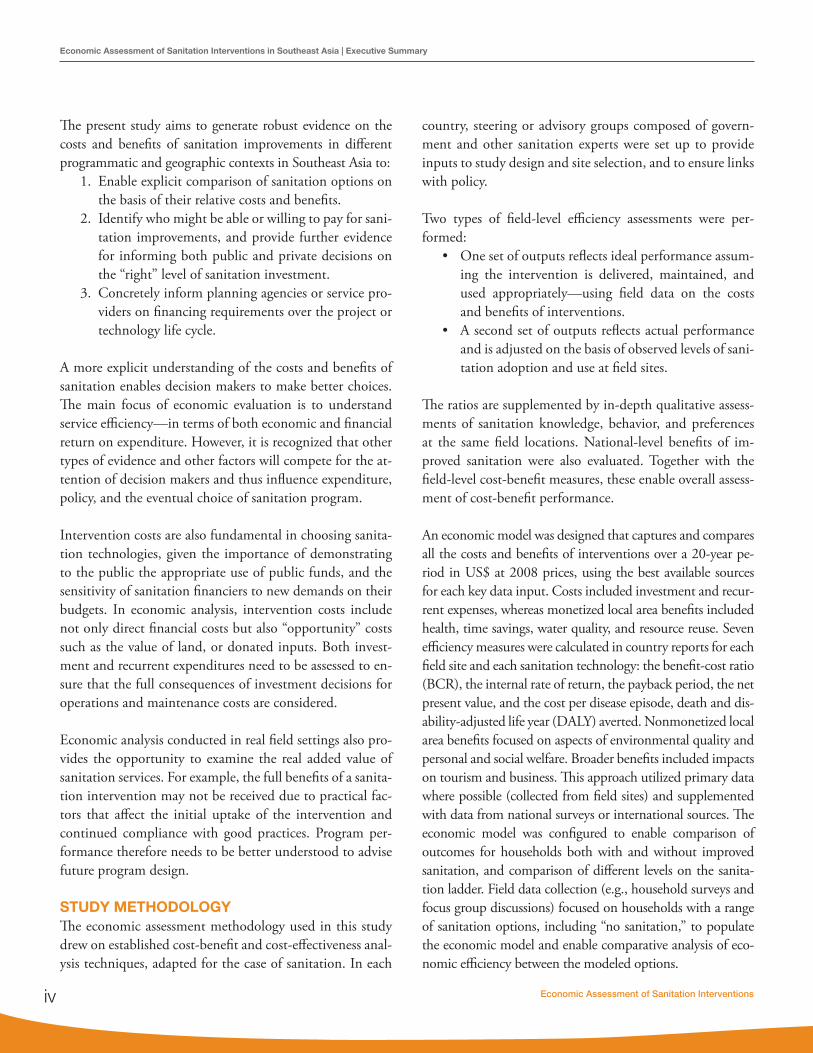
RESULTS: ECONOMIC RETURNS OF RURAL SANITATIONFigure 1 presents the results for pit latrines, reflecting the ideal benefit-cost ratios (i.e., assuming households who in-vest in or receive a latrine will continue to use the facility and use it properly). Three findings are worth noting:
1. Returns on pit latrines are at least 5 times their cost in all but one country, Cambodia. Across both wet and dry pit latrines, the returns are highest in Lao PDR at over 8 times.
2. Dry pit latrines do not consistently have a higher re-turn than the more expensive wet pits, despite their lower investment cost in all countries. For example, this finding was observed for the Philippines and Cambodia largely because the expected life of a dry pit is shorter than that of a wet pit latrine.
3. Although the overall returns are similar across countries, the benefits that make up the returns are significantly different. This is due to the different levels of impact and the different relative values of those impacts.
The assessment of septic tanks in rural areas showed that net returns are significantly lower than less costly pit latrines. In only two countries did the net returns reach 4 (Vietnam and Lao PDR), the net returns are as low as 2 in the Phil-ippines. However, the returns remain above 1 for all tech-nologies and all countries. Health benefits alone exceeded the intervention costs in four out of five countries.
The economic returns on reuse options in three countries covered biogas and urine diversion dehydration toilets (UDDT). All reuse options were found to yield economic returns of at least 1, ranging from a BCR of 2 in the Philip-pines to 9 in Yunnan for UDDT. In Yunnan the UDDT option has a higher ratio than a pit latrine, accomplished through a large-scale government program that made the unit cost of UDDT facilities similar to that of ordinary pit latrines. In the Philippines, the UDDT yielded significantly lower returns than pit latrines, due to the high hardware and software unit costs of delivering UDDT. In Vietnam the composting latrine yielded a marginally lower return than a pit latrine, due to the higher unit cost but limited marginal return on reuse of compost.
Rural households still used shared or public toilets at field sites in four countries. The assessment showed that the net returns are greater than 1 for all these options. The BCR of shared latrines is generally not higher than that of private latrines, because although the costs are shared by two or perhaps three households, the expected lifespan is usually considerably shorter, or more regular emptying is needed. In the Philippines, the returns for shared toilets are the low-est because unit costs of shared (communal) toilets are sig-nificantly higher than those of private options, even when calculated on a “cost per household served” basis. The re-turns on shared latrines in Lao PDR and Indonesia are sig-nificantly higher, with a BCR of at least 5. Public and com-munal toilets have a return of 3 in Indonesia and at least 5 in Yunnan. In these countries, the share of time savings is considerably diminished due to the travel and waiting time required for shared facilities.
Large differences were found between the ideal and actual performance of most technologies, because some house-holds do not use a latrine over the full life of the hardware—either because of noncompliance or because the hardware itself is not functioning.
Economic Assessment of Sanitation Interventionsvi
Economic Assessment of Sanitation Interventions in Southeast Asia | Executive Summary
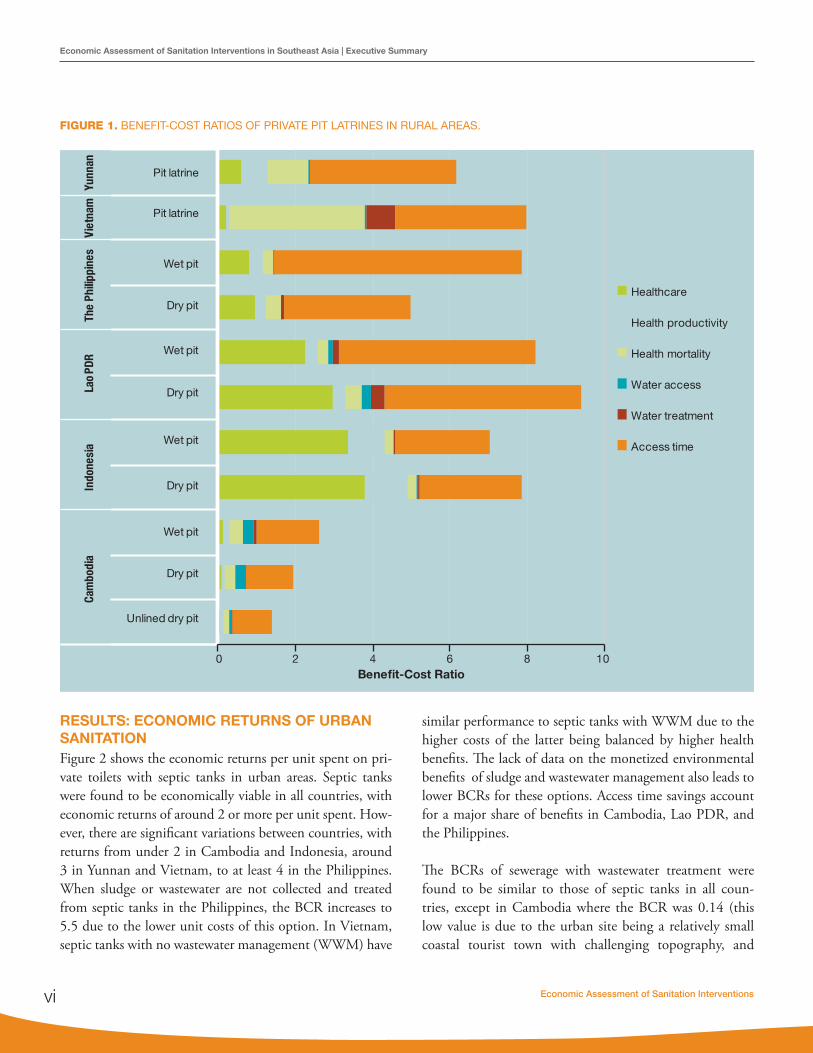
RESULTS: ECONOMIC RETURNS OF URBAN SANITATIONFigure 2 shows the economic returns per unit spent on pri-vate toilets with septic tanks in urban areas. Septic tanks were found to be economically viable in all countries, with economic returns of around 2 or more per unit spent. How-ever, there are significant variations between countries, with returns from under 2 in Cambodia and Indonesia, around 3 in Yunnan and Vietnam, to at least 4 in the Philippines. When sludge or wastewater are not collected and treated from septic tanks in the Philippines, the BCR increases to 5.5 due to the lower unit costs of this option. In Vietnam, septic tanks with no wastewater management (WWM) have
similar performance to septic tanks with WWM due to the higher costs of the latter being balanced by higher health benefits. The lack of data on the monetized environmental benefits of sludge and wastewater management also leads to lower BCRs for these options. Access time savings account for a major share of benefits in Cambodia, Lao PDR, and the Philippines.
The BCRs of sewerage with wastewater treatment were found to be similar to those of septic tanks in all coun-tries, except in Cambodia where the BCR was 0.14 (this low value is due to the urban site being a relatively small coastal tourist town with challenging topography, and
0 2 4 6 8 10
Unlined dry pit
Dry pit
Wet pit
Dry pit
Wet pit
Dry pit
Wet pit
Dry pit
Wet pit
Pit latrine
Pit latrine
Cam
bodi
aIn
done
sia
Lao
PDR
The
Phili
ppin
esVi
etna
mYu
nnan
Benefit-Cost Ratio
Healthcare
Health productivity
Health mortality
Water access
Water treatment
Access time
FIGURE 1. BENEFIT-COST RATIOS OF PRIVATE PIT LATRINES IN RURAL AREAS.

www.wsp.org vii
Economic Assessment of Sanitation Interventions in Southeast Asia | Executive Summary
many potential benefits, such as tourism, were not valued). At most sites assessed, wastewater treatment plants release the treated wastewater into the environment. In Vietnam, on the other hand, wastewater is reused and hence has a value that represents almost half of the costs, or about one-sixth of the benefits.
Shared and public toilets remain important options for a significant share of the countries’ urban populations, and ranged from 5% to 24% in the year 2010. Economic re-turns varied from a BCR of 1.5 in Indonesia (public toi-lets), to 2.5 in Yunnan (shared toilet with septic tanks), and 6 in Lao PDR (shared pit latrines). Because less time
is saved by using shared latrines, their contribution to time saved as part of overall economic benefits is lower than that provided by private toilets.
Significant differences were found between ideal and actual performance for two main reasons. First—as rural areas—some households do not use the latrine over the full life of the hardware, either because they do not wish to change their be-havior or because the hardware no longer functions properly. Second, off-site systems for sludge and wastewater transport and treatment are not used to their full capacity. A common problem across countries is the low connection rate of house-holds to sewer systems.
FIGURE 2. BENEFIT-COST RATIOS OF PRIVATE TOILETS WITH SEPTIC TANK, URBAN AREAS.
0 10
Septic tank
Septic tank
Septic tank
Septic tank(no WWM)
Septic tank(WWM)
Septic tank(no WWM)
Septic tank(WWM)
Septic tank
Cam
bodi
aIn
done
sia
Lao
PDR
The
Phili
ppin
esVi
etna
mYu
nnan
Benefit-Cost Ratio
Healthcare
Health productivity
Health mortality
Water access
Water treatment
Access time
0 2 4 6 8

Economic Assessment of Sanitation Interventionsviii
Economic Assessment of Sanitation Interventions in Southeast Asia | Executive Summary
NONMONETIZED RETURNS OF SANITATIONSeveral benefits of sanitation were excluded from the monetary estimates presented above, including the environmental ben-efits of proper sludge and wastewater management. Evidence on others is presented below. Improved sanitation significantly reduces the transmission of fecal-related diseases—the main disease being diarrhea—and associated premature mortality. Sanitation is also effective in preventing intestinal nematodes and reducing diseases associated with childhood malnutrition, which is linked to repeated diarrheal episodes and enteropathy. There is a widely adopted method for aggregating a range of diseases with different levels of severity, and diseases that have different case fatality rates. The cost per DALY averted is how much spending it takes to gain one year of life that is entirely free from disability. According to the World Health Organiza-tion, a health-improving intervention with a cost per DALY of less than the GDP per capita reflects a very cost-effective use of funds for health interventions, whereas a cost per DALY of between 1 and 3 times the GDP per capita is still considered a cost-effective use of funds for health interventions.
In rural areas, the cost per DALY averted differs signifi-cantly between country and between technologies used. In Cambodia and Lao PDR, a DALY can be averted for less than US$500, which reflects a very cost-effective health in-tervention. In Indonesia and Yunnan, the costs per DALY averted for both pit latrines and septic tanks are also low-er than the GDP per capita, as is the case for pit latrines in Vietnam. Options with a cost per DALY of between 1 and 3 times the GDP per capita include pit latrines in the Philippines and septic tanks in Vietnam, reflecting a cost-effective use of health resources. Septic tanks in Lao PDR and the Philippines have a cost per DALY averted of greater than 3 times the GDP per country; hence in these cases the health arguments alone cannot justify public budget expen-diture on interventions that are based on the international thresholds defined above.
In urban areas, the cost per DALY averted was significant-ly higher than in rural areas, due to the higher cost of the sanitation interventions and the lower potential for health benefits compared to rural areas. Using the same thresholds defined above, pit latrines reflect a cost-effective interven-tion in the urban areas of all countries except Vietnam, where they are very cost-effective. Septic tanks reflect a cost-
effective intervention in Yunnan, Indonesia, and Cambodia, and very cost-effective intervention in Vietnam. Sewerage is a cost-effective intervention only in Indonesia and Vietnam.
The personal and social welfare impacts of sanitation were assessed using a variety of approaches. The reasons why households have or do not have toilets were examined, and many were found to recur across the countries, but often in a different order of importance. “Time savings” and “convenience” were ranked among the top responses in four countries and as a lower-ranked response in In-donesia, but not ranked at all in the Philippines. Con-venience includes not having to get up early, not having to leave children unattended, and not having to seek a place to defecate while it is raining. “Safety” is considered important in five countries, especially for women and at nighttime. Linked to this is “privacy” (including shyness and embarrassment), which was mentioned in four of the six countries. “Health,” “hygiene,” and “sanitary environ-ment” are reasons cited, or hinted at (e.g., “clean,” “no flies”), in all countries. “Aesthetic” aspects were also men-tioned (pollution, no smell, environmental protection) in most countries. Having a toilet also gives some house-holds a sense of pride, including being able to offer visitors a place to use the toilet. In two countries, households said they have a toilet because they received it from a project.
The most commonly cited reason why households do not have toilets was the high cost of a latrine. This finding is confirmed by the relatively high cost of even pit latrines as a proportion of the local wages in some countries. For ex-ample, the full investment costs of an improved dry pit la-trine, as a proportion of the average GDP per capita (which is a conservative proxy of the average wage in a country) were 21% in Cambodia, 4% in Indonesia, 2% in Lao PDR and the Philippines, 11% in Vietnam, and 7% in Yunnan. These percentages reflect the proportion of a household’s income that would need to be spent on a dry pit latrine, if that household earned the same as the GDP per capita. These percentages are in fact a lower limit for the lowest income groups, which are most likely to have a total house-hold (cash) income of below the GDP per capita, especially in rural areas. Furthermore, these percentages refer to dry pit latrines, which have the lowest investment cost of any

www.wsp.org ix
Economic Assessment of Sanitation Interventions in Southeast Asia | Executive Summary
sanitation option across all countries. On the other hand, these costs reflect the full investment costs and not what households themselves at the sites spent, due to interven-tions being cofinanced by governments or donors.
The lack of land on which to build a pit latrine and a lack of space in dwellings for a toilet room are important non-financial barriers to owning a toilet, especially in urban areas. Other context-specific constraints include a lack of water for flushing and the risk of flooding on low-lying land. For fami-lies renting their dwelling, there is little incentive to invest in a toilet. Some do not feel the need as they use someone else’s facility or a public facility. Other cited reasons include: ignorance about toilets (“never thought about it”); the fact that they are not accustomed to latrines; and households not wanting to use a latrine either because they are content with their traditional practice, or because they have had bad ex-periences with smelly latrines. The “recipient” mentality is echoed in all countries—many respondents stated that they do not have a toilet because they have never been offered one.
However, having a toilet facility at home does not guarantee that families will use it, or that it will be used by all house-hold members. This might be because a toilet facility does not meet the expectations of a family or some of its mem-bers. This is especially the case for sanitation programs that do not sufficiently raise awareness or generate demand for toilets, and those that deliver construct a type of toilet that families do not like. In some cases, it may be because the toilet is not sufficiently cleaned and maintained, becoming unpleasant (e.g., smelly) or dangerous to use.
SUMMARY OF MAIN FINDINGSSanitation has been shown to have significant economic and social returns in the six countries of this study. The significant amount of economic evidence collected in a diversity of urban and rural settings indicates that benefits exceed costs in almost all cases. In five out of six countries, BCRs were at least five in rural areas and at least three in urban areas. Inclusion and valuation of sanitation benefits was conservative throughout the analysis. Some benefits were omitted from the BCR but shown to be important to households. These intangible welfare benefits include dig-nity, comfort, prestige, security, gender equality, house-
hold cleanliness, and aesthetics of the community envi-ronment. Hence the quantified estimates presented in the cost-benefit analysis ignore several important benefits of improved sanitation.
The study has shown significant differences between ide-al and actual economic performance. Hence, in order to capture maximum economic benefit, programs and tech-nologies have to be effective, demanded, and sustainable. Economic performance declines when a facility is not used by some or all family members, or falls into disrepair due to hardware breakdown or because the pit or tank is not emptied. Sewerage networks and wastewater treatment plants are characterized by low usage, leading to reduced economic performance.
The variation in economic performance between different technologies and programs in different field contexts indi-cates that it is crucial for decision makers to have a good un-derstanding of the costs and benefits of sanitation in their specific context. Economic performance results have often been counterintuitive, such as annualized costs of shared latrines exceeding private latrines. Households consider-ing upgrading from one sanitation option to another (e.g., moving from shared to private latrine, or from dry pit to wet pit latrine) will not face the same marginal costs and benefits as those that currently have no option.
Sanitation is known to be fundamental to the welfare of everybody, whether it be at home, in school, at work or in public spaces. The quality of a country’s sanitation can af-fect its reputation in the world, most notably with foreign visitors (who are responsible for valuable foreign earnings that directly account for as much as 10% of GDP) and with foreign companies bringing in the key investments and know-how that are linked to economic growth. Hence, good sanitation contributes to economic growth.
Given the strong correlation between income level and sanitation coverage, public sanitation programs targeted to those households without access to a basic level of house-hold sanitation are likely to have a positive redistributive effect in society. However, the actual impact on the poor depends on the mechanisms that exist at project level to en-

Economic Assessment of Sanitation Interventionsx
Economic Assessment of Sanitation Interventions in Southeast Asia | Executive Summary
sure that poor households adopt improved sanitation. This includes awareness-raising, demand creation, and financing measures to ensure that poorer households are not left be-hind.
RECOMMENDATIONSThe present study has presented evidence on the costs and benefits of sanitation improvements in different program-matic and geographical contexts in Southeast Asia. This evidence enables explicit comparison of sanitation options on the basis of their relative merits and thus informs both public and private decisions on sanitation investment. The following six recommendations are based on the key find-ings of the study.
1. The high socioeconomic returns of sanitation in-vestment indicate that it should be promoted as a central development priority. The economic evi-dence generated in this study has demonstrated the importance of improved sanitation for a number of development outcomes, including public health, the natural environment, education, economic develop-ment, social outcomes, gender equality, and poverty alleviation. Improved evidence on the costs of sanita-tion and those potentially willing to pay for it, gives an evidence base for sanitation planners and provid-ers on which to estimate the market size for sanita-tion goods and services. Financiers, however, need to be confident that the funds will be put to good use. Rational and realistic sanitation plans need to be drawn up, detailing the costs of achieving sani-tation scale-up and the realistic expected financing sources. Different financiers and program imple-menters should be approached on the basis of this evidence, to seek both further funds for sanitation and mechanisms to ensure efficient service delivery. Furthermore, a dialogue needs to be started with a range of public financiers, including nontraditional ones. Pressure can be brought on financiers by uti-lizing the media and advocacy groups for human rights, women’s welfare, water, sanitation, and the environment. Key line ministries and government departments that particularly need to buy into sani-tation are those responsible for education, health, workplace conditions, water resources management,
municipal services, rural development, and tourism.2. Sanitation program/project proposals that use
public funds should be scrutinized more closely to ensure maximum chances of success and a high degree of efficiency. At the planning phase, policy-makers need to improve program design and pro-curement processes, and implementers need to be aware of the conditions of success and to conduct real-time monitoring. Decisions about investment in sanitation need to be based on evidence of the com-parative returns of different approaches. These cover both the delivery approach (how to get households to adopt some form of improved sanitation) and the technology used, which can vary significantly in terms of cost and impact. Only in this way will the full benefits of investment be reaped.
3. Evidence-based decision making should be pro-moted widely. To achieve this, a combination of measures is proposed: (1) decision makers are trained in advanced methods of planning, which include economic and financial analysis; (2) decision makers across different departments and jurisdictions are en-couraged to work together in a transparent manner and to utilize evidence to solve common issues; (3) evidence is made available, stored in easy-to-access databases, and presented in an easy-to-digest format; and (4) evidence is updated—at least annually—to ensure that it is relevant to ongoing decisions.
4. Financial innovations need to be further devel-oped and implemented to promote a sustainable market-based supply of sanitation services. This includes mechanisms to reach the most needy popu-lations. Given that households—even poor ones—are usually able and willing to pay small but regular payments, governments and microfinancing agents should help to finance these upfront payments. Some or all of the costs can then be repaid over the lifetime of the hardware, depending on the subsidy available. Many prior examples exist to help plan fu-ture programs. In settings where poor households are not willing to enter into a contractual arrangement, or financing is not available, lower-cost sanitation options can be utilized as a stop-gap measure until the households can finance a higher quality sanita-tion installation.

www.wsp.org xi
Economic Assessment of Sanitation Interventions in Southeast Asia | Executive Summary
5. Considerable further attention should be given to making programs more responsive to population demand in order to achieve their objectives. Sanita-tion programs need to be more people-centered: they need to be demand-driven. Public decision makers and private suppliers should make available different sanitation options, so that individuals and commu-nities themselves can weigh their costs and benefits, and they can be supported in this decision-making process. Low-cost and proven effective and sustain-able approaches to household sanitation improve-ment should especially be promoted. Women need to be given at least as much voice as men; the needs of the elderly, children, and people who are physi-cally impaired need to be considered, and adapted sanitation options offered (such as extra space and railings). Sanitation programs should contain infor-mation campaigns on the benefits of sanitation and hygiene, standards of practice, and the importance of continued behavior change and maintenance. The delivery of technology should be accompanied by technical guides and instruction manuals of differ-ent levels of complexity (e.g., one for the supplier, and another for the user). The various financing and technical assistance partners should ensure that they apply and respect the national sanitation policy and technical guidelines, and they should coordinate among themselves and share best practice.
6. An evidence base needs to be built and used op-portunistically to support better decision making. Evidence includes not only focused research but also improved monitoring and evaluation of sanitation programs and routine information systems. Where funds are available, impact evaluations of projects and programs are highly valuable in that they en-able an understanding of the determinants of sanita-tion impacts under real-life conditions. The evidence generated needs to be customized for different au-diences, and targeted toward those audiences with technical and learning support. Disaggregations of cost (hardware investment versus program support versus operations versus maintenance) are needed to improve budgeting and the efficient allocation of funds. A breakdown of the main benefits by ben-eficiaries will also enable programs to be more tar-
geted and effective in maximizing benefits. As well as the monetized benefits, the strength of preference for different sanitation types needs to be known to avoid promoting the wrong solutions. Finally, better quantification of environmental impacts is needed to support stronger regulations and practices in relation to pollution discharge.


www.wsp.org xiii
Foreword
Millennium Development Goal target 10 recognizes access to safe sanitation as a key aspect of human development: “Halve, by 2015, the proportion of the population without sustainable access to safe drinking water and basic sanita-tion.” The current discussions on the post-2015 develop-ment agenda consistently mention universal sanitation as necessary and achievable in the next phase of global de-velopment. This reflects the fact that access to improved sanitation is a basic need: at home, in the workplace, and at school, people appreciate and value a clean, safe, private, and convenient place to urinate and defecate. Good sanita-tion also contributes importantly to achieving other devel-opment goals, including those related to child mortality, school enrolment, nutritional status, gender equality, clean drinking water, environmental sustainability, and the qual-ity of life of slum dwellers.
Since the baseline year of the MDG framework there has been considerable progress in sanitation coverage, from 49% (1990) to 64% (2012) globally. Including shared sani-tation boosts those coverage numbers to 55% (1990) and 75% (2012). Despite this progress, the world remains off target to meet the MDG target by 2015, by at least 8 per-centage points. Open defecation continued to be practiced by 14% of the world’s population in 2012, compared to 24% in 1990. At regional level, progress has been signifi-cantly slower in the sub-Saharan Africa and Oceania regions than in the rest of the world, and coverage of improved sanitation remains below 50% in South Asia, sub-Saharan Africa and Oceania. In Southeast Asia, three in 10 house-holds do not have their own safe place to defecate, and 13% still practice open defecation. At least half of these numbers are accounted for by the region’s largest country, Indonesia.
Despite its recognized importance in global development, and now by many policymakers in countries with low cov-erage, sanitation continues to lose ground to other devel-
opment targets when it comes to real political and budget support on the ground by both governments and influen-tial external partners (such as donors). However, thanks to the MDG target and the International Year of Sanita-tion in 2008, the topic of sanitation has emerged from the shadows, having previously been a largely taboo or ignored subject. In addition, more and more evidence is becoming available on the links between sanitation and other priority development outcomes, such as economic growth, health, nutrition, gender, and equality.
Having produced economic impact evidence on all conti-nents since its initiation in 2006, the Economics of Sanita-tion Initiative (ESI) of the World Bank’s Water and Sanita-tion Program (WSP) has indeed contributed to this new wave of concrete evidence. The overall aim of the ESI is to assist decision makers at different levels to make informed choices on sanitation policies and resource allocation. The initial phase of the ESI focused on measuring the economic impacts of inadequate sanitation, demonstrating that the economic impacts of poor sanitation amount to an average of 2% of annual GDP across five Southeast Asian countries. The next set of country studies synthesized in this report ex-amined in greater depth the economic returns of alternative sanitation options in a range of field settings. This evidence supports policymakers and program implementers to make specific hardware and software choices to achieve greater efficiency. Individual studies have been published for each country, while the purpose of the current report is to sum-marize and compare the results across several countries of Southeast Asia.

Economic Assessment of Sanitation Interventionsxiv
Abbreviations BCR benefit-cost ratio
CBA cost-benefit analysis
CEA cost-effectiveness analysis
CER cost-effectiveness ratio
CLTS Community-Led Total Sanitation
DALY disability-adjusted life year
DHS demographic and health survey
Ecosan ecological sanitation
ESI Economics of Sanitation Initiative
FGD focus group discussion
GDP gross domestic product
IRR internal rate of return
JMP Joint Monitoring Programme (WHO, UNICEF)
MDG Millennium Development Goal
NGO nongovernmental organization
OD open defecation
STH soil-transmitted helminthes
UDDT urine diversion dehydration toilets
UNICEF United Nations Children’s Fund
VSL value of statistical life

www.wsp.org xv
WHO World Health Organization
WSP Water and Sanitation Program
WWM wastewater management
WWTP wastewater treatment plant
Economic Assessment of Sanitation Interventions in Southeast Asia | Abbreviations

Economic Assessment of Sanitation Interventionsxvi
Glossary of Terms Benefit-cost ratio (BCR): the ratio of the present value of the stream of benefits to the present value of the stream of costs. A higher BCR suggests a more efficient intervention (not considering unquantified costs and benefits that may vary between interventions).
Cost per case averted: the discounted value of the costs for each case of a disease that is avoided because of an intervention.
Cost per DALY averted: the discounted value of the costs for each DALY that is avoided because of an intervention.
Cost per death averted: the discounted value of the costs for each death that is avoided because of an intervention.
Cost-effectiveness ratio (CER): the ratio of the present value of the future costs to the present value of the future health benefits in nonmonetary units (cases, deaths, DALYs). The lower the CER the more efficient the intervention (not considering unquantified costs and health benefits that may vary between interventions).
Disability-adjusted life year (DALY): a measurement of the gap between current health status and an ideal health situation where the entire population lives to an advanced age, free of disease and disability. One DALY can be thought of as one lost year of “healthy” life (WHO 2010).
Ecological sanitation (EcoSan): an approach that recognizes the value of the recoverable resources from human excreta and wastewater, with collection, treatment where necessary, and safe reuse.
Improved sanitation: the use of the following facilities in the home compound: flush/pour-flush to piped sewer system/septic tank/pit latrine; ventilated improved pit latrine; pit latrine with slab; or composting toilet (e.g., Ecosan) (JMP 2008).
Shared sanitation facilities: sanitation facilities of an otherwise acceptable type shared between two or more households. Only facilities that are not shared or are not public are considered improved in monitoring Millennium Development Goal target 7C (JMP 2008).
Open defecation: the practice of disposing of human feces in fields, forests, bushes, open bodies of water, beaches, or other open spaces, or disposed together with solid waste (JMP 2008).
Intangible benefits: benefits of improved sanitation that are difficult to quantify. These include impacts on the quality of life, comfort, security, dignity, and personal and cultural preferences.

www.wsp.org xvii
Internal rate of return (IRR): the discount rate for which the present value of the stream of net benefits is zero. In other words, it is the discount rate that forces the BCR to equal unity (1.0).
Net benefit: the difference between the present value of the stream of benefits to the present value of the stream of costs.
Net present value: the discounted value of the current and future stream of net benefits from a project.
Payback period: the number of months and years that are necessary to recover the costs incurred from an intervention.
Unimproved sanitation: the use of the following facilities anywhere: flush/pour flush without isolation or treatment; pit latrine without slab/open pit; bucket; hanging toilet/hanging latrine; use of a public facility or sharing any improved facility; no facilities, bush or field (open defecation) (JMP 2008).
Economic Assessment of Sanitation Interventions in Southeast Asia | Glossary of Terms
Economic Assessment of Sanitation Interventionsxviii
Acknowledgments The study was led by the World Bank’s Water and Sanitation Program (WSP), with the contribution of WSP teams and consultants in each of the participating countries.
Guy Hutton (WSP Senior Economist and Task Team Leader) led the development of the concept and methodology for the ESI, the management and coordination of the country teams, the provision of regional tools and templates, and the drafting of the synthesis report. Bjorn Larsen contributed to the development of generic data collection tools and the health methodology. The consultant teams in each country were as follows:
• Cambodia:The staffof theEconomic InstituteofCambodia (EIC) ledbySamSokHeng,withcontributions from Pok Kong Chheng and the survey team.
• Indonesia:ThestaffofPTMitraLingkunganDutaconsult(MLD)IndonesialedbyAsepWinara,with contributions from Oktarinda, Edi Purnomo, Koderi Hadiwardoyo, Indon Merdykasari, Takdir Nurmadi, Bert Bruinsma, and Dedek Gunawan. The study was supervised by Dadang Fadilah. Water quality monitoring was conducted by PT SUCOFINDO laboratories.
• LaoPDR:GeoSysLaoPDRconductedthefieldwork,ledbyAlanBoatman.Thefieldteamconsistedof Stephanie Cohen, Frederic De San, and Vilaythong Chanthalinh. U-Primo Rodriguez (WSP Consultant) was responsible for the economic analysis and completing the write-up of the report.
• ThePhilippines:U-PrimoRodriguez (WSPConsultant)was the team lead, supportedbyNelissaJamora (WSP Consultant) and Jeremy Ockelford (WSP Consultant). The survey was implemented by the Resources, Environment, and Economics Center for Studies, Inc. (REECS) and Consultants for Engineering Science and Technology, Inc. (CEST) under the leadership of Dieldre Harder. Members of the survey team were Mike Vergara, Carmela Taguiam, Christine Leda-Paatan, Malou Eugenio, Lhea Santos, Ailene Gabrillo, Brenda Fe Quiapos, Aileen Gay Casem, Liezel Sembran, Clarissa Andrade, Rowena Sorigo, Marita Rosaot, Bonifacio Sope, David Longao, Catherine Cuico, Donald Bracamonte, Liza Laus, Milagrena Baguio, Arianne Golez, Donald Chiu, Lito Lomonggo, Nicolas Elemia, Louisa Bite, Jelyn Doctor, Razella Hufancia, Teresita Fernandez, Norlyn Sareno, Catherine Bolante, Joel Doctor, Jefferson Apuada, and Temistocles Rigor. The water quality survey was conducted by Intertek Testing Services Phils, led by Sandra Bucal and Mines Mercado. Other members of the water survey team were Francis Legaspi, Grace Milan, Fred Buot, Edmy de la Vega, Rod Zapanta, and Ricky Namay.

www.wsp.org xix
• Vietnam:Staffoftheleadresearchagency,theInstituteofEnvironmentalScienceandEngineering(IESE), were led by Nguyen Viet Anh, and supported by the Research Centre for Family Health and Community Development (CEFACOM). Staff involved in the study included Hoang Thuy Lan, Phan Huyen Dan, Nguyen Hoang Yen, Le Thu Hoa, Le Thu Hang, Bui Nhung, Nguyen Huu Tuyen, Nguyen Phuong Thao, Tran Kong Khanh, and Hoang Van Minh. In addition, more than 40 contractors were mobilized in field surveys in different provinces throughout the country. The water quality surveys were conducted by laboratories at the National Center for Rural Water Supply and Environmental Sanitation (NCERWASS), Hue National University, and National University in Ho Chi Minh City.
• Yunnan Province, China: The study was supported by the Yunnan Environmental ProtectionDepartment (YEPD). Zhou Bo led project preparation and coordination of field studies and Yang Liqiong and Zhang Pu provided support. Yunnan Academy of Social Sciences (YASS) conducted the research and report writing under the leadership of Liang Chuan. The YASS research team was Fang Jinmin, Dong Di, Dong Lin, Luo Ronghuai, Zhang Tiwei, Zou Yahui, Wang Jing, and Zhouzheng Yuxiao.
The study benefited from the continuous support of WSP country staff: Phyrum Kov and Phalla Yin (Cambodia); Martin Albrecht (Indonesia); Viengsamay Vongkhamsao and Viengsompasong Inthavong (Lao PDR); EdKarl Galing, Leila Elvas, Shiela del Torres, and Emma Boucart (the Philippines); and Nguyen Diem Hang and Hoang Anh Nga (Vietnam).
Regional WSP staff provided valuable support to the overall concept and the country studies: Almud Weitz, Isabel Blackett, Yosa Yuliarsa, Irvan Tjondronegoro, and WSP support staff.
The regional report was peer reviewed by Eddy Perez, Craig Kullmann, Paul Procee, and Victor Vazquez. Peer reviewers for each country are sincerely thanked and acknowledged in each report.
The ESI has been financed by the regional component of the Sustainable Sanitation in East Asia (SUSEA) program, which is funded by the Swedish International Development Agency (SIDA). The Asian Development Bank cofinanced the consultant teams in Indonesia, the Philippines, and Vietnam. The study in Yunnan Province (China) was cofinanced by ECO-Asia. WSP and the reports’ authors are grateful to the funding agencies for their support.

Economic Assessment of Sanitation Interventionsxx
Reference for citation:
Hutton, Guy, U-Primo Rodriguez, Asep Winara, Nguyen Viet Anh, Sam Sok Heng, Kov Phyrum, Liang Chuan, Isabel Blackett, and Almud Weitz. 2014. Economic Assessment of Sanitation Interventions in Southeast Asia. Technical Paper. Washington, DC: World Bank.
The synthesis study has also been published in an academic journal: Hutton G., U.P. Rodriguez, A. Winara, V.A. Nguyen, P. Kov, L. Chuan, I. Blackett, and A. Weitz. 2014. “Economic Efficiency of Sanitation Interventions in Southeast Asia.” Journal of Water, Sanitation and Hygiene in Development 4(1): 23-26.
Other country reports:
Heng, Sam Sok, Guy Hutton, Poch Kongchheng, and Phyrum Kov. 2012. Economic Assessment of Sanitation Interventions in Cambodia. Technical Paper. Washington, DC: World Bank.
Winara, Asep, Guy Hutton, Oktarinda, Edi Purnomo, Koderi Hadiwardoyo, Indon Merdykasari, Takdir Nurmadi, Bert Bruinsma, Dedek Gunawan, Dadang Fadilah, and Martin Albrecht. 2011. Economic Assessment of Sanitation Interventions in Indonesia. Washington, DC: World Bank.
Rodriguez, U-Primo, Guy Hutton, and Alan Boatman. 2012. Economic Assessment of Sanitation Interventions in Lao People’s Democratic Republic. Washington, DC: World Bank.
Rodriguez, U-Primo, Guy Hutton, Nelissa Jamora, Dieldre Harder, Jeremy Ockelford and EdKarl Galing. 2011. Economic Assessment of Sanitation Interventions in the Philippines. Washington, DC: World Bank.
Viet Anh, Nguyen, Guy Hutton, Hoang Thuy Lan, Phan Huyen Dan, Le Thu Hoa, Bui Thi Nhung. 2012. Economic Assessment of Sanitation Interventions in Vietnam. Washington, DC: World Bank.
Chuan, Liang, Guy Hutton, Yang Liqiong, Fang Jinming, Zhang Tiwei, Dong Lin, Zhang Pu, Luo Ronghuai. 2012. Economic Assessment of Sanitation Interventions in Yunnan Province, People’s Republic of China. Washington, DC: World Bank.
Summary reports are available for each country, in both English and in the local languages. All country reports are accessible from http://www.wsp.org/esi.

www.wsp.org xxi
ContentExecutive Summary ...................................................................................................................................... iiiForeword ..................................................................................................................................................... xiiiAbbreviations ..............................................................................................................................................xivGlossary of Terms .......................................................................................................................................xviAcknowledgments .................................................................................................................................... xviiiContent .......................................................................................................................................................xxiSelected Development Indicators ........................................................................................................... xxivI. Introduction ............................................................................................................................................. 1II. Study Aims ............................................................................................................................................. 4
2.1 Aims ................................................................................................................................................. 42.2 Methodology Overview ..................................................................................................................... 52.3 Study Design And Survey Locations ................................................................................................. 62.4 Sanitation Interventions Evaluated ..................................................................................................... 72.5 Costs And Benefits Included ............................................................................................................. 82.6 Data Analysis .................................................................................................................................. 10
III. Economic Returns of Sanitation ......................................................................................................... 113.1 Monetized Returns Of Sanitation ..................................................................................................... 113.2 Nonmonetized Benefits Of Sanitation .............................................................................................. 233.3 Wider Benefits Of Sanitation ........................................................................................................... 32
IV. Issues in Decision Making ................................................................................................................... 354.1 Making Use Of The Study Results ................................................................................................... 354.2 Nationwide Generalizability Of The Results ...................................................................................... 364.3 Affordability And Sanitation Financing ............................................................................................... 384.4 Distributional Impacts ...................................................................................................................... 394.5 Sanitation Policies And Programming ............................................................................................... 41
V. Recommendations .............................................................................................................................. 42References .................................................................................................................................................. 46 Annex: Estimation and Survey Methodologies .......................................................................................... 49
A1 Field site selection ........................................................................................................................... 49A2 Cost estimation ............................................................................................................................... 49A3 Benefit estimation (field level) ........................................................................................................... 51A4 Benefit estimation (national level) ..................................................................................................... 60A5 Data collection instruments ............................................................................................................. 61

Economic Assessment of Sanitation Interventionsxxii
List of TablesTable 1. Sanitation targets in study countries .......................................................................................... 2Table 2. Number of field sites per country .............................................................................................. 7Table 3. Benefits of improved sanitation included in this study ............................................................... 9Table 4. Factors explaining sanitation coverage and lack of coverage .................................................. 26Table 5. Concerns of those practicing open defecation (% of responses) ............................................. 27Table 6. Continuing poor sanitation practices of households with toilets (% of responses) ..................... 28Table 7. Pollution caused by sanitation facilities (% of respondents) ..................................................... 29Table 8. Tourist arrival statistics and importance to the economy and employment, 2011 .................... 32Table 9. Sanitary experience of visitors in different places (scale 0–100; 100 = very good) ................... 32Table 10. Availability of public toilets and sanitary experience of visitors .................................................. 33Table 11. Gastrointestinal illnesses—frequency, days of illness, and medical treatment cost ................... 33Table 12. Stated health concerns, proportion of respondents citing each factor (max. 3 per respondent) .. 34Table 13. Visitors’ hesitancy to return, and importance of poor sanitation as a reason ............................ 34Table 14. Importance of different factors for business location and revenues ......................................... 34Table 15. Summary assessment of features of field sites and their generalizability ................................... 36Table 16. Summary assessment of features of tourism and business surveys and their generalizability ... 37Table 17. Summary of total investment and annual recurrent costs per household ................................. 38
www.wsp.org xxiii
List of FiguresFigure 1: Coverage of improved sanitation in 2011: Percentages of households by country .................. 1Figure 2: Flow of data collected and eventual cost-benefit assessments (outputs) .............................. 6Figure 3: Representation of the pathway of sanitation improvements .................................................... 8Figure 4: Benefit-cost ratios of private pit latrines in rural areas ........................................................... 12Figure 5: Benefit-cost ratios of private toilets with septic tank and/or sewerage in rural areas ............ 13Figure 6: Benefit-cost ratios of private toilets with reuse options in rural areas..................................... 14Figure 7: Benefit-cost ratios of shared or public toilets in rural areas ................................................... 14Figure 8: Benefit-cost ratios of sanitation options in Cambodia, rural sites .......................................... 15Figure 9: Benefit-cost ratios of sanitation options in Indonesia, rural sites ........................................... 15Figure 10: Benefit-cost ratios of sanitation options in Lao PDR, rural sites ............................................ 16Figure 11: Benefit-cost ratios of sanitation options in the Philippines, rural sites .................................... 16Figure 12: Benefit-cost ratios of sanitation options in Vietnam, rural sites .............................................. 17Figure 13: Benefit-cost ratios of sanitation options in Yunnan (China), rural sites ................................... 17Figure 14: Benefit-cost ratios of private toilets with septic tank, urban areas ......................................... 18Figure 15: Benefit-cost ratios of private toilets with sewerage, urban areas ........................................... 19Figure 16: Benefit-cost ratios of private wet pit latrines in urban areas .................................................. 19Figure 17: Benefit-cost ratios of shared or public toilets in urban areas ................................................. 20Figure 18: Benefit-cost ratios of sanitation options in Cambodia, urban sites ........................................ 21Figure 19: Benefit-cost ratios of sanitation options in Indonesia, urban sites ......................................... 22Figure 20: Benefit-cost ratios of sanitation options in Lao PDR, urban sites .......................................... 22Figure 21: Benefit-cost ratios of sanitation options in the Philippines, urban sites .................................. 22Figure 22: Benefit-cost ratios of sanitation options in Vietnam, urban sites ........................................... 23Figure 23: Benefit-cost ratios of sanitation options in Yunnan Province, urban sites .............................. 23Figure 24: Cost per DALY averted for selected technology options, rural sites ...................................... 24Figure 25: Cost per DALY averted for selected technology options, urban sites .................................... 25Figure 26: E. Coli readings of samples from open water sources and wells, the Philippines (all sites)..... 29Figure 27: Comparison of E. Coli readings in high sanitation coverage villages (left) with low
sanitation coverage villages (right) ........................................................................................ 30Figure 28: E. Coli readings from Quibei rural and urban sites, Yunnan Province, China .......................... 30Figure 29: Perceived quality of the environment relating to open defecation and open canals
and sewers (100% = very good environment) ....................................................................... 31Figure 30: Financial investment costs of sanitation in rural and urban areas as a proportion of
two measures of annual income (minimum wage and GDP per capita) ................................. 38Figure 31: Benefit cost ratios (left) and cost per DALY averted (right) for different income
groups in the Philippines ...................................................................................................... 40

Key Development Indicators
Variables Cambodia Indonesia Lao PDR The Phillippines Vietnam
Yunnan Province (China)
Population
Total population (million) 13.4 237.6 6.2 90.5 85.8 45.4
Rural population (% total) 80.5% 50.2% 68.0% 49.2% 70.4% 76.6%
Urban population (% total) 19.5% 49.8% 32.0% 50.8% 29.6% 23.4%
Annual population growth 1.54% 1.49% 2.0% 2.0% 1.2% 0.63%
Under 5 population (% total population)
10.3% 7.8% 12.5% 12.6% 7.8% 26.0%2
Under 5 mortality rate (deaths per 1,000)1
46 33 44 26 23 162
Population living below poverty line
30.1% 14.2% 33.9% 32.9% 15.5% 6.4%
Economic data
Currency name Riel (KHR) Rupiah (IDR) Kip (LAK) Peso (PhP) Dong (VND)Renminbi
Yuan (RMB)
Currency exchange with US$3 4,143 10,387 8,259 44.5 17,400 6.83
GDP per capita (US$) 739 2,925 1,177 1,863 1,024 2,003
GDP per capita (International $) 1,633 4,205 2,460 3,773 3,300 3,336
Sanitation coverage4
Improved total 37% 59% 65% 74% 75% 65%5
Improved rural 25% 46% 50% 69% 67% 56%5
Improved urban 82% 71% 90% 79% 93% 74%5
Year: 2011 unless stated otherwise. Source: ESI country reports, selected variables updated to 2011 data where available.1 WHO data, 2008. 2 For Yunnan province this refers to children under 14 years of age for the year 2000. 3 Exchange rate for the midpoint of the study (December 31st, 2008) is taken. For Lao PDR this was December 31, 2009, as the field study was conducted 1 year later. 4 JMP 2014 reports 2012 estimates. 5 Estimates reflect national level in China (source: JMP 2014).
www.wsp.org 1
I. Introduction
Millennium Development Goal (MDG) target 7C on im-proved drinking water and sanitation has enabled sector stakeholders to gain political support and drive through improved policies in this often neglected sector (World Health Organization 2012). More recently, further support has come from the Human Rights to Water and Sanitation, which were adopted by the United Nations General Assem-bly in 2010 and by the Human Rights Council in 2011 (United Nations 2010; Human Rights Council 2011). The resolutions recognize that water and sanitation are essen-tial for the full enjoyment of life and of all human rights. The UN General Assembly’s resolution calls upon member states to scale up efforts to provide water and sanitation for all. Furthermore, recognizing that greater progress on sani-tation is essential for fighting poverty and for achieving all
the MDGs, the UN Deputy Secretary-General initiated on behalf of the Secretary-General a renewed effort to drive progress on sanitation towards the 2015 target date and be-yond.1
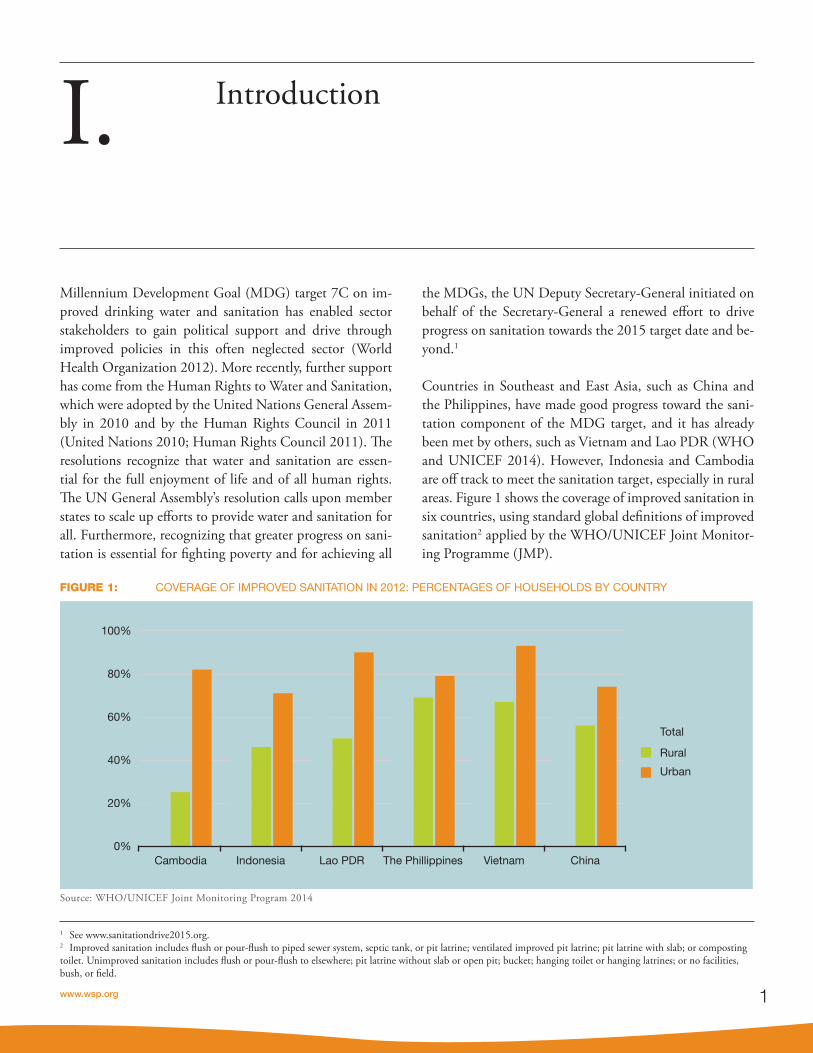
Countries in Southeast and East Asia, such as China and the Philippines, have made good progress toward the sani-tation component of the MDG target, and it has already been met by others, such as Vietnam and Lao PDR (WHO and UNICEF 2014). However, Indonesia and Cambodia are off track to meet the sanitation target, especially in rural areas. Figure 1 shows the coverage of improved sanitation in six countries, using standard global definitions of improved sanitation2 applied by the WHO/UNICEF Joint Monitor-ing Programme (JMP).
0%
20%
40%
60%
80%
100%
Cambodia Indonesia Lao PDR The Phillippines
Total
Rural
Urban
Vietnam China
FIGURE 1: COVERAGE OF IMPROVED SANITATION IN 2012: PERCENTAGES OF HOUSEHOLDS BY COUNTRY
1 See www.sanitationdrive2015.org.2 Improved sanitation includes flush or pour-flush to piped sewer system, septic tank, or pit latrine; ventilated improved pit latrine; pit latrine with slab; or composting toilet. Unimproved sanitation includes flush or pour-flush to elsewhere; pit latrine without slab or open pit; bucket; hanging toilet or hanging latrines; or no facilities, bush, or field.
Source: WHO/UNICEF Joint Monitoring Program 2014
Economic Assessment of Sanitation Interventions2
Economic Assessment of Sanitation Interventions in Southeast Asia | Introduction
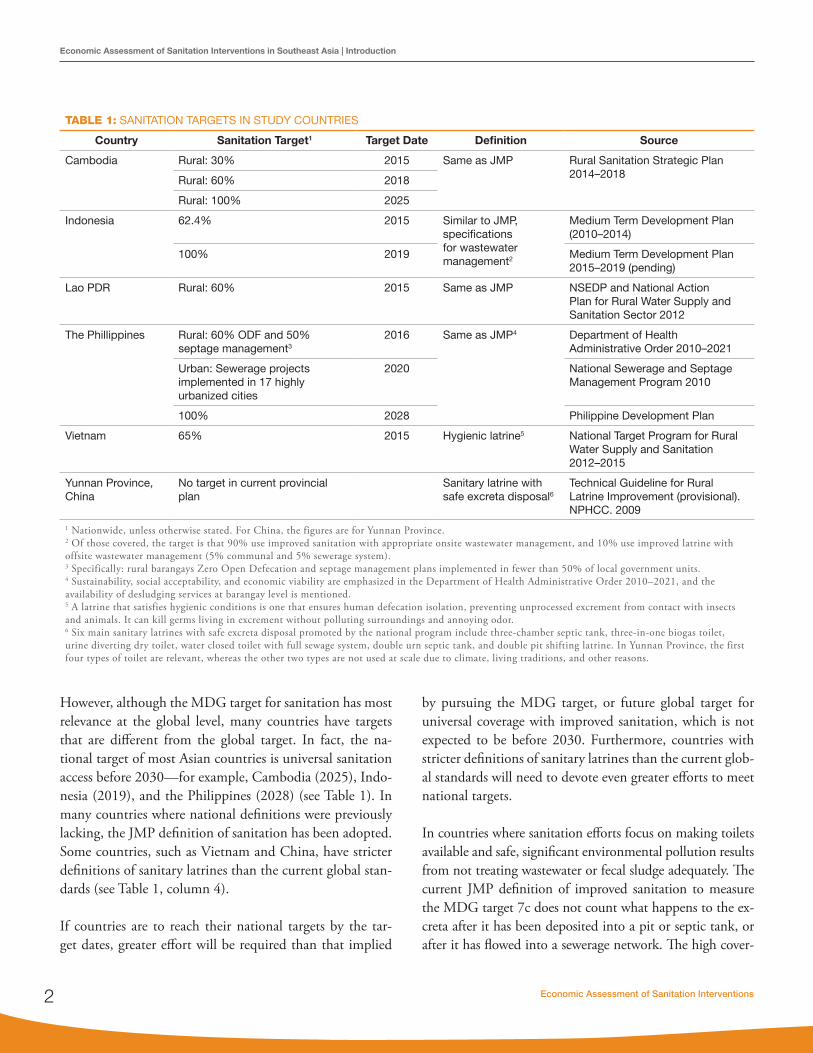
However, although the MDG target for sanitation has most relevance at the global level, many countries have targets that are different from the global target. In fact, the na-tional target of most Asian countries is universal sanitation access before 2030 —for example, Cambodia (2025), Indo-nesia (2019), and the Philippines (2028) (see Table 1). In many countries where national definitions were previously lacking, the JMP definition of sanitation has been adopted. Some countries, such as Vietnam and China, have stricter definitions of sanitary latrines than the current global stan-dards (see Table 1, column 4).
If countries are to reach their national targets by the tar-get dates, greater effort will be required than that implied
by pursuing the MDG target, or future global target for universal coverage with improved sanitation, which is not expected to be before 2030. Furthermore, countries with stricter definitions of sanitary latrines than the current glob-al standards will need to devote even greater efforts to meet national targets.
In countries where sanitation efforts focus on making toilets available and safe, significant environmental pollution results from not treating wastewater or fecal sludge adequately. The current JMP definition of improved sanitation to measure the MDG target 7c does not count what happens to the ex-creta after it has been deposited into a pit or septic tank, or after it has flowed into a sewerage network. The high cover-
TABLE 1: SANITATION TARGETS IN STUDY COUNTRIES
Country Sanitation Target1 Target Date Definition Source
Cambodia Rural: 30% 2015 Same as JMP Rural Sanitation Strategic Plan 2014–2018Rural: 60% 2018
Rural: 100% 2025
Indonesia 62.4% 2015 Similar to JMP, specifications for wastewater management2
Medium Term Development Plan (2010–2014)
100% 2019 Medium Term Development Plan 2015–2019 (pending)
Lao PDR Rural: 60% 2015 Same as JMP NSEDP and National Action Plan for Rural Water Supply and Sanitation Sector 2012
The Phillippines Rural: 60% ODF and 50% septage management3
2016 Same as JMP4 Department of Health Administrative Order 2010–2021
Urban: Sewerage projects implemented in 17 highly urbanized cities
2020 National Sewerage and Septage Management Program 2010
100% 2028 Philippine Development Plan
Vietnam 65% 2015 Hygienic latrine5 National Target Program for Rural Water Supply and Sanitation 2012–2015
Yunnan Province, China
No target in current provincial plan
Sanitary latrine with safe excreta disposal6
Technical Guideline for Rural Latrine Improvement (provisional). NPHCC. 2009
1 Nationwide, unless otherwise stated. For China, the figures are for Yunnan Province.2 Of those covered, the target is that 90% use improved sanitation with appropriate onsite wastewater management, and 10% use improved latrine with offsite wastewater management (5% communal and 5% sewerage system).3 Specifically: rural barangays Zero Open Defecation and septage management plans implemented in fewer than 50% of local government units.4 Sustainability, social acceptability, and economic viability are emphasized in the Department of Health Administrative Order 2010–2021, and the availability of desludging services at barangay level is mentioned.5 A latrine that satisfies hygienic conditions is one that ensures human defecation isolation, preventing unprocessed excrement from contact with insects and animals. It can kill germs living in excrement without polluting surroundings and annoying odor.6 Six main sanitary latrines with safe excreta disposal promoted by the national program include three-chamber septic tank, three-in-one biogas toilet, urine diverting dry toilet, water closed toilet with full sewage system, double urn septic tank, and double pit shifting latrine. In Yunnan Province, the first four types of toilet are relevant, whereas the other two types are not used at scale due to climate, living traditions, and other reasons.
www.wsp.org 3
Economic Assessment of Sanitation Interventions in Southeast Asia | Introduction
age of improved sanitation in the majority of urban areas in these countries masks the major negative impacts of releas-ing large quantities of untreated wastewater into water bod-ies on water resources, ecosystems, humans, and economies. There are few statistics on the proportion of wastewater that is appropriately treated and disposed of in these countries. Sewerage connection rates are not the appropriate statistic given that much sewered wastewater is released into water bodies untreated, leaks into the ground, or is only partially treated. According to a report released by the United Nations Environment Programme, it is likely that only 10% to 20% of wastewater is fully treated in the Southeast and East Asia region (Corcoran, Nellemann et al. 2011).
With economic growth continuing at 5% or more in many countries of Southeast and East Asia, increasing public and private resources are being allocated to urban expan-sion and renewal, or targeted toward basic services for ru-ral populations. Many countries have recently revised their sanitation strategies to achieve rapid scale-up of sanitation programs. Hence, these funds need to be spent efficiently on appropriate services to meet the needs of the greatest number of people, and of specific vulnerable population groups such as the poor, and to demonstrate development impact and value-for-money in order to qualify for further public funds.
However, governments face many issues in responding to their remaining sanitation challenges. External funding is
not guaranteed as donors face difficult choices on where to direct their aid. Much aid remains earmarked or spent through projects that are designed by the donor. Govern-ments and populations must choose between an array of sanitation technologies. There are also many alternative ways to deliver sanitation programs, for example through public or private providers. Other variables include the de-gree of demand generation, the consultative approach to technology selection, and the degree of integration with other services. Policymakers therefore need to rationally examine alternative approaches to reaching their national goals, using evidence where available as a basis for their de-cisions.
The Economics of Sanitation Initiative (ESI), a global pro-gram of the Water and Sanitation Program, aims not only to provide evidence on the costs and benefits of alternative sanitation approaches, but also to provide a framework to enable policymakers to systematically and rationally con-sider technology and program alternatives and thus make better choices. Supporting these recommendations are economic estimates indicating that inadequate sanitation is associated with major preventable costs, and hence im-proved sanitation has a role to play in poverty reduction efforts. The ESI has previously shown costs of inadequate sanitation valued at 1.3% of gross domestic product (GDP) in Vietnam, 1.5% in the Philippines, 2.3% in Indonesia, 5.6% in Lao PDR, and 7.2% in Cambodia (Hutton, Ro-driguez et al. 2008; Hutton, Larsen et al. 2009).

Economic Assessment of Sanitation Interventions4
2.1 AIMSThe overall aim of the Economics of Sanitation Initiative (ESI) is to promote evidence-based decision making to in-crease the volume, effectiveness, and sustainability of sani-tation expenditure. The evidence produced is useful for a range of stakeholders, including governments at national and subnational levels, donors, nongovernmental organiza-tions, program managers, and the private sector.
The present study aims to generate robust evidence on the costs and benefits of sanitation improvements in different programmatic and geographic contexts in Southeast Asia to:
1. Enable explicit comparison of sanitation options on the basis of their relative merits
2. Identify who might be able or willing to pay for sani-tation improvements, and provide further evidence for informing both public and private decisions on the “right” levels of sanitation investment
3. Concretely inform planning agencies or service pro-viders on financing requirements over the project or technology life cycle
A more explicit understanding of the costs and benefits of sanitation enables decision makers to make better choic-es. However, it is recognized that other types of evidence and other factors will compete for the attention of deci-sion makers and thus influence expenditure, policy, and the eventual choice of sanitation. Box 1 illustrates some of the ways in which cost-benefit evidence can be used, and the extent to which this study has answered each of these is as-sessed in Chapter 4.
The main focus of economic evaluation is to understand service efficiency in terms of return on investment and recurrent expenditure. “Return” can be evaluated in both
II. Study Aims
economic and financial terms. The economic returns are more relevant to public decisions where social welfare is to be considered, whereas financial returns are more rel-evant for private decisions, such as those made by a house-hold or a service provider. For example, economic values include impacts that are not direct or easily quantifiable (such as the risk of death and associated value of reduc-ing this risk), or are externalities (impacts on other people who are not making the investment decision or not di-rectly receiving the intervention). Given that not all ben-efits can be easily quantified, this study has attempted to express nonmonetized benefits so that they can be consid-ered in addition to the money-based metrics. This enables decision makers to select projects that have the greatest overall beneficial impact for society instead of considering monetized impacts alone.
Intervention costs are also fundamental in choosing sani-tation technologies, given the importance of demonstrat-ing to the public the appropriate use of public funds, and the sensitivity of sanitation financiers to new demands on their budgets. However, government and donor plan-ning processes do not always take into account the full opportunity costs (such as the value of land or donated inputs), or the full operation and maintenance costs, of new investments. In government decision making, capi-tal budget planning rarely considers the consequences of expanding infrastructure for operations and maintenance costs. This is also true of many donor projects, which pro-vide generous financing for investment costs, but do not fully take into account the capacity of communities and governments to assure the sustained operation of the fa-cilities (Franceys and Pezon 2010). Hence, it is crucial to understand the full costs, their breakdown by cost type, and the financing of these costs, in order to ensure rational intervention selections are made.

www.wsp.org 5
Economic Assessment of Sanitation Interventions in Southeast Asia | Study Aims
Economic analysis conducted in real field settings also pro-vides the opportunity to examine the real added value of sanitation services. For example, the full benefits of a sanita-tion intervention may not be received due to practical fac-tors that affect the initial uptake of the intervention and continued compliance with good practices. Program per-formance therefore needs to be better understood to advise future program design.
2.2 METHODOLOGY OVERVIEWA methodology for economic assessment of sanitation interventions was developed for the study, and applied in a standardized way in all six countries. The methodol-ogy draws on established cost-benefit analysis techniques
BOX 1. WAYS TO USE THE RESULTS OF THE ECONOMIC ASSESSMENT OF SANITATION INTERVENTIONS
1. Provides advocacy material for increased spending on sanitation, and to prompt sector stakeholders to pay greater attention to efficient implementation and scaling up of sanitation programs. Once financiers realize that investment in sanitation brings financial and economic benefit to households, the private sector, and the economy, and greater social equity, they will be more encouraged to allocate resources to sanitation.
2. Enables the inclusion of efficiency criteria in the selection of sanitation options in government and donor strategic planning documents, and in specific sanitation projects and programs. Resources allocated to sanitation can be targeted toward those interventions that generate greater social return. Standard outputs of cost-benefit analysis include benefit-cost ratios, internal rate of return, payback period, and net benefits (see Glossary). Cost-effectiveness analysis—often utilized by ministries of health in selecting health interventions in which to invest—compares health impacts with intervention costs, expressed in measures such as the cost per disease case averted, per death averted or per DALY averted.
3. Highlights the nonmonetized benefits of sanitation interventions that are key to investment decisions by communities and households, such as dignity, comfort, prestige, security, sanitation preferences, gender equality, household cleanliness, and aesthetics of the community environment. These aspects are crucial to the uptake and optimal choice of sanitation technology.
4. Brings greater focus on appropriate technology through increased understanding of the marginal costs and benefits of moving up the sanitation ladder in different contexts. Decision makers can avoid making high-cost investments with unaffordable financing requirements for operations and maintenance, where there is a high risk of hardware falling into disrepair. Appropriate technology needs to be determined through assessment of multiple criteria, including economic ones.
5. Provides the empirical basis for improved estimates of the total costs and benefits of meeting sanitation targets, and contributes to financing plans for meeting national targets and achieving universal access. The data sets on sanitation costs, and how those costs are shared between different financiers, will enable governments to make realistic financing plans, including future budgeting. Through identification of the beneficiaries, cost-benefit analysis also contributes to the design of feasible financing options. Program implementers better understand beneficiaries’ willingness to pay when setting subsidy levels, and the private sector better understands the potential market opportunities and how to respond to these.
(Sugden and Williams 1978; Hanley and Spash 1993; Hutton et al. 2007), adapted to the specific features of sanitation interventions, their costs and benefits, and the research budget of the ESI. In each country, steering or advisory groups composed of government and other sani-tation experts were set up to provide inputs to study de-sign, site selection, and research to policy linkages (refer to country reports for details). The study has been published in a peer-reviewed journal (Hutton et al. 2014).
As shown in Figure 1, the study consists of field compo-nents giving quantitative cost-benefit estimates. Two types of field-level efficiency assessments were performed:
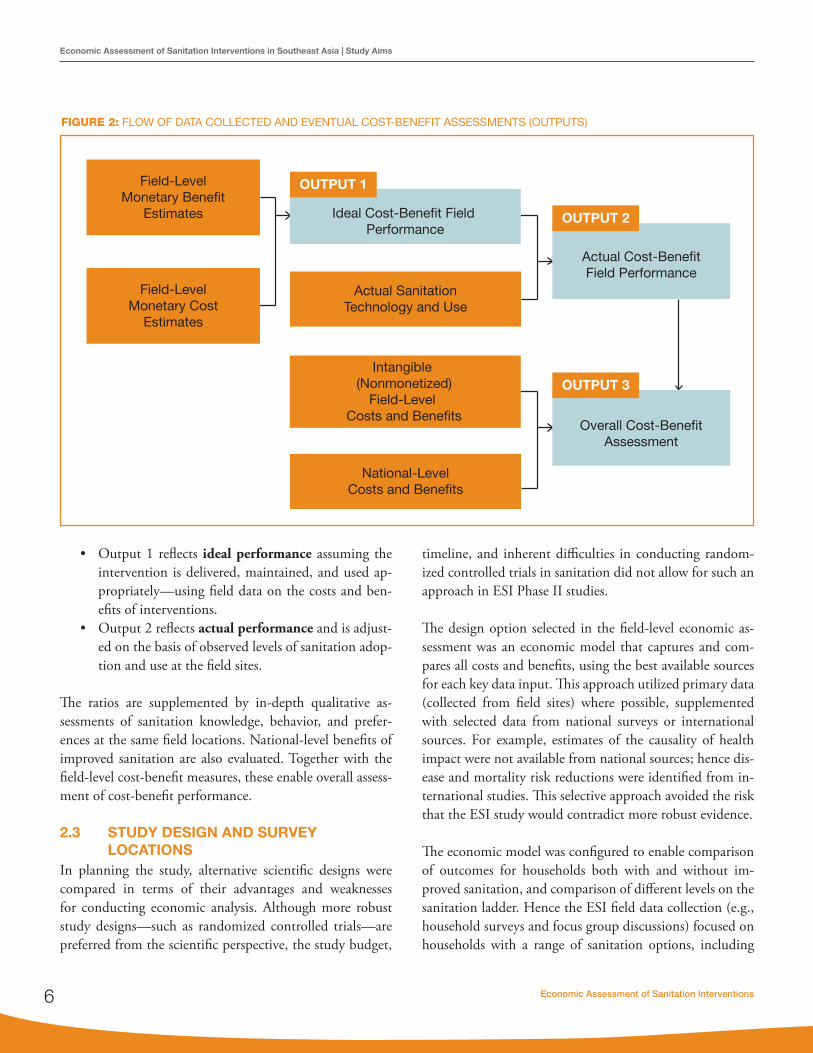
Economic Assessment of Sanitation Interventions6
Economic Assessment of Sanitation Interventions in Southeast Asia | Study Aims
Overall Cost-BenefitAssessment
Actual SanitationTechnology and Use
Ideal Cost-Benefit Field Performance
Intangible (Nonmonetized)
Field-Level Costs and Benefits
National-LevelCosts and Benefits
Field-LevelMonetary Benefit
Estimates
Field-LevelMonetary Cost
Estimates
Actual Cost-BenefitField Performance
OUTPUT 1
OUTPUT 2
OUTPUT 3
• Output 1 reflects ideal performance assuming the intervention is delivered, maintained, and used ap-propriately—using field data on the costs and ben-efits of interventions.
• Output 2 reflects actual performance and is adjust-ed on the basis of observed levels of sanitation adop-tion and use at the field sites.
The ratios are supplemented by in-depth qualitative as-sessments of sanitation knowledge, behavior, and prefer-ences at the same field locations. National-level benefits of improved sanitation are also evaluated. Together with the field-level cost-benefit measures, these enable overall assess-ment of cost-benefit performance.
2.3 STUDY DESIGN AND SURVEY LOCATIONS
In planning the study, alternative scientific designs were compared in terms of their advantages and weaknesses for conducting economic analysis. Although more robust study designs—such as randomized controlled trials—are preferred from the scientific perspective, the study budget,
timeline, and inherent difficulties in conducting random-ized controlled trials in sanitation did not allow for such an approach in ESI Phase II studies.
The design option selected in the field-level economic as-sessment was an economic model that captures and com-pares all costs and benefits, using the best available sources for each key data input. This approach utilized primary data (collected from field sites) where possible, supplemented with selected data from national surveys or international sources. For example, estimates of the causality of health impact were not available from national sources; hence dis-ease and mortality risk reductions were identified from in-ternational studies. This selective approach avoided the risk that the ESI study would contradict more robust evidence.
The economic model was configured to enable comparison of outcomes for households both with and without im-proved sanitation, and comparison of different levels on the sanitation ladder. Hence the ESI field data collection (e.g., household surveys and focus group discussions) focused on households with a range of sanitation options, including
FIGURE 2: FLOW OF DATA COLLECTED AND EVENTUAL COST-BENEFIT ASSESSMENTS (OUTPUTS)

www.wsp.org 7
Economic Assessment of Sanitation Interventions in Southeast Asia | Study Aims
“no sanitation,” to populate the economic model and en-able comparative analyses of economic efficiency between the modeled options.
Field sites and projects were selected to be representative of each country, or province in the case of Yunnan, China. By sampling a range of representative locations, the study results can be utilized outside the study settings, and hence be more useful for national and local level planning. Because of dif-ferences in budget availability, research costs, and population sizes between the six countries, the number of field sites per country varied from five in Indonesia to 14 in Vietnam. Field assessments were made in a total of 47 sites—25 classified as rural and 22 as urban.3 Table 1 shows the distribution of rural and urban field sites, whereas Annex Table A1 identifies and describes their main characteristics. In all countries there was an almost equal number of rural and urban sites, except in Cambodia, where the majority of the unserved population resides in rural areas, and hence four of the five field sites were rural. A larger number of field sites were selected in Vietnam, to reflect the different nature of its Northern, Central, and Southern regions. In Yunnan Province, China, three different geographical regions were chosen, each with rural and urban settings. Further details of the background and features of the field sites are provided in the country reports.
hygiene was also included, insofar as it affects health out-comes and intangible factors.
In addition to human excreta management, the study considered interventions jointly addressing human waste with domestic wastewater management (especially in ur-ban areas) and animal waste management (in the case of biogas generation). In Vietnam, solid waste management was also evaluated in four sites (see country report for the results).
The baseline analysis focuses on comparing each sanitation intervention option with no sanitation service. This approach helps decision makers understand why sanitation is necessary for those currently without a service, and also helps justify preventing households from falling back into the ‘no service’ category (e.g. when regular pit emptying, hardware main-tenance and behavior change activities are not conducted, as required). Because some governments, communities and households will be considering an upgrade, the country re-ports compare the incremental costs with the incremental benefits of movements up the ‘sanitation ladder’.
Figure 3 presents a generalized pathway of sanitation im-provement. The upward slope of the pathway reflects the assumption of greater benefits as the ladder is climbed, but (generally) with higher costs. The progression shown in Figure 3 is not necessarily true in all settings and hence needs to be altered on the basis of setting-specific features (e.g. different physical and climatic environments such as soil type or water scarcity). Although some positions on the pathway are not currently considered improved by the WHO/UNICEF Joint Monitoring Programme (JMP), these interventions are often associated with quantifiable benefits, such as increased time availability or improved health. For example, Community-Led Total Sanitation (CLTS) aims to stop open defecation (OD); hence, as a first step, households may choose a very basic pit latrine that would not meet the JMP improved sanitation defini-tion. In other circumstances, such as slums, a toilet for every household may not be feasible due to cost or lack of space, and shared or public latrines may be an appropriate interim option.
TABLE 2: NUMBER OF FIELD SITES PER COUNTRY
Country Rural sites Urban sites Total sites
Cambodia 4 1 5
Indonesia 2 3 5
Lao PDR 3 3 6
The Philippines 3 3 6
Vietnam 9 8 17
Yunnan (China) 4 4 8
Total 25 22 47
2.4 SANITATION INTERVENTIONS EVALUATED
The type of sanitation evaluated in this study was human excreta management at the household level. Interventions to improve human excreta management at the household level focus on both onsite and off-site sanitation options. Basic
3 In China (Yunnan Province) two sites were classified as ‘peri-urban’ and results were presented separately in the country reports. In the synthesis report, these sites were reclassified as either ‘rural’ or ‘urban’ based on population density.

Economic Assessment of Sanitation Interventions8
Economic Assessment of Sanitation Interventions in Southeast Asia | Study Aims
The sanitation technologies evaluated were based on those actually implemented in the selected field sites shown in Annex Table A1.
2.5 COSTS AND BENEFITS INCLUDEDSanitation costs are the denominator in calculations to es-timate cost-benefit, and the numerator in estimations of cost-effectiveness ratios; thus they are crucial to the evalua-tion of sanitation option efficiency. Summary cost measures include total lifetime costs and annualized costs, expressed as the cost per household, cost per capita, and cost per sys-tem.
For financing and planning purposes, this study collected costs for each sanitation option by capital hardware, pro-gram and recurrent costs; financial and economic costs; fi-nancier; and income or wealth group. The incremental costs of moving up the sanitation ladder were also assessed.
To enable a level playing field for sanitation options with different expected life spans, the cost-benefit model evalu-ated costs of all interventions over a 20-year period. In other
words, options with a shorter than 20-year duration were as-sumed to be renewed; whereas for systems with a longer than 20-year duration, the 20-year cost equivalent was estimated. Costs were estimated in the local currency units of each coun-try in 2008 prices, and converted to United States dollars (US$) at average exchange rates on December 31, 2008, ex-cept for Lao PDR where 2010 prices were used (see the Key Development Indicators table in front matter). Although the focus of the results section is on the rates of economic return, summary cost data are presented in Chapter 4 and further data are presented in the separate country reports.
The benefits of improved sanitation and hygiene are defined as belonging to three categories:
1. Household direct benefits are incurred by house-holds making the sanitation improvement. These may include health impacts related to household sanitation and hygiene, local water resource impacts, access time, intangible impacts (personal and social welfare impacts), house price changes, and the value of human excreta reuse when used safely.
Water
Excreta & Water Reuse
Intangibles
Health
Time
Benefits
Dry privatelatrine
Double vaultdry toilet
Wet privatelatrine
On-site septictank system
Reuse Reuse
Secondarytreatment
Tertiarytreatment
Improved publicor shared latrine
Open defecation
Unimprovedpit latrine
Public or unimproved shared latrine
Unit costs per household
FIGURE 3: REPRESENTATION OF THE PATHWAY OF SANITATION IMPROVEMENTS

www.wsp.org 9
Economic Assessment of Sanitation Interventions in Southeast Asia | Study Aims
2. Local level external benefits are those benefits po-tentially incurred by all households living in the environment where households improve their sani-tation. These may include health impacts related to environmental exposure to pathogens (e.g., through water sources or OD practices on land), an aestheti-cally improved environment, and improved usability of local water sources for household and productive activities. These benefits may not be substantial until a critical mass of households utilizes improved sani-tation facilities.
3. Wider scale external benefits are also enjoyed above the community level. For example, poor sanitary conditions may dissuade investors and tourists from investing in or visiting a country or specific area of a country. The benefits of improved sanitation may include improved water quality for productive uses, improved environmental condi-tions for attracting tourists, improved environ-mental conditions for local businesses to operate,
and improved environmental conditions encour-aging multinational or foreign companies to con-sider locating productive capacity or sales outlets in a country. The benefits can either be linked to improved sanitary coverage in specific areas or zones (e.g., a tourist area or industrial zone), or the country generally (e.g., investment climate). As well as improved management of human excre-ta, other contributors to environmental improve-ment such as solid waste management, industrial wastewater, and storm water treatment need to be considered.
For the purposes of data collection and presentation of re-sults, this study distinguishes two levels of economic ben-efit: local community (where the sanitation and hygiene improvements take place) and “higher” national-level im-pacts. Table 3 shows the impacts included in the current study, distinguishing between those expressed in monetary and nonmonetary units.
TABLE 3: BENEFITS OF IMPROVED SANITATION INCLUDED IN THIS STUDY
Level ImpactSocioeconomic impacts evaluated in
Monetary terms ($ values) Nonmonetary terms (non-$ values)
Local benefits Health • Healthcare costs• Health-related productivity• Premature death
• Disease and mortality rates• Quality of life impacts• Gender impacts
Domestic water • Water sourcing• Household treatment
• Link with water quality and practices• Potential use for income generating
activities
Personal and social welfare
• Time use related to accessing sanitation facilities
• Convenience, comfort, privacy, prestige, social status, dignity, security, gender
Environmental quality
• Land use changes• Aesthetics related to the environment
Output reuse1 • Fertilizer generated & used• Biogas generated & used
• Preferences for handling human excreta• Safe wastewater reuse
National benefits Tourism Sanitation-tourism link: potential impact of poor sanitation on tourist numbers & income
Business Sanitation-business link: potential impact of poor sanitation on local business and FDI
1 Included in China, the Philippines, and Vietnam only. FDI: foreign direct investment.

Economic Assessment of Sanitation Interventions10
Economic Assessment of Sanitation Interventions in Southeast Asia | Study Aims
2.6 DATA ANALYSISThe field-level cost-benefit analysis generates a set of effi-ciency measures from site-specific field studies, focusing on actual implemented sanitation improvements, including household and community costs and benefits (see Table 3). Five major efficiency measures were presented in country reports (the benefit-cost ratio, the cost-effectiveness ratio, the internal rate of return, the payback period, and the net present value). For simplicity, only the first two are pre-sented in this report:
1. The benefit-cost ratio (BCR) is the present value of the future benefits divided by the present value of the future costs, for a 20-year period. Future costs and benefits were discounted to present value using a discount rate of 8%, except in Lao PDR where 12% was used. In the sensitivity analysis, discount rates of 5% and 10% were applied.
2. The cost per DALY averted is the present value of the future disability-adjusted life years averted di-vided by the present value of the future costs, for a 20-year period. Future costs and health benefits were discounted to present value using the discount rates noted above.
Results were estimated by field site and for each sanita-tion improvement option, compared not only with the no sanitation option (i.e., OD) but also with each other, and presented in each country report. In this report, the aver-ages across all field sites are presented for each technology, compared to the no sanitation option. BCRs and costs per DALY averted are presented under two scenarios:
1. Under the assumption that sanitation programs lead to properly functioning, sustainable sanitation sys-tems that are used by the population. It is also as-sumed that the health risk reduction is enjoyed by the household, irrespective of broader sanitation coverage.
2. Under actual functioning and use of sanitation sys-tems and practices, obtained from the household questionnaires. In other words, scenario 1 is ad-justed by the rate of nonuse of onsite facilities, or overcapacity of septage or wastewater management systems.
Nonmonetized benefits of improved sanitation are de-scribed and presented alongside the above efficiency mea-sures. Gender issues, especially, are central to the presenta-tion of intangible benefits.
The results described above reflect data on the input vari-ables of the average population. A case study of the Philip-pines is presented in this report, comparing input values for poor and vulnerable groups with the average population values and with high-income groups. Model parameters varying between these population groups included house-hold size, value of time, disease and mortality rates, water supply and treatment practices, and investment cost.

www.wsp.org 11
III. Economic Returns of Sanitation
This chapter presents a summary comparison of results between countries and sanitation technologies. The main indicator presented in this section is the benefit-cost ra-tio (BCR).4 The reader is referred to the country reports for further results. Section 3.1 presents the results of the quantitative cost-benefit analysis for rural and urban sites, separately. Section 3.2 highlights selected nonmonetized benefits for households and communities affected directly by sanitation interventions, and presents cost-effectiveness ratios of the health gains (cost per DALY averted). Section 3.3 presents findings on the assessment of the broader im-pacts of sanitation covering tourism and business.
3.1 MONETIZED RETURNS OF SANITATION3.1.1 RURAL SETTINGS—COMPARING
COUNTRIESThis section compares four groupings of sanitation options in Figures 5–8, reflecting different points on the sanitation ladder in rural areas. All BCRs presented here are the ideal ratios, assuming households that invest in or receive a la-trine will continue to use the facility and use it properly.
Figure 4 shows the economic returns per unit investment in private pit latrines. Three findings are worth noting. First, the returns on pit latrines are at least 5 times their cost in all but one country—Cambodia. Across both wet and dry pit latrines, the returns are highest in Lao PDR at over 8 times cost. The returns are two or more times cost in Cambo-dia for improved pit latrines. The average returns are lower in Cambodia partly because costs there are at least as high as those in other countries, but the value of the benefits is diminished by lower average incomes in Cambodia. Note that health savings alone are greater than the costs in five countries.
A second finding is that dry pit latrines do not consistently have a higher return than the more expensive wet pits, de-spite involving lower investment cost in all countries. In the Philippines and Cambodia, dry pit latrines have lower returns than wet pit latrines, whereas the inverse is true in Indonesia and Lao PDR. This finding was observed for the Philippines and Cambodia largely because expected life is shorter than for a wet pit latrine. A third finding is that, whereas overall returns are similar across all countries, the benefits that make up the returns vary significantly, due to the different levels of impact and the different relative values of those impacts. For example, healthcare savings make up a significant share of overall benefits in Lao PDR and Indo-nesia, whereas mortality reductions are more important in Vietnam. The value of time savings makes up at least 50% of the overall benefit in four of the six countries. Reduced costs due to less polluted water sources are an insignificant benefit in all countries except Vietnam, where they account for close to 10% of benefits.
Figure 5 shows the returns for private toilets with septic tanks and/or sewerage for all countries except Cambodia, where these options were not found in sufficient number in the rural field sites. Three findings are apparent. The first is that the net returns are significantly lower than those for lower cost pit latrines, presented above. In only Vietnam and Lao PDR do the net returns reach 4, whereas the net returns are as low as 2 in the Philippines. However, the re-turns remain above 1 for all technologies and all countries. Second, in Vietnam and the Philippines, where a compari-son was possible, the economic net returns are lower for improved wastewater management (WWM) than for septic tanks alone. This is not surprising given the higher costs of improved WWM, whereas the additional benefits of
4 A BCR of greater than 1.0 indicates economic viability whereas a BCR of <1 indicates economic nonviablility. In this case, viability can only be judged based on monetized benefit. Where important benefits are not monetized, a BCR of below 1 should be interpreted based on the merits of the nonmonetized benefits.

Economic Assessment of Sanitation Interventions12
Economic Assessment of Sanitation Interventions in Southeast Asia | Economic Returns of Sanitation
The second finding is the variation of reuse options with pit latrines in each country. In Yunnan the UDDT option has a higher ratio than that for a pit latrine. This was ac-complished through a large-scale government program that made the unit cost of UDDT facilities similar to that of ordinary pit latrines. In the Philippines, returns for UDDT were significantly lower than those from pit latrines, due to the high hardware and software unit costs of delivering UDDT to populations. In Vietnam the composting latrine had a marginally lower return than that of a pit latrine, due to the higher unit cost but limited marginal return on reuse of compost.
WWM were not fully monetized. The third finding is that health benefits and time savings account for the majority of the overall benefits. Health benefits exceed the intervention costs in four of the five countries.
Figure 6 shows the economic returns of reuse in the three countries where this option existed at field sites; covering biogas and urine diversion dehydration toilet (UDDT) in two countries, and composting toilet (either a double- or triple-vault pit latrine) in Vietnam. The first finding is that all reuse options have economic returns of at least 1, rang-ing from 2 for UDDT in the Philippines to almost 9 for UDDT in Yunnan.
0 2 4 6 8 10
Unlined dry pit
Dry pit
Wet pit
Dry pit
Wet pit
Dry pit
Wet pit
Dry pit
Wet pit
Pit latrine
Pit latrine
Cam
bodi
aIn
done
sia
Lao
PDR
The
Phili
ppin
esVi
etna
mYu
nnan
Benefit-Cost Ratio
Healthcare
Health productivity
Health mortality
Water access
Water treatment
Access time
FIGURE 4: BENEFIT-COST RATIOS OF PRIVATE PIT LATRINES IN RURAL AREAS

www.wsp.org 13
Economic Assessment of Sanitation Interventions in Southeast Asia | Economic Returns of Sanitation
The third finding is that biogas has a positive economic return, despite its very high unit costs compared to other sanitation options. In Vietnam, the biogas digesters sur-veyed were large and were adopted by medium-sized farms with a lot of livestock. Hence, the resource recovery value accounted for a large share of overall benefit. In Yunnan, the biogas digesters were small and this made the unit costs of the option three times the cost of a pit latrine. Hence, the high return on biogas of at least 7 was accounted for largely by health and time savings, rather than the value of recovered gas.
At field sites in four countries, rural households still used shared or public toilets. Figure 7 shows that the net returns
are greater than 1 for all the options assessed. The BCR of shared latrines is generally not higher than that of private latrines, because although two or perhaps three households share the cost, the expected lifespan is usually considerably shorter, or more regular emptying is needed. In the Philip-pines the returns for shared toilets are the lowest, because unit costs for shared (communal) toilets are significantly higher than those of private options, even when calculated on a cost per household served basis. The returns on shared latrines in Lao PDR and Indonesia are significantly higher, with BCRs of at least 5. Public and communal toilets have a return of 3 in Indonesia and at least 5 in Yunnan. In these countries, the share of time savings is considerably diminished due to the travel and waiting time required for shared facilities.
0 10
Septic tank
Septic tank
Septic tank
Septic tank(no WWM)
Septic tank(WWM)
Septic tank(no WWM)
Septic tank(WWM)
Septic tank
Cam
bodi
aIn
done
sia
Lao
PDR
The
Phili
ppin
esVi
etna
mYu
nnan
Benefit-Cost Ratio
Healthcare
Health productivity
Health mortality
Water access
Water treatment
Access time
0 2 4 6 8
FIGURE 5: BENEFIT-COST RATIOS OF PRIVATE TOILETS WITH SEPTIC TANK AND/OR SEWERAGE IN RURAL AREAS
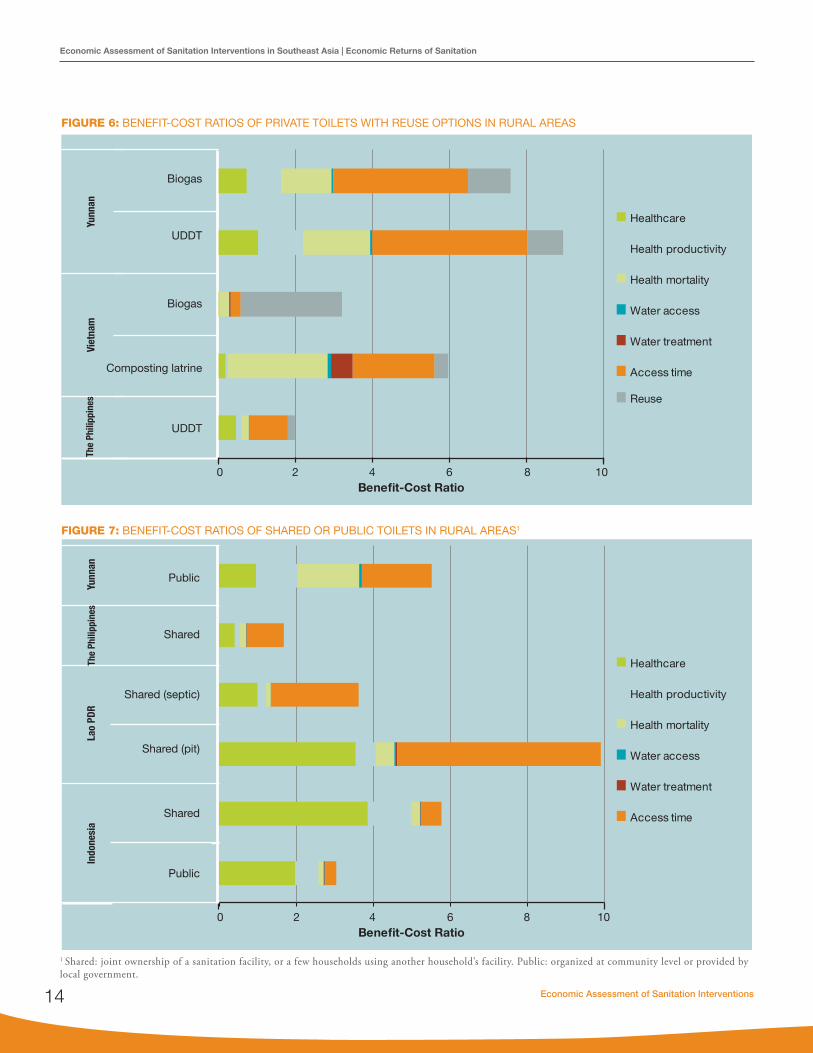
Economic Assessment of Sanitation Interventions14
Economic Assessment of Sanitation Interventions in Southeast Asia | Economic Returns of Sanitation
0 42 86 10
UDDT
Composting latrine
Biogas
UDDT
Biogas
Viet
nam
Yunn
an
Benefit-Cost Ratio
Healthcare
Health productivity
Health mortality
Water access
Water treatment
Access time
Reuse
The
Phili
ppin
es
FIGURE 6: BENEFIT-COST RATIOS OF PRIVATE TOILETS WITH REUSE OPTIONS IN RURAL AREAS
FIGURE 7: BENEFIT-COST RATIOS OF SHARED OR PUBLIC TOILETS IN RURAL AREAS1
0 42 86 10
Public
Shared
Shared (pit)
Shared (septic)
Shared
Public
Indo
nesi
aLa
o PD
RYu
nnan
Benefit-Cost Ratio
Healthcare
Health productivity
Health mortality
Water access
Water treatment
Access time
The
Phili
ppin
es
1 Shared: joint ownership of a sanitation facility, or a few households using another household’s facility. Public: organized at community level or provided by local government.

www.wsp.org 15
Economic Assessment of Sanitation Interventions in Southeast Asia | Economic Returns of Sanitation
3.1.2 RURAL SETTINGS – COMPARING OPTIONS WITHIN COUNTRIES
This section focuses on the differences in economic returns between technologies, and the variation between ideal and actual performance. Differences between ideal and actual performance are accounted for by the fact that some house-holds do not use a latrine over the full life of the hardware—either due to noncompliance or because the hardware itself is not functioning.
Figure 8 shows the performance of sanitation interventions delivered in four projects in rural Cambodia. Two projects focused on delivering wet pits, one on delivering dry pits (al-though not exclusively), and another on CLTS implemen-
tation, which leads to a high coverage of unlined, simple dry pit latrines. The wet pit options have a higher economic return owing to the longer expected lifespan of the hard-ware (8 years) than the dry lined pit option (3 years) and the unlined dry pit (1 year). For all options, there is quite a significant drop in performance when taking into account the nonuse of facilities by household members within those lifespans. Only in the case of the unlined dry pit latrine does the economic return drop below the benefit-cost threshold of 1. However, for this option, it is assumed that the full software cost (US$54 out of US$74 total cost) would be incurred each year to ensure that the facility is rebuilt, which might not be the case. The difference between actual and ideal indicates the relatively high rates of latrine nonuse.
Benefit-Cost Ratio0 2 4 6 8 10
Wet pit(Tonlé Sap)
Wet pit(Ecosorn)
Dry pit
Actual 1.66
2.31
1.91
2.93
1.32
1.98
0.84
1.42
Ideal
Actual
Ideal
Actual
Ideal
Actual
Ideal
Unlineddry pit
Benefit-Cost Ratio0 2 4 6 8 10
Wet pit
Septictank
Dry pit
Shared
Actual
3.77
3.20
5.56
7.05
6.26
7.87
3.97
5.77
2.49
3.04
Ideal
Actual
Ideal
Actual
Ideal
Actual
Ideal
Actual
IdealPublic
FIGURE 8: BENEFIT-COST RATIOS OF SANITATION OPTIONS IN CAMBODIA, RURAL SITES
FIGURE 9: BENEFIT-COST RATIOS OF SANITATION OPTIONS IN INDONESIA, RURAL SITES
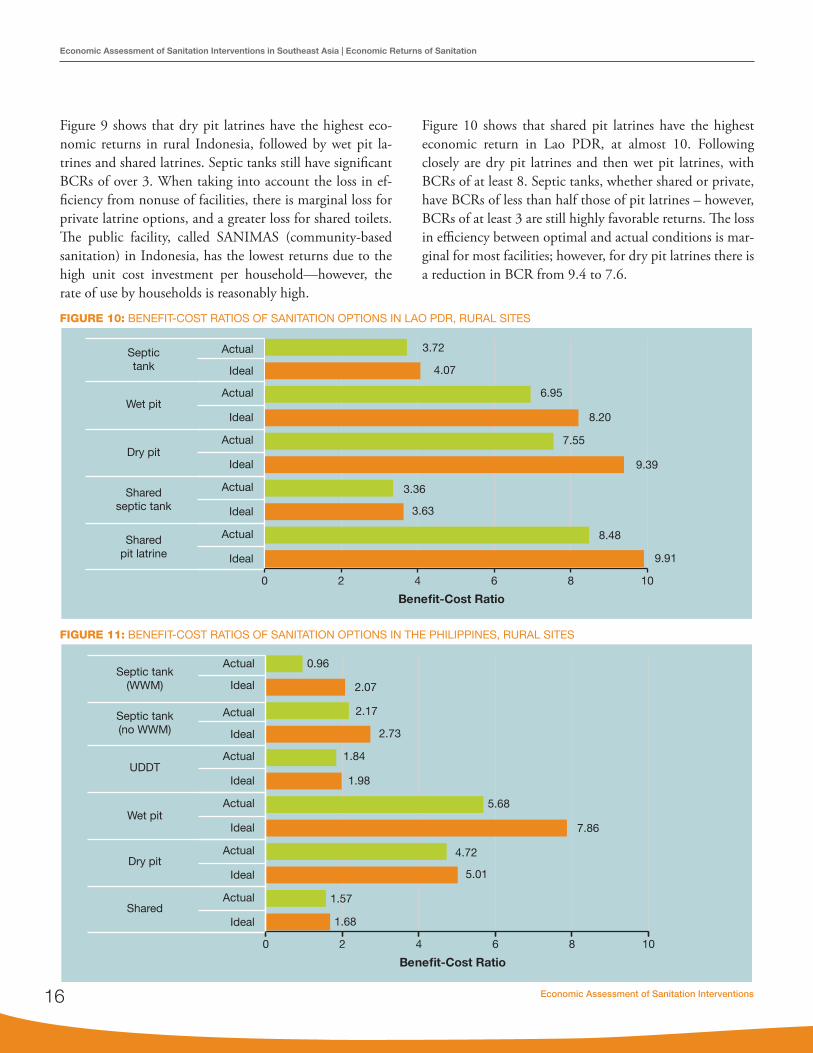
Economic Assessment of Sanitation Interventions16
Economic Assessment of Sanitation Interventions in Southeast Asia | Economic Returns of Sanitation
Figure 9 shows that dry pit latrines have the highest eco-nomic returns in rural Indonesia, followed by wet pit la-trines and shared latrines. Septic tanks still have significant BCRs of over 3. When taking into account the loss in ef-ficiency from nonuse of facilities, there is marginal loss for private latrine options, and a greater loss for shared toilets. The public facility, called SANIMAS (community-based sanitation) in Indonesia, has the lowest returns due to the high unit cost investment per household—however, the rate of use by households is reasonably high.
Figure 10 shows that shared pit latrines have the highest economic return in Lao PDR, at almost 10. Following closely are dry pit latrines and then wet pit latrines, with BCRs of at least 8. Septic tanks, whether shared or private, have BCRs of less than half those of pit latrines – however, BCRs of at least 3 are still highly favorable returns. The loss in efficiency between optimal and actual conditions is mar-ginal for most facilities; however, for dry pit latrines there is a reduction in BCR from 9.4 to 7.6.
Benefit-Cost Ratio
Wet pit
Septictank
Dry pit
Sharedseptic tank
Actual
4.07
3.72
6.95
8.20
7.55
9.39
3.36
3.63
8.48
9.91
Ideal
Actual
Ideal
Actual
Ideal
Actual
Ideal
Actual
Ideal
Sharedpit latrine
0 2 4 6 8 10
Benefit-Cost Ratio
0 2 4 6 8 10
UDDT
Septic tank(no WWM)
Septic tank(WWM)
Wet pit
Dry pit
Actual
2.73
2.17
1.84
1.98
5.68
7.86
4.72
5.01
1.57
1.68
Ideal
Actual
Ideal
2.07
0.96Actual
Ideal
Actual
Ideal
Actual
Ideal
Actual
IdealShared
FIGURE 10: BENEFIT-COST RATIOS OF SANITATION OPTIONS IN LAO PDR, RURAL SITES
FIGURE 11: BENEFIT-COST RATIOS OF SANITATION OPTIONS IN THE PHILIPPINES, RURAL SITES

www.wsp.org 17
Economic Assessment of Sanitation Interventions in Southeast Asia | Economic Returns of Sanitation
Figure 11 shows that wet pit latrines have by far the highest BCR in rural sites of the Philippines. However, efficiency is significantly reduced when nonuse of wet pit latrines by household members is taken into account (a decrease of 7.9 to 5.7). Dry pit latrines have a very favorable return of 5. All the other options have similar returns with BCRs of around 2. The greatest reduction in efficiency due to nonuse is sewerage, because a sewerage treatment facility is working at well below capacity. For septic tanks connected to sewerage, at current capacity use, the economic return is below the BCR threshold of 1.
Figure 12 shows that all options in rural Vietnam, even at be-low optimal conditions, have favorable benefit-cost ratios of at least 2.6. The highest returns are for hygienic pit latrines,
which have a BCR of 8, followed by composting latrines with a BCR of 6; however, nonuse of these facilities leads to sig-nificant drops in efficiency to 6.4 and 4.5, respectively. While septic tanks without proper WWM5 have a higher economic return than the WWM option, this finding is likely to be re-versed if the environmental, wastewater reuse and intangible benefits of improved WWM6 are considered.
Figure 13 shows that the highest net returns to sanitation in Yunnan Province are from reuse options—UDDT and bio-gas. Pit latrines and community latrines have BCRs of 5.5 and 6.2, respectively. In many rural areas, the septic tank is an increasingly common option, with a favorable BCR of 3.4. Taking into account the nonuse by households, the ef-ficiency drops by about one-third for all options.
Benefit-Cost Ratio
0 2 4 6 8 10
Septic tank(no WWM)
Septic tank(WWM)
Biogas
Compostinglatrine
Actual
Ideal
Actual
Ideal
Actual
Ideal
Actual
Ideal
Actual
Ideal
3.22
4.04
2.61
3.12
2.91
3.21
4.52
5.96
6.40
7.98Pit latrine
Benefit-Cost Ratio
Biogas
Septic tank
UDDT
Pit latrine
Actual
Ideal
Actual
Ideal
Actual
Ideal
Actual
Ideal
Actual
Ideal
4.88
7.58
2.35
3.43
5.83
8.94
6.19
3.51
5.52Community
4.40
0 2 4 6 8 10
FIGURE 12: BENEFIT-COST RATIOS OF SANITATION OPTIONS IN VIETNAM, RURAL SITES
FIGURE 13: BENEFIT-COST RATIOS OF SANITATION OPTIONS IN YUNNAN (PRC CHINA), RURAL SITES
5 In these common cases, the septic tank serves as a pretreatment for black wastewater—the effluent either soaks into the ground or flows into an open drain.6 Specifically, this usually involves a septic tank with sewerage and a cluster waste water treatment station.

Economic Assessment of Sanitation Interventions18
Economic Assessment of Sanitation Interventions in Southeast Asia | Economic Returns of Sanitation
3.1.3 URBAN SETTINGS – COMPARING COUNTRIES
This section compares four sanitation option groupings in Figures 14–17, reflecting different points on the sanitation ladder. All BCRs presented here are for ideal conditions, which assume that households that invest in or receive a latrine will continue to use it and that WWM systems are working at designed capacity.
Figure 14 shows the economic returns per unit spent on private toilets with septic tanks. The first observation is that septic tanks are economically viable in all countries, with economic returns of around 2 or more per unit spent. How-ever, there are significant variations between countries, with returns ranging from under 2 in Cambodia and Indonesia,
to around 3 in Yunnan and Vietnam and at least 4 in the Philippines. When sludge and wastewater are not collected and treated from septic tanks in the Philippines, the BCR increases to 5.5 due to the lower unit costs of this option. In Vietnam, septic tanks with no WWM have similar perfor-mance to those with WWM, because the higher cost of the latter are balanced by higher health benefits. The omission of the monetized environmental benefits of sludge wastewa-ter management also leads to lower BCRs for these options. Access time savings account for a major share of benefits in Cambodia, Lao PDR, and the Philippines. The share is so high in the Philippines because the value of time used in Metro Manila is considerably higher than that in rural sites. In Yunnan, Vietnam, and Indonesia, health benefits account for 50% or more of benefits.
FIGURE 14: BENEFIT-COST RATIOS OF PRIVATE TOILETS WITH SEPTIC TANK, URBAN AREAS
Septic tank
Septic tank
Septic tank
Septic tank(no WWM)
Septic tank(WWM)
Septic tank(no WWM)
Septic tank(WWM)
Septic tank
Cam
bodi
aIn
done
sia
Lao
PDR
The
Phili
ppin
esVi
etna
mYu
nnan
Benefit-Cost Ratio
Healthcare
Health productivity
Health mortality
Water access
Water treatment
Access time
0 2 4 6 8 10

www.wsp.org 19
Economic Assessment of Sanitation Interventions in Southeast Asia | Economic Returns of Sanitation
Figure 15 shows that the BCRs of sewerage with wastewater treatment are similar to those for septic tanks in all countries, except Cambodia. The BCR in Cambodia (0.14) is so low because the urban site is a relatively small town with connec-tions planned for 3,300 households, whereas the wastewater treatment plant, sewerage system, and purchased land cost US$22 million (ADB 2008). In most sites assessed, waste-water treatment plants release the treated wastewater into the environment. In Vietnam, on the other hand, wastewa-ter is reused and hence has a value that represents almost half of the costs, or about one-sixth of the benefits.
Pit latrines remain a feasible and affordable sanitation op-tion in some urban settings, where population density is low and properties have sufficient plot size for the construc-tion of additional buildings. In fact, wet pit latrines were common in most urban sites in all countries except Viet-nam, where septic tanks were the most common option. As shown in Figure 16, the BCRs for wet pit latrines are more favorable than septic tanks and sewerage in urban ar-
eas. However, wet pit latrines in urban areas had a poorer economic performance compared to those in rural areas in Yunnan, the Philippines, Lao PDR, and Indonesia. This was largely due to the higher construction costs in urban areas (Lao PDR and Yunnan), and the lower relative im-pact on health indices in urban sites (Indonesia, Lao PDR, the Philippines and Yunnan). However, economic returns for wet pit latrines remain very favorable, and they are the best performing sanitation option in urban areas. Note that health benefits alone justify the investments.
Shared and public toilets remain important options for a significant share of the countries’ urban populations, rang-ing from 5% to 24% in 2010.7 Figure 17 shows similarities in economic returns between three countries of between 1.5 (public toilets in Indonesia) to 2.5 (shared septic tanks in Yunnan). In Lao PDR shared latrines have a BCR of 6. Due to the lower time savings for shared latrines, the share of time savings in overall economic benefits is lower than that for private toilets.
Benefit-Cost Ratio0 2 4 6 8 10
Yunnan
Vietnam
The Philippines
Lao PDR
Indonesia
Cambodia
Healthcare
Health productivity
Health mortality
Water access
Water treatment
Access time
Reuse
Benefit-Cost Ratio0 2 4 6 8 10
Yunnan
Vietnam
The Philippines
Lao PDR
Indonesia
Healthcare
Health productivity
Health mortality
Water access
Water treatment
Access time
FIGURE 16: BENEFIT-COST RATIOS OF PRIVATE WET PIT LATRINES IN URBAN AREAS
FIGURE 15: BENEFIT-COST RATIOS OF PRIVATE TOILETS WITH SEWERAGE IN URBAN AREAS
7 According to the JMP 2011 estimates, the following shares of the urban population continue to use shared or public facilities: Cambodia 10%, China 24%, Indonesia 10%, Lao PDR 5%, the Philippines 17%, and Vietnam 5% (WHO and UNICEF 2013).

Economic Assessment of Sanitation Interventions20
Economic Assessment of Sanitation Interventions in Southeast Asia | Economic Returns of Sanitation
3.1.4 URBAN SETTINGS—COMPARING OPTIONS WITHIN COUNTRIES
This section focuses on the differences in economic returns between technologies, and the variation between ideal and actual performance. Differences between ideal and actual performance are accounted for by two reasons: (1) some households do not use the latrine over the full life of the hardware, either because they do not wish to change their behavior or because the hardware itself is not functioning; and (2) off-site systems for sludge and wastewater transport and treatment are not used to their full capacity.
Figure 18 shows the significant difference in economic per-formance between the sewerage and wastewater treatment system in one urban site in Cambodia, and the alternative that is still practiced by many households: a brick sedimen-tation tank that acts as a septic tank. The net return on
the sedimentation tank is 1.8, falling to 1.4 due to nonuse in some households. The sewerage system at the study site has a poor economic performance with a BCR of 0.14, re-duced to 0.03 when taking into account that, at the time of the study, only 20% of target households and properties had actually connected to the sewerage system. This find-ing raises serious concerns about the selection of large-scale infrastructures that risk having a low utilization rate. The coastal town surveyed, Sihanoukville, is an important tour-ist site in Cambodia with further tourism development po-tential (see section 3.3.1). Therefore, some economic ben-efits have not been counted in the analysis. However, the low connection rate, which is due to a lack of regulation and a lack of financial support for households to connect, raises concerns about assumptions made during the project design stage. The majority of the town’s wastewater is still deposited, untreated and very close to the tourist beaches.
FIGURE 17: BENEFIT-COST RATIOS OF SHARED OR PUBLIC TOILETS IN URBAN AREAS
Communitytoilets
Sharedpit latrine
Sharedwet pit latrine
Sharedpit latrine
Sharedseptic tank
Sharedseptic tank
Communitytoilets
Sharedsewerage
Indo
nesi
aLa
o PD
RTh
e Ph
ilipp
ines
Yunn
an
Benefit-Cost Ratio
Healthcare
Health productivity
Health mortality
Water access
Water treatment
Access time
0 2 4 6 8 10

www.wsp.org 21
Economic Assessment of Sanitation Interventions in Southeast Asia | Economic Returns of Sanitation
Figure 19 shows that wet pit latrines have the best econom-ic performance in urban sites in Indonesia. However, where this is not feasible or desirable for the household, other op-tions are economically viable. Sewerage and septic tanks have a similar economic performance at approximately 1.8; however, under actual use, this ratio drops to 1.4 and 1.1 for septic tanks and sewerage, respectively. Community fa-cilities (SANIMAS) do not perform as well as the private facility options, with a BCR of 1.4, which drops to 0.85 under actual conditions. Given that SANIMAS is an option that has some traction with the government and communi-ties, attempts should be made to reduce facility costs while maintaining quality.
In Lao PDR, wet pit latrines are by far the most economi-cally viable option, with a BCR of greater than 6, as shown in Figure 20. Septic tanks and sewerage have a BCR of less than half that of the wet pit latrine; however, these options are still economically viable. There is greater uncertainty over the economic performance of sewerage, given that the unit costs were drawn from another country. Similarly, shared options are economically viable, with the low cost pit latrines having the most favorable economic return.
Figure 21 shows the economic performance of sanitation options in urban areas of the Philippines. Unlike other countries, in the Philippines the economic performance of sewerage and septic tanks is very similar to that of wet pit latrines, at around 4.4. However, this finding is quite deceptive because wet pit latrine options were assessed for urban sites outside Metro Manila, whereas the sewerage and septic tank options were heavily influenced by the
higher relative value of time in Metro Manila. This fac-tor also explains why septic tanks had a higher BCR in urban than in rural areas of the Philippines. Shared and community toilets have lower BCRs of 2.3 to 2.5, and UDDT at San Fernando costal urban area has the lowest BCR, at 1.5. For all options, there is significant reduction in efficiency when considering the nonuse of facilities or system capacity.
Figure 22 shows that wet pit latrines have the best perfor-mance of any option in Vietnam. However, these facilities were only assessed at one of five urban sites (Quang Nam). Septic tanks and sewerage had a reasonable economic per-formance, with BCRs of 3.6 and 3.2, respectively. Unusu-ally, septic tanks with WWM had a higher BCR than septic tanks without WWM, even though some of the potential benefits of improved WWM such as reuse value were omit-ted. This is explained by the context-specific features of the different urban locations evaluated. Shared latrines and public toilets, which are used by only about 5% of the ur-ban population, were not evaluated.
Figure 23 shows that, in Yunnan Province, pit latrines (mainly wet pits) have the most favorable performance, with a BCR of 5.2, followed by community toilets, at 4.4. However, when nonuse is taken into account, the net eco-nomic returns drop significantly, to 3.7 and 3.3, respective-ly. Septic tanks with sludge collection and treatment have a BCR of 2.7, and sewerage with wastewater treatment has a BCR of 1.9. Because of below-capacity utilization of off-site facilities, the actual BCRs are lower at 1.95 and 1.45, respectively.
Benefit-Cost Ratio
Sewerage
Septic tank
Actual
Ideal
Actual
Ideal
0.03
0.14
1.41
1.79
0 2 4 6 8 10
FIGURE 18: BENEFIT-COST RATIOS OF SANITATION OPTIONS IN CAMBODIA, URBAN SITES

Economic Assessment of Sanitation Interventions22
Economic Assessment of Sanitation Interventions in Southeast Asia | Economic Returns of Sanitation
FIGURE 19: BENEFIT-COST RATIOS OF SANITATION OPTIONS IN INDONESIA, URBAN SITES
0 2 4 6 8 10
Benefit-Cost Ratio
Shared
Wet pit
Septic tank
Sewerage
CommunityActual
Ideal
Actual
Ideal
Actual
Ideal
Actual
Ideal
Actual
Ideal
0.85
1.41
1.74
2.30
2.37
3.16
1.43
1.89
1.09
1.74
FIGURE 20: BENEFIT-COST RATIOS OF SANITATION OPTIONS IN LAO PDR, URBAN SITES
Benefit-Cost Ratio
Sharedseptic tank
Wet pit
Septic tank
Sewerage
Shared wetpit latrine
Actual
Ideal
Actual
Ideal
Actual
Ideal
Actual
Ideal
Actual
Ideal
0 2 4 6 8 10
0 2 4 6 8 10
Benefit-Cost Ratio
Septic tank(WWM)
Wet pit
UDDT
Community
Shared
Sewerage
Septic tank(no WWM)
Actual
Ideal
Actual
Ideal
Actual
Ideal
Actual
Ideal
Actual
Ideal
Actual
Ideal
Actual
Ideal
1.70
2.48
1.32
2.29
2.77
4.45
1.15
1.53
4.55
5.58
3.44
4.28
3.60
4.35
FIGURE 21: BENEFIT-COST RATIOS OF SANITATION OPTIONS IN THE PHILIPPINES, URBAN SITES

www.wsp.org 23
Economic Assessment of Sanitation Interventions in Southeast Asia | Economic Returns of Sanitation
3.2 NONMONETIZED BENEFITS OF SANITATION
3.2.1 HEALTH RETURNSImproved sanitation reduces significantly the transmission of fecal-related diseases and associated premature mortality; the main disease being diarrhea. Sanitation is also effective in preventing intestinal nematodes and reducing diseases associated with childhood malnutrition (through the link between repeated diarrheal episodes, enteropathy and mal-nutrition). The disability-adjusted life-year (DALY) is a widely adopted method for aggregating a range of diseases with different levels of severity, as well as diseases that have different case fatality rates. The cost per DALY averted is how much spending it takes to avert one year of life that is entirely free from disability. The DALY is similar to a healthy life year or a quality-adjusted life year. The health impacts of sanitation interventions in each country were
converted to the numbers of DALYs averted using standard methods (Murray, et al. 2001). Summaries of results for se-lected sanitation options in rural and urban areas are shown in Figure 24 and Figure 25, respectively.
In order to understand how to achieve the greatest health gain for a given health budget, and eventually give advice to health financiers and policymakers on how to spend health budgets, the efficiency of different sanitation interventions should be compared. However, in the absence of data sets on the cost per DALY of the full range of health interven-tions, a threshold cost per DALY is needed to indicate whether an intervention represents good, moderate or poor value-for-money. Indeed, few guidelines exist for interna-tional benchmarks of cost-effectiveness. According to the World Health Organization, a health-improving interven-tion with a cost per DALY of less than the GDP per capita
FIGURE 22: BENEFIT-COST RATIOS OF SANITATION OPTIONS IN VIETNAM, URBAN SITES
Benefit-Cost Ratio
Septic tank(WWM)
Wet pit
Sewerage
Septic tank(no WWM)
Actual
Optimal
Actual
Optimal
Actual
Optimal
Actual
Optimal
6.76
8.64
2.88
3.20
3.04
3.55
2.91
3.19
0 2 4 6 8 10
FIGURE 23: BENEFIT-COST RATIOS OF SANITATION OPTIONS IN YUNNAN PROVINCE, URBAN SITES
0 2 4 6 8 10
Benefit-Cost Ratio
Pit latrine
Community
Septic tank
Sewerage
Shared
Actual
Optimal
Actual
Optimal
Actual
Optimal
Actual
Optimal
Actual
Optimal
3.28
4.39
1.93
3.14
3.68
5.21
1.95
2.72
1.45
1.86
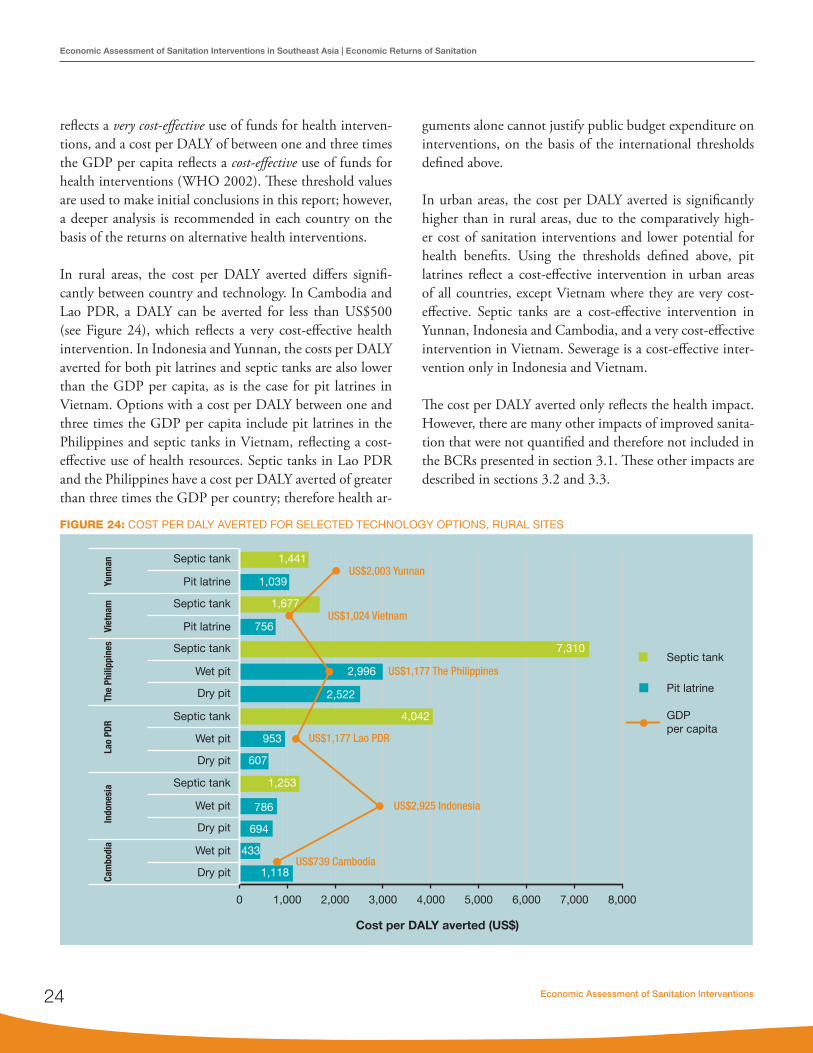
Economic Assessment of Sanitation Interventions24
Economic Assessment of Sanitation Interventions in Southeast Asia | Economic Returns of Sanitation
reflects a very cost-effective use of funds for health interven-tions, and a cost per DALY of between one and three times the GDP per capita reflects a cost-effective use of funds for health interventions (WHO 2002). These threshold values are used to make initial conclusions in this report; however, a deeper analysis is recommended in each country on the basis of the returns on alternative health interventions.
In rural areas, the cost per DALY averted differs signifi-cantly between country and technology. In Cambodia and Lao PDR, a DALY can be averted for less than US$500 (see Figure 24), which reflects a very cost-effective health intervention. In Indonesia and Yunnan, the costs per DALY averted for both pit latrines and septic tanks are also lower than the GDP per capita, as is the case for pit latrines in Vietnam. Options with a cost per DALY between one and three times the GDP per capita include pit latrines in the Philippines and septic tanks in Vietnam, reflecting a cost-effective use of health resources. Septic tanks in Lao PDR and the Philippines have a cost per DALY averted of greater than three times the GDP per country; therefore health ar-
guments alone cannot justify public budget expenditure on interventions, on the basis of the international thresholds defined above.
In urban areas, the cost per DALY averted is significantly higher than in rural areas, due to the comparatively high-er cost of sanitation interventions and lower potential for health benefits. Using the thresholds defined above, pit latrines reflect a cost-effective intervention in urban areas of all countries, except Vietnam where they are very cost-effective. Septic tanks are a cost-effective intervention in Yunnan, Indonesia and Cambodia, and a very cost-effective intervention in Vietnam. Sewerage is a cost-effective inter-vention only in Indonesia and Vietnam.
The cost per DALY averted only reflects the health impact. However, there are many other impacts of improved sanita-tion that were not quantified and therefore not included in the BCRs presented in section 3.1. These other impacts are described in sections 3.2 and 3.3.
Yunn
anVi
etna
mTh
e Ph
ilipp
ines
Lao
PDR
Indo
nesi
aCa
mbo
dia
Septic tank
Pit latrine
Septic tank
Pit latrine
Septic tank
Wet pit
Dry pit
Wet pit
Dry pit
Septic tank
Septic tank
Wet pit
Dry pit
Wet pit
Dry pit
0 1,000 2,000 3,000 4,000 5,000 6,000 7,000 8,000
1,441
1,039
1,677
756
7,310
2,996
2,522
953
607
4,042
1,253
786
694
433
1,118US$739 Cambodia
US$2,925 Indonesia
US$1,177 Lao PDR
US$1,177 The Philippines
US$1,024 Vietnam
US$2,003 Yunnan
Septic tank
Pit latrine
GDP per capita
Cost per DALY averted (US$)
FIGURE 24: COST PER DALY AVERTED FOR SELECTED TECHNOLOGY OPTIONS, RURAL SITES

www.wsp.org 25
Economic Assessment of Sanitation Interventions in Southeast Asia | Economic Returns of Sanitation
3.2.2 SANITATION PREFERENCES Sanitation—or more precisely, the act of defecation—is considered a private matter in virtually all societies, and is largely a taboo subject in many Asian countries. Paradoxi-cally, however, the impacts of a lack of adequate sanitation are very public in nature: for example, public humiliation for a woman being caught practicing OD, or the pungent smell emanating from open sewers.
Perceptions of and preferences for sanitation were gathered from interviews with households and through focus group discussions at the 47 field sites in the six study countries. Indeed, a very rich and unique set of data was gathered from the six countries, which has been provided in full in the country reports. Here the intangible aspects of sanita-tion—decisions around sanitation choices and the act of
using a toilet—are assessed with respect to two key ques-tions, which were addressed in detail in the focus group discussions:
• Why should a household own a toilet or latrine? The answer to this question is based on the common real-ization by participants in the focus group discussions of what they appreciate about having an improved toilet facility at their home.
• Why have those households without sanitation not yet made the decision to invest in their own toilet facility? The answer to this question is based on the constraints against getting a toilet, whether financial or cultural, and whether household decision makers are ignorant of the benefits sanitation can bring.
Yunn
anVi
etna
mTh
e Ph
ilipp
ines
Lao
PDR
Indo
nesi
aCa
mbo
dia
Wet pit
Sewerage
Septic tank
Wet pit
Sewerage
Septic tank
Wet pit
Sewerage
Septic tank
Wet pit
Sewerage
Septic tank
Wet pit
Sewerage
Septic tank
Septic tank
Sewerage
Septic tank
Pit latrine
Pit latrine
GDP per capita
Cost per DALY averted (US$)
0 2,000 4,000 6,000 8,000 10,000
2,417
1,389
7,326
3,587
669
331
9,770
9,000
2,785
3,481
1.941
6,518
2,460
2,189
1,651
8,737
1,560 US$739 Cambodia
US$2,925 Indonesia
US$1,177 Lao PDR
US$1,177 The Philippines
US$1,024 Vietnam
US$2,003 Yunnan
FIGURE 25: COST PER DALY AVERTED FOR SELECTED TECHNOLOGY OPTIONS, URBAN SITES

Economic Assessment of Sanitation Interventions26
Economic Assessment of Sanitation Interventions in Southeast Asia | Economic Returns of Sanitation
Table 4 presents the factors affecting households’ use of, or lack of, sanitation, in order of importance. Clear gender differences (whether a factor is more important to men or to women) are also indicated.
The reasons why households have toilets are provided in column 2 of Table 4. Many of the reasons recur across the countries, but often in different order of importance. Timesavings and convenience were ranked among the top responses in four countries, as a lower-ranked response in
Indonesia, and not ranked in the Philippines. Average time per trip varied from 3 minutes in urban areas (Cambodia, Yunnan) to 20 minutes in rural areas (Philippines).8 Con-venience includes not having to get up early, not having to leave children unattended, and not having to seek a place to defecate while it is raining. Safety is considered important in five countries, especially for women and at nighttime. Linked to this is privacy (including shyness and embar-rassment), which is mentioned in four of the six countries. Health, hygiene, and sanitary environment are reasons cit-
TABLE 4: FACTORS EXPLAINING SANITATION COVERAGE AND LACK OF COVERAGE
Country Why those with toilets have them Why those without toilets do not have them
Cambodia 1. Saves time and is convenient2. Safe from danger (women)3. Improved health4. Does not smell and spoil environment (improved)
1. High cost of latrine2. Not used to using latrine3. No space for building latrine4. (Unimproved) latrine has bad smell
Indonesia 1. Source of pride (men)2. Safe to go any time (women)3. Offers privacy (women)4. No need to worry about children (women)5. No need to queue for public toilets or get up early6. Clean and comfortable, no flies
1. High cost of latrine2. No space in or near house 3. Never been offered latrine 4. Not thought about it
Lao PDR 1. Provided support by project2. Clean, no odor, and convenient3. Easy to install and use
1. High cost of latrine2. Never offered a toilet3. Not enough water for pit (1 site)
The Philippines 1. Could not tolerate smell2. Toilet was donated or came with house/grew up with
toilets3. Embarrassment being seen4. Pollution5. Health problems
1. High cost of latrine2. Lack of space or do not own land3. Never been offered toilet facility4. Toilet ruined by flood
Vietnam 1. Saves time and is convenient2. Cleanliness3. Comfort4. Safe, especially at night (women)5. Everyone now has a toilet/saw benefit of neighbor’s
toilets6. Gives greater independence7. Shy to practice OD8. Visitors have toilet to use
1. High cost of latrine2. Never been offered toilet facility3. Lack of space in or near house4. Not enough water for flushing5. Habit/do not care6. Have use of someone else’s toilet
Yunnan 1. Privacy, not being disturbed2. Convenient (especially during rainy periods) and
proximity3. Clean, sanitary4. Comfort5. Water/environmental protection6. Safety, avoid snakes and pests7. Civilized8. Use of toilet room for shower
1. No space2. High cost of latrine3. Never considered4. Limited by location and city planning5. Has not been provided6. Have public toilet to use7. Do not own property8. Not necessary
8 Average time per trip for adults practising open defecation or using public toilet facilities varied by country and by rural/urban location: Cambodia (10 minutes rural, 3 minutes urban), Indonesia (3.5 minutes rural, 7.5 minutes urban), Lao PDR (14 minutes rural, 10 minutes urban), Philippines (20 minutes rural, 9 minutes urban), Vietnam (6 minutes rural, 15 minutes urban), and Yunnan (6 minutes rural, 3 minutes urban).

www.wsp.org 27
Economic Assessment of Sanitation Interventions in Southeast Asia | Economic Returns of Sanitation
ed, or hinted at (e.g., clean, lack of flies), in all six countries. Aesthetic aspects were also mentioned (pollution, no odor, environmental protection) in most countries. Having a toi-let also gives some households a sense of pride, including being able to offer visitors a place to use the toilet. In two countries, households said they have a toilet because they received it from a project.
As expected, there are many reasons for having a toilet. Al-though they could not easily be evaluated statistically and ranked across all countries, the findings provide valuable material for advocacy campaigns to persuade people to own and use a toilet.
The reasons why households do not have toilets are provided in column 3 of Table 4. The most commonly cited reason was the high cost of a latrine. This finding is confirmed by the relatively high cost of even pit latrines as a proportion of the local wages. For example, the full investment costs of an improved dry pit latrine, as a proportion of the aver-age GDP per capita (which is a lower limit on the average wage in a country) was 21% in Cambodia, 4% in Indonesia, 2% in Lao PDR and the Philippines, 11% in Vietnam, and 7% in Yunnan. These percentages reflect the proportion of a household’s income that would have to be spent on a dry pit latrine, if that household earned the same as the GDP per capita. These percentages are in fact a lower limit for the lowest income groups, which are most likely to have a total household (cash) income below the GDP per capita, espe-cially in rural areas. Furthermore, these percentages refer to dry pit latrines, which have the lowest investment cost of any
sanitation option across all countries. On the other hand, these costs reflect the full investment costs, and do not in-clude what surveyed households spent on sanitation due to cofinancing of interventions by governments and donors.
The lack of land on which to build a pit latrine and the lack of space in dwellings for a toilet room are important non-financial barriers to owning a toilet, especially in urban ar-eas. Other context-specific constraints include lack of water for flushing, and the risk of flooding due to low-lying land. For families renting their dwelling, there is little incentive to invest in a toilet. Some do not feel the need as they use someone else’s facility or a public facility. Other reasons cited by participants include: ignorance of toilets (“never thought about it”); they are not used to latrines; they are content with their traditional practice; and they have had a bad experience with smelly latrines. The “recipient” men-tality is echoed in all countries—many respondents stated that they do not have a toilet because they have never been offered one.
Table 5 builds on the reasons to invest in an improved toilet facility, providing information on the impacts of OD on welfare. These data were extracted from information gath-ered in household interviews. A significant proportion of households without a toilet cited feeling in danger while going to the toilet in the open (at least 24%), or worrying about the safety of their children (at least 31%). It is clear that a majority of households are concerned about the dan-gers of OD. A smaller proportion (at least 13%) of respon-dents had heard about animal attacks while practicing OD.
TABLE 5: CONCERNS OF THOSE PRACTICING OPEN DEFECATION (% OF RESPONSES)
Country Sample size (number)
Felt in danger (%) Worried about safety of children (%) Heard about animal attack (%)
Sometimes Often Sometimes Often Sometimes Often
Cambodia 367 52 39 48 42 42 8
Indonesia 350 50 72 19
Lao PDR 336 19 40 19 55 9 4
the Philippines 221 28 18 25 37 11 2
Vietnam 211 9 31 53 36 7 54
Yunnan 58 23 1 26 5 21 3

Economic Assessment of Sanitation Interventions28
Economic Assessment of Sanitation Interventions in Southeast Asia | Economic Returns of Sanitation
However, having a toilet facility at home does not guar-antee that families will use it, or that it will be used by all household members. This might be because the type of toi-let facility does not meet the expectations of a family or some of its members. This is especially the case in sanitation programs that do not sufficiently raise awareness and gener-ate demand for toilets, and those that deliver or construct a type of toilet that the family does not want. In some cases, it may be because the toilet is not sufficiently cleaned and maintained and hence becomes unpleasant (e.g., smelly) or dangerous to use.
3.2.3 ENVIRONMENTAL IMPACTSPoor sanitation practices have a major impact on the envi-ronment of the study countries. First, there is the continu-ing practice of OD, by both households with and without a household toilet. Of the six countries, OD rates were highest in Cambodia in 2010, at 61%, followed by Lao PDR (28%), Indonesia (17%), the Philippines (8%), and Vietnam (4%). OD is now largely, but not exclusively, a rural phenomenon. National rates of OD in urban areas are significantly lower than these rates in Vietnam, China, Lao PDR, and the Philippines. However, even when house-
holds have a toilet facility, OD persists, as shown in the ESI household survey. This may be because of preference and habit or custom, but also because of convenience, for example when someone is working in the fields and it is not practical to use a toilet facility.
Table 6 shows the OD rates in rural and urban field sites of the six countries, reflecting infrequent or regular OD practice by households with a toilet. The rate of noncompliance (i.e., a household having a toilet facility but not always using it) is highest in rural Cambodia, and is also very high in the field sites in Vietnam where one-quarter of urban households with a toilet admitted to sometimes practicing OD. For the field sites in the four countries that measured it, open urina-tion was considerably more common than OD. Household respondents also commonly spotted children defecating in public areas, with rates especially high in Vietnam and Yun-nan. In Cambodia, 27% of respondents in high coverage vil-lages saw children defecating in the open, compared to 94% for households in rural areas with very low rates of sanitation. In Indonesia, around one-fifth to one-quarter of households with a latrine used a hanging latrine over water, with disposal to water (24% rural, 20% urban).
TABLE 6: CONTINUING POOR SANITATION PRACTICES OF HOUSEHOLDS WITH TOILETS (% OF RESPONSES)
Country Location Open defecation Open urinationStools of children disposed in the
environment
CambodiaRural 44% 81% 27%
Urban 7% 17% 2%
IndonesiaRural 4% 15% 7%
Urban 0% 13% 2%
Lao PDRRural 3% 22% 24%
Urban 2% 3% 4%
The PhilippinesRural 6% 30% 7%
Urban 16% 34% 26%
VietnamRural 21% - 73%
Urban 25% - 72%
YunnanRural 3% - 43%
Urban 4% - 51%

www.wsp.org 29
Economic Assessment of Sanitation Interventions in Southeast Asia | Economic Returns of Sanitation
Sanitation facilities can also cause environmental pollution through pits becoming flooded and overflowing. Table 7 presents selected data from survey countries. Not all sites provided answers to these questions. Flooding appears to be common in the rural site in the Philippines, and two sites in Lao PDR. Furthermore, for those households that have owned their pit latrine or septic tank for a number of years, rates of desludging varied between sites and countries. In Lao PDR, respondents stated that 90% of septic tanks over five years old had been desludged within the past 5 years, and 10% had not been desludged for at least five years. In Indonesia, only 16 out of 250 households that responded to the question said that they have ever had a septic tank or pit latrine desludged.
Water quality surveys were conducted in all or in only se-lected field sites, depending on the country. Although a wide range of parameters were measured (see country re-ports), only E. Coli readings are presented here. The study only made measurements once, and comparisons between low and high sanitation coverage sites were only possible in Cambodia (see Figure 27). In the Philippines, a higher proportion of E. Coli readings were “high” in open water sources than in wells. However, over 50% of water samples from wells had a “high” E. Coli count (see Figure 26).
Figure 27 compares E. Coli readings in different villages in Cambodia—those with 50% sanitation coverage or higher (where projects were operating), and noninter-vention villages with 10% sanitation coverage or lower. It can be seen that the readings are high in low coverage villages, especially those from dug wells, which are more likely to be contaminated by surface water and latrines than boreholes. Although one of the intervention villages had consistently high readings of E. Coli, this village had not reached anywhere near OD-free status, unlike villages at sites 2 and 3.
In Yunnan, water quality samples were taken in one zone—Quibei—which contained one rural and one urban site. Figure 28 shows that E. Coli readings in both these sites remained consistently high, especially for surface water and dug wells. Urban dug wells had, on average, the lowest con-tamination, although three of the eight wells had high E. Coli readings.
The experience of inhabitants is also important, because their welfare is directly affected by poor sanitation. Figure 29 shows scores for the perceived state of the local envi-ronment as it relates to the presence of human excreta in public areas and open sewers, for rural and urban areas in
TABLE 7: POLLUTION CAUSED BY SANITATION FACILITIES (% OF RESPONDENTS)
Country Sites referred to Experienced seepage / flooding into pit Pit overflows “sometimes”
Cambodia Plan International site (CLTS) 41% 28%
Indonesia All rural sites 5.0% 2.5%
Lao PDR Rural sites 3 and 4 only 22.5% 7.8%
The Philippines Rural site San Fernando only 60% 80%
FIGURE 26: E. COLI READINGS OF SAMPLES FROM OPEN WATER SOURCES AND WELLS, THE PHILIPPINES (ALL SITES)
0
10
20
30
40
50
60
70
80
Canal, drain,river, pond
Well
Per
cent
of
sam
ple
s
High Moderate Zero

Economic Assessment of Sanitation Interventions30
Economic Assessment of Sanitation Interventions in Southeast Asia | Economic Returns of Sanitation
the six countries. Scores provided by the respondents have been converted to percentages, with 100% meaning “no perception of any problem related to excreta management.” Scores are particularly low (under 60%) in Cambodia, In-donesia, Yunnan, and urban areas of the Philippines, and
also quite low (60-70%) in Lao PDR and rural areas of the Philippines. Although the best scores come from Vietnam (around 75%), they are far from perfect. The external en-vironment is further assessed in relation to its impact on tourism and business in section 3.3.
FIGURE 27: COMPARISON OF E. COLI READINGS IN HIGH SANITATION COVERAGE VILLAGES (LEFT) WITH LOW SANITATION COVERAGE VILLAGES (RIGHT) IN CAMBODIA
FIGURE 28: E. COLI READINGS FROM QUIBEI RURAL AND URBAN SITES, YUNNAN PROVINCE, CHINA
0 500 1000 1500 2000 2500
D WD WD WD WD WD WD WD WB HD WB HD WB HB HD WD WD WD WD WD WD WD WB HB HB HB HD WB H
Sit
e 1
In
terv
en
tio
nS
ite
2
Inte
rve
nti
on
Sit
e 3
In
terv
en
tio
nS
ite
4
Inte
rve
nti
on
E. Coli (cfu/100 ml) E. Coli (cfu/100 ml)
0 500 1000 1500 2000
D WD WB HB HB HD WD WB HD WB HD WB HD WB HD WD WD WD WD WD WD WB HB HB HB HD WP OL A
Sit
e 1
C
on
tro
lS
ite
2
Co
ntr
ol
Sit
e 3
C
on
tro
lS
ite
4
Co
ntr
ol DW : dug well
BH : boreholePO : pondLA : lake
UR : urban riverUDW : urban dug wellUP-W : urban piped from well
RS-C : rural surface water close to dwellingRS-D : rural surface water distant from dwelling
RDW : rural dug wellRSP : rural spring water
0
5.000
10.000
15.000
20.000
25.000
UR
1U
R 2
UR
3U
R 4
UR
3U
DW
1U
DW
2U
DW
3U
DW
4U
DW
5U
DW
6U
DW
7U
DW
8U
P-W
1U
P-W
2R
S-C
1R
S-C
2R
S-C
3R
S-C
4R
S-C
5R
S-C
6R
S-D
1R
S-D
2R
S-D
3R
DW
1R
DW
2R
DW
3R
DW
4R
DW
5R
SP
1R
SP
2R
SP
3R
SP
4

www.wsp.org 31
Economic Assessment of Sanitation Interventions in Southeast Asia | Economic Returns of Sanitation
3.2.4 OVERALL IMPLICATIONS OF NONMONETIZED BENEFITS FOR EFFICIENCY ASSESSMENT
Chapter 2 stated that because not all relevant sanitation impacts can be captured in monetized form in a cost-ben-efit analysis (CBA), it is important to compare the results of a CBA and the assessment of nonmonetized outcomes of improved sanitation. This section began by examining sanitation’s returns in health units. In fact, the comparison of technologies in cost-effectiveness analysis (CEA) largely mirrors the CBA results, given that CEA is based on disease and mortality rates, while BCR is strongly influenced by health indicators. The fact that many of the cost-effective-ness ratios indicate very favorable health returns on sani-tation investment should support ministries of health to support sanitation interventions. The most basic types of latrine delivered cost per DALY at below (or close to) the GDP per capita of all countries, making sanitation a very cost-effective health intervention.
Some personal and social benefits of latrine ownership are similar when moving from OD to different hardware options, such as convenience, proximity (so that children need not be left alone), the danger of animals and stinging insects, less exposure to social ridicule, and less danger and inconvenience for nighttime use. Other benefits, however, can differ substantially between different qualities of facil-ity. Open pits and some pit latrines may not isolate waste well, so waste is more likely to overflow, especially during the rainy season. Facilities made with local materials (e.g.,
branches, reeds) will not provide the same privacy as a solid wall, and superstructures with gaps in the wall will let through more flies, mosquitoes, and small creatures. On the other hand, dry and open pits, and nonsolid walls may provide a welcome draft to remove odors. In addi-tion, while pride in owning a toilet for visitors to use is a culture-specific phenomenon, there is unarguably a dif-ference in the pride felt depending on the quality of the latrine.
There are also major differences between sanitation op-tions from the perspective of offsite management of excreta. With appropriate septage management there will be less illicit dumping of sludge on the edge of inhabited neigh-borhoods, improving the quality of the environment and reducing disease transmission. As sealed sewerage networks are constructed, the cessation of former dumping practices and open canals will improve the quality of urban envi-ronments. Perception of environmental quality related to sanitation varied significantly between countries, and also between rural and urban areas (see Figure 29). Reducing the disposal of untreated sewage in water bodies will also have a significant impact on water quality, which has not been properly captured in the CBA.
The data presented in this section, therefore, provide a more complete picture of the performance of sanitation options, especially as the estimates in the CBA could not clearly dis-tinguish between the benefit levels of different sanitation options.
FIGURE 29: PERCEIVED QUALITY OF THE ENVIRONMENT RELATING TO OPEN DEFECATION AND OPEN CANALS AND SEWERS (100% = VERY GOOD ENVIRONMENT)
40
45
50
55
60
65
70
75
80
Cambodia Indonesia Lao PDR The Philippines Vietnam Yunnan
Per
cent
Rural Urban

Economic Assessment of Sanitation Interventions32
Economic Assessment of Sanitation Interventions in Southeast Asia | Economic Returns of Sanitation
3.3 WIDER BENEFITS OF SANITATIONThere are several impacts of poor sanitation beyond the preferences of ordinary citizens and community members. Two tangible examples explored in ESI are the impacts on tourism and business. These are important as they affect not only the country as a whole, but also specific neigh-borhoods where poor sanitation persists. These impacts are examined for five of the six countries.9
3.3.1 TOURISMIn 2011, roughly 23 million tourists visited the five countries (Table 8), bringing direct income of US$34 billion. Currently, direct tourism receipts account for 2.0% to 9.5% of GDP and 2.1% to 8.0% of employment. With tourism expected to grow in all of these countries by at least 5.5% per annum over the next 10 years, this reflects an important and still growing sec-tor. The responsible government agencies should therefore do all they can to promote sustainable tourism in their countries.
Foreign tourists and business visitors were asked about their general and sanitary experiences in the countries visited, through questionnaire interviews, mainly at the departure gates of international airports. More than 1,300 question-naires were completed.
Visitors were asked to rank their sanitary experience in various locations. The best performing locations were hotels, restaurants, and swimming pools, with average scores of over 70% out of the ideal score of 100% (Table 9). Private owners make these environments pleasant in order to attract foreign visitors. The poorest performing variable was the general sanitary condition of the coun-tries, which saw scores of little over 50% in all cases. City environments and open water such as rivers, lakes, and the sea resorts performed a little better with scores of 50% to 70%.
TABLE 8: TOURIST ARRIVAL STATISTICS AND IMPORTANCE TO THE ECONOMY AND EMPLOYMENT, 2011
CountryAnnual number
of tourist arrivals (million people)
Tourism receipts
(US$ billion)
Tourism as % of GDP Tourism as % employment Expected tourism
growth until 2022, % per
yearDirect1 Total2 Direct1 Total2
Cambodia 2.8 1.9 9.5 22.1 8.0 19.2 6.0
Indonesia 7.7 21.2 3.0 8.8 2.6 7.7 6.9
Lao PDR 2.7 0.44 5.8 18.2 4.9 15.9 5.5
The Philippines 3.9 4.4 2.0 8.5 2.1 9.6 6.5
Vietnam 6.0 6.2 4.3 10.0 3.7 8.6 6.1
Source: World Tourism & Travel Council, www.wttc.org 1 “Direct” reflects income and employment generated by industries that deal directly with tourists, including hotels, travel agents, airlines, and other passenger transport services, as well as the activities of restaurant and leisure industries that deal directly with tourists.2 “Total” equals indirect and induced income and employment: capital investment, government spending and supply chain effects, and the further private household spending these induce.
TABLE 9: SANITARY EXPERIENCE OF VISITORS IN DIFFERENT PLACES (SCALE 0–100; 100 = VERY GOOD)
CountryNumber
of visitors interviewed
General sanitary
conditionHotel Swimming
pool Open water Restaurant Capital city Other cities
Cambodia 334 50 72 76 62 74 52 60
Indonesia 235 52 76 66 68 76 62 70
Lao PDR 254 49 75 73 46 71 55 58
The Philippines 189 57 78 74 67 75 60 63
Vietnam 300 57 - - - - - -
9 Wider benefits were not within the scope of the ESI study in Yunnan Province, China

www.wsp.org 33
Economic Assessment of Sanitation Interventions in Southeast Asia | Economic Returns of Sanitation
Foreign visitors need access to clean toilets because they are outside their hotels most of the day. Table 10 presents data on the availability and perceived quality of toilets at selected locations. There was sharp variation in the availability of toilets between countries, with between 1% (Indonesia) and 46% (Lao PDR) of visitors being unable to find a toi-let when they needed one. The quality of toilets and hand-washing facilities was adequate in restaurants (scoring at least 60% compared to the ideal of 100%), whereas bus sta-tions and city center facilities scored the lowest, with scores of between 34% and 52%.
A significant proportion (around one-quarter to one-fifth) of foreign visitors experienced gastrointestinal illnesses dur-ing their stay (see Table 11). Although their symptoms last-ed an average of 2.2 to 4.4 days, they were incapacitated be-tween 0.6 and 2.9 days. Treatment cost varied from US$5.7 per person in Lao PDR to US$41.8 in Indonesia.
There are many health risks for foreign visitors, who were queried about their perceived risk of gastrointestinal tract infections (mainly fecal-oral disease). It is clear from the
results presented in Table 12 that in most countries, foreign visitors did not feel safe. Visitors perceived the most risk concerns (up to three per respondent) in Cambodia, fol-lowed by Lao PDR and Indonesia. The highest perceived risks in Cambodia related to unsanitary toilets and tap wa-ter, while in Lao PDR and Indonesia it was food. Tap water ranked high as a perceived risk in Lao PDR and Vietnam, whereas public toilets were also a major concern in Lao PDR. The greatest risk in the Philippines was perceived to be bottled water, probably because that was the main source of drinking water for visitors.
Between 12% and 26% of foreign visitors said that they would be hesitant to return to the country for a future vis-it (see Table 13). When these respondents were asked to explain their hesitancy, they were given a list of potential reasons.10 Poor sanitation was cited as the most important factor in the Philippines (the main reason in 40% of cases and a contributory reason in 25% of cases). Sanitation was cited as affecting hesitation in 26% of cases for Cambodia, 46% of cases for Indonesia, 17% of cases in Lao PDR and 14% of cases in Vietnam.
TABLE 10: AVAILABILITY OF PUBLIC TOILETS AND SANITARY EXPERIENCE OF VISITORS
Country Proportion of visitors unable to find a toilet when needed (%)
Quality of toilets and hand washing facilities (100 = very good)
Restaurant Bus station City facilities
Cambodia - 64 42 40
Indonesia 1% 60 40 40
Lao PDR 46% 64 38 40
The Philippines 14% 70 44 52
Vietnam - 64 44 38
TABLE 11: GASTROINTESTINAL ILLNESSES—FREQUENCY, DAYS OF ILLNESS AND MEDICAL TREATMENT COST
Country Proportion of visitors with GIT during their stay
Number of days symptoms (average)
Number of days incapacitated (average)
Average cost per visitor seeking medical care (US$)
Cambodia 23% 3.1 0.7 13.2
Indonesia - 3.0 1.9 41.8
Lao PDR 19% 2.2 0.6 5.7
The Philippines 25% 4.4 2.9 17.8
10 These reasons were concerns about physical safety, too costly, no need as they already saw the country, dirty/poor sanitary environment, poor service, and too many tourists.

Economic Assessment of Sanitation Interventions34
Economic Assessment of Sanitation Interventions in Southeast Asia | Economic Returns of Sanitation
3.3.2 BUSINESSSeventy businesses were interviewed across five countries, focusing on enterprises that are especially affected by envi-ronmental factors (see Annex Table A6). These businesses were asked to rank different environmental variables with-in the geographical reach of their business. Water quality ranked consistently low in all countries, and across most businesses. Many businesses spend significant sums on treating water so that it reaches the quality they require. The
TABLE 12: STATED HEALTH CONCERNS, PROPORTION OF RESPONDENTS CITING EACH FACTOR (MAX. 3 PER RESPONDENT)
Health Concern Cambodia Indonesia Lao PDR The Philippines Vietnam
Bottled water 29% 19% 27% 64% 5%
Tap water 43% 18% 39% 11% 36%
Food 38% 21% 43% 5% 36%
Unsanitary toilets 46% 18% 5% - -
Public toilets 31% 10% 40% - -
Currency notes 16% 8% 10% - 11%
Swimming pool water 9% 1% 10% 20% 7%
Shaking hands 7% 1% 5% - 5%
TABLE 13: VISITORS’ HESITANCY TO RETURN, AND IMPORTANCE OF POOR SANITATION AS A REASON
CountryTourists hesitant to return (“no return,” “maybe,” or
“don’t know”)
In explaining their hesitancy to return, poor sanitary conditions stated as the:
Main reason Contributory reason
Cambodia 17% 6% 20%
Indonesia 17% 46%
Lao PDR 13% 4% 13%
The Philippines 12% 40% 25%
Vietnam 26% 6% 8%
TABLE 14: IMPORTANCE OF DIFFERENT FACTORS FOR BUSINESS LOCATION AND REVENUES (100 = VERY IMPORTANT)
Factor Cambodia Indonesia The Philippines Vietnam
Workforce health 95 96 92 77
Pleasant environment for your staff 96 98 96 74
Availability of cheap and good land 87 92 70 60
Water quality directly available from nature 73 96 81 71
Total companies responding 19 10 17 7
state of environmental infrastructure, such as drains, canals, and WWMs, also ranked poorly. Ambient air quality from both vehicle emissions, open sewers and poorly managed solid waste were considered to be serious issues. Table 14 shows that company bosses, when considering current busi-ness operations and potential future expansion, especially value workforce health and a pleasant external environment for their staff.

www.wsp.org 35
IV. Issues in Decision Making
4.1 USING THE STUDY RESULTSChapter 2 introduced the various uses of economic assess-ment (see Box 1), which included generating scientific evi-dence to support sanitation investments, and enabling the comparison of efficiency and nonmonetized benefits to in-form the selection and financing of appropriate sanitation programs and technologies. Some of the key messages of this study are highlighted below.
The first key message is that sanitation has been shown to have significant economic and social returns in the six countries of this study. The significant amount of economic evidence collected in a diversity of urban and rural settings indicates that benefits exceed costs in almost all cases.11 In five out of six countries, BCRs were at least 5 in rural areas and at least 3 in urban areas. Inclusion and valuation of san-itation benefits was conservative throughout the analysis.12
Some benefits were omitted from the BCR but shown to be important to households. These intangible welfare benefits include dignity, comfort, prestige, security, gender equal-ity, household cleanliness, and the aesthetics of the com-munity environment. Hence the values presented reflect an artificially low economic performance. These findings reassure those both planning and implementing sanitation programs that their intervention can bring a net benefit to society generally, and to poor households specifically. Given that sanitation advocacy has traditionally drawn on health and dignity messages, evidence on the financial and eco-nomic returns to households and society will also encourage potential financiers to spend more on sanitation programs.
The second key message is that to capture the full eco-nomic benefits, programs and technologies have to be
effective, wanted, and sustainable. When a facility is not used by some or all family members, or falls into disrepair because the hardware has broken down or the pit or tank is not emptied, economic performance declines. The field research showed that there was sometimes a significant de-cline in economic performance at most sites due to the fa-cilities not being used. Sewerage networks and wastewater treatment plants in large-scale systems are characterized by low use, leading to reduced economic performance.
The third key message is that the variation shown in eco-nomic performance between different technologies and programs in different field contexts indicates that it is crucial for decision makers to have a good understand-ing of the costs and benefits of sanitation in their spe-cific context. Furthermore, economic performance results might be counterintuitive, such as the annualized costs of shared latrines exceeding private latrines. Households con-sidering upgrading from one sanitation option to another (e.g., moving from shared to private latrine, or from dry pit to wet pit latrine) will not face the same marginal costs and benefits as those currently with no option. Decision makers therefore need to be made aware of how improved evidence can lead to better selection of interventions, thus leading them to invest in research. For ministry or local govern-ment staff, this requires an underlying motivation to make good use of public funds—not just “quick wins,” but also long-term effective interventions. When evidence is avail-able, public decision makers can avoid making high-cost investments with unaffordable financing requirements for operations and maintenance, where there is a high risk of systems falling into disrepair.
11 The one exception was in Sihanoukville, Cambodia, where the costs of a sewerage system and wastewater treatment plant exceeded the resultant health and time savings. However, the averted water pollution and tourism benefits were not included in the CBR.12 For example, in the Philippines the base case BCR of 5.0 for dry pit latrines increased to 14.1 when the value of time for adults increased from 30% of GDP to 100%, and for children 15% of GDP to 50%. When a higher value was used for the value of life, using the value-of-statistical-life technique, the BCR increased to 7. Even when investment costs doubled, the BCR remained highly favorable, at 2.9.

Economic Assessment of Sanitation Interventions36
Economic Assessment of Sanitation Interventions in Southeast Asia | Issues in Decision Making
Sanitation is known to be fundamental to the welfare of everybody, whether it be at home, in school, at work, or in public. The quality of a country’s sanitation can affect its reputation in the world, most notably among foreign visi-tors (who are responsible for valuable foreign earnings that directly account for as much as 10% of GDP) and foreign companies that bring key investments and know-how that are linked to economic growth. Hence, good sanitation is fundamental to a country’s economic growth.
4.2 NATIONWIDE GENERALIZABILITY OF THE RESULTS
One key use of this study is to inform national policy. Although the field sites were selected to be representative of typical situations in each country (or province in the case of Yunnan), a policymaker would wish to know how rep-licable the results are in other locations. Table 14 presents a brief description of how representative the field sites are of the six countries. Further details of selection criteria and justification are provided in the country reports.
TABLE 15: SUMMARY ASSESSMENT OF FEATURES OF FIELD SITES AND THEIR GENERALIZABILITY
Country/ province
Rural or urban
No. of projects or sites
Nature of field sites selected and reason for selection Possible implications for generalizability
Cambodia Rural 4 All projects were located around Tonlé Sap lake, due to easy accessibility and focus of donor projects in that area.
Difference in ethnic, climatic and economic features is only marginal throughout the country. Results are not relevant to seasonally flooded areas.
Urban 1 Site in coastal tourism town selected, as few towns with functioning WWTP were available at time of study.
Relatively small hilly town made this an expensive site compared to other medium-sized towns.
Indonesia Rural 2 Sites on East Java and Banten. Lamongan (East Java) represents a site with high coverage achieved from joint donor-government program. Tangerang (Banten), a site that experienced diarrheal outbreaks in 2004 and 2007, received community-based sanitation (SANIMAS) intervention.
Urban 3 Sites were chosen on three main islands where sewerage and community sanitation systems are functioning.
Sites represent three major islands (Banjarmarsin - Kalimantan island; Malang – East Java; Payakumbuh - Sumatera island). The system in Malang has already been replicated elsewhere.
Lao PDR Rural 4 Sites were chosen on the basis of the limited availability of relevant projects.
Areas represent northern, central and southern areas.
Urban 2 Sites were chosen on the basis of the limited availability of relevant projects.
Cities represent national and provincial capital cities. No site with WWM.
The Philippines
Rural 3 One site on Luzon, and two sites on central and southern islands with a mixture of rural and urban barangays (communes)
One site where ecological sanitation is practiced; other sites reflect poor populations.
Urban 3 All sites on Luzon (main) island, where Metro Manila is situated
Range of urban sites, including capital city, and two small coastal cities
Vietnam Rural 8 Sites selected in southern, central, and northern regions represent the different ecological zones. In rural areas, biogas also assessed.
Similar results across different sites suggest a high degree of generalizability.
Urban 5
Yunnan Rural 4 Three zones identified in northern, central and southern areas of province, with rural, peri-urban, and urban sites selected from each zone
Locations with different features: mountainous, ethnic groups, lakeside near a city, and peri-urban areas.
Urban 4 Cities represented provincial, prefectural and county capitals, and one small town.
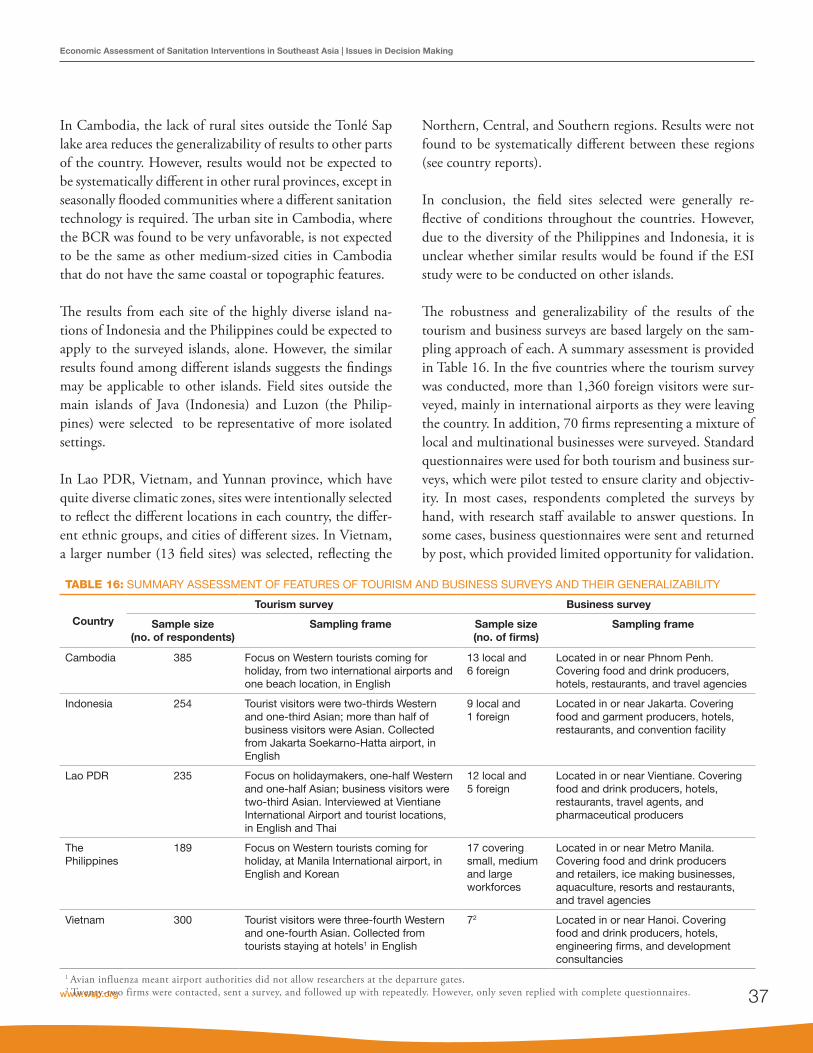
www.wsp.org 37
Economic Assessment of Sanitation Interventions in Southeast Asia | Issues in Decision Making
In Cambodia, the lack of rural sites outside the Tonlé Sap lake area reduces the generalizability of results to other parts of the country. However, results would not be expected to be systematically different in other rural provinces, except in seasonally flooded communities where a different sanitation technology is required. The urban site in Cambodia, where the BCR was found to be very unfavorable, is not expected to be the same as other medium-sized cities in Cambodia that do not have the same coastal or topographic features.
The results from each site of the highly diverse island na-tions of Indonesia and the Philippines could be expected to apply to the surveyed islands, alone. However, the similar results found among different islands suggests the findings may be applicable to other islands. Field sites outside the main islands of Java (Indonesia) and Luzon (the Philip-pines) were selected to be representative of more isolated settings.
In Lao PDR, Vietnam, and Yunnan province, which have quite diverse climatic zones, sites were intentionally selected to reflect the different locations in each country, the differ-ent ethnic groups, and cities of different sizes. In Vietnam, a larger number (13 field sites) was selected, reflecting the
Northern, Central, and Southern regions. Results were not found to be systematically different between these regions (see country reports).
In conclusion, the field sites selected were generally re-flective of conditions throughout the countries. However, due to the diversity of the Philippines and Indonesia, it is unclear whether similar results would be found if the ESI study were to be conducted on other islands.
The robustness and generalizability of the results of the tourism and business surveys are based largely on the sam-pling approach of each. A summary assessment is provided in Table 16. In the five countries where the tourism survey was conducted, more than 1,360 foreign visitors were sur-veyed, mainly in international airports as they were leaving the country. In addition, 70 firms representing a mixture of local and multinational businesses were surveyed. Standard questionnaires were used for both tourism and business sur-veys, which were pilot tested to ensure clarity and objectiv-ity. In most cases, respondents completed the surveys by hand, with research staff available to answer questions. In some cases, business questionnaires were sent and returned by post, which provided limited opportunity for validation.
TABLE 16: SUMMARY ASSESSMENT OF FEATURES OF TOURISM AND BUSINESS SURVEYS AND THEIR GENERALIZABILITY
Country
Tourism survey Business survey
Sample size(no. of respondents)
Sampling frame Sample size(no. of firms)
Sampling frame
Cambodia 385 Focus on Western tourists coming for holiday, from two international airports and one beach location, in English
13 local and 6 foreign
Located in or near Phnom Penh. Covering food and drink producers, hotels, restaurants, and travel agencies
Indonesia 254 Tourist visitors were two-thirds Western and one-third Asian; more than half of business visitors were Asian. Collected from Jakarta Soekarno-Hatta airport, in English
9 local and 1 foreign
Located in or near Jakarta. Covering food and garment producers, hotels, restaurants, and convention facility
Lao PDR 235 Focus on holidaymakers, one-half Western and one-half Asian; business visitors were two-third Asian. Interviewed at Vientiane International Airport and tourist locations, in English and Thai
12 local and 5 foreign
Located in or near Vientiane. Covering food and drink producers, hotels, restaurants, travel agents, and pharmaceutical producers
The Philippines
189 Focus on Western tourists coming for holiday, at Manila International airport, in English and Korean
17 covering small, medium and large workforces
Located in or near Metro Manila. Covering food and drink producers and retailers, ice making businesses, aquaculture, resorts and restaurants, and travel agencies
Vietnam 300 Tourist visitors were three-fourth Western and one-fourth Asian. Collected from tourists staying at hotels1 in English
72 Located in or near Hanoi. Covering food and drink producers, hotels, engineering firms, and development consultancies
1 Avian influenza meant airport authorities did not allow researchers at the departure gates.2 Twenty-two firms were contacted, sent a survey, and followed up with repeatedly. However, only seven replied with complete questionnaires.

Economic Assessment of Sanitation Interventions38
Economic Assessment of Sanitation Interventions in Southeast Asia | Issues in Decision Making
4.3 AFFORDABILITY AND SANITATION FINANCING
During focus group discussions held with representatives of households without sanitation, a significant number of re-spondents cited cost as a major barrier to obtaining a private sanitation facility (see Table 3). Table 17 presents the average costs per household in rural and urban areas in each country.
The question of affordability is explored empirically by comparing the sanitation cost with household income, shown in Figure 30. The two proxy measures of poor peo-ple’s household income are the minimum wage and the av-erage GDP per capita.
The results indicate significant variation in the relationship between the sanitation investment cost and the income proxies. In most rural areas, the investment cost lies be-tween 2% (the Philippines) and 12% (Cambodia) of the GDP per capita, whereas it is between 3% (the Philippines) and 22% (Lao PDR) of the rural minimum wage. In ur-ban areas, the proportion is significantly higher, at between 17% (Indonesia) and 52% (Vietnam) of the GDP per cap-ita, and between 29% (Indonesia) and 55% (Lao PDR) of the urban minimum wage.
TABLE 17: SUMMARY OF TOTAL INVESTMENT AND ANNUAL RECURRENT COSTS PER HOUSEHOLD
Country CostRural areas Urban areas
Dry pit Wet pit Septic tank UDDT Biogas Wet pit Septic tank Sewer
Cambodia Investment 158 173 - - - - 227 5,345
Recurrent 5 2 - - - - 13 16
Indonesia Investment 67 84 582 - - 88 400 513
Recurrent 14 14 25 - - 20 32 45
Lao PDR Investment 114 114 447 - - 133 447 586
Recurrent 6 6 33 - - 6 33 49
The Philippines
Investment 37 108 821 343 - 98 839 1,013
Recurrent 0 20 26 19 - 9 47 27
Vietnam Investment - 110 531 191 9,339 88 530 1,361
Recurrent - 10 18 17 251 10 27 49
Yunnan Investment - 132 408 207 398 187 566 721
Recurrent - 14 31 25 18 20 45 71
UDDT: urine diversion dehydration toilet
0%
10%
20%
30%
40%
50%
60%
Rural Urban Rural Urban Rural Urban Rural Urban Rural Urban Rural Urban
Cambodia Indonesia Lao PDR The Philippines Vietnam Yunnan
Investment cost as a proportion of annual minimum wage Investment cost as a proportion of GDP per capita
FIGURE 30. FINANCIAL INVESTMENT COSTS OF SANITATION1 IN RURAL AND URBAN AREAS AS A PROPORTION OF TWO MEASURES OF ANNUAL INCOME (MINIMUM WAGE AND GDP PER CAPITA)
1 Rural areas: dry pit latrine; urban areas: septic tank with wastewater management.
www.wsp.org 39
Economic Assessment of Sanitation Interventions in Southeast Asia | Issues in Decision Making
In terms of an international affordability standard, this is expressed as the percentage of household income spent annually on water and sanitation, which usually varies be-tween 3% and 6%. However, in the case of most sanitation options the expenditure is “lumpy,” meaning that a large investment is needed upfront and lower recurrent expen-diture is made on operations and maintenance. Hence, to convert the proportions in Figure 30 to annual equivalents would require an estimate of the length of life of the hard-ware. A pit latrine lasting three years before being replaced or emptied would incur annualized costs of up to 7% of the rural minimum wage in Cambodia. If the duration were six years, annualized costs would fall to 3.5%. A septic tank lasting 10 years before being emptied would incur annual-ized costs of around 5% of income in Vietnam and Lao PDR.
For poor families that may only have one income, full cost recovery on their sanitation option is likely to lead to ex-penditure that exceeds an annualized cost of 3% to 6% of income. The investment costs shown in Table 17 are a con-siderable price to pay for the most basic type of improved sanitation, especially when the funds have to be paid up-front rather than in installments (in the case of a loan) or a tariff that includes capital cost (in the case of a utility). Sani-tation options with lower investment costs, such as lower-cost pit latrines and shared septic tanks (between several apartments), are potentially more affordable, but they may not last as long or bring the same benefits as other options evaluated in this study. Therefore, a general conclusion is that a price support mechanism is needed, or at least loans to support upfront costs.
4.4 DISTRIBUTIONAL IMPACTSPublic sanitation programs targeting households without access to a basic level of household sanitation are likely to have a positive redistributive effect in society, because of the strong correlation between income level and sanitation coverage. However, the actual impact on the poor depends on project-level mechanisms to ensure they adopt improved sanitation. These include awareness raising, demand cre-ation and financing measures to ensure that poorer house-holds are not left behind.
Distributional impacts are divided into technical efficiency (such as whether economic returns are greater for poor or
nonpoor households) and practical implementation issues. The case of the Philippines illustrates some of the technical efficiency issues. Figure 31 shows results for rural areas (pri-vate wet pits) and urban areas (community toilets). On the one hand, the BCRs indicate that richer households enjoy a greater rate of economic return. This is largely because the same cost values are assumed for the same technologies, while the richer are assigned a higher value of time in the benefits calculation. On the other hand, the cost per DALY averted is lower for poorer households (i.e., health spending is more efficient) due to the higher disease and mortality rates in these groups.
These results comparing economic performance in richer and poorer households should be interpreted with care be-cause poor households are likely to put a greater value on each dollar of benefit compared to rich households. For example, in rural areas the net present value of the inter-vention is higher as a proportion of annual household in-come for poor households than for nonpoor households. This means that the net gains relative to income tend to be larger for lower income groups, even if the BCR is lower. A further consideration is that higher income groups tend to adopt more expensive technologies, reducing the returns relative to the poorer groups.
The practical issue of targeting poorer households with san-itation programs was not the primary focus of the research. A program approach analysis was conducted to shed light on this issue; drawing on responses from the household surveys, project documents and interviews with project implementers. A snapshot of the main findings is presented below. The full results are presented in the country reports.
In Cambodia, four rural projects were chosen to evalu-ate variations in program approach. Two projects aimed to achieve open defecation (OD) free status, one through encouraging poor households to build their own low-cost simple latrines through Community Led Total Sanitation (CLTS), and the other through a highly subsidized dry pit latrine with concrete rings and robust superstructure. The other two projects encourage toilet use in villages by pro-viding partial hardware subsidies to those households most ready to adopt latrines and able to pay cash, and to provide household labor to build the latrine. In these latter cases, poorer households were commonly given greater subsidies.

Economic Assessment of Sanitation Interventions40
Economic Assessment of Sanitation Interventions in Southeast Asia | Issues in Decision Making
However, poor households often gave their right to this subsidy to other households, in exchange for some negoti-ated return. Because public subsidies are limited, therefore, there is clearly a conundrum: should the entire population be targeted with something that is temporary, or should a smaller proportion of the population be targeted with something more durable?
The majority of on-site facility investments in the Philip-pines were financed by households, except in the case of EcoSan toilets, which at the rural site were partially (31%) financed by the implementing NGO. One site with a waste-water treatment plant involved 85% upfront financing from external sources, reduced to 42% when taking into account the households (tariff) contribution over the lifetime of the infrastructure. In Metro Manila, around 30% of the cost of infrastructure (sewers or desludging septic tanks) was paid upfront by the private concessionaire, while eventually the tariff would cover all the costs of the system. Therefore, except for the limited examples of upfront (credit) financ-ing, there appear to be limited subsidies to make sanitation services more affordable for poor households. In Indonesia, the largest share of subsidies was paid for sewerage (around US$1,700 per household), and community toilets were also heavily subsidized (around 85%). Private on-site facilities, on the other hand, were not subsidized at all. Similarly, in Vietnam, 23% of the investment costs of centralized treat-
ment facilities in urban areas were paid by households, with the proportion increasing to 60% for septic tanks and 98% for wet pit latrines. In rural areas, the highest subsidy (40%) was for the highest cost option (cluster wastewater treat-ment), reducing to 30% for septic tanks and 10% for pit latrines.
As can be seen, the majority of subsidies are being spent on the most costly, large systems and public or community la-trines. The logic is that more expensive systems must entail higher subsidies, to assist households with the necessary up-front payments. However, this means that fewer subsidies are being spent on on-site facilities. The key questions are: Who is selecting or using these different systems? Are poor people more likely to select on-site sanitation options only, therefore gaining very limited access to public subsidies? Are urban areas capturing the majority of benefits? This clearly varies by location, and there is no single answer to this question. Identifying who captures public subsidies was not a central question in this study, although it has been partially answered above: it appears that greater subsidies are being spent on the off-site systems that richer house-holds tend to use, and these are naturally more common in urban areas. Further research is needed on these ques-tions to identify which population groups capture public subsidies, and whether these same subsidies could be more effectively spent on reaching the poorest or most deserving.
FIGURE 31: BENEFIT COST RATIOS (LEFT) AND COST PER DALY AVERTED (RIGHT) FOR DIFFERENT INCOME GROUPS1 IN THE PHILIPPINES
0 50,000 100,000 150,000 200,000 250,000
Very Poor
Poor
Nonpoor
Cost per DALY avertedRural
Urban
0 5 10 15 20
Very Poor
Poor
Nonpoor
Benefit-cost ratioRural
Urban
1 Very poor = income quintile 5; poor = income quintile 4; nonpoor = income quintile 2

www.wsp.org 41
Economic Assessment of Sanitation Interventions in Southeast Asia | Issues in Decision Making
4.5 SANITATION POLICIES AND PROGRAMMING
Ultimately, the results of economic analysis should inform the design and implementation of sanitation policies and programming. The information collected by this study en-ables interpretation of efficiency results. One key result was the decline in efficiency observed at all project sites, due either to household non-compliance (that is, nonadoption of the technology on offer) or a gradual decline in perfor-mance over time (due to poor quality hardware or unsus-tained use). Although these observations do not come as a surprise, the scale of impact on efficiency is sufficient for policymakers to take note. The two causes of performance decline are examined here in turn.
Low initial uptake has several interlinked causes. First and foremost, households decide to remain without improved sanitation because they cannot afford the sanitation options offered. At the urban site of Cambodia, households chose not to pay the sewerage connection fee because there was no legal obligation to do so, and they did not see how it would benefit them. This led to very low capacity utiliza-tion of the sewerage network and the wastewater treatment plant; increasing the cost per household served to five times its design capacity. Households may not adopt sanitation because they are not sufficiently aware of the negative im-pacts of poor sanitation, or there is insufficient social mo-bilization for them to feel a change in behavior is necessary.
Declines in efficiency over time were due to households not sustaining improved behaviors (because of force of habit or lack of conviction), or because the technology itself stopped functioning. In Cambodia, CLTS had a high initial uptake, with most households building their own latrines, but it was not sustained over time because the pit latrines col-lapsed or they quickly became too unhygienic to use. In Indonesia and Lao PDR, some population groups found it hard to change their habits for a long time because they were happy with traditional practices. Furthermore, in rural areas, people who work in the fields are unlikely to go home to access their sanitation facility.
At some sites, a lack of consultation and the supply of inap-propriate technology were responsible for unsustained use of systems. For example, in the Philippines, 7% of house-holds at one site (Bayawan) with a sewerage system reported
having an insufficient household water supply to flushing their toilet; and over 50% of households at this site said that they were not offered any other sanitation options. Across all sites in the Philippines, 20% of households answered that they experience regular pit flooding, making facilities unusable for certain periods during the year. Many unim-proved sanitation practices were found to exist for these reasons, even in sites with sanitation projects. In particular, a high proportion of households saw children regularly def-ecating openly, revealing a public perception that children do not need to conform to adult sanitation behavior. Urina-tion in open areas and public spaces was also still particu-larly prevalent in both rural and urban areas. These issues underline the key roles to be played by consultation and awareness raising.

Economic Assessment of Sanitation Interventions42
V. Recommendations
The overall aim of the Economics of Sanitation Initiative (ESI) is to promote evidence-based decision making to increase the volume, effectiveness, and sustainability of sanitation expendi-ture. The present study has presented evidence on the costs and benefits of sanitation improvements in different programmatic and geographic contexts in Southeast Asia. This evidence en-ables explicit comparison of sanitation options on the basis of their relative merits and thus informs both public and private decisions on sanitation investment. The following six recom-mendations are based on the key findings of the study.
First, the high socioeconomic returns on sanitation in-vestment indicate that it should be promoted as a central development priority. The economic evidence generated in this study has been intentionally broad, demonstrat-ing the importance of improved sanitation to a number of development outcomes, among them public health, the natural environment, education, economic development, social outcomes, gender equality, and poverty alleviation. Improved evidence on the costs of sanitation and those po-tentially willing to pay for it provides an evidence base for sanitation planners and providers from which to estimate the market size for sanitation goods and services.
The study has demonstrated that many arguments can be made for improvements in sanitation—in a variety of forms and for a variety of audiences. Although the responsibility for sanitation policies and programs may fall on one or two government ministries, improving sanitation is in the inter-est of all.
Financiers, however, need to be confident that funds will be put to good use. Rational and realistic sanitation plans need to be
drawn up, detailing the costs of achieving sanitation scale-up and the realistic expected financing sources. Different financiers and program implementers should be approached on the basis of this evidence, to seek both further funds for sanitation and mechanisms to ensure the efficient delivery of services.
A dialogue needs to be started with a range of public fi-nanciers including some nontraditional ones. Pressure can be brought on government by utilizing the media and advocacy groups for human rights, women’s welfare, water, sanitation, and the environment. Key line ministries and government departments that particularly need to buy in to sanitation are those responsible for education, health, workplace conditions, water resources management, municipal services, rural development, and tourism (see Box 2).
Local governments are also key promoters of sanitation policies, as demonstrated by the case of Indonesia, where important advocacy has been provided by local govern-ment leaders, such as mayors. An alliance of districts and cities that mainstreams sanitation development was formed. Since 2010 the central government has been implementing the Acceleration of Residential Sanitation Development Program (Program Percepatan Pembangunan Sanitasi Permukiman/PPSP). Its target is that at least 330 of 497 districts or cities in Indonesia should join in the program by 2014. The program provides technical assis-tances to local governments to prepare their medium-term sanitation development strategic planning. The central government and Sanitation Donor Group (SDG) estab-lished a strategic sanitation development plan as a pre-condition for receiving funds for sanitation development.

www.wsp.org 43
Economic Assessment of Sanitation Interventions in Southeast Asia | Recommendations
The sanitation market offers opportunities for businesses and public-private partnerships to develop. The private sec-tor is a key—but largely unexploited—stakeholder that can mobilize funds and bring innovation to sanitation financ-ing, demand creation and service delivery.
Current sanitation technologies and delivery mechanisms in public programs are not very efficient. When project failures and inefficiencies come to light, they put further allocation of funds from governments and donors at risk. The second recommendation, therefore, is that sanitation program and project proposals that use public funds should be scrutinized more closely to ensure maximum chances of success and a high degree of efficiency. At planning phase, therefore, policymakers need to improve program design and procurement processes, and implementers need to be aware of the conditions of success and to conduct real-time monitoring. Decisions about investment in sanitation
need to be based on evidence of the comparative returns of different approaches. These cover both the delivery ap-proach (how to get households to adopt some form of im-proved sanitation) and the technology used, which can vary significantly in terms of their cost, and its impact. Only in this way will the full benefits of investments be reaped.
In order to increase the efficiency of spending, the variation in costs and efficiency of different sanitation options has to be made clear to different stakeholder groups, and evidence needs to be clearly communicated. For example, the ESI has already produced six-page research briefs for each coun-try, which present clearly the comparative costs and BCR of different technology options in rural and urban areas. These figures do not have to be taken at face value, but should stimulate a dialogue between stakeholders to ensure the costs and impacts of different intervention options are fully understood.
BOX 2. OTHER SECTORS OR GOVERNMENT PLAYERS TO ENGAGE ON THE SANITATION AGENDA
1. Education (schools and higher education establishments), where students learn good practices and develop higher expectations with regard to sanitary and hygienic facilities, and take their knowledge and practices home to influence their parents and siblings. This is likely to have a positive impact on school enrolment and completion, and reduce regular absences, especially of girls.
2. Health, where health facilities themselves have good standard of toilets and handwashing facilities and practices, so that patients and visitors learn the appropriate standards. In addition, the ministry or department responsible for health is well placed to (jointly) implement sanitation and hygiene programs to ensure maximum health benefits are captured.
3. Workplaces, where working populations have access to improved sanitation and hygiene services while they are away from home; improving female participation in the workforce.
4. Water resources management and water resources regulation. Through policies, regulation, and advocacy, influence can be exerted on major water resource polluters, including municipal sewage/wastewater and excreta coming from the rural environment (e.g., densely populated settlements and intensive animal farming). These measures are crucial to improving the quality of water resources for human use, as well as protecting biodiversity and ecosystems.
5. Municipal services and rural development. This includes the availability of public toilet facilities with running water and handwashing facilities, and appropriate conveyance of sewage to off-site locations for proper treatment and safe final disposal. Improvement of the communal living environment improves quality of life and makes the environment more attractive for businesses and tourists.
6. Tourism. Ministries and departments of tourism can serve as advocates for sanitation, drawing on an improved understanding of the sensitivity of tourists to matters of sanitation and hygiene. This means improved public toilet facilities, improved environmental quality (especially in tourist hotspots), and improvement in other sanitary and hygiene standards such as solid waste management and food and restaurant hygiene.

Economic Assessment of Sanitation Interventions44
Economic Assessment of Sanitation Interventions in Southeast Asia | Recommendations
There is a risk that economic evidence is not used even though it is available. This can be because decision mak-ers do not believe or trust the data; do not understand it; do not think it is relevant to them (e.g., it is too broad or is out of date); or do not receive it at the right moment. There may also be other important factors influencing their decisions, and influential people may dismiss the evidence. Therefore, a third recommendation is that evidence-based decision-making should be promoted widely. To achieve this, a combination of measures is proposed: (1) de-cision makers are trained in advanced methods of planning, which include economic and financial analysis; (2) decision makers across different departments and jurisdictions are encouraged to work together in a transparent manner and to utilize evidence to solve common issues; (3) evidence is made available, and stored in easy-to-access databases, and presented in an easy-to-digest format; and (4) evidence is updated at least annually to ensure it is relevant to ongoing decisions.
The study found that sanitation is costly for poor people, especially when expenditure is “lumpy,” that is, involving large upfront purchases/payments. Therefore, the fourth recommendation is that financial innovations are fur-ther developed and implemented to promote sustain-able market-based supply of sanitation services. This includes mechanisms to reach the most needy populations. Given that households—even poor ones—are usually able and willing to pay small but regular payments, governments and microfinancing agents should help to finance these up-front payments. Some or all of the costs can then be repaid over the lifetime of the hardware, depending on the subsidy available. Many prior examples exist to help plan future programs. In settings where poor households are not willing to enter into a contractual arrangement, or the financing is not available, lower-cost sanitation options can be utilized as a stop-gap measure until the households can finance a higher quality sanitation installation.
This study showed that there may be a significant drop in efficiency and benefits actually received by households and communities, either because the wrong technology is cho-sen, or solutions are delivered inappropriately, leading to in-dividual practices not being sustained. Therefore, the fifth
recommendation is that considerable further attention is given to improving program design and implementa-tion, in order to capture the full benefits of sanitation programs. Sanitation programs need to be more people-centered: they need to be demand-driven. Public decision makers and private suppliers should make available differ-ent sanitation options, so that individuals and communities themselves can weigh up their costs and benefits, and they can be supported in this decision-making process. Low-cost and proven effective and sustainable approaches to house-hold sanitation improvement should especially be promot-ed. Women need to be given at least an equal voice as men; the needs of the elderly, children, and people who are physi-cally impaired need to be considered, and adapted sanita-tion options offered (such as extra space and railings). Sani-tation programs should contain information campaigns on the benefits of sanitation and hygiene, standards of practice, and the importance of continued practice and maintenance. The delivery of technology should be accompanied by tech-nical guides and instruction manuals of different levels of complexity (e.g., one for the supplier, and another for the user). The various financing and technical assistance part-ners should ensure that they apply and respect the national sanitation policy and technical guidelines, and they should coordinate among themselves and share best practice.
Good quality economic evidence is in short supply in the surveyed countries. Budgets tend to be allocated and tech-nologies chosen on the basis of historical reasons, and in-cremental changes are often based on political influences rather than efficiency arguments. Scientific evidence is very rarely systematically evaluated in a way that examines all the pros and cons, in order to inform a policy. Therefore, the sixth recommendation is that the evidence base needs to be built and used opportunistically to support better de-cision making. Evidence includes not only focused research but also improved monitoring and evaluation of sanitation programs and routine information systems. Where funds are available, impact evaluations of projects and programs are highly valuable in that they enable an understanding of the determinants of sanitation impacts under real-life con-ditions. The evidence generated needs to be customized for different audiences, and targeted toward those audiences with technical and learning support.

www.wsp.org 45
Economic Assessment of Sanitation Interventions in Southeast Asia | Recommendations
The key economic evidence includes the overall costs and benefits of interventions, to enable assessment of overall economic and financial performance. In addition, disaggre-gations of cost (hardware investment versus program sup-port versus operations versus maintenance) are also needed to improve budgeting and the efficient allocation of funds. A breakdown of the main benefits by beneficiaries will also enable programs to be more targeted and effective in maxi-mizing benefits. In addition to the monetized benefits, so-cial factors including the strength of preference for differ-ent sanitation types need to be known to avoid promoting the wrong solutions. Better quantification of environmen-tal impacts is needed to support stronger regulations and practices in relation to pollution discharge. These costs and benefits need to be better measured and customized accord-ing to target audiences, and will be supported by a standard methodology and set of tools available in the ESI Toolkit.
Economic Assessment of Sanitation Interventions46
References
Asian Development Bank (ADB). 2008. Completion Report: Provincial Towns Improvement Project, Cambodia. Manila: Asian Development Bank.
Azurin, James, and Alicia M. Alvero. 1974. “Field Evalua-tion of Environmental Sanitation Measures against Cholera.” Bulletin of the World Health Organization 51:19-26.
Barreto, M., et al. 2010. “Impact of a Citywide Sanitation Program in Northeast Brazil on Intestinal Para-sites Infection in Young Children.” Environmental Health Perspectives 118(11): 1637-1642.
Cairncross, S., and V. Valdmanis (2006). “Water Supply, Sanitation and Hygiene Promotion.” Disease Con-trol Priorities in Developing Countries. 2nd Edition, D. Jamison, et al., eds. New York: Oxford Univer-sity Press.
Corcoran, E., et al. 2011. Sick Water? The Central Role of Wastewater Management in Sustainable Develop-ment. A Rapid Response Assessment. Arendal, Nor-way: United Nations Environment Programme, UN HABITAT, GRID-Arendal.
Daniels, D., et al. 1990. “A Case-Control Study of the Im-pact of Improved Sanitation on Diarrhoea Mor-bidity in Lesotho.” Bulletin of the World Health Or-ganization 68(4): 455-463.
Esrey, S. 1996. “Water, Waste, and Well-Being: a Multi-country Study.” American Journal of Epidemiology 143(6): 608-623.
Esrey, S., et al. 1985. “Interventions for the Control of Diarrheal Diseases among Young Children: Im-proving Water Supplies and Excreta Disposal Fa-cilities.” Bulletin of the World Health Organization 63(4): 57-72.
Esrey, S., and J.-E. Habicht. 1986. “Epidemiologic Evi-dence for Health Benefits from Improved Water and Sanitation in Developing Countries.” Epide-miology Review 8: 117-128.
Esrey, S., et al. 1992. “The Complementary Effect of La-trines and Increased Water Usage on the Growth of Infants in Rural Lesotho.” American Journal of Epidemiology 135(6): 659-666.
Esrey, S., et al. 1991. “Effects of Improved Water Supply and Sanitation on Ascariasis, Diarrhea, Dracuncu-liasis, Hookworm Infection, Schistosomiasis, and Trachoma.” Bulletin of the World Health Organiza-tion 69(5): 609-621.
Fewtrell, L., et al. 2005. “Water, Sanitation, and Hygiene Interventions to Reduce Diarrhoea in Less Devel-oped Countries: A Systematic Review and Meta-analysis.” Lancet Infectious Diseases 5(1): 42-52.
Fishman, S., et al. 2004. “Childhood and Maternal Un-derweight.” Comparative Quantification of Health Risks: Global and Regional Burden of Disease Due to Selected Major Risk Factors. M. Ezzati, A. Rodgers, A. Lopez and C. Murray, eds. Geneva: WHO, 2.
Fox-Rushby, J., and K. Hanson. 2001. “Calculating and Presenting Disability Adjusted Life Years (DALYs) in Cost-Effectiveness Analysis.” Health Policy and Planning 16(3): 326-331.
Franceys, R., and C. Pezon. 2010. Services Are Forever: The Importance of Capital Maintenance (CapManEx) in Ensuring Sustainable WASH services. WASHCost Briefing Note 1b. The Hague, The Netherlands: IRC International Water and Sanitation Centre.
www.wsp.org 47
Economic Assessment of Sanitation Interventions in Southeast Asia | References
Hanley, N., and C. Spash. 1993. Cost-Benefit Analysis and the Environment. Cheltenham, UK: Edward Elgar.
Hotez, P., et al. 2006. “Helminth Infections: Soil-Trans-mitted Helminth Infections and Schistosomiasis.” Chapter 4, Disease Control Priorities in Developing Countries, 2nd Edition. Cambridge, MA: Harvard University Press..
Human Rights Council. 2011. The Human Right to Safe Drinking Water and Sanitation. Resolution adopt-ed by the Human Rights Council. 18/1, United Nations General Assembly. 12 October.
Hutton, G., et al. 2007. “Global Cost-Benefit Analysis of Water Supply and Sanitation Interventions.” Jour-nal of Water and Health 5(4): 481-502.
Hutton, G., et al. 2009. Economic Impacts of Sanitation in Lao PDR. Washington: DC: World Bank.
Hutton, G., et al. 2014. “Economic Efficiency of Sanitation Interventions in Southeast Asia.” Journal of Water, Sanitation and Hygiene in Development, in press.
Hutton, G., et al. 2008. Economic Impacts of Sanitation in Southeast Asia. Washington, DC: World Bank.
Moraes, L., et al. 2003. “Impact of Drainage and Sewer-age on Diarrhoea in Poor Urban Areas in Salvador, Brazil.” Trans R Soc Trop Med Hyg. 97(2): 153-158.
Murray, C., et al. 2001. “The Global Burden of Disease 2000 Project: Aims, Methods and Data Sources.” Geneva: WHO.
Prüss, A., et al. 2002. “Estimating the Burden of Disease from Water, Sanitation, and Hygiene at a Global Level.” Environmental Health Perspectives 110 (5): 537-542.
Prüss, A., and S. Mariotti. 2000. “Preventing Trachoma through Environmental Sanitation: A Review of the Evidence Base.” Bulletin of the World Health Organization 78: 258-266.
Sugden, R., and A. Williams. 1978. Principles of Practical Cost-Benefit Analysis. Oxford, UK: Oxford Univer-sity Press.
United Nations. 2010. Resolution adopted by the General Assembly. 64th Session. A/RES/64/292.
Waddington, H., et al. 2009. Water, Sanitation and Hygiene Interventions to Combat Childhood Diarrhea in De-veloping Countries. New Delhi, India: International Initiative for Impact Evaluation (3ie).
WHO and UNICEF. 2013. Progress on Drinking Water and Sanitation. 2013 Update: Joint Monitoring Pro-gramme for Water Supply and Sanitation. Geneva: WHO and UNICEF.
World Health Organization. 2002. Reducing Risks, Promot-ing Healthy Life. Geneva: WHO.
World Health Organization. 2012. UN-Water Global Analysis and Assessment of Sanitation and Drinking-Water. The Challenge of Extending and Sustaining Services. Geneva: WHO.


www.wsp.org 49
Economic Assessment of Sanitation Interventions in Southeast Asia | Annex
A1. FIELD SITE SELECTIONThe field sites were selected on the basis of (a) the presence of a sanitation project or program implemented in the past five years; (b) the presence of at least two different sanitation technologies for comparison purposes, with a minimum sample size of at least 30 households per technology; and (c) relevance of the technologies implemented to the rest of the country (or province).
Once this list of projects and programs was established, a further set of criteria was applied in order to reduce the short list to the number of field sites where research would take place. These criteria included (a) logistical feasibility for research to be conducted; (b) potential for collaboration with project or program; and (c) being representative of the country’s geophysical, climatic, demographic, and socioeconomic characteristics.
A2. COST ESTIMATIONThis study collected, as far as possible, information with which to estimate the full cost of implementing each sanitation tech-nology and program. Costs were estimated on the basis of information collected from three main data sources: (a) sanitation program or project documents; (b) the provider or supplier of sanitation services; and (c) the questionnaire conducted in a sample of households (see section A5). Data from these three sources were compiled, compared, triangulated, and adjusted to ensure accuracy and to avoid double counting of cost components. This information was supplemented using interviews with key resource people to ensure correctness of interpretation, and to enable adjustment where necessary. The cost data were entered into standardized cost tabulation sheets.
The annual equivalent costs of different sanitation options were calculated by adding together (a) annualized investment cost, calculated using the asset depreciation method and taking into account the estimated life of hardware and software compo-nents; and (b) annual running costs. Investment costs were broken down into hardware capital costs and program (software) costs. Recurrent costs were broken down into maintenance, operational and program (software) costs. Furthermore, nonfi-nancial costs were tabulated separately from financial costs. For each cost item, the financing agent was recorded.
Annex: Estimation and Survey Methodologies

Economic Assessment of Sanitation Interventions50
Economic Assessment of Sanitation Interventions in Southeast Asia | Annex
Site or project Rural, urban, or peri-urban
Shared facility Private facility
Dry and wet sanitation Dry sanitation Wet sanitation
Shared with neighbors Public Private dry
pit latrine UDDT Private wet pit latrine
Biogas digester
Septic tank and STF
Sewerage / WWTP
Ecosorn (EU), 3 provinces Rural
Plan International, 2 provinces Rural
World Vision, 9 provinces Rural
Tonlé Sap Rural Water Supply & Sanitation Rural
Sihanoukville town Urban
Lamongan District, East Java province Rural
Tangerang District, Banten province Rural
Benjarmasin City, South Kalimantan province Urban
Malang City, East Java province Urban
Payakumbuh City, West Sumatera province Urban
Meun District, Vientiane province Rural
Nam Bak District, Luang Prabang province Rural
Champone District, Savannakhet province Rural
Chantabouly District, Vientiane Capital Urban
Xaythany District, Vientiane Capital Rural
Nan District, Luang Prabang province Urban
San Fernando (upland), Region I Rural
Bayawan, Region VII Rural
Alabel, Region XII Rural
Dagupan, Region I Urban
San Fernando (coastal), Region I Urban
Taguig, Metro Manila, National Capital Region
Urban
Xuan Loc district, Dong Nai province Rural
Tra On, Vinh Long province Rural
Son Tinh district, Quang Ngai province Rural
Dan Phuong, Ha Tay Hanoi Rural
Tam Ky district, Quang Nam province Rural
Luc Ngan, Bac Giang province Rural
Lai Xa, Hanoi Rural
Thieu Hoa district, Thanh Hoa province Rural
Phu Loc district, Hue province Rural
Sa Dec Town, Dong Thap province Urban
Tam Ky, Quang Nam Urban
Hai Phong Urban
Ha Long city, Bai Chay Urban
Buon Ma Thuot city Urban

www.wsp.org 51
Economic Assessment of Sanitation Interventions in Southeast Asia | Annex
Hiep Hoa District, Bac Giang province Urban
Hanoi city Urban
Cua Lo Town, Nghe An province Urban
Kunming rural Rural
Dali rural Rural
Dali peri-urban Peri-urban
Qiubei Rural
Kunming City Urban
Kunming peri-urban Peri-urban
Dali City Urban
Qiubei City Urban
Abbreviations: UDDT: urine diversion dehydration toilet; WWTP: wastewater treatment plant; STF: septage treatment facility.
A3. BENEFIT ESTIMATION (FIELD LEVEL)Annex Figure A1 shows an overview of the methods for estimating the benefits to households receiving improved sanitation. The actual size of the benefit will depend on the specific subtype of sanitation intervention implemented.
ANNEX FIGURE A1. OVERVIEW OF METHODS FOR ESTIMATING FIELD-LEVEL BENEFITS OF IMPROVED SANITATION
The specific methods for each sanitation benefit are described below. For further details on the specific calculations, data sources, and choices made in relation to the methodology, refer to section A3.7.
A3.1 HEALTHDiseases considered in this study include all types of diarrheal disease, helminthes, hepatitis A and E, malnutrition, and dis-eases related to malnutrition (malaria, acute lower respiratory infection, and measles). Trachoma and scabies, being related to personal hygiene, were included in countries where statistics were available. Disease rates and mortality were collected from a variety of sources, including Demographic and Health Surveys (DHS), and World Health Organization country estimates.
BENEFIT CATEGORY
POPULATION WITHUNIMPROVED SANITATION
POPULATION WITHIMPROVED SANITATION
BENEFIT ESTIMATED
HEALTH
WATER
ACCESS TIME
INTANGIBLES
REUSE
Data on health risk per person, by age category and socioeconomic
status
Generic risk reduction,using international literature
Data on water source andtreatment practices
Data on time to access toilet per person per day
Attitudes and preferences of householders to sanitation
Observed changes in practices in populations with improved sanitation
Observed reductions in time to access toilet
Benefits cited of improvedsanitation
Practices related to excreta reuse
Averted healthcare costs,reduced productivity loss,
reduced deaths
Reduced water sourcing and water treatment costs
Opportunity cost of time applied to time gains
Strength of preferences fordifferent sanitation aspects
and willingness to pay
Value gained, based on sales or own use
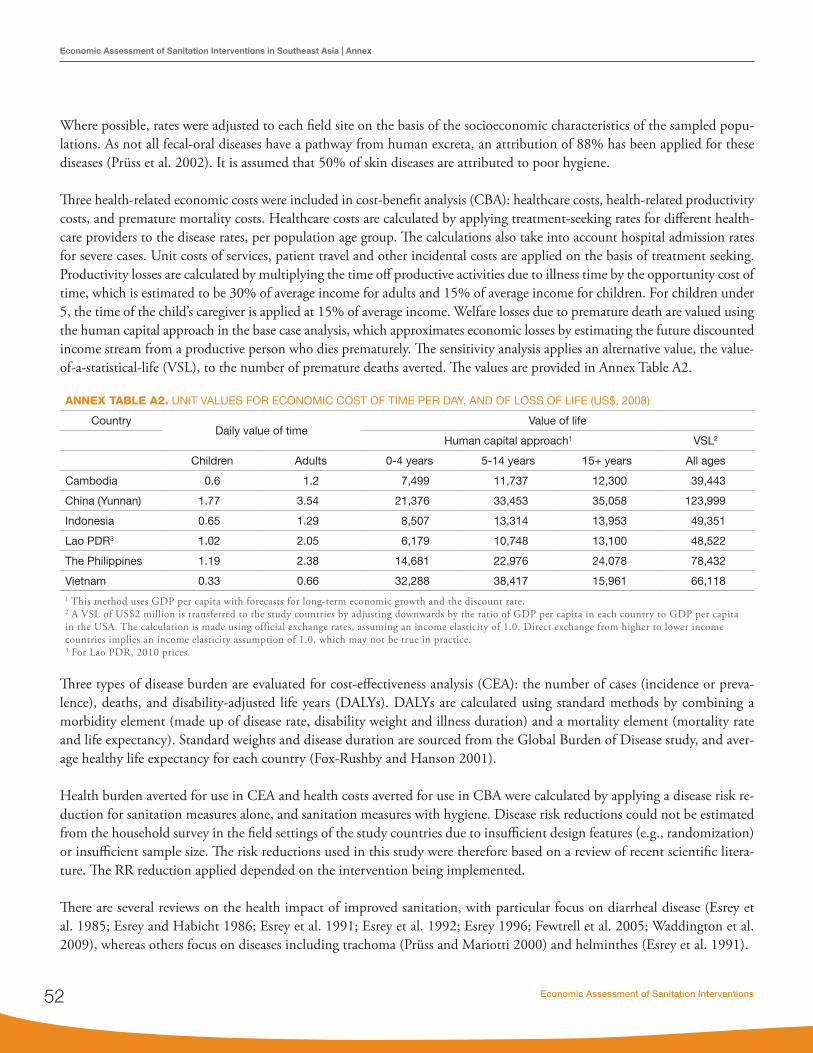
Economic Assessment of Sanitation Interventions52
Economic Assessment of Sanitation Interventions in Southeast Asia | Annex
Where possible, rates were adjusted to each field site on the basis of the socioeconomic characteristics of the sampled popu-lations. As not all fecal-oral diseases have a pathway from human excreta, an attribution of 88% has been applied for these diseases (Prüss et al. 2002). It is assumed that 50% of skin diseases are attributed to poor hygiene.
Three health-related economic costs were included in cost-benefit analysis (CBA): healthcare costs, health-related productivity costs, and premature mortality costs. Healthcare costs are calculated by applying treatment-seeking rates for different health-care providers to the disease rates, per population age group. The calculations also take into account hospital admission rates for severe cases. Unit costs of services, patient travel and other incidental costs are applied on the basis of treatment seeking. Productivity losses are calculated by multiplying the time off productive activities due to illness time by the opportunity cost of time, which is estimated to be 30% of average income for adults and 15% of average income for children. For children under 5, the time of the child’s caregiver is applied at 15% of average income. Welfare losses due to premature death are valued using the human capital approach in the base case analysis, which approximates economic losses by estimating the future discounted income stream from a productive person who dies prematurely. The sensitivity analysis applies an alternative value, the value-of-a-statistical-life (VSL), to the number of premature deaths averted. The values are provided in Annex Table A2.
ANNEX TABLE A2. UNIT VALUES FOR ECONOMIC COST OF TIME PER DAY, AND OF LOSS OF LIFE (US$, 2008)
CountryDaily value of time
Value of life
Human capital approach1 VSL2
Children Adults 0-4 years 5-14 years 15+ years All ages
Cambodia 0.6 1.2 7,499 11,737 12,300 39,443
China (Yunnan) 1.77 3.54 21,376 33,453 35,058 123,999
Indonesia 0.65 1.29 8,507 13,314 13,953 49,351
Lao PDR3 1.02 2.05 6,179 10,748 13,100 48,522
The Philippines 1.19 2.38 14,681 22,976 24,078 78,432
Vietnam 0.33 0.66 32,288 38,417 15,961 66,1181 This method uses GDP per capita with forecasts for long-term economic growth and the discount rate.2 A VSL of US$2 million is transferred to the study countries by adjusting downwards by the ratio of GDP per capita in each country to GDP per capita in the USA. The calculation is made using official exchange rates, assuming an income elasticity of 1.0. Direct exchange from higher to lower income countries implies an income elasticity assumption of 1.0, which may not be true in practice. 3 For Lao PDR, 2010 prices.
Three types of disease burden are evaluated for cost-effectiveness analysis (CEA): the number of cases (incidence or preva-lence), deaths, and disability-adjusted life years (DALYs). DALYs are calculated using standard methods by combining a morbidity element (made up of disease rate, disability weight and illness duration) and a mortality element (mortality rate and life expectancy). Standard weights and disease duration are sourced from the Global Burden of Disease study, and aver-age healthy life expectancy for each country (Fox-Rushby and Hanson 2001).
Health burden averted for use in CEA and health costs averted for use in CBA were calculated by applying a disease risk re-duction for sanitation measures alone, and sanitation measures with hygiene. Disease risk reductions could not be estimated from the household survey in the field settings of the study countries due to insufficient design features (e.g., randomization) or insufficient sample size. The risk reductions used in this study were therefore based on a review of recent scientific litera-ture. The RR reduction applied depended on the intervention being implemented.
There are several reviews on the health impact of improved sanitation, with particular focus on diarrheal disease (Esrey et al. 1985; Esrey and Habicht 1986; Esrey et al. 1991; Esrey et al. 1992; Esrey 1996; Fewtrell et al. 2005; Waddington et al. 2009), whereas others focus on diseases including trachoma (Prüss and Mariotti 2000) and helminthes (Esrey et al. 1991).

www.wsp.org 53
Economic Assessment of Sanitation Interventions in Southeast Asia | Annex
One of the most recent and systematic reviews to date was published by Fewtrell et al. in 2005, which reviewed published studies only and used strict criteria for inclusion—not only study design criteria but also the outcomes presented by studies that allowed quantitative synthesis of results in a meta-analysis (Fewtrell et al. 2005). Only two studies relating to sanitation interventions were used in the review. One, from the Philippines, looked at the impact of communal toilets on cholera rates (Azurin and Alvero 1974), whereas the other (Daniels et al. 1990) looks at the impact of latrine installation on diarrhea rates. When the relative risk reductions were combined, sanitation interventions yielded a 32% reduction in diarrheal disease. Eleven studies related to hygiene, giving an average reduction in diarrheal disease of 45% (Fewtrell et al. 2005).
The review by Fewtrell et al. was recently updated in 2009 (Waddington et al. 2009), which adjusted the risk reduction as follows:
• 36% risk reduction, based on three high quality studies, or • 37% risk reduction, based on all six studies.
For hygiene interventions, the risk reduction, based on 12 high-quality studies, was 30% (Waddington et al. 2009). In-cluding five low-quality studies (with an average 37% reduction) yielded an overall average reduction of 31% reduction. A hygiene education intervention reduced disease risk by 27%. These are lower than the risk reductions estimated by Fewtrell (2005) of 37% (11 studies of low- and high-quality combined) or 45% (eight high-quality studies).
These studies provide an overall idea of the health impacts of improved sanitation, with sanitation usually defined as “basic.” Different types of sanitation intervention (such as sewerage versus septic tank versus basic pit latrines versus any type of shared facility) have not been explicitly compared. Waddington et al. (2009) found that sewer connections (31% reduction) performed worse than latrines alone (35% reduction). Individual studies have shown that full sewerage has greater health impacts, yielding as high as a 69% reduction in disease risk (Moraes et al. 2003). Esrey (1991) does review the evidence on sanitation and hookworm infection, and finds only one rigorous study from Iran showing a 4% reduction in infection rates from improved excreta disposal. The same review showed that improved personal hygiene was found in three studies to result in reductions in trachoma incidence of between 69% and 79%. It is important to consider this potential health gain from WSH interventions, given that environmental factors explain 50% of malnutrition (Fishman et al. 2004). Although some studies are currently researching this impact, there remains a gap in the current evidence.
For simplicity, the risk reductions in the ESI study split diseases into three broad categories:
• Strictly fecal-oral diseases (diarrheal disease, hepatitis A and E).• Other fecal-related diseases (fecal-oral or fecal-skin, such as helminthes, and fecal-eye such as trachoma). • Hygiene-specific diseases (e.g., scabies), which are prevented through improved hygiene practices but not sanitation.
Relative risks are assumed for four different levels of sanitation coverage, both with and without improved hygiene practices.
• Open defecation (OD), in which all diseases are at their maximum rates.• Unimproved pit latrines, in which reduction is only achieved in the rate of helminthes.• Improved pit latrines or open-bottom septic tanks and sewage mainly going into the ground (including groundwa-
ter), open drains, canals and rivers. This category includes public and shared latrines, assuming that these facilities are hygienic.
• Improved wastewater management as well as improved toilets.

Economic Assessment of Sanitation Interventions54
Economic Assessment of Sanitation Interventions in Southeast Asia | Annex
Annex Table A3 shows the relative risk reductions used in this study. For diarrheal diseases, any kind of improved latrine—whether private or shared—is assumed to bring the health gains shown in the literature. The average of four reviews (Esrey et al. 1991; Esrey 1996; Fewtrell et al. 2005; Waddington et al. 2009) is 36% reduction, which was the rate used by Cairncross and Valdmanisin the Disease Control Priorities Project Edition 2 (Cairncross and Valdmanis 2006).
For hygiene interventions, 12 high-quality studies available from the meta-analysis in Waddington et al. give 30%—a lower rate than the 45% found by Fewtrell (2005). The ESI is focusing on handwashing as the main hygiene intervention, and the Waddington subanalysis of handwashing with soap gives 37% reduction. There is assumed to be some (but not total) additional health impact of combining sanitation with hygiene interventions. Together they are assumed to give a relative risk reduction of 50%.
In urban areas with significantly improved sewerage and wastewater treatment systems, populations are moving toward (but not immediately reaching) the diarrheal disease rates found in developed countries. We would therefore expect to see greater risk reductions than those of around 36% discussed above. The evidence is very sparse, and rather mixed. Two studies from the same city in Brazil (Salvador) made 20 years apart (by Barreto and Moraes) present differing results. In the earlier, rela-tively small-scale study, Moraes reported that full sewerage brought reductions in diarrheal disease rates of 69% (Moraes et al. 2003), compared to the 22% found in the latter, city-wide sewerage program reported by Barreto (Barreto et al. 2010). The latter study does however distinguish between rate reductions in populations with different baseline risks—and for high-risk populations the reduction is 43%, compared to 0% for low-risk populations. The high-risk population in Brazil corresponds more closely with those found by ESI in urban areas of Asia, and this rate is averaged with the 69% to obtain a relative risk reduction in diarrheal disease of 56% for sanitation interventions alone, which is used in this study.With hygiene added, this rate is assumed to increase a further 9 percentage points to 65%. For specifically hygiene-related diseases (e.g., scabies), a high degree of environmental sanitation combined with strict hygiene measures in the home are assumed to lead to a 70% reduction in these diseases.
Hotez et al. state that people of all ages rapidly reacquire infection following treatment for Soil-Transmitted Helminthes (STH), hence STH treatment programs may reduce prevalence, worm concentration and reinfection rates, but are unlikely to remove the risk altogether (Hotez et al. 2006). Without a change in defecation habits, periodic deworming cannot attain a stable reduction in transmission. Improved sanitation, especially that which isolates human feces, is the main intervention to ensure lasting reduction in reinfection rates. Hotez et al. state that although “sanitation is the only definitive intervention to eliminate STH infections,” “to be effective it should cover a high percentage of the populations.” In other words, if 90% of households have improved latrines and 10% are still practicing OD, environmental risk persists for the whole popula-tion. Therefore, as the primary means of control, it can take years or even decades for sanitation to be effective (due to the long time required to reach 100% coverage, and the long life of many worm eggs before the environment becomes safe). Hotez et al. do not provide estimates for the effectiveness of sanitation interventions on STH, but from the direct STH-poor sanitation link, it is assumed that if 100% of the population are covered by improved sanitation (meaning complete excreta isolation in pits or safe conveyance with off-site treatment), new STH infections will drop to close to zero. However, if in practice some of the population still use OD, or excreta from latrines is not successfully isolated, it is unclear which STH reinfection rates persist. A linear relationship is assumed in ESI, given the lack of data on community effects. The “risk lad-der” of STH starts with OD (highest risk), unimproved sanitation (which isolates excreta, but imperfectly, giving a proposed 30% reduction), improved basic sanitation (which isolates human excreta better, but still leads to only a 50% reinfection rate reduction), and finally, in urban areas especially, a properly functioning sewage collection and treatment systems (giving a reinfection rate reduction to 0%). A reinfection rate reduction of 70% is proposed for hygiene education, which is assumed to reduce exposure to STH by changing the interaction between population and the environment (e.g., use of sandals, avoid-ing walking in OD areas, changing the location of OD).

www.wsp.org 55
Economic Assessment of Sanitation Interventions in Southeast Asia | Annex
ANNEX TABLE A3. RELATIVE RISK REDUCTIONS IN DISEASE INCIDENCE AND PREVALENCE USED IN ESI
Sanitation coverage Hygiene intervention Diarrheal disease, hepatitis A & E STH Hygiene-related
diseases
Open defecation Without hygiene 0% 0% 0%
Unimproved pit latrines (excreta partially isolated)
Without hygiene 0% 30% 0%
Improved pit latrines or open-bottom septic tanks or toilets with sewage flowing into ground or open drains, canals, and rivers
Without hygiene 36%1 50% 0%
With hygiene 50%2 70% 37%
Septic tanks with emptying and treatment or sewerage with full wastewater treatment
Without hygiene 56%3 80% 0%
65%4 100% 70%
1 This reflects the average of Waddington 2009, Fewtrell 2005, Esrey 1991, and Esrey 1996.2 This reflects the sanitation interventions alone of 36% plus 14% add-on for hygiene.3 This reflects the average for the two Brazilian studies, which found 43% and 69% reinfection rate reduction for high-risk populations.4 This reflects a 56% reduction from sanitation plus hygiene add-on, which yields a 9% incremental impact.
A3.2 WATERAlthough water has many uses at the community level and for industrial purposes, the focus of the ESI field study is on water use for domestic purposes, in particular drinking water. The most specific link between poor management of human excreta and water quality is water safety, and communities and individual households often take mitigative measures to avoid consuming unsafe water. Mitigation includes reducing reliance on surface water and using instead protected wells or treated piped water supplies. As increasing population density increases the pressure on the environment’s capacity to cope with pol-lution, communities move from traditional to cleaner but more expensive water sources.
This study measured the potential economic gains from improving sanitation on two sets of mitigation measures—water access and household water treatment.
• Water access. Reduced water access costs from improved sanitation occur because either the costs of treating piped water are reduced and/or access to closer clean water sources reduces collection time. For example, some people prefer the taste of water from shallow wells (which tend to be closer to the household) to that from deeper wells, but they use deep wells because the shallow wells are contaminated.
• Household treatment of water. Many households traditionally treat their water due to concerns about safety and ap-pearance. This is commonly true even for piped treated water supplies. Boiling is the most popular method because it is perceived to guarantee safe drinking water. However, boiling water can require considerable cash outlay for fuel, and extra time may be involved for the collection of additional fuel supplies. Furthermore, using wood, charcoal or electricity to boil water for drinking purposes is more costly to the environment, resulting in comparatively higher CO2 emissions than other water treatment methods. If sanitation is improved and the pathogens in the environment are reduced to low or zero levels, households would feel more receptive to simple and less costly household treatment methods, such as filtration or chlorination.
The cost savings associated with improved water access and adapted treatment practices are calculated using field-based assumptions about changes in access to water sources and reductions in costly household treatment methods (see An-nex A).

Economic Assessment of Sanitation Interventions56
Economic Assessment of Sanitation Interventions in Southeast Asia | Annex
Special surveys on water quality measurement were conducted at most of the field sites as part of the ESI study, to enable detailed analysis of the likely impacts of improved sanitation on local water quality. The results of these surveys are presented in the country reports.
A3.3 ACCESS TIMEHouseholds with their own private latrine may save time every day, because they do not have to use the bush or a shared facil-ity for their toilet needs. The time used for each sanitation option will vary from household to household, and from person to person, because children, men, women, and the elderly all have different sanitation practices. Therefore, this study calculates the time saved through improved sanitation, based on observations by households both with and without improved sanita-tion. The value of time is based on the same values as health-related time savings (see section A3.1).
A3.4 EXCRETA REUSEHuman excreta, if handled properly, can be a safe source of fertilizer, wastewater for irrigation or aquaculture, or biogas. However, improved human excreta reuse is not commonly practiced in most of the study countries. Thirteen of the sites monitored for this survey include reuse options: the Philippines (two UDDT), Vietnam (two UDDT and three biogas), and Yunnan (four UDDT and two biogas). Measurement of the value of excreta reuse depends on the uses to which the product is put. The value of saved expenditure on fertilizer and energy when households used the product was estimated. Households were asked the price (and revenue) realized from the sale of the product. In most cases, households use the product them-selves. In the case of biogas, additional excreta were commonly sourced freely from livestock belonging to households. The average value per household practicing reuse of excreta was calculated for each reuse option at each site.
A3.5 INTANGIBLESIntangibles such as comfort, privacy, convenience, safety, social status, and prestige are major factors in personal and commu-nity welfare, and are thus important determinants of sanitation choices. Because of their private and subjective nature, it is difficult to elicit reliable information on intangible benefits from individuals. Furthermore, perceptions and preferences vary considerably from one individual and social group to another. Intangibles are therefore difficult to quantify and summarize from a population perspective, and are even more difficult to value in monetary terms for cost-benefit analysis. Economic tools do exist for quantitative assessment of intangible benefits, such as the contingent valuation method, and willingness-to-pay surveys are commonly used to value environmental goods. However, there are many challenges to the application of these methods in field settings, thus affecting their reliability and validity, and ultimately the appropriate interpretation of quantitative results. Furthermore, willingness-to-pay surveys often capture not only the intangible variables being examined, but also preferences that have been valued elsewhere (e.g., health and water benefits). The current study therefore attempts only to understand and measure sanitation knowledge, practices and preferences in terms of ranking scales through an in-terview questionnaire (ESI household survey), and from community knowledge, consensus and diversity of opinion (ESI focus group discussions). Importantly, this approach enables a separate set of qualitative results to be provided alongside the quantitative currency-based efficiency measures.
A3.6 EXTERNAL ENVIRONMENTIn the same way that intangibles related to toilet preferences, the impacts of poor sanitation practices on the external environ-ment are difficult to quantify in monetary terms. Hence, this study attempts only to understand and measure practices and preferences in relation to the broader environment, using ranking scales and opinions gathered from respondents. Because human-related sanitation is only one of several factors affecting environmental quality, other aspects such as industrial water pollution, solid waste management and animal waste are also addressed, in order to form an understanding of human excreta management within the overall picture of environmental quality.

www.wsp.org 57
Economic Assessment of Sanitation Interventions in Southeast Asia | Annex
A3.7 ALGORITHMS FOR BENEFIT ESTIMATIONAnnex Table A4 shows the algorithms for each monetized benefit of improved sanitation, with data sources for each variable used.
ANNEX TABLE A4. ALGORITHMS WITH CORRESPONDING VARIABLES, DATA SOURCES AND VALUES
Impacts included Variable Data sources Value or comment
1. HEALTHAll calculations were made using disaggregated data inputs on disease and age grouping: 0-4 years, 5-14 years, and 15+ years.
1.1 Healthcare savings
Calculation:[Prevalence or incidence X Attribution to poor sanitation X ((% seeking outpatient care X Visits per case X Unit cost per visit (medical and patient)) +(Inpatient admission rate X Days per case X Unit cost per day (medical and patient))] XProportion of disease cases averted
Diarrheal disease incidence (0-4 years)
DHS Variable by context
Diarrheal disease incidence (over 5 years)
WHO statistics Variable by context
Helminthes prevalence Global review Variable by context
Hepatitis A and E incidence
National health statistics Variable by context
Indirect diseases incidence (malaria, acute lower respiratory infection)
WHO statistics Variable by context
Malnutrition prevalence UNICEF/WHO statistics Variable by context
Scabies and trachoma Incidence
National health statistics Variable by context
Attribution of fecal-oral diseases to poor sanitation
WHO Value = 88%
Attribution of helminthes to poor sanitation
Global review Value = 100%
% disease cases seeking healthcare
DHS, SES, ESI household survey, health statistics
Variable by context
Outpatient visits per patient
Health facility statistics, ESI household survey
Assumed 1, unless available
Inpatient admission rate Variable by context
Inpatient days per admission
Variable by context
Health service unit costs Variable by context
Other patient costs (transport, food)
ESI household survey
% disease cases averted
International literature review
See Annex B for review
1.2 Health morbidity-related productivity gains
Calculation:[Prevalence X Attribution to poor sanitation X Days off productive activities X Value of time] X Proportion of disease cases averted
Days off productive activities
ESI household survey Variable by context
Basis of time value: GDP per capita
National economic dataWorld Bank data
Average product per capita (at subnational level, where available) —30% for adults, 15% for children

Economic Assessment of Sanitation Interventions58
Economic Assessment of Sanitation Interventions in Southeast Asia | Annex
Impacts included Variable Data sources Value or comment
1.3 Premature mortality savings
Calculation:[Mortality rate X Attribution to poor sanitation X Value of life] X Proportion of disease cases averted
Mortality rate (all diseases)
WHO statistics Variable by context, cross-checked with local statistics
Basis of time value: GDP per capita
National economic dataWorld Bank data
Annual value of lost production of working adults (human capital approach), from the time of death until the end of (what would have been) their productive life.
Discount rate for future earnings
National governments Cost of capital estimate (8%)
Long-term economic growth
Assumption Default = 5%
Value-of-statistical-life Developed country studies
Adjusted to local purchasing power by multiplying by GDP per capita differential
1.4 Disability-adjusted life-years (DALY) averted
Calculation: DALY = YLD+YLLYLD: discounted disability based on weight and years equivalent timeYLL: discounted future years of healthy life lost
Duration of disability ESI household survey Based on average length of each disease
Disability weighting WHO burden of disease project
Variable by disease
Healthy life expectancy WHO statistics Variable by country
Discount rate for future disease burdens
National governments Cost of capital estimate (8%)
Morbidity and mortality rates
Various: see 1.1 and 1.3 (above)
Variable by context
2. WATER (for household use)Weighted average costs were estimated for each water source and for each household water treatment method.
2.1 Household water access savings
Calculation:Annual costs X % costs reduced, per water source
Drinking water sources (%) in wet and dry seasons
ESI household survey Variable by context
Annual financial cost per household, per water source
ESI household survey; ESI market survey
Variable by context
Annual non-financial cost per household, per water source
ESI household survey Variable by context
Proportion of access cost reduction under scenario of 100% improved sanitation, per water source
ESI household survey; assumption
Variable by context

www.wsp.org 59
Economic Assessment of Sanitation Interventions in Southeast Asia | Annex
Impacts included Variable Data sources Value or comment
2.2 Household water treatment savings
Calculation:(% households treating water per method X Annual cost) X % households that stop treating
Proportion of households treating their water, by method
ESI household survey Validated by other national statistics (DHS, SES)
Full annual cost per water treatment method
ESI household survey; ESI market survey
Proportion of households currently treating that stop treating under scenario of 100% improved sanitation
ESI household survey; assumption
As well as stopping treatment, households may switch to an alternative (cheaper) treatment method if the cleaner water sources enable different water purification methods
3. ACCESS TIME SAVINGSWeighted average costs estimated for each age category and gender—young children, children and male and female adults.
Calculation:% household members using OD X Time saved per trip due to private toilet X Average trips per day X Value of time
Household composition (demographics)
ESI household survey Variable by context
Sanitation practice, by age group
ESI household survey Variable by context
Average round trip time to access site of OD
ESI household survey For households moving from shared to private toilet, access time to shared toilets is used instead of OD
Average number of round trips to defecation site per day
ESI household survey Assumed = 1 per day
Basis of time value: GDP per capita
National economic data;World Bank data
Average product per capita (at subnational level, where available)—30% for adults, 15% for children
4. EXCRETA REUSE GAINS(reuse of excreta as fertilizer from either UDDT or double-vault pit latrine; and reuse of energy value from biogas digester)
Calculation:(% households using product themselves X Value in own use) + (% households selling product X Selling price)
% households using reuse methods
ESI household survey Variable by context
% households using product themselves
ESI household survey Variable by context
% households selling product to others
ESI household survey Variable by context
Selling price ESI household & market survey
Variable by context
Value in own use ESI market survey; assumption
Variable by context
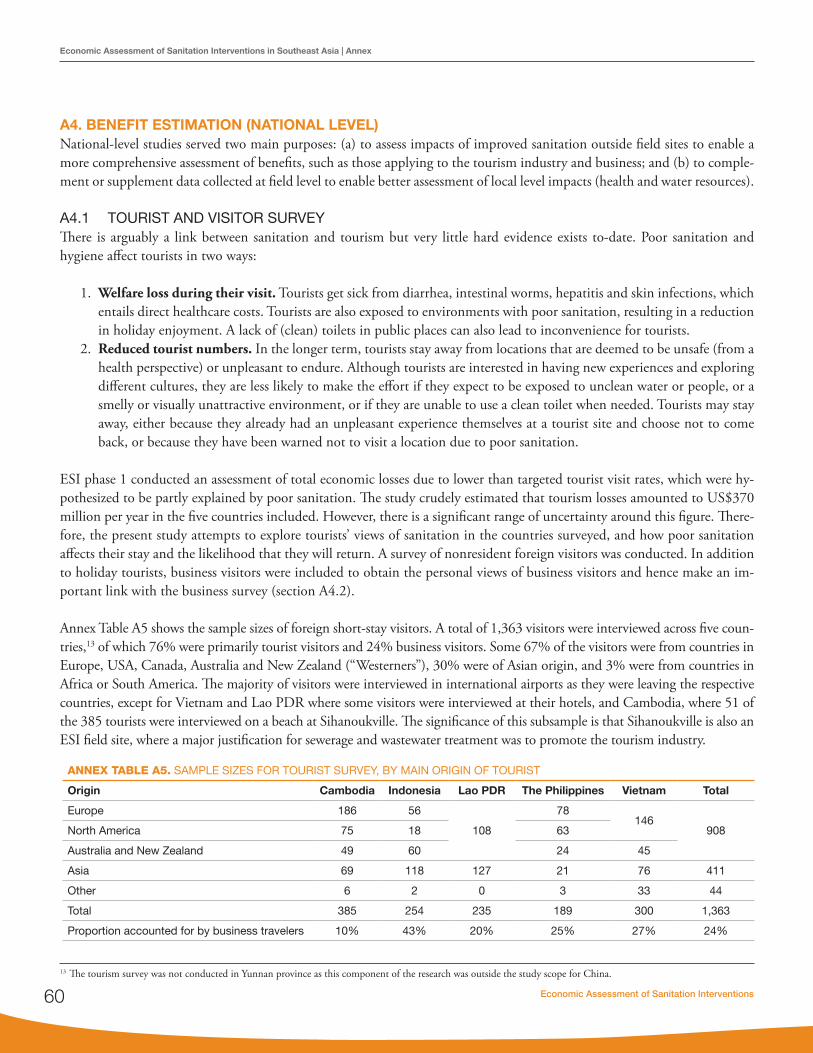
Economic Assessment of Sanitation Interventions60
Economic Assessment of Sanitation Interventions in Southeast Asia | Annex
A4. BENEFIT ESTIMATION (NATIONAL LEVEL)National-level studies served two main purposes: (a) to assess impacts of improved sanitation outside field sites to enable a more comprehensive assessment of benefits, such as those applying to the tourism industry and business; and (b) to comple-ment or supplement data collected at field level to enable better assessment of local level impacts (health and water resources).
A4.1 TOURIST AND VISITOR SURVEYThere is arguably a link between sanitation and tourism but very little hard evidence exists to-date. Poor sanitation and hygiene affect tourists in two ways:
1. Welfare loss during their visit. Tourists get sick from diarrhea, intestinal worms, hepatitis and skin infections, which entails direct healthcare costs. Tourists are also exposed to environments with poor sanitation, resulting in a reduction in holiday enjoyment. A lack of (clean) toilets in public places can also lead to inconvenience for tourists.
2. Reduced tourist numbers. In the longer term, tourists stay away from locations that are deemed to be unsafe (from a health perspective) or unpleasant to endure. Although tourists are interested in having new experiences and exploring different cultures, they are less likely to make the effort if they expect to be exposed to unclean water or people, or a smelly or visually unattractive environment, or if they are unable to use a clean toilet when needed. Tourists may stay away, either because they already had an unpleasant experience themselves at a tourist site and choose not to come back, or because they have been warned not to visit a location due to poor sanitation.
ESI phase 1 conducted an assessment of total economic losses due to lower than targeted tourist visit rates, which were hy-pothesized to be partly explained by poor sanitation. The study crudely estimated that tourism losses amounted to US$370 million per year in the five countries included. However, there is a significant range of uncertainty around this figure. There-fore, the present study attempts to explore tourists’ views of sanitation in the countries surveyed, and how poor sanitation affects their stay and the likelihood that they will return. A survey of nonresident foreign visitors was conducted. In addition to holiday tourists, business visitors were included to obtain the personal views of business visitors and hence make an im-portant link with the business survey (section A4.2).
Annex Table A5 shows the sample sizes of foreign short-stay visitors. A total of 1,363 visitors were interviewed across five coun-tries,13 of which 76% were primarily tourist visitors and 24% business visitors. Some 67% of the visitors were from countries in Europe, USA, Canada, Australia and New Zealand (“Westerners”), 30% were of Asian origin, and 3% were from countries in Africa or South America. The majority of visitors were interviewed in international airports as they were leaving the respective countries, except for Vietnam and Lao PDR where some visitors were interviewed at their hotels, and Cambodia, where 51 of the 385 tourists were interviewed on a beach at Sihanoukville. The significance of this subsample is that Sihanoukville is also an ESI field site, where a major justification for sewerage and wastewater treatment was to promote the tourism industry.
ANNEX TABLE A5. SAMPLE SIZES FOR TOURIST SURVEY, BY MAIN ORIGIN OF TOURIST
Origin Cambodia Indonesia Lao PDR The Philippines Vietnam Total
Europe 186 56
108
78146
908North America 75 18 63
Australia and New Zealand 49 60 24 45
Asia 69 118 127 21 76 411
Other 6 2 0 3 33 44
Total 385 254 235 189 300 1,363
Proportion accounted for by business travelers 10% 43% 20% 25% 27% 24%
13 The tourism survey was not conducted in Yunnan province as this component of the research was outside the study scope for China.
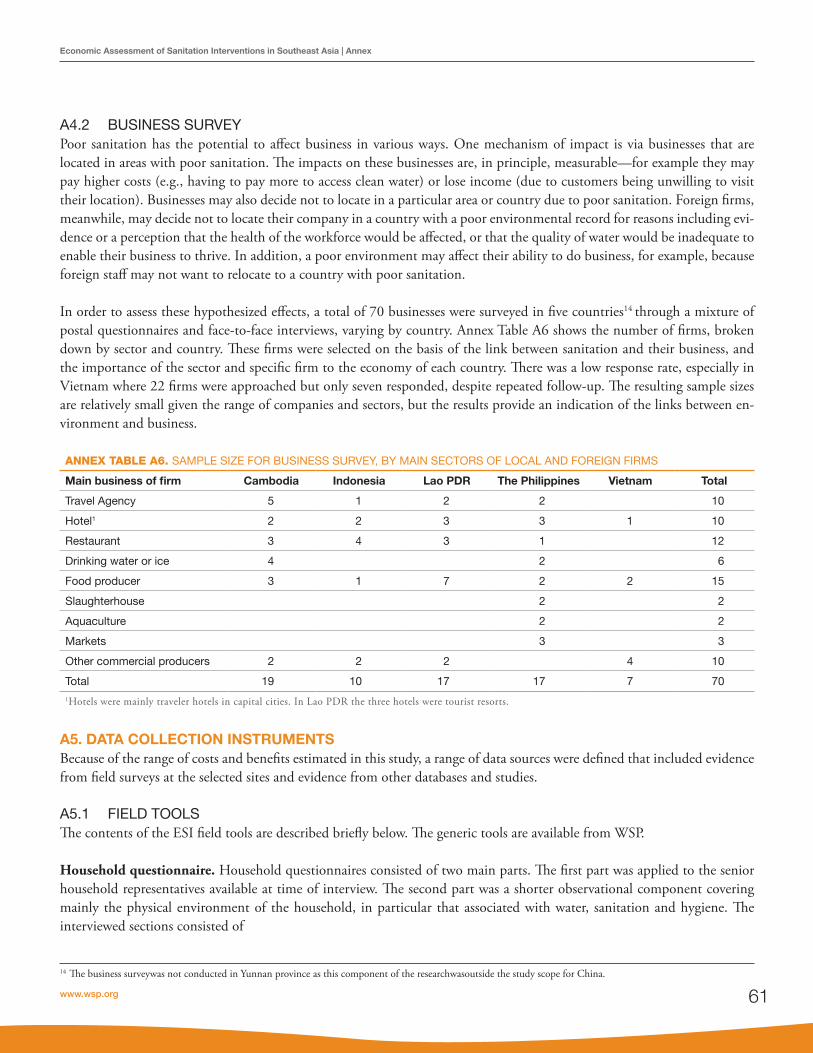
www.wsp.org 61
Economic Assessment of Sanitation Interventions in Southeast Asia | Annex
A4.2 BUSINESS SURVEYPoor sanitation has the potential to affect business in various ways. One mechanism of impact is via businesses that are located in areas with poor sanitation. The impacts on these businesses are, in principle, measurable—for example they may pay higher costs (e.g., having to pay more to access clean water) or lose income (due to customers being unwilling to visit their location). Businesses may also decide not to locate in a particular area or country due to poor sanitation. Foreign firms, meanwhile, may decide not to locate their company in a country with a poor environmental record for reasons including evi-dence or a perception that the health of the workforce would be affected, or that the quality of water would be inadequate to enable their business to thrive. In addition, a poor environment may affect their ability to do business, for example, because foreign staff may not want to relocate to a country with poor sanitation.
In order to assess these hypothesized effects, a total of 70 businesses were surveyed in five countries14 through a mixture of postal questionnaires and face-to-face interviews, varying by country. Annex Table A6 shows the number of firms, broken down by sector and country. These firms were selected on the basis of the link between sanitation and their business, and the importance of the sector and specific firm to the economy of each country. There was a low response rate, especially in Vietnam where 22 firms were approached but only seven responded, despite repeated follow-up. The resulting sample sizes are relatively small given the range of companies and sectors, but the results provide an indication of the links between en-vironment and business.
ANNEX TABLE A6. SAMPLE SIZE FOR BUSINESS SURVEY, BY MAIN SECTORS OF LOCAL AND FOREIGN FIRMS
Main business of firm Cambodia Indonesia Lao PDR The Philippines Vietnam Total
Travel Agency 5 1 2 2 10
Hotel1 2 2 3 3 1 10
Restaurant 3 4 3 1 12
Drinking water or ice 4 2 6
Food producer 3 1 7 2 2 15
Slaughterhouse 2 2
Aquaculture 2 2
Markets 3 3
Other commercial producers 2 2 2 4 10
Total 19 10 17 17 7 701Hotels were mainly traveler hotels in capital cities. In Lao PDR the three hotels were tourist resorts.
14 The business surveywas not conducted in Yunnan province as this component of the researchwasoutside the study scope for China.
A5. DATA COLLECTION INSTRUMENTSBecause of the range of costs and benefits estimated in this study, a range of data sources were defined that included evidence from field surveys at the selected sites and evidence from other databases and studies.
A5.1 FIELD TOOLSThe contents of the ESI field tools are described briefly below. The generic tools are available from WSP.
Household questionnaire. Household questionnaires consisted of two main parts. The first part was applied to the senior household representatives available at time of interview. The second part was a shorter observational component covering mainly the physical environment of the household, in particular that associated with water, sanitation and hygiene. The interviewed sections consisted of

Economic Assessment of Sanitation Interventions62
Economic Assessment of Sanitation Interventions in Southeast Asia | Annex
• Socioeconomicanddemographicinformation,andhouseholdfeatures.• Currentandpasthouseholdsanitationoptionsandpractices,andhowthecurrentsanitationoptionwasobtained.• Perceivedbenefitsofsanitation,andpreferencesrelatedtotheexternalenvironment.• Actualusebyhouseholdmembersofavailablesanitationandhandwashingfacilities.• Householdwatersupplysources,treatment,andstoragepractices.• Healtheventsandhealthtreatmentseeking.• Hygieneandsolidwastepractices.
The household questionnaire was applied to a total of 8,470 households across the 47 sites across the six countries (equating to roughly 180 per site, with some variation across countries).15 The sample in each site was divided between households with no sanitation option (i.e., practicing OD) and those with the different improved sanitation options specific to each site (see Table 2). Households were randomly selected until the target sample size per sanitation option was reached.
Focus group discussions (FGDs). The purpose of the FGDs was to elicit behavior and preferences relating to water, sanita-tion, and hygiene from different population groups, with separate FGDs involving households with sanitation, households without sanitation, men, and women.16 The FGDs followed a generic template of discussion topics, but the depth of discus-sion was dictated by the willingness of the participants to discuss the topics, and group dynamics. The added advantage of the FGD approach is to prompt discussion of aspects of sanitation and hygiene that may not otherwise be revealed by face-to-face household interviews, and to either arrive at a consensus or otherwise to reflect the diversity of opinions and preferences for sanitation and hygiene among the population. FGDs were led by experienced social researchers and the discussions were recorded by field staff.
Physical location survey. A survey of the physical environment was conducted at all field sites. The main purpose was to identify important variables in relation to water, sanitation and hygiene in the general environment, covering land use, water sources, and environmental quality. This information was triangulated with the household surveys, FGDs, and the water quality measurement survey, to enable appropriate conclusions to be made about the extent of poor sanitation and links to other impact variables.
Water quality measurement. Because one of the major detrimental impacts of poor sanitation is its impact on surface and ground water quality, special attention was paid in this study to identifying the relationship between the type and coverage of toilets at the selected field sites, and the quality of local water bodies. The limited time scale of the present study made it impossible to measure water quality variables before the project or program was implemented; neither was it possible to compare wet season and dry season measurements. The water quality measurement survey was contracted to experienced laboratories in each country and timed to coincide as closely as possible with the other field surveys. The study enabled assess-ment of the impact of specific local sanitation features on water quality. It also enabled a broader comparison of water quality between study sites with different levels of sanitation coverage. Water sources tested at each site included ground water (dug shallow wells, deeper drilled wells), standing water (ponds, lakes, canals), and flowing water (rivers, wastewater channels). For cost and logistical reasons, water testing was not conducted at all sites. Parameters measured varied according to water source, but generally included biological oxygen demand, chemical oxygen demand, dissolved oxygen, nitrate, ammonia, conductivity, temperature, E.Coli, Total Coliform, pH and turbidity. Tap water in households provided by centralized sys-tems was tested using residual chlorine.
15 Cambodia: 1,180 households (an average of 240 per site). China: 909 households (an average of 114 per site). Indonesia: 1,500 households (an average of 300 per site). Lao PDR: 1,211 households (an average of 202 per site). The Philippines: 1,270 households (an average of 212 per site). Vietnam: 2,400 households (an average of 100 per urban site and 200 per rural site).16 Cambodia: 20 focus groups. China: 24 focus groups. Indonesia: 15 focus groups. Lao PDR: 21 focus groups. The Philippines: 18 focus groups. Vietnam: 17 focus groups among users; FGDs were also conducted in project management units and in some local authorities.

www.wsp.org 63
Economic Assessment of Sanitation Interventions in Southeast Asia | Annex
Health facility survey. Because of the importance of health impacts, a separate survey was conducted in two or three health facilities serving each field site. Variables collected included the number of patients with different types of WSH-related dis-ease, and the types and cost of treatment provided by the facility. Data were supplemented by data collected or compiled at higher levels of the health system (commune, district, or national level).
The staff involved in data collection are listed in the Acknowledgment sections of the country reports.
A5.2 OTHER DATA SOURCES FOR FIELD STUDIESThe field study had several weaknesses,17 which required data gaps to be filled using information from larger and more reli-able nationwide surveys, and from academic studies and government reports. The disadvantage of drawing on nationally representative surveys such as the DHS was that data on the key parameters were rarely available, or of sufficient sample size, for the specific ESI field locations. Hence national or subnational (e.g., rural or urban) breakdowns were commonly used.
Data sources included:
• DemographicandHealthSurveys(DHS),fromwhichdatawereextractedondiarrhealdiseaseratesforchildrenun-der five, and health seeking behavior for childhood diseases.
• Socioeconomicsurveysandgovernmentstatisticswithinformationonincomes,health-seekingbehavior,householdcomposition, and sanitation coverage.
• InternationalhealthstatisticsavailablefromtheWorldHealthOrganization.Thisincludedinparticularmortalityrates broken down by major cause and rates of diarrheal disease in adults.
• Internationaldataontheunitcostsofservices,availablefromtheWorldHealthOrganizationdatabaseCHOosing Interventions that are Cost-Effective (CHOICE).
• Waterqualitysurveys,whichwerecollectedpreviouslyundertheESIandreportedinphaseIcountryreports.• Economicstatistics,includingGDPpercapitaincomefromtheWorldBank,andaverageexchangerates.18
• InternationalhealthliteraturedealingwithratesofdiseaseandeffectivenessofWSHinterventionsinavertingdisease(see section A3.1).
A5.3 SURVEY INSTRUMENTS FOR WIDER IMPACTSTourism survey. The survey was applied in English in all countries. However, to capture some important visitor categories, a Korean translation was also applied in the Philippines and a Thai translation in Lao PDR. In most cases, tourists were ap-proached and the purpose of the questionnaire was explained. If they agreed to participate, they were given the form to fill out. Survey staff were available in the vicinity to answer any questions they had while filling out the form, and to collect the com-pleted form. In some cases, tourists preferred to be interviewed. The survey form included questions on the following topics:
• Lengthoftrip,placesstayed,andpricecategoryofhotel• Levelofenjoymentofdifferentlocationsvisited,andreasonsfortheiranswer• Sanitaryconditionofplacesvisited,andavailabilityandcleanlinessoftoiletsinpublicplaces• Waterandsanitation-relatedsicknessessufferedduringthevisit,perceivedsources,daysofsickness,andtypeoftreat-
ment sought and cost of treatment• Majorsourcesofconcernduringtheholidaystay• Intentiontoreturntothecountryortorecommendthecountrytofriends,andreasonsfortheiranswer.
17 The main weaknesses were that (1) the survey was carried out at a single point in time rather than through comparison before and after sanitation interventions at two different time points, hence the causality of impact had to be estimated using a different approach; and (2) the sample size was too small per site and per sanitation option to enable estimates of underlying health rates and impact of improved sanitation on health outcomes.18 www.oanda.com.

Economic Assessment of Sanitation Interventions64
Economic Assessment of Sanitation Interventions in Southeast Asia | Annex
Business survey. The survey form included questions on the following topics:
• Ownership,sectorofbusiness,specificbusinessactivities,numberofemployees,andlocationoffirm(production,sales);
• Perceptionsofsanitationatcompanylocations.• Factorsaffectingdecisiontolocateincountryorarea,andintentiontorelocateinthefuture.• Theproductionandsalescostsrelatedtodifferentaspectsofpoorsanitation(health,water,environment)andcharges
for sanitary services (e.g. garbage collection, environmental taxes).• Potentialcostsandbenefitstothebusinessoffurtherimprovementsrelatedtosanitation.