economic aspects of marine turtle use and conservation
TRANSCRIPT

economic aspects of marine turtle use and conservation
Sebastian Troëng and Carlos Drews
Cite as: Troëng, S. and Drews C. (2004)
Money Talks: Economic Aspects of Marine Turtle
Use and Conservation, WWF-International, Gland,
Switzerland www.panda.org
FRA
N &
EA
RLE
KE
TLE
Y
Sebastian TroëngSebastian Troëng is Scientific Director of Caribbean
Conservation Corporation in Costa Rica
(www.cccturtle.org). He has worked with marine
turtle conservation in Central America, Europe, Asia,
Australia and Oceania since 1991.
Carlos DrewsCarlos Drews is WWF’s Regional Coordinator for
Marine Turtle Conservation in Latin America and
the Caribbean.

Money Talks:Economic Aspects of Marine Turtle Use and Conservation

Money Ta lks : Economics Aspects o f Mar ine Tur t le Use and Conservat ion 4
This study would not have been possible had it not
been for the generous assistance of a large number of
people. Alberto Abreu, Windia Adnyana, Joanna Alfaro,
Harry Andrews, Hyacinthe Angoni, Gary Appleson,
Randall Arauz, Annette Arjoon, Rob Atkinson, Roger
Bailye, George Balazs, Beverly Ball, Robert Baldwin,
Claudio Bellini, Brenda Bossman, Mario Boza, Andy
Caballero, Charles Caillouet, Juan Carlos Cantú,
Herman Cesar, Didiher Chacón, Stéphane Ciccione,
Gordon Claridge, Becky Crane, Carlos Diez, Dimitrios
Dimopoulos, Jose Luis Di Paola, Marydele Donnelly,
Dave Eastham, Dan Evans, Alejandro Fallabrino, Helen
Fazakerley, Jerris Foote, Angela Formia, Jack Frazier,
Jacques Fretey, Mauricio Garduño, David Godfrey,
María Elena González, Raúl de J. González Díaz Mirón,
Brendan Godley, Vicente Gúzman, Tim Harvey, Eve
Haverfield, Gail Hearn, Roberto Herrera, Wendy Herron,
Ron Holland, Julia Horrocks, Charlotte Hudson, Anna
Hywel-Davies, Marzena Jankowska, Thushan
Kapurusinghe, Vishwas Katdare, Laurent Kelle, Ali Al
Kiyumi, Sujeet Kumar Dongre, Yaniv Levy, Carl Lloyd,
Edna López, Luis Felipe López, Jeff Mangel, Marina
(Kido team), Rod Mast, Sara Maxwell, Sharon Maxwell,
Pat McCloskey, Miguel Medina, Pascal Melot,
Anne Meylan, Badaruddin Mohamed, Somchai
Monanunsap, Félix Moncada, Anthony Mora, Natalia
Morales, Catharine Muir, M.Rama Murty, Wallace J.
Nichols, Celia Nicholls, Amanda Nickson, Calina
Norton, Erasmus Owusu, Joel Palma, Rudi Permana,
Jocelyn Peskin, George Petro, Rotney Piedra, Nick
Pilcher, Earl Possardt, Wagner Quiros, Marissa
Ramjattan, Sue Ranger, Adam Roberts, Salim Al-Saady,
Carl Safina, Dennis Sammy, Dewi Satriani, Kartik
Shanker, Debbie Sherman, Marco Solano, Jules Soto,
Guy-Philippe Sounguet, Todd Steiner, Joca Thomé,
Sara Townsend, Robin Trindell, Tony Tucker, Robert van
Dam, Lily Venizelos, Roger Villavicencio, Richard Winn,
Simon Wilson, Larry Wood, Richard Zanre and Patricia
Zárate shared data, contacts and their wisdom.
Special thanks go to all those who provided great
hospitality, logistic support and valuable information
during visits to case study sites:
In Ostional, Costa Rica: ADIO,
Carlos-Mario Orrego and Rodrigo Morera
In Tortuguero, Costa Rica: CCC, Zelmira Williams
and Eduardo Chamorro
In Malaysia: Nick Pilcher, Paul Basintal, Pauline Chin,
Terengganu tourism board, Kamaruddin Ibrahim and
his staff at TUMEC, EH Chan, HC Liew, Malaysia
Tourism Board, Central Bank of Malaysia, Andrew Ng,
and Chris Shepherd
In Maldives: Hussein Zahir
In Seychelles: Jeanne Mortimer, Frauke Dogley,
Eddy Belle, John Nevill, George and Margaret
Norah, Steven Barbe, Selby Remie, Nirmal Shah,
David Rowat, Jude Bijoux, and Michel Mellie
In South Africa: George Hughes, Ronel Nel,
Patrick Boddam-Parker, Mike Bower, Sandy
Ferguson, Dean Morton, Richard Penn-Sawyers,
and Walter Baard
In Brazil: TAMAR, Neca and Guy Marcovaldi,
Lali Guardia, Gustave Lopez, Fernando Rodriguez,
Betânia Ferreira, Luciana Brondizio, Victor de
Andrade, Gonzalo Rostan, Cristiana Coimbra
and Gilberto Sales
Lisa Campbell, Karen Eckert, Cynthia Lagueux, Sue
Lieberman, Warwick Moss, Adrian Reuter, Kirsten
Schuyt and Scott Whiting provided constructive
comments on an earlier draft and presentation that
greatly strengthened the final version of this report. The
contents are entirely the responsibility of the authors.
The study was encouraged and funded by WWF
International Species Programme. Support by Sue
Lieberman, Amanda Nickson and Joanna Benn was
instrumental to make it happen.
Acknowledgements
Money Ta lks : Economics Aspects o f Mar ine Tur t le Use and Conservat ion 5
Contents
Summary 6
Why consider economic aspects of marine turtle use and conservation? 8
Analytical framework and methodology 12
Direct use 15
Consumptive marine turtle use 16
Non-consumptive marine turtle use 18
Direct use options: economic consequences of a fundamental policy decision 22
Passive use 25
Replacement cost 28
Policy and management implications 30
Direct use 31
Passive use 32
Cost of marine turtle loss 32
Replacement cost 33
Conclusions 34
Recommendations 36
Appendices 38
1 Case studies – marine turtle use and conservation 39
2 Sites with non-consumptive marine turtle use 54
References 56

Summary

Money Ta lks : Economic Aspects o f Mar ine Tur t le Use and Conservat ion 7
when evaluating use options are contribution to poverty
alleviation, cost of production, distribution of revenues
and potential for economic diversification.
Environmental and social impacts should also be
examined when evaluating use options for a particular
site. Thus, promotion of non-consumptive use needs to
go along with careful planning, and it may not be a
feasible option at some sites. The case studies suggest
that promotion of consumptive uses of endangered
marine turtles is not precautionary, either from an
ecological or an economic perspective.
Marine turtles have a wide range of passive use values
including option, intrinsic, ethical, existence and
bequest values. We chose to quantify a lower boundary
for the passive use value as the expenditure of a
sample of 162 conservation organizations and
conventions in marine turtle conservation. Current
global marine turtle conservation expenditure is
estimated at a minimum of US$20 million per year.
In order to maintain the intrinsic values of marine
turtles, their roles in ecosystem functioning and in
providing benefits to people, their populations need to
be restored worldwide to healthy levels. Failure to
reverse marine turtle decline would imply a replacement
cost for nesting females through captive breeding
estimated at US$245.9-US$263.3 million for green and
US$2.5 billion for leatherback turtles. The cost of
rearing turtles in captivity suggests that conservation of
marine turtles in the wild is less expensive.
Overexploitation of marine turtles and other negative
impacts on their populations continue unabated in
many places because of local economic incentives.
Governments, international agencies and non-govern-
mental organizations can prevent over-exploitation by
creating local economic incentives in favour of adequate
management through employment and/or retraining of
people overexploiting marine turtles, promoting use
regulations, enforcing restrictive legislation, establishing
fines comprehensive of marine turtle values, facilitating
funding, subsidies and/or microcredits for non-
consumptive use where pertinent, eliminating perverse
subsidies, and establishing concessions and use fees.
Such economic incentives, once in place, will add value
to the marine turtles and thereby encourage measures
to mitigate additional threats, such as habitat
destruction and fisheries by-catch.
For thousands of years, marine turtles have provided
sustenance to coastal communities around the world.
Unfortunately, their populations have declined drastically
due to human overexploitation, fisheries by-catch and
habitat destruction. Six of seven species are classified by
the World Conservation Union (IUCN) as endangered or
critically endangered. Marine turtles occur predominantly
in developing countries. These countries stand to lose
most from continued decline and have most to gain
from reversing negative population trends. Economic
factors are often behind marine turtle declines.
Therefore, we set out to analyze economic aspects of
marine turtle use and conservation. Decision-makers
defining policies for sustainable economic develop-
ment and poverty alleviation may incorporate the
results of this study as additional criteria to reconcile
their agendas with marine turtle conservation goals.
We estimate gross revenue from consumptive use of
marine turtle meat, eggs, shell, leather and bone at nine
case study sites in developing countries. Gross revenue
from consumptive use range from US$158 to
US$1,701,328 yr-1 per case study with an average of
US$581,815 yr-1. Direct beneficiaries from consumptive
use vary from a handful to several hundred. Gross
revenue for nine case studies where non-consumptive
use of marine turtles, such as tourism, is a major revenue
generator range from US$41,147 to US$6,714,483 yr-1
per site with an average of US$1,659,250 yr-1. Gross
revenue at four sites where marine turtles are one of
many attractions varies between US$3,387-US$105,997
yr -1 with an average of US$40,791 yr -1. Direct
beneficiaries from non-consumptive use range from ten
tourism operators to 1,280 persons per case study.
Non-consumptive use generates more revenue, has
greater economic multiplying effects, greater potential
for economic growth, creates more support for
management, and generates proportionally more jobs,
social development and employment opportunities for
women than consumptive use. Both consumptive and
non-consumptive uses result in leakage of revenue
from local to national and international levels. Rivalry
between uses means that population decline caused by
consumptive use can have negative economic impacts
on uses at other locations. Consumptive and non-
consumptive uses may in many cases be incompatible
at the same location. In addition to gross revenue and
number of beneficiaries, other variables to consider
Summary
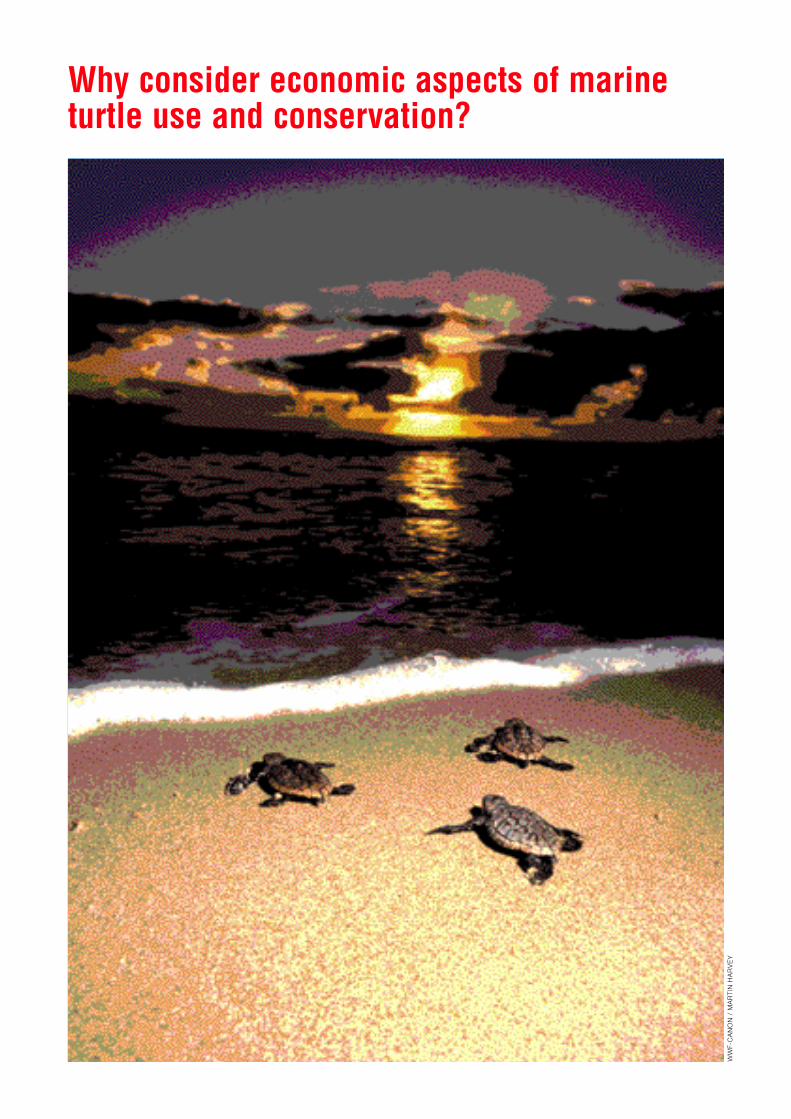
Why consider economic aspects of marineturtle use and conservation?
WW
F-C
AN
ON
/ M
AR
TIN
HA
RV
EY

2003, Trinidad & Wilson 2000), as well as cultural and
social impacts (Campbell 2003). However, the
economic importance of the flow of goods and services
provided by marine turtles is often ignored when
policies are formulated.
Quantification of the economic consequences of
marine turtle use and conservation could contribute
significantly to our understanding of use options and
their ecological impacts, and hence further the process
of defining adequate management policies. This is a
timely and urgent issue. Motivations behind the use of
marine turtles are currently influenced more by
economic incentives than any other impetus. Growing
human populations, decline in other natural resources
and societies striving for greater wealth mean that
economic considerations are likely to become even
more dominant factors controlling marine turtle use and
conservation in the future.
Goods and services provided by marine
turtles are valued by societies around the
world. The values put on these goods and
services are defined by user groups and are
relative in nature (Daily et al. 2000). An
economic perspective on marine turtle values
addresses one of many dimensions through
which humans interact with these animals. A
framework of universal, basic values of nature
discriminates the utilitarian, naturalistic,
ecologistic-scientific, aesthetic, symbolic,
dominionistic, humanistic, moralistic and
negativistic dispositions associated with the
human inclination to affiliate with the natural
world (Kellert 1996). The economics of marine
turtle uses are an expression of their utilitarian
value, for this reflects the traditional notion of
material benefit derived from exploiting nature
to satisfy various human needs and desires.
In addition, non-consumptive uses that
generate economic revenue capitalize on
other dispositions that make marine turtles
attractive to tourists and scientists, such as
the naturalistic, ecologistic-scientific and
aesthetic values.
The cultural meanings of marine turtles can be quite
diverse, even within a small region. For example; the
Money Ta lks : Economic Aspects o f Mar ine Tur t le Use and Conservat ion 9
For thousands of years, marine turtles have been a
source of food and sustenance for coastal communities
in tropical and subtropical regions. Today, six of the
world’s seven species of marine turtle are classified as
endangered or critically endangered and lack of
information prevents classification of the status of the
flatback turtle (IUCN 2003). Human activities,
noticeably overexploitation, fisheries by-catch and
habitat destruction, have been identified as the main
reasons for marine turtle declines (Seminoff 2002,
Spotila et al. 2000). Clearly, there is a pressing need to
identify and implement policies and actions that will
reverse the trend so that these endangered species and
the benefits they provide to human societies and
ecosystems are not lost forever (WWF 2003).
Marine turtles are highly migratory and represent an
open-access resource. Many countries recognize the
need to reduce marine turtle mortality from human
sources and have provided partial or total legal
protection for marine turtles. However, attempts to
exclude users and reduce human impacts have met
with limited success, particularly in countries where
funds to enforce restrictive legislation are scarce. We
need to understand the underlying factors driving
human impacts on marine turtles in order to
appropriately address threats to marine turtle survival.
In recent decades, there has been increased
recognition that economic factors are behind many
human activities that cause declines in habitats and
species. Economists and ecologists to a large extent
agree that methods combining economic and biological
information can help us to identify strategies to reverse
biodiversity and ecosystem loss. The methodological
approaches used in environmental economics have
met with criticism from economists (e.g. Bockstael et al.
1998) and ecologists (e.g. Mooney 2000). In spite of
shortcomings, fusion of biological and economic
information reflects interactions that are pertinent to
biodiversity management decisions.
Marine turtle management policies need to consider,
among other things, the ecological roles of turtles
(Bjorndal & Jackson 2003), biological limitations such
as slow growth and late maturation (Heppell et al. 2003;
Thorbjarnarson et al. 2000), risk of extinction (IUCN
2003), institutional capacity to regulate use (Epperly
In recent
decades,
there has
been
increased
recognition
that economic
factors are
behind
many human
activities that
cause
declines in
habitats and
species.
Why cons ider economic aspects o f mar ine tur t le use and conservat ion?

(Hope 2002). At Playa Grande, Costa Rica
annual gross revenue from turtle tourism at
the leatherback nesting beach was
estimated at US$900,460 in 1993 (Gutic
1994). Woody (1986) estimated annual gross
revenue from a fishery for olive ridleys in
Oaxaca at US$707,000 in 1985. In 2000, the
economic impact of illegal fishing of green
turtles in Costa Rica was estimated at
US$1,142 per turtle (Castro et al. 2000).
Marine turtles are predominantly tropical and
subtropical species. Their distribution extends
principally through countries with developing
economies (IUCN 2003, OECD 2000). For five of the
seven species of marine turtle, 78%-91% of countries
where they occur are countries with developing
economies (Table 1).
Table 1 Distribution of marine turtle species.(own elaboration from IUCN 2003, OECD2000)
Species Countries Proportion and with
territories developingpresent economies
%
Loggerhead Caretta caretta 58 78
Green Chelonia mydas 123 81
Leatherback Dermochelys coriacea 64 80
Hawksbill Eretmochelys imbricata 110 81
Kemp’s ridley Lepidochelys kempii 3 67
Olive ridley Lepidochelys olivacea 35 91
Flatback Natator depressus 1 0
ethnic diversity and cultural change on the Caribbean
coast of Costa Rica have historically generated
meanings that include the marine turtle as deity, food,
merchandise, medicine, aphrodisiac, scientific object,
protected animal, managed animal, tourist attraction,
and object of art (Vargas-Mena 2000). Although values
associated with some of the meanings can conflict with
each other, in principle these are not mutually exclusive
and several can be present simultaneously in the same
person or institution. Due to a lack of information on the
economic value of marine turtles for all of these
meanings, any analysis will inevitably fail to cover the
rich range of relationships between humans and these
reptiles. We believe, however, that those meanings,
which are most commonly related to economic revenue
throughout the world, namely the marine turtle as
merchandise, mainly for food (meat and eggs) and
handicrafts (hawksbill scutes), and as tourist attraction
can be quantified. Also, economic analysis of passive
use of marine turtles implicitly addresses Kellert’s
(1996) notion of their symbolic, humanistic and
moralistic values.
Some previous studies focused on identifying different
economic values of marine turtles and how many turtles
are needed to support consumptive and non-
consumptive use (Frazer 2001, Witherington & Frazer
2003). Extensive work to quantify the economic
benefits of marine turtle tourism and identifying the
economic rationale for turtle conservation has been
carried out at a loggerhead nesting beach in Mon
Repos, Australia (Tisdell & Wilson 2001, Tisdell &
Wilson 2002, Wilson & Tisdell 2001). Case studies of
the economic aspects of marine turtle use in
developing countries include socio-economic analyses
of olive ridley egg use in Costa Rica (Campbell 1998,
Hope 2002), Honduras (Lagueux 1991) and Nicaragua
Marine
turtles are
predominantly
found in
countries with
developing
economies.
Money Ta lks : Economics Aspects o f Mar ine Tur t le Use and Conservat ion 10
Why cons ider economic aspects o f mar ine tur t le use andconservat ion?
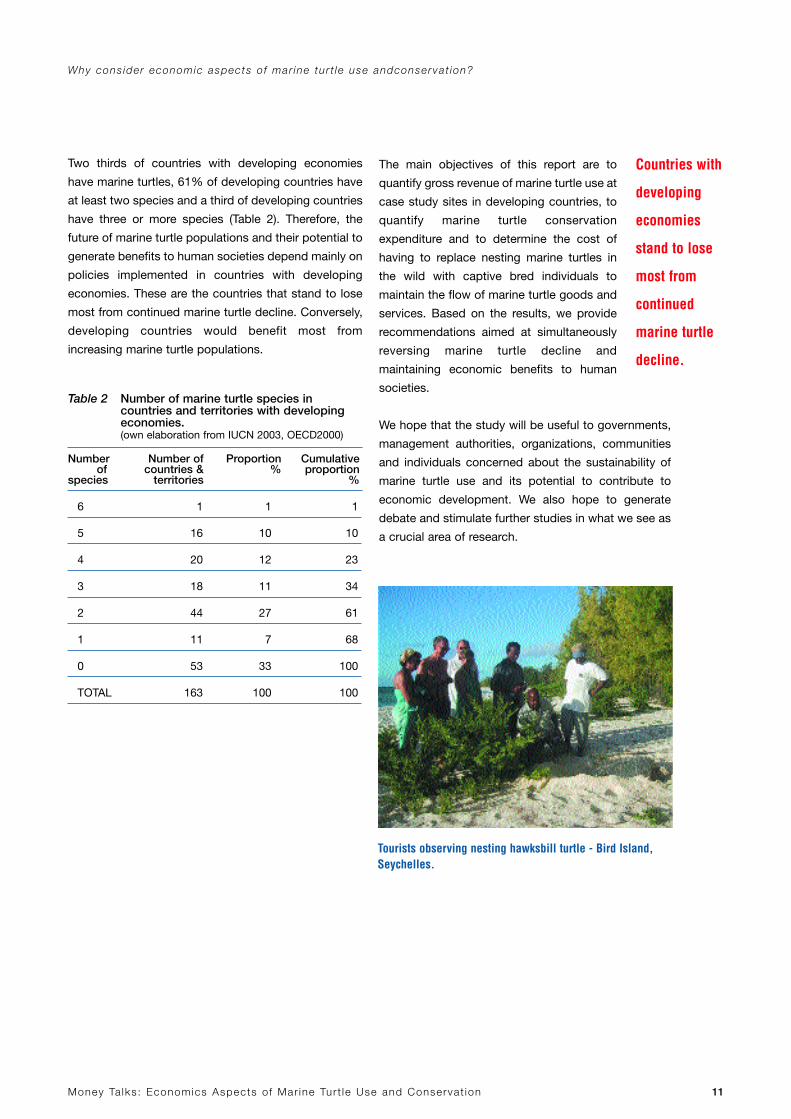
Two thirds of countries with developing economies
have marine turtles, 61% of developing countries have
at least two species and a third of developing countries
have three or more species (Table 2). Therefore, the
future of marine turtle populations and their potential to
generate benefits to human societies depend mainly on
policies implemented in countries with developing
economies. These are the countries that stand to lose
most from continued marine turtle decline. Conversely,
developing countries would benefit most from
increasing marine turtle populations.
Table 2 Number of marine turtle species incountries and territories with developingeconomies.(own elaboration from IUCN 2003, OECD2000)
Number Number of Proportion Cumulativeof countries & % proportion
species territories %
6 1 1 1
5 16 10 10
4 20 12 23
3 18 11 34
2 44 27 61
1 11 7 68
0 53 33 100
TOTAL 163 100 100
Why cons ider economic aspects o f mar ine tur t le use andconservat ion?
Money Ta lks : Economics Aspects o f Mar ine Tur t le Use and Conservat ion 11
The main objectives of this report are to
quantify gross revenue of marine turtle use at
case study sites in developing countries, to
quantify marine turtle conservation
expenditure and to determine the cost of
having to replace nesting marine turtles in
the wild with captive bred individuals to
maintain the flow of marine turtle goods and
services. Based on the results, we provide
recommendations aimed at simultaneously
reversing marine turtle decline and
maintaining economic benefits to human
societies.
We hope that the study will be useful to governments,
management authorities, organizations, communities
and individuals concerned about the sustainability of
marine turtle use and its potential to contribute to
economic development. We also hope to generate
debate and stimulate further studies in what we see as
a crucial area of research.
Countries with
developing
economies
stand to lose
most from
continued
marine turtle
decline.
Tourists observing nesting hawksbill turtle - Bird Island,Seychelles.

Analytical framework and methodology

Money Ta lks : Economic Aspects o f Mar ine Tur t le Use and Conservat ion 13
Economic valuation theory is based on the preferences
and choices of individuals (Freeman 2003, Simpson
1998). The economic value of goods or a service is
based on what a person is willing to forfeit in terms of
other goods and services. This is commonly known as
willingness to pay. Willingness to pay is constrained by
income and available time. Willingness to pay also
depends on the substitutability of goods and services.
Goods and services that are easily substituted are
generally less valuable than those that are difficult to
replace. It can be argued that marine turtle eggs could
be easily substituted with eggs from domestic fowl and
marine turtle meat could be replaced with beef, pork or
chicken so substitutability is high. The replacement of
cultural connotations attached to marine turtle
products, however, is not straight forward. Also, marine
turtles used non-consumptively as an ecotourism
attraction are not easy to substitute at a given site, but
visitors may change to other tourism sites where marine
turtles are present. In the long-term, substitutability will
decrease as marine turtle populations continue to
decline. The unit used in this study to measure people’s
willingness to pay in the market economy is currency.
Figure 1 shows the framework used to quantify the
economic aspects of marine turtle use and
conservation. Although not exhaustive, the framework
covers the most important uses behind local economic
incentives for and against overexploitation of marine
turtles. It also addresses the issue of having to replace
the flow of goods and services provided by marine turtles.
Figure 1 Analytical framework to quantify economicaspects of marine turtle use andconservation.
Economic theory defines economic value as the gross
revenue plus consumer surplus minus the cost of
production (Perman et al. 2003). Gross revenue is
estimated by multiplying the number of units (quantity)
by sales price or expenditure. Consumer
surplus is the additional value to a customer
beyond what was paid for a good or service.
In the case of consumptive marine turtle use,
an example of consumer surplus is the ability
to eat meat at a lower price than the cost of
beef or pork. If a person’s willingness to pay
for meat is the same as the market price for
beef or pork, then consumer surplus would
be the difference between the market price
of beef/pork and the market price of marine
turtle meat. Cultural preferences that make
people appreciate marine turtles more may
result in a greater willingness to pay for marine turtle
products and if market prices are low, contribute to a
large consumer surplus. For non-consumptive use,
consumer surplus can be exemplified by tourists willing
to pay more for a marine turtle tour than they are
actually charged.
However, information on consumer surplus and the
cost of production for direct use of marine turtles in
developing countries is not readily available. Therefore,
per capita net revenue was not calculated, although it is
an important economic measure of marine turtle use.
Consequently, our study is limited to an estimate of
gross revenue of direct use rather than economic value.
Gross revenue reflects the extent of economic activity
in an area and has implications for employment rates.
Both these aspects are particularly important in the
context of countries with developing economies. All
gross revenue and expenditure estimates were
converted to 2002 US dollars using the US Consumer
Price Index.1
An underlying assumption of our study is that an
increment in revenue corresponds to an improvement
in the quality of life. Although one case study (Table 10)
suggests that higher income is indeed associated with
greater likelihood of basic needs being satisfied, an
analysis of the relationship between income and quality
of life is beyond the scope of this report.
Ana ly t ica l f ramework and methodo logy
Consumptive use:gross revenue from sale of eggs, meat and shell
Direct use
Passive use
Conservation:expenditure byorganization andconventions
Non-consumptive use:
Replacement cost:cost of rearing marine turtles in captivity
major attraction (expenditure for entire stay)one of many attractions (tour expenditure)
•
•
1 ftp://ftp.bls.gov/pub/special.requests/cpi/cpiai.txt
Economic
valuation
theory is
based on the
preferences
and choices of
individuals.

Money Ta lks : Economic Aspects o f Mar ine Tur t le Use and Conservat ion 14
We estimate gross revenue from direct use of marine
turtles at case study sites in developing countries. We
had two criteria for selecting case study sites.
Information to estimate gross revenue had to be
available and also we wanted a geographically and
culturally diverse selection of case studies from Africa,
Asia, Latin America and the Caribbean. No developing
country site was left out if gross revenue could be
estimated. Detailed information for each case study is
available in Appendix 1. Appendix 2 lists sites with non-
consumptive uses identified during this study, including
number of visitors per year where available.
For passive use, we estimate gross expenditure in
marine turtle conservation for a sample of organizations
and conventions. It has been suggested that only
expenditure for advocacy and direct conservation
actions should be included when estimating
preservation values and that all other conservation
organization expenditure should be excluded (Freeman
2003). We choose to include all expenditure, as
administrative and other expenses create employment
opportunities and therefore may influence local
economic incentives regarding marine turtle use and
conservation. The estimate of annual conservation
expenditure is based on budget information provided
by organizations for fiscal years 2002-2004.
The replacement cost of substituting all nesting turtles
in the wild with individuals raised in captivity was
estimated for two marine turtle species based on
captive breeding case studies (Appendix 1).
A limitation of projections into the future based on our
analysis is that total take, visitation, supply and demand
for marine turtle goods and services can change over
time with subsequent changes in prices and gross
revenue.
Ana ly t ica l f ramework and methodo logy
Direct use

Money Ta lks : Economic Aspects o f Mar ine Tur t le Use and Conservat ion 16
Gross revenue from consumptive use of marine turtles
ranged from US$158 to US$1,701,328 per year with an
average of US$581,815 per year (Table 3). Direct
beneficiaries from consumptive use at the case study
sites vary from a handful to several hundred (Table 3).
They include fishermen and egg collectors in
communities close to marine turtle feeding areas and
nesting beaches. Often traders or other intermediaries
are involved in aggregating value and transporting
marine turtle products before final sale in towns and
cities located further away, sometimes even in other
countries. It is likely that the intermediaries receive the
greatest share of the gross revenue.
In several cases, overexploitation has
caused drastic declines in marine turtle
populations (Jackson 1997, 2001, Jackson
et al. 2001, Meylan & Donnelly 1999,
Seminoff 2002, Thorbjarnarson et al. 2000,
TRAFFIC Southeast Asia 2004, Troëng 1997).
Consumptive uses remove turtles of many
life stages from their population and hence
reduce survivorship rates and reproductive
output of marine turtle populations. If use
exceeds sustainable levels, the utilized
populations begin to decline. It is reasonable
to assume that the consumptive uses are at
least partly responsible for the negative population
trends at six of the nine case study sites (Table 3).
Marine turtle population trends at the remaining three
case study sites are uncertain although nesting is
probably increasing at one of the sites (Table 3).
Conversely, changes in marine turtle abundance have
consequences for consumptive use. Smaller marine
turtle populations can sustain less consumptive use
and hence will generate less gross revenue. At Rantau
Abang, Malaysia nesting declined from 10,000
leatherback nests per year in 1956 to 3 nests in 2002
due to overexploitation of eggs and fisheries by-catch
(Appendix 1). The nesting decline caused gross
revenue from consumptive use at Rantau Abang to fall
to US$158 in 2002 (Table 3). However, in places such as
Ostional, Costa Rica consumptive use of marine turtle
eggs is believed to be biologically sustainable (Valverde
1999). There are yet other consumptive use projects,
like the legal fishing of a mixed stock of hawksbill
turtles in Cuba, where the issue of sustainability
remains contested (Rhodin & Pritchard 1999).
Direct use
Rantau Abang,Malaysia
Turtle Islands,Philippines
Pacific Mexico
Ostional,Costa Rica
Cuba
Nicaragua Maldives
Seychelles Bali, Indonesia
Consumptive marine turtle use
Marine turtles have been used for eggs, meat, shell, oil,
leather or other products since at least 5000 BC (Frazier
2003). Ancient human societies from the Ubaid culture
of the Arabian Peninsula and surrounding areas, to the
Mesoamerican Mayas and other Amerindians had
consumptive marine turtles use in common (Frazier
2003, Wing & Wing 2001). During colonial times, marine
turtle utilization increased for use as food by ships’
crews and for export to European countries (Jackson
1997, Parsons 1962, 1972). Due to such trade, the
green turtle was once called “... the world’s most
valuable reptile ...” (Parsons 1962). Today, intentional
capture of marine turtles for consumptive use
continues in tropical and subtropical regions. Marine
turtles are easily caught and their eggs collected by
local inhabitants or concession holders when emerging
to nest on sandy beaches. Marine turtles are also
caught using nets, harpoons or traps in feeding
grounds and during their migrations.
We analyzed nine case studies of consumptive use,
which include examples of use for meat, shell, eggs,
bone and leather (Appendix 1). The case studies
illustrate marine turtle use in countries bordering the
Atlantic, Indian and Pacific Oceans (Figure 2). We
estimate gross revenue for consumptive use by
multiplying the number of units extracted each year (for
example; turtles or eggs) by the final sales price per
unit.
Figure 2 Case studies of consumptive uses ofmarine turtles.
Marine turtles
have been
used for eggs,
meat, shell,
oil, leather or
other products
since at least
5000BC.

Money Ta lks : Economic Aspects o f Mar ine Tur t le Use and Conservat ion 17
Table 3 Gross revenue from consumptive use case studies (for sources see text in Appendix 1)
Case Study Year Species Population Units Price Estimated Adjusted Direct(Appendix 1) trend per unit gross to 2002 beneficiaries
US$ revenue usingUS$ US CPI
1 Bali, 2002 Cm - 8,208 turtles 146.2-268.4 1,701,328 1,701,328 fishers on 56-Indonesia 101 boats,
traders and employees
2 Mexican 1985 Lo - 28,000 turtles 25.3 707,280 1,182,525 100’s of Pacific fishers?,
wholesaler and employees
3 Cuba 2002 Ei -? ~650 kg shell 1,654.6 1,075,455 1,075,455 fishers 5 communities (Cuba),234 manufacturers (Japan)
4 Ostional, 2003 Lo +? 4,137,000 eggs 0.12-0.37 1,011,615 992,851 235 egg Costa Rica collectors,
~66 intermediaries
5 Nicaraguan 2003 Cm ±? 10,166 turtles 9.8-52.1 256,467 251,709 fishers in ≥12 Caribbean communities
6 Seychelles 1993 Ei - ~1,250 kg shell ~211.3 264,091 328,789 fishers and (domestic) ~40 artisans
(for export) 1982 Ei - 591 kg shell 148.7 87,878 163,826 fishers and traders
7 Turtle Islands, 2003 Cm, Ei - 386,714 eggs 0.18-0.26 85,078 83,500 egg collectors Philippines on 4 islands
traders
8 Maldives 2003 Cm, Ei - 163,833 eggs 0.24 38,731 38,013 egg collectors and traders
9 Rantau Abang, 2002 Dc - 240 eggs 0.66 158 158 1-3 egg Malaysia collectors
Cm = Green turtle, Ei = hawksbill turtle, Dc = leatherback turtle, Lo = olive ridley
Direct use
Money Ta lks : Economic Aspects o f Mar ine Tur t le Use and Conservat ion 18
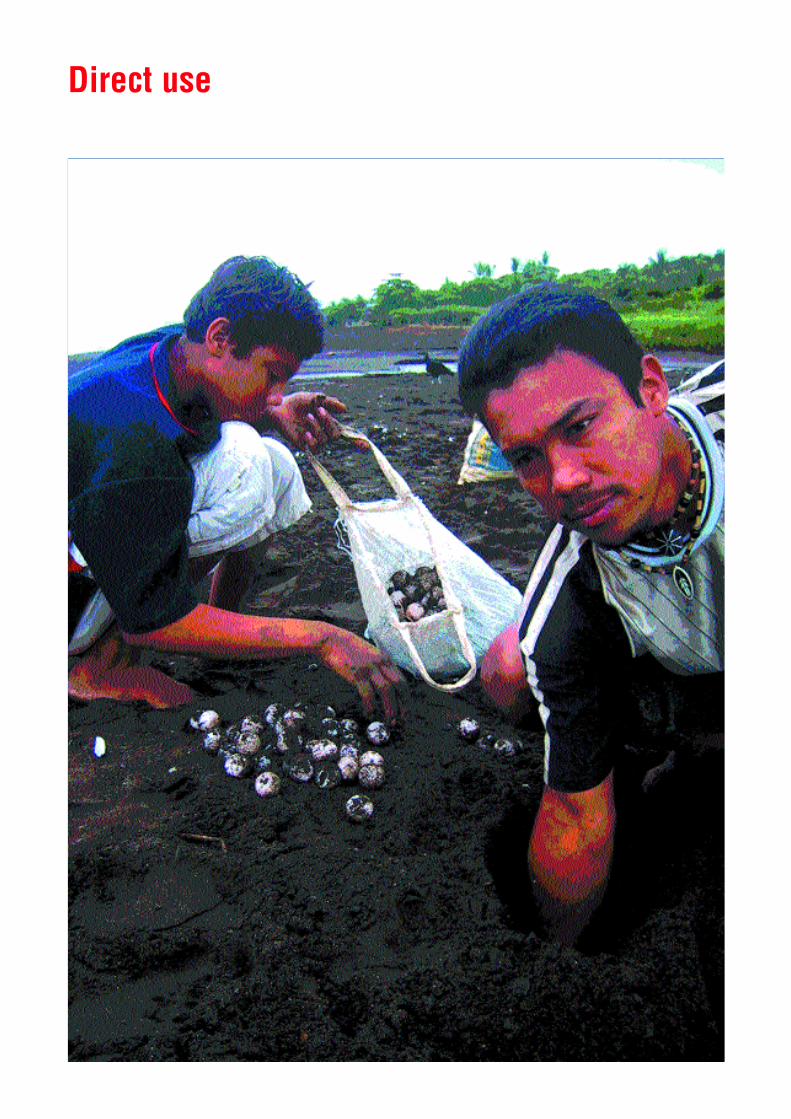
Non-consumptive marine turtle use
Non-consumptive use refers mainly to the use of
marine turtles as a tourism attraction, either on land
when turtles come to nest or bask, or in-water. The
production and sale of items with marine turtle motifs
associated with conservation projects, and the
provision of board and lodging services to scientists
and volunteers is another form of non-consumptive
use. Non-consumptive use of marine turtles is a
relatively recent phenomenon. Tourists were travelling
to Rantau Abang in Malaysia to watch nesting
leatherback turtles as early as in the 1960s. In the
1980s, tourism to observe marine turtle nesting began
in the Turtle Islands Park in Sabah, Malaysia and in
Tortuguero National Park, Costa Rica. Now, 8,450 and
32,854 tourists, respectively, visit each year these sites
to observe marine turtles nesting (Appendix 1). In the
1990s and during the first years of this century, marine
turtle tourism has become popular at many sites in
Africa, the Americas and Asia. Worldwide, non-
consumptive marine turtle use occurs at least at 92
sites in 43 countries (Appendix 2). Each year, more than
175,000 tourists participate in marine turtle tours
(Appendix 2).
We estimated gross revenue at nine case study sites
where non-consumptive marine turtle use represents a
major generator of revenue and four places where
marine turtles are one of many attractions. The case
studies are distributed in the tropics and subtropics of
Africa, Asia, Latin America and the Caribbean (Figure
3). We estimate gross revenue for non-consumptive
use, by multiplying tourist expenditure by the number of
tourists participating in marine turtle observation. For
locations where marine turtles represent a major
generator of revenue, the estimate includes all
expenditure (food, accommodation, souvenirs,
transport and other costs) incurred by tourists during
their time at the turtle-watching location.
Direct use
A discussion of the biological sustainability of marine
turtle use is beyond the scope of this report.
In the light of these trends, promotion of consumptive
use of marine turtles is not precautionary, either from an
ecological or an economic perspective. Countries
throughout the world recognize the potential negative
impact of consumptive use on marine turtle
populations. National legislation, protective of
endangered species, often prohibits the take of marine
turtles and domestic trade in their products. In a
sample of 45 countries including Central America, the
northern Caribbean, the Atlantic coast of Africa,
Indonesia and Vietnam, legislation included restrictions
on consumptive use in all but one nation (Chacón 2002,
Fleming 2001, Fretey 2001, TRAFFIC Southeast Asia
2004, van Dijk & Shepherd 2004). The precise level of
protection and its species coverage was unclear in the
literature in nine cases. Among the 36 nations for which
enough information was readily available, 53% granted
full protection to marine turtles and 44% partial
protection. The latter category either excluded some
species from the protection scheme or allowed for
regulated take of eggs and, in few cases, of turtles for
meat and shell. Recent changes in national legislation
leading to absolute protection of marine turtles in
Vietnam, acknowledge that consumptive uses caused
overexploitation in that country (TRAFFIC Southeast
Asia 2004). Trade is regarded as a major contributor to
the decline of Vietnam’s marine turtle populations.
Wholesale, illegal international trade persists in Asia
and prevents marine turtle populations from recovering
(TRAFFIC Southeast Asia 2004, van Dijk & Shepherd 2004).

Money Ta lks : Economic Aspects o f Mar ine Tur t le Use and Conservat ion 19
Costs for tours to observe marine turtles are relatively
low, as little local transport and no specialized
equipment are needed. However, marine turtles tend to
nest on remote beaches and mostly at night resulting in
high expenditure for within-country travel to the site
and accommodation. The ratio of total expenditure/tour
fee is higher for marine turtle tourism than for example
whale watching (Hoyt 2001). Based on information from
five case studies2, we estimate that total expenditure is
26 times the tour fee. For case studies where
information was available only on tour fee expenditure,
we multiplied this number by 26 to estimate gross
revenue. At sites where marine turtles are one of several
tourism attractions, we included only the tour fee
expenditure in the estimate of gross revenue.
Gross revenue at case study sites where non-
consumptive marine turtle use is a major revenue
generator ranged from US$41,147 to US$6,714,483 per
year with an average of US$1,659,250 per year (Table
5). Gross revenue at sites where marine turtles are one
of many attractions varied between US$3,387 and
US$105,997 per year with an average of US$40,791
per year (Table 5).
A minimum of 30+ tour guides, hostel and resort
owners and their employees to as many as 1,280
people receive direct economic benefits from non-
consumptive use at sites where marine turtles are a
major generator of revenue (Table 5). At sites where
marine turtles are one of many attractions, direct
beneficiaries vary from ten tourism operators to include
several dive operators, tour guides, business owners
and their employees (Table 5). As in the case of
consumptive use, one set of beneficiaries, in this case
tourism business owners are likely to receive a larger
share of the economic revenue than other user groups.
Tourism development can have both positive and
negative economic, environmental and socio-cultural
impacts (Table 4). In Rantau Abang, Malaysia
uncontrolled tourism affected the behaviour of nesting
leatherback turtles (K. Ibrahim pers. comm.). On
Zakynthos Island, Greece, lights from hotels and
restaurants and the compacting of sand by cars and
tourists have changed the distribution of loggerhead
nests on Laganas Bay beaches (pers. obs.). The
economic benefits from tourism can only be
sustainable long-term if appropriate control measures
are in place.
There are guidelines to maximize the benefits
of nature tourism, while minimizing its
drawbacks (e.g. Lindberg 1991). It appears
that regulation of marine turtle tourism often
takes time. In the Maldives, tourism
development began in the 1970’s and first
stimulated an increase in turtle catch to
supply the souvenir market with tortoiseshell
souvenirs and stuffed turtles (Frazier et al.
2000). Since then, some tourism operators
have realized the importance of a healthy
marine environment in attracting visitors to
the Maldives. Environmentalists and tour
operators were instrumental in promoting a
ten-year ban on marine turtle catching that
came into effect in June 1995 (Hussein
2000). Tourism can result in decreased
marine turtle mortality and positive
population trends if it creates economic
incentives for stakeholder groups to stop
overexploitation. Also, the presence of scientists, tour
operators and tourists on nesting beaches is a
deterrent against the illegal take of turtles and eggs,
hence contributing to better protection.
One serious concern is that tourism has a large
“ecological footprint” because it stimulates air travel
Direct use
Figure 3 Case studies of non-consumptive uses of marine turtles.
Rantau Abang,Malaysia
Rekawa,Sri Lanka
Playa Grande,Costa Rica
Tortuguero,Costa Rica
Gandoca,Costa Rica
Barbados
Brazil
Matura, Trinidad
Oman
South Africa
Turtle Islands, Sabah, Malaysia
Cape Verde
2 Tortuguero (Costa Rica), Sabah (Malaysia), Ras Al Hadd (Oman), Rekawa (Sri Lanka), Rantau Abang (Malaysia)
Non-
consumptive
use refers
mainly to the
use of marine
turtles as a
tourism
attraction,
either on land
when turtles
come to nest
or bask, or
in water.
Money Ta lks : Economic Aspects o f Mar ine Tur t le Use and Conservat ion 20
and other resource intensive activities (Table 4).
Theoretically, marine turtle tourism can incite people to
travel abroad and hence cause an increase in
international travel and augment resource use.
However, we believe that in most cases marine turtle
tourism attracts visitors that have already decided to
travel and therefore it redistributes rather than
increases total resource use.
Marine turtle abundance can influence tourism
visitation to nesting and in-water sites. As a
consequence, turtle tourism will be affected when the
probability of observing marine turtles falls below a
certain level. Tisdell & Wilson (2001) suggested that at
least 200 marine turtle females per year were needed to
maintain tourism at current levels at Mon Repos,
Australia. The threshold concept is consistent with
observations at Rantau Abang, Malaysia where tourism
declined rapidly once leatherback nesting fell below
100 nests per year (Appendix 1). Similarly, at Playa
Grande, Costa Rica tourist visits declined during
seasons when annual nesting fell below 100 females
(Appendix 1).
Nature oriented tourism is growing worldwide at a rate
of 10-30% per year which is faster than the global overall
tourism growth of 4% (Reingold 1993). Similarly, marine
turtle tourism has shown great potential for growth
(Appendix 1). At Tortuguero, tourism visitation increased
at a rate of 16% per year between 1988 and 2002. At
Turtle Islands Park, Sabah tourism visitation increased
13% per year between 1988 and 2002. In Oman, the
number of visitors grew with 20% per year between
1991 and 1996. In Rantau Abang, national tourism grew
with 15% and international tourism with 9% per year
between 1989 and 1994. The potential of long-term
growth is apparent at the two non-consumptive use
programs generating the greatest gross revenue –
Tortuguero, Costa Rica and Projeto TAMAR were both
initiated over 20 years ago (Appendix 1).
Direct use
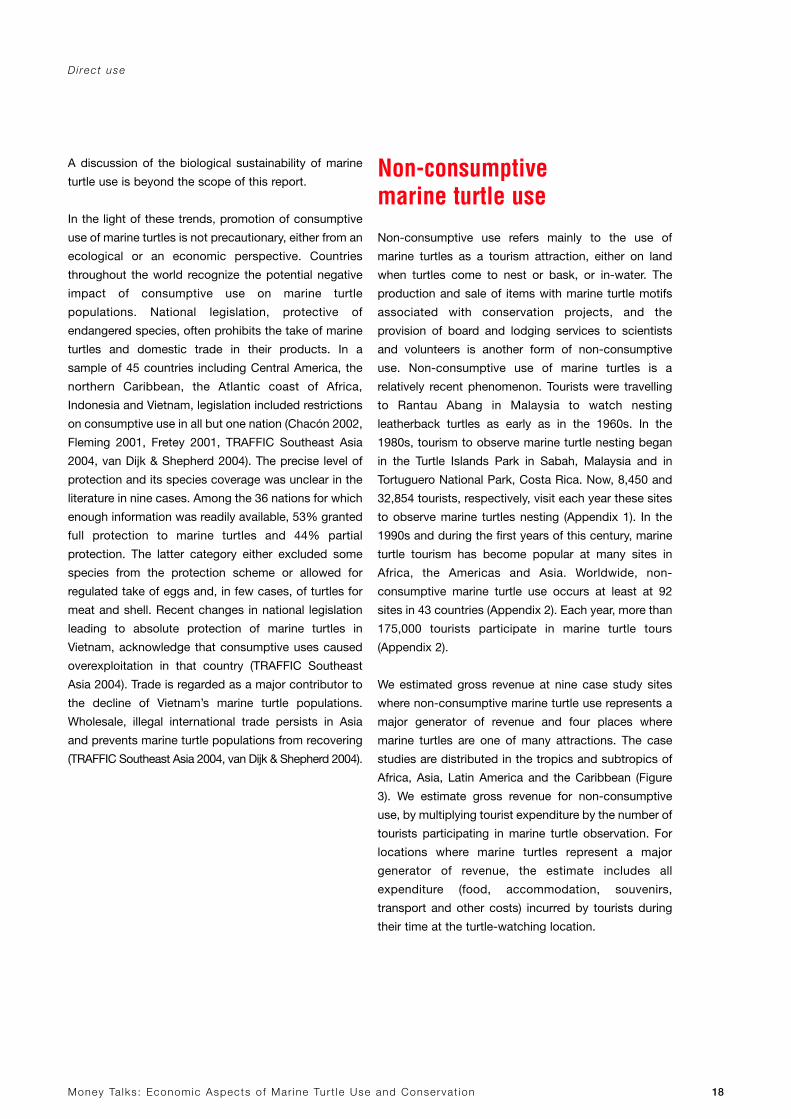
Table 4 Potential impacts of tourism(adapted from Kiss 2004, NOAA 2002, Peskin 2002, Scheyvens 1999)
Impacts Positive Negative
Economic • Greater tax base• Creation of jobs• Increase in house-
hold incomes• Improved
infrastructure
Environmental • Greater support for conservation efforts
• Heightened environ-mental awareness
Social • Greater awareness and appreciation for other cultures
• Increased standard of living
• Improved access to public services
• Greater cooperation and sense of ownership among stakeholders
• Price inflation as demandfor goods and servicesincrease
• Unequal distribution ofeconomic benefits
• Leakage of revenues• Unsteady income streams
from seasonal jobs
• Greater ‘ecologicalfootprint’
• Habitatdestruction/damage
• Negative impacts on plantand animal species
• Generation of garbage• Noise pollution• Air and water pollution
• Crowding • Displacement of local
residents• Loss of cultural heritage• Increase in alcohol and
drug abuse• Prostitution

Money Ta lks : Economic Aspects o f Mar ine Tur t le Use and Conservat ion 21
Table 5 Summary of non-consumptive use case studies (for sources see text in Appendix 1)
Case study Year Major Nesting Visitors Spending Estimated Adjusted Direct(Appendix 1) species trend per visitor gross to 2002 beneficiaries
US$ revenue usingUS$ US CPI
Major revenue generator
4 Tortuguero, 2002 Cm + 26,292 255.4 6,714,483 6,714,483 owners of 25 hotels and Costa Rica hostels,
~265 hotel employees, 235 tour guides
10 Projeto TAMAR, 2001 Cc +? N/A N/A 2,635,656 2,677,326 1,280 employeesBrazil Ei
Lo
4 Playa Grande, 2002 Dc - 4,234 338-676** 2,113,176 2,113,176 business owners and Costa Rica employees,
41 tourism operators
11 Ras Al Hadd, 1997 Cm ± 11,558 98.3 1,136,151 1,273,481 tour company owners Oman and employees
7 Sabah, Malaysia 2002 Cm + 8,450 113.7-115.5 975,044 975,044 tour company owners~54 persons including park rangers, resort staff, boat captains, tour guides
12 Matura, 2001 Dc + 10,693 21.2-390.0** 559,014 567,852 beach monitors, turtle Trinidad & taggers, tour guides, Tobago business owners and
employees
9 Rantau Abang, 2002 Dc - 12,259 26.3-65.5 480,149 480,149 Concession holders,Malaysia business owners and
employees
4 Gandoca, 2003 Dc + 610 151.3* 92,300 90,588 taxi drivers, shop & bar Costa Rica owner and employees,
tour guides, owners and employees of 7 hostels, 6 conservation project employees
13 Rekawa, 2003 Cm ? 1,710 24.5 41,925 41,147 17 tour guides,Sri Lanka 13+ hostel and resort
owners, business owners and employeesOne of many attractions
One of many attractions
14 Barbados 2003 Cm, Ei + 1,400 20-100 108,000 105,997 dive operators, tour guides, BSTP, business owners and employees
15 Maputaland, 2003 Cc, Dc + ~1,750 7.1-94.1 45,597 44,751 4 tour companies and South Africa employees
16 Brazil 2002 Cc +? 260 13.6-45.9 9,031 9,031 tour companies and employees
17 Cape Verde 2003 Cc ? ~300 11.5 3,451 3,387 10 tourism operators
Cc =loggerhead turtle, Cm = Green turtle, Ei = hawksbill turtle, Dc = leatherback turtle, Lo = olive ridley*Direct income for community**Extrapolated from tour fee
Direct use

Money Ta lks : Economic Aspects o f Mar ine Tur t le Use and Conservat ion 22
Direct use options: economicconsequences of afundamental policy decisionDecision-makers are faced with the choice to allow
consumptive use to continue or to ban such use and
instead promote non-consumptive use as an alternative
generator of jobs and revenue. Consumptive use of
marine turtles has thus far resulted by-and-large in
population declines (Table 3), a reason why this kind of
use has often been questioned (Thorbjarnarson et al.
2000). On the other hand, unregulated tourism as a
substitute for consumptive use can also have negative
impacts (Table 4). To discern the economic con-
sequences of the two use options, we identified four case
studies where policy decisions were made to continue
consumptive use or to stop such use and instead
promote non-consumptive use (Table 6, Appendix 1).
Non-consumptive use generally generates greater gross
revenue than consumptive use (Table 6). In our case
studies, the average gross revenue was 2.9 times higher at
sites where marine turtles are a major tourist attraction than
the average gross revenue of consumptive use sites
(Table3 c.f. Table 5). This difference in gross revenue is
conservative since multipliers to determine the total
economic impact of service industries such as tourism
tend to be higher than for fisheries (Stynes 1999). One
major reason is that tourism requires input from other
economic sectors such as agriculture (e.g. food), transport
and manufacturing (e.g. furniture) whilst fisheries require
minimal input from other sectors (Arabsheibani & Delgado-
Aparicio 2002).
There are other aspects to consider when evaluating
the economic consequences of direct use options.
These are relevant to policy decisions regarding the
promotion of certain uses over others.
Firstly, the potential for growth is different for
consumptive and non-consumptive use. The revenue
from consumptive use at an optimal level will remain
the same or perhaps under ideal conditions grow
slightly. If use exceeds sustainable levels, the revenue
from consumptive use will decline over time as
demonstrated by many of the sites with large-scale
consumptive use (Appendix 1). From local and national
perspectives, aggregating values to the raw material
could increase the revenue from consumptive use. For
example, tortoiseshell could be made into jewellery
before export to industrialized countries. Due to vested
interests, aggregation of value has proven difficult for
other wildlife products (Hutton et al. 2001). Also,
increasing the value at a local or national level can
result in more effort being directed towards
consumptive use. For example; the increase in the price
of tortoiseshell caused increased exploitation of
hawksbill turtles in Seychelles (Mortimer 1984). There is
a maximum carrying capacity for non-consumptive use
too but with careful regulation, impacts on marine turtle
populations can be kept at a minimum and economic,
social and ecological benefits maximized (e.g. Lindberg
1991). It would appear that non-consumptive use has
greater potential for long-term growth than consump-
tive use (Table 6). Marine turtle tourism has grown
steeply at most sites where nesting can be reliably
offered as an attraction. If marine turtle tourism becomes
more commonplace, will each site receive fewer visitors
Direct use
Table 6 Case studies where consumptive use was continued or replaced with non-consumptive use (for sources see text in Appendix 1).
Case study Consumptive Gross revenue Gross revenue Population Grossuse consumptive non-consumptive trend revenue
continued use use trendUS$ US$
9 Rantau Abang, Malaysia Yes 158 480,149 - -
7 Turtle Islands, Philippines Yes 83,500 0 - -Turtle Islands, Sabah, Malaysia No 0 975,044 + +
4 Ostional, Costa Rica Yes 992,851 ? +? ±Tortuguero, Costa Rica No 0 6,714,483 + +
6. Seychelles No 0 ? +? +?

Money Ta lks : Economic Aspects o f Mar ine Tur t le Use and Conservat ion 23
or will prices for turtle tours decline as more sites offer
similar services? Worldwide more than 175,000 tourists
per year pay for marine turtle tours (Appendix 2). The
number of global whale watching tourists is one order
of magnitude greater and still growing (Hoyt 2001). We
therefore think that it is unlikely that participation in
marine turtle tours or tour prices will decline in the near
future as a result of supply exceeding demand.
Secondly, consumptive and non-consumptive uses
contribute differently to social development, mainly
through job generation and benefits to women. Tourism
tends to require more workers than fisheries (Stynes
1999). In addition, multiplying effects result in more
indirect jobs created by tourism than by fisheries. Also,
tourism employs a higher proportion of women than do
fisheries (Cattarinich 2001). Employment of women
tends to contribute more to social and economic
development than if only men are employed
(Cattarinich 2001). Projeto TAMAR’s efforts and
Tortuguero tour guides are two examples of women
involved in non-consumptive use of marine turtles
(Appendix 1). In Costa Rica, a community with non-
consumptive use has more basic needs satisfied than
two communities without such use (Appendix 1, Table
10). Marine turtle tourism in developing countries has
the potential to contribute to the economy of rural and
isolated coastal areas with few active economic
sectors, little production and scarce job opportunities
(Cattarinich 2001). Niche tourism, such as nature
tourism has greater economic multiplier effects and
better links to local economies than mass tourism
(Cattarinich 2001).
Thirdly, cost of production varies for direct uses.
Community-based ecotourism projects in many cases
depend on external funding for long periods (Kiss
2004). Non-consumptive use requires considerable
investments in terms of infrastructure to provide board
and lodging for tourists or production facilities for
manufacturing items with marine turtle motifs. Guiding
services on the other hand do not require much
investment aside from initial training costs. The cost of
production for consumptive use depends on where
and how marine turtles are exploited. Collection of
eggs and take of turtles on nesting beaches require
little investment. Catching turtles at sea may have
higher costs including purchase of vessels, motors
and gasoline.
Fourth, the distribution of revenue amongst users is an
important consideration. A large number of
beneficiaries at a local level, each with a fair share of
the revenue, are most likely to represent an economic
incentive in favour of adequate marine turtle
management. Several researchers have expressed
concern that leakage of revenue means that local
community members receive few economic benefits
Direct use
Table 7 Estimated distribution of gross revenue from marine turtle use for cases in which the information was available.
Location Type of use Local National International
Cuba3 Fishery for export $318,500 $756,955=30% =70%
Ostional, Costa Rica4 Domestic egg sales $202,323 $809,292=~20% =~80%
Tortuguero, Costa Rica5 Tourism $642,417 $3,050,549 $3,029,394=~10% =~45% =~45%
Playa Grande, Costa Rica6 Tourism $325,104 $792,441 $914,355=~16% =~39% =~45%
3 Based on the assumption of an export price of US$490/kg for tortoiseshell from the Cuban state fishery (ROC 2002) and a final sales price in Japan of US$1,655/kg.
4 Based on local sales of 4,137,000 (Chacón 2002) eggs at US$0.05/egg (R. Morera pers. comm.) and a final sales price of US$0.25/egg(pers. obs.).
5 Based on the assumption that 55% of revenue stay in-country (Bann 1996), local revenue assumed to include 72% of turtle tours (Peskin2002), minimum salaries for 265 people during five months and 5% of visitors spending half the average expenditure at a local level
6 Based on the assumptions that 55% of revenue stay in-country (Bann 1996) and 16% remain locally (Gutic 1994)
Non-
consumptive
use generally
generates
greater gross
revenue than
consumptive
use.

Money Ta lks : Economic Aspects o f Mar ine Tur t le Use and Conservat ion 24
The reduced populations are less likely to
sustain consumptive use or allow for
development of non-consumptive uses. Non-
consumptive uses are less likely to have
negative impacts on other uses and will
therefore not affect the economic revenue at
other locations (Appendix 1). This is a key
aspect as marine turtles are highly migratory.
Also, consumptive and non-consumptive
uses may be socially incompatible at the
same location (Hope 2002). Visitors paying for
marine turtle tours, who admire live turtles in
their natural habitats, will not tolerate
consumptive use of these turtles. Therefore,
the decision to advocate for one form of use in many
cases excludes the possibility of developing the other.
Seventh, economic diversification reduces risk, allows
for robust development and ensures that local
economies are less likely to be susceptible to a sudden
decline in one economic activity. Use options that avoid
reliance on one resource (in this case marine turtles)
and permit diverse sources of income are more likely to
generate long-term economic growth and social
development. With regards to risk of resource decline,
two thirds of consumptive use case studies showed
a decline (Table 3). Only two of thirteen non-
consumptive use sites had declining marine turtle
populations (Table 5). In both cases, declines were
caused by overexploitation of eggs and fisheries
by-catch rather than the established tourism
scheme (Table 5).
Eighth, non-consumptive use has the potential to break
the vicious circle of poverty and environmental
degradation (Dasgupta et al. 2000) by materializing a
value for conserving marine turtles. Local economic
incentives created by non-consumptive use can result
in increased protection of marine turtles, thus permitting
a recovery of populations that in turn contribute to local
ecological and economic well-being. The result is that
the positive feedback mechanism between poverty and
environmental degradation is reversed.
Finally, all economic, environmental and social impacts
should be considered when evaluating direct use
options for a particular site. Local circumstances may
result in certain types of consumptive and non-
consumptive use being unfeasible.
Direct use
from marine turtle tourism (Campbell 1999, Hope 2002).
Leakage of revenue from local and national levels is an
issue for both marine turtle tourism and fisheries (Table
7). It has been estimated that on average 55% of
tourism expenditure remain outside the destination
country (Cattarinich 2001). Potential tortoiseshell
exports from Cuba to Japan, where 70% of the revenue
would be aggregated in the importing country,
demonstrate the same problem for some marine turtle
fisheries (Table 7). Although the proportion of gross
revenue remaining locally may be higher for domestic
consumptive use, the absolute local economic income
is higher for turtle tourism in the Costa Rican case
studies (Table 7).
Fifth, marine turtle use has the potential to create
support for conservation and responsible management.
Tourism to observe marine turtles in the wild creates a
direct link between revenue and conservation of marine
turtle populations. Good examples of such linkage
include Turtle Islands Park, Sabah and Maputaland,
South Africa (Appendix 1). In both these places
conservation and tender fees are reinvested in marine
turtle protection and monitoring. There are ample
examples of tourism operators promoting conservation
of marine turtles. In Maldives, the tourism sector was
instrumental in achieving a ban on trade in marine
turtles and marine turtle products in 1995 (Hussein
2000). In Costa Rica, hotel owners formed part of the
coalition of groups and individuals behind the lawsuit
that resulted in green turtle fishing being outlawed in
1999 (pers. obs.). These in-situ examples of marine
turtle use are different from captive breeding operations
that generally results in few if any incentives for
conservation of wild populations (Hutton et al. 2001).
Proponents of Cuban tortoiseshell export suggest such
trade would increase funding for marine turtle
conservation activities in the country (ROC 2002).
Alternatively, a share of dive and turtle tourism revenue
could be invested in marine turtle conservation in Cuba
and elsewhere in the Caribbean.
Sixth, there is an issue of rivalry between uses.
Overexploitation has the potential to cause negative
economic impacts on local and distant, consumptive
and non-consumptive use projects. Consumptive use
on a nesting beach or of a mixed foraging stock may
have effects on the abundance of marine turtles in
waters of another country and vice versa (Appendix 1).
Marine turtle
use has the
potential to
create
support for
conservation
and
responsible
management.

Passive use

Money Ta lks : Economic Aspects o f Mar ine Tur t le Use and Conservat ion 26
Marine turtles have a wide range of passive use values.
These include option, intrinsic, ethical (Naess 1989,
Rolston 1994), existence and bequest values. Option
value represents the value of maintaining options for
direct and passive uses that may emerge in the future.
For biodiversity, a commonly mentioned option value is
the potential of harbouring chemical compounds that
could yield active ingredients for future pharmaceutical
products. Although it is very difficult to determine the
probability of marine turtles containing such
compounds, the importance of option values should
not be underestimated. An illustrative example is that
up until a few decades ago, marine turtle tourism
represented but an option value. If decision-makers
then had had the foresight and knowledge to recognize
the option value of marine turtle tourism, marine turtle
use may already have been transformed at that time
with the implementation of stronger conservation
measures. Although we are currently not able to
estimate the option value, it does not mean it is zero. It
is plausible that new direct and passive marine turtle
uses could emerge in the future.
Passive use values are difficult to measure in currency.
Many studies aimed at quantifying passive use values
utilize contingent valuation methods (CVM), which in
essence is how much respondents state that they are
willing to pay to maintain or avoid something. For
example; a study in North Carolina in 1991 suggested
that respondents would be willing to pay on average
US$33.2 per year to conserve loggerhead turtles
(Whitehead 1992). The stated willingness to pay
depends on many factors. Stated willingness to pay
has little practical relevance for local economic
incentives that drive marine turtle use and conservation
in developing countries for it does not typically translate
into actual payment of the quoted amounts. Therefore,
we chose to quantify the passive use value as the
expenditure of marine turtle conservation organizations
and conventions. Our estimate should be considered a
minimum given that "Free-rider" behaviour may be
common (Freeman 2003). Some people and
organizations may not contribute funds to conservation
in spite of valuing marine turtles because they figure
others will take on that cost.
Worldwide, 162 organizations and
conventions conducting marine turtle con-
servation activities were identified, divided
into groups by region and category and
contacted about their expenditure (Table 8).
A total of 55 organizations and conventions
provided information on expenditure and
number of employees dedicated to marine
turtle conservation. The information from
these 55 organizations and conventions is
assumed to be representative for others in
the same region and category. Total marine turtle
conservation expenditure was at least US$20 million in
2002 (Table 8). The estimate should be considered a
minimum value as other organizations and also govern-
ments invest considerable amounts in marine turtle
conservation. Also, many organizations engage volunteers
in their conservation activities. The value of the time
invested by volunteers is not included in our estimate.
Local and national level organizations in North America
and Europe to a large extent depend on volunteers that
are not included under the estimated employees.
Therefore salaries make up a smaller proportion of
overall expenditure and the amount of expenditure per
job is higher (Table 8).
Pass ive use
Up until a
few decades
ago, marine
turtle tourism
represented
but an option
value.

Money Ta lks : Economic Aspects o f Mar ine Tur t le Use and Conservat ion 27
Table 8 Annual expenditure for marine turtle conservation worldwide.
Region Category Total Org’s (#) Estimated Estimated US$ to generateorg’s providing expenditure employees one job
(#) data (US$)* (#)
Global Global 28 10 6,468,486 165.2 39,155
North America International 5 2 487,500 13.8 35,455National 2 1 98,145 2.0 49,073
Local 36 8 6,326,477 129.3 53,052
Europe & International 2 1 116,971 16.0 7,311Mediterranean National 4 1 1,784,298 98.0 18,207
Local 2 1 45,333 2.0 22,666
Latin America International 7 3 1,511,588 23.3 64,782& Caribbean National* 16 8 290,791 76.0 3,826
Local 17 3 197,088 181.3 1,087Projeto TAMAR** National 1 1 1,595,583 436.9 3,652
Africa International 1 1 818,795 16.0 51,175National 8 4 189,423 160.0 1,184
Local 3 2 59,623 25.5 2,338
Asia International 1 1 5,165 1.0 5,165National 12 1 234,000 168.0 1,393
Local 11 4 82,141 55.0 1,493
Oceania International 0 0 0 0.0 0National 5 2 74,420 2.8 27,062
Local 1 1 32,154 2.0 16,077
Total 162 55 20,417,981 1,564.0 13,055
* Estimated expenditure and employees are based on extrapolation of information provided by the
organizations listed in the previous column
** Projeto TAMAR, Brazil is not included with other national organizations in Latin America and the Caribbean,
as it is not considered representative of the size of other organizations in the category.
Pass ive use

Replacement cost
WW
F-C
AN
ON
/ R
OG
ER
LE
GU
EN

Money Ta lks : Economic Aspects o f Mar ine Tur t le Use and Conservat ion 29
Marine turtles are keystone species in coastal and
oceanic marine ecosystems. Green turtles digest sea
grass leaves and part of the sea grasses’ nutritional
content becomes available to other organisms much
more rapidly than through normal decomposition
(Thayer & Engel 1982, Thayer et al. 1984). The presence
of green turtles contributes to healthy seagrass beds
(Bjorndal & Jackson 2003). Seagrass bed ecosystems
are amongst the most valuable ecosystems on the
planet, with ecosystem services worth an estimated
US$19,004 ha-1yr -1 in 1994 or US$3.8 trillion yr -1
globally, mainly because of nutrient cycling services
(Costanza et al. 1997, Green & Short 2003). Hawksbill
turtles feed predominantly on sponges at coral reefs
and provide biological control of sponges that may
otherwise out-compete corals for space (Leon &
Bjorndal 2002, Bjorndal & Jackson 2003). The potential
net benefit from coral reefs worldwide was recently
estimated at US$30 billion (Cesar et al. 2003). Marine
turtles function as biological transporters of nutrients
from marine to terrestrial ecosystem with benefits to
numerous species of fauna and flora (Bouchard &
Bjorndal 2000). Loggerhead, leatherback, olive and
Kemp’s ridley turtles are important predators in coastal
and open ocean ecosystems. Decline of marine turtles
has adverse ecological impacts with subsequent
economic effects on human societies (Jackson 2001,
Jackson et al. 2001).
The complex ecological interactions between turtles
and the ecosystems they inhabit make it difficult to
quantify the value of the ecological services provided
by marine turtles. A minimum estimate can be
calculated by determining the cost of raising marine
turtles in captivity to replace them, should they become
extinct in the wild. This rearing service is normally
provided by nature but can also be provided by
aquarium or farm facilities. Three criteria should be
fulfilled to justify the use of the replacement cost
method (Freeman 2003). The replacement method
must be the least costly alternative for maintaining the
ecological service provided, the replacement must
provide a service of equivalent quality and magnitude,
Table 9 Replacement costs for nesting greenand leatherback turtles (for sources see text in Appendix 1).
Case Cost of Annual Replacementstudy producing global cost
one adult nesting US$US$ population
18 Greens: 1,672 147,056-157,424 245.9-263.3 millionFerme (Seminoff 2002)CORAIL,Reunión
9 Leatherbacks: 72,632 34,500 2.5billionTUMEC, (Spotila et al. 1996)Rantau Abang, Malaysia
Replacement cost
Nesting females represent but a tiny fraction
of marine turtle populations. Also, since the
current global populations are depleted,
larger population sizes will be needed to truly
restore their ecological role and environ-
mental services. The replacement cost
estimates above do not consider non-nesting
females, males and juveniles and should
therefore be considered very conservative.
It would be difficult to replace the turtles’
ecological functions by other means so the
first criterion for using the replacement cost
method is fulfilled. It is less clear that reared
turtles are equivalent to wild turtles or that
people would be prepared to incur the above
costs to replace marine turtle functions. Even
so, the estimates serve to demonstrate that
conservation of turtles in the wild is probably
less costly than captive breeding.
Marine turtles
function as
biological
transporters of
nutrients from
marine to
terrestrial
ecosystem
with benefits
to numerous
species of
fauna and
flora.
and individuals must be willing to incur the cost of the
replacement. We estimate the cost of replacing all
currently existing green and leatherback turtles nesting
in one year worldwide at least at US$246 million and
US$2.5 billion respectively, based on the cost of rearing
these species in captivity (Appendix 1).
Policy and management implications

Money Ta lks : Economic Aspects o f Mar ine Tur t le Use and Conservat ion 31
Direct use
Our analysis shows that from a macroeconomic point
of view, non-consumptive uses generate or have the
potential to generate greater gross revenue and sustain
greater economic growth than consumptive use.
Governments of countries like Costa Rica and
Seychelles have recognized this fact and consequently
banned the consumptive use of marine turtles to
stimulate tourism.
Still, legal and illegal consumptive use of marine turtles
continues in many countries. One explanation for this
apparent contradiction is that revenue from non-
consumptive use does not benefit those that use
marine turtles consumptively. From a microeconomic
perspective, consumptive use may still generate higher
income for fishermen and coastal dwellers than non-
consumptive use, at least over the short term. Future
analyses of net per capita income would shed light on
this issue. Each user evaluates personal costs and
benefits of use options before deciding which use to
pursue. Creation of local economic incentives is crucial
to convert consumptive users to non-consumptive
users. Those that traditionally have used marine turtles
in a consumptive manner need to see direct and
tangible economic benefits from non-consumptive use
to change their use patterns.
Non-consumptive use can be promoted by increasing
the cost of consumptive use through regulation,
enforcement, fines and other penalties or by increasing
the benefits that user groups receive from non-
consumptive use. Governments, international agencies
and conservation organizations can create economic
incentives by providing policies, subsidies, funding
and microcredits that facilitate the investment
necessary to initiate non-consumptive marine turtle use
and offset the cost of production for user groups.
The retraining and compensation of tortoiseshell
artisans in Seychelles demonstrates that the potential
economic benefits from marine turtle tourism can
convince governments to take difficult policy decisions
regarding marine turtle use. It also shows that the cost
of converting consumptive marine turtle users is
relatively low when compared to the potential economic
benefits from marine turtle tourism. In Seychelles, the
retraining and compensation program cost less than
the annual gross revenue from a large marine
turtle tourism project (Table 5, Appendix 1).
Maintenance of perverse government
subsidies is another reason for continued
ecosystem and species decline (Balmford et
al. 2002). For example; before green turtle
fishing was banned in Costa Rica, some of
the fishermen involved in illegal take of green
turtles received subsidized gasoline that
made it cheaper for them to travel to
Tortuguero National Park and pursue illegal
use (pers. obs.). Perverse subsidies that
stimulate continued overexploitation of
marine turtles must be eliminated.
In order to ensure that funds are available for
needed regulation and enforcement of marine turtle use
regimes, sustainable funding mechanisms have to be
established. Concessions and use fees are two
possible means to raise funds needed for management.
A novel approach to generate funds for marine turtle
conservation could be the sale of marine turtle credits
by local communities, government agencies or NGOs,
similar to credits for carbon sequestration or protection
of watersheds (Daily et al. 2000).
Fisheries by-catch represents a major threat to marine
turtle populations (Lewinson et al. 2004, Lutcavage et
al. 1997). It also represents a market failure (Perman et
al. 2003). Direct and passive marine turtle uses are
affected when marine turtles drown in shrimp trawls or
are caught on longlines or in gillnets but the market
does not currently recognize the economic impacts of
such activities. As a result, fisheries continue to cause
marine turtle mortality without assuming responsibility
for the economic repercussions on society, including
the negative economic consequences for countries and
communities investing in marine turtle use and
conservation. Marine turtle values can be included in
the market by incorporating them into fines for illegal
killing of turtles, incidental or not. For example; in Costa
Rica, an Ecuadorian pirate fisher was caught for illegally
catching sharks and turtles in a National Park. The fine
was set in excess of US$300,000 and was based on the
environmental damage caused, including direct and
passive use values of US$1,142 for each marine turtle
killed (C. Castro pers. comm.).
Pol icy and management impl icat ions
Creation
of local
economic
incentives
is crucial
to convert
consumptive
users to non-
consumptive
users.
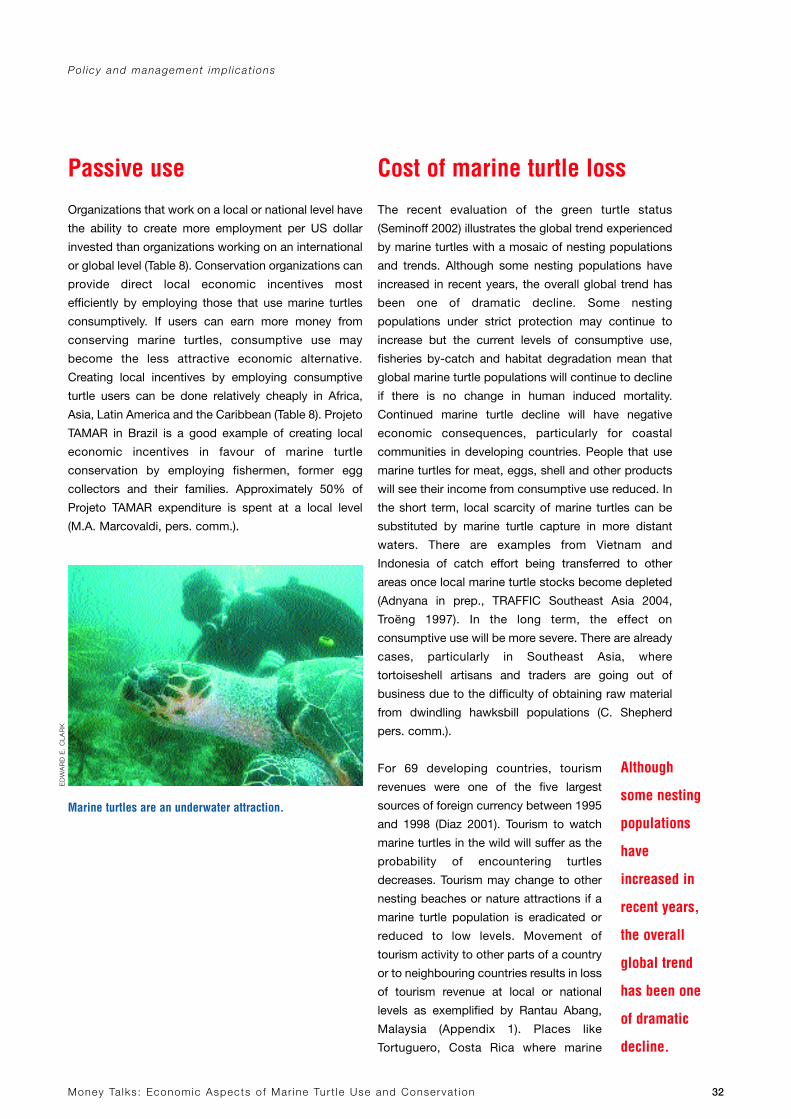
Money Ta lks : Economic Aspects o f Mar ine Tur t le Use and Conservat ion 32
Passive use
Organizations that work on a local or national level have
the ability to create more employment per US dollar
invested than organizations working on an international
or global level (Table 8). Conservation organizations can
provide direct local economic incentives most
efficiently by employing those that use marine turtles
consumptively. If users can earn more money from
conserving marine turtles, consumptive use may
become the less attractive economic alternative.
Creating local incentives by employing consumptive
turtle users can be done relatively cheaply in Africa,
Asia, Latin America and the Caribbean (Table 8). Projeto
TAMAR in Brazil is a good example of creating local
economic incentives in favour of marine turtle
conservation by employing fishermen, former egg
collectors and their families. Approximately 50% of
Projeto TAMAR expenditure is spent at a local level
(M.A. Marcovaldi, pers. comm.).
Cost of marine turtle loss
The recent evaluation of the green turtle status
(Seminoff 2002) illustrates the global trend experienced
by marine turtles with a mosaic of nesting populations
and trends. Although some nesting populations have
increased in recent years, the overall global trend has
been one of dramatic decline. Some nesting
populations under strict protection may continue to
increase but the current levels of consumptive use,
fisheries by-catch and habitat degradation mean that
global marine turtle populations will continue to decline
if there is no change in human induced mortality.
Continued marine turtle decline will have negative
economic consequences, particularly for coastal
communities in developing countries. People that use
marine turtles for meat, eggs, shell and other products
will see their income from consumptive use reduced. In
the short term, local scarcity of marine turtles can be
substituted by marine turtle capture in more distant
waters. There are examples from Vietnam and
Indonesia of catch effort being transferred to other
areas once local marine turtle stocks become depleted
(Adnyana in prep., TRAFFIC Southeast Asia 2004,
Troëng 1997). In the long term, the effect on
consumptive use will be more severe. There are already
cases, particularly in Southeast Asia, where
tortoiseshell artisans and traders are going out of
business due to the difficulty of obtaining raw material
from dwindling hawksbill populations (C. Shepherd
pers. comm.).
For 69 developing countries, tourism
revenues were one of the five largest
sources of foreign currency between 1995
and 1998 (Diaz 2001). Tourism to watch
marine turtles in the wild will suffer as the
probability of encountering turtles
decreases. Tourism may change to other
nesting beaches or nature attractions if a
marine turtle population is eradicated or
reduced to low levels. Movement of
tourism activity to other parts of a country
or to neighbouring countries results in loss
of tourism revenue at local or national
levels as exemplified by Rantau Abang,
Malaysia (Appendix 1). Places like
Tortuguero, Costa Rica where marine
Pol icy and management impl icat ions
Marine turtles are an underwater attraction.
Although
some nesting
populations
have
increased in
recent years,
the overall
global trend
has been one
of dramatic
decline.
ED
WA
RD
E.
CLA
RK
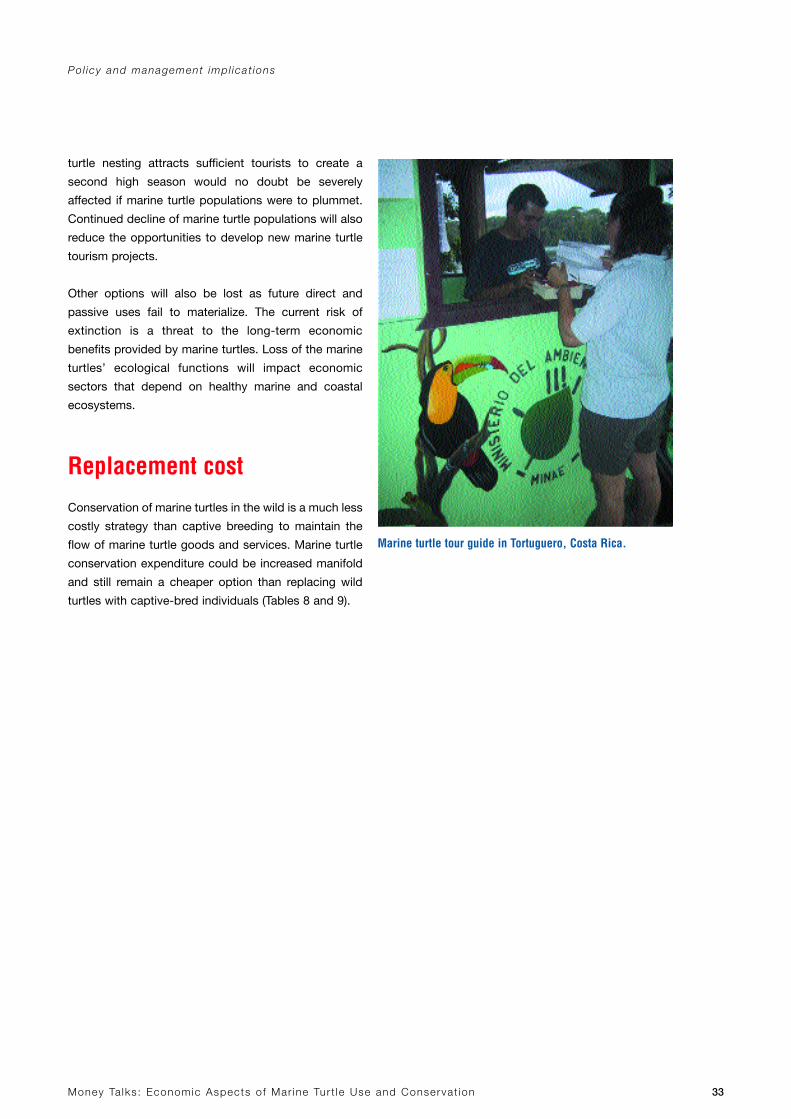
Money Ta lks : Economic Aspects o f Mar ine Tur t le Use and Conservat ion 33
turtle nesting attracts sufficient tourists to create a
second high season would no doubt be severely
affected if marine turtle populations were to plummet.
Continued decline of marine turtle populations will also
reduce the opportunities to develop new marine turtle
tourism projects.
Other options will also be lost as future direct and
passive uses fail to materialize. The current risk of
extinction is a threat to the long-term economic
benefits provided by marine turtles. Loss of the marine
turtles’ ecological functions will impact economic
sectors that depend on healthy marine and coastal
ecosystems.
Replacement cost
Conservation of marine turtles in the wild is a much less
costly strategy than captive breeding to maintain the
flow of marine turtle goods and services. Marine turtle
conservation expenditure could be increased manifold
and still remain a cheaper option than replacing wild
turtles with captive-bred individuals (Tables 8 and 9).
Pol icy and management impl icat ions
Marine turtle tour guide in Tortuguero, Costa Rica.

Conclusions
WW
F-C
AN
ON
/ M
AR
TIN
HA
RV
EY

Money Ta lks : Economic Aspects o f Mar ine Tur t le Use and Conservat ion 35
It is clear that marine turtle use and conservation
generate revenue and create jobs in developing
countries throughout the world. Historically,
consumptive use of marine turtles for meat, eggs and
shell generated most revenue but such use also
contributed to marine turtle declines. In recent
decades, non-consumptive use in the form of tourism
to observe marine turtles in-water and on nesting
beaches has gained popularity throughout the world.
The case studies we have compiled suggest that non-
consumptive use can generate much greater gross
revenue and at the same time have less impact on
marine turtle populations than consumptive use. We
acknowledge that economic development and
conservation issues are complex and advise that
careful evaluation of economic, environmental and
socio-cultural consequences are necessary when
considering use options at a particular site.
Evidently, threats to marine turtle survival must be
reduced to avoid the negative economic consequences
of marine turtle declines. Our estimate of global
conservation expenditure confirms that human
societies are concerned and willing to invest to recover
marine turtle populations. Also, most marine turtle
values can be maintained concurrently. However,
consumptive use has often resulted in overexploitation
of marine turtle populations with negative effects
on marine turtle values at other sites. Replacing
such consumptive uses of marine turtles with
non-consumptive uses where feasible, will ensure
continued economic benefits and simultaneous marine
turtle recovery.
Governments, international agencies and non-
governmental organizations can reduce over-
exploitation of marine turtles by creating local
economic incentives in favour of effective conservation.
Such economic incentives, once in place, will add value
to the marine turtles and thereby encourage measures
to mitigate additional threats, such as habitat
destruction and fisheries by-catch. Actions should be
aimed at conserving marine turtles in the wild as it is a
less costly strategy than captive breeding. Financial
support conservation action should come, at least
partly, from the economic benefits derived from marine
turtle use. Revenue from non-consumptive use is
already being reinvested into marine turtle conservation
at some sites, thus pointing at a promising avenue to
consolidate such funding.
Economic considerations are likely to persist as the
driving force behind local decisions concerning marine
turtle use in coastal communities of developing
countries. Therefore, conservation strategies
to recover marine turtles must envision and
include tangible, local economic benefits.
The economics of marine turtle use and
conservation illustrate one approach to
reverse the positive feedback mechanism
between poverty and environmental
degradation.
Conc lus ions
Conservation
strategies to
recover
marine turtles
must envision
and include
tangible, local
economic
benefits.

Recommendations

Money Ta lks : Economic Aspects o f Mar ine Tur t le Use and Conservat ion 37
Decision-makers and government officials• Promote policies to regulate marine turtle use.
• Promote policies that address the economic impacts
of fisheries by-catch and directed take of turtles e.g.
fines for impacting turtles or tax breaks for using
“turtle-friendly” technologies.
• Establish sustainable funding mechanisms, including
partial allocation of revenue generated by use, to
cover continuous marine turtle management costs.
• Eliminate perverse subsidies and tax breaks that make
it profitable to continue overexploiting marine turtles.
• Offer subsidies, funding and microcredits to
encourage those that overexploit marine turtles to
instead develop marine turtle tourism or other non-
consumptive uses, where feasible.
• Generate local economic incentives in favour of
marine turtle conservation.
• For cost-efficiency, promote conservation of marine
turtles in the wild rather than through captive breeding.
• Incorporate potential economic returns as an
additional argument for governments to invest in
marine turtle conservation.
Development assistance agencies• Provide training, funding and microcredits to create
alternative livelihoods that encourage those
overexploiting marine turtles to instead develop
marine turtle tourism or other non-consumptive
uses, where economically, ecologically and culturally
feasible.
• Provide funding and technical support to projects
that create local economic incentives in favour of
marine turtle conservation, and contribute to
community development.
• Consider and mitigate the negative impacts that
development assistance projects may have on
marine turtle use options and populations.
• Support the establishment of sustainable funding
mechanisms to cover continuous marine turtle
conservation and management costs.
Tourism developers and operators• Employ and train people involved in marine turtle
overexploitation to create alternative livelihoods
through tourism, where feasible.
• Mitigate negative cultural, economic and ecological
consequences of tourism at marine turtle nesting
and feeding sites.
• Carry out an informed and participative consultation
process, as well as a comprehensive feasibility analysis,
before promoting community based ecotourism.
• Minimize leakage of profit in favour of maximizing
both, community benefits and economic incentives
in favour of conservation.
Fisheries industry• Recognize the economic impacts of fisheries by-catch
on marine turtle uses in-water and on nesting beaches.
• Adopt turtle-friendly gear and fishing practices.
• Consider compensating affected sectors of society,
including coastal communities that use marine turtles,
for the economic impacts of marine turtle by-catch.
Conservation practitioners• Involve stakeholder groups and employ local
community members, in particular marine turtle
users, in conservation projects.
• Promote best practices among marine turtle users
through technical advice and training.
• Monitor the economic impacts of their marine turtle
conservation projects.
• Explore the economic potential and social feasibility
for marine turtle tourism initiatives in coastal
communities of developing countries.
• Carry out an informed and participative consultation
process, as well as a comprehensive feasibility analysis,
before promoting community based ecotourism.
Tourists• Participate in responsible marine turtle tours led by
local guides and support tourism businesses that
benefit local people (including hotels, restaurants,
handicrafts and curios, etc.).
• Do not buy any marine turtle products as this is an
economic incentive for illegal use and may lead to
overexploitation.
Researchers• Conduct research aimed at quantifying cost of
production and consumer surplus, as well as per
capita net income for direct use of marine turtles.
• Conduct research aimed at quantifying the distribu-
tion of costs and revenue from marine turtle uses.
• Conduct research aimed at quantifying the causal
linkage between marine turtle uses and population
trends.
• Conduct research aimed at quantifying the supply and
demand function for marine turtle goods and services.
Recommendat ions
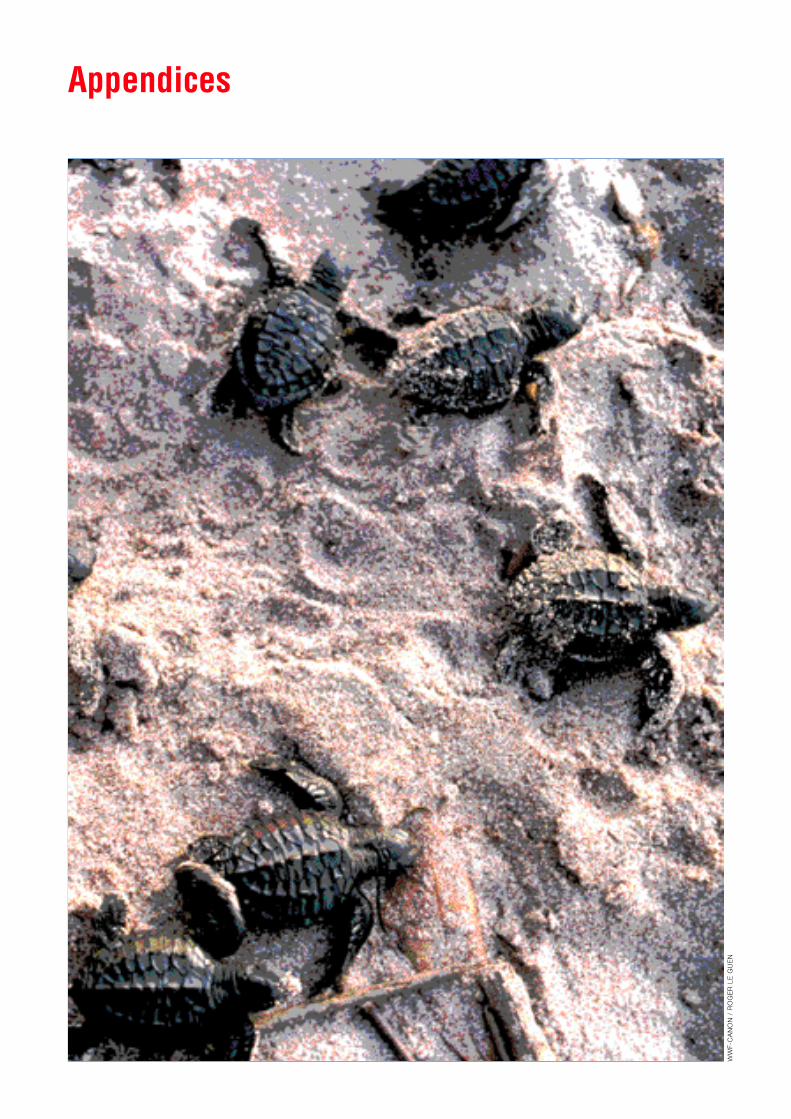
Appendices
WW
F-C
AN
ON
/ R
OG
ER
LE
GU
EN
Money Ta lks : Economic Aspects o f Mar ine Tur t le Use and Conservat ion 39
Case study 1: green turtle consumption inBali, Indonesia
Bali, Indonesia is one of the world’s largest markets
for marine turtles. Many Moslems in Southeast Asia do
not consume the meat from marine turtles. However,
green turtle meat and products are often used in Hindu
rituals and for communal meals in Bali. Green turtles
are caught elsewhere in Indonesia and brought to Bali
for sale.
As a result of fishery and egg collection, Indonesian
green turtle populations have declined severely over the
past decades (Troëng 1997). Fishermen now have to
travel further in pursuit of large turtles that bring in the
highest price (Troëng 1997). Green turtle consumption
in Bali peaked in the late 1970’s when more than 30,000
green turtles were landed each year (Adnyana in prep.).
Between 56 and 101 boats are engaged in the Bali
green turtle trade (Adnyana in prep.). On Bali, green
turtles are sold whole or as meat packages known as
karang (Adnyana in prep.). In 1994, the retail price for
one green turtle varied with turtle size and sales format
(whole or package) with an average price of US$146.2-
US$268.4 in Balinese markets (Adnyana in prep.). In
2002, landings are estimated at 684 green turtles per
month (Adnyana in prep.). Gross revenue from the
green turtle fishery to fishermen, traders and their
employees is estimated at US$1,199,629-
US$2,203,027.
Case study 2: industrialized processing ofolive ridleys in Mexico
In Pacific Mexico, olive ridleys were exploited for meat,
leather and bone meal (Woody 1986). The take of olive
ridley turtles on a large scale began in the 1960’s
(Trinidad & Wilson 2000). The fisheries take peaked in
1968 when at least 218,000 turtles were caught (Mack
et al. 1995). Probably as a result of the fishery, arribazón
events disappeared from Playa Mismaloya in Jalisco,
Playa El Tlalcoyunque in Guerrero and Chacahua in
Oaxaca (Trinidad & Wilson 2000). Pesquerías
Industriales de Oaxaca, S.A. (PIOSA), a private
company, continued exploiting olive ridleys at the
remaining arribazón site at Playa Escobilla. In Mexico, a
total ban on the taking of marine turtles, eggs and also
on trade in marine turtle products was proclaimed in
1990 (Aridjis 1990). Olive ridley nesting at Escobilla has
since increased (Marquez et al. 1996).
It is estimated that 28,000 olive ridleys were caught
in 1985 (Woody 1986). Fishermen landing olive ridley
turtles at Puerto Angel could sell them for US$8.42
per turtle (Woody 1986). The same year, meat, leather
and bone meal from one processed olive ridley turtle
would bring in US$25.26 to the wholesaler (Woody
1986). Gross revenue from the fishery to fishermen,
the wholesaler and his employees is estimated
at US$707,280.
Case study 3: fishery of hawksbill turtles inCuba for international tortoiseshell trade
Hawksbill turtles have been fished in Cuba for food and
tortoiseshell at least since the 1500s (Carrillo et al.
1999). Now, tortoiseshell stocks have been
accumulated by the government, and Cuba has
repeatedly presented proposals to the Convention on
International Trade in Endangered Species of Wild Flora
and Fauna (CITES) to export the tortoiseshell stock to
Japan (e.g. ROC 2002). Those proposals have not
been adopted.
An estimated 168,781 hawksbill turtles were taken
between 1935 and 1994 (Carrillo et al. 1999). The
hawksbill population was significantly reduced over this
period (Carrillo et al. 1999). The fishery was reduced
from an annual take of approximately 5,000 hawksbill
turtles in 1990 to 500 hawksbill turtles per year after
1994 (Carrillo et al. 1999). Fishing is now only allowed
in two traditional fishing areas by fishermen from five
communities (Carrillo et al. 1999). It has been argued
that hawksbill abundance has increased after the
Appendices
Appendix 1
Case studies: marine turtle use and conservation
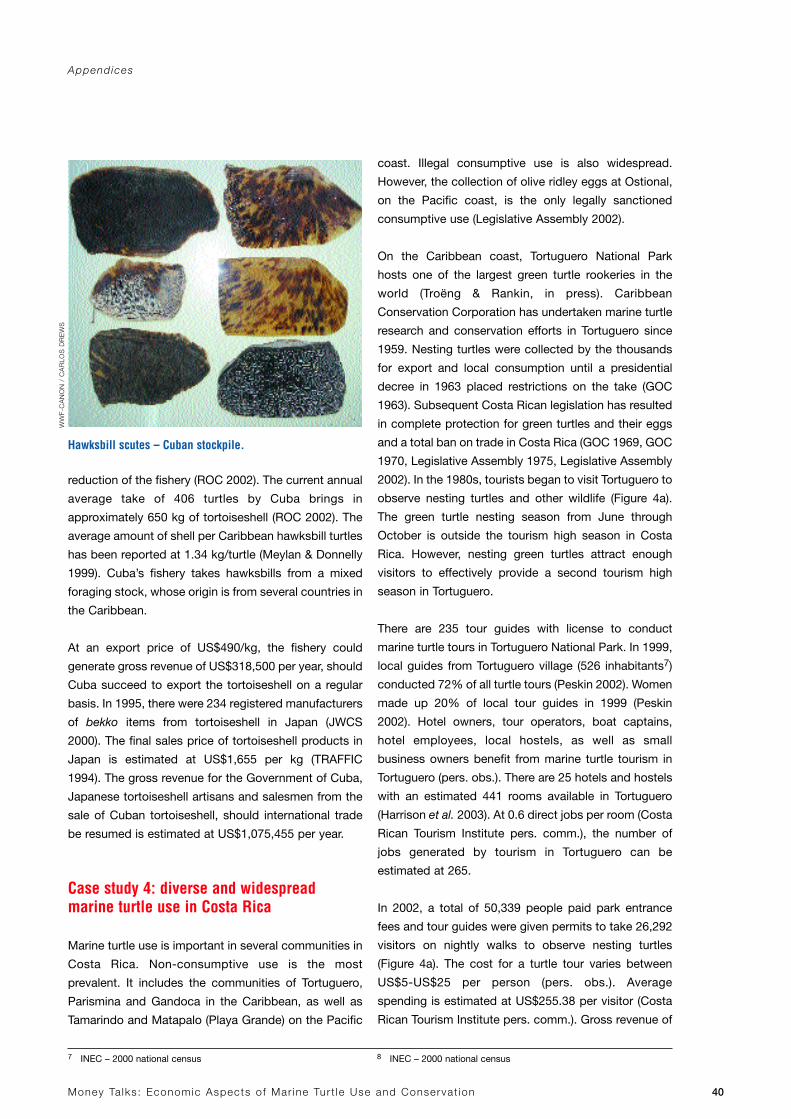
Money Ta lks : Economic Aspects o f Mar ine Tur t le Use and Conservat ion 40
reduction of the fishery (ROC 2002). The current annual
average take of 406 turtles by Cuba brings in
approximately 650 kg of tortoiseshell (ROC 2002). The
average amount of shell per Caribbean hawksbill turtles
has been reported at 1.34 kg/turtle (Meylan & Donnelly
1999). Cuba’s fishery takes hawksbills from a mixed
foraging stock, whose origin is from several countries in
the Caribbean.
At an export price of US$490/kg, the fishery could
generate gross revenue of US$318,500 per year, should
Cuba succeed to export the tortoiseshell on a regular
basis. In 1995, there were 234 registered manufacturers
of bekko items from tortoiseshell in Japan (JWCS
2000). The final sales price of tortoiseshell products in
Japan is estimated at US$1,655 per kg (TRAFFIC
1994). The gross revenue for the Government of Cuba,
Japanese tortoiseshell artisans and salesmen from the
sale of Cuban tortoiseshell, should international trade
be resumed is estimated at US$1,075,455 per year.
Case study 4: diverse and widespreadmarine turtle use in Costa Rica
Marine turtle use is important in several communities in
Costa Rica. Non-consumptive use is the most
prevalent. It includes the communities of Tortuguero,
Parismina and Gandoca in the Caribbean, as well as
Tamarindo and Matapalo (Playa Grande) on the Pacific
coast. Illegal consumptive use is also widespread.
However, the collection of olive ridley eggs at Ostional,
on the Pacific coast, is the only legally sanctioned
consumptive use (Legislative Assembly 2002).
On the Caribbean coast, Tortuguero National Park
hosts one of the largest green turtle rookeries in the
world (Troëng & Rankin, in press). Caribbean
Conservation Corporation has undertaken marine turtle
research and conservation efforts in Tortuguero since
1959. Nesting turtles were collected by the thousands
for export and local consumption until a presidential
decree in 1963 placed restrictions on the take (GOC
1963). Subsequent Costa Rican legislation has resulted
in complete protection for green turtles and their eggs
and a total ban on trade in Costa Rica (GOC 1969, GOC
1970, Legislative Assembly 1975, Legislative Assembly
2002). In the 1980s, tourists began to visit Tortuguero to
observe nesting turtles and other wildlife (Figure 4a).
The green turtle nesting season from June through
October is outside the tourism high season in Costa
Rica. However, nesting green turtles attract enough
visitors to effectively provide a second tourism high
season in Tortuguero.
There are 235 tour guides with license to conduct
marine turtle tours in Tortuguero National Park. In 1999,
local guides from Tortuguero village (526 inhabitants7)
conducted 72% of all turtle tours (Peskin 2002). Women
made up 20% of local tour guides in 1999 (Peskin
2002). Hotel owners, tour operators, boat captains,
hotel employees, local hostels, as well as small
business owners benefit from marine turtle tourism in
Tortuguero (pers. obs.). There are 25 hotels and hostels
with an estimated 441 rooms available in Tortuguero
(Harrison et al. 2003). At 0.6 direct jobs per room (Costa
Rican Tourism Institute pers. comm.), the number of
jobs generated by tourism in Tortuguero can be
estimated at 265.
In 2002, a total of 50,339 people paid park entrance
fees and tour guides were given permits to take 26,292
visitors on nightly walks to observe nesting turtles
(Figure 4a). The cost for a turtle tour varies between
US$5-US$25 per person (pers. obs.). Average
spending is estimated at US$255.38 per visitor (Costa
Rican Tourism Institute pers. comm.). Gross revenue of
Appendices
7 INEC – 2000 national census 8 INEC – 2000 national census
Hawksbill scutes – Cuban stockpile.
WW
F-C
AN
ON
/ C
AR
LOS
DR
EW
S
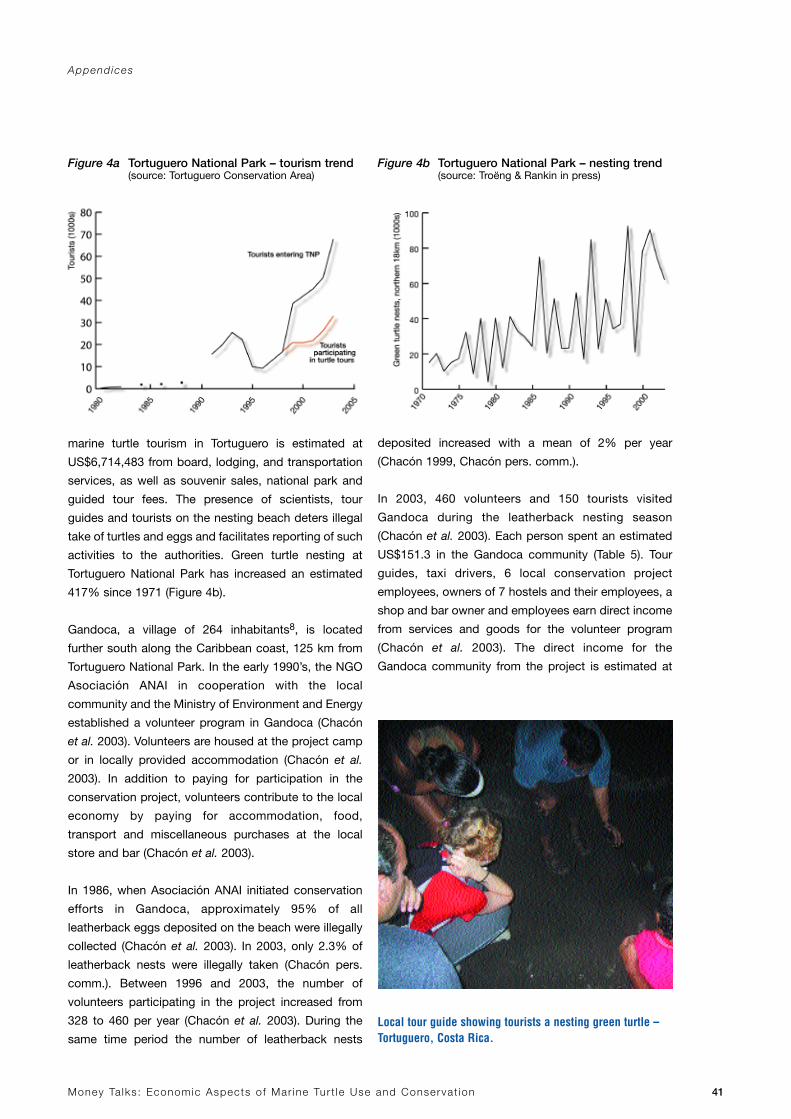
Money Ta lks : Economic Aspects o f Mar ine Tur t le Use and Conservat ion 41
marine turtle tourism in Tortuguero is estimated at
US$6,714,483 from board, lodging, and transportation
services, as well as souvenir sales, national park and
guided tour fees. The presence of scientists, tour
guides and tourists on the nesting beach deters illegal
take of turtles and eggs and facilitates reporting of such
activities to the authorities. Green turtle nesting at
Tortuguero National Park has increased an estimated
417% since 1971 (Figure 4b).
Gandoca, a village of 264 inhabitants8, is located
further south along the Caribbean coast, 125 km from
Tortuguero National Park. In the early 1990’s, the NGO
Asociación ANAI in cooperation with the local
community and the Ministry of Environment and Energy
established a volunteer program in Gandoca (Chacón
et al. 2003). Volunteers are housed at the project camp
or in locally provided accommodation (Chacón et al.
2003). In addition to paying for participation in the
conservation project, volunteers contribute to the local
economy by paying for accommodation, food,
transport and miscellaneous purchases at the local
store and bar (Chacón et al. 2003).
In 1986, when Asociación ANAI initiated conservation
efforts in Gandoca, approximately 95% of all
leatherback eggs deposited on the beach were illegally
collected (Chacón et al. 2003). In 2003, only 2.3% of
leatherback nests were illegally taken (Chacón pers.
comm.). Between 1996 and 2003, the number of
volunteers participating in the project increased from
328 to 460 per year (Chacón et al. 2003). During the
same time period the number of leatherback nests
deposited increased with a mean of 2% per year
(Chacón 1999, Chacón pers. comm.).
In 2003, 460 volunteers and 150 tourists visited
Gandoca during the leatherback nesting season
(Chacón et al. 2003). Each person spent an estimated
US$151.3 in the Gandoca community (Table 5). Tour
guides, taxi drivers, 6 local conservation project
employees, owners of 7 hostels and their employees, a
shop and bar owner and employees earn direct income
from services and goods for the volunteer program
(Chacón et al. 2003). The direct income for the
Gandoca community from the project is estimated at
Appendices
Local tour guide showing tourists a nesting green turtle – Tortuguero, Costa Rica.
Figure 4a Tortuguero National Park – tourism trend(source: Tortuguero Conservation Area)
Figure 4b Tortuguero National Park – nesting trend(source: Troëng & Rankin in press)
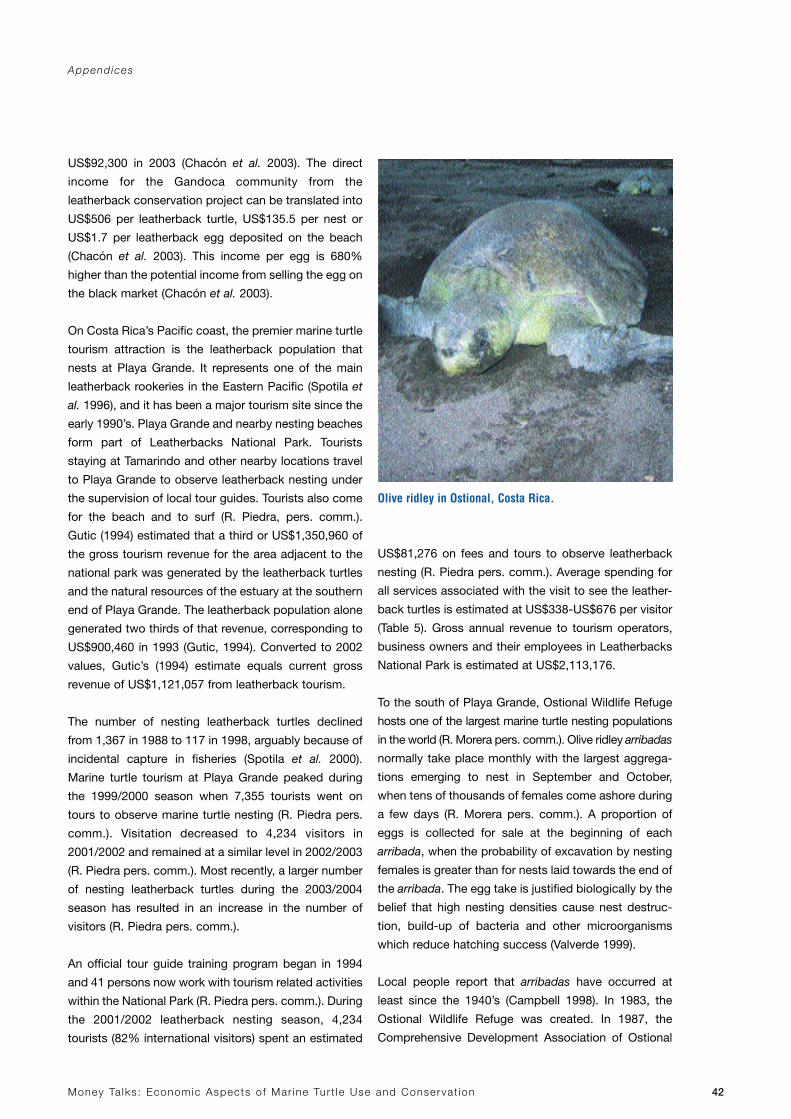
Money Ta lks : Economic Aspects o f Mar ine Tur t le Use and Conservat ion 42
US$92,300 in 2003 (Chacón et al. 2003). The direct
income for the Gandoca community from the
leatherback conservation project can be translated into
US$506 per leatherback turtle, US$135.5 per nest or
US$1.7 per leatherback egg deposited on the beach
(Chacón et al. 2003). This income per egg is 680%
higher than the potential income from selling the egg on
the black market (Chacón et al. 2003).
On Costa Rica’s Pacific coast, the premier marine turtle
tourism attraction is the leatherback population that
nests at Playa Grande. It represents one of the main
leatherback rookeries in the Eastern Pacific (Spotila et
al. 1996), and it has been a major tourism site since the
early 1990’s. Playa Grande and nearby nesting beaches
form part of Leatherbacks National Park. Tourists
staying at Tamarindo and other nearby locations travel
to Playa Grande to observe leatherback nesting under
the supervision of local tour guides. Tourists also come
for the beach and to surf (R. Piedra, pers. comm.).
Gutic (1994) estimated that a third or US$1,350,960 of
the gross tourism revenue for the area adjacent to the
national park was generated by the leatherback turtles
and the natural resources of the estuary at the southern
end of Playa Grande. The leatherback population alone
generated two thirds of that revenue, corresponding to
US$900,460 in 1993 (Gutic, 1994). Converted to 2002
values, Gutic’s (1994) estimate equals current gross
revenue of US$1,121,057 from leatherback tourism.
The number of nesting leatherback turtles declined
from 1,367 in 1988 to 117 in 1998, arguably because of
incidental capture in fisheries (Spotila et al. 2000).
Marine turtle tourism at Playa Grande peaked during
the 1999/2000 season when 7,355 tourists went on
tours to observe marine turtle nesting (R. Piedra pers.
comm.). Visitation decreased to 4,234 visitors in
2001/2002 and remained at a similar level in 2002/2003
(R. Piedra pers. comm.). Most recently, a larger number
of nesting leatherback turtles during the 2003/2004
season has resulted in an increase in the number of
visitors (R. Piedra pers. comm.).
An official tour guide training program began in 1994
and 41 persons now work with tourism related activities
within the National Park (R. Piedra pers. comm.). During
the 2001/2002 leatherback nesting season, 4,234
tourists (82% international visitors) spent an estimated
US$81,276 on fees and tours to observe leatherback
nesting (R. Piedra pers. comm.). Average spending for
all services associated with the visit to see the leather-
back turtles is estimated at US$338-US$676 per visitor
(Table 5). Gross annual revenue to tourism operators,
business owners and their employees in Leatherbacks
National Park is estimated at US$2,113,176.
To the south of Playa Grande, Ostional Wildlife Refuge
hosts one of the largest marine turtle nesting populations
in the world (R. Morera pers. comm.). Olive ridley arribadas
normally take place monthly with the largest aggrega-
tions emerging to nest in September and October,
when tens of thousands of females come ashore during
a few days (R. Morera pers. comm.). A proportion of
eggs is collected for sale at the beginning of each
arribada, when the probability of excavation by nesting
females is greater than for nests laid towards the end of
the arribada. The egg take is justified biologically by the
belief that high nesting densities cause nest destruc-
tion, build-up of bacteria and other microorganisms
which reduce hatching success (Valverde 1999).
Local people report that arribadas have occurred at
least since the 1940’s (Campbell 1998). In 1983, the
Ostional Wildlife Refuge was created. In 1987, the
Comprehensive Development Association of Ostional
Appendices
Olive ridley in Ostional, Costa Rica.

Money Ta lks : Economic Aspects o f Mar ine Tur t le Use and Conservat ion 43
(ADIO) was formalized (R. Morera pers. comm.).
Members of ADIO have since collected and sold olive
ridley eggs. Campbell (1998) reviewed the egg
collection and commercialization process in detail.
Hope (2002) suggested that more flexible seasonal and
regional pricing policies might increase profits from egg
sales and also recommended community egg
marketing cartels with urban selling points. It is
believed that olive ridley nesting at Ostional is
increasing (R. Morera pers. comm.). Sale of an
unquantified volume of illegally collected eggs from
beaches other than Ostional takes place in Costa Rican
markets behind the cover of the legal egg sale system.
ADIO currently has 235 members (R. Morera pers.
comm.). The project should be commended for
achieving an impressive level of local participation and
equitable distribution of profits between ADIO
members including men and women (pers. obs.). In
2003, ADIO sold eggs to intermediaries for US$0.05 per
egg (R. Morera pers. comm.). The eggs are later sold to
the consumers at markets and by seafood merchants
for US$0.12-US$0.37 per egg (pers. obs.). There are
approximately 66 intermediaries selling eggs from
Ostional throughout Costa Rica (R. Morera pers.
comm.). In 2001, 4,137,000 olive ridley eggs were
collected for sale at Ostional (Chacón 2002), a village
with 208 inhabitants9. Gross revenue from the con-
sumptive use of olive ridley eggs benefiting villagers,
inter-mediaries and market salesmen is estimated at
US$1,011,615 per year.
By looking at rural, coastal communities in the same
country we can reduce the number of confounding factors
to explain differences. We chose to compare the two
marine turtle use sites with the greatest gross revenue,
Tortuguero and Ostional. The comparison suggests that
non-consumptive use generates much greater revenue
than consumptive use (Tables 3 and 5). But does non-
consumptive use generate more revenue and social
development locally? Hope (2002) estimated that the
members of ADIO earned on average US$70-US$100
per month in 2000 (39-56% of the minimum wage in
Costa Rica10) from egg collection. A tour guide in Tortu-
guero can make as much as US$100 per tour. In 1999,
Appendices
9 INEC – 2000 national census 10 http://www.mideplan.go.cr/sides/economico/03-11.htm
Peskin (2002) estimated that each local tour guide in
Tortuguero took 351 tourists on turtle tours. At a tour fee
of US$5-US$10 per person, each guide earned on average
US$1,755-US$3,510 during a five month period,
corresponding to 2.1-4.1 times10 the minimum wage.
Guides also undertake other activities such as canal tours
and hence the mentioned sum only represents part of
their income. Since 1999, the number of tourists joining
turtle tours has increased and guides now earn more.
We also compared indicators of social development for
Ostional, Tortuguero and Barra del Colorado, a coastal
community without marine turtles but with similar
characteristics to Tortuguero in terms of location (rural,
isolated, Caribbean coast) and infrastructure (no direct
road access). Data on Basic Needs Not Satisfied were
provided by the National Institute for Statistics and
Census (INEC) and were collected as part of the Costa
Rican National Census in 2000. INEC’s data show that
people in Tortuguero had lower values for Basic Needs
Not Satisfied and hence a higher index of social and
economic development than both, Ostional and Barra
del Colorado (Table 10).
Table 10 Basic needs not satisfied for coastalpopulations in Costa Rica in 2000 (Source: INEC).
Location Marine turtle Proportion of use (in 2000) population with
basic needs not satisfied*
Barra del Colorado None 41%
Ostional Egg sales 39%
Tortuguero Tourism 28%
*Higher value indicates less social and economicdevelopment
In addition to generating more revenue and social
development at a local level, non-consumptive use also
appears to have a higher potential for economic
growth. On average, recorded visitors to Tortuguero
National Park increased at a rate of 16% per year
between 1988 and 2002 (Figure 4a). The number of
eggs collected at Ostional has remained fairly constant
in recent years (R. Morera pers. comm.).

Money Ta lks : Economic Aspects o f Mar ine Tur t le Use and Conservat ion 44
Case Study 5: fishing green turtles for thedomestic market along the NicaraguanCaribbean coast
The continental shelf of the Caribbean coast of
Nicaragua hosts the most extensive seagrass beds in
the Caribbean. In Nicaragua, turtle grass (Thalassia
testudinum) is the main staple for juvenile and adult
green turtles from the Tortuguero green turtle rookery in
neighbouring Costa Rica (Mortimer 1981). Tag returns
(Carr et al. 1978), genetic analysis (Bass et al. 1998) and
satellite telemetry (Troëng & Evans in review) show that
the majority of green turtles nesting at Tortuguero
migrate to feeding grounds in Nicaragua. Green turtles
are fished primarily with nets but a few fishers still use
harpoons (Lagueux 1998). Although some are sold in
neighbouring countries, green turtles are mainly caught
for consumption within Nicaragua (Nietschmann 1976).
Miskitu Indians have probably caught marine turtles
in the waters off Caribbean Nicaragua for at least
400 years (Parsons 1962). Cayman Island fishermen
caught turtles in Nicaragua until the mid-1960s
(Nietschmann 1973). Green turtle processing plants for
the export market operated between 1968 and 1977
(Lagueux 1998).
Green turtle take probably decreased during the civil
war 1980-1988 but has since increased (Lagueux
1998). Green turtle nesting at Tortuguero increased
during the 1971-2002 period (Troëng & Rankin in press).
Lagueux (1998) estimated the annual take to at least
10,166 green turtles. Fishers from at least 12
communities participate in the green turtle fishery
(Lagueux 1998). Turtles are consumed or sold in local
communities or sold to butcheries in coastal towns for
final sale (Lagueux 1998). Approximately 50% of
captured turtles are sold outside the turtler’s
community (Lagueux 1998). Most green turtles caught
are in size classes corresponding to large juveniles, and
the average weight is 80.6 kg (=178 lb) (Lagueux 1998).
A time delay in the impact of the Nicaragua green turtle
fishery on the number of adult females nesting at
Tortuguero can be expected (Campbell 2003). Lagueux
(1998) suggested there were indications of
overexploitation of green turtles in Nicaragua but that
overharvest could not be conclusively proven.
In 2003, prices for an approx. 175 lb green turtle at the
Bilwi (Puerto Cabezas) dock varied between US$9.8
and US$26.0 and an approx. 300 lb green turtle sells for
US$19.5-US$52.1 (C. Lagueux pers. comm.). Prices for
a live turtle vary throughout the year depending on the
number of turtles available for sale. In Awastara, one of
the Miskitu turtle fishing communities, a 50 lb live green
turtle sells for approx. US$16.3 and a 150 lb green turtle
for approx. US$32.6 (C. Lagueux pers. comm.). If 50%
of turtles are sold in towns and 50% are sold in the
turtler communities, gross revenue to the turtle fishers
in 2003 can be estimated at US$215,101-US$297,832.
Appendices
Case Study 6: from tortoiseshell to tourism attraction: hawksbill turtles in the Seychelles
Hawksbill fishing to export shell has a long history in
the Seychelles. At least 83,221 kg of raw shell were
exported between 1894 and 1982 (Mortimer 1984).
Export of shell declined between 1925 and 1940, partly
as a result of decline in the price of shell (Figure 5,
Mortimer 1984). Increasing international prices caused
an increase in exports from the 1960s onwards
(Figure 5, Mortimer 1984).
In 1982, 591 kg of raw shell corresponding to 1,182
hawksbill turtles was exported at a price of
~US$148.7/kg for a gross revenue of US$87,878
Green turtles tied-up for the meat sale at the market n Bluefields, Nicaragua.
ALE
JAN
DR
O A
LVA
RE
Z /
CO
NS
ER
VAT
ION
IN
TE
RN
AT
ION
AL

Money Ta lks : Economic Aspects o f Mar ine Tur t le Use and Conservat ion 45
(Mortimer 1984). The major hawksbill shell importer,
Japan, banned imports of tortoiseshell in December
199211 (Meylan & Donnelly 1999) but sale of
tortoiseshell items continued domestically in
Seychelles. After 1992, gross revenue from domestic
sale by tortoiseshell artisans is estimated at
US$264,091 (Seychelles Ministry of Industry Statistics
as reported to the author by J.A. Mortimer).
Approximately 40 tortoiseshell artisans (representing
0.15% of the Seychelles workforce at the time) were
active in 1993 (Seychelles Ministry of Industry Statistics
as reported to the author by J.A. Mortimer).
The overexploitation of nesting turtles for shell resulted
in negligible hawksbill reproduction outside of
effectively protected areas until the early 1990s
(Mortimer 2001). In 1993-1994, the Government of
Seychelles took the decision to reverse the decline of
marine turtle populations (Mortimer 2001). Through a
Global Environment Facility (GEF)-Seychelles
Government funded program, 37 hawksbill shell
artisans were compensated (at an average of
US$15,000 per artisan), trained in other trades and
subsequently agreed to sell all their tortoiseshell stocks
to the Government (Mortimer 2001). The 2.5 tons of
tortoiseshell was ceremoniously destroyed and a ban
on all consumptive use and harassment of marine
turtles was declared in 1994 (Mortimer 2001). The total
cost of the program, approx. US$805,000, was split
between the Seychelles Government and the GEF
(Mortimer 2001).
Now, tourism is the major economic sector of
Seychelles, with gross revenues totalling US$750
million per year. The spectacular natural scenery, clean
beaches and ample marine life are used to attract
tourists to Seychelles. Marine turtles are mentioned
repeatedly in the in-flight magazine of the flag carrier Air
Seychelles. Hotels and tour operators use marine
turtles in their advertising and logos. The ten rupees bill
features a marine turtle and all Seychelles bills carry a
marine turtle emblem. Although marine turtles are not
marketed as a specific attraction, they are mentioned
as one important component enhancing Seychelles’
natural charm. Tourists can see marine turtles on
glassbottom boat tours, during dives and whilst the
turtles nest on some of the resort islands.
Appendices
Day-time emergence of hawksbills, Bird Island, Seychelles.
Today, efforts are underway to quantify the economic
value of Seychelles marine turtles (H. Cesar pers.
comm., J. Mortimer pers. comm.). There are also
endeavours to place a market value on marine turtles in
order to create local incentives for conservation (J.
Nevill pers. comm.). Nesting beach protection has
resulted in increased nesting within some Seychelles
protected areas (Mortimer & Bresson 1999). It is hoped
that as marine turtle populations recover, increased
abundance will result in greater sighting probabilities
that will facilitate the marketing of specific marine turtle
tours in-water and on nesting beaches (J. Neville pers.
comm., N. Shah pers. comm.).
Figure 5 Tortoiseshell exports from Seychelles and price/kg(source: Mortimer 1984)
11 Although the hawksbill turtle was included in Appendix I of CITES in 1975 (Atlantic population) and 1977 (Pacific population), Japan did notadopt a zero quota on its reservation until December 1992.

Money Ta lks : Economic Aspects o f Mar ine Tur t le Use and Conservat ion 46
Heritage Protected Area (Palma 1997). Eggs are
collected under permits and either sold in the
Philippines or smuggled to nearby Sabah, Malaysia.
Between 1984-1995, a total of 1,562 egg collection
permits were issued to qualified residents on Taganak,
Lihiman, Langaan and Bakkungan islands (Palma
1997). Egg sales prices vary. Currently, illegal sale
prices are lower (US$0.18 per egg, pers. obs.) in
markets in Sandakan, Malaysia, close to the Turtle
Islands than in more distant Kota Kinabalu, Malaysia
(US$0.26 per egg, Khan 2003). On average 386,714
eggs per year were collected between 1984-1995
(Figure 6, Palma 1997), representing 31% of all eggs
laid. Gross revenue of the consumptive egg use to egg
collectors and traders is estimated at US$85,078.
In 1972, the Sabah, Malaysia state government
purchased the three islands on the Malaysian side of
the border (Basintal 2002). The islands were first
pronounced a Game and Bird Sanctuary and in 1977
declared as the Turtle Islands Park (Basintal 2002).
Green and hawksbill turtles nest on the islands that are
managed by Sabah Parks. Before the Sabah state
government purchased the islands, egg collection was
the dominant use. Since 1972, egg take has been
prohibited. Tourists have been allowed to visit one of
the islands, Pulau Selingaan, since 1982. The Turtle
Islands Park is now one of the major tourism attractions
of Sabah’s east coast. In 1998, the running of tourist
accommodation and the restaurant on Pulau Selingaan
was turned over to private operators (Basintal 2002).
Although there is a defined peak in nesting in July, a
major promotional point is made of the fact that nesting
turtles can be seen any night of the year. Tourism
visitation has grown from the modest 431 overnight
visitors in 1982 to a peak of 10,131 in 2000 (Figure 7a).
Tour operators and an estimated 54 boat captains, guides,
resort staff and rangers benefit from the marine turtle
tourism (pers. obs.). Sabah Parks receives fees for the use
of the facilities and conservation fees collected from
tourists. Funds collected from tourism activities remain
with Sabah Parks and help offset the cost of conservation
activities in the Turtle Islands Park. In 2002, a total of
506 national and 7,944 foreign tourists visited Pulau
Selingaan (Figure 7a). Average spending is estimated at
US$113.7 for national visitors and US$115.5 for foreign
Appendices
The Government of Seychelles has been cautious not
to develop specific marine turtle tours until local
capacity to control such non-consumptive use is
adequate. However, to create incentives in favour of
marine turtle conservation at a local level it may be
necessary to develop activities through which marine
turtles provide direct economic benefits. For local
people, it is not enough that greater gross revenue is
generated by non-consumptive use. Each individual,
particularly those who used to benefit economically
from consumptive use, needs to receive economic
benefits from non-consumptive use. The potential for
specific marine turtle tours appears tremendous as
hawksbill turtles nest mainly during the daytime in
Seychelles thus allowing for more comfort to visitors
and the taking of photographs (Mortimer & Bresson 1999).
Case Study 7: divergent uses at thePhilippines and Sabah, Malaysia Turtle Islands
The Philippines and Sabah, Malaysia Turtle Islands are
geographically so close that you can see from one
island to the next. Three of the islands are located in
Sabah, Malaysia and six belong to the Philippines.
Marine turtle uses on the different sides of the border are
very different and make the islands a useful case study
for comparing consumptive and non-consumptive use.
Collection of marine turtle eggs at the Turtle Islands,
Tawi-Tawi in the Philippines is a traditional source of
livelihood for local people (Palma 1997). Since 1996,
the islands form part of the Binational Turtle Islands
Figure 6 Marine turtle eggs collected in PhilippinesTurtle Islands(source: Palma 1997)

Money Ta lks : Economic Aspects o f Mar ine Tur t le Use and Conservat ion 47
Appendices
tourists (pers. obs.). Gross revenue from tourism to visit
Turtle Island Park in 2002 is estimated at US$975,044.
In conclusion, the gross economic revenue from non-
consumptive use on the Sabah Turtle Islands is now
one order of magnitude greater than revenue from con-
sumptive use of marine turtle eggs on the Philippines
Turtles Islands (Table 3 and 5). In terms of use trends,
the number of eggs collected on the Philippine Turtle
Islands declined at a rate of 3.2% per year between
1984 and 1995. During the same time period, tourism
visitation to the Sabah Turtle Islands Park grew at a rate
of 28% per year. The impact of each use on the
breeding population contrasts sharply: a drop of 82% in
eggs available for extraction has been recorded in the
Philippines Turtle Islands since 1950s due to egg
collection (Palma 1997), whereas green turtle nesting in
the Sabah Turtle Islands Park increased at a rate of
15% per year between 1984-1995 (Figure 7b).
Promotion of marine turtle tourism, Sabah, Malaysia.
Case Study 8: egg collection for localconsumption and sale in Maldives
Marine turtles and their eggs have been used for food
in the Maldives for centuries (Frazier et al. 2000).
Consumptive use initially focused on eggs, as many
Moslems consider marine turtle meat unclean (Frazier
et al. 2000). A different interpretation of meat use by a
religious leader caused an expansion of use from the
1950’s (Frazier et al. 2000). Since January 1996, there is
a ban on turtle and turtle product sales but tortoiseshell
items are still available in souvenir shops in Male (pers.
obs.). Collection and sale of marine turtle eggs remains
legal (Hussein 2000). Eggs are consumed locally or sold
at the market in Male (pers. obs.).
Maldives marine turtle populations are thought to be
much depleted from previous levels (Zahir 2000).
Increased prices of tortoiseshell stimulated export of
large quantities of shell in the early 1970’s, followed by
a subsequent decline in exports in the late 1970’s
(Frazier et al. 2000). Between 1988-1995, the number of
eggs exploited declined with an average of 4.9% per
year for green turtle eggs and 3.1% for hawksbill eggs,
as a likely consequence of fewer females coming
ashore to nest (Zahir 2000).
Current egg sales price is US$0.24 per egg (pers. obs.).
Local authorities are compiling data on the number of
green and hawksbill turtle eggs collected each year but
Figure 7a Turtle Island Park, tourism trend(source: Sabah Parks, P. Bastinal pers. comm.)
Figure 7b Turtle Island Park, Sabah nesting trend(source: Sabah Parks, P. Bastinal pers. comm.)

Money Ta lks : Economic Aspects o f Mar ine Tur t le Use and Conservat ion 48
Appendices
Green turtle eggs for sale - Male, Maldives.
the quality and consistency of the information are
questionable (Zahir 2000). If we assume that the
reported egg numbers reflect the levels of use in
Maldives then an average of 147,927 green turtle and
15,906 hawksbill eggs were collected annually in the
Maldives during 1988-1995 (Zahir 2000). Gross revenue
to egg collectors and traders from egg sales is
estimated at US$38,731.
Case Study 9: simultaneous egg collectionand tourism at Rantau Abang, Malaysia
The right to collect leatherback eggs laid at Rantau
Abang, Malaysia is limited through a concession
system. The Terengganu State Government issues
concession rights to preferred bidders through a tender
process. Only holders of a concession may collect
marine turtle eggs. The system is very different from an
open-access situation where anyone may exploit
wildlife resources and which is often considered a major
explanation for overexploitation (Hutton et al. 2001).
Since the 1950’s, close to 100% of leatherback eggs
were collected and either consumed locally or sold at
markets. Efforts to incubate a small proportion of the
leatherback nests in hatcheries began in 1961 (K.
Ibrahim pers. comm.). Egg collection continues but all
leatherback eggs must now be sold to the Fisheries
Department and incubated in hatcheries for
subsequent release (K. Ibrahim pers. comm.). It is
estimated that in 1956 over 10,000 leatherback nests
were deposited at Rantau Abang (Siow 1989). Between
1956 and 2002, leatherback nesting at Rantau Abang
declined by over 99% (Chan & Liew 1996, K. Ibrahim
pers. comm.). Overexploitation of eggs and mortality in
fisheries activities are thought to be the major causes of
the decline (Chan & Liew 1996, K. Ibrahim pers.
comm.). In 2002, only three leatherback nests
containing an estimated 240 eggs were deposited on
Terengganu beaches (K. Ibrahim pers. comm.). The
current egg sales price is estimated at US$0.66 per
egg. The gross revenue to egg collectors from the sale
of leatherback eggs to the Fisheries Department is
estimated at US$158, down from an estimated gross
revenue of US$54,867 in 1984.
Rantau Abang was also one of the first sites in the world
with marine turtle tourism. Tourism to observe nesting
leatherback turtles began as early as in the 1960s. In
1988, the Terengganu state declared the Rantau Abang
Turtle Sanctuary (TUMEC, K. Ibrahim pers. comm.). The
Sanctuary extends along 13 km of coastline and includes
waters up to 3 nautical miles offshore (TUMEC, K.
Ibrahim pers. comm.). Tourism visitation peaked in
1994 when a total of 68,800 Malay and international
tourists visited the Sanctuary (Figure 8a). In 2002,
12,259 visitors came to Rantau Abang (Figure 8a and 8b).

Money Ta lks : Economic Aspects o f Mar ine Tur t le Use and Conservat ion 49
consequently maintain tourism at 1994 levels, gross
revenue from tourism in 2002 would have been
$2,933,407 ie six times greater than actual revenue12
from egg sales and tourism in that year. Had visitation
continued to increase at the 1989-1994 rate, gross
tourism revenue in 2002 would now be $7,031,335, ie
more than 14 times the actual revenue. The estimate
illustrates the cost of failing to adequately manage a
marine turtle population, which was generating revenue
from multiple uses. It suggests that it would be worth to
invest considerable resources to recover the Rantau
Abang leatherback population and associated tourism.
In addition, the case demonstrates the difference of
several orders of magnitude, between gross revenue
from consumptive use of marine turtle eggs and that of
non-consumptive use through tourism.
Rantau Abang also provides a good example of the
costs of raising leatherback turtles in captivity. In
general, leatherback turtles are considered very difficult
to raise in captivity and one of few, if not the only
successful example is the effort of the Turtle and Marine
Ecosystem Centre (TUMEC) in Rantau Abang (K.
Ibrahim pers. comm.). From a handful of hatchlings
kept in captivity, one survived to 8.5 years of age (K.
Ibrahim pers. comm.). The cost of raising the
leatherback amounted to approximately US$132 per
month during the first year and approximately US$658
per month for each subsequent year (K. Ibrahim pers.
comm.). If we assume age of maturity at 10 years, the
cost of raising one adult leatherback turtle amounts to
US$72,632.
Appendices
Not all tourists visiting Rantau Abang stay overnight
locally. Many prefer accommodation in the adjacent
towns of Kuala Terengganu and Dungun. To calculate
average spending, we assume an average stay of one
day and spending per tourist equal to the average
spending of US$26.3 for Malay and US$65.4 for
international tourists in Malaysia (Malaysia Tourism Board
pers. comm.). These assumptions are probably conser-
vative as tourists would travel from Penang, Kuala
Lumpur and Johor Bahru to observe nesting leather-
back turtles (K. Ibrahim pers. comm.). Concession
holders, business owners and their employees benefit
from marine turtle tourism. For 2002, gross revenue
from tourism is estimated at US$480,149.
Rantau Abang provides an example of the negative
effect marine turtle population decline can have on
tourism. Between 1994-2002, Malaysian visitation to
the Sanctuary declined on average 21% per year and
international visitors declined with a rate of 20% per
year as the probability of seeing a leatherback turtle
diminished (Figure 8a). In 2001, the fisheries sector in
Malaysia employed 145,100 or 1.5% of the total
employed population whilst 589,400 or 6.2% of the
employed population worked in tourism (Malaysia
National Bank M. Rizwan pers. comm.). In this context,
it is likely that more livelihoods are affected in the
tourism sector by lack of effective conservation action,
than in the fisheries sector.
Had a complete stop to egg collection in 1984 been
enough to sustain the leatherback population, and
Figure 8a Rantau Abang Turtle Sanctuarytourism trend(source: TUMEC, K. Ibrahim pers. comm.)
Figure 8b Rantau Abang Turtle Sanctuarynesting trend(source: TUMEC, K. Ibrahim pers. comm.)

Money Ta lks : Economic Aspects o f Mar ine Tur t le Use and Conservat ion 50
Case Study 10: Projeto TAMAR, Brazil
Brazil’s marine turtle conservation program Projeto
TAMAR was founded in 1980 (Marcovaldi & Marcovaldi
1999). As part of its marine turtle conservation efforts,
Projeto TAMAR has organized productive groups in
coastal communities. At locations with little or no
tourism, the productive groups manufacture items with
marine turtle themes such as T-shirts, hats and
souvenirs that are sold in Projeto TAMAR’s visitors
centres (de Andrade Patiri 2002, pers. obs.). The visitor
centres serve the dual purpose of raising funds and
awareness through education of the predominantly
Brazilian visitors. The centres also generate local
employment to attend visitors, maintain facilities and
care for the marine turtles.
Total sales from Projeto TAMAR’s productive chain
increased with an average of 30% per year between
1998 and 2002 (L. Guardia pers. comm.). Projeto
TAMAR now employs 1,280 people of which 60% are
women (M.A. Marcovaldi pers. comm.). On many of the
Appendices
beaches where Projeto TAMAR is present, the program
is the primary source of direct and indirect income to
the local community (Marcovaldi & Marcovaldi 1999).
Projeto TAMAR’s production and sales activities
generated a gross revenue of US$2,635,656 in 2001 (de
Andrade Patiri 2002). Profits from sales are used for
marine turtle conservation work (de Andrade Patiri
2002). At least at some sites in Brazil, marine turtle
nesting has increased since the late 1980’s (Marcovaldi
2001).
Case Study 11: Ras Al Hadd and Ras Al Jinz,Oman
Ras Al Hadd and Ras Al Jinz, Oman hosts annual
nesting of 6,000-18,000 green turtles (Salm 1991 cited
in Mendonça et al. 2001). In 1996, a turtle reserve of
120 km2 including 70 km of coastline was established
at Ras Al Hadd and Ras Al Jinz (Chomo & Grobler
1998). Green turtle nesting at Ras al Hadd is thought to
have remained stable between 1977-79 to 1988
(Seminoff 2002).
Since 1991, visitors have observed marine turtle
nesting under the guidance of park rangers (A. Al
Kiyumi pers. comm.). Between, 1991-1996, the number
of visitors increased from 3,631 to 11,558 (Chomo &
Grobler 1998) corresponding to an average increase of
19.9% per year. Visiting Omani residents increased with
an average of 24.7% and international visitors with
14.9% per year during the same time period. Visitation
has continued to increase since 1996 (A. Al Kiyumi
pers. comm.). During a religious holiday in November
2003, the turtle nesting beaches had over 3,000 visitors
in a single week (R. Baldwin pers. comm.).
Tour companies organize visits to the turtle reserve
(Chomo & Grobler 1998). In 1996, a total of 11,558
persons visited the Ras Al Hadd Turtle Reserve (Chomo
& Grobler 1998). Entrance fee to the reserve is US$2.6
(A. Al Kiyumi pers. comm.). In 1997/1998, average
expenditure per visitor is conservatively at US$98.3
(Chomo & Grobler 1998). Gross revenue is estimated at
US$1,136,151. Tour company workers and owners
benefit economically from marine turtle tourism.
12 In 2002, we estimated gross revenue at $158 from consumptive use (Appendix 1) and $480,149 from non-consumptive use (Appendix 2a).
Production of souvenirs with marine turtle motifs - Praia do Forte, Brazil.
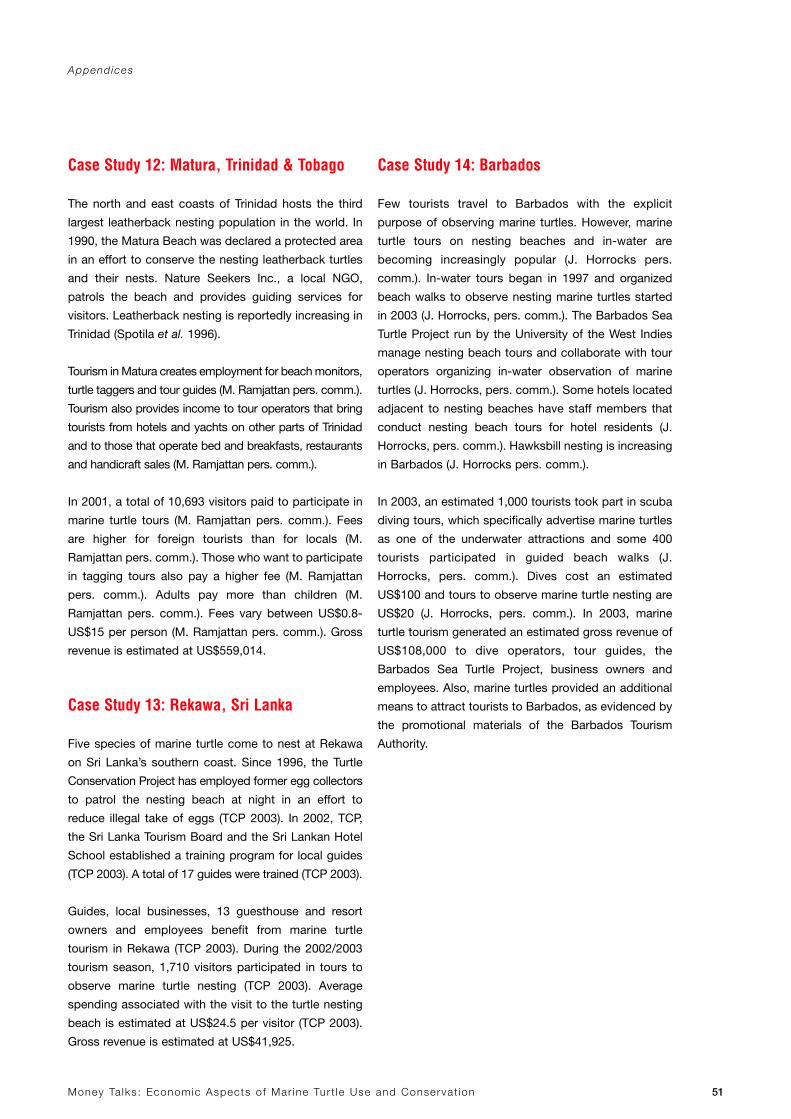
Money Ta lks : Economic Aspects o f Mar ine Tur t le Use and Conservat ion 51
Case Study 12: Matura, Trinidad & Tobago
The north and east coasts of Trinidad hosts the third
largest leatherback nesting population in the world. In
1990, the Matura Beach was declared a protected area
in an effort to conserve the nesting leatherback turtles
and their nests. Nature Seekers Inc., a local NGO,
patrols the beach and provides guiding services for
visitors. Leatherback nesting is reportedly increasing in
Trinidad (Spotila et al. 1996).
Tourism in Matura creates employment for beach monitors,
turtle taggers and tour guides (M. Ramjattan pers. comm.).
Tourism also provides income to tour operators that bring
tourists from hotels and yachts on other parts of Trinidad
and to those that operate bed and breakfasts, restaurants
and handicraft sales (M. Ramjattan pers. comm.).
In 2001, a total of 10,693 visitors paid to participate in
marine turtle tours (M. Ramjattan pers. comm.). Fees
are higher for foreign tourists than for locals (M.
Ramjattan pers. comm.). Those who want to participate
in tagging tours also pay a higher fee (M. Ramjattan
pers. comm.). Adults pay more than children (M.
Ramjattan pers. comm.). Fees vary between US$0.8-
US$15 per person (M. Ramjattan pers. comm.). Gross
revenue is estimated at US$559,014.
Case Study 13: Rekawa, Sri Lanka
Five species of marine turtle come to nest at Rekawa
on Sri Lanka’s southern coast. Since 1996, the Turtle
Conservation Project has employed former egg collectors
to patrol the nesting beach at night in an effort to
reduce illegal take of eggs (TCP 2003). In 2002, TCP,
the Sri Lanka Tourism Board and the Sri Lankan Hotel
School established a training program for local guides
(TCP 2003). A total of 17 guides were trained (TCP 2003).
Guides, local businesses, 13 guesthouse and resort
owners and employees benefit from marine turtle
tourism in Rekawa (TCP 2003). During the 2002/2003
tourism season, 1,710 visitors participated in tours to
observe marine turtle nesting (TCP 2003). Average
spending associated with the visit to the turtle nesting
beach is estimated at US$24.5 per visitor (TCP 2003).
Gross revenue is estimated at US$41,925.
Case Study 14: Barbados
Few tourists travel to Barbados with the explicit
purpose of observing marine turtles. However, marine
turtle tours on nesting beaches and in-water are
becoming increasingly popular (J. Horrocks pers.
comm.). In-water tours began in 1997 and organized
beach walks to observe nesting marine turtles started
in 2003 (J. Horrocks, pers. comm.). The Barbados Sea
Turtle Project run by the University of the West Indies
manage nesting beach tours and collaborate with tour
operators organizing in-water observation of marine
turtles (J. Horrocks, pers. comm.). Some hotels located
adjacent to nesting beaches have staff members that
conduct nesting beach tours for hotel residents (J.
Horrocks, pers. comm.). Hawksbill nesting is increasing
in Barbados (J. Horrocks pers. comm.).
In 2003, an estimated 1,000 tourists took part in scuba
diving tours, which specifically advertise marine turtles
as one of the underwater attractions and some 400
tourists participated in guided beach walks (J.
Horrocks, pers. comm.). Dives cost an estimated
US$100 and tours to observe marine turtle nesting are
US$20 (J. Horrocks, pers. comm.). In 2003, marine
turtle tourism generated an estimated gross revenue of
US$108,000 to dive operators, tour guides, the
Barbados Sea Turtle Project, business owners and
employees. Also, marine turtles provided an additional
means to attract tourists to Barbados, as evidenced by
the promotional materials of the Barbados Tourism
Authority.
Appendices

Money Ta lks : Economic Aspects o f Mar ine Tur t le Use and Conservat ion 52
Case Study 15: Maputaland, South Africa
The coast of Maputaland, South Africa hosts nesting by
loggerhead and leatherback turtles. Scuba diving and
game tourism are the major reasons for tourists visiting
Maputaland and marine turtle tours can only be
considered an additional attraction. In the past, marine
turtles were used consumptively but today marine
turtles are mainly used for ecotourism purposes (R. Nel
pers. comm.). At Kosi Bay, local guides have been
licensed to offer marine turtle tours since the
1994/1995 nesting season. Tenders to conduct turtle
tours are given to communities and tour operators.
Communities are given preference in the tender
process (M. Bower pers. comm.). The only hotel with
two tenders is 49% owned by the local community. Part
of the proceeds from the hotel goes directly to a
community trust fund. The tender fees paid by the
concessionaires are reinvested in marine turtle
monitoring and protection. The nesting season extends
for five months from mid-October to mid-March with
most tours undertaken during the November-January
period (W. Baard, pers. comm.). Both loggerhead and
leatherback nesting numbers have increased since
monitoring began in 1963 (Nel & Hughes, in prep.).
In 2003, four hotels and tour operators paid US$863-
US$2,039 per month and car to conduct turtle tours in
four wheel drive vehicles. In addition, the Kosi Bay
community offers turtle tours on foot. There are also a
couple of minor operators conducting turtle tours on
foot. Approximately 1,750 tourists participate in marine
turtle nesting tours each year (W. Baard pers. comm., P.
Boddam-Whetham pers. comm., M. Bower pers.
comm., pers. obs.). The price for a turtle tour varies
from US$7.1 for a beach walk to US$94.1 for a vehicle
tour with meals and transport included (W. Baard pers.
comm., M. Bower pers. comm., D. Morton pers.
comm., pers. obs.). Gross revenue from tour fees is
estimated at US$45,597.
Case Study 16: Praia do Forte, Costa deSauipe and Fernando do Noronha, Brazil
Projeto TAMAR organizes tours to release hatchlings
and observe nesting turtles. Tours are conducted to
raise funds and create awareness in the states of Bahía
and Pernambuco. In Fernando do Noronha, tourists
can pay to participate in nightly monitoring of nesting
turtles (TAMAR 2002). In Praia do Forte and Costa de
Sauipe, Projeto TAMAR offers “tartarugas by night”.
After two years of pilot efforts, the project became a
regular program during the 1995-1996 nesting season
(Vieitas & Marcovaldi 1997). Participants take part in a
hatchling release event and also have the chance to see
a nesting female.
In 2002, at least 71,870 overnight visitors came to Praia
do Forte, site of the headquarters and largest visitor
centre of Brazil’s marine turtle program Projeto TAMAR
(G. Rostan pers. comm., Bahíatursa pers. comm.).
Marine turtles are a central theme in the streets of Praia
do Forte. When asked about what they enjoyed most
during their stay in Praia do Forte, 5.5% of visitors
mentioned Projeto TAMAR. Tourism in Praia do Forte
provides an estimated 550-613 direct and 3,025-3,371
indirect jobs (de Andrade Patiri 2002).
The “tartarugas by night” program is organized with a
tour operator that benefits economically from the tours.
In 2002, a total of 260 tourists took part in Projeto
TAMAR’s “tartarugas by night” and nightly monitoring
programs (TAMAR 2002). Prices vary from US$13.6 for
nightly monitoring to US$45.9 for the “tartarugas by
night” program (TAMAR 2002). Nightly monitoring in
Fernando do Noronha and the “Tartarugas by Night”
program in Praia do Forte and Costa de Sauipe
generate an estimated gross revenue of US$9,031. The
Appendices
Author Sebastian Troëng on turtle tour, Sodwana bay, South Africa.
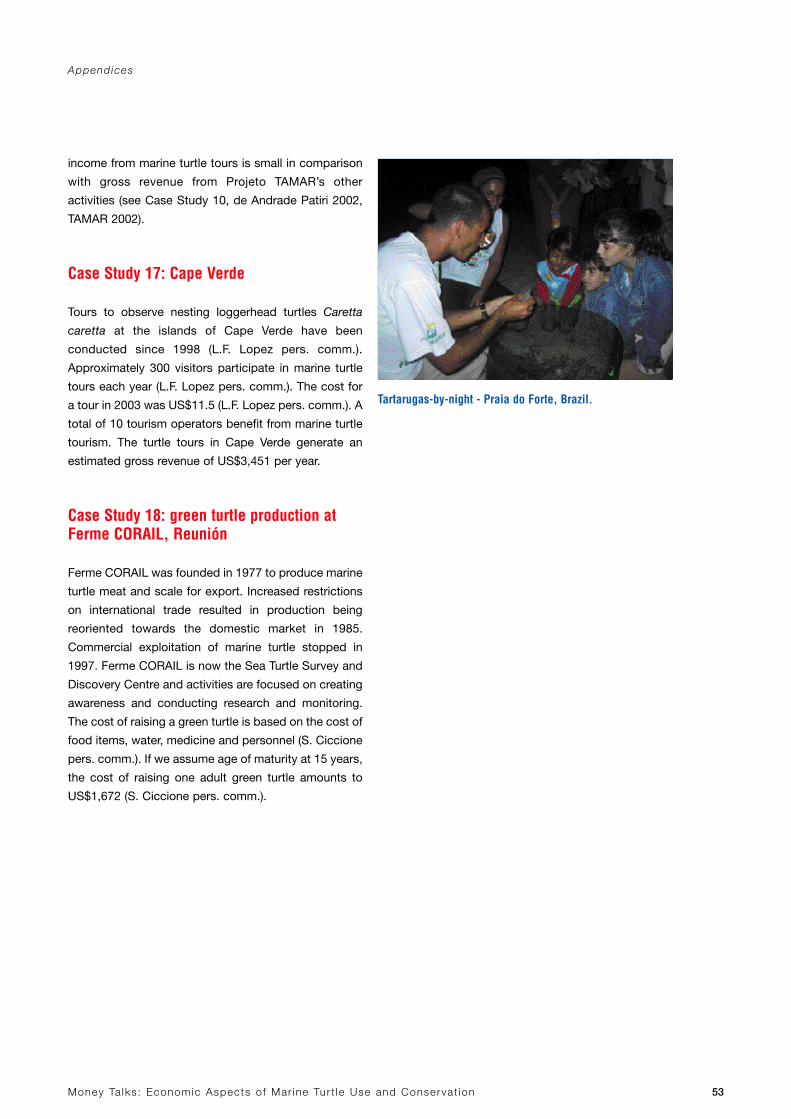
Money Ta lks : Economic Aspects o f Mar ine Tur t le Use and Conservat ion 53
income from marine turtle tours is small in comparison
with gross revenue from Projeto TAMAR’s other
activities (see Case Study 10, de Andrade Patiri 2002,
TAMAR 2002).
Case Study 17: Cape Verde
Tours to observe nesting loggerhead turtles Caretta
caretta at the islands of Cape Verde have been
conducted since 1998 (L.F. Lopez pers. comm.).
Approximately 300 visitors participate in marine turtle
tours each year (L.F. Lopez pers. comm.). The cost for
a tour in 2003 was US$11.5 (L.F. Lopez pers. comm.). A
total of 10 tourism operators benefit from marine turtle
tourism. The turtle tours in Cape Verde generate an
estimated gross revenue of US$3,451 per year.
Case Study 18: green turtle production atFerme CORAIL, Reunión
Ferme CORAIL was founded in 1977 to produce marine
turtle meat and scale for export. Increased restrictions
on international trade resulted in production being
reoriented towards the domestic market in 1985.
Commercial exploitation of marine turtle stopped in
1997. Ferme CORAIL is now the Sea Turtle Survey and
Discovery Centre and activities are focused on creating
awareness and conducting research and monitoring.
The cost of raising a green turtle is based on the cost of
food items, water, medicine and personnel (S. Ciccione
pers. comm.). If we assume age of maturity at 15 years,
the cost of raising one adult green turtle amounts to
US$1,672 (S. Ciccione pers. comm.).
Appendices
Tartarugas-by-night - Praia do Forte, Brazil.
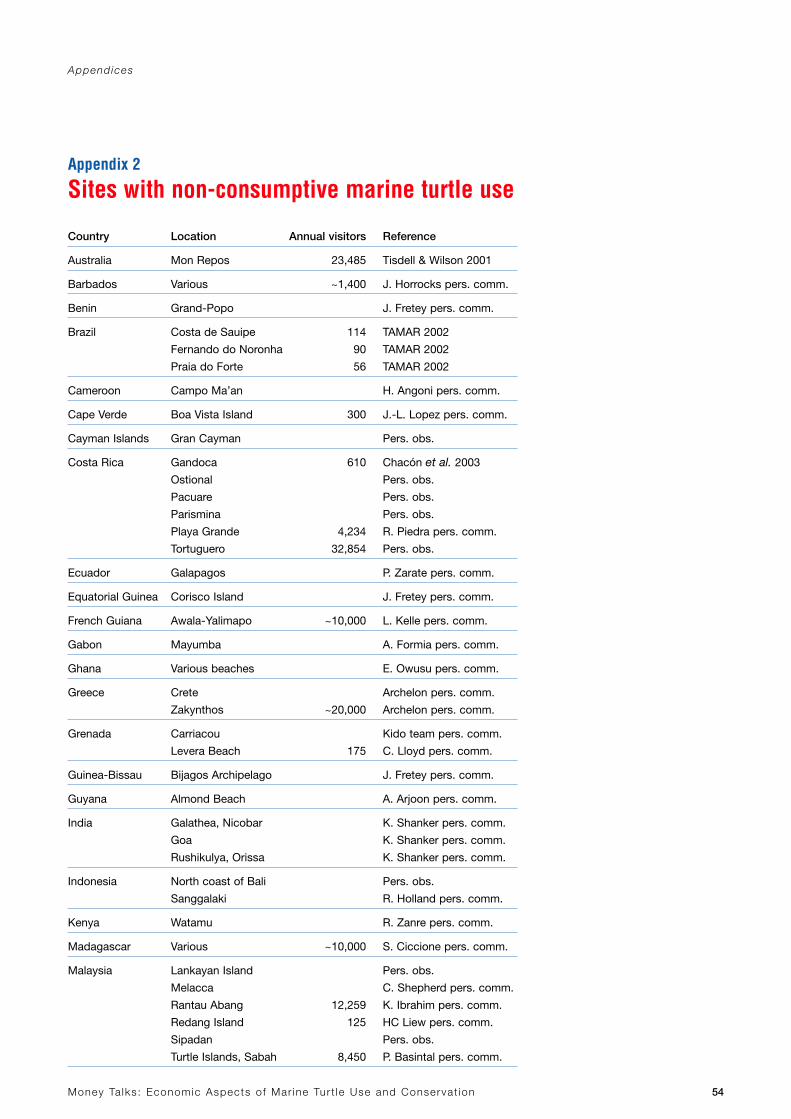
Money Ta lks : Economic Aspects o f Mar ine Tur t le Use and Conservat ion 54
Country Location Annual visitors Reference
Australia Mon Repos 23,485 Tisdell & Wilson 2001
Barbados Various ~1,400 J. Horrocks pers. comm.
Benin Grand-Popo J. Fretey pers. comm.
Brazil Costa de Sauipe 114 TAMAR 2002
Fernando do Noronha 90 TAMAR 2002
Praia do Forte 56 TAMAR 2002
Cameroon Campo Ma’an H. Angoni pers. comm.
Cape Verde Boa Vista Island 300 J.-L. Lopez pers. comm.
Cayman Islands Gran Cayman Pers. obs.
Costa Rica Gandoca 610 Chacón et al. 2003
Ostional Pers. obs.
Pacuare Pers. obs.
Parismina Pers. obs.
Playa Grande 4,234 R. Piedra pers. comm.
Tortuguero 32,854 Pers. obs.
Ecuador Galapagos P. Zarate pers. comm.
Equatorial Guinea Corisco Island J. Fretey pers. comm.
French Guiana Awala-Yalimapo ~10,000 L. Kelle pers. comm.
Gabon Mayumba A. Formia pers. comm.
Ghana Various beaches E. Owusu pers. comm.
Greece Crete Archelon pers. comm.
Zakynthos ~20,000 Archelon pers. comm.
Grenada Carriacou Kido team pers. comm.
Levera Beach 175 C. Lloyd pers. comm.
Guinea-Bissau Bijagos Archipelago J. Fretey pers. comm.
Guyana Almond Beach A. Arjoon pers. comm.
India Galathea, Nicobar K. Shanker pers. comm.
Goa K. Shanker pers. comm.
Rushikulya, Orissa K. Shanker pers. comm.
Indonesia North coast of Bali Pers. obs.
Sanggalaki R. Holland pers. comm.
Kenya Watamu R. Zanre pers. comm.
Madagascar Various ~10,000 S. Ciccione pers. comm.
Malaysia Lankayan Island Pers. obs.
Melacca C. Shepherd pers. comm.
Rantau Abang 12,259 K. Ibrahim pers. comm.
Redang Island 125 HC Liew pers. comm.
Sipadan Pers. obs.
Turtle Islands, Sabah 8,450 P. Basintal pers. comm.
Appendices
Appendix 2
Sites with non-consumptive marine turtle use
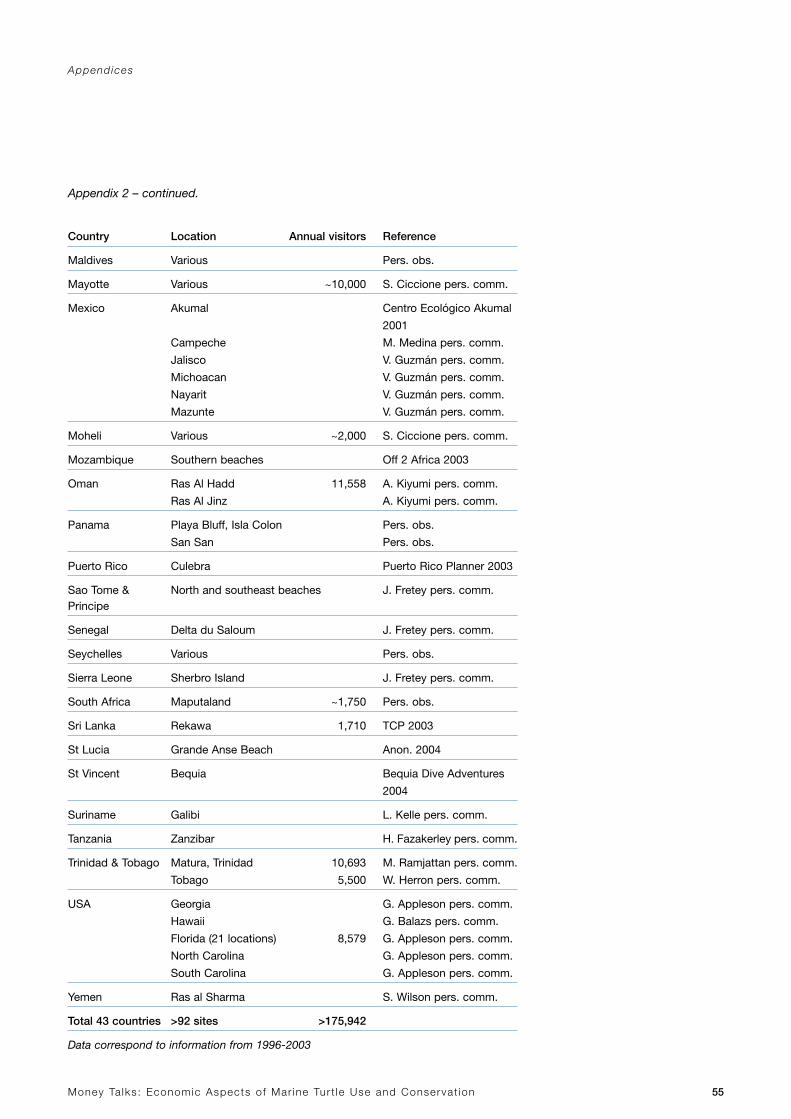
Money Ta lks : Economic Aspects o f Mar ine Tur t le Use and Conservat ion 55
Country Location Annual visitors Reference
Maldives Various Pers. obs.
Mayotte Various ~10,000 S. Ciccione pers. comm.
Mexico Akumal Centro Ecológico Akumal
2001
Campeche M. Medina pers. comm.
Jalisco V. Guzmán pers. comm.
Michoacan V. Guzmán pers. comm.
Nayarit V. Guzmán pers. comm.
Mazunte V. Guzmán pers. comm.
Moheli Various ~2,000 S. Ciccione pers. comm.
Mozambique Southern beaches Off 2 Africa 2003
Oman Ras Al Hadd 11,558 A. Kiyumi pers. comm.
Ras Al Jinz A. Kiyumi pers. comm.
Panama Playa Bluff, Isla Colon Pers. obs.
San San Pers. obs.
Puerto Rico Culebra Puerto Rico Planner 2003
Sao Tome & North and southeast beaches J. Fretey pers. comm.Principe
Senegal Delta du Saloum J. Fretey pers. comm.
Seychelles Various Pers. obs.
Sierra Leone Sherbro Island J. Fretey pers. comm.
South Africa Maputaland ~1,750 Pers. obs.
Sri Lanka Rekawa 1,710 TCP 2003
St Lucia Grande Anse Beach Anon. 2004
St Vincent Bequia Bequia Dive Adventures
2004
Suriname Galibi L. Kelle pers. comm.
Tanzania Zanzibar H. Fazakerley pers. comm.
Trinidad & Tobago Matura, Trinidad 10,693 M. Ramjattan pers. comm.
Tobago 5,500 W. Herron pers. comm.
USA Georgia G. Appleson pers. comm.
Hawaii G. Balazs pers. comm.
Florida (21 locations) 8,579 G. Appleson pers. comm.
North Carolina G. Appleson pers. comm.
South Carolina G. Appleson pers. comm.
Yemen Ras al Sharma S. Wilson pers. comm.
Total 43 countries >92 sites >175,942
Data correspond to information from 1996-2003
Appendices
Appendix 2 – continued.

References

Money Ta lks : Economic Aspects o f Mar ine Tur t le Use and Conservat ion 57
Adnyana, W. (in prep.) Turtle trade in Bali: A retrospective,current situations and future challenges for its control.Unpublished manuscript. WWF Wallacea Office.
Anon. (2004) The Desbarras Sea Turtle WatchCommunity-Based Management Initiative MovingForward. Website:http://www.slubiodiv.org/Biodiversity_Project/Information/Biodiversity_Papers/Turtle_Watch/turtle_watch.html
Arabsheibani, R., Delgado-Aparicio A. (2002) Tourismmultiplier effects on Peru. Brazilian Journal of BusinessEconomics 2(3): 31-45.
Aridjis, H. (1990) Mexico proclaims total ban on harvestof turtles and eggs. Marine Turtle Newsletter 50: 1-3.
Balmford, A., Bruner, A., Cooper, P., Costanza, R.,Farber, S., Green, R.E., Jenkins, M., Jefferiss, P.,Jessamy, V., Madden, J., Munro, K., Myers, N., Naeem, S., Paavola, J., Rayment, M., Rosendo, S.,Roughgarden, J., Trumper, K., Turner, R.K. (2002)Economic Reasons for Conserving Wild Nature. Science 297: 950-953.
Bann, C. (1996) Maximising the Economic and EcologicalBenefits of Ecotourism in Malaysia. Unpublished WWFMalaysia Project Report, Petaling Jaya. 45 pp.
Basintal, P. (2002) Sea turtles conservation at the Sabah’sTurtle Island Park, Malaysia. In: Proceedings of theWestern Pacific Sea Turtle Cooperative Research &Management Workshop. Kinan, I. (ed). Western PacificRegional Fishery Management Council. pp151-160.
Bass, A.L., Lagueux, C.J., Bowen. B.W. (1998) Origin of green turtles, Chelonia mydas, at ‘Sleeping Rocks’ off the Northeast Coast of Nicaragua. Copeia 1998(4):1064-1069.
Bequia Dive Adventures (2004) Bequia Dive Adventures.Website: http://www.bequiadiveadventures.com/index.htm
Bjorndal, K.A., Jackson, J.B.C. (2003) Role of sea turtles in marine ecosystems: reconstructing the past. In: Biology of Sea Turtles, Volume II. Lutz, P.L., Musick,J.A. ,Wyneken, J. (eds.) CRC Press, Boca Raton, pp. 259-273.
Bockstael, N.E., Freeman, A.M., Kopp, R.J., Portney,P.R., Smith, V.K. (1998) On valuing nature. Unpublishedreport. University of Maryland, Bowdoin College,Resources for the Future & Duke University. 12pp.
Bouchard, S.S., Bjorndal, K.A. (2000) Sea turtles asbiological transporters of nutrients and energy frommarine to terrestrial ecosystems. Ecology 81(8): 2305-2313.
Campbell, C.L. (2003) Population assessment andmanagement needs of a green turtle, Chelonia mydas,population in the Western Caribbean. PhD dissertation.University of Florida, Gainesville.124 pp.
Campbell, L.M. (1998) Use them or lose them?Conservation and the consumptive use of marine turtleeggs at Ostional, Costa Rica. Environmental Conservation25(4): 305-319.
Campbell, L.M. (1999) Ecotourism in rural developingcommunities. Annals of Tourism Research 26(3): 534-553.
Campbell, L.M. (2003) Contemporary culture, use, andconservation of sea turtles. In: Biology of Sea Turtles,Volume II. Lutz, P.L., Musick, J.A. ,Wyneken, J. (eds.)CRC Press, Boca Raton, pp. 307-338.
Carr, A., Carr, M.H., Meylan, A.B. (1978) The ecology andmigrations of sea turtles, 7. The west Caribbean greenturtle colony. Bulletin of the American Museum of NaturalHistory 162: 1-46.
Carrillo, E., Webb, G.J.W., Manolis, S.C. (1999) Hawksbillturtles (Eretmochelys imbricata) in Cuba: an assessmentof the historical harvest and its impacts. ChelonianConservation and Biology 3(2): 264-280.
References
Visitor centre - Rantau Abang, Malaysia.
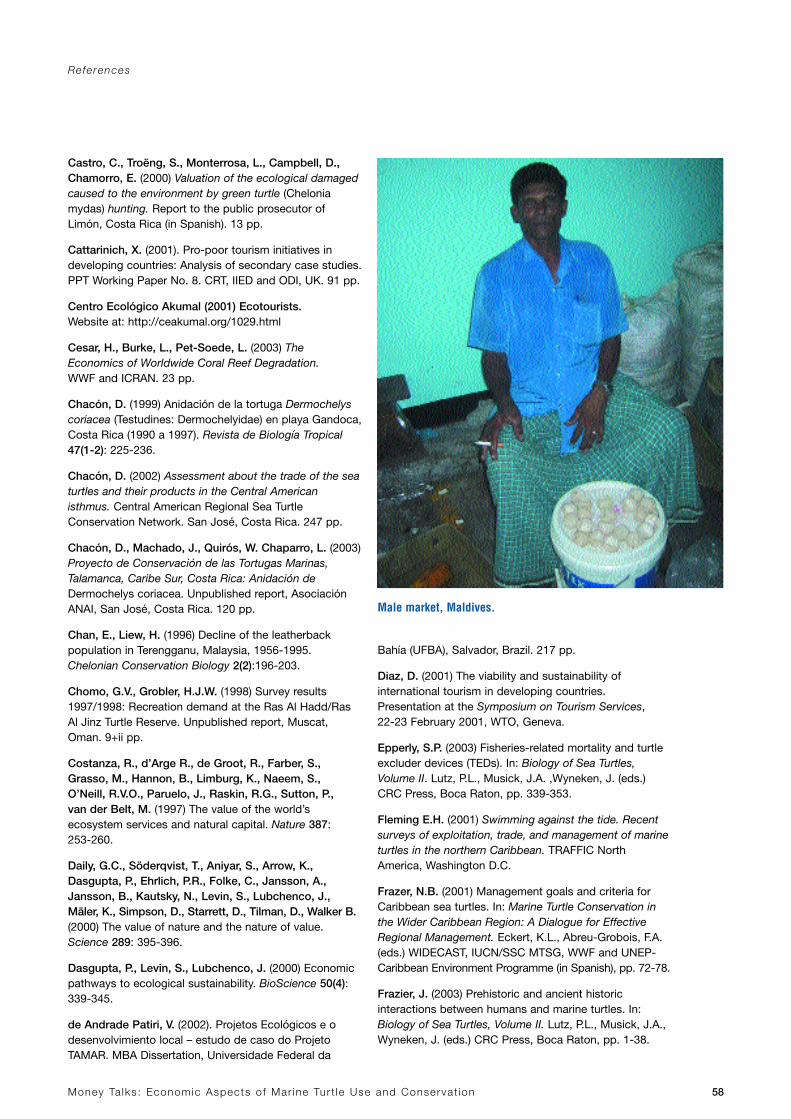
Money Ta lks : Economic Aspects o f Mar ine Tur t le Use and Conservat ion 58
Castro, C., Troëng, S., Monterrosa, L., Campbell, D.,Chamorro, E. (2000) Valuation of the ecological damagedcaused to the environment by green turtle (Cheloniamydas) hunting. Report to the public prosecutor ofLimón, Costa Rica (in Spanish). 13 pp.
Cattarinich, X. (2001). Pro-poor tourism initiatives indeveloping countries: Analysis of secondary case studies.PPT Working Paper No. 8. CRT, IIED and ODI, UK. 91 pp.
Centro Ecológico Akumal (2001) Ecotourists.Website at: http://ceakumal.org/1029.html
Cesar, H., Burke, L., Pet-Soede, L. (2003) TheEconomics of Worldwide Coral Reef Degradation.WWF and ICRAN. 23 pp.
Chacón, D. (1999) Anidación de la tortuga Dermochelyscoriacea (Testudines: Dermochelyidae) en playa Gandoca,Costa Rica (1990 a 1997). Revista de Biología Tropical47(1-2): 225-236.
Chacón, D. (2002) Assessment about the trade of the seaturtles and their products in the Central Americanisthmus. Central American Regional Sea TurtleConservation Network. San José, Costa Rica. 247 pp.
Chacón, D., Machado, J., Quirós, W. Chaparro, L. (2003)Proyecto de Conservación de las Tortugas Marinas,Talamanca, Caribe Sur, Costa Rica: Anidación deDermochelys coriacea. Unpublished report, AsociaciónANAI, San José, Costa Rica. 120 pp.
Chan, E., Liew, H. (1996) Decline of the leatherbackpopulation in Terengganu, Malaysia, 1956-1995.Chelonian Conservation Biology 2(2):196-203.
Chomo, G.V., Grobler, H.J.W. (1998) Survey results1997/1998: Recreation demand at the Ras Al Hadd/RasAl Jinz Turtle Reserve. Unpublished report, Muscat,Oman. 9+ii pp.
Costanza, R., d’Arge R., de Groot, R., Farber, S.,Grasso, M., Hannon, B., Limburg, K., Naeem, S., O’Neill, R.V.O., Paruelo, J., Raskin, R.G., Sutton, P., van der Belt, M. (1997) The value of the world’secosystem services and natural capital. Nature 387: 253-260.
Daily, G.C., Söderqvist, T., Aniyar, S., Arrow, K.,Dasgupta, P., Ehrlich, P.R., Folke, C., Jansson, A.,Jansson, B., Kautsky, N., Levin, S., Lubchenco, J.,Mäler, K., Simpson, D., Starrett, D., Tilman, D., Walker B.(2000) The value of nature and the nature of value.Science 289: 395-396.
Dasgupta, P., Levin, S., Lubchenco, J. (2000) Economicpathways to ecological sustainability. BioScience 50(4):339-345.
de Andrade Patiri, V. (2002). Projetos Ecológicos e odesenvolvimiento local – estudo de caso do ProjetoTAMAR. MBA Dissertation, Universidade Federal da
Bahía (UFBA), Salvador, Brazil. 217 pp.
Diaz, D. (2001) The viability and sustainability ofinternational tourism in developing countries.Presentation at the Symposium on Tourism Services, 22-23 February 2001, WTO, Geneva.
Epperly, S.P. (2003) Fisheries-related mortality and turtleexcluder devices (TEDs). In: Biology of Sea Turtles,Volume II. Lutz, P.L., Musick, J.A. ,Wyneken, J. (eds.)CRC Press, Boca Raton, pp. 339-353.
Fleming E.H. (2001) Swimming against the tide. Recentsurveys of exploitation, trade, and management of marineturtles in the northern Caribbean. TRAFFIC NorthAmerica, Washington D.C.
Frazer, N.B. (2001) Management goals and criteria forCaribbean sea turtles. In: Marine Turtle Conservation inthe Wider Caribbean Region: A Dialogue for EffectiveRegional Management. Eckert, K.L., Abreu-Grobois, F.A.(eds.) WIDECAST, IUCN/SSC MTSG, WWF and UNEP-Caribbean Environment Programme (in Spanish), pp. 72-78.
Frazier, J. (2003) Prehistoric and ancient historicinteractions between humans and marine turtles. In:Biology of Sea Turtles, Volume II. Lutz, P.L., Musick, J.A.,Wyneken, J. (eds.) CRC Press, Boca Raton, pp. 1-38.
References
Male market, Maldives.

Money Ta lks : Economic Aspects o f Mar ine Tur t le Use and Conservat ion 59
Frazier, J., Salas, S., Didi, N.T. (2000). Status of seaturtles in the Maldives. Maldives Marine Research Bulletin4: 5-42.
Freeman, A. M. III (2003) The Measurement ofEnvironmental and Resource Values. Resources for theFuture, Washington D.C.
Fretey J. (2001) Biogeography and conservation ofmarine turtles of the Atlantic coast of Africa. CMSTechnical Series Publication No. 6., SecretariatConvention on Migratory Species, Bonn.
GOC (1963) Regulations for turtle fishing. ExecutiveDecree Nº9. La Gaceta 121: 30 May 1963 (in Spanish).
GOC (1969) Reform to regulations for turtle fishing.Executive Decree Nº15. La Gaceta 157: 4 July 1969 (in Spanish).
GOC (1970) Declare Tortuguero National Park. ExecutiveDecree Nº1235-A. La Gaceta 213: 24 September 1970 (in Spanish).
Green, E.P., Short, F.T. (2003) World Atlas of Seagrasses.Prepared by the UNEP Wolrd Conservation MonitoringCentre. University of California Press, Berkeley. 298 pp.
Gutic, J. (1994) Sea turtle eco-tourism brings economicbenefit to community. Marine Turtle Newsletter 64: 10-12.
Harrison, E., Troëng, S., Nolasco, D., Crispin, D.,Matthews, C., Padidar, K., Gaos, A., Towers, R.,Jímenez, D., Debade, X., Paxton, M., Sawyer, T.,Gutiérrez, A., Garzón, J.C., Machado, J., Yañez, I., Díaz, A., Redondo, A. (2003) Report on the 2002 Green Turtle Program at Tortuguero. Unpublished reportsubmitted to Caribbean Conservation Corporation andthe Ministry of Environment and Energy, San José, Costa Rica. 52 pp.
Heppell, S.S., Snover, M.L., Crowder, L.B. (2003) Seaturtle population ecology. In: Biology of Sea Turtles,Volume II. Lutz, P.L., Musick, J.A. ,Wyneken, J. (eds.)CRC Press, Boca Raton, pp. 275-306.
Hope, R.A. (2002) Wildlife harvesting, conservation andpoverty: the economics of olive ridley egg exploitation.Environmental Conservation 29(3): 375-384.
Hoyt, E. (2001) Whale Watching 2001: Worldwide tourismnumbers, expenditures, and expanding socio-economicbenefits. International Fund for Animal Welfare, YarmouthPort, MA, USA, 158+vi pp.
Hussein, A.R. (2000). Minister’s preface. Maldives MarineResearch Bulletin 4: 1-2
Hutton, J., Ross, P., Webb, G. (2001) Using the Market toCreate Incentives for the Conservation of Crocodilians: AReview. Unpublished report by the IUCN/SSC CrocodileSpecialist Group. 28 pp.
IUCN (2003) 2003 IUCN Red List of Threatened Species.http://www.redlist.org
Jackson, J.B.C. (1997) Reefs since Columbus. CoralReefs 16 Suppl.: S23-S32.
Jackson, J.B.C. (2001) What was natural in the coastaloceans? Proceedings of the National Academy ofSciences of the U.S.A. 98: 5411-5418.
Jackson, J.B.C., Kirby, M.X., Berger, W.H., Bjorndal,K.A., Botsford, L.W., Bourque, B.J., Bradbury, R.H.,Cooke, R., Erlandson, J., Estes, J.A., Hughes, T.P.,Kidwell, S., Lange, C.B., Lenihan, H.S., Pandolfi, J.M.,Peterson, C.H., Steneck, R.S., Tegner, M.J., Warner, R.R. (2001) Historical overfishing and the recentcollapse of coastal ecosystems. Science 293: 629-638.
JWCS (2000) Hawksbill trade revived? Analysis of themanagement system of domestic “bekko” trade in Japan.Japan Wildlife Conservation Society (JWCS) Report. 16 pp.
Kellert S.R. (1996) The Value of Life. Island Press,Washington D.C.
Khan, A. (2003) There are people who still think it’s OKAYto sell turtle eggs. New Sabah Times October 14: 4.
Kiss, A. (2004) Is community-based ecotourism a gooduse of biodiversity conservation funds? TRENDS inEcology and Evolution 19(5): 232-237.
Lagueux, C.J. (1991) Economic analysis of sea turtleeggs in a coastal community on the Pacific coast ofHonduras. In: Neotropical Wildlife Use and Conservation.Robinson, J.G., Redford, K.H. (eds.) University of ChicagoPress, Chicago, pp. 136-144.
Lagueux, C.J. (1998) Marine turtle fishery of CaribbeanNicaragua: Human use patterns and harvest trends. PhDdissertation. University of Florida, Gainesville, 215 pp.
Legislative Assembly (1975) Creation of TortugueroNational Park. Law Nº5680. La Gaceta 216: 13 November1975 (in Spanish).
Legislative Assembly (2002) Law for protection,conservation and recuperation of sea turtle populations.Law Nº8325. La Gaceta 230: 28 November 2002 (in Spanish).
León, Y.M., Bjorndal, K.A. (2002) Selective feeding in the hawksbill turtle, an important predator in coral reefecosystems. Marine Ecology Progress Series 245: 249-258.
Lewinson, R.L., Freeman, S.A., Crowder, L.B. (2004)Quantifying the effects of fisheries on threatened species:the impact of pelagic longlines on loggerhead andleatherback sea turtles. Ecology Letters 7(3): 221-231.
References

Money Ta lks : Economic Aspects o f Mar ine Tur t le Use and Conservat ion 60
Lindberg, K. 1991. Policies for Maximising NatureTourism´s Ecological & Economic Benefits. WorldResources Institute, Washington, D.C.
Lutcavage, M.E., Plotkin, P., Witherington, B., Lutz, P.L.(1997) Human impacts on sea turtle survival. In: Biologyof Sea Turtles. Lutz, P.L., Musick, J.A. (eds.) CRC Press,Boca Raton. pp387-407.
Mack, D., Duplaix, N., Wells, S. (1995) Sea turtles,animals of divisible parts: international trade in sea turtleproducts. In: Biology and Conservation of Sea Turtles.Revised Edition. Bjorndal, K. (ed.). Smithsonian InstitutionPress, Washinton and London. pp 545-562.
Marcovaldi, M.A. (2001) Conservation status anddistribution of the olive ridley, Lepidochelys olivacea, in the Western Atlantic Ocean. In: Marine TurtleConservation in the Wider Caribbean Region: A Dialogue for Effective Regional Management. Eckert,K.L., Abreu-Grobois, F.A. (eds.) WIDECAST, IUCN/SSCMTSG, WWF and UNEP-Caribbean EnvironmentProgramme (in Spanish), pp. 54-58.
Marcovaldi, M.A., Marcovaldi, G. (1999) Marine turtles of Brazil: the history and structure of Projeto TAMAR-IBAMA. Biological Conservation 91: 35-41.
Marquez, R., Peñaflores, C., Vasconcelos, J. (1996) Olive ridley turtles (Lepidochelys olivacea) show signs of recovery at La Escobilla, Oaxaca. Marine TurtleNewsletter 73: 5-7.
Mendonça, V.M., Al-Kiyumi, A.A., Al-Saady, S.M.,Grobler, H.J., Erzini, K. (2001) Environment of the nestingand feeding grounds for endangered turtle species inDhofar (Southern Oman). In: Proceedings of the 1stInternational Conference on Fisheries Aquaculture andEnvironment in the Northwest Indian Ocean, Claereboudt,M. R., Al-Oufi, H.S., McIlwain, J., Goddard, S.(eds).,Oman. pp 151-159.
Meylan, A.B., Donnelly, M. (1999) Status justification forlisting the hawksbill turtle (Eretmochelys imbricata) asCritically Endangered on the 1996 IUCN Red List ofThreatened Animals. Chelonian Conservation and Biology3(2): 200-224.
Mooney, H.A. (2000) Worth more dead than alive. Nature403: 593-594.
Mortimer, J.A. (1981) The feeding ecology of the WestCaribbean green turtle (Chelonia mydas) in Nicaragua.Biotropica 13(1): 49-58.
Mortimer, J.A. (1984). Marine turtles in the Republic of Seychelles: Status and management. Publication of the IUCN Conservation Library: Gland, Switzerland. 80 pp. + 4 pl.
Mortimer, J.A. (2001) Conservation of hawksbill turtles(Eretmochelys imbricata) in the Republic of Seychelles. In:Proceedings of the 2nd ASEAN Symposium andWorkshop on Sea Turtle Biology and Conservation.
Mortimer, J.A., Bresson, R. (1999) Temporal distributionand periodicity in hawksbill turtles (Eretmochelysimbricata) nesting at Cousin Island, Republic ofSeychelles, 1971-1997. Chelonian Conservation andBiology 3(2): 318-325.
Naess, A. (1989) Ecology, Community, and Lifestyle:Outline of an Ecosophy. Cambridge University Press,Cambridge.
Nel, R., Hughes, G. (in prep.) Turtle Report at the End of 40 Years. EKZN Wildlife, Durban, South Africa.
Nietschmann, B. (1973) Between Land and Water, theSubsistence Ecology of the Miskito Indians, EasternNicaragua. Seminar Press, New York, 279 pp.
Nietschmann, B. (1976) Memorias de Arrecife Tortuga:Historia Natural y Economica de las Tortugas en el Caribede America Central. Serie Geografia y Naturaleza No. 2,258 pp.
References
© W
WF-
CA
NO
N/M
ICH
EL
GU
NT
HE
R
Loggerhead turtle tracks, Sekana beach, Zakinthos, Greece.

Money Ta lks : Economic Aspects o f Mar ine Tur t le Use and Conservat ion 61
NOAA (2002) Coastal recreation and tourism: impacts.NOAA website at:http://www.csc.noaa.gov/techniques/recreation/impacts.html
OECD (2000) List of developing countries in alphabethical order. OECD website at:http://www1.oecd.org/dac/htm/ldc-alfa.htm
Off 2 Africa (2003) Mozambique: What to see. Website at:http://www.off2africa.com/html/mozambique/what-to-see/maputoele.html
Palma, J.A.M. (1997) Marine turtle conservation in thePhilippines and initiatives towards a regional managementand conservation program. In: Proceedings of theWorkshop on Marine Turtle Research and Management inIndonesia. Jember, East Java, November 1996. WetlandsInternational, PHPA, Environment Australia, Bogor. p121-138.
Parsons, J.J. (1962) The Green Turtle and Man. Universityof Florida Press, Gainesville.
Parsons, J.J. (1972) The hawksbill turtle and the tortoiseshell trade. In: Études de géographie tropicale offertes aPierre Gourou. Paris: Mouton, pp. 45-60.
Perman, R, Ma, Y., McGilvray, J., Common, M. (2003)Natural Resource and Environmental Economics.3rd Edition. Pearson Education Ltd, London.
Peskin, J.D. (2002) Attitudes of local guides towardecotourism, sea turtle conservation, and guiding inTortuguero, Costa Rica. MSc Thesis, University of Florida,Gainesville, USA. 81 pp.
Puerto Rico Planner (2003) Turtle watching season.Website at: http://www.travelandsports.com
Reingold, L. (1993) Identifying the Elusive Ecotourist.Going Green: A Supplement to Tour & Travel NewsOctober 25: 36-37.
Rhodin, A.G.J., Pritchard, P.C.H. (1999) Editorialcomment. Chelonian Conservation and Biology 3(2): 171-172.
ROC (2002) Transfer of the population in Cuban watersfrom Appendix I to Appendix II, pursuant to ResolutionConf. 9.24. Proposal presented to the 12th Conference of the Parties, Santiago (Chile), 3 - 15 November 2002.Convention on International Trade in Endangered Species of Wild Fauna and Flora. 26 pp.
Rolston III, H. (1994) Conserving Natural Value. ColumbiaUniversity Press, New York.
Salm, R. (1991) Turtles in Oman: Status, Threats andManagement Options. Scientific Results of the IUCNCoastal Zone Management Project. IUCN/Ministry ofCommerce and Industry, Muscat, Oman.
Scheyvens, R. (1999) Ecotourism and the empowermentof local communities. Tourism Management 20: 249-249.
Seminoff (2002) 2002 IUCN Red list global statusassessment, green turtle Chelonia mydas. IUCN MarineTurtle Specialist Group Review. 93 pp.
Simpson, R. D. (1998) Economic analysis andecosystems: some concepts and issues. EcologicalApplications 8(2): 342-349.
Siow, K.T. (1989). A study on the migration of leatheryturtle (Dermochelys coriacea) from Malaysia by means ofsatellite tracking. In: Majlis Penasihat Santuari Penyu.Mesyuarat Ke 3/89. Kerajaan Negeri Terengganu Darul Iman.
Spotila, J.R., Dunham, A.E., Leslie, A.J., Steyermark,A.C., Plotkin, P.T., Paladino, F.V. (1996) WorldwidePopulation Decline of Dermochelys coriacea: AreLeatherback Turtles Going Extinct? ChelonianConservation and Biology 2: 209-222.
Spotila, J.R., Reina, R.D., Steyermark, A.C., Plotkin, P.T.& Paladino, F.V. (2000) Pacific leatherback turtles faceextinction. Nature 405: 529-530.
Stynes, D.J. (1999) Approaches to estimating theeconomic impacts of tourism; some examples. MichiganState University. 18 pp.
TAMAR (2002). Relatório de atividades 2002. AnnualReport. Projeto TAMAR, Praia do Forte, Brazil. 281+v pp.
References
Collection of olive ridley eggs for sale - Ostional, Costa Rica.
Money Ta lks : Economic Aspects o f Mar ine Tur t le Use and Conservat ion 62
TCP (2003). Report on “Turtle Watches” nature tourism inRekawa. Unpublished report. Turtle Conservation Project(TCP), Tangalle, Sri Lanka. 9 pp.
Thayer, G.W., Engel, D.W. (1982) Evidence for short-circuiting of the detritus cycle of seagrass beds by thegreen turtle, Chelonia mydas L. Journal of ExperimentalMarine Biology and Ecology 62: 173-183.
Thayer, G.W., Bjorndal, K.A., Ogden, J.C., Williams, S.L.,Zieman, J.C. (1984) Role of larger herbivores in seagrasscommunities. Estuaries 7: 351-376.
Thorbjarnarson, J., Lagueux, C.J., Bolze, D., Klemens,M.W., Meylan, A.B. (2000) Human use of turtles: aworldwide perspective. In: M. W. Klemens (Editor), TurtleConservation. Smithsonian Institution Press, Washington,D.C, pp. 33-84.
Tisdell, C., Wilson, C. (2001) Tourism and theconservation of sea turtles: an Australian case study. In:C. Tisdell (Editor), Tourism Economics, the Environmentand Development: Analysis and Policy. Edward Elgar,Cheltenham, UK, pp. 356-368.
Tisdell, C., Wilson, C. (2002) Ecotourism for the survivalof sea turtles and other wildlife. Biodiversity &Conservation 11: 1521-1538.
TRAFFIC (1994) Shell smuggler arrested in Japan. Marine Turtle Newsletter 67:31-35.
TRAFFIC Southeast Asia (2004) The trade in marine turtle products in Viet Nam. TRAFFIC Report.http://www.traffic.org
Trinidad, H., Wilson, J. (2000) The bio-economics of seaturtle conservation and use in Mexico: History ofexploitation and conservation policies for the olive ridley(Lepidochelys olivacea). Microbehavior and Macroresults:Proceedings of the Tenth Biennial Conference of theInternational Institute of Fisheries Economics and TradePresentations.
Troëng, S. (1997) Marine Turtle Utilisation. In:Proceedings of the Workshop on Marine Turtle Researchand Management in Indonesia. Jember, East Java,November 1996. Wetlands International, PHPA,Environment Australia, Bogor. p73-85.
Troëng, S., Evans, D. (In review) Internesting and PostNesting Migration Behavior of Green Turtles Cheloniamydas Elucidated through Satellite Telemetry. Marine Biology.
Troëng, S., Rankin, E. (In press) Long-term conservationefforts contribute to positive green turtle Chelonia mydasnesting trend at Tortuguero, Costa Rica. BiologicalConservation.
Valverde, R.A. (1999) On the Ostional affair. Marine TurtleNewsletter 86, 6-8.
van Dijk P.P., Shepherd, C.R. (2004) Shelled out? Asnapshot of bekko trade in selected locations in South-East Asia. TRAFFIC Southeast Asia, Selangor, Malaysia.http://www.traffic.org
Vargas-Mena, E. (2000) Significados culturales de latortuga verde (Chelonia mydas) en el Caribecostarricense. In: Actitudes hacia la fauna enLatinoamérica. Nassar-Montoya, F., Crane, R. (eds.)Humane Society Press, Washington D.C. pp. 161-176.
Vieitas, C.F., Marcovaldi, M.A. (1997) An ecotourisminitiativeto increase awareness andprotection of marineturtles in Brazil: the Turtle by Night program. ChelonianConservation Biology 2(4): 607-610.
Whitehead, J. C. (1992). Ex ante willingness to pay withsupply and demand uncertainty: implications for valuing asea turtle protection programme. Applied Economics 24:981-988.
Wilson, C., Tisdell, C. (2001) Sea turtles as a non-consumptive tourism resource especially in Australia.Tourism Management 22: 279-288.
Wing, S.R., Wing, E.S. (2001) Prehistoric fisheries in theCaribbean. Coral Reefs 20: 1-8.
Witherington, B.E., Frazer, N.B. (2003) Social andeconomic aspects of sea turtle conservation. In: Biologyof Sea Turtles, Volume II. Lutz, P.L., Musick, J.A.,Wyneken, J. (eds.) CRC Press, Boca Raton, pp. 355-384.
Woody, J.B. (1986) On the dollar value of the Oaxacanridley fishery. Marine Turtle Newsletter 36: 6-7.
WWF (2003) Marine turtles: Global voyagers threatenedwith extinction. WWF International Species Programme,Godalming, UK. 11 pp.
Zahir, H. (2000). Status of sea turtles in the Maldives.Maldives Marine Research Bulletin 4: 43-61.
References

All photos: © WWF-Canon / Sebastian Troëng, except where indicated.
Design: www.thedesignpod.net
FRA
N &
EA
RLE
KE
TLE
Y
The mission of WWF – the global environment network – is to stop the degradation of the planet’s natural environment and to build a future in which humans live in harmony with nature, by:· conserving the world’s biological diversity· ensuring that the use of renewable resources is sustainable· promoting the reduction of pollution and wasteful consumption P
rinte
d on
rec
ycle
d pa
per
mad
e fro
m 1
00 p
er c
ent
post
con
sum
er w
aste
M
ain
fro
nt c
ove
r p
hoto
: W
WF-
Can
on
/ R
og
er le
Gue
n
Bac
k co
ver
pho
to:W
WF-
Can
on
/ C
at H
ollo
way
WWF International Species [email protected]
www.panda.org