economic and technical feasibility of modifying the … · efficiency from 30% to 34%. exhaust from...
TRANSCRIPT

Final Report
Economic and Technical Feasibility of Modifying the Minnesota Valley Power Plant to Utilize Whole Trees
as the Primary Fuel Source
Submitted to XCEL ENERGY
by
ENERGY PERFORMANCE SYSTEMS, Inc. 7767 Elm Creek Blvd., Suite 300
Maple Grove, MN 55369 Phone: 763 416 9095
Fax: 763 416 9001
May, 2003
____________________________ L. David Ostlie, President
Energy Performance Systems, Inc.

LEGAL NOTICE
THIS REPORT WAS PREPARED AS A RESULT OF WORK SPONSERED BY XCEL ENERGY. IT DOES NOT NECESSARILY REPRESENT THE VIEWS OF XCEL ENERGY, ITS EMPLOYEES, OR THE RENEWABLE DEVELOPMENT FUND BOARD. XCEL ENERGY, ITS EMPLOYEES, CONTRACTORS, AND SUBCONTRACTORS MAKE NO WARRANTY, EXPRESS OR IMPLIED, AND ASSUME NO LEGAL LIABILITY FOR THE INFORMATION IN THIS REPORT; NOR DOES ANY PARTY REPRESENT THAT THE USE OF THIS INFORMATION WILL NOT INFRINGE UPON PRIVATELY OWNED RIGHTS. THIS REPORT HAS NOT BEEN APPROVED OR DISAPPROVED BY XCEL ENERGY NOR HAS XCEL ENERGY PASSED UPON THE ACCURACY OR ADEQUACY OF THE INFORMATION IN THIS REPORT.
i

Executive Summary
Conversion of the Xcel Energy Minnesota Valley Generating Plant, located in Granite Falls, MN, to a renewable energy power plant is proposed. This 44 MW pulverized coal power plant, that went into operation in 1953, currently operates infrequently. The project is to repower the Minnesota Valley plant to a 77 MW peak capacity Whole Tree EnergyTM Combined Cycle (WTECC) power plant using farm grown trees as the fuel. With a capacity factor of 80%, this retrofitted power plant will deliver 504,000 MWh per year. The retrofit project was also evaluated without the combustion turbine. The retrofitted WTECC power plant will generate 53 MW peak power from the existing steam turbine-generator and 24 MW from a new combustion turbine-generator with an increase in net total plant efficiency from 30% to 34%. Exhaust from the combustion turbine heats the boiler feedwater, and the economizer and feedwater heaters are bypassed. Exhaust from the boiler heats the combustion air and the air used to dry the fuel. The fuel is provided by harvesting 7800 acres per year of hybrid poplar trees on 40 to 80 acre plots of leased farmland within a 50 mile radius of Granite Falls. These fast growing trees yield a biomass fuel of 25 dry tons per acre after five growing seasons. The dedicated cropland required for the tree farms is 39,000 acres or 1% of the cropland within the 50 mile radius. Special planting and harvesting equipment are being developed to improve tree farming. Harvested trees are delivered whole (not chipped) to a drying dome at the power plant site where they are dried for one month using waste heat from the boiler. The trees are conveyed from the drying dome in whole form and fed into the boiler as tree segments. A water-cooled fixed grate, a dump grate below, and extensive overfire air are added to the boiler. The whole tree segments burn in a 9 ft deep fuel bed where the lowest layer near the grate is wood char, and in the upper layers of the fuel bed the wood is gasified at high temperature. Some char and ash falls through the grate and is burned on a dump grate. Volatiles are burned with the overfire air in the upper part of the boiler. The fuel supply of farm grown hybrid poplar trees will have very positive impact on air quality, wildlife diversity, soil characteristics and water runoff. The power plant itself is clean burning with much less ash than a coal plant. Closed-loop biomass power plants are a practical green power solution to combat global warming. The direct capital cost for the WTECC retrofit is $48.6 million and $29.9 million for the WTE steam cycle only retrofit. The cost of farm grown wood fuel delivered to the plant is $2.81/million Btu, and the assumed cost of natural gas is $3.83/million Btu. The total annual cost is $30.4 million for the WTECC retrofit and $19.3 million for the WTE steam cycle only retrofit. The Bus Bar cost of electricity for the WTECC retrofit is 48.4 mills/kWh and 46.0 mills/kWh for the WTE steam cycle only retrofit in $2003. The Whole Tree Energy™ Combined Cycle retrofit has been scheduled for 36 months, however an accelerated schedule would allow for delivery of commercial power in 24 months. The fuel supply will require 5 years from project start to harvest, and the first 2-3 years of operation will use existing wood resources in Minnesota.
ii

Table of Content EXECUTIVE SUMMARY................................................................................................................................................... II TABLE OF CONTENTS.....................................................................................................................................................III LIST OF FIGURES .............................................................................................................................................................VI PROJECT CONTRIBUTORS.......................................................................................................................................... VII 1. EXISTING MINNESOTA VALLEY POWER PLANT................................................................................................ 1 2. REPOWERING AND RETROFITTING THE MINNESOTA VALLEY POWER PLANT .................................... 2
REPOWERING CONFIGURATION ............................................................................................................................................ 2 COMPUTER MODELING RESULTS.......................................................................................................................................... 2 STARTUP TIMES AND RAMP RATES ...................................................................................................................................... 6 BOILER RETROFIT ................................................................................................................................................................ 7 MODIFICATIONS TO BOILER FOR NEW FUEL FEED SYSTEM.................................................................................................. 8
Water Wall Modifications............................................................................................................................................. 14 Grate for Fuel Bed........................................................................................................................................................ 14 Char Burnout Grate...................................................................................................................................................... 15 Other Boiler Modifications........................................................................................................................................... 15
BOILER PERFORMANCE ...................................................................................................................................................... 15 FLUE GAS FLOWS............................................................................................................................................................... 16 FEEDWATER HEATING EQUIPMENT .................................................................................................................................... 17 EXISTING COMBUSTION AIR HEAT EXCHANGER ................................................................................................................ 19 NEW CONDENSING HEAT EXCHANGER .............................................................................................................................. 19
3. FUEL HANDLING, DRYING AND FEEDING........................................................................................................... 21
BACKGROUND .................................................................................................................................................................... 21 DRYING DOME ................................................................................................................................................................... 21 DRYING AIR DISTRIBUTION SYSTEM.................................................................................................................................. 25 TOWER CRANE AND GRAPPLE............................................................................................................................................ 28 DRAG CONVEYOR .............................................................................................................................................................. 28 SIZING SAW AND RAM FEED SYSTEM................................................................................................................................. 33 FUEL HANDLING ROADWAY............................................................................................................................................... 35 DOME ELECTRICAL DESCRIPTION ...................................................................................................................................... 35
4. FUEL SUPPLY................................................................................................................................................................ 37
SRWC FUEL ...................................................................................................................................................................... 37 CURRENT LAND USE IN THE 9 COUNTY REGION ................................................................................................................ 40 SITE SELECTION ................................................................................................................................................................. 41
Location ........................................................................................................................................................................ 41 Soil Quality ................................................................................................................................................................... 41 Slope ............................................................................................................................................................................. 42 Availability.................................................................................................................................................................... 43 Cost............................................................................................................................................................................... 43
FUEL SUPPLY DEVELOPMENT PLAN ................................................................................................................................... 44 CRP POTENTIAL FOR SRWC ............................................................................................................................................. 46 EXISTING ACREAGE OF SRWC........................................................................................................................................... 46 ECONOMIC IMPACT OF SRWCS.......................................................................................................................................... 47 INITIAL WOOD FUEL SUPPLY ............................................................................................................................................. 47
5. AIR EMISSIONS CONTROL AND WATER RESOURCES...................................................................................... 51
PARTICULATE CONTROL .................................................................................................................................................... 51 ASH HANDLING AND RECYCLING....................................................................................................................................... 53 NITROGEN OXIDE EMISSIONS............................................................................................................................................. 54 CARBON MONOXIDE AND VOC’S ....................................................................................................................................... 54
iii

RIVER WATER AUTHORIZATION......................................................................................................................................... 55 CIRCULATING WATER ........................................................................................................................................................ 55 BOILER MAKEUP WATER ................................................................................................................................................... 55 ASH SLUICING.................................................................................................................................................................... 56 POTABLE WATER ............................................................................................................................................................... 56 SEWAGE SYSTEM ............................................................................................................................................................... 56 OTHER WATER USES.......................................................................................................................................................... 56
6. PERMITS......................................................................................................................................................................... 57
BACKGROUND .................................................................................................................................................................... 57 WATER PERMITS ................................................................................................................................................................ 58
Water Appropriations Permit: ...................................................................................................................................... 58 NPDES Permit .............................................................................................................................................................. 59 Stormwater Discharges................................................................................................................................................. 59 Sewage Treatment......................................................................................................................................................... 60 Cooling Water Intake Structures .................................................................................................................................. 60 Spill Prevention, Control and Countermeasure Requirements ..................................................................................... 60
AIR EMISSIONS PERMITS .................................................................................................................................................... 61 Background................................................................................................................................................................... 61 New Source Review & New Source Performance Standards........................................................................................ 61 New Source Review (NSR) - Prevention of Significant Deterioration .......................................................................... 61 Other Issues .................................................................................................................................................................. 62 Air Permitting Process.................................................................................................................................................. 63
POWER PLANT SITING ........................................................................................................................................................ 63 OTHER PERMITS ................................................................................................................................................................. 63
Local Permits................................................................................................................................................................ 63 Certificate of Need........................................................................................................................................................ 63 Hazardous Waste .......................................................................................................................................................... 64 Fuel Supply Permits...................................................................................................................................................... 64 Ash Disposal on Tree Farm Fields ............................................................................................................................... 64
7. ENVIRONMENTAL IMPACT ..................................................................................................................................... 65
POWER PLANT OPERATIONS............................................................................................................................................... 65 Ash and Particulates..................................................................................................................................................... 67 Sulfur Dioxide Emissions.............................................................................................................................................. 68 Nitrogen Oxide Emissions ............................................................................................................................................ 68 Carbon monoxide and VOC’s....................................................................................................................................... 68 Carbon Dioxide ............................................................................................................................................................ 68
CONSTRUCTION IMPACTS ................................................................................................................................................... 70 OTHER IMPACTS................................................................................................................................................................. 70 IMPACT ON WATER RESOURCES......................................................................................................................................... 70 ENVIRONMENTAL IMPACT OF GROWING THE FUEL SUPPLY ............................................................................................... 71
Wildlife.......................................................................................................................................................................... 71 Air Quality Impact ........................................................................................................................................................ 74 Water Quality Impact.................................................................................................................................................... 74 Soil Quality Impact ....................................................................................................................................................... 75
STARTUP ............................................................................................................................................................................ 76 8. PROJECT COSTS .......................................................................................................................................................... 77
PLANT OPERATING AND MAINTENANCE COSTS ................................................................................................................. 77 FARM-GROWN TREES......................................................................................................................................................... 78 NATURAL GAS - COMBUSTION TURBINE............................................................................................................................ 80 EXISTING FOREST RESOURCES ........................................................................................................................................... 81 CAPITAL COST SUMMARY.................................................................................................................................................. 83 ANNUAL TOTAL COST SUMMARY ...................................................................................................................................... 85
9. PROJECT SCHEDULE ................................................................................................................................................. 87
iv

10. SELECTED REFERENCES ON WHOLE TREE ENERGYTM............................................................................... 96 APPENDICES
APPENDIX 1. EXISTING MINNESOTA VALLEY POWER PLANT EQUIPMENT APPENDIX 2. CRANE SPECIFICATIONS APPENDIX 3. AIR EMISSIONS SPREADSHEETS APPENDIX 4. FUEL COST SUMMARY APPENDIX 5. FUEL SUPPLY DEVELOPMENT PLAN APPENDIX 6. CAPITAL COST SUMMARY APPENDIX 7. WOOD FUEL RESOURCES WITHIN 50 MILE RADIUS OF GRANITE FALLS APPENDIX 8. EXISTING WOOD RESOURCES IN 120 MILE RADIUS OF GRANITE FALLS APPENDIX 9. FUEL SUPPLY PLAN PROFORMA APPENDIX 10. UTILITY ENGINEERING CORP. REPORT
v
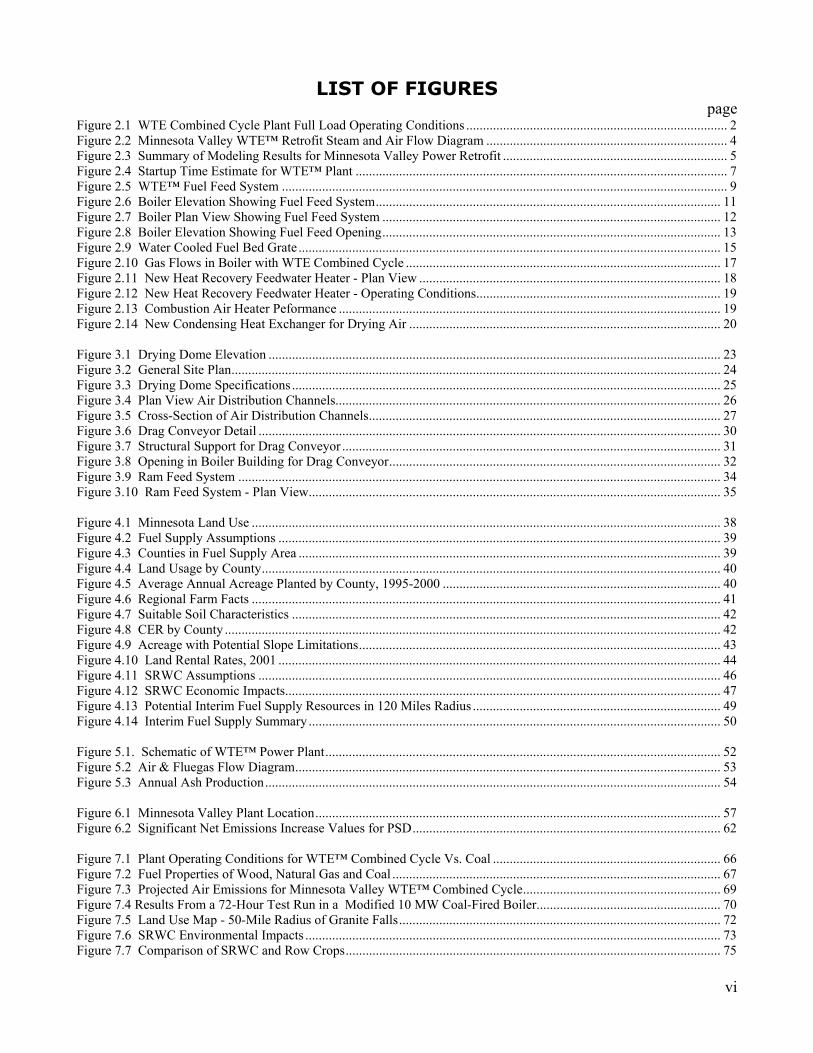
LIST OF FIGURES page
Figure 2.1 WTE Combined Cycle Plant Full Load Operating Conditions .............................................................................. 2 Figure 2.2 Minnesota Valley WTE™ Retrofit Steam and Air Flow Diagram ........................................................................ 4 Figure 2.3 Summary of Modeling Results for Minnesota Valley Power Retrofit ................................................................... 5 Figure 2.4 Startup Time Estimate for WTE™ Plant ............................................................................................................... 7 Figure 2.5 WTE™ Fuel Feed System ..................................................................................................................................... 9 Figure 2.6 Boiler Elevation Showing Fuel Feed System....................................................................................................... 11 Figure 2.7 Boiler Plan View Showing Fuel Feed System ..................................................................................................... 12 Figure 2.8 Boiler Elevation Showing Fuel Feed Opening..................................................................................................... 13 Figure 2.9 Water Cooled Fuel Bed Grate .............................................................................................................................. 15 Figure 2.10 Gas Flows in Boiler with WTE Combined Cycle .............................................................................................. 17 Figure 2.11 New Heat Recovery Feedwater Heater - Plan View .......................................................................................... 18 Figure 2.12 New Heat Recovery Feedwater Heater - Operating Conditions......................................................................... 19 Figure 2.13 Combustion Air Heater Peformance .................................................................................................................. 19 Figure 2.14 New Condensing Heat Exchanger for Drying Air ............................................................................................. 20 Figure 3.1 Drying Dome Elevation ....................................................................................................................................... 23 Figure 3.2 General Site Plan.................................................................................................................................................. 24 Figure 3.3 Drying Dome Specifications ................................................................................................................................ 25 Figure 3.4 Plan View Air Distribution Channels................................................................................................................... 26 Figure 3.5 Cross-Section of Air Distribution Channels......................................................................................................... 27 Figure 3.6 Drag Conveyor Detail .......................................................................................................................................... 30 Figure 3.7 Structural Support for Drag Conveyor ................................................................................................................. 31 Figure 3.8 Opening in Boiler Building for Drag Conveyor................................................................................................... 32 Figure 3.9 Ram Feed System ................................................................................................................................................ 34 Figure 3.10 Ram Feed System - Plan View........................................................................................................................... 35 Figure 4.1 Minnesota Land Use ............................................................................................................................................ 38 Figure 4.2 Fuel Supply Assumptions .................................................................................................................................... 39 Figure 4.3 Counties in Fuel Supply Area .............................................................................................................................. 39 Figure 4.4 Land Usage by County......................................................................................................................................... 40 Figure 4.5 Average Annual Acreage Planted by County, 1995-2000 ................................................................................... 40 Figure 4.6 Regional Farm Facts ............................................................................................................................................ 41 Figure 4.7 Suitable Soil Characteristics ................................................................................................................................ 42 Figure 4.8 CER by County .................................................................................................................................................... 42 Figure 4.9 Acreage with Potential Slope Limitations............................................................................................................ 43 Figure 4.10 Land Rental Rates, 2001 .................................................................................................................................... 44 Figure 4.11 SRWC Assumptions .......................................................................................................................................... 46 Figure 4.12 SRWC Economic Impacts.................................................................................................................................. 47 Figure 4.13 Potential Interim Fuel Supply Resources in 120 Miles Radius .......................................................................... 49 Figure 4.14 Interim Fuel Supply Summary ........................................................................................................................... 50 Figure 5.1. Schematic of WTE™ Power Plant...................................................................................................................... 52 Figure 5.2 Air & Fluegas Flow Diagram............................................................................................................................... 53 Figure 5.3 Annual Ash Production........................................................................................................................................ 54 Figure 6.1 Minnesota Valley Plant Location......................................................................................................................... 57 Figure 6.2 Significant Net Emissions Increase Values for PSD............................................................................................ 62 Figure 7.1 Plant Operating Conditions for WTE™ Combined Cycle Vs. Coal .................................................................... 66 Figure 7.2 Fuel Properties of Wood, Natural Gas and Coal .................................................................................................. 67 Figure 7.3 Projected Air Emissions for Minnesota Valley WTE™ Combined Cycle........................................................... 69 Figure 7.4 Results From a 72-Hour Test Run in a Modified 10 MW Coal-Fired Boiler....................................................... 70 Figure 7.5 Land Use Map - 50-Mile Radius of Granite Falls................................................................................................ 72 Figure 7.6 SRWC Environmental Impacts ............................................................................................................................ 73 Figure 7.7 Comparison of SRWC and Row Crops................................................................................................................ 75
vi

Figure 8.1 Operating Conditions for Retrofit Combined Cycle ............................................................................................. 77 Figure 8.2 Estimated Operating Costs ($2003) ..................................................................................................................... 78 Figure 8.3 Fuel Supply Assumptions .................................................................................................................................... 80 Figure 8.4 Fuel Cost Assumptions ........................................................................................................................................ 81 Figure 8.5 Stumpage Cost Calculation for Existing Timberland Resources ......................................................................... 82 Figure 8.6 Cost Calculation for Existing Timberland Resources .......................................................................................... 83 Figure 8.7 Capital Cost Summary of Retrofit........................................................................................................................ 85 Figure 8.8 Total Annual Costs ($2003) ................................................................................................................................. 86 Figure 9.1 Schedule for WTE™ Retrofit of the Minnesota Valley Plant.............................................................................. 88 Figure 9.2 Poplar Slip Supply Development Schedule ......................................................................................................... 91 Figure 9.3 Tree Farm Development Schedule....................................................................................................................... 92 Figure 9.4 Fuel Supply Development Schedule .................................................................................................................... 93
Project Contributors
This project was supported by the Xcel Renewable Energy Development Fund under Contract No. RDF 2001 BB06. Managers of this project at Xcel were Rick Halet and John Donatell. Dave Ostlie and Ken Ragland of Energy Performance Systems, Mike Gilbertson of Inventure, and Rich Andresen of Tee Array Consulting carried out this project. Mark Holmberg, Doru Posteuca, Frank Qie, Tony Witkowski and others at Utility Engineering participated in a subcontract regarding some of the power plant design aspects of the project. Lynn Wright from Oak Ridge National Laboratory assisted with the environmental impact assessment of growing short rotation woody crops in Minnesota. Bill Berguson of the Natural Resource Research Institute, Ernie Schmidt of the Minnesota DNR, and Don Remenschnider of the Wisconsin DNR provided input on the fuel supply. Dale Claridge and Libby Henderson of Wenck & Associates consulted on the water and air permits. Minnesota Valley power plant operators Sean Skogrand and Don Berends were most helpful in running power plant tests and providing design and operation details.
vii
1. Existing Minnesota Valley Power Plant The Xcel Energy Minnesota Valley Generating Plant is located in Granite Falls, MN, in the southwestern part of the state. The plant has one operating pulverized coal fired boiler (Boiler #4) and one operational steam turbine-generator (Unit 3). This equipment went into operation in 1953 and is rated at 44 MW. Currently the plant does not run on a regular basis. The plant also has three retired boilers and two retired steam turbines. The Minnesota Valley plant can receive coal by train or truck. The coal is transferred from the coal yard to a bunker in the powerhouse via a crusher building and a conveyor. The coal travels from the bunker to three pulverizers and is blown into the boiler by six burners located on the west side of the boiler. The two-drum boiler has a working pressure of 1500 psig and produces up to 425,000 lb/hr of superheated steam at 950°F. The steam cycle has four feedwater heaters and a deaerating heater but no reheat. The once-through cooling system takes water from the Minnesota River for the condenser, and the water is returned to the river via an outlet structure downstream. Ash from the boiler is sent to settling ponds located east of the powerhouse. The exhaust from the boiler flows through an electrostatic precipitator prior to going to the 350 ft stack. In June 2002 the Minnesota Valley plant was run on coal at peak load for four hours and test data was obtained. The net power generated was 46 MW and the net plant efficiency was 31.0% with a corresponding heat rate of 11,179 Btu/kWh. Further details of the performance test are given in the next section of the report. Natural gas is available at the plant to provide up to a 13 MW load. The Great Plains gas pipeline just across the river has sufficient capacity to supply a full load but a different metering arrangement at the town-border station across the river is needed to do so. For the retrofit the rail spur that runs into the coal yard would need to be removed to make way for the drying dome. Since Xcel owns the spur, no problem is anticipated with its removal. US highway 212 provides excellent access to the plant. Highway 212 has two lanes going east and one lane going west. A turning lane going west onto power plant property may be desirable. Many excellent state and county highways serve the area. The vintage and condition of the transformers were not determined. In the 1960’s the power plant apparently generated 75 MW when the two older units were operated along with the current 44 MW unit. Additional listing and description of the existing power plant equipment are given in Appendix 1.
Existing Power Plant 1

2. Repowering and Retrofitting the Minnesota Valley Power Plant
Repowering Configuration The basic operating conditions of the retrofit combined cycle power plant are summarized in Figure 2.1. A flow diagram for the retrofit plant is shown in Figure 2.2. The steam cycle (WTE) portion of the retrofit plant has a full load net power output of 48 MW at full load. For design purposes a capacity factor of 80% is assumed. To improve efficiency and increase output, a 24 MW combustion turbine (GTD1) is added as shown. Two new heat exchangers (HX2 and HX4), located in the same enclosure, are added to utilize the exhaust from combustion turbine to preheat the boiler feedwater. During combined-cycle operations the retrofit power plant bypasses the existing feedwater heaters (FWH1, FWH2, FWH3, and FWH4) and the existing economizer (ECON1).
Figure 2.1 WTE Combined Cycle Plant Full Load Operating Conditions
Factor Units Specification Source
Total net power, WTE Combined Cycle
MW 72 From GateCycle model
Capacity factor % 80 Design specification
Net annual output MWh 505,000 Calculation
Net power plant efficiency % 33.7 From GateCycle model
Net power plant heat rate Btu/kWh 10,130 From GateCycle model
Wood feed rate dry lb/hr 70,900 From GateCycle model
Natural gas flow rate lb/hr 10,646 Calculation
In the combined cycle mode the feedwater flows from the condenser (CND1); to the first heat exchanger (HX4); to the deaerator (DA1); to the second heat exchanger (HX2); and to the boiler drum (DRUM1). Steam flows out of the boiler (FB1); through the steam turbine (ST1 and ST2); and on to the condenser (CND1). Flue gas from the boiler flows around the economizer (ECON1, which is bypassed); to existing the air heater (HX1); to a new heat exchanger (HX3), that heats air for the drying dome; and to the electrostatic precipitator (ESP) and exhaust stack. In Figure 2.3 the symbols SP are slitters that direct the flow depending on the mode of operation (combined cycle or existing configuration) and the symbol M refers to a mixer which joins two flows. When modeling the existing configuration, SP4 directs all the feedwater flow to the feedwater heaters; the extractions from the steam turbine (ST) are activated; ECON1 is activated; and GTD1, HX2 and HX4 are shut down. In addition, when modeling the URGE test, HX3 was bypassed since that feedwater heater was down. Computer Modeling Results Computer modeling of the existing and repowered plant was done using GateCycle, version 5.4 (GE Energy and Industrial Services, Inc.). The GateCycle program is a PC-based software program that performs detailed, steady-state design analyses of thermal power systems using a Windows 2000 operating system. A specific GateCycle model is built up from a palette of component equipment (equipment icons) that are connected to make a flow network. Mass and energy balance calculations are done for each link of the network.
Repowering and Retrofitting 2

Figure 2.3 summarizes the main results from the modeling. For the Minnesota Valley plant, the steam flow rate at the turbine inlet is rated at 425,000 lb/hr maximum for a 4 hr period and 385,000 lb/hr for long duration. The steam pressures were set at the conditions of the URGE test: 1315 psia at ST1 inlet, 1435 psia at DRUM1 and 1665 psia at PUMP4, and the steam temperature at ST1 inlet was set at 957°F. Pressure drop in the links and heat exchangers was not modeled at this time. The isentropic efficiency of the steam turbine was set at 82% based on a good match between the model and the URGE test data. The condenser pressure was set at 1.5 psia (115°F). The deaerator was operated at 50.6 psia for the combined cycle cases. Blowdown from the drum was assumed to be 2,000 lb/hr for wood fuel and 5,000 lb/hr when using coal (Note: during the URGE test, the blowdown was zero). Air for the drying dome was set at 132°F and the drying air flow rate was set at 45 times the wood feed rate based on previous dying tests. The gas turbine was modeled using the parameters of the LM2500, which is built into GateCycle. The net power of the gas turbine (GT1) was adjusted to yield a feedwater temperature to the drum of 460°F for the full load case. Note that the drum saturation temperature is 590°F at 1434 psia, and the feedwater temperature out of the economizer (ECON1) reached 432°F during the URGE test with the high pressure feedwater heater down. In the model the fuel input to the boiler was adjusted until the desired steam flow rate was obtained. Other assumptions used in the modeling are given in Figure 2.3. In the combined cycle maximum load case the gas turbine generates 24.3 MW and the steam turbine 53.3 MW for a total output of 77.6 MW at a net plant efficiency of 33.3% (net plant heat rate of 10,239 But/kWh). At 385,000 lb/hr of steam, the net power output is 72.0 MW at essentially the same efficiency. The steam cycle efficiency and power output are higher in the combined cycle case than for the existing case because the feedwater is heated by the gas turbine exhaust rather than with extracted steam. The net steam plant efficiency for the combined cycle case was 34.3%, whereas for the existing configuration the net efficiency is 29.2%. The steam flow to the condenser is 21% higher for the maximum output (77.6 MW) combined cycle case and 14% higher for the 72 MW combined cycle case compared to the URGE test. For the URGE test (using low moisture, low sulfur, bituminous coal) the measured net plant efficiency was 30.5%, which is slightly higher than the wood case (29.2) due to the higher moisture in the wood (23% versus 5.6% moisture for the test coal). The new feedwater heat exchangers HX2 and HX4 have a surface area (calculated in GateCycle) of 32,500 ft2 and 55,800 ft2, respectively. The new heat exchanger for the drying dome (HX3) has a calculated surface area of 35,000 ft2. The existing combustion air heater (HX1) has a surface area or 70,900 ft2, and the existing economizer (ECON1) has a surface area of 6,650 ft2.
Repowering and Retrofitting 3
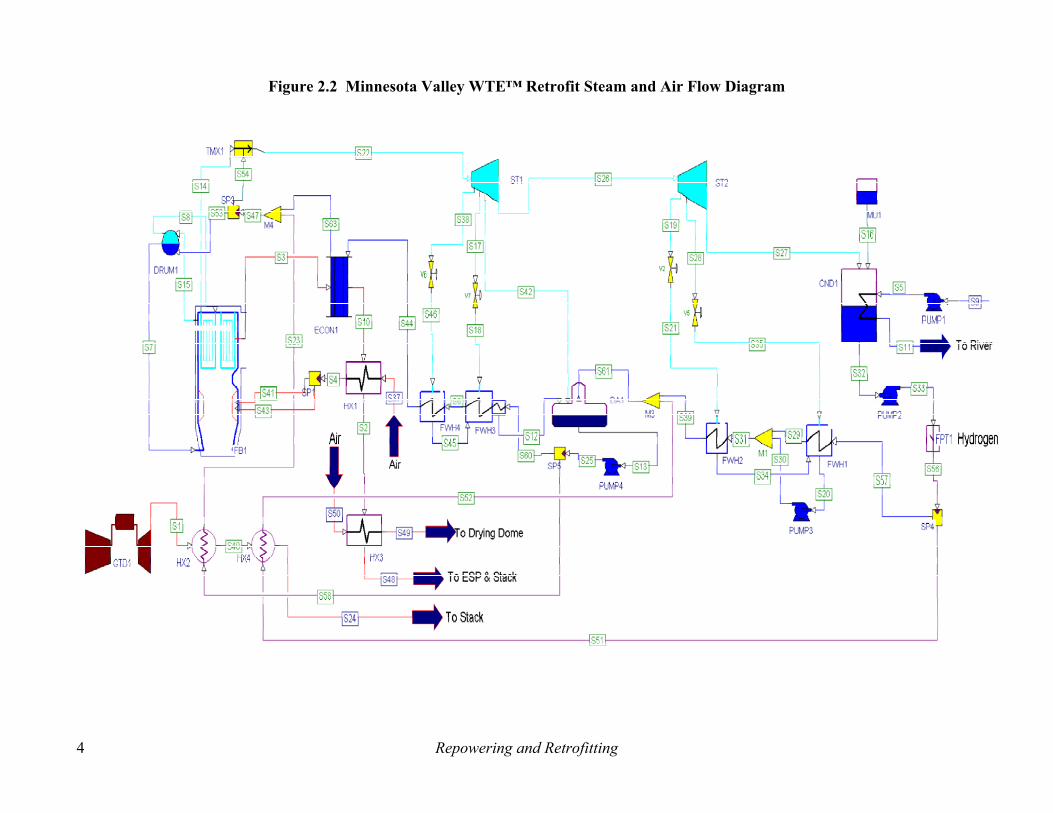
Figure 2.2 Minnesota Valley WTE™ Retrofit Steam and Air Flow Diagram
Repowering and Retrofitting 4

Figure 2.3 Summary of Modeling Results for Minnesota Valley Power Retrofit
WTE™ Combined Cycle Coal Operations
Parameter
WTE-CC (Peak Steam)
WTE-CC (Full Load)
WTE Only
Coal Only
Coal Urge Test
Steam flow to ST, lb/hr 425,000 385,000 385,000 385,000 397,860(2)
Total net power, MW 77.6 72.0 43.1 42.4 46.3
ST net power, MW 53.3 47.7 43.1 42.4 46.3
GT net power, MW 24.3 24.3 - - -
Net plant efficiency, % 33.3 33.7 29.2 30.0 31.0
Net plant heat rate, Btu/kWh 10,239 10,130 11,701 11,366 11,179
Net steam plant efficiency, % 33.7 34.3 29.2 30.0 30.5
Net steam cycle efficiency, % 42.9 43.3 37.9 37.5 37.7 (3)
Net GT efficiency, % 31.8 31.8 - - -
Boiler efficiency, % 80.4 81.1 82.1 86.2 88.7 (3)
Steam extraction to DA, lb/hr 21,500 15,000 14,370 14,710 19,070**
FW temperature to boiler, °F 461 477 430 448 429
Solid fuel feed rate, lb/hr(ar) 80,600 70,900 75,370 50,520 40,440
Boiler air flow rate, lb/hr 416,000 366,000 398,000 413,500 413,630 (3)
Boiler air preheat, °F 720 720 604 580 590
Flue gas flow rate, lb/hr 496,600 436,900 473,730 461,730 450,020 (3)
Nat. Gas flow rate, lb/hr 10,646 10,646 - - -
Steam flow to condenser, lb/hr 403,500 370,000 286,000 285,500 319,240 (3)
Circulating water temp rise,°F 28.5 26.3 20.2 20.2 22.5
Drying air flow rate, 1000 lb/hr 2,800 2,500 2,600 - -
Notes: (1) Best fit to URGE data using model; test data readings were 435,000 lb steam/hr and 385,000 lb water/hr, which
indicates instrumentation error in one or both readings. (2) All efficiencies, including GT efficiency, based on HHV. (3) Model calculation.
Nomenclature: WTE-CC = Whole Tree Energy Combined Cycle, feedwater heaters & economizer bypassed WTE only = Whole Tree Energy without GT, active feedwater heaters & economizer Coal only = sub-bituminous coal without GT or HX3, active FW heaters & economizer Coal test = URGE test data using low moisture, low sulfur bituminous coal without GT or HX3, with high pressure FW heater bypassed, other FW heaters & economizer active GT = gas turbine ST = steam turbine FW = feedwater DA=deaerator
Repowering and Retrofitting 5
HHV = higher heating value HX – heat exchanger ar = as-received basis
Key Assumptions: Gas Turbine type LM2500 (General Electric Co.) Ambient conditions, 50°F, 14.23 psia (890 ft elevation), 60% relative humidity Steam conditions at turbine inlet, 957°F, 1315 psia Steam turbine efficiency, 82% Steam condenser pressure, 1.5 psia Circulating water to condenser, 13 million lb/hr Auxiliary and balance of plant power, 5% (excluding FW pumps) HHV: wood 6700 Btu/lb; URGE test coal 12,564 Btu/lb; coal (Decker subbituminous) 9540 Btu/lb (all fuels as-received basis) Wood proximate analysis: 0.15 fixed carbon, 0.613 volatile matter, 0.007 ash, 0.23 water Wood ultimate analysis: 0.500 carbon, 0.060 hydrogen, 0.440 oxygen (dry ash free basis) Coal (URGE test) proximate analysis: moisture 0.0575, ash 0.0949, sulfur 0.0071. Coal (URGE test) ultimate analysis (assumed): 0.78 carbon, 0.053 hydrogen, 0.14 oxygen, 0.02 nitrogen, 0.0007 sulfur (dry ash free basis) Coal (Decker subbituminous) proximate analysis: 0.4137 fixed carbon, 0.3125 volatile matter, 0.0398 ash, 0.234 water Coal (Decker subbituminous) ultimate analysis: 0.76 carbon, 0.053 hydrogen, 0.1724 oxygen, 0.01 nitrogen, 0.0046 sulfur (dry ash free basis) Excess air for combustion, 15% Natural Gas higher heating value, 23,880 Btu/lb Air to drying dome 45*dry wood feed rate, air heated to 132°F Blowdown is 2000 lb/hr from drum for wood and 5000 lb/hr for coal; makeup at condenser is from a demineralizer; URGE test had zero blowdown.
Startup Times and Ramp Rates For the WTE™ plant, the startup time prior to load ramp includes the cumulative time it takes to rebuild the main fuel bed, start the bed burning, and bring the boiler to a minimum operating temperature (Figure 2.4). Rebuilding the main fuel bed requires injecting multiple batches of trees onto the main grate. How long this step takes depends on the cycle time of the fuel feed system. After the bed reaches some minimum size for startup (estimated at 30 dry tons), the bed is ignited using gas burners under the main grate. A short time is needed before the bed is fully ignited and able to generate significant heat. Once the bed is reacting, the entire mass of the furnace and boiler needs time to heat up to a minimum temperature before power can be efficiently produced. The time for this step should be comparable to the coal-fired power plant. In either case, normal operating procedure for the Minnesota Valley plant is to heat soak at an output of 2.5/3.0 MW for 20-30 minutes before building to desired output. Ramp rate measures how long it takes to bring a plant from a low load to a higher load level. For the Minnesota Valley plant, the rule-of-thumb has been to bring the plant up at about 1 MW/min from 2.5/3.0 MW to full load. The recommended ramp rate of 1 MW/min is based on turbine operating limitations rather than potential heat output of the fuel.
Repowering and Retrofitting 6

Figure 2.4 Startup Time Estimate for WTE™ Plant
Factor Units Value Comments
Ram fueling cycle minutes 2 Design specification
Minimum fuel load for startup
dry tons 30 Design specification
Fuel batch size dry tons 6 Calculation
Number of batches required
5 Calculation
Total fuel loading time minutes 10 Calculation
Time to ignite fuel minutes 3 Estimate based on testing
Time to heat boiler/ turbine to minimum dispatch level
minutes 20-30 Data from Minnesota Valley plant
Total cold startup time minutes 33-43 Calculated
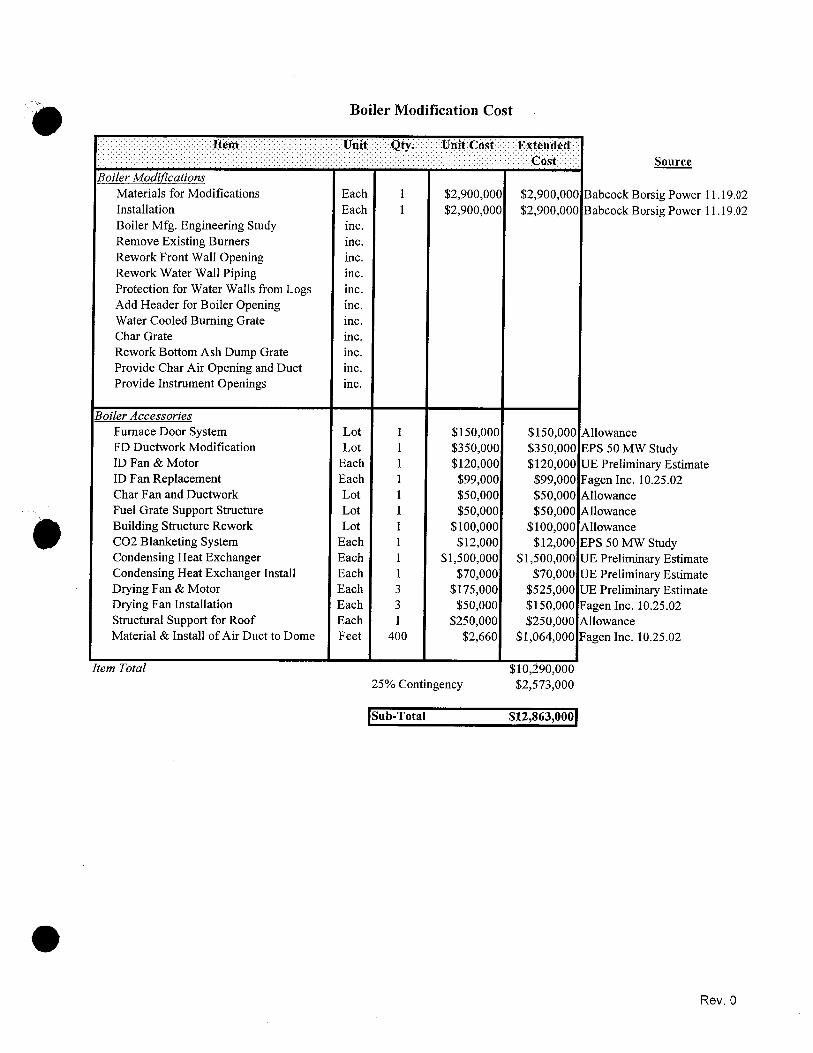
Assumes cold start with no fuel in main burn pile. Boiler Retrofit The Riley-Stoker Corp Boiler # 4 was placed in service in November 1953 and was originally rated at approximately 45 MW when firing with Western Kentucky coal (boiler serial number 2895; YPR-22 plus WW boiler; two drum; working pressure 1500 psig; heating surface-water walls, 12,584 ft2; convective heating surface, 2450 ft2; furnace volume 30,400 ft3; water cooled furnace envelope 6500 ft2 steam capacity 385,000 lb/hr; one hour peak capacity 425,000 lb/hr). The boiler was converted in 1974 to burn low sulfur sub-bituminous Western coal, resulting in a boiler derate to approximately 40 MW. Currently, the plant #4 boiler is maintained for use in emergencies but requires advanced trucking of large quantities of coal to the site. In June 2002, a four-hour URGE test of the Minnesota Valley plant generated 46 MW of capacity with bituminous coal. Converting the boiler for WTE™ requires significant internal and external modifications. Utility Engineering, Inc. had a subcontract to detail the modifications, and their report is found in Appendix 10. As part of this subcontract Babcock Borsig Power, Inc, manufacturer of the original equipment, reviewed the proposed boiler modifications, provided a cost estimate, and explained their design concerns (contained in Appendix 10). With the WTE™ system, combustion is divided into three distinct stages. In the first stage, the deep-bed of whole tree segments is supported by the fixed water-cooled grate. The fuel near the grate is primarily carbon char that is exposed to air, and the char temperature is very high (> 3000°F). In the upper two-thirds of the bed oxygen is no longer present and the wood gasifies under sub-stoiciometric conditions. Because of the drying and devolatilization of the wood, the solids temperature is expected to be 2000 to 2100°F and the gas temperature decreases towards the solids temperature near the top of the bed. In the second stage, volatiles released from the bed are combusted in the volume above the bed at temperatures of 2700°F or so with the addition of overfire air. In the third stage, char from the bottom of the deep bed falls through the grate and is burned on a smaller lower grate
Repowering and Retrofitting 7

Converting boiler #4 to WTE™ will require modifications to the existing waterwalls and exterior structure to accommodate the new fuel feed system, combustion grate and char burnout grate. Openings in the boiler wall will also be added for new overfire air nozzles, underfire air ports and new instrumentation ports. The existing coal injection ports will be removed. Additional modifications to boiler auxiliary equipment have been identified in conjunction with modifications to the boiler. The wood drying system uses boiler flue gas waste heat extracted by a new condensing heat exchanger. Two new large capacity blowers provide fresh air to the condensing heat exchanger and subsequent ductwork to the drying dome. The existing forced draft fan ductwork requires rerouting to allow for an adequate air supply of overfire and underfire air. An additional fan is required for the air-cooled char burnout grate. A new induced draft fan and ductwork are needed for the condensing heat exchanger. In addition, a CO2 blanketing system is needed for fire protection. Modifications to Boiler for New Fuel Feed System The WTE™ fuel feed system uses a pair of rams as shown in Figure 2.5 and Figure 2.6 to first load the charging pit and then to feed the fuel load into the boiler. At the appropriate time in the fuel loading cycle, the charge pit isolation gate opens allowing the charge pit ram to push each batch of trees into the furnace on top of the fuel bed. The charge pit ram retracts and the furnace isolation gate closes in preparation for the next batch of fuel. When closed, the door maintains an air and heat seal around its perimeter to maintain efficient furnace operation. During plant operation, the charge pit door and the charge pit isolation gate are never open at the same time. The charge pit isolation door allows batches of trees 24 feet in length (nearly the width of the furnace inside the water wall) to be pushed onto the deep bed. Each load will weigh up to 6 dry tons (For more information on the fuel feed system see Fuel Handling section).
Repowering and Retrofitting 8

Figure 2.5 WTE™ Fuel Feed System
Char Burnout A
���������
������������������
������������������
����������������������������
������������������������������������
��������������������������������������������������
�����������������������������
������������������������
����������
����������
��������������
����������������������
����� ����������
����������
����������������
����������������������������������������������������������������������������������
������������
����������
������������
����������������
�����������������
���������������
����������������
������������
Steam Generator
Hydraulic Ram
Ash Pit
Charge Pit Door
Furnace Ram
Char Burn Out Zone
Deep Bed
Volatile Gas Combustion
Zone
Water Cooled Grate
Overfire Air
Underfire Air
Drag Conveyor
Isolation Gate
Dump Grate
Char
In order to feed large batches of wood fuel into the boiler, a 24 ft x 8 ft opening will be made in thefront wall. The bottom edge of the fuel feed opening will be at elevation 928 ft. The opening will require the removal of up to 192 square feet of boiler wall and water wall area in front of this openi(see Water Wall Modification section below). While this opening in the side of the boiler is larger than typically used, large isolation gates and rams faces have been used in mass burn boilers. The opening is 1.5% of the water wall surface, and this amount of heat transfer will be more than made by heat transfer to the water cooled grate. The charge box structure will tie into this new opening providing leak resistant charge pit for loadinfuel directly into the boiler. The existing external structural members forming the skin of the existiboiler will require the addition of new structural framing to support the upper and lower portions ofwall and integrate the charge pit structure, the isolation gate and furnace ram mechanisms. Clearan
Repowering and Retrofitting
���Underfire Air
ir
������
Burnout Air
ng
up
g ng the ce
9

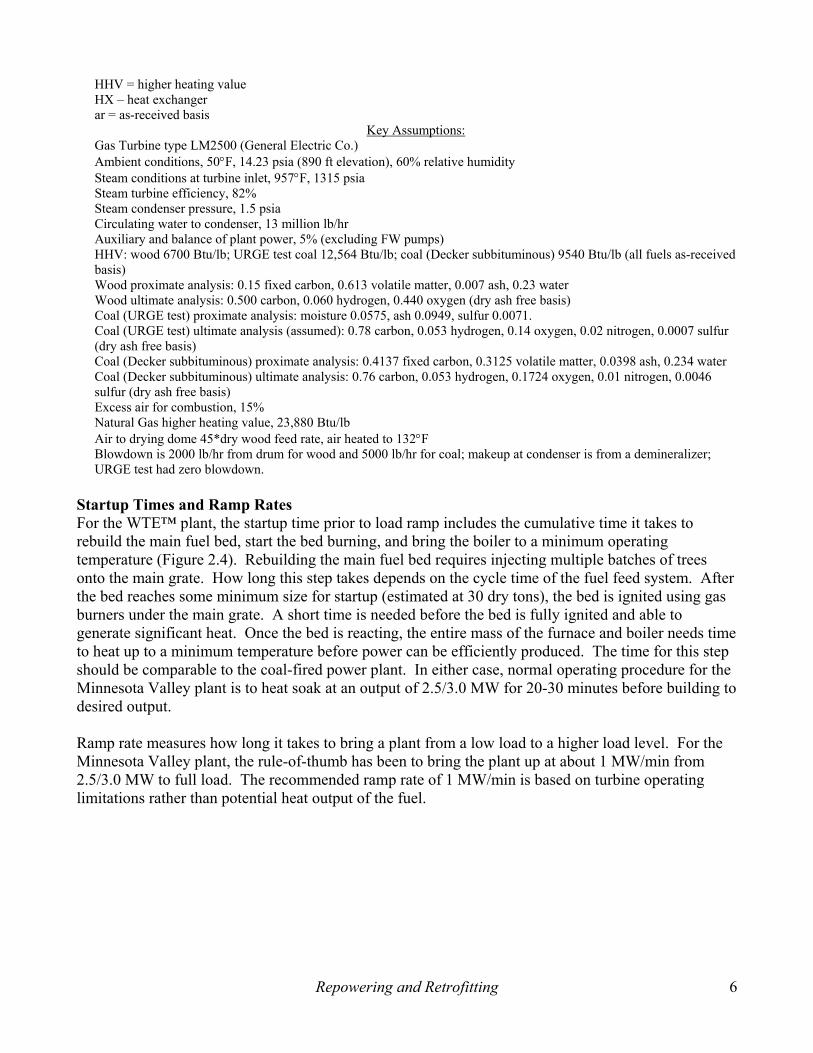
for the new water wall headers - required to bridge the fuel feed opening - will also need to be considered in the final design. Demolition of the existing coal storage and crushing systems will be required to provide clearance for the fuel drag conveyor and the fuel feed rams. The face of the charge pit isolation gate is lined with high temperature, high reflectivity refractory material that withstands exposure to the 2200°F reducing conditions at the top of the fuel bed. The normal fuel charging time is about 1 min. The face of the charge pit ram will see furnace temperature only for about 10 s after the fuel charge has been pushed into the furnace and the isolation gate is closing. Otherwise the fuel charge with 23% moisture acts as a shield for the ram face. There is no requirement for sealing the ram face because the charge pit is isolated during the charge cycle, however, seals around the piston and guide interface with the rear bulkhead of the charge pit are needed. The temperatures and stresses experienced in the charge pit will vary by section and during each fuel feed cycle. The charge pit ram will be built using a combination of high temperature insulation, refractory materials, cast alloy tile, high temperature gasketing materials and water-cooled steel jacketing. Heat transfer analysis including cooling of the charge pit are to be a part of the detailed design process. Another design consideration to ensure reliable, fail-safe operations is avoiding the possibility of a fuel jam or misfeed caused by branches or debris stuck in the charge pit doors or ram systems. The charge pit door will be designed with a built-in sheer along its edge to cut any branches blocking its from closing. Although the preliminary sketches show the charge pit isolation door closing vertically from the bottom to the top of the charge pit, it may prove easier to seal the door and maintain a smooth obstruction free surface by having the door close down from the top. Details such as this will be worked out during the detailed design phase. Most of the modifications and components required to accommodate the new fuel feed system will be site-built. Examples include fabricating and insulating the charge pit box, reinsulating the opening in the boiler wall and adding new structural support members. Some components such as the rams, charge pit door and charge pit isolation door will likely be fabricated off-site by various contractors. While the boiler modifications are a technical challenge, they will use existing technologies and materials commonly used in the power industry. Other views of the feed system are shown in Figures 2.7 and 2.8.
Repowering and Retrofitting 10
Figure 2.6 Boiler Elevation Showing Fuel Feed System
UE drawings D010783-006S009 Sectional Elevation Looking South, in Appendix 10.
Repowering and Retrofitting 11
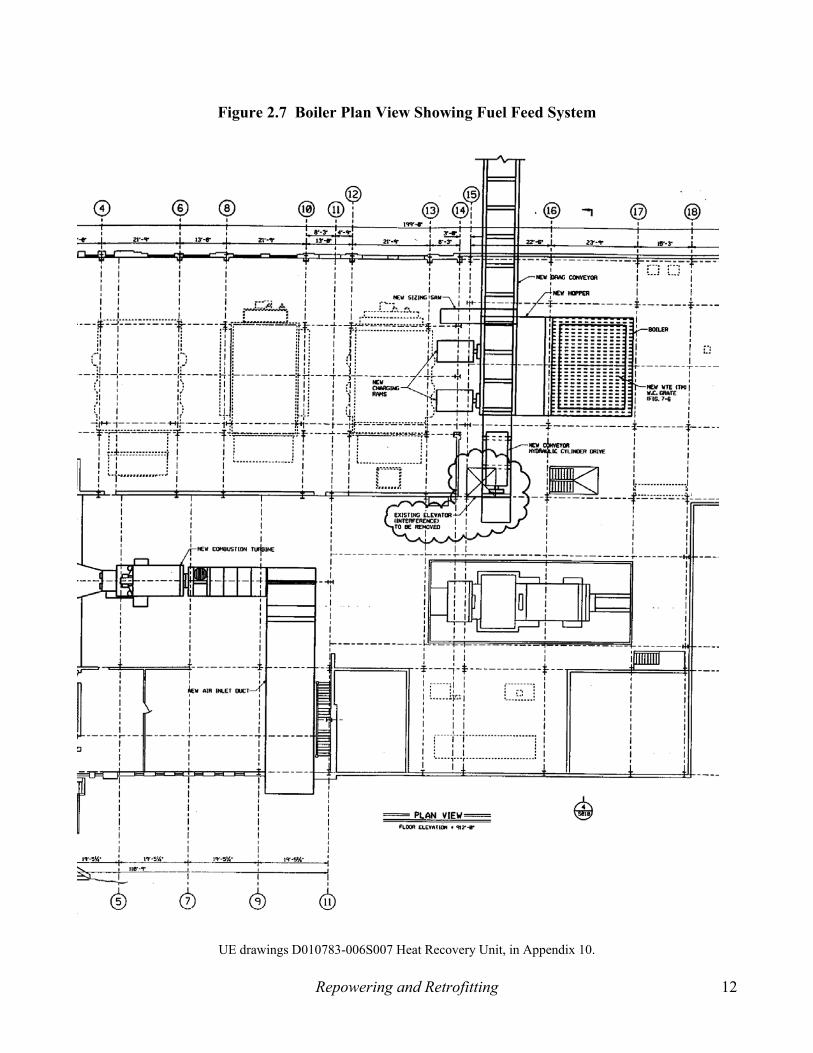
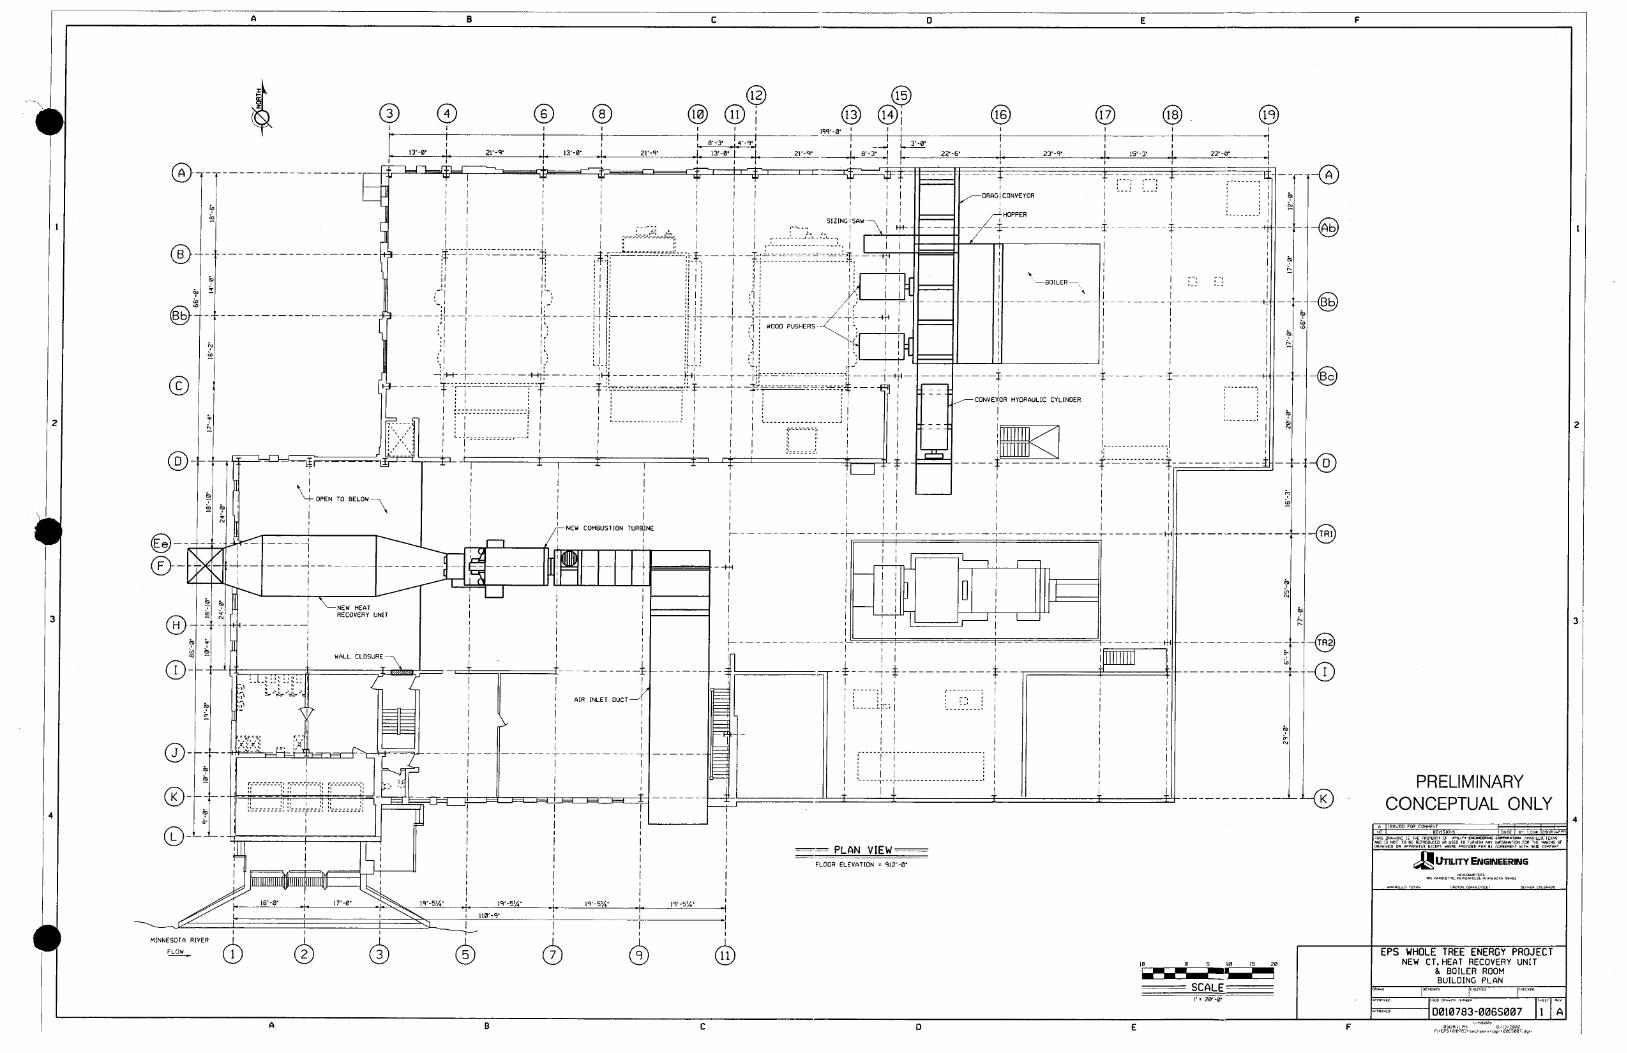
Figure 2.7 Boiler Plan View Showing Fuel Feed System
UE drawings D010783-006S007 Heat Recovery Unit, in Appendix 10.
Repowering and Retrofitting 12

Figure 2.8 Boiler Elevation Showing Fuel Feed Opening
UE drawings D010783-006S008 Section 4 Looking West, in Appendix 10.
Repowering and Retrofitting 13
Water Wall Modifications Currently, several openings in the water wall provide access for coal injectors, firing air ducting, gas and oil burners and instrumentation ports. Converting the existing boiler to burn whole trees will require changes to the water wall to provide openings for additional overfire air ports and the wood fuel feed system. Other minor modifications may be required for new instrumentation and viewing ports. The overfire air ports will be situated above the top elevation of the new fuel feed opening. The exact number and size of these ports will be determined during the detailed design stage. The overfire ports will be designed to maintain even mixing of air and volatile compounds to ensure complete combustion while minimizing nitrogen oxide formation. For the new fuel feed port a system of headers will be designed and fabricated to direct the water-wall piping around the opening on the back wall of the furnace and reconnect with a matching header system above the opening. The lower header and piping will need to be protected from potential damage as each load of trees is injected into the furnace. Minor modifications to the water wall will be needed to accommodate the structural supports for the new combustion grate. These modifications will use standard components. As part of the boiler performance analysis, the impact of these changes in the existing water wall be analyzed and considered in the final design. Grate for Fuel Bed A fixed, water-cooled combustion grate approximately 24 ft long x 20 ft wide will be fabricated and mounted about 12 ft below the fuel feed system opening at an elevation of 910.0 ft (Figure 2.6). The grate will consist of a network of 3 in. diameter heavy-walled tubes mounted in parallel sets of three tubes welded together vertically with each set on 9 in. centers (Figure 2.9). The openings in the grate between the tubes allow particles of char to drop down to a secondary char burnout grate below and allow underfire air to flow evenly up through the main burn bed. The grate tubing will run from front to back of the boiler perpendicular to the orientation of the pile of trees in fuel bed. Segmented high temperature alloy wear bars are welded longitudinally along the top tube of each set to provide a wear surface to protect the combustion grate from damage. All the grate tube sections will be headered together at both ends and connected to the main feedwater to provide continuous cooling water to the grate. The grate will be designed to withstand the a 70 ton load of fuel and to absorb the intermittent forces generated from up to 6 dry tons of trees fed from above during each fuel charge cycle. The grate design needs to take into account that the temperature just above the grate where the air meets the carbon char will be in excess of 3000°F. The grate is to be sloped slightly and made vertically adjustable by using spool pieces in each corner.
Repowering and Retrofitting 14

Figure 2.9 Water Cooled Fuel Bed Grate
���������������������������������������
���������������������������������������������������������������������������
������������������������������������������������������������������������������
���������������������������������������
���������������������������������������
���������������������������������������������������������������������������
������������������������������������������������������������������������������
������������������������������������������������������������������������������
������������������������������������������������������������������������������
���������������������������������������
Water Filled Tubes
Welded Alloy Segmented Wear Bars
Char Burnout Grate A new dump grate for holding unburned char and ash will need to be installed below the main grate. The dump grate will be approximately 5 ft wide and extend the width of the furnace. This grate will be mounted at an elevation of about 892.0 ft in the lower portion of the boiler about 17 ft below the main grate and just above the ash sluice pit. The char grate will consist of movable slats that remain closed except for a brief intermittent dump of ash into the existing ash pit. The char burnout grate will be air cooled with small holes that provide the char burnout air. Other Boiler Modifications Other required boiler modifications include:
• Remove existing coal burner equipment and ports. • Pressure part water wall modifications to eliminate the existing coal burner openings: -Upper row of three burners ~ elevation 929'-6"will be replaced with straight tubing -Lower row of three burners ~ elevation 916'-6" will be removed and no new tubes are required due to the new fuel chute being added in this location.
• Add instrumentation water wall openings. • New furnace observation doors will also be added at the appropriate locations requiring openings in the furnace wall and minor modifications to existing water wall piping.
Boiler Performance Converting the boiler from pulverized coal firing to deep fixed bed combustion rises the issue that the heat transfer profile in the boiler may change. However, since the deep fixed bed combustion system can operate over a wide range of air flows, bed heights and underfire/overfire air ratios, necessary adjustments can be made during initial startup tests. During these tests the best set of operating conditions to maintain desired superheat temperatures and steam loads will be determined. The boiler
Repowering and Retrofitting 15

contractor needs to evaluate the past deep fixed bed combustion test data and modeling information obtained to date and participate in the startup tests. The primary grate area is 480 ft2and the design heat input for maximum power from the steam turbine is 540 million Btu/hr, or 1.1 million Btu/hr- ft2. Previous field tests and modeling have shown that this heat release rate is readily achievable with a deep fixed bed of whole trees with a 6 ft to 9 ft deep bed with under-grate air velocities of 3 ft/s to 4 ft/s. A deeper bed and higher air velocities will give a greater heat release rate. Underfire-to-overfire air ratios of near one are expected but the design should allow for a ratio of 0.75 to 2.0 with stoichiometries of 0.55 to 0. 65 at the top of the fuel bed. The distance from the top of the bed to the nose of the boiler is 34 ft so that the residence time is 2-3 s, which allows sufficient time to complete combustion. In addition to the boiler retrofit requirements noted above, the boiler contractor should complete a comprehensive boiler assessment and design study. The study will provide the following information:
• Assessment of the condition of the boiler; • Assessment of the capability of the retrofitted boiler to make full load; • Design of boiler retrofit modifications to insure good boiler circulation without hot spots; • Specification of sootblowers changes, if any; • Design of ducting for adequate combustion air flows; • Design of overfire air system.
The overfire air nozzle design must provide for complete burnout of the gasified fuel above the bed at low excess air while maintaining the lowest possible nitrogen oxide emissions. During startup tests the overfire air system will need to be tuned to best operating conditions in relation to the fuel bed height, underfire air flow rate, air preheat, and steam load. The overfire system needs to accommodate a range of operating conditions. Flue Gas Flows The GateCycle model of the WTE combined cycle was used to determine the total air flow rate and wood feed rate required to meet the steam load. At the high steam flow rate of 425,000 lb/hr with an excess air of 15%, the flow rate of under-grate air is 208,000 lb/hr and using a 50/50 split, the over-bed air flow rate is also 208,000 lb/hr. The flow rate of combustion products is 496,600 lb/hr. Using estimated temperatures at the top of the fuel bed and top of the furnace, the gas velocities in the furnace are calculated as shown in Figure 2.10. The furnace volume allows for a wide range of bed depths, air flows and heat release rates.
Repowering and Retrofitting 16

Figure 2.10 Gas Flows in Boiler with WTE Combined Cycle
Factor Peak Steam Full Load Steam flow rate, lb/hr 425,000 385,000 Wood feed rate, lb/hr 80,600 70,900 Heat release per unit area, Btu/hr/ft2 1,000,000 890,000 Under-grate air flow, lb/hr 208,000 183,000 Under grate air temperature,°F 720 720 Under-grate air velocity, ft/s 3.3 2.9 Temperature at top of bed,°F 2200 2200 Gas flow at top of bed, lb/hr 288,600 253,900 Gas velocity at top of bed, ft/s 10.3 9.1 Temperature at top of furnace, °F 2100 2100 Gas flow at top of furnace, lb/hr 496,600 436,900 Gas velocity at top of furnace, ft/s 17.0 15.0
The existing forced draft fan is a Buffalo Forge No. 12 “SLD” fan capable of moving 135,000 cfm at 12.6 in. water gauge pressure, which is satisfactory for the anticipated air flows. An internal visual inspection of this FD fan in 1991 indicated that this fan was in good condition. The existing induced draft fan is a Buffalo Forge No. 15.5 “SHLD” fan capable of moving 215,000 cfm at 13.5 in. water gauge pressure. Maintenance records show that the fan blading was replaced in 1976, and a 1991 inspection indicated the fan was in good condition but inlet swirl vanes were badly eroded. The flow rate is adequate but the fan may need to be replaced. Feedwater Heating Equipment In the current plant two low pressure (#31 and #32) and two high pressure (#34 and #35) Foster Wheeler feedwater heaters use turbine extraction steam to heat the boiler feedwater. One of the high pressure feedwater heaters (#35) is out of service and needs to be replaced and the others may need tube replacements. During combined cycle operation, these feedwater heaters are bypassed and feedwater is heated using a new heat recovery heat exchanger mounted inline with the combustion turbine exhaust. This heat exchanger will be mounted where the machine shop floor is currently (Figure 2.11). The new feedwater heat exchanger has two compartments (HX2 and HX4) with an estimated surface area (calculated in the GateCycle model) of 32,500 ft2 and 55,800 ft2, respectively. The performance of these heat exchangers is shown in Figure 2.12.
Repowering and Retrofitting 17

Figure 2.11 New Heat Recovery Feedwater Heater - Plan View
Repowering and Retrofitting 18

Figure 2.12 New Heat Recovery Feedwater Heater - Operating Conditions
Variable Section HX2 Section HX4 Direction of gas flow Horizontal Horizontal No. of Gas Passes One One Gas flow, lb/hr 586,000 586,000 Gas inlet temperature, °F 980 464 Gas outlet temperature, °F 464 155 Direction of water flow Horizontal Horizontal No. of passes One One Feed water flow, lb/hr 427,000 406,000 Water inlet temperature, °F 284 121 Water outlet temperature, °F 461 232 Heat transferred, MMBtu/hr 80 45 Estimated delivered cost $780,000
Existing Combustion Air Heat Exchanger The existing combustion air heater (HX1) is a Ljungstrom rotary regenerative heater Model 22-V-56 with a heating surface area of 70,900 ft2. The original rated air pressure drop is 4.1 in. water and the gas pressure drop is 2.8 in. water at a rated air flow rate of 425,500 lb/hr and rated gas flow of 490,000 lb/hr (Figure 2.13). The condition of the air heater was considered good in 1991. The existing air heater will be used in the retrofit WTE™ plant to provide 416,000 lb/hr of air at up to 720°F for overfire and underfire combustion air.
Figure 2.13 Combustion Air Heater Peformance
Variable Urge Test Data
WTE Combined Cycle
Gas flow, lb/hr 449,000 496,000 Gas inlet temperature, °F 700 870 Gas outlet temperature, °F 336 363 Total air flow, lb/hr 413,000 (1) 416,000 Underfire air flow - 208,000 Overfire air flow - 208,000 Air inlet temperature, °F 108 50 Air outlet temperature, °F 589 720 Heat transferred, MBtu/hr (1) 50.0 (1) 68.7
(1) Calculated by GateCycle Model New Condensing Heat Exchanger In order to generate warm air for drying the fuel, a new condensing heat exchanger is added to extract waste heat from the flue gas exiting the combustion air heat exchanger. A condensing heat exchanger
Repowering and Retrofitting 19

is used because there is no sulfuric acid in the flue gas when burning wood. Approximately 2.8 million lb/hr of drying air heated to 132°F and ducted to the drying dome. The performance of the drying air heat exchanger is summarized in Figure 2.14. See the Fuel Handling section for further information.
Figure 2.14 New Condensing Heat Exchanger for Drying Air
Variable Quantity No. of Gas Passes One Gas flow, lb/hr 496,000 Gas inlet temperature, °F 363 Gas outlet temperature, °F 115 No. of air passes One Air flow, lb/hr 2,800,000 Air inlet temperature, °F 50 Air outlet temperature, °F 132 Heat transferred, MBtu/hr 55.4
Repowering and Retrofitting 20

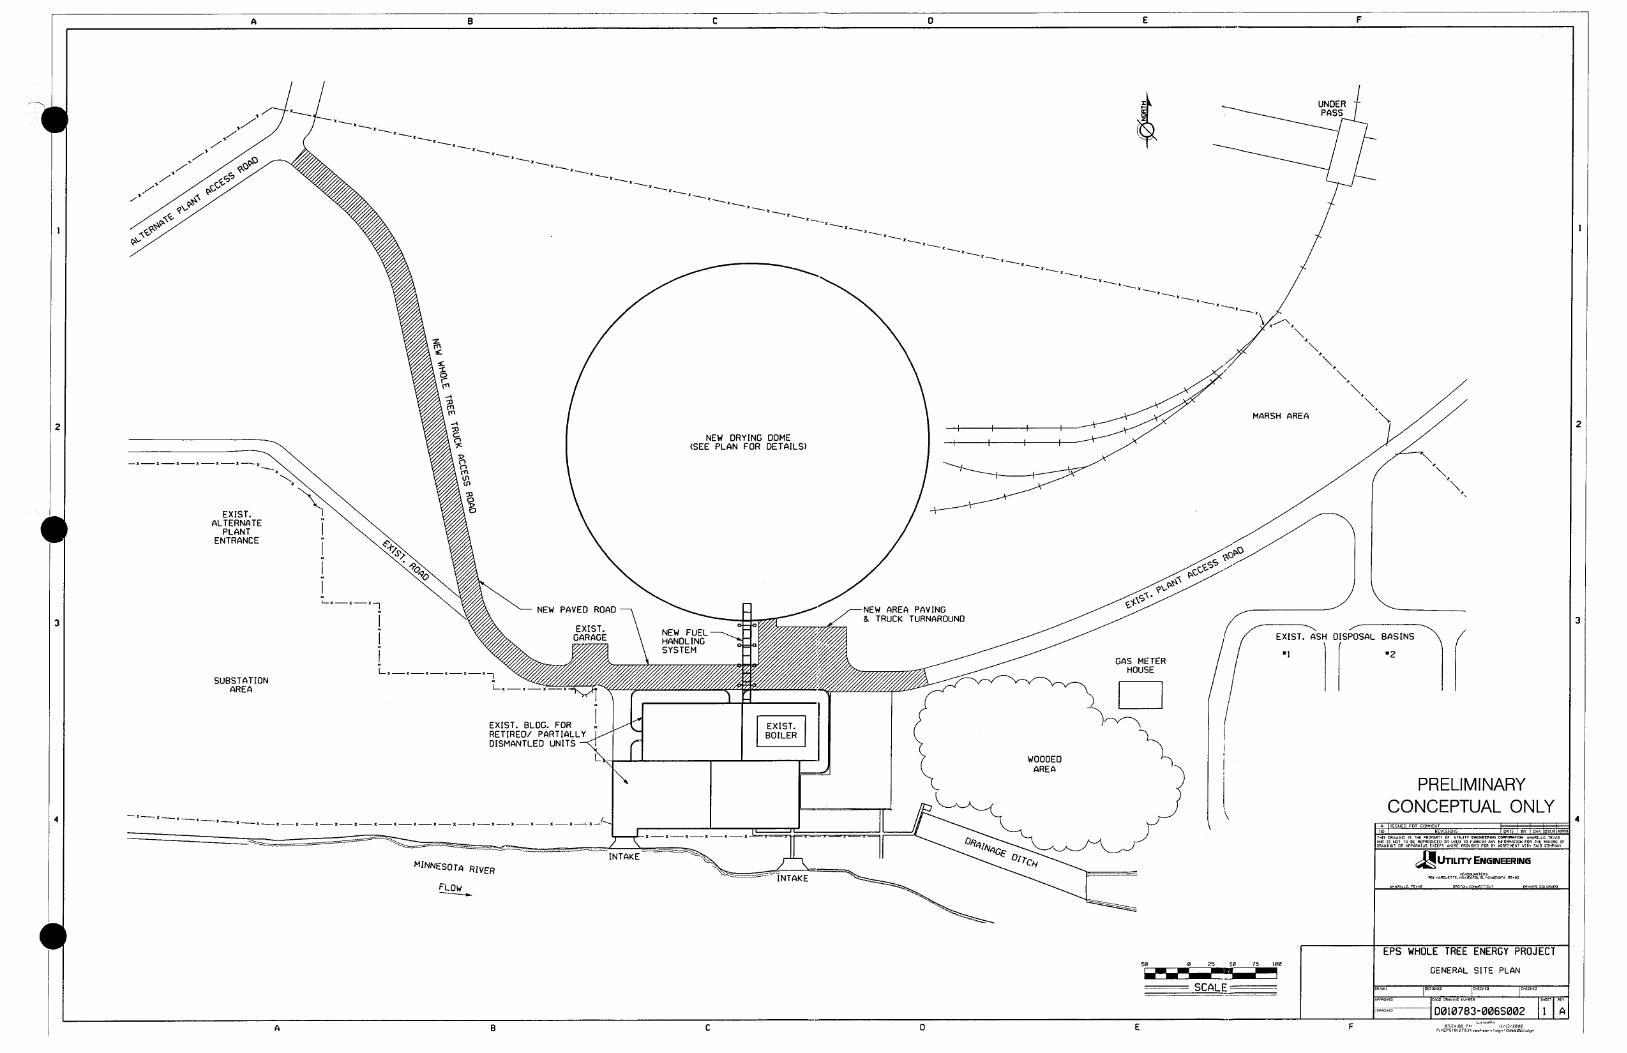
3. Fuel Handling, Drying and Feeding Background The tree drying/handling facility consists of an air supported fabric dome, a drying air distribution system, a tower crane tree handling system, and an integrated firewater storage system. A separate drag conveyor system is designed to transport a continuous pile of whole trees from inside the drying dome to the dual-ram fuel feed system at the furnace. The design fuel feed requirements are 35 dry ton/hr for full load operations and 40 tons/hr at short term (4 hr) peak load. The trees are fed into the boiler from the fuel drying building on a first in-first out basis. In a typical cycle, the crane picks up a load of green trees from a waiting whole tree hauling truck, raise the load to pile height and swing the load to the current position of the transition zone between green and dried trees. The load of green wood will then be dropped at the leading edge of the green trees and the crane will swing across the transition zone and pick up a load of dried trees to be fed onto the drag conveyor. Again, the load will be raised to pile height and swing back to the loading zone to be dropped into the fuel feed hopper over the drag conveyor. The loading/unloading area will be located immediately next to the fuel feed hopper. Simulation of the fuel handling cycle has shown this configuration to be the most efficient in terms of crane cycle times. Whole green trees are dried from their typical 40% to 50% moisture down to less than 25% moisture in the drying dome using warm dry air (130°F) for a period of one month. This improves boiler efficiency and decreases emissions from burning wood. The fabric drying dome is supported by air pressure from the drying air supply during the normal tree-drying operation. An independent, motor-driven, air supply system equipped with a back-up diesel generator will be used to keep the dome inflated during emergency and plant shut-down periods. The tree drying facility integrates tree unloading, storage, drying and a fuel handling. Drying Dome The drying dome is 410 ft in diameter and 145 ft high to accommodate a 300 ft diameter by 70 ft tall stack of trees (Figure 3.1). The entire enclosed space can be used for storage since internal support columns are not required. The trees are randomly stacked in a donut shaped pile with a center open space of 50 ft in diameter to provide space for the central crane tower. The dome will be situated approximately where the coal storage yard is currently located (Figure 3.2). The existing coal storage and handling facilities will be removed during the demolition phase of the project. The size of the dome is dependent on the volume of trees to be stored and dried. In previous testing, EPS has determined that drying trees from 50% green moisture content to 23% as fired takes about 30 days. At a design fuel feed rate of about 54,593 dry lb/hr (524 dry tons/day at 80% capacity factor), about 15,700 dry tons of fuel needs to be stored in the drying dome (Figure 3.3). The dome will be made from double-layer of a strong plastic/fabric film called ESIFILM (from Environmental Structures, Inc.). The special plastic fabric is commonly used in large air-supported structures such as sports domes, temporary construction buildings, and emergency shelters. This film is strong, light, translucent, and resistant to damage from ultraviolet radiation. The film is also designed to meet standard fire codes for flame resistance. Galvanized 3/8-inch aircraft cable are embedded in seams every 4 ft allowing the entire dome to be folded up and erected in one piece on site. The load bearing steel cables also provide structural strength while maintaining the shape of the
Fuel Handling, Drying and Feeding 21

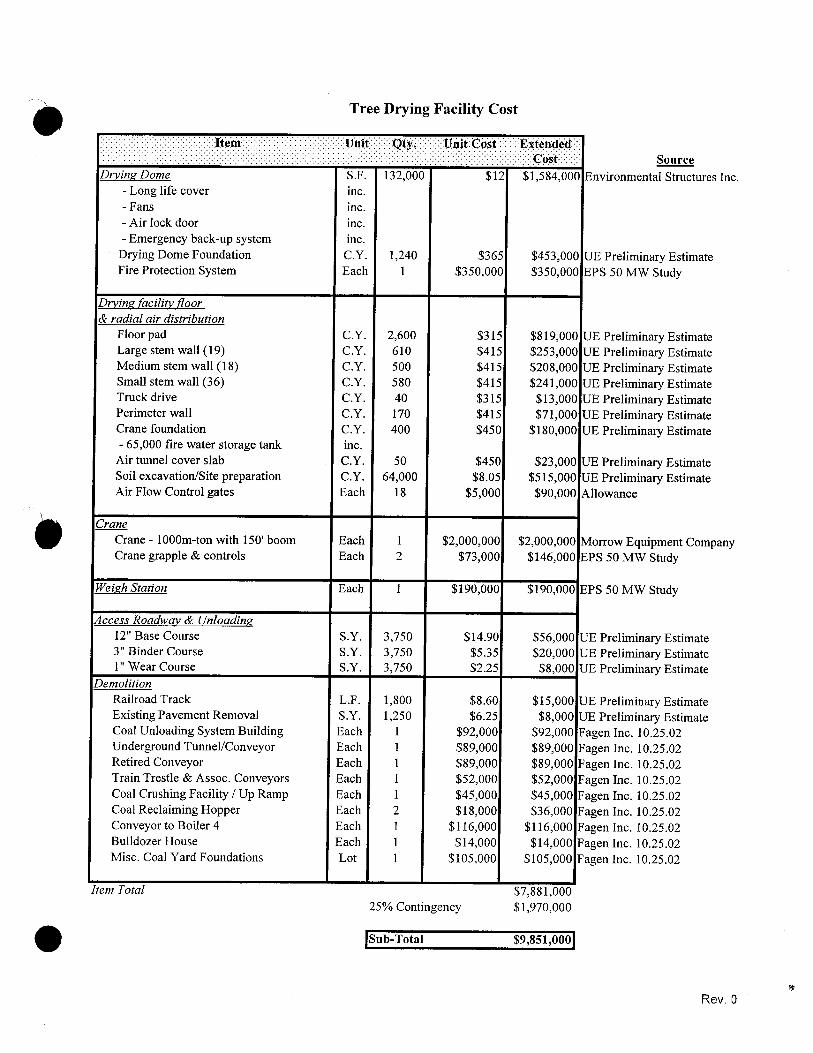
dome. Low pressure air separates the inner and outer layers of the double-wall cover. This slightly pressurized dead air space acts as an insulation layer. The translucent film lets natural daylight into the enclosure eliminating the need for auxiliary lighting during the day. Lights can be mounted on outside poles illuminating the cover at night for shadow-free inside light without internal obstructions. At the top of the dome, a large circular opening is designed to exhaust the warm, saturated air from the building to the atmosphere. This vent will be adjustable to retain a positive pressure inside the drying building at all times. The domes 1288 ft long perimeter will include various access doors and exits. One 14 ft by 14 ft truck entrance door, two revolving personnel entrance doors and several exit doors will be located around the perimeter of the drying building. The truck entrance door will not require an airlock given the high airflow into the building from the air distribution system. The mechanical system required to inflate the dome will consist of two 250 hp drying air circulation blowers, several small backup fans, and two emergency stand-by generators. Only two small fans are needed to maintain the normal interior pressure once the building is inflated (and the vent is closed). The backup fans are used to stabilize the building in high wind conditions or in case of a system failure and will pressurize the dome to 1.5 in. water. The structure will be designed to withstand the appropriate wind and snow loads typical for the Granite Falls area. Normal wind pressures require an inside air pressure of only 0.4 to 0.5 inches of water to support the structure. As wind velocity rises through gale force winds, internal pressure is increased using an automatic pressure control system. The drying building, as designed for the Minnesota Valley project, will have the design capability to withstand 100+ mile per hour winds. Since the drying building will be heated to 110 to120°F continuously, snow load will not build up. An automatic control system will maintain a constant interior air pressure by automatically adjusting to all expected atmospheric conditions such as storms, high winds, snow loads, or air losses at the doors. The drying building will require only minor maintenance on a regular basis to maintain its integrity for many years. There are no windows to wash or replace. The structure needs no painting. In the case of minor damage to the dome of the drying building, repairs are simple and inexpensive. Damage to the exterior envelope due to trees falling off the pile or accidentally puncturing the sides is not expected to be a problem since there will be a tree-free zone 100 ft wide between the perimeter wall and the edge of the tree pile, and in prior stacking tests whole trees were stacked 100 ft high (in a square stack) without any problem with trees falling off or the pile tipping over. Even if the dome were to get accidentally punctured, the drying building will not deflate and the tear can be easily repaired on-site. The cost of the entire drying building including the fabric dome, the anchor wall, the mechanical systems and the site preparation is expected to be about $9.9 million. This includes the cost of the fabric dome, the anchor system and the mechanical system. Construction of the dome enclosure can be completed before the radial walls, crane and other equipment to facilitate an above freezing indoor environment.
Fuel Handling, Drying and Feeding 22
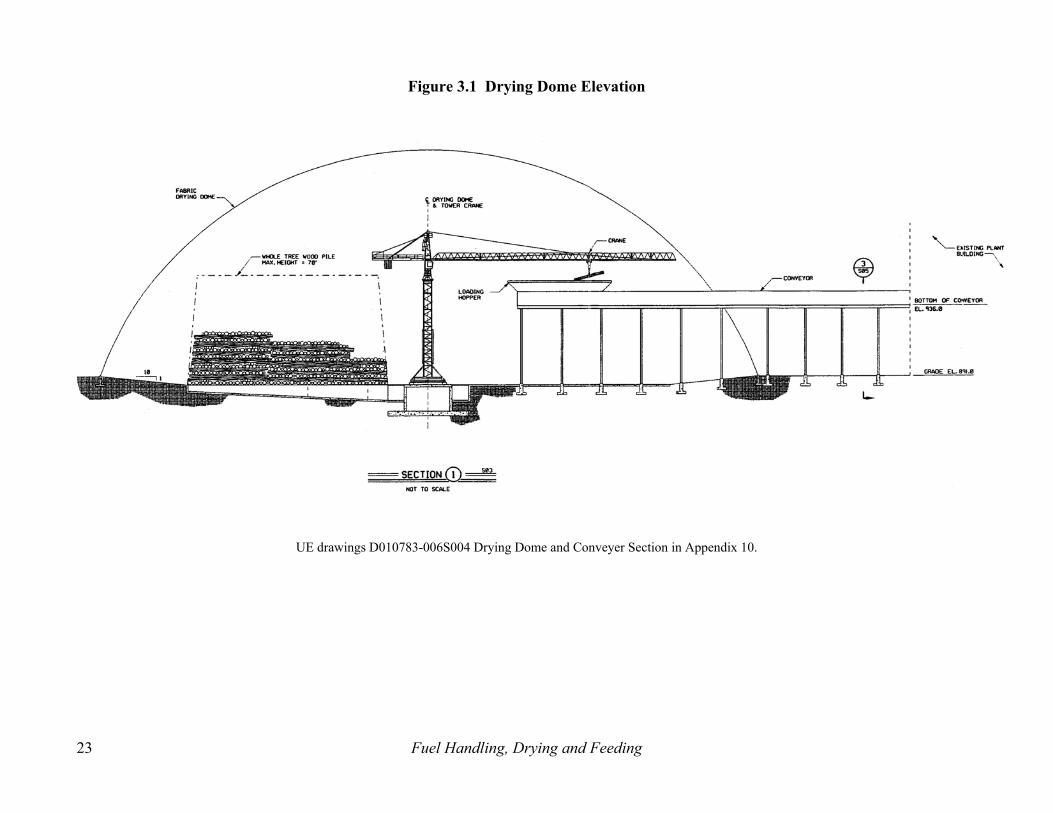
Figure 3.1 Drying Dome Elevation
UE drawings D010783-006S004 Drying Dome and Conveyer Section in Appendix 10.
Fuel Handling, Drying and Feeding 23

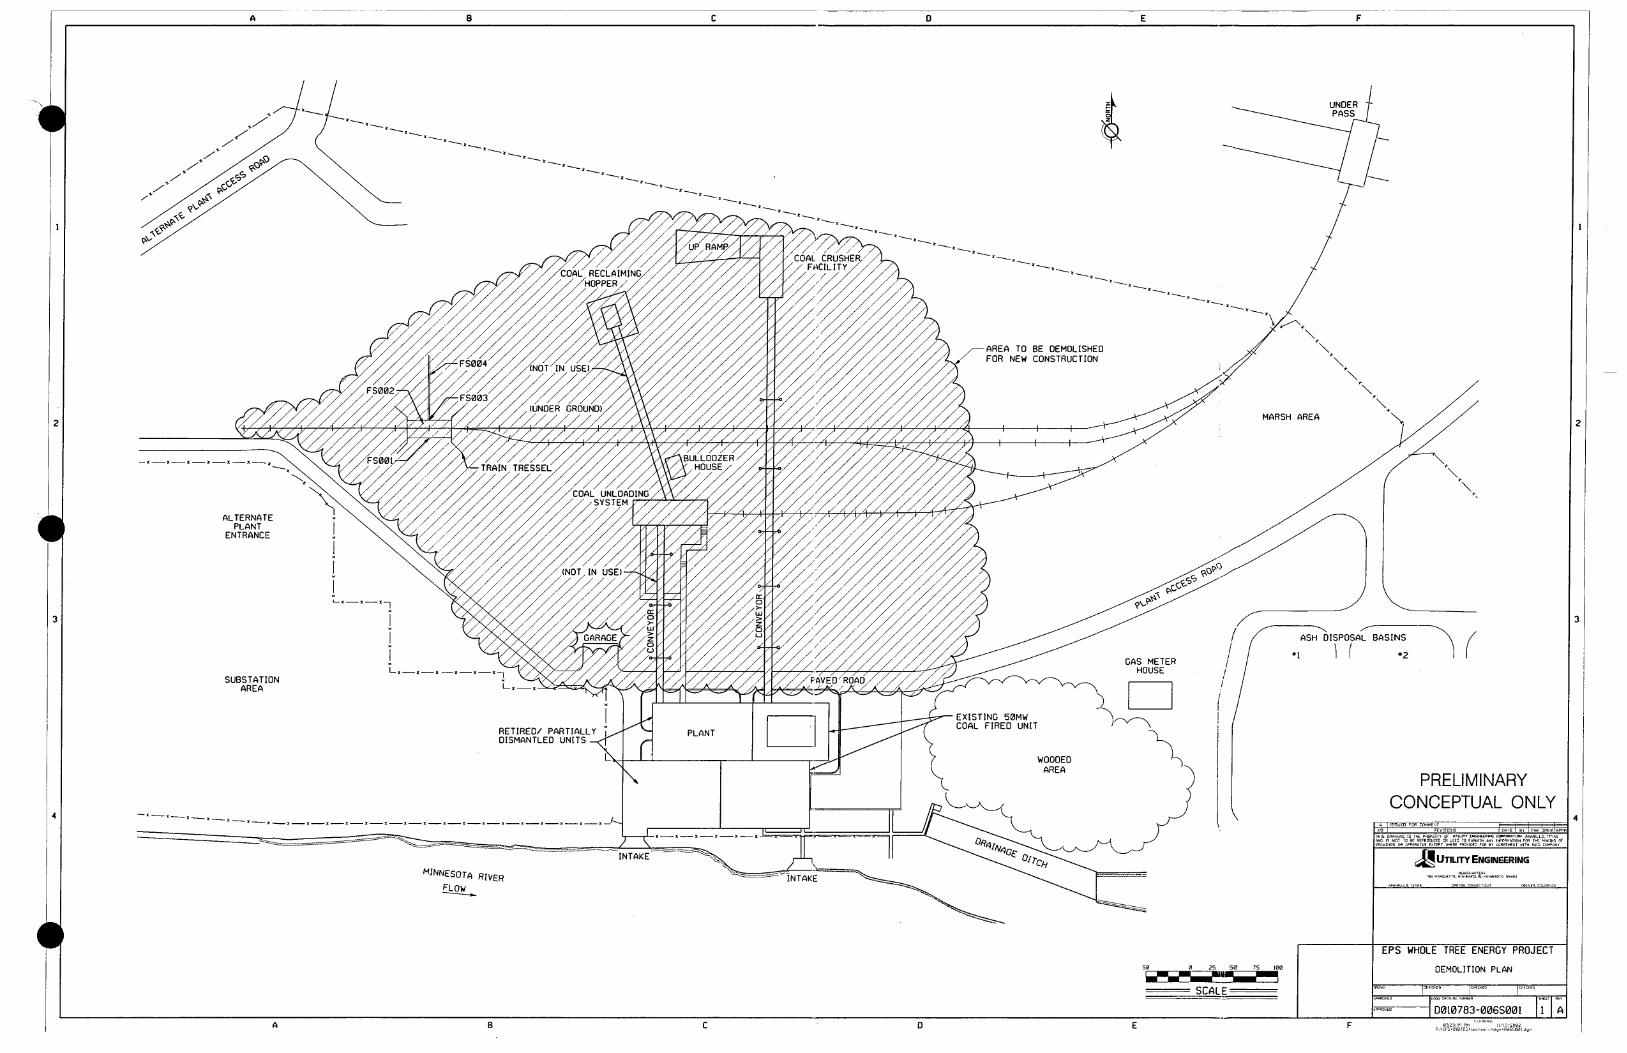
Figure 3.2 General Site Plan
See UE drawings D010783-006S002 General Site Plan in Appendix 10.
Fuel Handling, Drying and Feeding 24

Figure 3.3 Drying Dome Specifications
Description WTE™ Plant
Diameter, ft 410
Center height, ft 145
Volume, million cu ft 11.7
Cover area, sq ft 198,100
Perimeter length, ft 1,288
Plan area, sq ft 132,025
Maximum whole tree storage capacity, dry tons (70 foot high pile at 9 dry lbs/cu ft)
19,750
Air flow during normal operations, million lb/hr
2.8
Drying Air Distribution System A large duct transports warm dry air from the condensing heat exchanger underground to the center ring air manifold inside the drying building. A network of radial walls distribute the drying air under various sections of the pile (Figure 3.4). The long radial walls extend out 120 ft from the central manifold to the edge of the pile at approximately 4.8° intervals. At about 50 ft from the manifold, a second shorter set of radial walls are spaced at 9.6° intervals and offset from the long walls by 2.4°. This second set of walls reduces the overall distance that the first layer of trees has to span from to 12 ft at the outside edge of the distribution system. All of the channel walls will slope up from a depth of about 8 ft at the manifold to 3.5 ft at the outside edge. Openings in the manifold wall centered between each radial channel allow warm air to circulate. The air distribution system will deliver about 2.8 million Btu/hr 130°F air to the wood pile under design conditions. The air distribution ducts will be below grade such that the bottom of the whole tree pile (and top of the radial walls) is flush with ground level surrounding the pile. The walls will be constructed using standard poured concrete reinforced with steel rebar (Figure 3.5). Cross supports will help strengthen and stabilize the walls. The walls of the air distribution system will be formed and poured at the same time as the footing and foundation wall is constructed for the drying building structure. A system of simple automatic baffles at the manifold end of each air channel will be used to automatically control the flow of air through various sections of the pile. Less air is required to remove the excess moisture from the drier wood while significantly higher volumes are required for the wettest wood. Air flow rates will vary from the wettest section of the pile to the driest section. The first layer of trees will be placed perpendicular to the channels to create a stable "floor" for stacking the main pile.
Fuel Handling, Drying and Feeding 25
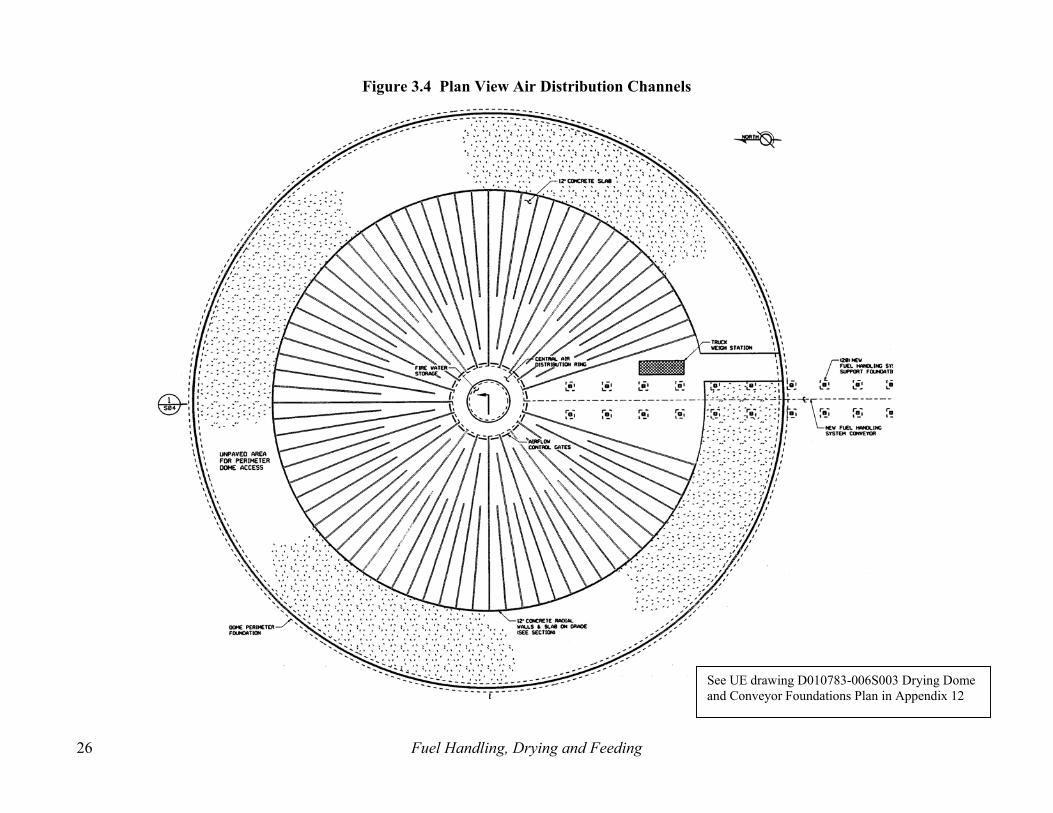
Figure 3.4 Plan View Air Distribution Channels
See UE drawing D010783-006S003 Drying Dome and Conveyor Foundations Plan in Appendix 12
Fuel Handling, Drying and Feeding 26

Figure 3.5 Cross-Section of Air Distribution Channels
See UE drawings D010783-006S005 Drying Dome and Conveyer Sections in Appendix 10.
Fuel Handling, Drying and Feeding 27

Tower Crane and Grapple Unloading the tree-hauling trucks and stacking and unstacking the tree pile will be accomplished by a large capacity tower crane/grapple system located in the center of the drying building (Figure 3.1). EPS recommends the use of a Liebherr Model 1800C tower crane or equivalent (Appendix 2). The Model 1800C can lift 30+ tons at the normal working radius of about 150 ft. The total rated horsepower of the crane is about 550 hp (2x200 hp for hoist, 6x20 hp for swing and 30 hp for trolley). The option of purchasing and installing used equipment should be considered for the crane and grapple system. The crane foundation structure is designed to contain a 65,000 gallon concrete firewater storage tank for a deluge fire-control system. The boom of the crane will have a reach of about 150 ft from the center of the tower to the maximum outward grapple position. A large EPS-designed 25 ton grapple designed to efficiently pick up and move piles of whole trees will be mounted on the boom to unload green trees from the trucks and to place dried fuel on the drag conveyor. The grapple will have three to four opposed tines and 360.8° rotation capability. In order to allow for clearance for the grapple, the boom needs to be mounted at least 20-30 ft above the maximum pile height or at approximately 100 ft above ground level. An air-conditioned cab for the operator will be located on the boom at the top of the tower offering a clear view of the entire tree pile and the truck loading/unloading area. The tower crane will be operated 24 hours/day during normal operation. Fuel will arrive at the drying building in the form of whole trees loaded on standard wood hauling trailers and custom whole-tree hauling trailers. The deliveries will take place continuously over a 10 to 12 hour day, 5 days per week. Four crane operators will be required for three 8 hr shifts per day. Personnel required to operate and maintain the conveyor system and for building cleanup will include one rover, one front-end loader operator (for cleanup and miscellaneous tasks), and one person for general maintenance. An area outside the drying building may be set aside to store loaded and empty trailers to allow for quicker turnaround time for the delivery trucks and to smooth the flow of traffic to the unloading crane. During gaps in the delivery schedule, loaded trailers stockpiled outside the drying building could be brought into the drying building and unloaded. The unloaded trailers would then be returned to the parking area and be available for use by a driver at some later time. Drag Conveyor The wood fuel handling system is based on proprietary EPS design and includes a hydraulically operated ratcheting drag conveyor, fuel feed rams extending across the boiler front wall, a sizing saw and seal doors. This new equipment will replace the existing coal conveyors, feeders, pulverizers and accessories. The existing building structure requires modification for the conveyor. The existing coal burners, piping, ducting and coal bunker structure will be removed. The drag conveyor will extend approximately 245 ft from inside the drying building to the edge of the powerhouse and continues another 75 ft inside the building past the fuel charge pit in font of the boiler. The drag conveyor consists of regularly spaced steel 8 in. by 12 in. rectangular tube slats with welded wear plates on the bottom attached near each end to two continuous loop of 2-1/2 in. steel braided-wire cables (Figure 3.6). The conveyor is 8 ft wide and originates inside the drying building at the fuel loading hopper. The loading hopper is 65 ft long and 20 ft wide at the top level. The sides of the hopper taper in to make a lower channel 8 ft wide with 8 ft high vertical sidewalls. The drag conveyor rides along the bottom of this channel; the channel has groves in the bottom for the cables (not shown in Figure 3.6). A load of trees is dropped into the hopper and slides down into the bottom channel
Fuel Handling, Drying and Feeding 28

where the drag conveyor latches onto a pile of trees and transports them into the drying building. The duty cycle of the conveyor is such that the conveyor is mostly at rest. From the loading hopper, the conveyor moves through the sidewall of the drying building to the side wall of the powerhouse and continues to the fuel feed area at the boiler. The conveyor regularly delivers loads of wood to the fuel feed ram and then continues over a large conveyor drive wheel before returning back to the fuel loading hopper to complete a continuous loop. The drag conveyor is continuously loaded with fuel. A fully loaded conveyor at the retrofit Minnesota Valley plant holds approximately 2 hours of fuel for full-load boiler operation. The bulk density is less for the pile on the conveyor and in the combustor as compared to the large tree pile (7.5 dry lb/ft3 compared to 9 lb/ft3 of the large pile). The conveyor cycles on and off as needed to deliver fuel to the boiler. Since a fuel load is added to the boiler at approximately 4 minute intervals with each "on" cycle lasting less than one minute, the conveyor duty cycle will be less than 20%. The conveyor system is supported at approximately 25 ft intervals. Each support consists of a 45 ft steel frame, braced in the east-west direction and resting on concrete foundations (Figure 3.7). Steel support beams run north-south connecting the tops of each frame and the existing building. The drag conveyor will enter the boiler building through a 9 ft by 12 ft opening cut through the north side of the building (Figure 3.8). Inside the building the conveyor is supported by steel frames resting on the existing building floor. The new hopper and ram systems are supported off of the existing floor structure.
Fuel Handling, Drying and Feeding 29

Figure 3.6 Drag Conveyor Detail
������������������������������������������������������������������������������������������������������������������������������������������������������������������������������������������������������������������������������������������������������������������������������������������������������������
������������������������������������������������
��������������������������������������������������������������������������������������������������������������������������������������������������������������������������������������������������������������������������������������������������������������������������������������������������������������������������������������������������������������������������������������������������������������������������������������������������������������������������������������������������������������������������������������������������������������������������������������������������������������������������������������������������������������������������������������������������������������������������������������������������������������������������������������������������������������������������������������������������������������������
8'-0"
8'-0"
Crossbar
�������������������������������������������������������������������������������������������������������������������������������������������������������������������������������������������������������������������������������������������������������������������������������������������������������������������������������������������������������������������������������������������������������������������������������������������������������������������������������������������������������������������������������������������������������������������������������������������������������������������������������������������������������������������������������������������������������������������������������������������������������������������������������������������������������������������������������������������������������������������������������������������������������������������������������������������������������������������������������������������������������������������������������������������������������������������������������������������������������������������������������������������������������������������������������������������������������������������������������������������������������������������������������������������������������������������������������������������������������������������������������������������������������������������������������������������������������������������������������������������������������������������������������������������������������������������������������������������������������������������������������������������������������������������������������������������������������������������������������������������������������������������������������������������������������������������������������������������������������������������������������������������������������������������������������������������������������������������������������������������������������������������������������������������������������������������������������������������������������������������������������������������������������������������������������������������������������������������������������������������������������������������������������������
��������������������������������������������������������������������������������������������������������������������������������������������������������������������������������������������������������������������������������������������������������������������������������������������������������������������������������������������������������������������������
�������������������������������������������������������������������������������������������������������������������������������������������������������������������������������������
Top View - Continuous Drag Conveyer Section
Cross Section - Rachet Drag Type Conveyor
Crossbar Drag Cable
Fuel Handling, Drying and Feeding 30

Fuel Handling, Drying and Feeding 31
Figure 3.7 Structural Support for Drag Conveyor
UE drawings D010783-006S005 Drying Dome and Conveyer Section in Appendix 10.

Figure 3.8 Opening in Boiler Building for Drag Conveyor
UE drawings D010783-006S010 North Building Elevation in Appendix 10.
Fuel Handling, Drying and Feeding 32

Sizing Saw and Ram Feed System After the drag conveyor advances the continuous pile of whole trees towards the furnace, a large cutoff saw cuts through the line of trees creating a separate batch of trees approximately 24 ft long by less than 8 ft tall and 8 ft wide (Figure 3.9 and Figure 3.10). Each batch of trees is then pushed off the drag conveyor by a hydraulically driven ram into the main charge pit. The charge pit isolation gate remains closed and sealed against hot gases at this point. The charge pit door closes shearing off any protruding branches. At the appropriate time in the fuel loading cycle, the furnace isolation gate opens and a second ram pushs the batch of trees into the furnace on top of the main fuel bed. The charge pit ram retracts and the furnace isolation gate closes in preparation for the next batch of fuel. A sawdust collection system is also part of this system. The ram feed system is unique to the WTE™ system. The isolation door will be about 24 ft long and 9 ft tall to allow clearance for a full batch of fuel. The furnace-side face will see continuous temperatures of up to 2500°F during normal operations. When closed, the door will maintain an air and heat seal around its entire perimeter to maintain efficient furnace operation. The door will need to be protected from wear and damage from the fuel. As the charge pit ram pushes a load into the furnace, the face will momentarily see the high temperatures inside the furnace. Although the ram feed system will require innovative design, the primary systems and components use standard materials and off-the-shelf technology. Preliminary cost estimates by Utility Engineers (based on EPS design specifications) total $1.23 million for the ram feed system and cutoff saw combined. The cut-off saw will be custom designed for this application but all the components and materials are readily available and proven in other industrial operations. The main challenge will be designing the saw components for long term reliability and minimal maintenance. The sawdust recovery collection system also uses standard components and off-the-shelf technology. Similar systems are used in most wood products and wood processing facilities.
Fuel Handling, Drying and Feeding 33

Figure 3.9 Ram Feed System
Char Burnout Ai
��������������������
����������
���������������
����������������������
����������������������������
��������������������������������
�����������������������
��������������������������������������������
��������������������������
��������
������������������������������
������������������������������������������
������������������������������������������
�����������������������������������������
���������������
������������
����������
Steam Generator
Hydraulic Ram
Ash Pit
Charge Pit Door
Furnace Ram
Char Burn Out Zone
Deep Bed
Volatile Gas Combustion
Zone
Water Cooled Grate
Overfire Air
Underfire Air
Drag Conveyor
Isolation Gate
Dump Grate
Fuel Handling, Drying and Feeding 34

Figure 3.10 Ram Feed System - Plan View
Fuel Handling Roadway Trucks carrying whole trees arrive from an off-site location at the northwest plant entrance. A new two-lane, 24 ft wide, access road is required to accommodate the traffic from the fuel trucks. Trucks enter the drying area through a dome opening and travel down a 50 ft access to a weigh station. Once the fuel is unloaded, the trucks back out of the drying dome, turn around in a designated area, and leave the plant by way of the new access road. The new access roadways and weigh station are estimated to cost $84,000 and $190,000 respectively. Exterior demolition of existing coal handling facilities including railroad tracks, coal conveyors, coal crusher etc is budgeted at $661,000. Dome Electrical Description The retrofit will require the addition of major new electrical equipment including the dome drying air and backup inflation fans, crane hoist and drive motors, drag conveyor and rams hydraulic pump motors for the furnace feed system, and the cutoff saw drive motor. Many smaller motors will also be added. A complete listing of 480V loads for this system is not available, and preliminary one-line diagrams below the 480V switchgear level were not identified.
Fuel Handling, Drying and Feeding 35

In order to provide power to the new equipment needed for the fuel related systems new 2400V and 480 V switchgear will be added. A 480 V feed to the drying dome from the 480 V switchgear will be added to feed a motor control center with starters for drying dome fans. A 480V feed to the dome facility from newly installed 480V switchgear will feed a motor control center with starters and distribution feeders as required. Electrical distribution and control equipment (shown on UE D010783LSIE100 in Appenxix 12) for operation of the fuel handling and boiler systems are supplied from a 480V feed from the proposed 480V switchgear.
Fuel Handling, Drying and Feeding 36

4. Fuel Supply Whole Tree Energy (WTE) integrates the production of biomass with its use as a power plant fuel. WTE is a patented technology for firing 100% wood fuel in new or converted power plants. The technology includes advances in planting, weed control, harvesting and handling, storage, drying, and staged combustion. Trees are grown for fuel, harvested and utilized in "whole-tree" form rather than as woodchips. The WTE process can also use wood fuel from a variety of other sources such as forest residue and wood waste. The fuel will supply consist of hybrid poplar and cottonwood trees grown as farm crops within 50 miles of the power plant. These short rotation tree crops are grown on plots averaging 80 acres that are integrated with the existing land use patterns. As will be shown in this chapter, the Granite Falls region is an appropriate area for this alternative farm crop (Figure 4.1). The retrofit power plant will require 191,300 dry tons (7800 acres) of whole tree biomass annually to meet the design specifications summarized in Figure 4.2. If the plant is operated at a different capacity factor or power level, the amount of wood fuel required will change proportionally. Counties within a 50 mile radius of Granite Falls where the fuel will be grown include Yellow Medicine, Lac Qui Parle, Lincoln, Lyon, Redwood, Renville, Kandiyohi, Chippewa, and Swift (Figure 4.3). SRWC Fuel The proposed biomass fuel for the Minnesota Valley retrofit is short rotation woody crops (SRWC). These tree crops, which have been developed specifically for biomass fuel, include varieties of hybrid poplar, willow and cottonwood. They have been carefully selected to be fast growing, drought and pest resistant. The trees grow tall and straight with relatively small branches. When grown in good soil on 6 ft centers the fields can be harvested after five growing seasons with an average yield of 25 dry tons per acre. The five year growing cycle will require 39,000 acres of dedicated SRWC. In Minnesota hybrid poplar is the most common SRWC. There are currently over 20,000 acres of hybrid poplar planted in Minnesota, which is approximately 20 percent of the poplar planted nation wide. Most of these acres were planted under one of the following programs: • Poplar breeding and research led by the USDA North Central Research Station of the Forest Service, and
the University of Minnesota, began in the 1970’s, which developed many of the clones that are used today. • • A biomass energy consortium established in 1986 by Energy Performance Systems including the USDA
Forest Service, EPRI and the US DOE. A 10 year, 13 site, four-state program that conducted screening trials to identify the best clones for energy production and resulted in selecting the poplar vairety NM-6.
• • The Oklee Project, managed by the Agriculture Utilization and Research Institute and the University of
Minnesota – Crookston, planted 3,000 acres near Oklee, Minnesota north of Crookston. This project included cost-share payments from the Conservation Reserve Program (CRP) and long-term contracts with Minnesota Power.
• • The MN Wood Energy Scaleup Project, started in 1993 and coordinated by WesMinn RC&D and the US
DOE, has planted over 1,800 acres on CRP land within a 50 mile radius of Alexandria, MN; • • Private individuals planted hybrid poplar under the CRP program in the early to mid 1990s when it was
easier to get hybrid poplar enrolled. One landowner has over 1,500 acres of hybrid poplar planted on CRP land and many others have smaller plantings;
Fuel Supply 37

• Champion International (now International Paper) is actively purchasing land in the Todd County area and planting poplar for the purpose of utilizing the wood in its paper plant in Sartell, MN. International Paper has approximately 9,000 acres planted as of the summer of 2000, and plans to plant 2000+ acres per year for the foreseeable future.
Figure 4.1 Minnesota Land Use
Legend Urban and rural development Forested Cultivated land Water Hay/pasture/grassland Bog/marsh/fen Brushland Mining
Fuel Supply 38

Figure 4.2 Fuel Supply Assumptions
Key Parameters Units Values Source
Net power, WTE steam turbine*
kW 47.7 From GateCycle model
Capacity factor % 80 Design specification
Net steam plant efficiency % 34.3 From GateCycle model
Net plant heat rate Btu/kWh 10,130 From GateCycle model
Wood higher heating value Btu/lb dry 8,700 From test results
Total fuel energy required 1012 Btu/yr 3.38 Calculation
Fuel heat content MBtu/dry ton 17.4 Calculation
Wood flow rate Dry lb/hr 54,593 From fuel supply model
Annual fuel requirements Dry tons 191,294 From fuel supply model
Wastewood usage Dry tons Not included Variable *Assumes operation of plant as a combined cycle system with combustion turbine.
Figure 4.3 Counties in Fuel Supply Area
50 Mile Radiu
75 Mile Radiu
Swift
Kandiyohi
Renville
Brown
Yellow Medicine
Lac La Parle Chippewa
LyonLincoln
Pope Stearns
Meeker
McLeod
Sibley
Nicollet
Brown
WatonwanCottonwoodMurrayPipestone
Big Stone
Stevens
Fuel Supply 39

Current Land Use in the 9 County Region A vast majority of the land in the procurement area surrounding Granite Falls is currently farmland. Of the 4.4 million acres of land area in the 9 counties 84% is cropland, 5% is in CRP, and 1.0% is wetland (Figure 4.4). Currently 97% of cropland is planted in either corn or soybeans (Figure 4.5). There are 8,091 farms in the procurement area averaging 459 acres in size (Figure 4.6). To get an idea of the relative scope of this project, if an average farmer were to choose to rent all of his land to grow SRWCs, less than 20 average size farms per year in the 9 county procurement area would need to commit to the program, or less that 1% of the land in the 9 counties.
Figure 4.4 Land Usage by County
Counties CRP Acres Crop AcresWetland Acres Total Acres Percent CRP
Percent Crop
Percent Wetland
Chippewa 7,803 326,753 2,503 376,398 2% 87% 1%Kandiyohi 37,399 377,217 18,396 551,868 7% 68% 3%Laq Qui Parle 38,289 410,605 6,704 498,318 8% 82% 1%Lincoln 60,874 278,286 2,450 351,290 17% 79% 1%Lyon 22,068 387,941 2,795 462,076 5% 84% 1%Redwood 17,730 510,636 1,198 564,182 3% 91% 0%Renville 5,102 575,165 1,483 631,725 1% 91% 0%Swift 22,658 400,602 8,283 481,444 5% 83% 2%Yellow Medicine 27,710 424,068 2,330 488,656 6% 87% 0%Total (50 Mi Radius) 239,633 3,691,273 46,142 4,405,957 5% 84% 1%
Figure 4.5 Average Annual Acreage Planted by County, 1995-2000
CountySmall
Grains(1) Corn Wheat Soybeans TotalChippewa 1,117 135,367 4,967 135,683 277,133 Kandiyohi 6,183 142,967 5,700 115,583 270,433 Laq Qui Parle 533 146,100 19,450 183,333 349,417 Lincoln 3,483 86,467 9,283 95,133 194,367 Lyon 3,167 175,450 4,850 171,900 355,367 Redwood 3,383 227,167 2,833 233,767 467,150 Renville 2,467 237,067 6,217 244,400 490,150 Swift 2,017 155,350 10,967 158,733 327,067 Yellow Medicine 1,150 173,700 11,233 187,500 373,583
Total Acres 23,500 1,479,633 75,500 1,526,033 3,104,667
Percent of Total 1% 48% 2% 49%
1. Mostly oats
Fuel Supply 40

Figure 4.6 Regional Farm Facts
CountyFarms
(Number)
Land in Farms (Acres)
Average Size of Farm (Acres)
Total Cropland (Acres)
Chippewa 618 318,472 515 297,971Kandiyohi 1,131 378,831 335 326,925Laq Qui Parle 790 397,519 503 361,544Lincoln 724 269,646 372 233,699Lyon 931 403,001 433 365,967Redwood 1,168 508,129 435 472,615Renville 1,114 601,103 540 567,231Swift 739 388,215 525 352,100Yellow Medicine 876 415,269 474 380,068
Total 8,091 3,680,185 459 3,358,120
Source: 1997 Agriculture Census Data Site Selection Selecting the farm sites suitable for SRWC development depends on location, soil quality, slope, availability, and cost. Location Distance from the power plant and ease of access to the fields are the main location factors. All else being equal, sites closer to the Minnesota Valley plant are more valuable due to lower transportation costs. In practice, the farm developers may choose to pay more for rent to get higher quality land closer to the plant to balance the lower transportation cost. Or they may offer slightly higher rents for land closer in to save money and time on transportation. For the purposes of this study, all the cropland within a 50-mile radius (approximately the 9 counties listed above) is considered within an economic range for SRWC's. The entire region is crisscrossed with hundreds of local, township and country and state roads providing relatively direct access to all the farms in the region. Soil Quality Poplars and other SRWC grow best on good agricultural soils, but can also be grown on soils that are marginal for traditional crops (Figure 4.7). Generally, better quality soil will produce greater yields earlier in the rotation. The best SRWC growth occurs on sites with a large rooting volume and good aeration, water, and nutrient availability. Soil pH should be above 5.5 and below 8.0. SRWC have been grown successfully on soils ranging in texture from sandy loam to silt or clay loams. Soils with higher clay content tend to have lower production in the first few years. Although SRWC grow on poorly drained soils, they do not grow at economically acceptable rates under these conditions. The best soils for SRWC are loams, silt loams and clay loams, which are the predominant soils in the 9 county region. The soils in the Minnesota River basin and in the floodplains of its tributaries are deep alluvial soils deposited when much of the area was covered by water while the glaciers were melting. Most of the upland soils are mollisols formed under prairie grasses, and are very fertile. Detailed information on soils can be found in the USDA Soil Survey for each County. The Crop Equivalency Rating (CER) of potential plots is a key measure of soil quality. In general, any cropland with a CER between 50 and 100 is considered adequate for growing SRWC. In the
Fuel Supply 41

procurement region, over 3.5 million acres or 81% of all land area fits this criteria (Figure 4.8). This probably represents most of the current land classified as cropland in the region. Land with lower CER ratings tend to be too wet, too rocky, too steep or prone to erosion to be used for productively growing trees (or any other type of crop for that matter). Most of the cropland in the procurement area is high quality and is expected to support relatively high levels of productivity for selected SRWC hybrids.
Figure 4.7 Suitable Soil Characteristics
Soil Characteristic Suitable Unsuitable Texture Loams, sandy loams, loamy
sands, clay loams and silt loams
Coarse sand, clay soils
Structure Well developed to single grain structure
Massive or lacking structure
Drainage Imperfectly to moderately well drained
Excessively well or very poorly drained
PH 5.5 to 8.0 Below 5.5 or above 8.0
Depth 18 inches of more Less than 18 inches
Slope Less than 12% Avoid greater than 12%
Figure 4.8 CER by County
Chippewa Kandiyohi Lac Qui Parle Lincoln (1) Lyon Redwood Renville Swift Yellow Medicine TotalCER Range
Known Acres
under 10 4,090 19,120 28,389 3,741 4,880 9,340 19,623 20,890 4,000 114,073
10 - 20 3,750 6,555 0 3,320 4,330 1,650 0 13,840 5,910 39,355
20 - 30 10,985 42,280 16,074 4,891 6,380 19,760 3,697 14,410 6,780 125,257
30 - 40 4,500 19,000 21,680 6,739 8,790 23,145 10,422 37,700 10,620 142,596
40 - 50 48,875 40,585 87,984 17,522 22,855 4,275 54,277 37,040 14,650 328,063
50 - 60 54,510 29,050 207,983 30,901 40,305 35,630 96,022 126,470 26,670 647,541
60 - 70 186,795 103,190 126,349 105,094 137,079 258,125 186,371 162,975 296,740 1,562,718
70 - 80 54,055 183,395 0 174,873 228,095 111,850 127,428 56,635 116,150 1,052,481
80 - 90 0 48,970 0 - 0 90,435 129,575 0 0 268,980
90 - 100 0 0 0 - 0 0 0 0 0 0
No CER calculated 6,315 59,625 632 4,209 5,490 2,890 4,685 8,440 3,300 95,586
Total 373,875 551,770 489,091 351,290 458,204 557,100 632,100 478,400 484,820 4,376,650
Weighted Average CE 63.2 62 52.3 67.7 66.9 65.8 55.3 66.1
-------------
1. Estimated based on Lyon County ratios
2. Total over CER 50 3,531,719
3. Percent over 50 81%
Minnesota Land Economics, University of Min
CER: Crop Equivalency Rating Slope The slope of the land affects the potential for erosion and ease planting and harvesting SRWC. Slope over 12% is too difficult or too expensive to use for SRWC. Erosion on steep slopes could be a significant problem in the first two years of plantation development before the crown closes in. The cost of land prep and planting would likely be higher. The main consideration, though, is harvesting; slopes over 12% are difficult to harvest using rapid harvesting equipment and would require slower, more labor intensive techniques. Preference should be given to plots with slopes under 12%.
Fuel Supply 42

Figure 4.9 Acreage with Potential Slope Limitations
County Slope 12%+
Chippewa 4,500
Kandiyohi 20,500
Laq Qui Parle 4,500
Lincoln 19,300
Lyon 15,700
Redwood 10,068
Renville 8,849
Swift NA
Yellow Medicine 7,814
Total 91,231 NA: Data not available.
Except in areas near rivers and other waterways, most of the land in the procurement area is relatively flat. According to county soil surveys, only about 91,000 acres in the area have slopes over 12% (not including Swift County). A significant portion of these acres are not currently being farmed due to erosion problems or may already be part of the CRP set-aside program and therefore not included in the total cropland acreage statistics. For the purposes of this study, all the acres currently classified as cropland will be considered potential farmland for SRWC. Availability Most of the land expected to be offered for growing SRWC will be land that is being rented to grow crops. In Minnesota, approximately 55% of all acres farmed are rented (13 million acres of 26 million acres of cropland). This number is increasing each year as the average age of farmers continues to increase. (Over 54% of the nation's farmland landlords are over 65 years old.) Assuming this ratio holds true for the cropland in the 9 county procurement area, of the 3.4 million acres of existing cropland, about 1.87 million acres are rented each year. Additional acreage will also become available each year as current farm owners decide to retire from active farming and offer their land for rent. Some farmers may decide to rent a portion of their acreage for growing trees as a way to downsize their operations. Growing SRWC on the land may be an appealing way to rent the land long term without the work and risk of crop sharing arrangements and ongoing planting and harvesting activities. Renting 7,800 acres per year for 5 years during the farm development phase should not create a significant management challenge given the total number of acres currently in rent each year. Cost The most important factor in selecting land for growing SRWCs is the land rental cost compared to the land quality. In the analysis of fuel supply costs land rent of $100-$120 per acre is felt to be cost competitive (without additional support such as CRP payment or CO2 rebates, etc). Rental prices depend on a number of factors including soil quality, moisture, location, historical productivity and crop prices. High quality soil with proven productivity is worth more than lower quality soils. Land closer to Granite Falls will be worth more to the project than land farther away because of the
Fuel Supply 43

differential cost of transportation. The Soil Rental Rate (SRR) can be used as a reasonable measure of how much land might be available for a certain rental rate in the procurement area (Figure 4.10). Higher quality land will have a higher SRR. Using SRR as a guide, a vast majority of the acreage available in the procurement area has an SRR under $120. The average SRR for the 9 county region is $87. Land rents can vary from year to year depending on crop prices, demand for rental land and other factors. In the long run though, the land rental price needs to be low enough so a farmer renting the land has a reasonable chance to produce a profit growing the crop of choice. In recent years, in some areas, land rental prices have gotten too high to justify the risk and they have begun to stabilize and decline to more reasonable levels. With the number of acres of cropland available in the procurement area, it is a reasonable expectation to rent sufficient acres of good quality land within the cost limits above to be able to produce economically viable wood fuel.
Figure 4.10 Land Rental Rates, 2001 SRR RangeKnown Acres Chippewa Kandiyohi Lac Qui Parle Lincoln Lyon Redwood Renville Swift Yellow Medicine Total Percent
under $10 0 0 0 0 0 0 0 0 0 0
10 - 20 0 0 0 0 0 0 0 0 0 0
20 - 30 0 0 0 0 0 0 0 0 0 0
30 - 40 0 0 0 0 0 0 0 0 0 0
40 - 50 0 0 0 7,513 0 0 0 0 0 7,513 0%
50 - 60 0 108,670 36,889 85,696 0 0 0 0 32,250 263,505 6%
60 - 70 8,990 15,245 23,288 139,002 62,700 27,410 0 14,360 30,680 321,675 8%
70 - 80 11,700 46,235 194,282 102,697 45,040 16,825 31,546 46,430 96,650 591,405 14%
80 - 90 15,530 211,455 60,598 0 201,265 53,220 14,957 204,230 235,030 996,285 24%
90 - 100 136,865 112,890 138,084 0 24,250 266,660 317,926 153,850 82,900 1,233,425 29%
100 - 110 198,490 0 0 0 102,899 189,670 151,331 51,090 0 693,480 16%
110 - 120 0 0 0 0 0 0 112,760 0 0 112,760 3%
120 - 130 0 0 0 0 0 0 0 0 0 0
130 - 140 0 0 0 0 0 0 0 0 0 0
Total 371,575 494,495 453,141 334,908 436,154 553,785 628,520 469,960 477,510 4,220,048 100%
99$ 82$ 82$ 66$ 87$ 96$ 102$ 89$ 83$ 87$
Minnesota Land Economics, University of Minnesota
SSR: Soil Rental Rate.
0%
0%
0%
0%
0%
0%
The SRR is used by the USDA to determine payments for long-term Cons
Reserve Program entries. The soil rental rates weight the average cr
rate in each county by the relative productivity of each soil listed
deemed more productive (and hence more costly) are associated with h
The cropland rental rates themselves are re-determined periodically
USDA, based upon recommendations from county USDA offices.
Fuel Supply Development Plan The retrofit power plant will require approximately 39,000 acres of tree crops to run at full capacity (Figure 4.11). This will require planting 7,800 acres per year for 5 years during the development stage. A representative SRWC farm development plan is laid out over a 20 year period in Appendix 5. The trees are harvested after 5 years growing seasons and grow back from the stumps for another harvest in five years. The fuel development process starts with recruiting interested landowners willing to rent some or all of their land for a contract term of at least 10 years. EPS or an affiliate fuel supply management company will process applications, review soil reports, negotiate rates and contract for each plot. At an average of 80 acres per "tree farm", about 98 contracts will need to be signed annually during the first 5 years. The farm managers will be responsible for marketing the program, recruiting farmers, selecting the sites, negotiating the rental contracts, and growing the plantations.
Fuel Supply 44

Once the land is identified, preparations for planting can begin. Depending on the land, land prep activities will include application of herbicides, fertilization if necessary, and minimal tilling in some instances. Soil tests and site surveys will determine the requirements for each plot. Tree planting is done within a 4-6 week period in late spring when the soil temperature reaches 50°F. Hybrid poplar is established by inserting a 10 inch long cutting - called a slip - into the ground leaving the top inch above ground. These slips are 0.375 in. to 1.25 in. diameter and are dormant sticks (no roots). Slips are commercially available from select nurseries in Minnesota and Wisconsin. The main variety will be hybrid poplar NM6 (Nigra x Maximawitzii 6). The quantity of slips needed to establish the fuel supply is contracted for in advance to ensure that adequate quantities are available. Slips are harvested from nursery stool beds (two year old trees) during the winter, and cut to length and stored frozen until shipment. To maximize productivity slips are planted in a 5.3 ft by 5.3 ft spacing pattern at a density of 1,500 slips per acre. EPS has developed a high-speed 4-row slip planter that is pulled by a tractor. Four people sit on the planter and feed the slips into hoppers, and the slips are inserted into the soil by a mechanical ram as the tractor moves along at four miles per hour. Plans are to increase this to a six row planter to further reduce the slip planting cost and time required compared to the traditional hand planting method. Further details on the fuel development plan are given in Appendix 5. Weed control is necessary until the shade created by canopy closure suppresses weed growth early in the third growing season. During the first couple of growing seasons, timely herbicide applications and shallow cultivation are required to control weeds. After five growing seasons the trees are 6-8 in. diameter and 30-35 ft tall. At this size the growth slows given the tight spacing, and the trees yield an average of 25 dry tons per acre harvested. A special harvesting machine is being developed by EPS. It is mounted on four powered rubber tracks and moves forward continuously along a row cutting trees at the base and accumulating them towards the rear of the harvester. At the end of the row the whole trees are loaded onto a trailer. This machine will reduce SRWC harvesting costs compared to traditional forestry methods. Harvesting will continue throughout the year (Appendix 5). After harvest the stumps re-grow (coppice) to produce new shoots of vigorous growth. Another option is to kill the stump and replant using a new, better hybrid. Promising new species are being tested each year and some will no doubt be superior to today's best clones.
Fuel Supply 45
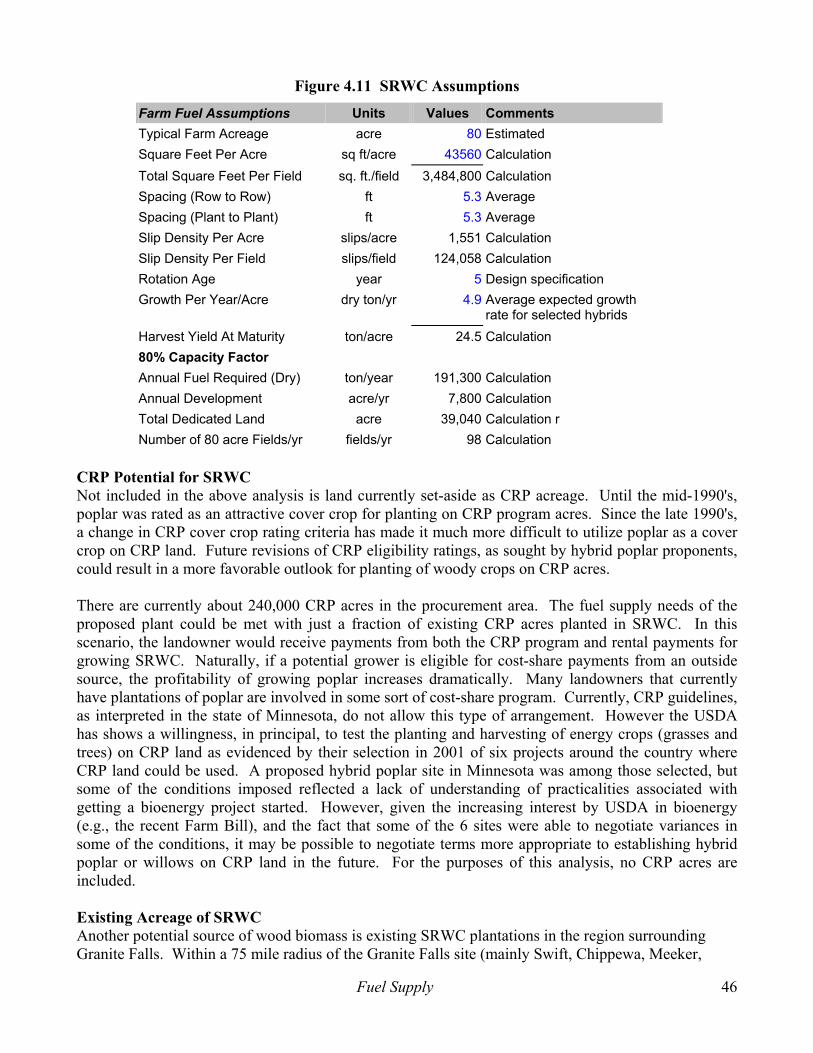
Figure 4.11 SRWC Assumptions
Farm Fuel Assumptions Units Values Comments Typical Farm Acreage acre 80 Estimated Square Feet Per Acre sq ft/acre 43560 Calculation Total Square Feet Per Field sq. ft./field 3,484,800 Calculation Spacing (Row to Row) ft 5.3 Average Spacing (Plant to Plant) ft 5.3 Average Slip Density Per Acre slips/acre 1,551 Calculation Slip Density Per Field slips/field 124,058 Calculation Rotation Age year 5 Design specification Growth Per Year/Acre dry ton/yr 4.9 Average expected growth
rate for selected hybrids Harvest Yield At Maturity ton/acre 24.5 Calculation 80% Capacity Factor Annual Fuel Required (Dry) ton/year 191,300 Calculation Annual Development acre/yr 7,800 Calculation Total Dedicated Land acre 39,040 Calculation r Number of 80 acre Fields/yr fields/yr 98 Calculation
CRP Potential for SRWC Not included in the above analysis is land currently set-aside as CRP acreage. Until the mid-1990's, poplar was rated as an attractive cover crop for planting on CRP program acres. Since the late 1990's, a change in CRP cover crop rating criteria has made it much more difficult to utilize poplar as a cover crop on CRP land. Future revisions of CRP eligibility ratings, as sought by hybrid poplar proponents, could result in a more favorable outlook for planting of woody crops on CRP acres. There are currently about 240,000 CRP acres in the procurement area. The fuel supply needs of the proposed plant could be met with just a fraction of existing CRP acres planted in SRWC. In this scenario, the landowner would receive payments from both the CRP program and rental payments for growing SRWC. Naturally, if a potential grower is eligible for cost-share payments from an outside source, the profitability of growing poplar increases dramatically. Many landowners that currently have plantations of poplar are involved in some sort of cost-share program. Currently, CRP guidelines, as interpreted in the state of Minnesota, do not allow this type of arrangement. However the USDA has shows a willingness, in principal, to test the planting and harvesting of energy crops (grasses and trees) on CRP land as evidenced by their selection in 2001 of six projects around the country where CRP land could be used. A proposed hybrid poplar site in Minnesota was among those selected, but some of the conditions imposed reflected a lack of understanding of practicalities associated with getting a bioenergy project started. However, given the increasing interest by USDA in bioenergy (e.g., the recent Farm Bill), and the fact that some of the 6 sites were able to negotiate variances in some of the conditions, it may be possible to negotiate terms more appropriate to establishing hybrid poplar or willows on CRP land in the future. For the purposes of this analysis, no CRP acres are included. Existing Acreage of SRWC Another potential source of wood biomass is existing SRWC plantations in the region surrounding Granite Falls. Within a 75 mile radius of the Granite Falls site (mainly Swift, Chippewa, Meeker,
Fuel Supply 46

Kandiyohi, and Yellow Medicine counties, see Figure 4.3) there are 5,100 acres of hybrid trees of various types that have been planted and maintained over the past 10 years as part of various experimental programs to test the productivity of different hybrids. Most of these plantations have reached harvestable maturity and could be a potential source of biomass for a WTE plant. Harvesting these plots would allow testing of various harvesting techniques and equipment like EPS's Whole Tree Harvester. Wood from existing SRWC plantations is not included in this analysis; however, if available this wood could be used in the WTE plant.
Economic Impact of SRWCs Rural communities throughout south central Minnesota that are heavily dependent on agriculture are experiencing serious challenges as a result of low commodity prices. These communities would benefit from having land leased at a steady rate with an alternate crop. The jobs and new business development linked to the conversion of the Minnesota Valley plant would bring welcome long term economic benefits to the area. In addition to the power plant itself, the establishment of many acres of SRWC would likely result in the creation of small businesses to manage and harvest the plantations, transport wood to the power plant and grow planting stock (Table 4.12).
Figure 4.12 SRWC Economic Impacts
Category Economic Impact Land use 2-4 fulltime jobs in plantation management
Annual land rental payments to landowners Alternative to renting land for annual crops
Land prep and planting 10-20 seasonal jobs to prep land,, and operate planting machines
Annual maintenance 2-3 seasonal jobs to monitor plots and maintain as needed
Harvesting SRWC 4-6 fulltime jobs operating harvesting machinery year-round
Transporting SWRC 8-12 fulltime jobs operating tree hauling trucks year round
Power plant operations 10-15 fulltime jobs in plant operations and maintenance
Initial Wood Fuel Supply During the first 2-3 years of operations, the WTE™ plant at Granite Falls will need to use various sources of wood while the SRWC fuel supply is being developed. Since wood resources within a 50 mile radius of Granite Falls are minimal (see Appendix 7), it is necessary to go up to 120 miles north to procure the wood fuel supply. In a 120 mile radius of Granite Falls there are 1.08 million acres of timberland in Minnesota (Figure 4.13). The total volume of merchantable growing stock is approximately 1088 million cu. ft. Adding in the estimated non-growing stock on these acres brings the total biomass available to 1600 million cu. ft. This results in an average of 1,460 cu. ft/acre or 23 dry tons/acre on timberland in the 120 mile radius. The average is 36 ton/acre on timberland in the 15 counties 50 to 120 miles north of Granite Falls.
Fuel Supply 47

Total annual wood removal in this procurement radius for year 2001 is estimated to be 14.5 million cu. ft (or about 14,400 acres). If non-growing stock is included, 21.1 million cu. ft or 328,000 dry tons of woody biomass are harvested each year. About 31% of this total is not used for commercial purposes resulting in a gross biomass residue available of 103,400 dry tons. Some of this material is too expensive or too difficult to collect. If only 50% is collectable, 51,700 dry tons of wood would be currently available to fuel the WTE plant in the interim period (and could be used as an auxiliary fuel during normal operations). Much of this material would be available at low or no cost for stumpage/harvesting. The primary cost would be transportation to the power plant. During the interim period, the WTE plant will use wood available from multiple sources including wastewood, forest residue, existing SRWC plantations and harvests of existing standing biomass. The WTE plant will require about 191,300 dry tons of biomass fuel annually to operate at full load at an 80% capacity factor. One potential scenario for the interim fuel supply is summarized in Figure 4.14. Expanding the potential procurement area out to 120 miles opens up many more sources of wastewood including portions of the Twin Cities and suburbs, Rochester, St. Cloud etc. It is conservatively estimated that about 30,000 dry tons of fuel would be available from wastewood sources. Existing residue adds 51,700 dry tons (see calculations above). Small independent operators could add significant quantities of residue and wastewood. Some of the existing SRWC plantations in the 120 mile radius are 10+ years old and could be harvested to supply a portion of the fuel required for the retrofit plant. Conservatively, approximately 1000 acres/yr could be harvested for the interim fuel supply. This scenario results in a need to harvest about 75,000 dry tons from existing timberland acreage in the region. This represents only 0.3% of the total biomass resources available in the 120 mile procurement area. Assuming that the sawtimber quality wood is sold to local lumber mills, the number of acres harvested each year would be 3,900 or only 0.4% of timberland acres in the area (see Appendix 8). This wood supply plan for the first several years of operation before the tree farms are mature is summarized in Figure 4.14.
Fuel Supply 48

Figure 4.13 Potential Interim Fuel Supply Resources in 120 Miles Radius
Total Biomass Units Value Notes
Total volume of merchantable growing stock
million cu ft 1,088 FIA website data search for 120 mile radius - MN
Ratio of non-growing stock to growing stock
0.45 See Ratios sheet - from 1992 MN harvest information
Additional non-growing stock biomass
million cu ft 492 Total growing stock times ratio of non-growing stock/growing stock
Total timberland biomass million cu ft 1,579 Calculation
Acres of timberland in region acres 1,082,000 FIA website data search for 15 county area - 1990 data updated 1996
Average merchantable growing stock
cu ft/acre 1,005 Calculation - total volume/total acres
Non-growing stock (limbwood, cull, saplings, dead and slash)
cu ft/acre 454 Calculation
Total biomass cu ft/acre 1,460 Calculation dry ton/acre 23 Calculation - 36 ton/acre in 15 county area to north
Assumptions Conversion (cu. ft to dry lb) lb/cu.ft. 31.2 Project Planning Handbook,
www.nationalcarbonoffsetcoalition.org. Total Existing Removals Existing annual growing stock removals
million cu ft 12.1 Source: North Central FIA web site query for 15 counties
Multiplier for estimated Year 2001 removals
Ratio 1.2 Represents increased harvest from 1990 to 2001 in Minnesota
Estimated growing stock removals 2001
million cu ft 14.52 Calculation
Additional non-growing stock biomass
million cu ft 6.6 Calculation
Total biomass removed (includes all residue)
million cu ft 21.1 Calculation
dry ton 328,860 Calculation Proportion of total biomass not used for products
% 31% See Ratio sheet - assumes ratios from 1992 data apply to 2001 estimate
Biomass residue potentially available
million cu ft 6.6 Calculation
dry ton 103,396 Includes logging residue and logging slash from growing and non-growing stock
Amount of residue collectible for WTE plant
50% Estimate - some residue will be too difficult or expensive to collect
Net residue available for interim fuel supply
million cubic feet
3.3 Annual amount of residue from current harvests in area that could be used to fuel WTE plant during interim period
dry ton 51,698 Note: Most of residue is in the 15 counties north of the 50 mile radius
Fuel Supply 49
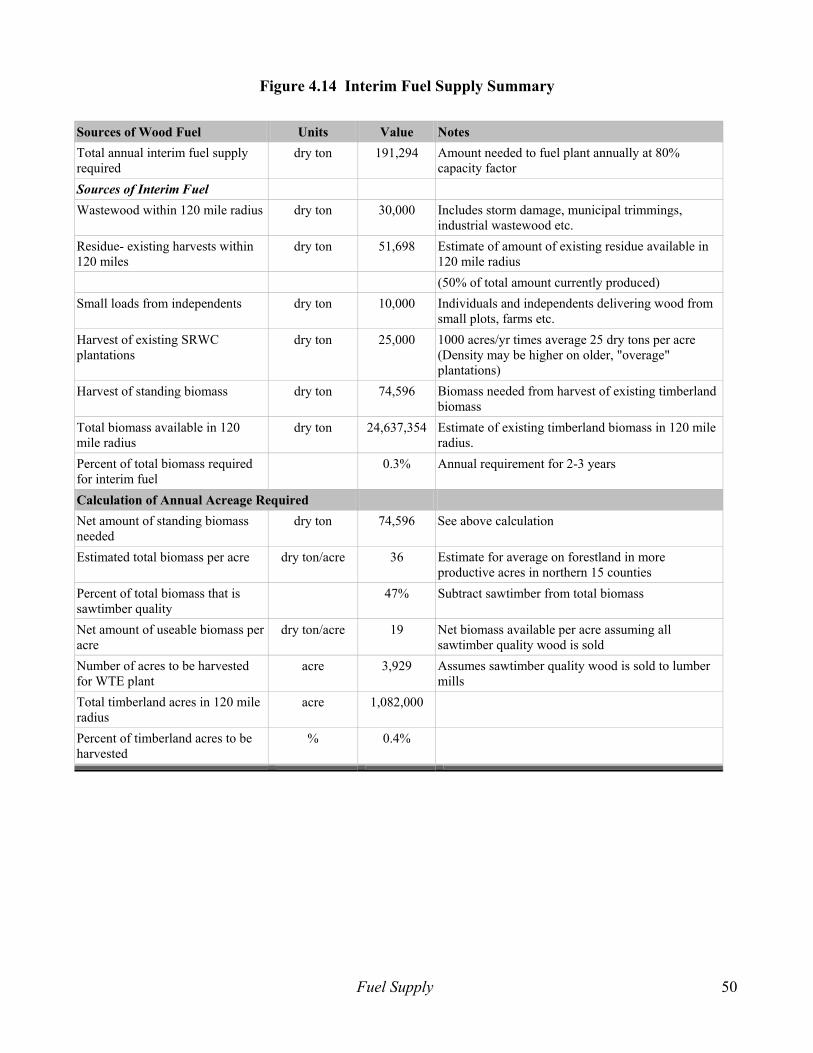
Figure 4.14 Interim Fuel Supply Summary Sources of Wood Fuel Units Value Notes Total annual interim fuel supply required
dry ton 191,294 Amount needed to fuel plant annually at 80% capacity factor
Sources of Interim Fuel Wastewood within 120 mile radius dry ton 30,000 Includes storm damage, municipal trimmings,
industrial wastewood etc. Residue- existing harvests within 120 miles
dry ton 51,698 Estimate of amount of existing residue available in 120 mile radius
(50% of total amount currently produced) Small loads from independents dry ton 10,000 Individuals and independents delivering wood from
small plots, farms etc. Harvest of existing SRWC plantations
dry ton 25,000 1000 acres/yr times average 25 dry tons per acre (Density may be higher on older, "overage" plantations)
Harvest of standing biomass dry ton 74,596 Biomass needed from harvest of existing timberland biomass
Total biomass available in 120 mile radius
dry ton 24,637,354 Estimate of existing timberland biomass in 120 mile radius.
Percent of total biomass required for interim fuel
0.3% Annual requirement for 2-3 years
Calculation of Annual Acreage Required Net amount of standing biomass needed
dry ton 74,596 See above calculation
Estimated total biomass per acre dry ton/acre 36 Estimate for average on forestland in more productive acres in northern 15 counties
Percent of total biomass that is sawtimber quality
47% Subtract sawtimber from total biomass
Net amount of useable biomass per acre
dry ton/acre 19 Net biomass available per acre assuming all sawtimber quality wood is sold
Number of acres to be harvested for WTE plant
acre 3,929 Assumes sawtimber quality wood is sold to lumber mills
Total timberland acres in 120 mile radius
acre 1,082,000
Percent of timberland acres to be harvested
% 0.4%
Fuel Supply 50

5. Air Emissions Control and Water Resources Particulate Control Particulates consists of bottom ash and flyash, both of which contain inorganic minerals and unburned carbon char. Because of the unique three-stage combustion system, and the use of dried wood with high temperature preheated air, the unburned carbon carryover is expected to be low. Since the dedicated wood crop has one-tenth the amount of ash as coal, the total ash collected and particulate emitted will be much less than when burning coal. The WTE™ three-stage combustor (Figure 5.1) consists of a deep fixed bed of whole tree segments supported by a water cooled grate, an overfire section, and second char burnout grate under the main grate. Air preheated up to 720°F flows under the main grate and up through the fuel bed. Fuel is fed to the top of the bed. In general, drying of the fuel occurs in the top part of the bed, gasification in the middle part of the bed and char burn in the lower part of the bed. The oxygen is consumed in the lower part of the bed so that the upper part of the bed is a reducing zone. Some char may fall through the grate and is collected on the lower grate where it burns out with additional air. Air jets strategically located above the deep bed burn the gasified products to complete combustion as the heat is transferred to the water walls of the boiler. Wood contains less than 1 % ash, whereas the ash content of coal can range from 4 %to 16 % by weight. With the inherent advantages of WTE and with the existing electrostatic precipitator, only about 5 tons of ash by-product will be generated daily from the baseload operation of the WTE™. Flue gas flows from the steam generator through combustion air heater and to the drying air heat exchanger (Figure 5.2). The moisture in flue gas is condensed in the drying air heat exchanger where some particulate is removed with the condensate. The flue gas then flows to the electrostatic precipitator (ESP) where more of the particulate is removed. The Minnesota Valley ESP was installed in the 1978 and has a rated collection efficiency of 97% when using coal. It was last repaired in 1982. Fluegas from the ESP is discharged to the 350 ft tall stack, which is rolled steel plate lined with Gunnite sprayed over steel mesh. Wood ash does not contain significant amounts of sodium, chlorine, or sulfur, but it does contain calcium, potassium and phosphorus so that the particle resistivity is not significantly different from coal. The char content of the ash is expected to be very low due to good combustion practice with dried fuel in the three-stage combustor. Thus the ESP efficiency should not be degraded by switching to wood. The US EPA AP-42 handbook (Table 1.6-1) indicates that ESPs operating with wood fuels have a collection efficiency of 90-99% with an average particulate emissions rate of 0.054 lb/million Btu and PM-10 emissions of 0.04 lb/million Btu. For the WTE retrofit less than 0.0282 lb/MBtu (or about 47 tons per year at design capacity) of particulates are expected to emitted with the flue gas (Figure 5.3) assuming no carbon carryover and with an ESP efficiency of 97%. An ESP collection efficiency of only 91% would still meet the new source particulate emission standard of 0.10 lb/MBtu. Thus although there may be a small amount of unburned carbon in the fly ash that might be collected less efficiently than the inorganic ash, the existing ESP should be adequate and replacement of the ESP with a fabric filter baghouse is not necessary. A final stage could be added to the precipitator if the collection efficiency were found to be less than expected.
Air Emissions and Water Resources 51
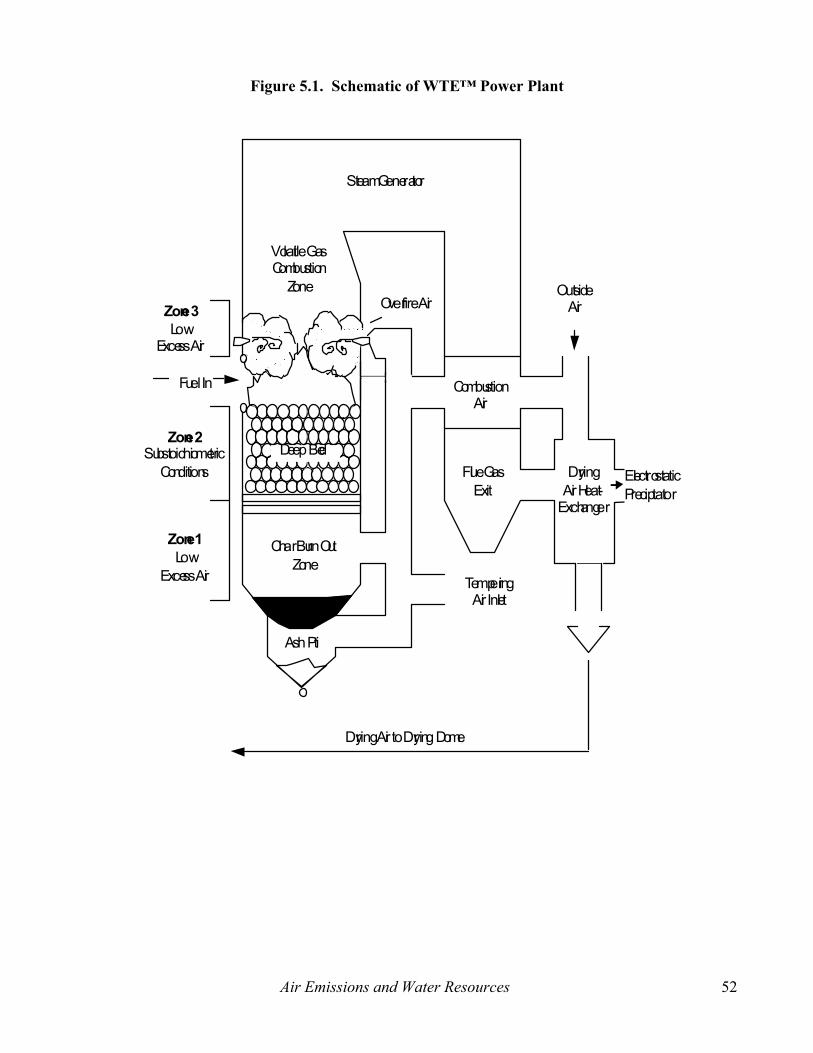
Figure 5.1. Schematic of WTE™ Power Plant
��������������������������������������������������������������������������������������������������������������������������������������������������������������������������������������������������������������������������������������������������������������������������������������������������������������������
������������������������������������������������������������
��������������
������������
���������������������
���������������������
��������������������������������
���������������������
����������������
������������
������������������������������������������������������������������������������������������
������������������������������������������������������������������������������������������
������������
������������
��������������
��������������������
����������������
������������������������������
���������������������
��������������������������������������������������������������������������������
��������������������������������������������������������������������������������
Steam Generator
Volatile GasCombustion
Zone
Char Burn OutZone
Ash Pit
TemperingAir Inlet
Drying Air to Drying Dome
Flue GasExit
CombustionAir
OutsideAirOverfire Air
Deep Bed
Zone 3Low
Excess Air
Zone 2Substoichiometric
Conditions
Zone 1Low
Excess Air
Fuel In
DryingAir Heat-
Exchanger
ElectrostaticPreciptator
Air Emissions and Water Resources 52

Figure 5.2 Air & Fluegas Flow Diagram
Flue Gas 496,000 lb/hr 870°F
��������������������������������������������������������������������������������������������������������������������������������������������
Exhaust From Combustion Turbine 586,000 lb/hr 155°F
Drying Air Preheater
Air Intake from Forced Draft Fan 416,000 lb/hr 50°F 70% RH
363°F
Air Intake from New Drying Air Fans 2.8 Mlb/hr 50°F 70% RH
Condensate 36,000 lb/hr
Electrostatic Precipitator
496,000 lb/hr 115°F
90°F 60% RH
Drying Building Air 2.8 Mlb/hr 130°F
Drying
Dome
Retrofit
Boiler
��������������������������������������������������������������������������������
Underfire Air 208,000 lb/hr 720°F
Overfire Air 208,000 lb/hr
720°F
��������������������������������������������������������������������������������������������������������������������������������������������������������������������������������������������������������Main Fuel Bed
��������������������
Dump Grate
Air
Combustion Air
Preheater
Ash Handling and Recycling Bottom ash will be collected using the existing ash sluice system at the Minnesota Valley plant (the ash dump grate may need rework for use with wood fuel). An ash pelletizing system will be added to capture the ash from the precipitator and compress it into an easier to handle form for recycling as fertilizer or disposal. The pelletized ash produced from the operation of the WTE™ plant may be used as a slow release fertilizer on the tree plantations. Unlike coal ash, ash produced by the direct combustion of wood is not acidic, contains only minute amounts of heavy metals, and is rich in calcium, potassium, phosphorous and magnesium. Land spreading of WTE™ ash likely not be regulated by the MPCA. If the ash cannot be used as a fertilizer, current permits would allow for disposal in existing ash ponds at the Sherco plant in Monticello.
Air Emissions and Water Resources 53
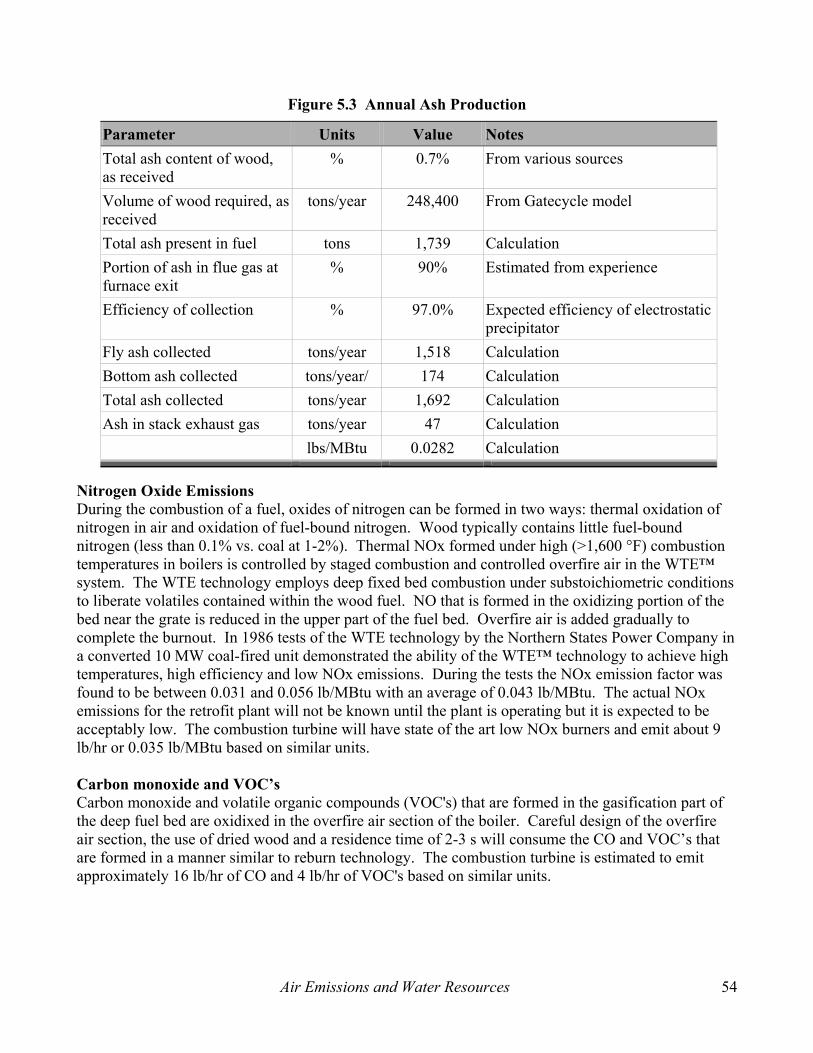
Figure 5.3 Annual Ash Production
Parameter Units Value Notes Total ash content of wood, as received
% 0.7% From various sources
Volume of wood required, as received
tons/year 248,400 From Gatecycle model
Total ash present in fuel tons 1,739 Calculation Portion of ash in flue gas at furnace exit
% 90% Estimated from experience
Efficiency of collection % 97.0% Expected efficiency of electrostatic precipitator
Fly ash collected tons/year 1,518 Calculation Bottom ash collected tons/year/ 174 Calculation Total ash collected tons/year 1,692 Calculation Ash in stack exhaust gas tons/year 47 Calculation lbs/MBtu 0.0282 Calculation
Nitrogen Oxide Emissions During the combustion of a fuel, oxides of nitrogen can be formed in two ways: thermal oxidation of nitrogen in air and oxidation of fuel-bound nitrogen. Wood typically contains little fuel-bound nitrogen (less than 0.1% vs. coal at 1-2%). Thermal NOx formed under high (>1,600 °F) combustion temperatures in boilers is controlled by staged combustion and controlled overfire air in the WTE™ system. The WTE technology employs deep fixed bed combustion under substoichiometric conditions to liberate volatiles contained within the wood fuel. NO that is formed in the oxidizing portion of the bed near the grate is reduced in the upper part of the fuel bed. Overfire air is added gradually to complete the burnout. In 1986 tests of the WTE technology by the Northern States Power Company in a converted 10 MW coal-fired unit demonstrated the ability of the WTE™ technology to achieve high temperatures, high efficiency and low NOx emissions. During the tests the NOx emission factor was found to be between 0.031 and 0.056 lb/MBtu with an average of 0.043 lb/MBtu. The actual NOx emissions for the retrofit plant will not be known until the plant is operating but it is expected to be acceptably low. The combustion turbine will have state of the art low NOx burners and emit about 9 lb/hr or 0.035 lb/MBtu based on similar units. Carbon monoxide and VOC’s Carbon monoxide and volatile organic compounds (VOC's) that are formed in the gasification part of the deep fuel bed are oxidixed in the overfire air section of the boiler. Careful design of the overfire air section, the use of dried wood and a residence time of 2-3 s will consume the CO and VOC’s that are formed in a manner similar to reburn technology. The combustion turbine is estimated to emit approximately 16 lb/hr of CO and 4 lb/hr of VOC's based on similar units.
Air Emissions and Water Resources 54

River Water Authorization Minnesota River water is used by power plant for condenser cooling, makeup water, ash sluicing, and potable water. Each of these uses is discussed below and the impact of converting to WTE is assessed. The Minnesota Valley Plant is authorized by existing permits to annually use up to 13.7 billion gallons of water from the river. The plant has 9 pumps with a total pumping capacity of 53,000 gpm (this includes the large pumps that originally served the old steam generators that are not being used). During 1995 when the plant had 153 starts and ran up to 16 hours per day, the Annual Water Appropriation Report totaled 2.8 billion gallons. During 1994, the plant ran 210 days and reported using 3.8 billion gallons. Before that the plant typically ran 210 days per year for 16 hours per day. In recent years the plant has been run on an emergency use basis and to maintain the operating condition of the equipment. Circulating Water The primary use of river water at the Minnesota Valley Plant is for once-through cooling of the steam condenser. The two main circulating water pumps are rated at 26,000 gpm at full capacity. The trash screens (two Rex traveling water screens).were rebuilt in 1994. During the power plant tests last June the hotwell the temperature was 221°F and the pressure was 3.7 in. Hg, which is higher than the original design conditions. The circulating water temperature rose from 73°F to 93°F, a 20 degree rise which is consistent with past experience. During the retrofit process the circulating pumps should be inspected for wear. For the WTE retrofit case with the feedwater heaters bypassed the circulating water temperature rise would be about 25°F. Changing the plant operation from limited use to operating 7,000 hours per year would use 10.9 billion gallons per year of river water, which is well within the permitted use of 13.7 billion gallons. However, the significant change in usage may require testing of the river water in the near downstream of the plant during different times of the year. Boiler Makeup Water The primary uses for makeup water are the hogger (condensor air evactor) and sootblowing. The need for sootblowing and hand lancing is expected to be reduced for wood burning based on previous testing and experience burning wood. Makeup water used for the hogger is expected to stay the same. Historically, boiler makeup water was produced from Minnesota River water treated with hydrated lime and soda ash in a mixing vessel and pumped to a 1250 gal/hr Permutit hot lime soda water softner. When in use, the evaporator produced between 1,000 and 1,100 gpm for up to 6 hours per shift. Continuous blowdown to the evaporator was also a normal part of the operation (continuous blowdown will not be needed for WTE operations). This equipment was adequate in 1995. In recent years when operation was run strictly for emergency and for testing, water for makeup was trucked from the Angus Anson Plant. When the boiler is drained, the water is stored in surge tanks for reuse. The existing equipment at the plant is expected to be adequate for providing boiler makeup water in the retrofitted plant. Compared to a coal plant operated at the same capacity factor, the WTE plant is expected to require less boiler makeup water primarily due to the lessened need for soot blowing and blowdown. New plants typically use well water and demineralizers to provide boiler makeup water. This is an option that could be considered for the retrofit plant.
Air Emissions and Water Resources 55

Ash Sluicing Fly ash is collected from economizer and electrostatic precipitator hoppers through a hydroveyor and sluiced to ash settling ponds east of the plant. Bottom ash is sluiced directly to ash pond. A separate pump that provides unfiltered river water to sluice the ash, and discharge from the ponds flows back to the river. Coal ash was periodically dredged out and trucked to the Sherco ash site. With wood ash less sluice water is needed because there is much less ash than with coal. Ash pelletizing equipment will be installed, and the ash pellets will be used on the tree farms. Potable Water There is currently no potable water in the plant. Water for showers, sinks and toilets comes from the river and is sand filtered, softened and passes thru an ultraviolet "cleaner". Bottled water is used for drinking. This approach is probably adequate for the retrofit WTE plant. The increased staffing level needed to operate the plant continuously would require additional bottled water. Sewage System A septic tank to capture sewage and other drainage from the plant is located east of the plant near the discharge channel. It is pumped as needed. There is a question of whether it may be leaking. The septic tank may need to be tested and brought up to current standards. More frequent pumping would be required based on higher usage. Other Water Uses A small amount of water is used for cooling equipment such as motor and equipment bearings. Separate pumps draw this water from the river supply into the plant where it is filtered and used for cooling. The amount used is negligible but will increase with the WTE retrofit because the plant will likely be operated at a higher capacity than in recent years. For the combustion turbine no open cycle water will be consumed or discharged.
Air Emissions and Water Resources 56

6. Permits Background This section summarizes the issues and permit requirements related to converting the existing coal-fired furnace at the Minnesota Valley plant to a WTE™ combined cycle unit. A WTE™ plant is subject to similar regulations and procedures as like-sized coal-fired facilities. As part of this activity, the requirements for site and facility permits including water usage, air emissions, ash handling, plant operations and plant expansion were reviewed. The Minnesota Valley power plant is located outside of Granite Falls, MN between Hwy 212 and the Minnesota River (Figure 6.1). Since the plant is currently used infrequently as a coal-fired peaking plant and has been used in the past as a base-load plant, permits covering the existing plant are in force. The retrofit plant can be grandfathered-in on some on these permits and needs updated permits to operate as a combined-cycle WTE power plant.
Figure 6.1 Minnesota Valley Plant Location
The retrofit project consists of a) modification of the existing boiler to WTE configuration including removal of coal burners and pulverizers, addition of a wood feed system and conversion to a fixed bed; and b) addition of a 24 MW gas turbine. Heat from the turbine exhaust will be used to heat the boiler feedwater. The boiler will have a peak heat input of 540 million Btu/hr and a power output of 53 MW; and the 24 MW gas turbine will have a heat input of 254 million Btu. The general permitting tasks needed prior to initiating WTE™ modifications at Minnesota Valley are:
Permits 57

1. Meet with state regulators to review plans for facility restart. (Obtain Certificate of Need if required).
2. Conduct environmental walk downs to identify any problems with hazardous or toxic waste prior to conducting modifications.
3. Conduct environmental review (land, air, water, ash by-product) in support of potential Environmental Assessment Worksheet preparation.
4. Submit Power Plant Siting plan to Environmental Quality Board
5. Develop monitoring plan and install monitoring equipment.6. Prepare air quality permit (Prevention of Significant Deterioration - PSD, New Source Performance Standards - NSPS etc.)
7. State review, public comments, modify as needed and issue air permit.
8. Amend and submit National Pollutant Discharge Elimination System (NPDES) permit application.
9. State review application and issue NPDES permit, Water Appropriation etc.
10. Prepare and submit ash by-product recycling plan.
11. State review and approval of ash recycling plan.
12. Construction permits, local building permits, fuel supply permitting issues. The permitting process may take 12-24 months to complete before construction activities can start. We assume ambient air quality is not required. The retrofit plant will have to re-qualify for various site, air and water permits, as discussed below. Some permits are likely to be grandfathered in like the water usage permits while others will require new or updated permits. Most regulations in this area, whether state or federal, are administered by state agencies, particularly the Minnesota Pollution Control Agency. Local approval may also be required, in some circumstances. Water Permits Key permits related to water usage and disposal for the retrofit plant include:
• MN DNR: Water Appropriation Authorization • NPDES: National Pollutant Discharge Elimination System • SWCC : Stormwater runoff requirements and testing. • SPCC: Spill Prevention Control & Countermeasure
Water Appropriations Permit: A Water Appropriations Permit from the Minnesota Department of Natural Resources is required for all users withdrawing more than 10,000 gallons of water per day or 1 million gallons per year. All permitted water users are required to submit annual reports of water use. The Minnesota Valley plant has an active and current Water Appropriations Permit (#764356). The permit authorizes the annual use of up to 13.7 billion gallons of water from the river. The permit covers 9 pumps/intake pipes with a total capacity of 53,000 gpm. Most of the volume of water is used for non-contact cooling water for the condenser and for cooling other plant equipment - most of which is returned to the river. Some of the water is used for sluicing ash (contacts ash) to the settling ponds. Boiler blowdown water and makeup water also use processed river water.
Permits 58

During 1995, when they ran 153 days in 1995 and ran up to 16 hours per day, the plants Annual Water Appropriation Report totaled 2.8 billion gallons. In the past 5 years the maximum usage has been only 363 million gallons per year in 1998. The retrofit WTE plant will use approximately 10.9 billion gallons per year at full load (and 80% capacity factor) - well within the permitted range for the plant today. Most of this water will be circulated through the condensers and returned to the river directly at about 26ºF warmer than the normal river water temperature. With the existing permit, the river temperature at the end of the mixing zone - 3600 feet down river is limited to a temperature rise of no more than 5ºF above the inlet temperature. (Note: In the summer months, with low river flow, the high river temperature may cause poor performance of the steam turbine and require load reductions to stay within the mixing zone limit. The Water Appropriations Permit is expected to be extended for use by the new retrofit plant. NPDES Permit As authorized by the Clean Water Act, the National Pollutant Discharge Elimination System (NPDES) permit program controls water pollution by regulating point sources that discharge pollutants into waters of the United States. Point sources are discrete conveyances such as pipes or man-made ditches. In Minnesota, the NPDES permit program is administered by the Minnesota Pollution Control Agency (MPCA). Ongoing monitoring is required to characterize waste streams and receiving waters, evaluate wastewater treatment efficiency, and determine compliance with permit conditions. The Minnesota Valley plant has an NPDES permit in force currently that will need to be updated to reflect the retrofit plant conditions and requirements. (Note: New NPDES standards are pending and may be in effect by May, 2003).The current permit has effluent limits for boron, selenium, and mercury. Converting the plant from coal to wood will reduce the potential for effluent discharges. The retrofit plant may need a well to provide potable water and a demineralizer for boiler makeup and NOx control. The existing permit should be easily modified to reflect the impact of the fuel changes and the addition of a well, if needed. Stormwater Discharges The conversion of the Minnesota Valley plant from coal to wood will significantly reduce the potential for runoff of harmful pollutants. The wood fuel will be stored under a large dome, and the runoff from the dome roof will be managed to avoid erosion. The retrofit plant will not be storing any toxic materials or chemicals that would have potential contact with stormwater. Included in the NPDES permit process are regulations covering stormwater runoff during construction activities. Storm water runoff from construction activities can have a significant impact on water quality, contributing sediment and other pollutants exposed at construction sites. The NPDES permit application must be submitted at least 7 days before construction is to begin. The MPCA is authorized to implement the NPDES program for stormwater in Minnesota. As of March 10, 2003, all small construction activities (disturbing one to five acres) must apply for permit coverage. The retrofit project at Minnesota Valley will likely be classified as a small project since all of the construction activity will take place on the existing plant site. The primary activities include demolition of existing coal handling facilities, road construction, excavation and construction of drying dome. Modifications to the existing water intake system may also be required (see below)., Development of a storm water pollution prevention plan and implementation of soil erosion and
Permits 59

sedimentation practices (best management practices) are part of the permit application and site management process. The NPDEC permit to cover construction activities is expected to be relatively straightforward. Information required for submission of the permit request will include preliminary construction plans, site surveys/maps, a storm water prevention plan and a project schedule. Sewage Treatment The Minnesota Valley Plant does not have a sewage treatment systems. A septic tank-subsurface disposal system serves the powerhouse, and is in service. The existing system should be carefully inspected and evaluated. Cooling Water Intake Structures The Minnesota Valley plant has an existing cooling water intake system. The proposed WTE™ plant would use the existing intake piping and filtering structures. While the existing cooling water intake meets existing EPA regulations, new rules have been proposed and are in the process of review that may effect the proposed project. The new rule will apply to certain existing power producing facilities that employ a cooling water intake structure and that withdraw 50 million gallons per day (MGD) or more of water from rivers, streams, lakes, reservoirs, estuaries, oceans, or other waters of the U.S. for cooling purposes. The proposed WTE™ plant will use 13 million gallons per hour at full capacity. Section 316(b) of the Clean Water Act requires EPA to ensure that the location, design, construction, and capacity of cooling water intake structures reflect the best technology available for minimizing adverse environmental impact. The proposed regulation is designed to protect fish, shellfish, and other aquatic life from being killed or injured by cooling water intake structures. The proposed national requirements would be implemented through National Pollutant Discharge Elimination System (NPDES) permits, The proposed requirements will vary according to the environmental sensitivity of the water source, the percentage of the source waterbody withdrawn, and facility utilization rate. It expected that existing facilities like Minnesota Valley will have several ways to meet the requirements including retrofit, exemption (if cost is too high) and remediation. Spill Prevention, Control and Countermeasure Requirements An SPCC plan must be prepared by all facilities subject to regulation. This plan is to help prevent any discharge of oil into navigable waters or adjoining shorelines. Before a facility is subject to the SPCC rule, it must meet three criteria:
• it must be non-transportation-related; • it must have an aggregate above-ground storage capacity greater than 1,320 gallons or a
completely buried storage capacity greater than 42,000 gallons; and • there must be a reasonable expectation of a discharge into or upon navigable waters of the
United States or ad-joining shorelines. In the past, oil has been used to ignite the furnace during startup. In the retrofit plant, natural gas will be used for igniting the main fuel pile during startup. On-site oil storage for the retrofit plant may not be necessary or may be limited to less than the 1,320 gallon threshold requiring an SPCC plan.
Permits 60

Air Emissions Permits Background The existing Minnesota Valley plant is currently operated infrequently for emergency and testing purposes only. In 2001, the plant was on-line only for URGE, Relative Assurance Test Audit and other testing requirements. The plant has not operated at significant load in the past 10+ years. Because of the existing plant's age, it is grandfathered in to most existing air quality rules and would not need to meet the air emissions requirements for new or modified rules if it were to continue operating as a coal plant (assuming significant modifications were not required to upgrade the plant for continuous operations). The new retrofit plant would be operated as a base load plant and will add additional capacity. Since major modifications will be required to retrofit the plant to burn wood and add the combustion turbine, air emissions requirements will need to be re-considered. New Source Review & New Source Performance Standards The EPA has developed New Source Performance Standards (NSPS) (contained in 40 CFR Part 60) that apply to specific categories of sources and emission units. The NSPS require a new or modified emission source to be less polluting than older sources. The NSPS standards apply to the six criteria pollutants (nitrogen oxides (NOx), sulfur dioxide (SO2), Ozone/Volatile Organic Compounds (VOCs), particulate matter (PM) and particulate matter less than 10 microns in size (PM10), carbon monoxide (CO), and lead (Pb)). NSPS applies to specific units (i.e. not whole facilities). For a new boiler that burns wood the Federal NSPS 40 CFR Part 60, Subpart Db applies. That is, PM emissions shall not exceed 0.10 lb/million Btu and stack opacity shall not exceed 20 percent (6 minute average) except for one 6 minute period per hour of not more than 27 % opacity. There are no stricter standards in Minnesota state rules. Because of the inherently low inorganic matter in wood, it is anticipated that the retrofitted boiler with existing electrostatic precipitator will meet the new source particulate emission regulations. Note that the NOx requirement of subpart Db will be met by limiting natural gas combustion to below specified annual capacity levels. The applicability of Subpart Da, for utility steam generating units, will have to be assessed as well. If natural gas is used for startup, it is possible that Subpart Da may apply instead of Db. For the combustion turbine, 40 CFR Part 60, Subparts GG apply. NOX emissions in percent by volume (at 15% oxygen and on a dry basis) shall not exceed 0.0150*14.4/HR, where HR is the turbine heat rate in kJ/Wh and is based on the lower heating value. The expected turbine heat rate is 9215 Btu/kWh = 9.71 kJ/Wh (1 Btu = 1.054 kJ) so that the NOX emission limit is 0.0022 % = 22 ppm. If the fuel-bound nitrogen is greater than 0.015% by weight an additional allowance is made according to section 60.332(a)(3). As needed, the combustion turbine emissions can be controlled for NOx using selective catalytic reduction (SCR) with ammonia injection, for CO with catalytic oxidation, and for PM-10 with good combustion practice. New Source Review (NSR) - Prevention of Significant Deterioration The Prevention of Significant Deterioration (PSD) program applies to construction of new major facilities and major modifications to existing major facilities located in attainment areas. The program considers the emissions of all units at the facility combined for determination of major sources and major modifications designations.
Permits 61
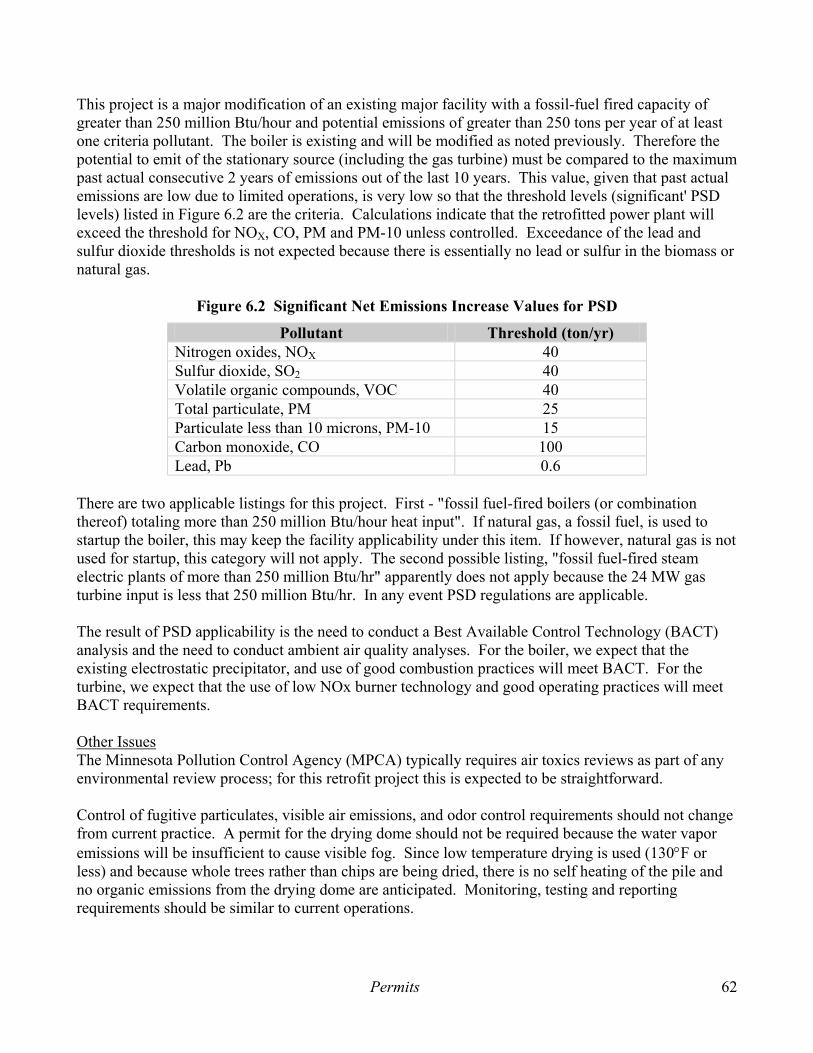
This project is a major modification of an existing major facility with a fossil-fuel fired capacity of greater than 250 million Btu/hour and potential emissions of greater than 250 tons per year of at least one criteria pollutant. The boiler is existing and will be modified as noted previously. Therefore the potential to emit of the stationary source (including the gas turbine) must be compared to the maximum past actual consecutive 2 years of emissions out of the last 10 years. This value, given that past actual emissions are low due to limited operations, is very low so that the threshold levels (significant' PSD levels) listed in Figure 6.2 are the criteria. Calculations indicate that the retrofitted power plant will exceed the threshold for NOX, CO, PM and PM-10 unless controlled. Exceedance of the lead and sulfur dioxide thresholds is not expected because there is essentially no lead or sulfur in the biomass or natural gas.
Figure 6.2 Significant Net Emissions Increase Values for PSD
Pollutant Threshold (ton/yr) Nitrogen oxides, NOX 40 Sulfur dioxide, SO2 40 Volatile organic compounds, VOC 40 Total particulate, PM 25 Particulate less than 10 microns, PM-10 15 Carbon monoxide, CO 100 Lead, Pb 0.6
There are two applicable listings for this project. First - "fossil fuel-fired boilers (or combination thereof) totaling more than 250 million Btu/hour heat input". If natural gas, a fossil fuel, is used to startup the boiler, this may keep the facility applicability under this item. If however, natural gas is not used for startup, this category will not apply. The second possible listing, "fossil fuel-fired steam electric plants of more than 250 million Btu/hr" apparently does not apply because the 24 MW gas turbine input is less that 250 million Btu/hr. In any event PSD regulations are applicable. The result of PSD applicability is the need to conduct a Best Available Control Technology (BACT) analysis and the need to conduct ambient air quality analyses. For the boiler, we expect that the existing electrostatic precipitator, and use of good combustion practices will meet BACT. For the turbine, we expect that the use of low NOx burner technology and good operating practices will meet BACT requirements. Other Issues The Minnesota Pollution Control Agency (MPCA) typically requires air toxics reviews as part of any environmental review process; for this retrofit project this is expected to be straightforward. Control of fugitive particulates, visible air emissions, and odor control requirements should not change from current practice. A permit for the drying dome should not be required because the water vapor emissions will be insufficient to cause visible fog. Since low temperature drying is used (130°F or less) and because whole trees rather than chips are being dried, there is no self heating of the pile and no organic emissions from the drying dome are anticipated. Monitoring, testing and reporting requirements should be similar to current operations.
Permits 62
Air Permitting Process In Minnesota, New Source Review requirements are managed by the Minnesota Pollution Control Agency. Air quality permits are required to operate existing air emission facilities and to begin construction on new or modified facilities. In Minnesota one permit is issued covering both construction and operation in cases where construction or modification occurs; no separate construction permit is issued in Minnesota. A permit will need to be obtained from the MPCA to address applicable NSPS and PSD requirements prior to beginning construction of the modifications. The air permit issued by the MPCA will establish limits on the amount of certain pollutants that can be emitted from the facility. The permit will contain conditions regarding monitoring of emissions and reporting. Power Plant Siting Depending primarily on the size of the facility, either an Environmental Assessment Worksheet (EAW) or an Environmental Impact Statement (EIS) would be prepared on a new facility. An EIS is required for a facility greater than 50 MW. For a facility between 25 MW and 50 MW, the Environmental Quality Board is required to prepare an EAW. For small facilities between 5 and 25 megawatts, the local unit of government where the facility is located has discretion on whether to prepare an EAW. For facilities that burn natural gas or are less than 80 MW, proposers may opt to pursue permitting with local officials. New power plants between 5 MW and 25 MW are subject to discretionary review. The retrofit project at the Minnesota Valley plant should only need to work with local officials with respect to power plant siting issues. The conversion of the existing coal plant to burn wood would will not require a siting permit since this is an existing plant. The addition of a 24 MW of gas-fired combustion turbine may be considered a "new facility" but the small size allows the permitting process to be completed with local officials in Granite Falls. As part of this process, an environmental assessment worksheet may be required. (Although, given the small size of the combustion turbine, it is likely that an EIS will not be required). Other Permits Local Permits General permits from Granite Falls covering normal construction project activities such as site plan review, zoning, electrical, and plumbing will also be required before construction can begin. Chippewa County may also become involved if any changes in county access roads are required as part of this project. Certificate of Need Prior to the issuance of a site permit, a certificate of need from the Minnesota Public Utilities Commission is normally required for a proposed large plant. (Minn. Stat. § 216B.243). Because the WTE portion of the plant is retrofitting an existing plant to use a renewable resource, no certificate of need should be required. The combustion turbine portion is not considered a large source so a certificate of need should not be required for this part either. In any case, if a certificate of need is required, there is sufficient data to support the need for additional electric generating capacity based on renewable energy sources.
Permits 63
Hazardous Waste A walk-down of the existing plant and surrounding area should be conducted prior to construction activities to determine compliance with hazardous waste regulations. Fuel Supply Permits Although no permits are required to grow trees for fuel, several types of permits related to managing the fuel supply may need to be obtained including:
• Herbicide control permit may be necessary. • Permit to use wood ash pellets for nutrient addition may be required (see below). • Permit to haul wide/long loads of trees (in lieu of individual move permits) • Permit to move harvester (in lieu of individual move permits)
Obtaining these permits is expected to be straightforward. The fuel supply development team and/or the project operator would manage this process as needed. Ash Disposal on Tree Farm Fields At full load the retrofit plant will produce about 1,500 tons per year of fly ash and 175 tons per year of bottom ash. The bottom ash will be ground and mixed with the fly ash in a pug mill and pelletized into 1 in. diameter by 2 in. long pellets. The pellets will be trucked to the tree farms and spread on the fields once during the five year growing period at the rate of roughly one pellet per 25 ft2. This will require 67 truck hauls per year with a 25 ton load. The ash pellets will be stored on a short term basis in the drying dome for later delivery the fields. Wood ash is a valuable soil amendment and replacement for commercial lime and fertilizer. Wood ash contains potash and phosphate essential for plant growth. Wood ash is very low in heavy metals. The ash is pelletized for slow release to the soil.
Permits 64

7. Environmental Impact
The first section reviews the differential impact of plant operations on the air, water and land resources surrounding the plant. The second section reviews the differential impact of using locally grown wood for fuel compared to coal shipped in from out-of-state mines. Power Plant Operations Operating a power plant has an environmental impact on the nearby air, water and land resources. Air impacts include emissions from the flue gas such as particulates, sulfur dioxide, nitrogen oxides and carbon dioxide. Water impacts include temperature rise, contamination, and construction and stormwater runoff. Land impacts from plant operations include construction effects, ash and waste disposal and increased truck traffic. Limits on these environmental effects are set by federal, state and local regulations. The operating conditions of the WTE™ Combined Cycle power plant are compared to a plant operating on sub-bituminous coal in Figure 7.1. Wood and coal have very different characteristics as fuel sources (Figure 7.2). The constituent components of each fuel has a significant impact on the type and amount of each emission. The air emission profile of the WTE™ unit is expected to be quite different from that of a conventional pulverized-coal boiler not equipped with the latest environmental control devices. As an example, wood is naturally lower in ash and sulfur making it much easier and cheaper to meet current environmental regulations when burned in a modern, high- efficiency furnace. Operation of the WTE™ retrofit unit at Minnesota Valley would meet or exceed all applicable air emissions standards. The expected levels of emissions from a WTE™ or coal plant at Minnesota Valley are summarized in the following section. The expected emissions levels for WTE were calculated using the estimated fuel requirements, output from the Gatecycle model and emissions data from large-scale testing of the WTE™ system completed by NSP in earlier testing. Coal emissions were estimated from output from the Gatecycle model and comparable coal plants operating today.
Environmental Impact 65

Figure 7.1 Plant Operating Conditions for WTE™ Combined Cycle Vs. Coal
Characteristic Units WTE CC Coal Net power output MW 72.0 42.4
Auxiliary power requirements MW 2.6 3.0
Net plant heat rate Btu/kWh 10,130 11,366
Capacity factor % 80% 80%
Net generation MWh 504,580 297,140
Net plant efficiency % 33.7 30.0
Steamflow into turbine lb/hr 385,000 385,000
Boiler blowdown, lb/hr 2,000 5,000
Soot blowing, lb/hr Not modeled Not modeled
Makeup water lb/hr 2,000 5,000
Net steam power output MW 47.7 42.4
Boiler efficiency, % 81.1 86.2
Higher heating value, dry Btu/lb 8,700 12,450
Fuel feed rate, as fired
Natural gas
lb/hr
lb/hr
70,900
10,646
50,520
Fuel flow rate, dry
Natural gas lb/hr 54,590
10,646 38,698
Annual fuel, dry
Annual natural gas tons 191,300
37,300 135,600
Wood @ 23% moisture and sub-bituminous coal @ 23.4% moisture Based on higher heating value of fuel
Environmental Impact 66

Figure 7.2 Fuel Properties of Wood, Natural Gas and Coal
Ultimate Analysis (dry) Wood Natural Gas Coal**
Carbon 51.0 69.3 72.0
Hydrogen 6.5 22.7 5.0
Oxygen 41.8 0.0 16.4
Ash 0.7 0.0 5.2
Sulfur (expected) <0.00035 0.0 0.44
Nitrogen (expected) <0.1 8.0* 0.95
Total 100.0 100.0 100.00
Proximate Analysis (dry)
Volatiles 80.0 100.0 40.8
Fixed carbon 19.3 0.0 54.0
Ash 0.7 0.0 5.2
Total 100.0 100.0 100.0
Fuel Higher Heating Value (dry), Btu/lb
8,700 23,800 12,450
Fuel Higher Heating Value
(as-burned), Btu/lb
6,700 23,800 9,450
N2 gas, not organic nitrogen ** Decker, MT sub-bituminous coal
Ash and Particulates One advantage of wood is it's naturally low ash content. The ash content, especially in short rotation trees grown specifically for the WTE plant, should average less than 0.7% by weight. This compares to sub-bituminous coal at 4% or more. Lower ash results in significantly less ash and lower particulate emissions. At design capacity, the total ash production for Minnesota Valley will be about 1,692 tons annually (Figure 7.3). This averages less than 5 tons per day or less than one truckload. Approximately 10% (174 tons/yr) of the ash collected will be bottom ash and the other 90% (1,518 tons/yr) will be removed by the existing electrostatic precipitator. Total particulate emissions from the stack are expected to be less than 47 tons per year. The combustion turbine will not add to the ash and particulate emissions for the retrofit plant. As modeled, a comparable coal plant at Minnesota Valley will produce 5,470 tons/year of ash and 167 tons/yr of particulate emissions without the addition of extra pollution control equipment (see Appendix 3 for detailed calculations).
Environmental Impact 67

A secondary advantage is that the wood ash has very low levels of heavy metals and other contaminants so is can generally be used as a fertilizer either on the fuel plantations or other farmland. Unlike coal ash, ash produced by the direct combustion of wood is not acidic, contains only minute amounts of heavy metals, and is rich in calcium, potassium, phosphorous and magnesium. Ash produced from the operation of the WTE™ at Minnesota Valley would either be given to local landowners to be used as a fertilizer or returned to the wood harvesting area to recycle its valuable nutrients back to the soil. An ash pelletizing system is included as part of the project budget. Coal ash must be stored indefinitely in specially designed settling ponds because of its high levels of contaminants. Sulfur Dioxide Emissions Emissions of SOx from the WTE™ plant will be extremely low because there is almost no sulfur in wood. The typical sulfur content is 0.01% or less while coal is 0.5% or more. At full capacity, the sulfur dioxide emissions are about 14.2 lb/hr or 49.6 ton/yr which is less than 0.030 lb/MBtu. The SOx emissions from a comparable coal plant will be 372 lb/hr (1302 ton/yr) or almost 1 lb/MBtu - about 26 times higher than WTE™. The current standard for SO2 is 0.1 lb/MBtu. To meet current pollution control standards for SO2, a coal plant will require the addition of expensive flue gas desulfurization equipment. Installation of SO2 environmental control technologies would not be necessary with the WTE™ technology. Nitrogen Oxide Emissions During the combustion of a fuel, oxides of nitrogen can be formed in two ways: thermal oxidation of nitrogen in air and oxidation of fuel-bound nitrogen. Wood contains little fuel-bound nitrogen (less than 0.1% vs. coal at 1-2%). Thermal NOx formed under high (>1,600 °F) combustion temperatures typical in boilers is controlled by staged combustion and low excess air in the WTE™ system. The WTE technology employs deep fixed bed combustion under substoichiometric conditions to liberate volatiles contained within the wood fuel. NO that is formed in the oxidizing portion of the bed near the grate is reduced in the upper part of the fuel bed. Overfire air is added gradually to complete the burnout. In 1986 tests of the WTE technology by the Northern States Power Company in a converted 10 MW coal-fired unit demonstrated the ability of the WTE™ technology to achieve high temperatures, high efficiency and low NOx emissions (Figure 7.4). During the tests the NOx emission factor was found to be between 0.031 and 0.056 lb/MBtu with an average of 0.043 lb/MBtu. The actual NOx emissions for the retrofit plant will not be known until the plant is operating but they should be acceptably low. The combustion turbine will have state of the art low NOx burners and emit about 9 lb/hr based on similar units. Carbon monoxide and VOC’s Carbon monoxide and volatile organic compounds (VOC's) that are formed in the gasification part of the deep fuel bed are oxidixed in the overfire air section of the boiler. Careful design of the overfire air section, the use of dried wood and a residence time of 2-3 s will consume the CO and VOC’s that are formed. The combustion turbine is estimated to emit approximately 16 lb/hr of CO and 4 lb/hr of VOC's based on similar units. Carbon Dioxide The combustion of any material containing carbon (e.g., coal, wood, etc.) produces carbon dioxide, the most prevalent manmade greenhouse gas. Although wood combustion introduces similar amounts of CO2 into the atmosphere compared to coal, wood is CO2 neutral because the CO2 released is reabsorbed by new biomass growth. Dedicated biomass crops are termed ‘closed loop biomass’
Environmental Impact 68

because new biomass growth starts right after harvest. The WTE retrofit will recycle 54,500 lb/hr of CO2. The combustion turbine, which uses natural gas, will emit 16,000 lb/hr of CO2.
Figure 7.3 Projected Air Emissions for Minnesota Valley WTE™ Combined Cycle
Parameter
Units
Combined Cycle WTE
Combined Cycle
Nat. Gas
Sub-Bituminous
Coal Steam flow rate lb/hr 385,000 385,000 Fuel feed rate, as received
lb/hr 70,900 10,646 50,520
Ash collected lb/hr 483 0.0 1951 ton/yr 1,692 0.0 6,836 lb/MBtu 0.89 0.0 4.05 Particulate emissions, lb/hr 13.4 0.0 59.7 ton/yr 47 0.0 209 (2) lb/MBtu 0.028 0.0 0.125 Sulfur dioxide lb/hr 14.2 0.0 464 ton/yr 49.6 0.0 1,627 (3) lb/MBtu 0.030 0.0 1.0 Carbon dioxide, net lb/hr 0 (1) 19,110 101,297 ton/yr 0 (1) 66,500 354,945 lb/MBtu 0 (1) 210 Nitrogen oxide lb/MBtu 0.043 (4)
(1) Emissions of CO2 will be about 98,600 lb/hr, 345,000 tons/yr or 208 lb/MBtu but the tree plantations will be sequestering an equal amount for a net CO2 contribution of approximately zero. (2) Does not include bag house. A coal plant would require a bag house to minimize particulate emissions. (3) Does not include desulfuring equipment that would be required for a coal plant. (4) From test results of WTE technology in modified 10 MW boiler. (5) The gas-fired combustion turbine will add primarily CO2 and some NOx as part of the WTE™ combined cycle. (6) ESP collection efficiency is 97%, no carbon in ash, and all ash is flyash. (7) All sulfur in fuel goes to sulfur dioxide.
Environmental Impact 69

Figure 7.4 Results From a 72-Hour Test Run in a Modified 10 MW Coal-Fired Boiler
Regulated Emission
Test Measurement (lb/MBtu)
Sulfur Dioxide 0.0004
Nitrogen Oxide 0.043
Particulates 0.87b
a. Old standards. New standards for SOx and NOx are 0.8 lb/MBtu and 0.4 lb/MBtu respectively. b. Boiler was not equipped with a particulate collection system during test. Source: PACE Laboratories, "Results of the Particulates and Oxides of Sulfur and Nitrogen Emissions Engineering Tests on the Number 3 Boiler at the NSP Facility Located in Ashland, Wisconsin.", August and October, 1986
Construction Impacts Most of the physical modifications to the existing site would be within the confines of the powerhouse. However, some structures outside the powerhouse would need to be moved, upgraded, or dismantled. New structures (such as the combined wood storage/drying dome and the rerouting of a service road) would require construction in previously undisturbed areas at the site. For a coal plant, upgrades to the existing coal unloading/crushing and storage facilities would be needed in addition to new construction such as a bag house and flue gas desulfuring facilities. In either case, these construction-related impacts will be temporary and can be effectively managed using normal site management techniques. Other Impacts On site noise from both construction and operation of the WTE™ unit would increase from present levels since the plant is currently inactive. Operation of heavy equipment during construction, and fuel delivery trucks and unloading equipment during operation would be responsible for the majority of the increase. During normal operation, the noise level generated by a retrofit WTE would be comparable to a similar coal plant. Noise from operating the crane and other fuel handling equipment will be no more than noise from the outdoor coal handling equipment. There may be an increase in the frequency of noise in the local area from the truck traffic delivering wood fuel to the plant but this is expected to be within acceptable levels for the area surrounding the plant site. Noise from operation of the gas turbine may be an issue that needs to be addressed during the detailed design stage. Otherwise, noise from power plant operations will be comparable. Noise is not expected to be a significant environmental issue. Impact on Water Resources Water required for cooling and circulating water, which makes up the bulk of a plant's water requirement, for the WTE™ retrofit unit is expected similar to the coal-fired operations. The WTE™ retrofit uses less boiler make up water, due to a decreased need for soot blowing operations. No differences between WTE and coal are expected in potable water usage. The operation of power generating options at the Minnesota Valley site may be subject to unit deaerating or temporary suspension of plant operations during the hottest portions of the summer or periods where river flow
Environmental Impact 70
rates are low in order to avoid exceeding thermal discharge limits to the Minnesota River. Otherwise, no significant difference in environmental impacts to the local water resource are expected from the operation of the WTE™ compared to coal at Minnesota Valley. Environmental Impact of Growing the Fuel Supply The procurement area includes all suitable and available land within a 9 county area around Granite Falls. The entire project area is within the Minnesota River Watershed, which is primarily an agricultural area. Figure 7.5 presents a map of current land use in the region around the Minnesota Valley plant location. As noted, most of the vegetation in the procurement area for the Minnesota Valley project consists of row crops such as corn, soybeans, oats and other small grains. Native/natural vegetation is limited to steep slopes, riparian areas and flood plains that flood so often that row crops production is not economically viable. Forested areas are focused around streams, wetlands and floodplains and consist of deciduous softwood species such as cottonwood, box elder, American elm and silver maple. The drier sites support hardwood species such as red oak, white oak, and red and sugar maple. Wetlands areas are dominated a variety of grasses, thistle, rushes and sedges. Many factors interact to determine the environmental impact of SRWC’s, including crop species and management; site characteristics (soils, climate, previous land use), and amount of land in production. Some of the typical environmental effects of growing SRWC's on agricultural land are discussed in the following paragraphs and summarized in Figure 7.6. Wildlife Because the vast majority of the acres converted to SRWC for this project will be replacing existing cropland, the project will not decrease species diversity on the field level, and will actually increase diversity in and around each farm location. Numerous studies have shown an increase in mammalian and avian abundance in poplar plantations. Therefore, when hybrid poplar is planted in the place of another agricultural crop, very little adverse environmental impact is expected. Because of the rural nature of the procurement area, wildlife is common where suitable habitat is present. However, because of the intensive annual cultivation of most of the land, wildlife is limited to species that thrive in this habitat. Examples include upland grass songbirds, pheasant and deer in the upland fields, and river bottom areas support turkey, mink, beaver, muskrat, fox, songbirds and waterfowl.
Environmental Impact 71
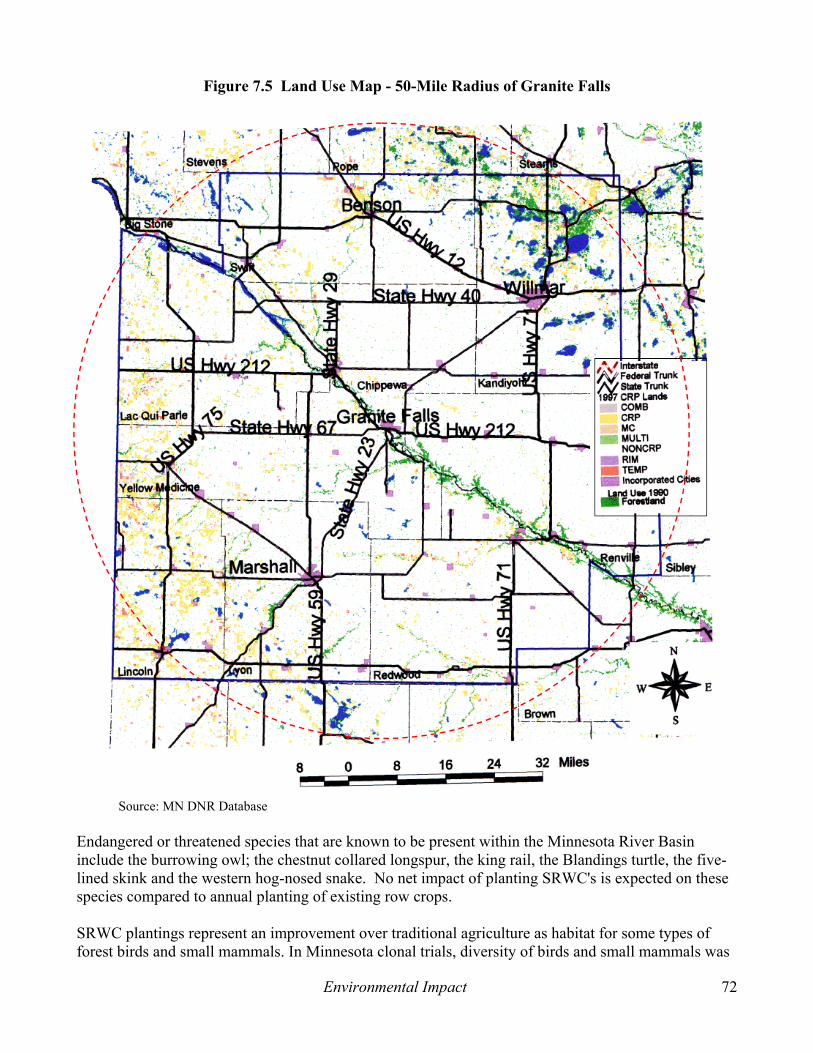
Figure 7.5 Land Use Map - 50-Mile Radius of Granite Falls
Source: MN DNR Database
Endangered or threatened species that are known to be present within the Minnesota River Basin include the burrowing owl; the chestnut collared longspur, the king rail, the Blandings turtle, the five-lined skink and the western hog-nosed snake. No net impact of planting SRWC's is expected on these species compared to annual planting of existing row crops. SRWC plantings represent an improvement over traditional agriculture as habitat for some types of forest birds and small mammals. In Minnesota clonal trials, diversity of birds and small mammals was
Environmental Impact 72

greater (in hybrid poplar stands) than that found in fields of row crops. Poplar plantations can potentially provide habitat for songbirds, game birds, raptors, deer and rodents. However, research on wildlife abundance and diversity has shown that the ecological value of SRWC plantings is very sensitive to its landscape context, as well as its age and management activities. Habitat diversity must be explicitly designed into the plantation, for example, by mixing clones, if maximizing its value to wildlife is an objective. Since hybrid poplar provides permanent cover, rather than annual cover that is plowed down in the fall and spring to plant crops, it provides a source of winter cover during harsh Minnesota winters for deer, pheasants, game birds, and other wintering wildlife. Winter cover is very important in this area because without protection, many game birds, such as pheasants, wild game animals such as deer, will not survive.
Figure 7.6 SRWC Environmental Impacts
SRWC Environmental Impact Wildlife Impact Increased diversity in species with the
conversion of cropland to woodland. Increase winter cover.
Air Impact Use of SRWC is a true closed carbon cycle system reducing net CO2 emissions to zero. Significantly lower emissions of SO2, NOx and particulates compared to coal. 1/10 of the ash production of a comparable coal plant.
Soil Impact Significantly less herbicide, pesticide and fertilizer usage with little to none used during years 3-5 of each rotation after initial 2 year plantation establishment period compared to corn and soybeans. Improved long term erosion resistance from runoff and wind. Improved water-holding capability.
Water Quality Reduced erosion in years after establishment. Lower levels of pesticide and herbicide contaminated runoff. Less nitrate and phosphate runoff
Environmental Impact 73

Air Quality Impact Short term, SRWC reduces wind blown dust and wind erosion by acting as a windbreak. Long term, the key benefit of SRWC to air quality is a net reduction in atmospheric CO2. When burning a dedicated biomass crop, the CO2 that is added to the atmosphere is offset by uptake of CO2 as the new biomass grows. On the other hand when fossil fuels are burned, CO2 from millions of years ago is added to the atmosphere. Since wood is approximately 50% carbon on a dry basis, SRWC crops sequester about 2.5 tons/acre/yr of carbon in above ground biomass. In addition, 40% of hardwood biomass is below ground in the roots so that 1 ton/acre/yr of carbon is sequestered in the roots. Thus there is a net reduction in atmospheric CO2. The amount of carbon sequestered does not give the whole story in terms of climate impact. A long-term study in Michigan that compared the Global Warming Potentials (GWPs) of several different annual crop tillage systems, perennial alfalfa, a poplar plantation, and unmanaged successional woodlands of varying ages, found that the poplar plantation had by far the lowest GWP (105 g/m2/year CO2 equivalents) of all the managed systems. This stemmed in large part from the relatively low soil N availability in the plantation that resulted in lower N2O emissions. Because N2O has much higher atmospheric warming potential than CO2, small differences in N2O emissions make large differences in GWP. Lower rates of N fertilization and tighter N cycling, compared to annual crops, ensure that N releases to the atmosphere, as well as the groundwater, will be lower in SRWC systems. Switching from coal to dedicated biomass eliminates CO2 input to the atmosphere. In addition the extensive root system creates long-term accumulation of carbon in the soil even as the aboveground portion is periodically harvested. SRWC hardwoods are acknowledged to be among the best feasible carbon sinks. Furthermore the soil chemistry of SRWC is such that emissions from the soil of another global warming gas, N2O, is reduced compared to annual crops. Water Quality Impact Water quality and evenness of flow improves with establishment of tree crops on agricultural land. The largest impacts of tree plantations on water quality may be when they are located in or near riparian zones. There is an extensive literature documenting the nutrient and sediment filtering functions of forested riparian zones. Vegetated riparian zones trap sediment and slow down water flow both aboveground and in the soils. The plants may then take up nutrients from the groundwater and immobilize them either in wood (long-term) or leaves (short-term). In addition, the slower movement of water and the often-saturated condition of the soils in the riparian zones allow anoxic conditions to develop, which favors denitrifying bacteria. These convert nitrate and nitrite to nitric or nitrous oxide (NO, N2O), which escapes into the atmosphere. Non-point source pollution by agricultural runoff is the major source of contamination for the Minnesota River. The main causes of excessive plant growth and its negative effects in lakes and streams are excessively high levels of nutrients, particularly nitrogen (N) as nitrate (NO3) and phosphorous (P) as phosphate (PO4). NO3-N is highly soluble and typically moves through the soil with groundwater, eventually reaching the water table. On the other hand, PO4,-P binds readily to clay or organic soil particles and moves only when the soil particles move, i.e. when erosion is occurring. SRWC can help remove NO3-N from the groundwater (and reduce the amount added to the soil in the first place), and helps keep PO4-P from reaching streams by prevent or slowing erosion. Numerous studies have established the effectiveness of hybrid poplars for the remediation of surface-applied municipal wastewater, including the immobilization of heavy metals and pesticides. Hybrid
Environmental Impact 74

poplar plantations are also being used as secondary recipients of treated municipal wastewater in several towns in Oregon and Washington. An advantage of trees over grasses for nutrient uptake is that tree roots can exploit deeper layers of soil. Year-round reduction from 20-150 to 2-3 mg NO3-N/L in near-surface ground water under deep-planted hybrid poplars has been demonstrated. This nutrient removal function can be beneficial not only in riparian zones but anywhere in proximity to more heavily fertilized conventional crops. Soil Quality Impact As described earlier, the soils within the procurement area are primarily loams, silt loams and clay loams. The soils in the Minnesota River basin and floodplains of its tributaries are deep alluvial soils deposited when much of the area was covered by water while the glaciers were melting. Most of the upland soils are mollisols formed under prairie grasses, and are very fertile. Of greatest concern is the impact of planting energy crops on erodible soil during the period the crops are first being established. Initial erosion levels, depending on soils and slope, may be quite high, but may be expected to decline significantly following establishment. Erosion rates might be reduced as much as 90 percent under established biomass crops in comparison to conventionally cultivated row crops. After establishment, limited or no further cultivation of the soil is usually required which significantly decreases the risk of erosion. Most row crops are cultivated multiple times annually leading to increased potential for erosion. In addition to less cultivation, rates of fertilizer and herbicide application are lower than those typically used for row crops. For example, annualized rates of herbicide applications were 11% of those applied to corn and 20% of those applied to soybeans (Figure 7.7). The Minnesota Valley project will result in poplar replacing traditional row crops. Although poplar is a crop, and will require some level of chemical uses and soil cultivation, the overall environmental impacts are expected to be much less than were associated with the crop it replaced. Figure 7.7 compares fertilizer and chemical use and estimated erosion rates for different crops. The overall affect SRWCs have on soils is very positive because the roots build organic matter and here is less soil disturbance over the life of the crop which results in less soil erosion and runoff.
Figure 7.7 Comparison of SRWC and Row Crops
Fertilizers Erosion Nitrogen Phosphorus Potassium Herbicide
Crop (ton/acre/yr) (lb/acre/yr) (lb/acre/yr) (lb/acre/yr) (lb/acre/yr) Corn 10 120 24 71 2.7 Soybeans 18 9 31 62 1.6 HECs* 0.1 27 45 80 0.22 SRWCs 0.9 11 5 14 0.35
Source: Wright, L.L., and W.G. Hohenstein (eds.). 1992. Biomass energy production in the United States: Opportunities and constraints. U.S. Department of Energy and U.S. Environmental Protection Agency. Draft, August 1992. Adapted from Office of Technology Assessment, U.S. Congress. 1993. Potential environmental impacts of bioenergy crop production: Background paper. Washington, D.C.: U.S. Government Printing Office. *HEC: Herbaceous Energy Crop (e.g., Switchgrass).
Environmental Impact 75

Startup During the first 2-3 years of plant operations, the WTE™ retrofit plant will be fueled using a combination of wastewood, wood residue and wood harvested from forest stands. The number of acres harvested will depend on the productivity of the available plots, the proportion of the harvest suitable for WTE™ and the availability of wastewood and wood residue. Harvested plots will range in size from 10 acres to 100 acres primarily in forested lands to the north of the Minnesota Valley plant. Much of the forested land in the region is privately owned. The current harvest in this region for sawtimber, pulpwood and fuel wood. Harvesting stands for WTE™ will likely use the same feller/buncher/skidder techniques used currently in typical logging operations. The main difference will be that the whole tree will be used versus just the main sawlog or pulpwood bole. Depending on the type of land being harvested, the forest may be allowed to regenerate naturally, be converted to another use (i.e. farmland or housing) or be replanted (state forestland).
Environmental Impact 76

8. Project Costs The operating and maintenance costs, fuel supply costs, and capital costs for the repowered plant are summarized in this section. Operating costs are based on typical costs for a similar size and age coal plant adjusted for a WTE™ plant. The fuel costs were developed from data specific to the area around the Minnesota Valley plant and were compiled on a mills/kWh basis. The wood fuel needed was based on 47.7 MW for the steam cycle operating 7008 hours per year (80 percent capacity factor) for a total of 334,280 MWh/ year. The combustion turbine adds 24.3 MW of capacity for a annual power output of 170,290 MWh/yr. Total plant output is 504, 600 MWh per year based on a power output of 72 MW. Inputs for fuel usage were calculated based on the heat content of each fuel, the net steam cycle efficiency of the plant of 43.3 % and the net combustion turbine efficiency of 31.8%. Fuel costs were estimated using EPS's fuel supply development model using trees planted on farmland within a 50 mile radius of the Minnesota Valley plant. Capital costs were estimated by Utility Engineering and EPS based on preliminary layout drawings for the WTE™ retrofit. Basic design specifications for the combined cycle and the Whole Tree Energy retrofit without the combustion turbine are summarized in Figure 8.1.
Figure 8.1 Operating Conditions for Retrofit Power Plant
Factor Units WTE-CC Peak Output
WTE-CC Base Load
WTE Base Load
Total net power MW 77.6 72.0 43.1
Net steam turbine power MW 53.3 47.7 43.1
Capacity factor % - 80 80
Net annual output MWh - 504,576 302,045
Net power plant efficiency % 33.3 33.7 29.2
Net power plant heat rate Btu/kWh 10,239 10,130 11,701
Wood feed rate, as-received lb/hr 80,600 70,900 75,370
Natural gas flow rate lb/hr 10,646 10,646 -------
Note: Values from Figure 2.3 Plant Operating and Maintenance Costs The operation and maintenance costs include all non-fuel activities such as operating labor, materials and tools for plant maintenance on both routine and emergency basis. Estimated annual O&M costs for the WTE™ plant are $2.0 million plus an additional $200,000 for the combustion turbine portion for a total of $2.2 million or 4.41 mills/kWh (Figure 8.2). The largest portion of O&M costs is $1.45 million for labor costs. Given the simplicity of the WTE™ technology, the average annual operating costs are expected to be comparable to or less than a similar sized coal plant - primarily because a WTE plant does not require complex pollution control equipment and because wood produces less ash. A WTE plant also does not require as many consumables like lime and limestone as a coal plant. EPS expects total employment will be about 28 full time equivalent positions with 6 persons per shift times 4 shifts (including weekend shifts) plus an additional 4 people on day shift for general maintenance.
Project Costs 77

Labor costs were estimated using census data for utility operations, internal data and past experience. Maintenance costs were estimated from experience and adjusted for the age and general condition of the plant. These costs do not include labor cost associated with developing and harvesting the fuel supply - those costs are included in the overall fuel cost estimate (see Fuel Cost section below).
Figure 8.2 Estimated Operating Costs ($2003) Fixed Costs
Units
WTE™ Plant
Combustion Turbine
Total
O&M Labor jobs Number 25 3 28 Labor hours/yr (2080 hr/yr/person) hr/yr 52,000 6,240 58,240 Average labor cost (including benefits) $/hr $25 $25 $25 Operating labor cost $/yr $1,300,000 $156,000 $1,456,000 Total Fixed Costs $/yr $1,300,000 $156,000 $1,456,000 Variable Costs Overtime, contract labor, supplies $/yr $700,000 $50,000 $750,000 Bottom and fly ash disposal $/yr $17,000 $0 $17,000 Total Variable Costs $/yr $717,000 $50,000 $767,000
Total Non-Fuel O&M Cost $/yr $2,017,000 $206,000 $2,223,000
mills/kWh 4.41
Farm-Grown Trees The primary long-term fuel supply for the retrofit WTE plant is assumed to be farm-grown trees. The fuel cost estimate is based on 39,000 acres of short rotation woody crops (SRWC) planted on farmland within a 50 mile radius of the Minnesota Valley plant (see Fuel Supply for more information). The net fuel cost for farm-grown trees includes the cost of land rent, land prep, planting, yearly maintenance, harvesting and transportation to the plant. Although the actual plant will likely use a proportion of wastewood and forest residue, these alternative fuel sources were not included in this cost analysis. Assumptions used to estimate the cost of farm-grown fuel supply are summarized in Figure 8.3. For detailed calculations, see Appendices 6 and 7. Land Rent: In order to produce sufficient fuel to feed the retrofit WTE plant, the fuel supply development team must obtain long term rental agreements for about 7,800 acres of existing farmland per year for five years within a 50 mile radius. A total of 39,000 acres are needed to provide a continuous supply of farm-grown trees to the plant. There are millions of acres of suitable land in the procurement area. The average rent is assumed to be $104 per acre. Prep and Planting Cost: Prep and planting costs including tilling, planting and the application of herbicides, pesticides and fertilizer as needed. These cost are assumed to occur in the first two years of each farms development cycle. Normally, first year prep and planting costs are estimated to be $227 per acre. This is based on detailed modeling by EPS and experience with SRWC plantation development. Second year costs average $66 per acre. These costs are typical for farms started in Year 2 through Year 5. In modeling the Minnesota Valley project, a planting and prep cost of $536 per acre for Year 1 farms - $309 more per acre than normal is used. The increased cost is due to an estimated cost of $0.30 per slip for hothouse produced slips compared to a normal cost of $0.10 per slip for nursery-grown stock. The farm development process would be delayed a year if the project were to wait for sufficient nursery grown stock to be produced for Year 1 planting. Construction of the
Project Costs 78
retrofit plant could still start on time - another year of fuel from existing forestland would need to be added to the fuel supply plan. Lower cost nursery stock will be available for planting all farms started in Year 2. Since the initial planting and prep costs are investments in developing a long-term fuel supply for the power plant, the annual costs are capitalized over the life of each farm (20 years) and then added to the annual fuel supply cost (see Appendix 9). Although some acreage may be replanted after harvest with new and improved clones, for the purposes of this analysis the increased productivity of the new clones is assumed to be counter balanced by the additional planting and prep costs, so the farms are assumed to be planted only once over their 20 year life cycle with no change in productivity. Harvesting Cost: The harvesting cost for farm-grown wood assumes the use of one or more high productivity harvesters being developed by EPS. The high-speed harvester is designed to combine several logging functions into one machine. The harvester is a large, rubber-tracked machine designed to continuously travel down each row of trees at relatively high speed. Each tree is cut off, guided into an accumulation area and batch-dumped onto a trailer towed behind the harvester. The harvester eliminates many of the inefficiencies of normal feller/buncher/skidder type harvesting operations and significantly lowers harvesting costs. The harvesters would be leased, and the cost including lease costs, fuel, operators and support crew is expected to average about $101 per acre. The first unit is scheduled to be demonstrated in spring of 2004. Transportation Cost: Trees harvested from each farm will be directly loaded onto a trailer by a high productivity harvester. Contract truckers will leave empty trailers near the end of the tree rows to be harvested and pick up loaded trailers. The average distance from field to plant is estimated to be 25 miles. The estimated cost per loaded mile is $1.70. Each truck can haul about 14 dry tons per load, which is a 27 ton load of green trees. Hauling costs to the Minnesota Valley plant for farm grown trees is expected to average about $3.06/dry ton.
Project Costs 79

Figure 8.3 Fuel Supply Assumptions
Power Plant Assumptions Units Steam Turbine Net Power kW 47.7 Cap. Factor % 80.0 Net Annual Output MWh 334,000 Plant Heat Rate (Combined Cycle)
Btu/kWh 10,239
Fuel Heat Content (dry) Btu/lb 8,700 Estimated Wood Flow Rate, dry lb/hr 54,593 Annual Fuel Required (Dry) tons/year 191,294
Farm Fuel Assumptions Units Typical Acreage per Farm acre 80 Slip Density Per Acre slips/acre 1,551 Total Slips Required slips 12,107,964 Rotation Age years 5 Growth Per Year/Acre dry ton/yr 4.9 Harvest Yield At Maturity dry ton/acre 24.5 Plant Fuel Req't -Acres/yr (1) acres/yr 7,808 Plant Fuel Req't -Lifetime acre 39,040
Farm Cost Assumptions Units Annual Rent on Land $/yr/acre $104 First Yr Prep/Planting Cost (2) $/acre $227 Second Yr Costs $/acre $66 Harvesting Cost $/acre $101 Transportation Cost $/ton $3.06 Fuel Cost (3) $/ton $48.91
Note: Certain costs have been capitalized but not levelized over the typical 20-year life of a farm (1) Assumes plant is entirely fueled using grown trees - no wastewood is assumed. (2) Land prep, planting, and certain startup marketing costs for first five years of each farm are capitalized. (3) See proforma financials in Appendix 9.
Total Farm-Grown Fuel Cost: The average farm grown fuel cost delivered to the retrofit WTE plant is $48.91/ton or about $2.81/MBtu. Fuel costs have not been levelized as part of this study and the impact of inflation and escalation are not considered. Natural Gas - Combustion Turbine The proposed WTE retrofit of the Minnesota Valley plant includes a natural gas-fired combustion turbine as part of the combined cycle system. The existing natural gas service to the plant will only require minor modifications to supply the new combustion turbine. The combustion turbine is assumed to operate in parallel with the WTE plant at an 80% capacity factor. (During combined cycle operation, the WTE plant operates at a higher efficiency and requires less wood fuel). For the purposes
Project Costs 80

of this study, the price for natural gas was assumed to be the average of 2002 prices for Minnesota utilities. Natural gas prices are estimated from US Energy Information Agency web site data (http://www.eia.doe. gov/emeu/states/ngprices/ngprices_mn.html). The average cost of natural gas is estimated to be $3.83/MBtu with a higher heating value of 23,880 Btu/lb. (Natural gas prices have been volatile in recent years with significant annual increases from historical averages although prices are expected to stabilize going forward). Given the plant operating assumptions shown in Figure 8.4, the total annual cost for wood fuel is $9.3 million and natural gas is estimated to cost $ 6.8 million per year.
Figure 8.4 Fuel Costs Costs
Units
WTE™ Plant
Combustion Turbine
Total
Fuel required ton/year 191,294 37,304 Fuel cost (1) $/ton $48.91
$/MBtu $2.81 $3.83 Fuel Higher Heating Value Btu/lb 8,700 23,880
Total Annual Fuel Cost $/yr $9,335,715 $6,828,946 $16,500,000 mills/kWh 40.10 32.08
Fixed O&M mills/kWh 4.30 0.93 2.88 Variable O&M plus Fuel mills/kWh 30.10 40.89 33.60
Total O&M plus Fuel mills/kWh 36.48
Average of first 3 years of second harvests - year 10,11and 12. Existing Forest Resources The need for existing forest resources and wastewood will depend on the actual development schedule for the retrofit project. Assuming construction starts simultaneous with development of the farm-grown fuel supply, a gap of about 2-3 years (5-6 years for fuel supply development less 2-3 years for plant construction) would need to be filled with other wood resources such as existing forestland resources in the procurement area. Forest resources are available in the area although the procurement area will have to extend north up to 120 miles to reach sufficient quantities to fuel the plant. The fuel supply manager will contract for harvesting rights to private and public lands in the procurement area and hire independent loggers and truckers to harvest and deliver the trees to the Minnesota Valley plant. In the procurement area for the proposed WTE plant, the pulpwood stumpage cost ranged from $11/cord to $60/cord in 2002. This is the stumpage cost (cost for right to harvest trees on private or public land) - harvesting cost and transportation cost to plant location vary depending on the type of harvest (thinning vs. clearcut) and the distance to the plant location. The cost for each of these elements depends on many factors including competition, type and value of wood, fuel costs, distance to plant, etc. It also only applies to the main bole or sawtimber portion of relatively healthy merchantable trees. WTE can use all of the resource on the site which will lower the net cost per ton about 45% (by adding additional biomass beyond just the merchantable portion of the tree). Stumpage costs vary significantly by primary type of tree, location and size of plot. Parcels with a high proportion of sawtimber generally have higher stumpage costs than primarily pulpwood parcels. A WTE plant can utilize just about any type of wood, if the price is right, including hardwoods,
Project Costs 81

softwoods, damaged trees, and even dead and dying trees. Based on current trends and competitive factors, EPS believes sufficient acreage can be obtained at an average stumpage cost of $30 per dry ton as measured by normal merchantable pulpwood prices. (Note: any sawtimber quality logs harvested from a site would likely be sold to a sawmill at a much higher price. The net stumpage price for the total biomass, including what normally would be considered residue such as trimmings, branches, and dead and dying is expected to average about $16.44 /dry ton (Figure 8.5).
Figure 8.5 Stumpage Cost Calculation for Existing Timberland Resources
Units 120 Mile Radius Comments
Estimated stumpage value of wood per acre
$/acre $470 MN Finance and Commerce - 44,000 public acres @ $20.7 million in rev.
Estimated average stumpage cost - merchantable wood
$/ton $30.00 Calculation
Proportion non-growing stock 0.45
Net cost for all biomass available $/ton $16.44 Calculation - does not include sawtimber revenue
Note: Stumpage costs vary significantly depending on species of wood, quality, location, demand etc. For instance, in 2001, stumpage prices for sawtimber ranged from $30.46/Mbf for cedar to $170.13/Mbf for white pine. Polewood varies similarly. At $100/Mbf, sawtimber is about $33/dry ton for the merchantable portion of the wood. Stumpage costs for residue varies from free to $5/cord or only about $2.25 per ton - in many cases skidded to a landing area near the harvesting site ready for loading.
The average harvesting cost for wood in the procurement area is about $14-$21 per dry ton. Normal logging equipment such as feller/bunchers and skidders would be used by contract loggers to harvest the fuel supply. Unlike when trees are used for pulpwood or sawtimber, the trees will not be trimmed as part of the harvesting process. The whole trees will be loaded onto the log hauling trailers. The feasibility of this process has been proven in previous large scale testing of the WTE technology. Minor trimming may be necessary to limit the load length to permit requirements. High quality sawlogs will be segregated and sold separately at market value. The WTE plant will be able to use all of the biomass available including whole trees, dead and dying trees and damaged wood. The fuel supply manager will contract with local truckers to transport the whole trees on log hauling trailer from each site to the Minnesota Valley plant. Each trailer is assumed to haul about 14 dry tons of whole trees per load. The average one-way trip to the plant is estimated to be 100 miles. The cost per loaded mile is estimated at $1.70 for a net cost for hauling of about $12.23 per ton. The total delivered cost for standing biomass resources for the retrofit WTE plant is expected to average $43 per dry ton ($2.47/MBtu) for the 2-3 years needed while the farm-grown trees mature to harvestable size (Figure 8.6).
Project Costs 82

Figure 8.6 Cost Calculation for Existing Timberland Resources Parameter Units Value Notes Stumpage Costs
Gross stumpage cost for resource, range $/ton $10-$40 Typical prices paid for non-sawlog quality logs
Expected net cost in 120 mile procurement area
$/ton $16.44 EPS estimate - net cost all biomass not including revenue from sale of sawtimber
Harvesting cost
Net whole tree harvesting cost $/ton $15.00 Using normal feller/buncher/skidder
No branch removal
Transportation cost
Mileage to plant miles 100 Average one-way distance from plot to plant
Delivery cost $/mile $1.70 Average for long haul distance - loaded mile
Total transportation cost per load $/load $170.00 Mileage times delivery cost
Average load capacity, dry ton/load 13.9 Estimated from experience and testing
Net transportation cost $/ton $12.23 Calculation
Total Cost
Total Standing Biomass Cost $/ton $43.67 Estimate
Capital Cost Summary Capital costs for the retrofit Minnesota Valley plant are summarized in Figure 8.7 and detailed in Appendices 7 and 11. The total estimated cost for retrofitting the Minnesota Valley is $55 million or $764/kW ($2003). This includes the new combustion turbine, drying dome, fuel conveyor, fuel feed system, boiler modifications, engineering and permitting needed to convert the existing coal-fired plant to a WTE combined cycle plant. If the combustion turbine and associated costs are eliminated (WTE only case) then the capital costs are $33.9 million or $787/kWh. Data for this analysis was provided by several sources including previous published data, vendor estimates, EPS internal data, and other expert sources. Utility Engineers served as subcontractor in developing part of the preliminary design and capital equipment estimates. The capital costs were divided into four major categories. Contingencies of 25% were added to each category total; the project contingencies are set high to cap the costs for development as the first WTE™ plant. Boiler Modifications: The boiler modifications, including the new water-cooled grate, char burnout grate, and various boiler modifications will cost $12.86 million. This estimate includes all materials including firebrick, insulation, equipment, demolition and installation. Costs included in this total are $1.5 million for the new condensing heat exchanger and $225,000 for drying air fans and motors, with labor and materials for drying air and combustion air ductwork making up the bulk of the remaining investment. Tree Drying Dome: The drying building and air distribution system is estimated to cost $9.9 million. This includes the drying building dome material, the anchor wall system, the building mechanical
Project Costs 83

systems, the central air vent, lighting system, weigh station, and the truck and personnel doors. The concrete under-pile air distribution system (balance of plant cost) is also included in this estimate. A tower crane and grapple system represents $2.15 million of the total. Fuel Handling System: The fuel feed conveyor and rams, sizing saws, dust collection system are major components of the fuel handling system, which is estimated to cost $7.75 million. This includes the cost of the concrete work and other balance of plant items. Other major costs include $2.65 million for the crane, crane tower, and foundation. Appropriate contingency factors and estimates of indirect costs have been included in the estimates for total plant cost. Combustion Turbine: Adding a 24 MW combustion turbine to the Minnesota Valley plant adds $18.8 million to the direct costs for the retrofit plant. The combustion turbine and new heat recovery feedwater heater represent the largest portion of added cost at $10.8 million to the overall capital cost. The combined cycle system increases the efficiency of the overall plant, decreases wood fuel requirements and increases the output of the plant. Other major costs associated with adding the combustion turbine include $1.0 million for upgrades to the natural gas supply system, and $1.2 million for related electrical upgrades with the remaining costs related to demolition, new ducting, and balance of plant. Sales taxes of $1.6 million were estimated assuming a 6.5% tax rate on 50% of total estimated costs (including the 25% contingency built into the estimates). The capital cost estimates include equipment, labor and materials needed to complete the retrofit. Engineering and construction management adds another $4.5 million. (Additional engineering costs for modifying the boiler are built into the cost estimate for boiler modifications). Permitting and other indirect costs add $750,000. An estimate of $3.0 million for allowance for funds used during construction (AFUDC) is based on a 3 year project schedule with 12%, 61% and 27% of total capital costs occurring in Year 1, Year 2 and Year 3, respectively with an assumed interest rate of 5.5% (see Appendix 6). The total investment required for the WTE Combined Cycle retrofit is estimated to be $59.0 million (2003$) or $820/kW. Using a fixed charge rate of 20.3% results in an annual capital cost of $12.0 million or 23.8 mills/kWh. Note that this cost does not include capitalized cost related to the development of the fuel supply because those costs are allocated separately and applied to total fuel cost. If the combustion turbine and associated costs are eliminated (WTE only case) then the annual cost of capital is $7.8 million or 24.4 mills/kWh (Figure 8.7).
Project Costs 84

Figure 8.7 Capital Cost Summary of Retrofit Item WTE-CC WTE only
Direct Costs (Material and Installation) Boiler modification cost $12,300,000 $12,300,000 Tree drying facility cost $9,849,334 $9,849,334 Fuel handling and balance of plant cost $7,754,250 $7,754,250 Combustion turbine and heat recovery feedwater heaters $18,712,063 ------
Subtotal Directs Cost (1) $48,615,647 $29,903,584 Indirect Costs Sales tax (2) at 6.5% $1,580,000 $972,000 Engineering and construction management $4,000,000 $2,500,000 Permitting $250,000 $200,000 Other indirect costs $500,000 $300,000 Subtotal Indirect Cost $6,330,000 $3,972,000
Total Retrofit Construction Cost (3) $54,945.655 $33,875,584 Allowance for funds used during construction (AFUDC) $4,079,591 $2,515,261
Total Investment (not including escalation) $59,025,301 $36,390,845 Cost per unit of capacity, $/kW $820 $844 Fixed charge rate, % 20.3% 20.3% Fixed capital charges $11,993,941 $7,387,341 Capital cost per unit of electricity, mills/kWh 23.77 24.45
(1) Represents the direct costs of only the items within the scope of this study. 25% contingency included in direct cost estimates. (2) Applied to 50% of total capital costs - remaining assumed to be non-taxed or installation costs. (3) Does not include estimates for escalation or inflation. Does not include capitalized fuel supply development costs
(planting, prep etc.) - these are included in net fuel costs Annual Total Cost Summary The total annual cost for the retrofitted WTE Minnesota Valley combined cycle power plant (WTE-CC) is $30.4 million, and the annual cost of the WTE only (no combined cycle) is $19.3 million (Figure 8.8). There is a Federal tax credit for closed-loop biomass under the Renewable Electricity Production Credit (REPC), which is a per kilowatt-hour tax credit for electricity generated by qualified energy resources - defined as wind, closed-loop biomass, or poultry waste. Available during the first 10 years of operation, the REPC provides a 1.5 cents per kWh credit adjusted annually for inflation. The adjusted credit amount for 2003 is 1.8 cents per kWh. Enacted as part of the Energy Policy Act of 1992 (U.S. Code Citation: 26 USC 45), the credit, which had expired at the end of 2001, was extended in March 2002 as part of H.R. 3090, Job Creation and Worker Assistance Act of 2002. The credit is set to expire on 12/31/03. It is reasonable to assume that this tax credit will be extended and adjusted for inflation. This credit has been extended regularly since 1992 and the emphasis for CO2 abatement continues to grow. After taking a tax credit of 18 mills/kWh for the biomass portion, the cost of electric power production is 48.4 mills/kWh for the WTE-CC plant and 46.0 mills/kWh for the WTE steam cycle plant. The cost calculations in Figure 8.8 do not include estimates of escalation or inflation. The costs are not levelized, and the annual levelized cost for the existing plant assets is also not included. No
Project Costs 85

investment tax credit was assumed. A 25% contingency is included in the capital costs. More refined cost calculations should be made as the project moves forward.
Figure 8.8 Total Annual Costs ($2003) Item WTE-CC WTE only
Operations and maintenance cost $2,223,000 $2,017,000 Fuel cost $16,185,000 $9,921,997 Capital cost $11,994,000 $7,387,341
Total Annual Cost $30,402,000 $19,326,338
Production cost, mills/kWh 60.32 63.98
Biomass tax credit at 18 mills/kWh 11.92 18.00
Bus Bar cost of power, mills/kWh 48.4 46.0
If the Minnesota Valley power plant were run on Western sub-bituminous coal (summarized in Figure 2.3, higher heating value of 9,540 Btu/lb, 42.4 MW, 50,520 lb/hr) that costs $1.40/million Btu delivered by rail and unloaded at the Minnesota Valley power plant, then the annual fuel cost would be $4.7 million. If the operations and maintenance costs are assumed to be $2.5 million/yr and assuming there is no capital cost, then the cost of power would be 24.2 mills/kWh. However some additional expenses would be incurred in base load operation of the plant on coal for inspection and repair/replacement of plant equipment. The status of the existing permits would need to be established as well as the adequacy of the electrostatic precipitator for continued use with coal. Because of the particulate, nitrogen oxides, sulfur dioxide and mercury emissions, it is questionable if this current unit could be permitted for base load coal-fired operation.
Project Costs 86

9. Project Schedule
The Whole Tree Energy™ combined cycle retrofit of the Minnesota Valley power plant is scheduled for 36 months in this section. An accelerated schedule would allow for delivery of commercial power in 24 months. Engineering and design will require 10 months (some of which will take place simultaneous with other activities), permitting 12 months (overlaps with engineering and design activities) site prep and demolition 3 months, and construction 12-18 months. Startup operations will require about 2 months before the plant can go online at full capacity. Key elements of the retrofit project include the drying dome, grapple crane, combustion turbine, the fuel feed system, and boiler modifications. The fuel supply involves establishing 7800 acres of short rotation woody crops per year for five growing seasons on farmland within 50 miles of Granite Falls. The power plant will use existing wood resources and waste wood during the first several years of operations while the fuel supply matures. The project schedule is presented in Figures 9.1 to 9.4.
Project Schedule 87

Figure 9.1 Schedule for WTE™ Retrofit of the Minnesota Valley Plant
Project Schedule 88
Activities 1 2 3 4 5 6 7 8 9 10 11 12 13 14 15 16 17 18 19 20 21 22 23 24 25 26 27 28 29 30 31 32 33 34 35 36
Project Engineering and PlanningComplete detailed engineering and
cost estimates
Finalize project schedule
Site permits and approvals
Site PrepAsbestos and hazardous material
abatement, as needed
Exterior site demolition and cleanup
(RR track, trestle, pavement, coal
facilities, conveyor, etc).
Remove existing unused steam
turbines, coal handling equipment,
coal bins, conveyors, pulverizers,
transformers, etc.
Other interior demolition (floor and
wall removal, electrical, generator
#1 and #2, opening for stack etc.)
Upgrade access roads to plant and
drying building
Fuel Handling and Drying FacilitiesSpecify and order drying
dome/fans etc.
Specify and order grapple crane
Specify and order waste heat
recovery equipmentFabrication and delivery waste heat
recovery equipment
Custom build item
Construct drag conveyor, crane and
dome foundations
Fabricate and install piping, pumps,
and tank for firewater storage
Fabricate drag conveyor
Reinforce plant roof for drying fans
and new condensing heat exchanger
Install 3-500 Hp drying air fans
Install waste heat recovery
Install and test dome
Install and test crane
Install weigh station

Figure 9.1 Schedule for WTE™ Retrofit of the Minnesota Valley Plant, cont. Activities 1 2 3 4 5 6 7 8 9 10 11 12 13 14 15 16 17 18 19 20 21 22 23 24 25 26 27 28 29 30 31 32 33 34 35 36
Drag Conveyor and Fuel Feed SystemModify structure for mounting fuel
feed systemComplete structural work for
supporting drag conveyor
Fabricate and install drag conveyor
structureFabricate and install dual ram whole
tree feed system
Fabricate and install cutoff system
Fabricate, install and test drag
Boiler ModificationsCreate opening in boiler wall for
WTE fuel feed system
Create openings for new
overfire/underfire air ducting
Reroute and modify water wall
piping for fuel door/ductsRemove existing burners
Fabricate and install new water
cooled grate
Fabricate and install furnace
isolation gateFabricate and install new char
combustion grate
Install CO2 damping system Optional item
Miscellaneous instrumentation
openings
Combustion TurbineSpecify and order gas turbine and
accessory equipment
IM2500 Turbine
Manufacture and delivery gas
turbine
12 months to build
Specify and order new heat
recovery feedwater heater
Fabrication of feedwater heater
Upgrade structure and foundation
for gas turrbine and heat recovery
Complete modifications to gas
supply line
Intall new gas flow meters and gas
compressor station (new building)
Install gas turbine
Install heat recovery feedwater
Install new GSU transformer,
motor starters, motor control
center etc. for gas turnbine
Project Schedule 89

Figure 9.1 Schedule for WTE™ Retrofit of the Minnesota Valley Plant, cont. Activities 1 2 3 4 5 6 7 8 9 10 11 12 13 14 15 16 17 18 19 20 21 22 23 24 25 26 27 28 29 30 31 32 33 34 35 36
ElectricalSpecify and order new plant
controls, as needed
Upgrade plant control systems
Install new 480V switchgear (fuel
handling, new boiler systems etc.)
Install new 2400V switchgear
(drying fans)
Install new 5600/7000 KVA
transformers
Add new distribution cables and
related equipment
Piping and DuctworkSpecify and order steam and
water piping
Specify and order ductwork
Add and reroute steam extraction
piping, as needed
Add and reroute ductwork for
firing air, triple zone flow
Add ductwork from ID fan to new
heat exchangerBalance of process piping, cooling
water, drains etc.
Balance of PlantReplace condensate pump
Replace one high pressure (#35)
feedwater heater
Add new ID fan
Add new ash pellatizing/handling
system
MiscellaneousUpgrade power transmission system
New fire protection system
Testing and Plant StartupBoilout and preops
Startup
Full Operation
Project Schedule 90

Figure 9.2 Poplar Slip Supply Development Schedule
NM-6 Hybrid Slip Production PlanYear 1 Year 2 Year 3 Year 4 Year 5 Year 6
Ostlie Nursery Production (Existing Beds)Total stools 200,000 200,000 200,000 200,000 200,000 200,000
Total number of slips per stool per season (1) 13 12.5 12.5 12.5 12.5 12.5
Number of slips from existing beds 2,500,000 2,500,000 2,500,000 2,500,000 2,500,000 2,500,000
Ostlie Nursery Production (New Beds)Total stools in new beds 200,000 225,000 225,000 225,000 225,000 225,000
Total number of slips per stool per season (1) 3 12.5 12.5 12.5 12.5 12.5
Number of slips from new beds 600,000 2,575,000 2,812,500 2,812,500 2,812,500 2,812,500
Other Supplier Production (Existing Beds)
Total stools in potential suppliers beds 250,000 250,000 250,000 250,000 250,000 250,000
Total number of slips per stool per season (1) 13 12.5 12.5 12.5 12.5 12.5
Number of slips from stool bed #2 3,250,000 3,125,000 3,125,000 3,125,000 3,125,000 3,125,000
Other Supplier Production (New Beds)
Total stools new stool beds 225,000 375,000 375,000 375,000 375,000 375,000
Total number of slips per stool per season (1) 3 12.5 12.5 12.5 12.5 12.5
Number of slips from stool bed #2 675,000 3,262,500 4,687,500 4,687,500 4,687,500 4,687,500
Greenhouse/Hothouse Production
Total 1.0" slips planted in greenhouses 1,000,000 0 0 0 0
Total number of slips per stool per cycle (1) 3 3 3 3 3
Growing cycles per year 2 2 0 0 0
Number of slips from greenhouse production 6,000,000 0 0 0 0
Total slips produced 13,025,000 11,462,500 13,125,000 13,125,000 13,125,000 13,125,000
Overall Slip InventoryYear 1 Year 2 Year 3 Year 4 Year 5 Year 6
Beginning inventory of slips (Jan 1) 0 0 742,036 96,573 100,000 100,000
Slips purchased from Ostlie Nursery 250,000 3,100,000 5,075,000 5,312,500 5,312,500 5,312,500Slips purchased from other sources 300,000 3,925,000 6,387,500 6,798,891 6,795,464 6,795,464Slips from greenhouse production 0 6,000,000 0 0 0 0
Total slips available for planting 550,000 13,025,000 12,204,536 12,207,964 12,207,964 12,207,964
Less: Number of slips used in additional stool beds 425,000 175,000 0 0 0 0Less: Number of slips used in
0
3
0
0
greenhouse planting (2) 125,000 0 0 0 0
Total slips available for fuel supply planting 0 12,850,000 12,204,536 12,207,964 12,207,964 12,207,964
Number of slips used for farm planting 0 12,107,964 12,107,964 12,107,964 12,107,964 12,107,964
Net slips in inventory 0 742,036 96,573 100,000 100,000 100,000
Definitions: Stool bed: Roots and stump left over in nursery after harvesting whips.Whip: 8'-10' long annual growth from stool bed or planted slipSlip: 10" long piece of whip
Slips per Established Stool = Whips/Stool X Slips/Whip Total2.5 5.0 12.5
(1) Note: New stool beds only produce one whip in first season.
(2) Each 10" slip is assumed to produce 8 - 1" slips for greenhouse planting.
0
Project Schedule 91

Figure 9.3 Tree Farm Development Schedule
Activities1 2 3 4 1 2 3 4 1 2 3 4 1 2 3 4 1 2 3 4 1 2 3 4 1 2 3 4 1 2 3 4
Develop slip nursery capaci May require 2 growing years of nursery stock, nursery expansion and/or hot house propagation
Harvest/purchase/inventory
slips (each year)
Need 12.1 million slips for Year 1 farm development - 7,800 acres
Hire plantation 2-3 fulltime positions
Complete plantation
development plan
Develop program marketing
materials, rental contracts
Year 1 Farm Development
Land rental Need to rent 7,800 acres each year for 5 years
Land prep Includes cultivation, fertilization and weed control applications prior to planting
Planting Must be completed during 6-7 week period in spring planting season
Second year maintenance Includes additional cultivation and weed control applications, as neede
Plantation monitoring
Harvest First harvest afte
5 growing seasons
Year 2 Farm Development
Land rental
Land prep
Planting
Second year maintenance
Plantation monitoring
Harvest
Year 3 Farm Development
Land rental
Land prep
Planting
Second year maintenance
Plantation monitoring
Harvest
Year 4 Farm Development
Land rental
Land prep
Planting
Second year maintenance
Plantation monitoring
Harvest
Year 5 Farm Development
Land rental
Land prep
Planting
Second year maintenance
Plantation monitoring
Harvest
2003 2004 2005 2006 2007 2008 2009 2010 Year 1 Year 2 Year 3 Year 4 Year 5 Year 6 Year 7 Year 8
Project Schedule 92

Figure 9.4 Fuel Supply Development Schedule Fuel Supply Plan 1
Plant Fuel Usage Schedule Year 1 Year 2 Year 3 Year 4 Year 5 Year 6 Year 7 Year 8 Year 9 Year 10 Year 11 Year 12 Year 13 Year 14 Year 15 Year 16 Year 17 Year 18 Year 19 Year 20 Year 21Plant Usage Factor (% of contract rate) % NA NA NA 0 100% 100% 100% 100% 100% 100% 100% 100% 100% 100% 100% 100% 100% 100% 100% 100% 100%Fuel Required to Operate Plant 1000's Dry Tons 0 0 0 0 191 191 191 191 191 191 191 191 191 191 191 191 191 191 191 191 191
Wastewood Usage % % 0% 0% 0% 0% 0% 0% 0% 0% 0% 0% 0% 0% 0% 0% 0% 0% 0% 0% 0% 0% 0%Wastewood Usage 1000's Dry Tons 0 0 0 0 0 0 0 0 0 0 0 0 0 0 0 0 0 0 0 0 0Farm Grown Fuel Requirements 1000's Dry Tons 0 0 0 0 191 191 191 191 191 191 191 191 191 191 191 191 191 191 191 191 191
Wastewood Inventory Schedule Year 1 Year 2 Year 3 Year 4 Year 5 Year 6 Year 7 Year 8 Year 9 Year 10 Year 11 Year 12 Year 13 Year 14 Year 15 Year 16 Year 17 Year 18 Year 19 Year 20 Year 21Wastewood Beginning Inventory 1000's Dry Tons 0 0 0 0 0 0 0 0 0 0 0 0 0 0 0 0 0 0 0 0 0New Purchases of Wastewood 0 0 0 0 0 0 0 0 0 0 0 0 0 0 0 0 0 0 0 0 0Wastewood Used in Plant 0 0 0 0 0 0 0 0 0 0 0 0 0 0 0 0 0 0 0 0 0Ending Inventory of Wastewood 0 0 0 0 0 0 0 0 0 0 0 0 0 0 0 0 0 0 0 0 0
Typical Farm Planting/Harvesting Schedule Year 1 Year 2 Year 3 Year 4 Year 5 Year 6 Year 7 Year 8 Year 9 Year 10 Year 11 Year 12 Year 13 Year 14 Year 15 Year 16 Year 17 Year 18 Year 19 Year 20 Year 21Year 1 Farms P G G G H G G G G H G G G G H G G G G H GYear 2 Farms P G G G H G G G G H G G G G H G G G G HYear 3 Farms P G G G H G G G G H G G G G H G G G GYear 4 Farms P G G G H G G G G H G G G G H G G GYear 5 Farms P G G G H G G G G H G G G G H G GYear 6 Farms NA NA NA NA NA NA NA NA NA NA NA NA NA NA NA NA *P=Plant, G=Grow, H=Harvest
Number of Acres Planted Each Year Year 1 Year 2 Year 3 Year 4 Year 5 Year 6 Year 7 Year 8 Year 9 Year 10 Year 11 Year 12 Year 13 Year 14 Year 15 Year 16 Year 17 Year 18 Year 19 Year 20 Year 21Year 1 Farms Development acres 7,808 0 0 0 0 0 0 0 0 0 0 0 0 0 0 0 0 0 0 0 0Year 2 Farms Development 0 7,808 0 0 0 0 0 0 0 0 0 0 0 0 0 0 0 0 0 0 0Year 3 Farms Development 0 0 7,808 0 0 0 0 0 0 0 0 0 0 0 0 0 0 0 0 0 0Year 4 Farms Development 0 0 0 7,808 0 0 0 0 0 0 0 0 0 0 0 0 0 0 0 0 0Year 5 Farms Development 0 0 0 0 7,808 0 0 0 0 0 0 0 0 0 0 0 0 0 0 0 0Year 6 Farms Development 0 0 0 0 0 0 0 0 0 0 0 0 0 0 0 0 0 0 0 0 0
Total Acres 7,808 7,808 7,808 7,808 7,808 0 0 0 0 0 0 0 0 0 0 0 0 0 0 0 0
Cumulative Acreage 7,808 15,616 23,424 31,232 39,040 39,040 39,040 39,040 39,040 39,040 39,040 39,040 39,040 39,040 39,040 39,040 39,040 39,040 39,040 39,040 39,040
Number of Slips Planted Each Year Year 1 Year 2 Year 3 Year 4 Year 5 Year 6 Year 7 Year 8 Year 9 Year 10 Year 11 Year 12 Year 13 Year 14 Year 15 Year 16 Year 17 Year 18 Year 19 Year 20 Year 21Year 1 Farms Development 1000's of slips 12,108 0 0 0 0 0 0 0 0 0 0 0 0 0 0 0 0 0 0 0 0Year 2 Farms Development 0 12,108 0 0 0 0 0 0 0 0 0 0 0 0 0 0 0 0 0 0 0Year 3 Farms Development 0 0 12,108 0 0 0 0 0 0 0 0 0 0 0 0 0 0 0 0 0 0Year 4 Farms Development 0 0 0 12,108 0 0 0 0 0 0 0 0 0 0 0 0 0 0 0 0 0Year 5 Farms Development 0 0 0 0 12,108 0 0 0 0 0 0 0 0 0 0 0 0 0 0 0 0Year 6 Farms Development 0 0 0 0 0 0 0 0 0 0 0 0 0 0 0 0 0 0 0 0 0
Total Slips 12,108 12,108 12,108 12,108 0 0 0 0 0 0 0 0 0 0 0 0 0 0 0 0
Number of Farms Started Each Year Year 1 Year 2 Year 3 Year 4 Year 5 Year 6 Year 7 Year 8 Year 9 Year 10 Year 11 Year 12 Year 13 Year 14 Year 15 Year 16 Year 17 Year 18 Year 19 Year 20 Year 21Year 1 Farms Development # of 80 acre farms 98 0 0 0 0 0 0 0 0 0 0 0 0 0 0 0 0 0 0 0 0Year 2 Farms Development 0 98 0 0 0 0 0 0 0 0 0 0 0 0 0 0 0 0 0 0 0Year 3 Farms Development 0 0 98 0 0 0 0 0 0 0 0 0 0 0 0 0 0 0 0 0 0Year 4 Farms Development 0 0 0 98 0 0 0 0 0 0 0 0 0 0 0 0 0 0 0 0 0Year 5 Farms Development 0 0 0 0 98 0 0 0 0 0 0 0 0 0 0 0 0 0 0 0 0Year 6 Farms Development 0 0 0 0 0 0 0 0 0 0 0 0 0 0 0 0 0 0 0 0 0
Total Farms Started 98 98 98 98 0 0 0 0 0 0 0 0 0 0 0 0 0 0 0 0
Farms Harvested Per Year Year 1 Year 2 Year 3 Year 4 Year 5 Year 6 Year 7 Year 8 Year 9 Year 10 Year 11 Year 12 Year 13 Year 14 Year 15 Year 16 Year 17 Year 18 Year 19 Year 20 Year 21Year 1 Farms Harvested # of 80 acre farms 98 0 0 0 0 98 0 0 0 0 98 0 0 0 0 98 0Year 2 Farms Harvested 98 0 0 0 0 98 0 0 0 0 98 0 0 0 0 98Year 3 Farms Harvested 98 0 0 0 0 98 0 0 0 0 98 0 0 0 0Year 4 Farms Harvested 98 0 0 0 0 98 0 0 0 0 98 0 0 0Year 5 Farms Harvested 98 0 0 0 0 98 0 0 0 0 98 0 0Year 6 Farms Harvested 0 0 0 0 0 0 0 0 0 0 0 0
Total Annual Harvest 0 0 0 98 98 98 98 98 98 98 98 98 98 98 98 98 98 98 98 89
Project Schedule 93

Figure 9.4 Fuel Supply Development Schedule, Cont. Typical Annual Farm Development Schedule Year 1 thru Year 4 Farms
Year 1 Farms SummaryYear of Farm 1 2 3 4 5 6 7 8 9 10 11 12 13 14 15 16 17 18 19 20Number of Acres 7,808 7,808 7,808 7,808 7,808 7,808 7,808 7,808 7,808 7,808 7,808 7,808 7,808 7,808 7,808 7,808 7,808 7,808 7,808 7,808Number of Farms 98 98 98 98 98 98 98 98 98 98 98 98 98 98 98 98 98 98 98 98
Fuel Inventory Per Acre dry tons per acre 4.9 9.8 14.7 19.6 24.5 4.9 9.8 14.7 19.6 24.5 4.9 9.8 14.7 19.6 24.5 4.9 9.8 14.7 19.6 24.5Fuel Inventory Per Farm dry tons per farm 392 784 1176 1568 1960 392 784 1176 1568 1960 392 784 1176 1568 1960 392 784 1176 1568 1960Total Fuel Inventory dry tons 38,259 76,518 114,776 153,035 191,294 38,259 76,518 114,776 153,035 191,294 38,259 76,518 114,776 153,035 191,294 38,259 76,518 114,776 153,035 191,294
$/acreRent $1,000's/Yr $104 $812 $812 $812 $812 $812 $812 $812 $812 $812 $812 $812 $812 $812 $812 $812 $812 $812 $812 $812 $812First Yr Prep/Planting Costs* $1,000's $227 $1,769 $0 $0 $0 $0 $0 $0 $0 $0 $0 $0 $0 $0 $0 $0 $0 $0 $0 $0 $0Second Yr Prep/Planting Costs* $1,000's $66 $0 $516 $0 $0 $0 $0 $0 $0 $0 $0 $0 $0 $0 $0 $0 $0 $0 $0 $0 $0Harvesting Cost $1,000's $32 $0 $0 $0 $0 $253 $0 $0 $0 $0 $253 $0 $0 $0 $0 $253 $0 $0 $0 $0 $253Total Cost Per Year $1,000's $2,581 $1,328 $812 $812 $1,065 $812 $812 $812 $812 $1,065 $812 $812 $812 $812 $1,065 $812 $812 $812 $812 $1,065
Year 2 Farms SummaryYear of Farm 1 2 3 4 5 6 7 8 9 10 11 12 13 14 15 16 17 18 19Number of Acres 7,808 7,808 7,808 7,808 7,808 7,808 7,808 7,808 7,808 7,808 7,808 7,808 7,808 7,808 7,808 7,808 7,808 7,808 7,808Number of Farms 98 98 98 98 98 98 98 98 98 98 98 98 98 98 98 98 98 98 98
Fuel Inventory Per Acre dry tons per acre 4.9 9.8 14.7 19.6 24.5 4.9 9.8 14.7 19.6 24.5 4.9 9.8 14.7 19.6 24.5 4.9 9.8 14.7 19.6Fuel Inventory Per Farm dry tons per farm 392 784 1176 1568 1960 392 784 1176 1568 1960 392 784 1176 1568 1960 392 784 1176 1568Total Fuel Inventory dry tons 38,259 76,518 114,776 153,035 191,294 38,259 76,518 114,776 153,035 191,294 38,259 76,518 114,776 153,035 191,294 38,259 76,518 114,776 153,035
$/acreRent $1,000's/Yr $104 $0 $812 $812 $812 $812 $812 $812 $812 $812 $812 $812 $812 $812 $812 $812 $812 $812 $812 $812 $812First Yr Prep/Planting Costs* $1,000's $227 $0 $1,769 $0 $0 $0 $0 $0 $0 $0 $0 $0 $0 $0 $0 $0 $0 $0 $0 $0 $0Second Yr Prep/Planting Costs* $1,000's $66 $0 $0 $516 $0 $0 $0 $0 $0 $0 $0 $0 $0 $0 $0 $0 $0 $0 $0 $0 $0Harvesting Cost $1,000's $32 $0 $0 $0 $0 $0 $253 $0 $0 $0 $0 $253 $0 $0 $0 $0 $253 $0 $0 $0 $0Total Cost Per Year $1,000's $0 $2,581 $1,328 $812 $812 $1,065 $812 $812 $812 $812 $1,065 $812 $812 $812 $812 $1,065 $812 $812 $812 $812
Year 3 Farms SummaryYear of Farm 1 2 3 4 5 6 7 8 9 10 11 12 13 14 15 16 17 18Number of Acres 7,808 7,808 7,808 7,808 7,808 7,808 7,808 7,808 7,808 7,808 7,808 7,808 7,808 7,808 7,808 7,808 7,808 7,808Number of Farms 98 98 98 98 98 98 98 98 98 98 98 98 98 98 98 98 98 98
Fuel Inventory Per Acre dry tons per acre 4.9 9.8 14.7 19.6 24.5 4.9 9.8 14.7 19.6 24.5 4.9 9.8 14.7 19.6 24.5 4.9 9.8 14.7Fuel Inventory Per Farm dry tons per farm 392 784 1176 1568 1960 392 784 1176 1568 1960 392 784 1176 1568 1960 392 784 1176Total Fuel Inventory dry tons 38,259 76,518 114,776 153,035 191,294 38,259 76,518 114,776 153,035 191,294 38,259 76,518 114,776 153,035 191,294 38,259 76,518 114,776
$/acreRent $1,000's/Yr $104 $0 $0 $812 $812 $812 $812 $812 $812 $812 $812 $812 $812 $812 $812 $812 $812 $812 $812 $812 $812First Yr Prep/Planting Costs* $1,000's $227 $0 $0 $1,769 $0 $0 $0 $0 $0 $0 $0 $0 $0 $0 $0 $0 $0 $0 $0 $0 $0Second Yr Prep/Planting Costs* $1,000's $66 $0 $0 $0 $516 $0 $0 $0 $0 $0 $0 $0 $0 $0 $0 $0 $0 $0 $0 $0 $0Harvesting Cost $1,000's $32 $0 $0 $0 $0 $0 $0 $253 $0 $0 $0 $0 $253 $0 $0 $0 $0 $253 $0 $0 $0Total Cost Per Year $1,000's $0 $0 $2,581 $1,328 $812 $812 $1,065 $812 $812 $812 $812 $1,065 $812 $812 $812 $812 $1,065 $812 $812 $812
Year 4 Farms SummaryYear of Farm 1 2 3 4 5 6 7 8 9 10 11 12 13 14 15 16 17Number of Acres 7,808 7,808 7,808 7,808 7,808 7,808 7,808 7,808 7,808 7,808 7,808 7,808 7,808 7,808 7,808 7,808 7,808Number of Farms 98 98 98 98 98 98 98 98 98 98 98 98 98 98 98 98 98
Fuel Inventory Per Acre dry tons per acre 4.9 9.8 14.7 19.6 24.5 4.9 9.8 14.7 19.6 24.5 4.9 9.8 14.7 19.6 24.5 4.9 9.8Fuel Inventory Per Farm dry tons per farm 392 784 1176 1568 1960 392 784 1176 1568 1960 392 784 1176 1568 1960 392 784Total Fuel Inventory dry tons 38,259 76,518 114,776 153,035 191,294 38,259 76,518 114,776 153,035 191,294 38,259 76,518 114,776 153,035 191,294 38,259 76,518
$/acreRent $1,000's/Yr $104 $0 $0 $0 $812 $812 $812 $812 $812 $812 $812 $812 $812 $812 $812 $812 $812 $812 $812 $812 $812First Yr Prep/Planting Costs* $1,000's $227 $0 $0 $0 $1,769 $0 $0 $0 $0 $0 $0 $0 $0 $0 $0 $0 $0 $0 $0 $0 $0Second Yr Prep/Planting Costs* $1,000's $66 $0 $0 $0 $0 $516 $0 $0 $0 $0 $0 $0 $0 $0 $0 $0 $0 $0 $0 $0 $0Harvesting Cost $1,000's $32 $0 $0 $0 $0 $0 $0 $0 $253 $0 $0 $0 $0 $253 $0 $0 $0 $0 $253 $0 $0Total Cost Per Year $1,000's $0 $0 $0 $2,581 $1,328 $812 $812 $1,065 $812 $812 $812 $812 $1,065 $812 $812 $812 $812 $1,065 $812 $812
Project Schedule 94
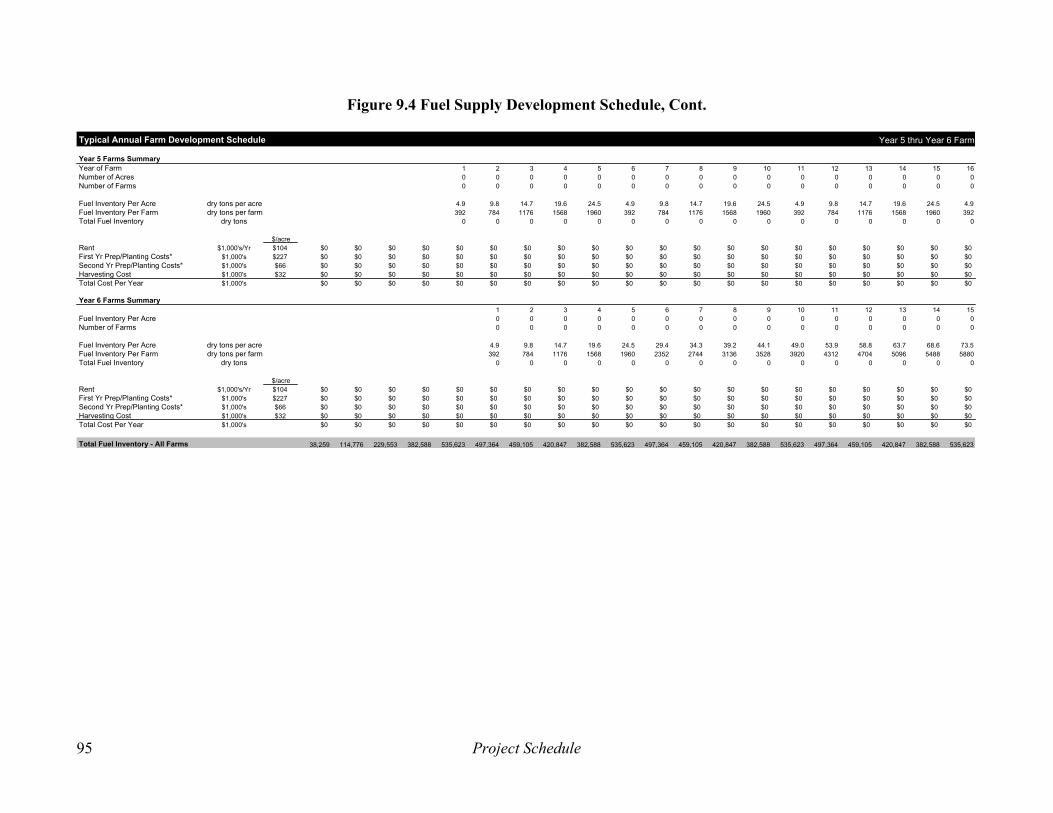
Figure 9.4 Fuel Supply Development Schedule, Cont.
Typical Annual Farm Development Schedule Year 5 thru Year 6 Farms
Year 5 Farms SummaryYear of Farm 1 2 3 4 5 6 7 8 9 10 11 12 13 14 15 16Number of Acres 0 0 0 0 0 0 0 0 0 0 0 0 0 0 0 0Number of Farms 0 0 0 0 0 0 0 0 0 0 0 0 0 0 0 0
Fuel Inventory Per Acre dry tons per acre 4.9 9.8 14.7 19.6 24.5 4.9 9.8 14.7 19.6 24.5 4.9 9.8 14.7 19.6 24.5 4.9Fuel Inventory Per Farm dry tons per farm 392 784 1176 1568 1960 392 784 1176 1568 1960 392 784 1176 1568 1960 392Total Fuel Inventory dry tons 0 0 0 0 0 0 0 0 0 0 0 0 0 0 0 0
$/acreRent $1,000's/Yr $104 $0 $0 $0 $0 $0 $0 $0 $0 $0 $0 $0 $0 $0 $0 $0 $0 $0 $0 $0 $0First Yr Prep/Planting Costs* $1,000's $227 $0 $0 $0 $0 $0 $0 $0 $0 $0 $0 $0 $0 $0 $0 $0 $0 $0 $0 $0 $0Second Yr Prep/Planting Costs* $1,000's $66 $0 $0 $0 $0 $0 $0 $0 $0 $0 $0 $0 $0 $0 $0 $0 $0 $0 $0 $0 $0Harvesting Cost $1,000's $32 $0 $0 $0 $0 $0 $0 $0 $0 $0 $0 $0 $0 $0 $0 $0 $0 $0 $0 $0 $0Total Cost Per Year $1,000's $0 $0 $0 $0 $0 $0 $0 $0 $0 $0 $0 $0 $0 $0 $0 $0 $0 $0 $0 $0
Year 6 Farms Summary1 2 3 4 5 6 7 8 9 10 11 12 13 14 15
Fuel Inventory Per Acre 0 0 0 0 0 0 0 0 0 0 0 0 0 0 0Number of Farms 0 0 0 0 0 0 0 0 0 0 0 0 0 0 0
Fuel Inventory Per Acre dry tons per acre 4.9 9.8 14.7 19.6 24.5 29.4 34.3 39.2 44.1 49.0 53.9 58.8 63.7 68.6 73.5Fuel Inventory Per Farm dry tons per farm 392 784 1176 1568 1960 2352 2744 3136 3528 3920 4312 4704 5096 5488 5880Total Fuel Inventory dry tons 0 0 0 0 0 0 0 0 0 0 0 0 0 0 0
$/acreRent $1,000's/Yr $104 $0 $0 $0 $0 $0 $0 $0 $0 $0 $0 $0 $0 $0 $0 $0 $0 $0 $0 $0 $0First Yr Prep/Planting Costs* $1,000's $227 $0 $0 $0 $0 $0 $0 $0 $0 $0 $0 $0 $0 $0 $0 $0 $0 $0 $0 $0 $0Second Yr Prep/Planting Costs* $1,000's $66 $0 $0 $0 $0 $0 $0 $0 $0 $0 $0 $0 $0 $0 $0 $0 $0 $0 $0 $0 $0Harvesting Cost $1,000's $32 $0 $0 $0 $0 $0 $0 $0 $0 $0 $0 $0 $0 $0 $0 $0 $0 $0 $0 $0 $0Total Cost Per Year $1,000's $0 $0 $0 $0 $0 $0 $0 $0 $0 $0 $0 $0 $0 $0 $0 $0 $0 $0 $0 $0
Total Fuel Inventory - All Farms 38,259 114,776 229,553 382,588 535,623 497,364 459,105 420,847 382,588 535,623 497,364 459,105 420,847 382,588 535,623 497,364 459,105 420,847 382,588 535,623
Project Schedule 95

10. Selected References on Whole Tree EnergyTM 1. EPRI (1993) Whole Tree EnergyTM Design, Volume 1: Engineering Evaluation, TR-101564v.1, Electric Power Research Institute. 2. EPRI (1993) Whole Tree EnergyTM Design, Volume 2: Program to Test Key Elements of WTE, TR-101564v.2, Electric Power Research Institute. 3. EPRI (1993) Whole Tree EnergyTM Design, Volume 3: 100 MW Design, TR-101564v.3, Electric Power Research Institute. 4. EPRI (1995) 100 MW Whole Tree EnergyTM Power Plant Feasibility Study, TR 104819, Electric Power Research Institute. 5. Lamarre, L. (1994 Jan-Feb) Electricity From Whole Trees, EPRI Journal, pp. 16-24. 6. Ostlie, L. D. & Ragland, K. W., (1998) High Efficiency Bioenergy Steam Power Plant, in Bioenergy’98, pp. 772-781. 7. Bryden, K. M. & Ragland, K. W. (1996) Numerical Modeling of a Deep, Fixed Bed Combustor, Energy and Fuels, American Chemical Society, 10, 269-275. 8. Ragland, K. W., Ostlie, L. D. & Berg, D. A. (2001) Whole Tree Energy Power Plant, Progress In Thermochemical Biomass Conversion, International Energy Agency, pp. 812-823. 9. Water Appropriations Permit information can be found at http://www.dnr.state.mn.us/ waters/progra ms/water_mgt_section/appropriations/ index.html or by calling 651-297-2835. 10. NPDES permit information, see http://www.pca.state.mn.us/water/ permits/index.html or contact the MPCA’s Customer Assistance Center at 651-296-7162. 11. Stormwater discharge permit information can be found at http://www.pca.state.mn.us/water/storm water.html. 12. Power plant siting information can be found at the Environmental Quality Board’s website, http://www.mnplan.state.mn.us/eqb/ pwrplant.html). 13. Information on hybrid poplar yields in Minnesota: http://bioenergy.ornl.gov/bfdpmain.html 14. General information on hybrid poplars: The Poplar Council of the Unites States, 251 Bessey Hall, Iowa State University, Ames, IA 50011-1021.
References 96

APPENDICES Appendix 1. Existing Minnesota Valley Power Plant Equipment Boiler: Riley Stoker Corp.; built in 1952; serial number 2895; YPR-22 plus WW boiler; two drum; working pressure 1500 psig; heating surface-water walls, 20,420 ft2; convective heating surface, 2450 ft2; furnace volume 30,400 ft3; water cooled furnace envelope 6500 ft2 steam capacity 385,000 lb/hr; four hour peak capacity 425,000 lb/hr at 1350 psig, 950°F; three Riley pulverizers; six burners; original rating 7.24 lb steam/kWh at 44,000 kW generator output (power factor 0.935), 7.22 lb steam/kWh at 40,000 kW generator output (power factor 0.85); coal feed rate 42,400 lb/hr at 385,000 lb steam/hr (HHV=12,300 as fired), 47,200 lb/hr at 425,000 lb steam/hr; 10 boiler sootblowers, 2 economizer sootblowers and 1 air preheater sootblower. Screen tubes are used. The boiler has made full load on natural gas. Superheater: heating surface 34,890 ft2, operating outlet pressure 1350 psig; operating temperature 950 F. Steam pressure drop 67 psig at 385,000 lb/hr and 81 psig at 425,000 lb/hr. The lower 18 inches of the superheater loops were replaced in 1990; had a number of leaks between 1984 and 1990, major areas of tube leakage were replaced in 1990. Economizer: heating surface 6650 ft2; water pressure drop 15 psi. Air preheater: Ljungstrom rotary, regenerative (model 22-V-56); heating surface 70,900 ft2; air pressure drop 4.1; draft loss 2.8 in. water; total static pressure at heater inlet 8.1 in. water; total static suction at heater exit 6.7 in. water; air flow rate 425,500 lb/hr; gas flow rate 490,000 lb/hr. Condition – good in 1991. Steam Turbine-Generator: General Electric (Contract GE-67362, shipped Jan. 1953); 40,000 kW, 44,000 kW maximum, 3600 rpm, tandem compound double flow condensing with steam at 1250 psig, 950 F, 1.5 in Hg abs.; extraction at 5th stage, 8th stage, 13th stage, 16th stage and 19th stage; steam moisture entering last stage under normal operating conditions not to exceed 9.5%; 40,000 kW, power factor 0.85, two poles, three phase, 60 cycle, 13,800 V, 1968 A, wye connections, hydrogen cooled generator. Overhauled in 1991. Feedwater heaters: two low pressure and two high pressure, Foster Wheeler. One high pressure FWH is out of operation at this time. All FWH could need tube replacement. Deaerating Heater: Elliott direct contact, spray type vertical DA mounted on 1750 ft3 storage tank. Feedwater pumps: two Worthington barrel type pumps (Model 6” WLS-2) Drain pump: low pressure Ingersoll-Rand No. 2 Class SFL single stage, horizontal centrifugal Condensate pump: Allis Chalmers model 6x6 2CL centrifugal pump, 600 gpm (could have a NPSH problem) Condenser: two pass surface condenser, 30,000 ft2, re-tubed in 1990; two 13,000 gpm circulating wate pumps.
Appendix 1. Minnesota Valley Equipment 1-1

Forced draft fan: Buffalo forge No. 12 ‘SLD”, 135,000 cfm at 12.6 in. water. Condition good in 1991. Induced draft fan: Buffalo forge No. 12 ‘SHLD”, 215,000 cfm flue gas at 13.5 in. water, 350 F; condition good in 1991. Electrostatic precipitator: UOP, 1978, collection efficiency 97%. Stack: 350 ft tall; rolled steel plate lined with Gunnite sprayed over steel mesh. Last repaired in 1982. Coal handling, feeding and pulverizing equipment: to be removed. Makeup water treatment system: makeup water from Minnesota River is treated with hydrated lime and soda ash in mixing vessel and pumped to a 1250 gal/hr Permutit hot lime soda water softener. Evaporator: no longer in use but used extracted steam to vaporize incoming makeup water and direct to deaerator. Traveling water screens: two Rex screens; redone in 1994. Ash handling system: currently fly ash is collected from economizer and electrostatic precipitator hoppers through hydroveyor and sluiced to ash ponds; bottom ash sluiced to ash pond. Amount of ash from wood will be 10% that of coal and ash to be pelletized and but back on fields as fertilizer. Electrical and Controls Equipment: see 1992 retention report.
Appendix 1. Minnesota Valley Equipment 1-2
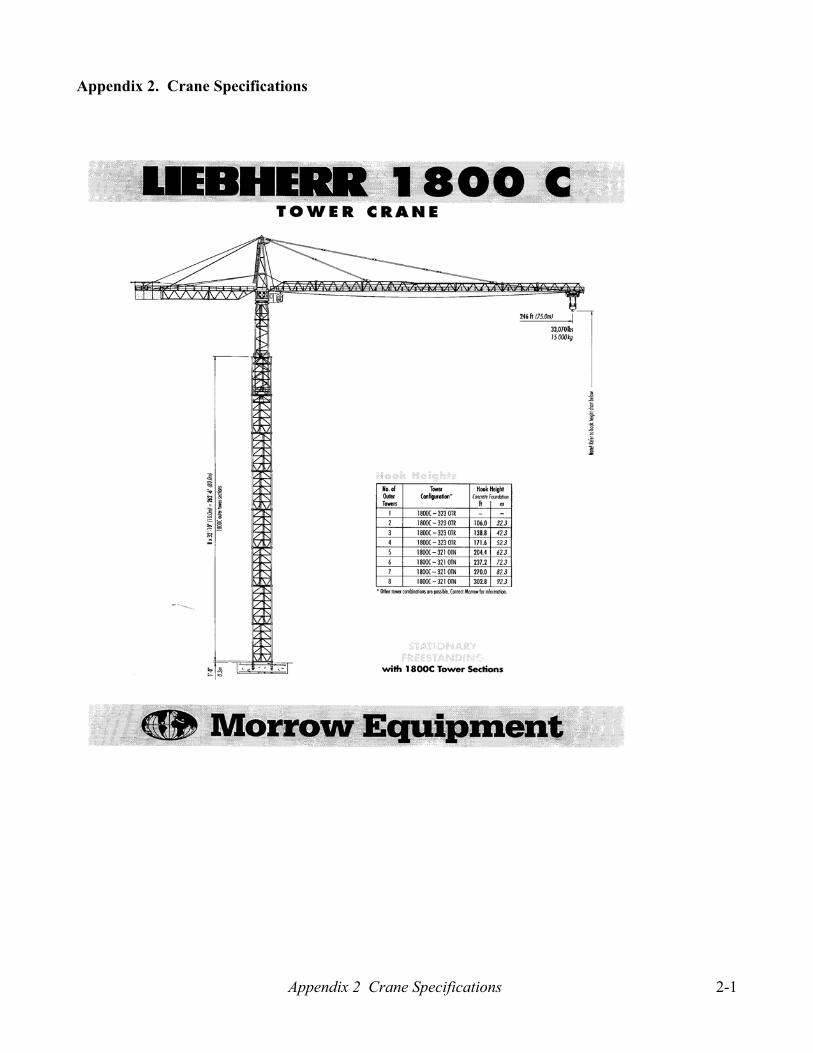
Appendix 2. Crane Specifications
Appendix 2 Crane Specifications 2-1

Appendix 2. Crane Specifications 2-2
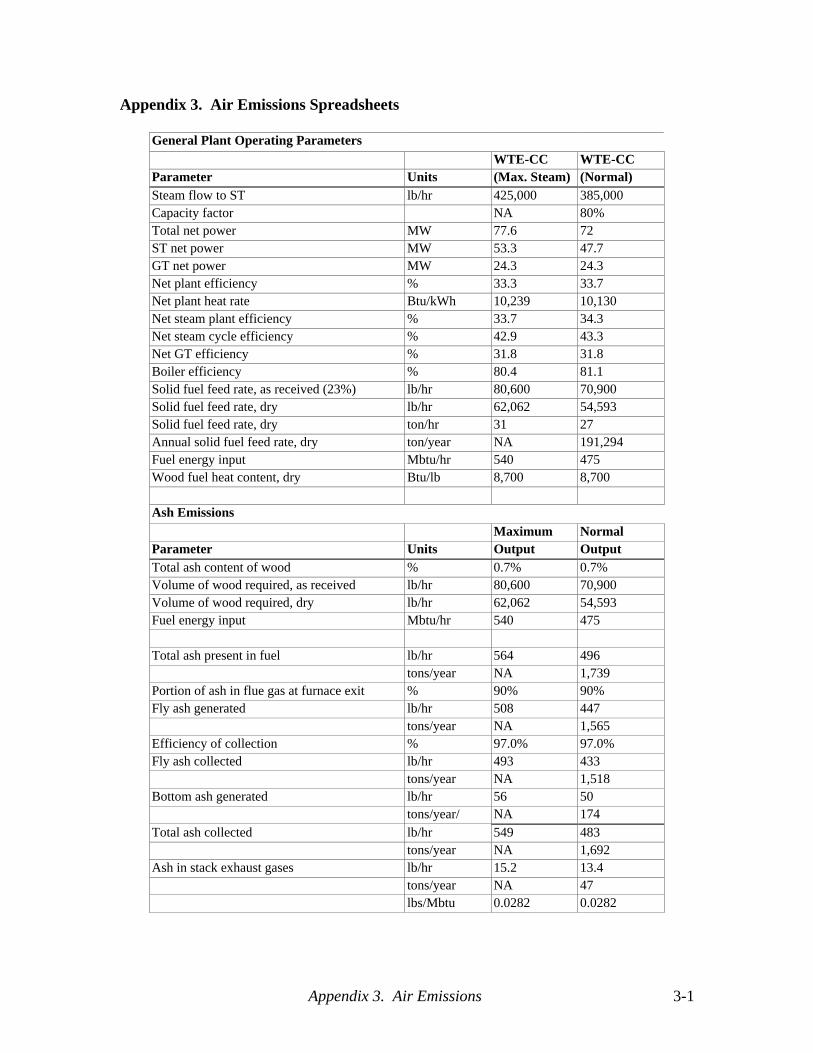
Appendix 3. Air Emissions 3-1
Appendix 3. Air Emissions Spreadsheets
General Plant Operating ParametersWTE-CC WTE-CC
Parameter Units (Max. Steam) (Normal)Steam flow to ST lb/hr 425,000 385,000Capacity factor NA 80%Total net power MW 77.6 72ST net power MW 53.3 47.7GT net power MW 24.3 24.3Net plant efficiency % 33.3 33.7Net plant heat rate Btu/kWh 10,239 10,130Net steam plant efficiency % 33.7 34.3Net steam cycle efficiency % 42.9 43.3Net GT efficiency % 31.8 31.8Boiler efficiency % 80.4 81.1Solid fuel feed rate, as received (23%) lb/hr 80,600 70,900Solid fuel feed rate, dry lb/hr 62,062 54,593Solid fuel feed rate, dry ton/hr 31 27Annual solid fuel feed rate, dry ton/year NA 191,294Fuel energy input Mbtu/hr 540 475Wood fuel heat content, dry Btu/lb 8,700 8,700
Ash EmissionsMaximum Normal
Parameter Units Output OutputTotal ash content of wood % 0.7% 0.7%Volume of wood required, as received lb/hr 80,600 70,900Volume of wood required, dry lb/hr 62,062 54,593Fuel energy input Mbtu/hr 540 475
Total ash present in fuel lb/hr 564 496tons/year NA 1,739
Portion of ash in flue gas at furnace exit % 90% 90%Fly ash generated lb/hr 508 447
tons/year NA 1,565Efficiency of collection % 97.0% 97.0%Fly ash collected lb/hr 493 433
tons/year NA 1,518Bottom ash generated lb/hr 56 50
tons/year/ NA 174Total ash collected lb/hr 549 483
tons/year NA 1,692Ash in stack exhaust gases lb/hr 15.2 13.4
tons/year NA 47lbs/Mbtu 0.0282 0.0282
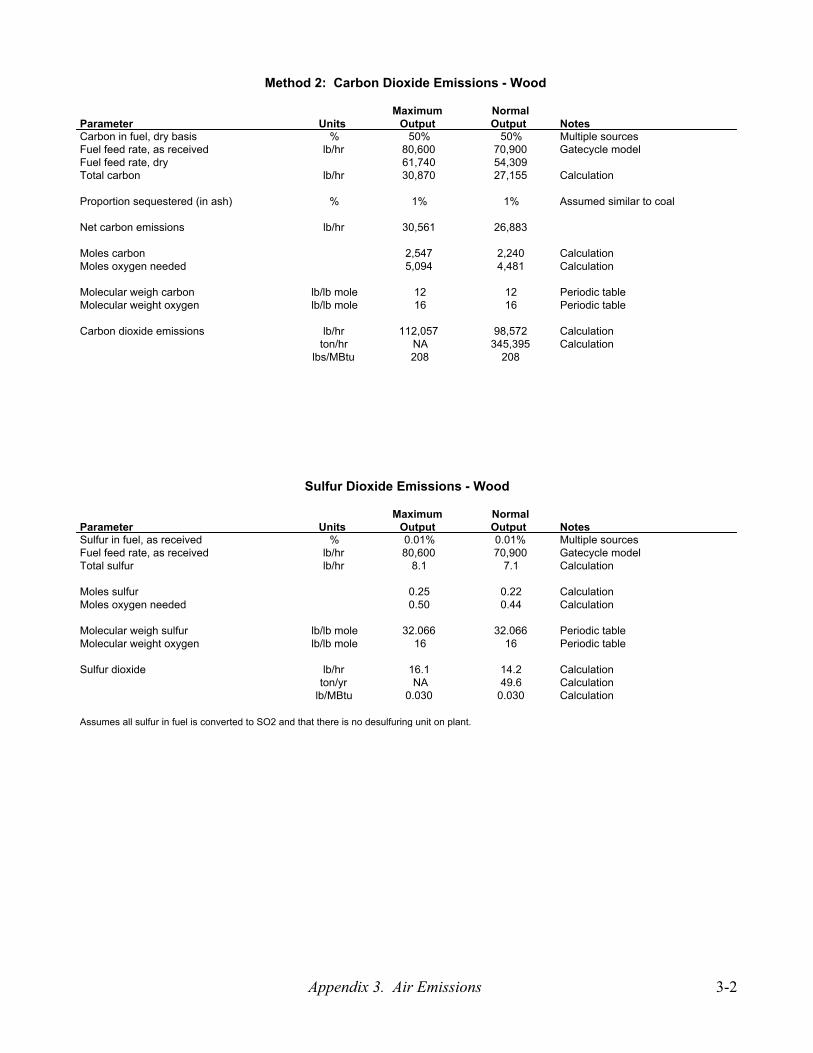
Maximum NormalParameter Units Output Output NotesCarbon in fuel, dry basis % 50% 50% Multiple sourcesFuel feed rate, as received lb/hr 80,600 70,900 Gatecycle modelFuel feed rate, dry 61,740 54,309Total carbon lb/hr 30,870 27,155 Calculation
Proportion sequestered (in ash) % 1% 1% Assumed similar to coal
Net carbon emissions lb/hr 30,561 26,883
Moles carbon 2,547 2,240 CalculationMoles oxygen needed 5,094 4,481 Calculation
Molecular weigh carbon lb/lb mole 12 12 Periodic tableMolecular weight oxygen lb/lb mole 16 16 Periodic table
Carbon dioxide emissions lb/hr 112,057 98,572 Calculationton/hr NA 345,395 Calculation
lbs/MBtu 208 208
Maximum NormalParameter Units Output Output NotesSulfur in fuel, as received % 0.01% 0.01% Multiple sourcesFuel feed rate, as received lb/hr 80,600 70,900 Gatecycle modelTotal sulfur lb/hr 8.1 7.1 Calculation
Moles sulfur 0.25 0.22 CalculationMoles oxygen needed 0.50 0.44 Calculation
Molecular weigh sulfur lb/lb mole 32.066 32.066 Periodic tableMolecular weight oxygen lb/lb mole 16 16 Periodic table
Sulfur dioxide lb/hr 16.1 14.2 Calculationton/yr NA 49.6 Calculation
lb/MBtu 0.030 0.030 Calculation
Assumes all sulfur in fuel is converted to SO2 and that there is no desulfuring unit on plant.
Sulfur Dioxide Emissions - Wood
Method 2: Carbon Dioxide Emissions - Wood
Appendix 3. Air Emissions 3-2

Urge Test Parameter Units Coal Only Coal NotesSteam flow to ST lb/hr 385,000 397,860 From Gatecycle modelCapacity factor 80% 80% DesignTotal net power MW 42.4 46.3 From Gatecycle modelST net power MW 42.4 46.3 From Gatecycle modelGT net power MW - - From Gatecycle modelNet plant efficiency % 30 31 From Gatecycle modelNet plant heat rate Btu/kWh 11366 11179 From Gatecycle modelNet steam plant efficiency % 30 30.5 From Gatecycle modelNet steam cycle efficiency % 37.5 37.7 From Gatecycle model
Net GT efficiency % - - From Gatecycle modelBoiler efficiency % 86.2 88.7 From Gatecycle model
Solid fuel feed rate, as received lb/hr 50,520 40,440 From Gatecycle modelSolid fuel feed rate, dry lb/hr - - CalculationSolid fuel feed rate, dry ton/hr - - CalculationAnnual solid fuel feed rate, as received ton/year 177,022 NA Calculation
Fuel energy input MBtu/hr 482 386 Calculation
Coal fuel heat content Btu/lb 9,540 9,540 From various sources
Urge Test Parameter Units Coal Only Coal NotesTotal ash content of coal, as received % 3.98% 3.98% From various sourcesVolume of coal required, as received lb/hr 50,520 40,440 From Gatecycle ModelVolume of coal required, dry lb/hr - - From Gatecycle ModelFuel energy input MBtu/hr 482 386 Calculation
Total ash present in fuel lb/hr 2,011 1,610 Calculationtons/year 7,045 5,640 Calculation
Portion of ash in flue gas at furnace exit % 99% 99% Energy Information Agency
Fly ash generated lb/hr 1,991 1,593 Calculationtons/year 6,975 5,583 Calculation
Efficiency of collection % 97.0% 97.0%Expected efficiency of electrostatic precipitator
Fly ash collected lb/hr 1,931 1,546 Calculationtons/year 6,766 5,416 Calculation
Bottom ash generated lb/hr 20 16 Calculationtons/year/ 70 56 Calculation
Total ash collected lb/hr 1,951 1,562 Calculationtons/year 6,836 5,472 Calculation
4.05 4.05
Ash in stack exhaust gases lb/hr 59.7 47.8 Calculationtons/year 209 167 Calculationlbs/MBtu 0.1239 0.1239 Calculation
General Plant Operating Parameters - Coal
Ash Emissions - Coal
Appendix 3. Air Emissions 3-3
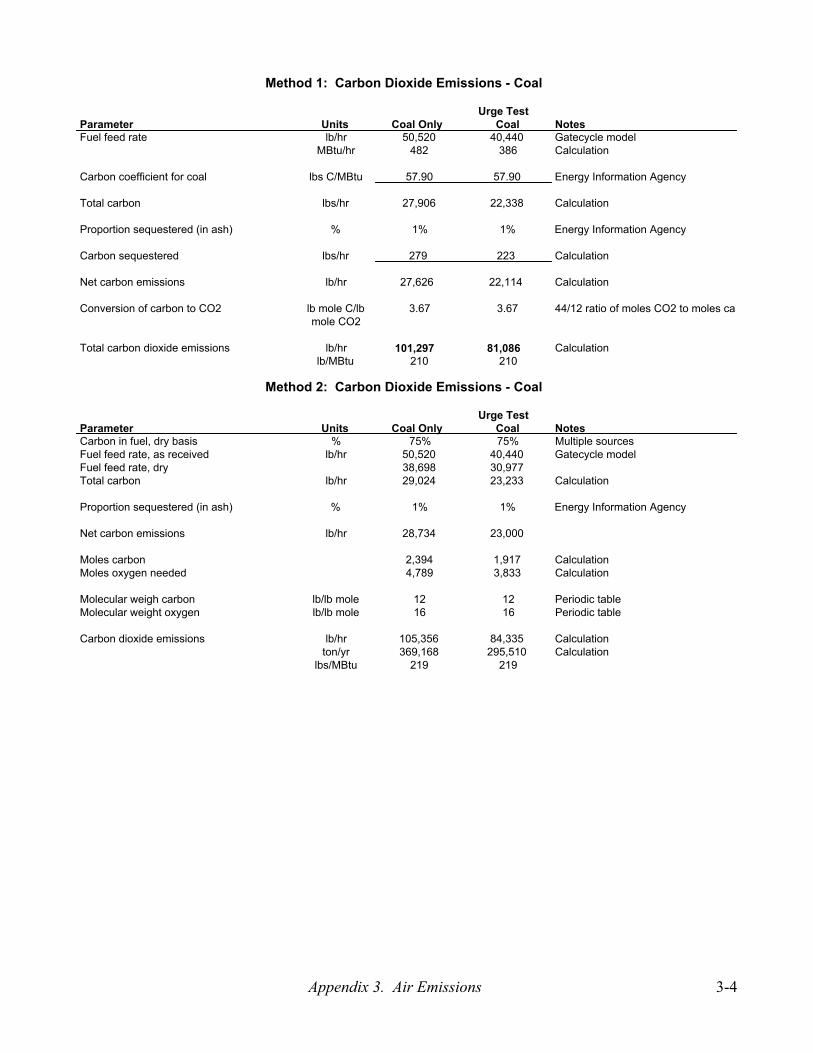
Urge Test Parameter Units Coal Only Coal NotesFuel feed rate lb/hr 50,520 40,440 Gatecycle model
MBtu/hr 482 386 Calculation
Carbon coefficient for coal lbs C/MBtu 57.90 57.90 Energy Information Agency
Total carbon lbs/hr 27,906 22,338 Calculation
Proportion sequestered (in ash) % 1% 1% Energy Information Agency
Carbon sequestered lbs/hr 279 223 Calculation
Net carbon emissions lb/hr 27,626 22,114 Calculation
Conversion of carbon to CO2 lb mole C/lb mole CO2
3.67 3.67 44/12 ratio of moles CO2 to moles car
Total carbon dioxide emissions lb/hr 101,297 81,086 Calculationlb/MBtu 210 210
Urge Test Parameter Units Coal Only Coal NotesCarbon in fuel, dry basis % 75% 75% Multiple sourcesFuel feed rate, as received lb/hr 50,520 40,440 Gatecycle modelFuel feed rate, dry 38,698 30,977Total carbon lb/hr 29,024 23,233 Calculation
Proportion sequestered (in ash) % 1% 1% Energy Information Agency
Net carbon emissions lb/hr 28,734 23,000
Moles carbon 2,394 1,917 CalculationMoles oxygen needed 4,789 3,833 Calculation
Molecular weigh carbon lb/lb mole 12 12 Periodic tableMolecular weight oxygen lb/lb mole 16 16 Periodic table
Carbon dioxide emissions lb/hr 105,356 84,335 Calculationton/yr 369,168 295,510 Calculation
lbs/MBtu 219 219
Method 2: Carbon Dioxide Emissions - Coal
Method 1: Carbon Dioxide Emissions - Coal
Appendix 3. Air Emissions 3-4

Appendix 4. Fuel Cost Summary
Parameter Units Value Notes
Establishment, Maintenance and Harvesting Costs
Cost for farm-grown biomass at farm $/ton $45.85 See Proforma Financials sheet for details.$/ton
Transportation cost
Mileage to plant Miles 25 Average one-way distance from plot to plant
Delivery cost $/mile $1.70 Average for long haul distance - loaded mileTota l transportation cost per load $/load $42.50 Mileage times delivery cost
Average load capacity, dry ton/load 13.9 Estimated from experience and testing
Net transportation cost $/ton $3.06 Calculation
Total Standing Biomass Cost $/ton $48.91 Calculation - see note.$/MBtu $2.81 Calculation
Notes:Does not include impact of tax credits for closed-loop biomass.
2002 Natural Gas Prices - Minnesota
Month $/1000 cu ftOct 4.52Sep 4.82Aug 3.91
Jul 3.28Jun 3.53May 3.66Apr 3.96Mar 2.55Feb 4.16Jan 3.94
$/1000 cu ft 3.833cu ft/MBtu 1000
3.833US Energy Information Agency
Fuel Cost Summary - Farm Grown Biomass
Appendix 4. Fuel Cost 4-1

Appendix 5. Fuel Supply Development Plan Fuel Supply Development Plan Planting Calculation
Typical Planting CrewPlanter Operators 6 Seasonal contract workers Tractor Driver 1 Seasonal contract workers - acts as field supervisorSupervisor/farm manager 1 Fulltime - manages up to 5 crews
Total 8
Equipment Required Per Planting CrewTractor (track type) 1 Rented for duration of the planting seasonAutomatic planters 6 Built for project use
Other Equipment and Personnel Required to Support CrewsPickup truck 1 For supervisor and crew transport, refueling and suppliesTrailer (low boy type) 1 Tractor/planter transport - rented or purchased usedSemi-tractor 1 For tractor/planter transport and delivering slips to fieldRefrigerated trailer 1 For delivery of the frozen slips to the fieldDriver for refrigerated trailer and transport trailer 1 Contract fulltime for planting season
Available Planting Time Per SeasonAverage daily operating time hrs 6.0 Estimated from experienceAverage daily down time (1) hrs 4.0 Estimated from experienceTotal time in field per day hrs 10.0 Calculation
Total planting days per year days 21 Estimated from experienceAvailablitity percentage 90% Estimate (some weather delays and scheduling conflicts)Average planting days per year 18.9
(1) Down time includes time for employee breaks, reloading slip inventory, turnaround time, maintenance and fueling.
Typical Planting Productivity Estimates Per CrewAverage speed of tractor mph 4.0 Estimated speed during normal field operationDistance between trees ft 5.3 As per planting specifications
No. of slips planted per second per planter slips 1.11 CalculationNo. of planting machines per tractor planters 6 Planned numberNo of slips planted per tractor per second slips 6.6 Calculation
No. of slips planted per tractor per day slips 143,457 CalculationSlips per acre slips 1,551 CalculationNo. of acres planted per day per tractor acres 92.5 Calculation
No. of acres planted per crew per season acres 1,748 CalculationNo. of 80 acre farms planted per crew per season farms 22 Calculation
Year 1 Year 2 Year 3 Year 4 Year 5 Year 6No. of acres required per year by fuel supply plan acres 7,808 7,808 7,808 7,808 7,808 0No. of planting crews required each season crews 4.5 4.5 4.5 4.5 4.5 0.0
Slip Delivery Requirements Per CrewNumber of slips per box slips 1,000 Estimated from experienceBoxes per pallet boxes 18 Estimated from experienceSlips per pallet slips 18,000 Calculation
Boxes needed per day per planting team boxes 143.5 CalculationPallets needed per day per planting team pallets 8.0 Calculation
Appendix 5. Fuel Supply Development Plan 5-1

Fuel Supply Development Plan Harvestings and Hauling Calculation
Harvesting AssumptionsTotal time in field per day hrs 10.0 EstimateLess:Downtime for each trailer loading hrs 0.17 Calculation (min= 10 )Other daily down time (1) hrs 2.0 For transport, refueling, maintenance etc.Average daily operating time hrs 7.8 Estimate
Harvester capacity per hour dry tons 100 Calculations from DOE researc
Tons per tree tons 0.016 CalculationTons/acre tons 24.5 CalculationTrees per hour trees 6330 CalculationTons per row tons 7.9 CalculationTons per farm tons 1960 CalculationTons per day tons 783 Calculation
Acres harvested per day acres 32 Calculation 244.205Farms harvested per day farms 0.40 Calculation
Harvester lease cost $/yr $200,000 EPS EstimateHarvesting crew 4 Full time equivalentSalary $/yr $35,000 Includes benefitsMiscellaneous costs $/yr $100,000 Fuel, maintenance etc. .05% of capital 750000Acres harvested per year acres/yr 7808Total harvesting cost $ $440,000 CalculationHarvesting cost $/ton $2.30 Calculation
$/MBtu $0.03 Calculation$/acre $56 Calculation
Hauling AssumptionsLoad capacity per hauling trailer dry tons 13.9 Results from large scale testingTruckloads required per day to plant 38 CalculationTruckloads per year 13,762Average distance from field to plant miles 40 Estimate - averagesurface road distanceAverage on-road truck speed mph 50 Estimate
Time to drop trailer and pick up full load minutes 30 EstimateTravel time from field to plant minutes 48 CalculationTime to unload trailer at plant minutes 10 EstimateTime to return to field minutes 48 CalculationTotal time for round-trip minutes 136 Calculation
Average daily load hauling time available hrs 10Average downtime hrs 0.5 Breaks, lunch, refueling, maintenance etc.Time available for hauling hrs 9.5
No. of loads hauled per truck per day 4.2 CalculationNo. of trucks required to supply plant 9.0 CalculationNo. of trailers required 18 Will need 2 trailers for each truck
Hauling cost $/mile $1.70Cost per truckload delivered to plant $/load $68.00 Roundtrip from plantation to plant and back
$/ton $4.89
Total harvesting and hauling cost $/ton $7.19 Calculation$/acre $176 Calculation
Appendix 5. Fuel Supply Development Plan 5-2
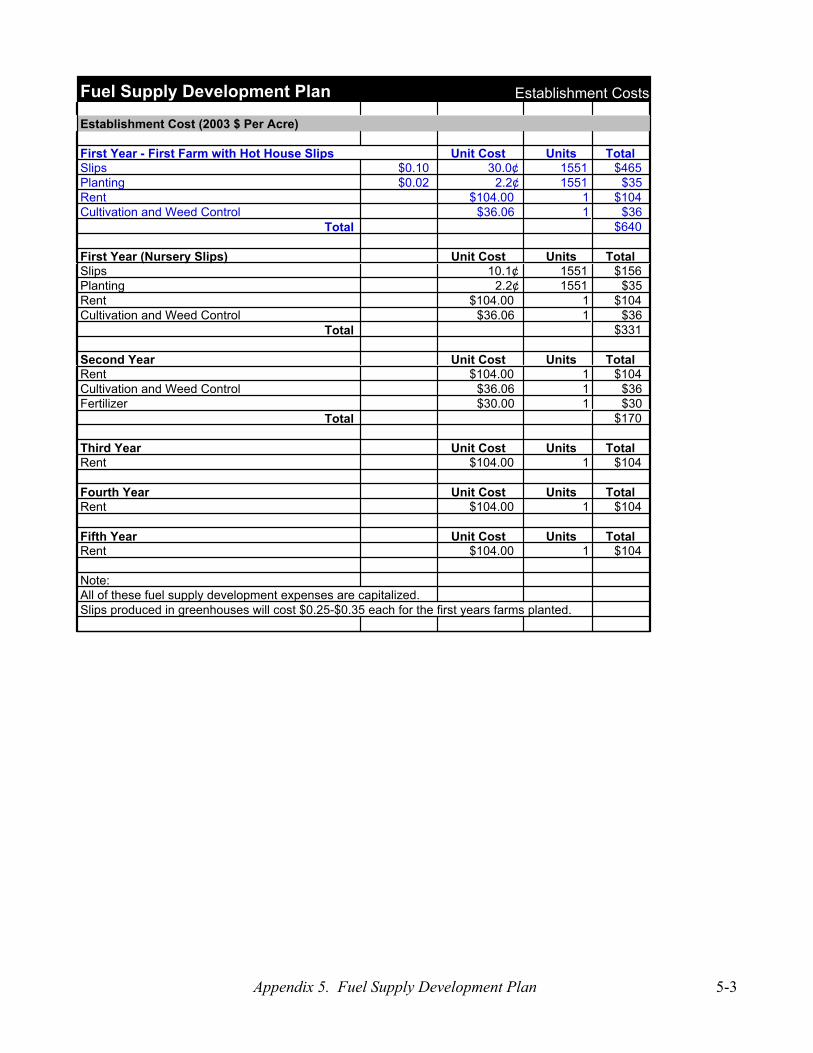
Fuel Supply Development Plan Establishment Costs
Establishment Cost (2003 $ Per Acre)
First Year - First Farm with Hot House Slips Unit Cost Units TotalSlips $0.10 30.0¢ 1551 $465Planting $0.02 2.2¢ 1551 $35Rent $104.00 1 $104Cultivation and Weed Control $36.06 1 $36
Total $640
First Year (Nursery Slips) Unit Cost Units TotalSlips $0.10 10.1¢ 1551 $156Planting $0.02 2.2¢ 1551 $35Rent $104.00 1 $104Cultivation and Weed Control $36.06 1 $36
Total $331
Second Year Unit Cost Units TotalRent $104.00 1 $104Cultivation and Weed Control $36.06 1 $36Fertilizer $30.00 1 $30
Total $170
Third Year Unit Cost Units TotalRent $104.00 1 $104
Fourth Year Unit Cost Units TotalRent $104.00 1 $104
Fifth Year Unit Cost Units TotalRent $104.00 1 $104
Note: All of these fuel supply development expenses are capitalized.Slips produced in greenhouses will cost $0.25-$0.35 each for the first years farms planted.
Appendix 5. Fuel Supply Development Plan 5-3

Appendix 6. Capital Cost Summary
Item Cost NotesDirect Costs (Material and Installation)Boiler modification cost $12,300,000 Babcock preliminary estimate
Tree drying facility cost $9,849,334 UE preliminary estimateFuel handling and balance of plant cost $7,754,250 UE preliminary estimateCombustion turbine and heat recovery feedwater heater $18,712,063 UE preliminary estimate
Subtotal Directs Cost (1) $48,615,647 Includes 25% contingency on all direct costsIndirect CostsSales tax (2) 6.5% $1,580,009 Assumes 50% of capital costs taxable itemsEngineering and construction management $4,500,000Permitting $250,000Other indirects $500,000
Subtotal Indirects Cost $6,330,009
Total Retrofit Construction Cost (3) $54,945,655 Calculation
Estimated AFDUC 5.5% Net interest $3,022,011 See calculation below - not adjusted for inflation or escalation
Total Investment $57,967,666
$/kW $805 For modifications only - book value of existing plantnot included.
Fixed charge rate 20.3% See calculation below
Fixed capital charges $/yr $11,779,030 Calculationmills/kWh 23.34 Calculation
(1) Represents the direct costs of only the items within the scope of this study 25% contingency included in direct costs(2) Applied to 50% of total capital costs - remaining assumed to be non-taxed or installation costs.(3) Does not include estimates for escalation, AFDUC, inflation etc. Does not include capitalized fuel supply development costs (planting, prep, etc.) - these are allocated to net fuel costs.
Component Value NotesInterest/required return on investment 9.0% See calculation belowDepreciation 5.0% Straight line for 20 year lifeInterim replacements 0.4% Allowance for capital equipment replacementsProperty insurance 1.0%Income taxes (effective) 4.9% Combined rate: See calculation below
Total Fixed Charge Rate 20.3%
CalculationsInterest/return on investment Proportion Rate Value Debt 50% 6% 3.0% Equity 50% 12% 6.0%
9.0% Interest/return on investment
Income tax charge 41% times req'd ROI 12% 4.9% Effective tax on profitIncome tax rates Federal 35% State 6% Combined 41%
Fixed Charge Rate for Capital Costs
Minnesota Valley Plant WTE ConversionCapital Cost Summary
Appendix 6. Capital Costs 6-1

AFDUC Calculation
2004 2005 2006
Cost allocation over project time line 12% 61% 27%Amount financed $6,593,479 $33,516,850 $14,835,327
Years of interest 2.5 1.5 0.5Total interest $362,641 $1,843,427 $815,943
Cumulative total AFDUC estimate $3,022,011
Interest expense 5.5%
Appendix 6. Capital Costs 6-1

Appendix 7. Wood Fuel Resources Within 50 Mile Radius of Granite Falls Of the 4.3 million acres of land area within the 9 counties only about 1.5 percent is forestland totaling about 63,000 acres (Figure A7.1). (Note that there are actually 5.0 million acres in a 50-mile radius but since the available data is summarized by county, complete county areas were used for this analysis). On a county by county basis, the proportion of forestland ranges from 0% in Lincoln County to about 4.5% in Kandiyohi County. The forestland - mostly hardwoods such as oak, hickory, maple and elm - is divided into several ownership classes including federal (4,300 acres/7%), state (1,500 acres/2%), farmer/rancher owned (34,700 acres/56%), corporate (1,800 acres/5%), and private individual owned (18,100 acres/29%), (Figure A7.2). There are only about 52,800 acres of forestland owned by farmers and private individuals. Much of this forestland borders wetlands, lakes and rivers.
Figure A7.1 Forestland by County, Acres
County All Land Total ForestPercent Forest
Percent of All Forest in
RegionNon-
ForestlandPercent Non-Forestland
Chippewa 373,800 9,400 2.5% 14.9% 364,400 97.5%Kandiyohi 501,600 22,500 4.5% 35.7% 479,100 95.5%Lac Qui Parle 493,900 7,000 1.4% 11.1% 486,900 98.6%Lincoln 344,600 0 0.0% 0.0% 344,600 100.0%Lyon 457,100 2,400 0.5% 3.8% 454,700 99.5%Redwood 564,200 9,400 1.7% 14.9% 554,800 98.3%Renville 629,900 6,900 1.1% 10.9% 623,000 98.9%Swift 475,700 2,200 0.5% 3.5% 473,500 99.5%Yellow Medicine 485,400 3,300 0.7% 5.2% 482,100 99.3%All counties 4,326,200 63,100 1.5% 100.0% 4,263,100 98.5%
- Source North Central FIA : St. Paul, MN
Figure A7.2 Forestland Ownership by County, 1000's Acres
County All OwnersMiscellaneou
s Federal State OwnedFarmer/ Rancher
Private Corporation
Private Individual
Chippewa 9.4 0 0 5.9 2 1.5Kandiyohi 21.1 3.1 1.5 7.7 0 8.8Lac Qui Parle 7 1.2 0 5.8 0 0Lincoln 0 0 0 0 0 0Lyon 2.4 0 0 1.2 0 1.2Redwood 9.4 0 0 3.9 0 5.5Renville 6.9 0 0 5.8 1.1 0Swift 2.2 0 0 2.2 0 0Yellow Medicine 3.3 0 0 2.2 0 1.1All counties 61.7 4.3 1.5 34.7 3.1 18.1
- No timberland in national forest, BLM, tribal trust, county/municipal, or forest Industry ownership classes - Numbers in rows and columns may not add to totals due to rounding. - The data are derived by sampling and are subject to statistical error. - Source North Central FIA : St. Paul, MN
Current Forestland Harvests Because of the relatively small amount of forestland in the procurement area, minimal logging currently takes place. Only about 356 thousand board feet are harvested annually (Figure A7.3). For
Appendix 7. Wood Resources Within 50 Miles 7-1
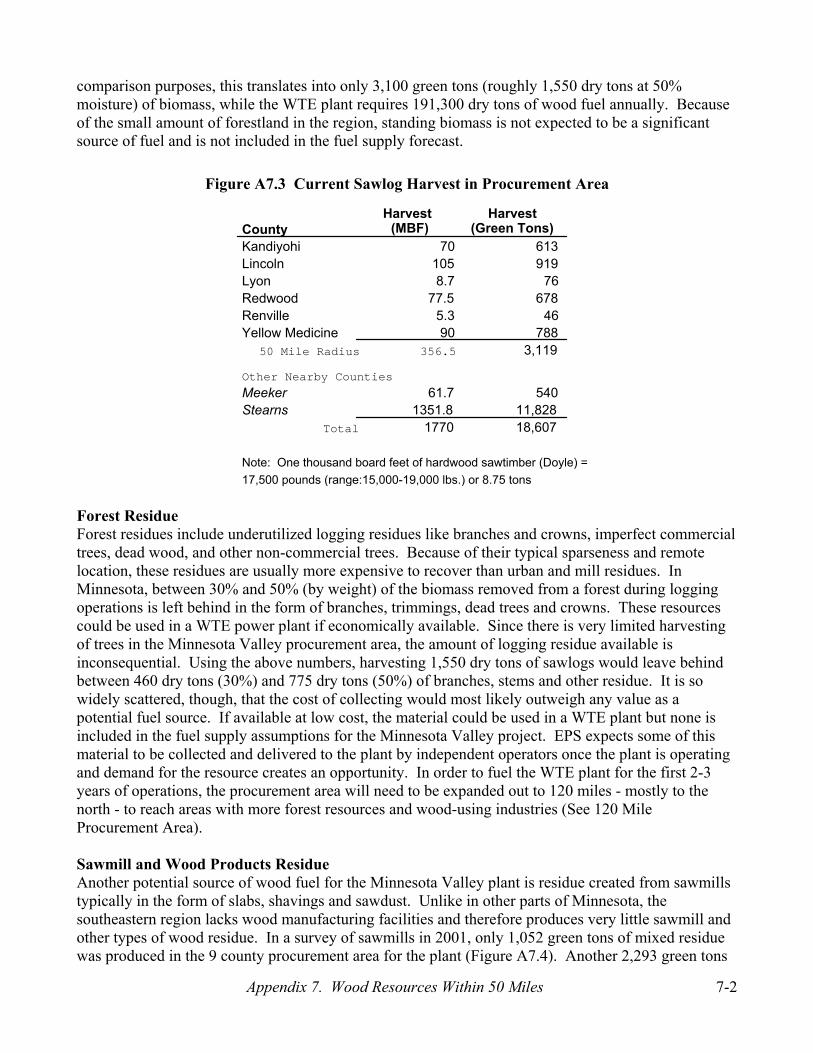
comparison purposes, this translates into only 3,100 green tons (roughly 1,550 dry tons at 50% moisture) of biomass, while the WTE plant requires 191,300 dry tons of wood fuel annually. Because of the small amount of forestland in the region, standing biomass is not expected to be a significant source of fuel and is not included in the fuel supply forecast.
Figure A7.3 Current Sawlog Harvest in Procurement Area
CountyHarvest
(MBF)Harvest
(Green Tons)Kandiyohi 70 613 Lincoln 105 919 Lyon 8.7 76 Redwood 77.5 678 Renville 5.3 46 Yellow Medicine 90 788
50 Mile Radius 356.5 3,119
Other Nearby Counties
Meeker 61.7 540 Stearns 1351.8 11,828
Total 1770 18,607
Note: One thousand board feet of hardwood sawtimber (Doyle) =17,500 pounds (range:15,000-19,000 lbs.) or 8.75 tons
Forest Residue Forest residues include underutilized logging residues like branches and crowns, imperfect commercial trees, dead wood, and other non-commercial trees. Because of their typical sparseness and remote location, these residues are usually more expensive to recover than urban and mill residues. In Minnesota, between 30% and 50% (by weight) of the biomass removed from a forest during logging operations is left behind in the form of branches, trimmings, dead trees and crowns. These resources could be used in a WTE power plant if economically available. Since there is very limited harvesting of trees in the Minnesota Valley procurement area, the amount of logging residue available is inconsequential. Using the above numbers, harvesting 1,550 dry tons of sawlogs would leave behind between 460 dry tons (30%) and 775 dry tons (50%) of branches, stems and other residue. It is so widely scattered, though, that the cost of collecting would most likely outweigh any value as a potential fuel source. If available at low cost, the material could be used in a WTE plant but none is included in the fuel supply assumptions for the Minnesota Valley project. EPS expects some of this material to be collected and delivered to the plant by independent operators once the plant is operating and demand for the resource creates an opportunity. In order to fuel the WTE plant for the first 2-3 years of operations, the procurement area will need to be expanded out to 120 miles - mostly to the north - to reach areas with more forest resources and wood-using industries (See 120 Mile Procurement Area). Sawmill and Wood Products Residue Another potential source of wood fuel for the Minnesota Valley plant is residue created from sawmills typically in the form of slabs, shavings and sawdust. Unlike in other parts of Minnesota, the southeastern region lacks wood manufacturing facilities and therefore produces very little sawmill and other types of wood residue. In a survey of sawmills in 2001, only 1,052 green tons of mixed residue was produced in the 9 county procurement area for the plant (Figure A7.4). Another 2,293 green tons
Appendix 7. Wood Resources Within 50 Miles 7-2

were produced in Meeker and Stearns County, which are within 75 miles of Granite Falls. Much of this resource is already being used for other purposes such as animal litter and bedding (sawdust and shavings), landscaping (wood chips) and firewood (slabs). The value of these residues depends on the end use. Only about 646 green tons are not currently being utilized. Since the plant will need about 60 dry tons per hour of wood during normal operations, the available sawmill residue would hardly supply enough fuel for one day of operations.
Figure A7.4 Sawmill Residue by Type and County
County Total Amt Not Used Total Amt Not Used Total Amt Not UsedKandiyohi 229 0 16 0 245 0Lincoln 573 458 234 12 807 470Meeker 287 0 117 0 404 0Stearns 1341 141 548 35 1889 176
2430 599 915 47 3345 646
Based on 2001 Sawmill Survey
No bark or bark mixed with edgings/chips reported
Total Amount of ResidueSlabs/Edgings Sawdust/Shavings
Other Waste Wood Sources There are many other potential sources of wastewood including debris from the river due to erosion and flooding, storm damaged trees, diseased trees, residential and utility trimmings, construction and demolition debris and residue from discarded wood products such as used pallets and crates. While each of these sources may be relatively small, the total amount can be significant in a larger urban environment. In many communities, this material is either burned, mulched or landfilled. All of this material could be burned in a WTE plant to produce electricity. Research by Oak Ridge National Laboratories and other organizations have tried to estimate the amount of this material that might be available in urban areas of different sizes and locations. While none of the communities in a 50 mile radius of Granite Falls comes close to the size of communities surveyed in the ORNL study, the estimates generated give at least a rough, top-end estimate of the amount of "urban" residue that could be available annually. On average, a typical urban area produces about 1/3 of a ton (moisture content varies) per person annually. This is dependent on many factors including the existence of wood products and other types of manufacturers, the amount of construction activity and the type of housing. For the small rural communities surrounding the Minnesota Valley plant, this estimate will likely be higher than what is actually available. With a total population of about 62,000 in city and township areas with populations over 1,000 (50-mile radius), the amount of wood residue available could be up to 20,000 tons annually (including the sawmill residue above). Expanding the procurement area to 75 miles would increase the "urban" population to 240,400 (cities and townships with populations over 1,000) and the estimated amount of wood to 80,000 wet tons (approximately 48,000 dry tons at an average moisture content of 40%). While this seems like a significant amount, the cost and logistics of collecting and transporting most of this residue from dozens of different cities would be prohibitive given current conditions. Obviously, if a natural disaster such as a tornado or flood generated a large one-time source of wastewood (such as the St. Peter tornadoes), or if material is already collected and available (utility trimmings), the material could be collected and burned in the proposed WTE plant - a much better use than being burned or landfilled. For the purposes of this analysis, though, no "urban" waste is included in the fuel supply estimates.
Appendix 7. Wood Resources Within 50 Miles 7-3

Figure A7.5 Cities in Procurement Area
Stevens Pope
Chippewa
MMcLeod
Meeker Kandiohi
Renville
Swift
Lac qui Parie
Big Stone
Linc
50 Mile Radius
Figure A
Area
CountyChippewaChippewaChippewaKandiyohiKandiyohiKandiyohiKandiyohiLyonRedwoodRenvilleSwiftSwiftYellow Medici
Appendix
Yellow edicine
Murray
Lyon Redwood
Brown
Cottonwood
oln
7.6 Cities in Fuel Supply Procurement
City or Township 2000Montevideo 5,346Clara City 1,393Granite Falls (part) 1,045Dovre township 1,968Green Lake township 1,473New London township 3,057Willmar 18,351Marshall 12,735Redwood Falls (part) 5,459Olivia 2,570Appleton 2,871Benson 3,376
ne Granite Falls 2,025Total "Urban" Population 61,669
7. Wood Resources Within 50 Miles 7-4

Appendix 8. Existing Wood Resources in 120 Mile Radius of Granite Falls
15 Counties All Forestland inNorth of 120 Mile Radius
Units 50 Mi Radius Minnesota NotesTotal BiomassTotal volume of merchantable growing stock million cu ft 745 1,088 FIA website data search for 13 county area - 1990 data updated 1996
Ratio of non-growing stock to growing stock 0.45 0.45 See Ratios sheet - from 1992 MN harvest information
Additional non-growing stock biomass million cu ft 337 492 Total growing stock times ratio of non-growing stock/growing stock
Total timberland biomass million cu ft 1,081 1,579 Calculation
Acres of timberland in region acres 468,100 1,082,000 FIA website data search for 15 county area - 1990 data updated 1996
Average growing stock cu ft/acre 1,591 1,005 Calculation - total volume/total acresdry ton/acre 25 16 Calculation
Non-growing stock (limbwood, cull, saplings, dead cu ft/acre 719 454 Calculationand logging slash) dry ton/acre 11.2 7.1 Calculation
Total biomass cu ft/acre 2,310 1,460 Calculationdry ton/acre 36 23 Calculation
Assumptions
Conversion (cu. ft to dry lb) lb/cu.ft. 31.2 31.2 Project Planning Handbook, www.nationalcarbonoffsetcoalition.org.
Total RemovalsExisting annual growing stock removals million cubic feet 10.3 12.1 Source: North Central FIA web site query for 15 counties
Multiplier for estimated Year 2001 removals Ratio 1.2 1.2 Represents increased harvest from 1990 to 2001 in Minnesota
Estimated growing stock removals 2001 million cubic feet 12.4 14.52 Calculation
Additional non-growing stock biomass million cubic feet 5.6 6.6 Calculation
Total biomass removed (includes all residue) million cubic feet 17.9 21.1 Calculationmillion lb 559.9 657.7 Calculationdry ton 279,939 328,860 Calculation
Proportion of total biomass not used for products % 31% 31% See Ratio sheet - assumes ratios from 1992 data apply to 2001 estimate
Biomass residue potentially available million cubic feet 5.6 6.6 Calculationmillion lb 176.0 206.8dry ton 88,015 103,396 Includes logging residue and logging slash from growing and non-growing sto
Amount of residue collectible for WTE plant 50% 50% Estimate - some residue will be too difficult or expensive to collect
Net residue available for interim fuel supply million cubic feet 2.8 3.3 Annual amount of residue from current harvests in area that could be usedmillion lb 88 103 to fuel WTE plant during interim period before fuel supply is ready to harvestdry ton 44,007 51,698 Note: Most of residue is in the 15 counties north of the 50 mile radius
Average growing stock per acre cu ft/acre 1,591 1,005dry ton/acre 25 16 Note: Southern timberland much less productive than northern timberland
Estimated number of acres harvested, 2001 acres 7,768 14,443 Estimate based on above assumptions
Estimated Biomass Resources in 120 Mile Radius (Including Residue)
Appendix 8. Wood Resources Within 120 Miles 8-1

Sources of Wood Fuel Units Value NotesTotal annual interim fuel supply required dry ton 191,294 Amount needed to fuel plant annually at 80% capacity factor
Sources of Interim FuelWastewood within 120 mile radius dry ton 30,000 Includes storm damage, municipal trimmings, industrial wastewood etc.
Residue- existing harvests within 120 miles dry ton 51,698 Estimate of amount of existing residue available in 120 mile radius(50% of total amount currently produced)
Small loads from independents dry ton 10,000 Individuals and independents delivering wood from small plots, farms etc.
Harvest of existing SRWC plantations dry ton 25,000 1000 acres/yr times average 25 dry tons per acre(Density may be higher on older, "overage" plantations)
Harvest of standing biomass dry ton 74,596 Biomass needed from harvest of existing timberland biomass
Total biomass available in 120 mile radius dry ton 24,637,354 Estimate of existing timberland biomass in 120 mile radiu
Percent of total biomass required for interim fuel 0.3% Annual requirement for 2-3 years
Calculation of Annual Acreage RequiredNet amount of standing biomass needed dry ton 74,596 See above calculation
Estimated total biomass per acre dry ton/acre 36 Estimate for average on forestland in more productive acres innorthern 15 counties - most likely harvesting area.
Percent of total biomass that is sawtimber quality 47% Substract sawtimber from total biomass
Net amount of useable biomass per acre dry ton/acre 19 Net biomass available per acre assuming all sawtimber quality wood is sold
Number of acres to be harvested for WTE plant acre 3,929 Assumes sawtimber quality wood is sold to lumber millsNote: Less acres for existing demands will need to be harvested if the sawtimber from these acres is sold reducing the total number of acresneeded to meet existing demands and the new temporary demand from WTE
Total timberland acres in 120 mile radius acre 1,082,000
Percent of timberland acres to be harvested % 0.4%
Assumptions
Amount required for retrofit plant dry ton/yr 191,294 From Gatecycle modelInterim supply needed for 2-3 period after plant is constructed and before SRWC supply is ready for harvest.
Estimated stumpage value of wood per acre $/acre 470$ 470$ MN Finance and Commerce - 44,000 public acres @ $20.7 million in rev.
Estimated average stumpage cost - merchantable $/ton 18.95$ 30.00$ Calculation
Proportion non-growing stock 0.45 0.45
Net cost for all biomass available $/ton 10.39$ 16.44$ Calculation - does not include subtraction for sawtimber revenue
Note: Stumpage costs vary significantly depending on species of wood, quality, location, demand etc. For instance, in 2001, stumpage prices for sa
from $30.46/Mbf for cedar to $170.13/Mbf for white pine. Polewood varies similarly.
At $100/Mbf, sawtimber is about $33/dry ton for the merchantable portion of the wood.
Stumpage costs for residue varies from free to $5/cord or only about $2.25 per ton - in many cases skidded to a landing area near the harvesting sit
Stumpage Cost Calculation for Existing Timberland Resources
Interim Fuel Supply Scenario for WTE Plant
Appendix 8. Wood Resources Within 120 Miles 8-2

Appendix 9. Fuel Supply Plan Proforma
Cash Flow Assumptions 5/13/0
Working Capital Assumptions(In Days) Startup Year 1 Year 2 Year 3 Year 4 Year 5 Year 6 Year 7 Year 8 Year 9 Year 10 Year 11 Year 12 Year 13 Year 14 Year 15 Year 16 Year 17 Year 18 Year 19 Year 20 Accounts Receivable 10 10 10 10 10 10 10 10 10 10 10 10 10 10 10 10 10 10 10 10 10 Inventory 0 0 0 0 0 0 0 0 0 0 0 0 0 0 0 0 0 0 0 0 0 Accounts Payable 60 60 60 60 60 60 60 60 60 60 60 60 60 60 60 60 60 60 60 60 60
Fixed Asset Purchases (In Dollars) Startup Year 1 Year 2 Year 3 Year 4 Year 5 Year 6 Year 7 Year 8 Year 9 Year 10 Year 11 Year 12 Year 13 Year 14 Year 15 Year 16 Year 17 Year 18 Year 19 Year 20 Land $0 $0 $0 $0 $0 $0 $0 $0 $0 $0 $0 $0 $0 $0 $0 $0 $0 $0 $0 $0 $0 Buildings $0 $0 $0 $0 $0 $0 $0 $0 $0 $0 $0 $0 $0 $0 $0 $0 $0 $0 $0 $0 $0 Building/Leasehold Improvements $0 $0 $0 $0 $0 $0 $0 $0 $0 $0 $0 $0 $0 $0 $0 $0 $0 $0 $0 $0 $0 Machinery & Equipment $0 $0 $0 $0 $0 $0 $0 $0 $0 $0 $0 $0 $0 $0 $0 $0 $0 $0 $0 $0 $0 Office Equipment $0 $0 $0 $0 $0 $0 $0 $0 $0 $0 $0 $0 $0 $0 $0 $0 $0 $0 $0 $0 $0 Automobiles $0 $0 $0 $0 $0 $0 $0 $0 $0 $0 $0 $0 $0 $0 $0 $0 $0 $0 $0 $0 $0Total Fixed Asset Purchases $0 $0 $0 $0 $0 $0 $0 $0 $0 $0 $0 $0 $0 $0 $0 $0 $0 $0 $0 $0 $0
Financing (In Dollars) Startup Year 1 Year 2 Year 3 Year 4 Year 5 Year 6 Year 7 Year 8 Year 9 Year 10 Year 11 Year 12 Year 13 Year 14 Year 15 Year 16 Year 17 Year 18 Year 19 Year 20 Sale of Stock $0 $0 $0 $0 $0 $0 $0 $0 $0 $0 $0 $0 $0 $0 $0 $0 $0 $0 $0 $0 $0 Cash Dividends Declared $0 $0 $0 $0 $0 $0 $0 $0 $0 $0 $0 $0 $0 $0 $0 $0 $0 $0 $0 $0 $0 Proceeds from Short Term Loans $0 $0 $0 $0 $0 $0 $0 $0 $0 $0 $0 $0 $0 $0 $0 $0 $0 $0 $0 $0 $0 Repayment of Short Term Loans $0 $0 $0 $0 $0 $0 $0 $0 $0 $0 $0 $0 $0 $0 $0 $0 $0 $0 $0 $0 $0 Proceeds from Long Term Loans $250,000 $5,000,000 $5,100,000 $6,100,000 $7,400,000 $7,700,000 $0 $0 $0 $0 $0 $0 $0 $0 $0 $0 $0 $0 $0 $0 $0 Repayment of Long Term Loans $0 $0 $0 $0 $0 $0 $857,000 $908,420 $962,925 $1,020,701 $1,081,943 $1,146,859$1,215,671 $1,288,611 $1,365,928 $1,447,883 $1,534,756 $1,626,842 $1,724,452 $1,827,920 $1,937,59 Cumulative debt $5,250,000$10,350,000$16,450,000$23,850,000$31,550,000$30,693,000$29,784,580$28,821,655$27,800,954$26,719,011$25,572,152$24,356,481$23,067,870$21,701,942$20,254,059$18,719,302$17,092,460$15,368,008$13,540,088$11,602,49Other Balance Sheet Accounts (In $) Startup Year 1 Year 2 Year 3 Year 4 Year 5 Year 6 Year 7 Year 8 Year 9 Year 10 Year 11 Year 12 Year 13 Year 14 Year 15 Year 16 Year 17 Year 18 Year 19 Year 20 Purchase of Investments $0 $0 $0 $0 $0 $0 $0 $0 $0 $0 $0 $0 $0 $0 $0 $0 $0 $0 $0 $0 $0 Sale of Investments $0 $0 $0 $0 $0 $0 $0 $0 $0 $0 $0 $0 $0 $0 $0 $0 $0 $0 $0 $0 $0 Increase in Notes Receivable $0 $0 $0 $0 $0 $0 $0 $0 $0 $0 $0 $0 $0 $0 $0 $0 $0 $0 $0 $0 $0 Collection of Notes Receivable $0 $0 $0 $0 $0 $0 $0 $0 $0 $0 $0 $0 $0 $0 $0 $0 $0 $0 $0 $0 $0 Increase in Other Current Assets $0 $0 $0 $0 $0 $0 $0 $0 $0 $0 $0 $0 $0 $0 $0 $0 $0 $0 $0 $0 $0 Reduction of Other Current Assets $0 $0 $0 $0 $0 $0 $0 $0 $0 $0 $0 $0 $0 $0 $0 $0 $0 $0 $0 $0 $0 Increase in Other Assets $0 $0 $0 $0 $0 $0 $0 $0 $0 $0 $0 $0 $0 $0 $0 $0 $0 $0 $0 $0 $0 Reduction of Other Assets $0 $0 $0 $0 $0 $0 $0 $0 $0 $0 $0 $0 $0 $0 $0 $0 $0 $0 $0 $0 $0 Increase in Other Payables $0 $0 $0 $0 $0 $0 $0 $0 $0 $0 $0 $0 $0 $0 $0 $0 $0 $0 $0 $0 $0 Decrease in Other Payables $0 $0 $0 $0 $0 $0 $0 $0 $0 $0 $0 $0 $0 $0 $0 $0 $0 $0 $0 $0 $0 Increase in Accrued Liabilities $0 $0 $0 $0 $0 $0 $0 $0 $0 $0 $0 $0 $0 $0 $0 $0 $0 $0 $0 $0 $0 Decrease in Accrued Liabilities $0 $0 $0 $0 $0 $0 $0 $0 $0 $0 $0 $0 $0 $0 $0 $0 $0 $0 $0 $0 $0
Appendix 9. Fuel Supply Plan 9-1

Income Statement 5/13/03
Sales Startup Year 1 Year 2 Year 3 Year 4 Year 5 Year 6 Year 7 Year 8 Year 9 Year 10 Year 11 Year 12 Year 13 Year 14 Year 15 Year 16 Year 17 Year 18 Year 19 Year 20Whole Tree Fuel (1) $0 $0 $0 $0 $0 $3,508,330 $8,770,824 $8,770,824 $8,770,824 $8,770,824 $8,770,824 $8,770,824 $8,770,824 $8,770,824 $8,770,824 $8,770,824 $8,770,824 $8,770,824 $8,770,824 $8,770,824 $8,770,824
Total Sales $0 $0 $0 $0 $0 $3,508,330 $8,770,824 $8,770,824 $8,770,824 $8,770,824 $8,770,824 $8,770,824 $8,770,824 $8,770,824 $8,770,824 $8,770,824 $8,770,824 $8,770,824 $8,770,824 $8,770,824 $8,770,824
Farm Development CostsFirst Year Planting/Prep Costs $0 $4,184,402 $1,768,978 $1,768,978 $1,768,978 $1,768,978 $0 $0 $0 $0 $0 $0 $0 $0 $0 $0 $0 $0 $0 $0 $0Second Year Prep Costs $0 $0 $515,814 $515,814 $515,814 $515,814 $515,814 $0 $0 $0 $0 $0 $0 $0 $0 $0 $0 $0 $0 $0 $0
Total Farm Development Costs (2) $0 $4,184,402 $2,284,792 $2,284,792 $2,284,792 $2,284,792 $515,814 $0 $0 $0 $0 $0 $0 $0 $0 $0 $0 $0 $0 $0 $0 % of Total Sales 0.0% 0.0% 0.0% 0.0% 0.0% 65.1% 5.9% 0.0% 0.0% 0.0% 0.0% 0.0% 0.0% 0.0% 0.0% 0.0% 0.0% 0.0% 0.0% 0.0% 0.0%
Other Farm Development CostsFarm Management $106,700 $357,500 $357,500 $357,500 $357,500 $357,500 $357,500 $357,500 $357,500 $357,500 $357,500 $357,500 $357,500 $357,500 $357,500 $357,500 $357,500 $357,500 $357,500 $357,500 $357,500Marketing/Land Acquisition $95,000 $80,000 $69,000 $64,000 $64,000 $58,000 $11,000 $11,000 $11,000 $11,000 $11,000 $11,000 $11,000 $11,000 $11,000 $11,000 $11,000 $11,000 $11,000 $11,000 $11,000Rent $0 $812,023 $1,624,046 $2,436,069 $3,248,092 $4,060,115 $4,060,115 $4,060,115 $4,060,115 $4,060,115 $4,060,115 $4,060,115 $4,060,115 $4,060,115 $4,060,115 $4,060,115 $4,060,115 $4,060,115 $4,060,115 $4,060,115 $4,060,115
Total Other Farm Development Cost (2) $201,700 $1,249,523 $2,050,546 $2,857,569 $3,669,592 $4,475,615 $4,428,615 $4,428,615 $4,428,615 $4,428,615 $4,428,615 $4,428,615 $4,428,615 $4,428,615 $4,428,615 $4,428,615 $4,428,615 $4,428,615 $4,428,615 $4,428,615 $4,428,615 % of Total Sales 0.0% 0.0% 0.0% 0.0% 0.0% 127.6% 50.5% 50.5% 50.5% 50.5% 50.5% 50.5% 50.5% 50.5% 50.5% 50.5% 50.5% 50.5% 50.5% 50.5% 50.5%
Total Cost $201,700 $5,433,925 $4,335,338 $5,142,361 $5,954,384 $6,760,407 $4,944,429 $4,428,615 $4,428,615 $4,428,615 $4,428,615 $4,428,615 $4,428,615 $4,428,615 $4,428,615 $4,428,615 $4,428,615 $4,428,615 $4,428,615 $4,428,615 $4,428,615
Gross Profit ($201,700) ($5,433,925) ($4,335,338) ($5,142,361) ($5,954,384) ($3,252,077) $3,826,395 $4,342,209 $4,342,209 $4,342,209 $4,342,209 $4,342,209 $4,342,209 $4,342,209 $4,342,209 $4,342,209 $4,342,209 $4,342,209 $4,342,209 $4,342,209 $4,342,209 % of Total Sales 0.0% 0.0% 0.0% 0.0% 0.0% -92.7% 43.6% 49.5% 49.5% 49.5% 49.5% 49.5% 49.5% 49.5% 49.5% 49.5% 49.5% 49.5% 49.5% 49.5% 49.5%
Misc. Operating ExpensesCrop Insurance (3) $0 $39,040 $78,079 $117,119 $156,158 $195,198 $195,198 $195,198 $195,198 $195,198 $195,198 $195,198 $195,198 $195,198 $195,198 $195,198 $195,198 $195,198 $195,198 $195,198 $195,198Depreciation $0 $0 $0 $0 $0 $0 $0 $0 $0 $0 $0 $0 $0 $0 $0 $0 $0 $0 $0 $0 $0Harvesting $0 $0 $0 $0 $0 $1,375,826 $1,375,826 $1,375,826 $1,375,826 $1,375,826 $1,375,826 $1,375,826 $1,375,826 $1,375,826 $1,375,826 $1,375,826 $1,375,826 $1,375,826 $1,375,826 $1,375,826 $1,375,826Miscellaneous $0 $0 $0 $0 $0 $0 $0 $0 $0 $0 $0 $0 $1 $2 $3 $4 $5 $6 $7 $8 $9Total Other Costs $0 $39,040 $78,079 $117,119 $156,158 $1,571,024 $1,571,024 $1,571,024 $1,571,024 $1,571,024 $1,571,024 $1,571,024 $1,571,025 $1,571,026 $1,571,027 $1,571,028 $1,571,029 $1,571,030 $1,571,031 $1,571,032 $1,571,033
Total Operating Expenses $0 $39,040 $78,079 $117,119 $156,158 $1,571,024 $1,571,024 $1,571,024 $1,571,024 $1,571,024 $1,571,024 $1,571,024 $1,571,025 $1,571,026 $1,571,027 $1,571,028 $1,571,029 $1,571,030 $1,571,031 $1,571,032 $1,571,033 % of Total Sales 0.00% 0.00% 0.00% 0.00% 0.00% 44.78% 17.91% 17.91% 17.91% 17.91% 17.91% 17.91% 17.91% 17.91% 17.91% 17.91% 17.91% 17.91% 17.91% 17.91% 17.91%
Income From Operations ($201,700) ($5,472,965) ($4,413,417) ($5,259,480) ($6,110,542) ($4,823,101) $2,255,371 $2,771,185 $2,771,185 $2,771,185 $2,771,185 $2,771,185 $2,771,184 $2,771,183 $2,771,182 $2,771,181 $2,771,180 $2,771,179 $2,771,178 $2,771,177 $2,771,176 % of Total Sales 0.00% 0.00% 0.00% 0.00% 0.00% -137.48% 25.71% 31.60% 31.60% 31.60% 31.60% 31.60% 31.60% 31.60% 31.60% 31.60% 31.60% 31.60% 31.60% 31.60% 31.60%
Interest Income $0 $0 $0 $0 $0 $0 $0 $0 $0 $0 $0 $0 $1 $2 $3 $4 $5 $6 $7 $8 $9Interest Expense (4) $15,000 $315,000 $621,000 $987,000 $1,431,000 $1,893,000 $1,893,000 $1,841,580 $1,787,075 $1,729,299 $1,668,057 $1,603,141 $1,534,329 $1,461,389 $1,384,072 $1,302,117 $1,215,244 $1,123,158 $1,025,548 $922,080 $812,405Income before Taxes ($216,700) ($5,787,965) ($5,034,417) ($6,246,480) ($7,541,542) ($6,716,101) $362,371 $929,605 $984,110 $1,041,886 $1,103,128 $1,168,045 $1,236,856 $1,309,796 $1,387,113 $1,469,069 $1,555,942 $1,648,027 $1,745,638 $1,849,105 $1,958,780Taxes on Income (5) $0 $0 $0 $0 $0 $0 $0 $0 $0 $0 $0 $0 $0 $0 $0 $0 $0 $0 $0 $0 $0
Net Income After Taxes ($216,700) ($5,787,965) ($5,034,417) ($6,246,480) ($7,541,542) ($6,716,101) $362,371 $929,605 $984,110 $1,041,886 $1,103,128 $1,168,045 $1,236,856 $1,309,796 $1,387,113 $1,469,069 $1,555,942 $1,648,027 $1,745,638 $1,849,105 $1,958,780
Appendix 9. Fuel Supply Plan 9-2
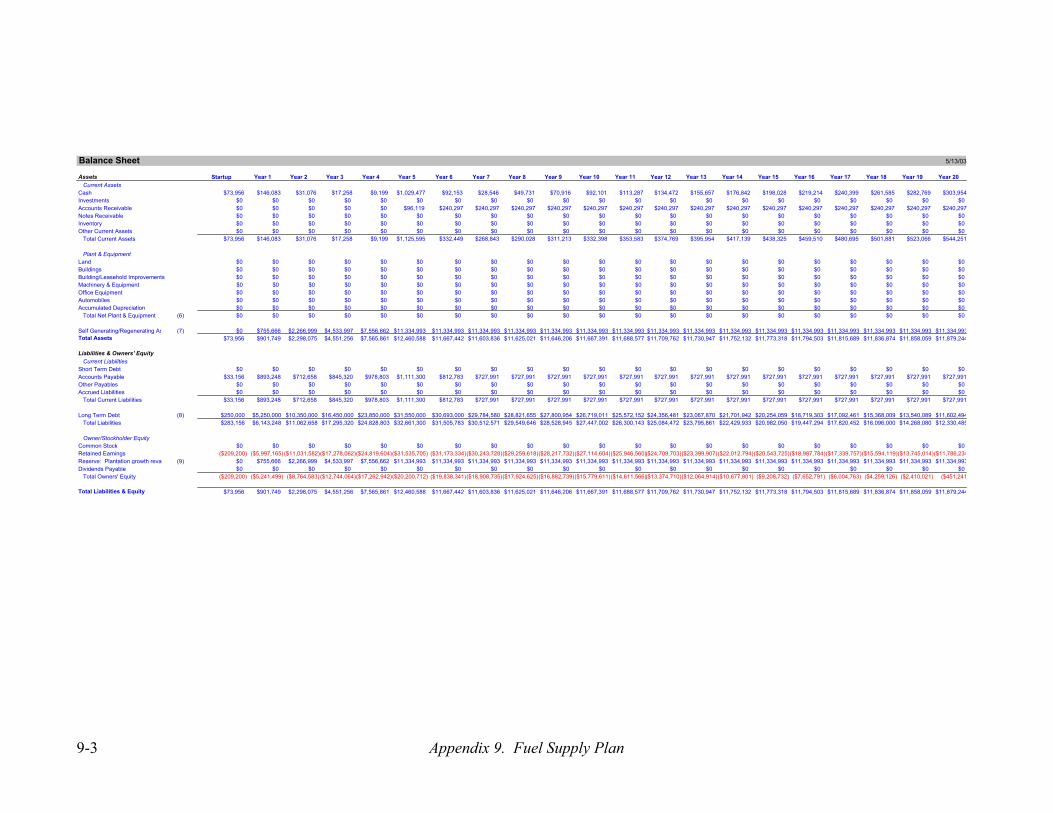
Balance Sheet 5/13/03
Assets Startup Year 1 Year 2 Year 3 Year 4 Year 5 Year 6 Year 7 Year 8 Year 9 Year 10 Year 11 Year 12 Year 13 Year 14 Year 15 Year 16 Year 17 Year 18 Year 19 Year 20 Current AssetsCash $73,956 $146,083 $31,076 $17,258 $9,199 $1,029,477 $92,153 $28,546 $49,731 $70,916 $92,101 $113,287 $134,472 $155,657 $176,842 $198,028 $219,214 $240,399 $261,585 $282,769 $303,954Investments $0 $0 $0 $0 $0 $0 $0 $0 $0 $0 $0 $0 $0 $0 $0 $0 $0 $0 $0 $0 $0Accounts Receivable $0 $0 $0 $0 $0 $96,119 $240,297 $240,297 $240,297 $240,297 $240,297 $240,297 $240,297 $240,297 $240,297 $240,297 $240,297 $240,297 $240,297 $240,297 $240,297Notes Receivable $0 $0 $0 $0 $0 $0 $0 $0 $0 $0 $0 $0 $0 $0 $0 $0 $0 $0 $0 $0 $0Inventory $0 $0 $0 $0 $0 $0 $0 $0 $0 $0 $0 $0 $0 $0 $0 $0 $0 $0 $0 $0 $0Other Current Assets $0 $0 $0 $0 $0 $0 $0 $0 $0 $0 $0 $0 $0 $0 $0 $0 $0 $0 $0 $0 $0 Total Current Assets $73,956 $146,083 $31,076 $17,258 $9,199 $1,125,595 $332,449 $268,843 $290,028 $311,213 $332,398 $353,583 $374,769 $395,954 $417,139 $438,325 $459,510 $480,695 $501,881 $523,066 $544,251
Plant & EquipmentLand $0 $0 $0 $0 $0 $0 $0 $0 $0 $0 $0 $0 $0 $0 $0 $0 $0 $0 $0 $0 $0Buildings $0 $0 $0 $0 $0 $0 $0 $0 $0 $0 $0 $0 $0 $0 $0 $0 $0 $0 $0 $0 $0Building/Leasehold Improvements $0 $0 $0 $0 $0 $0 $0 $0 $0 $0 $0 $0 $0 $0 $0 $0 $0 $0 $0 $0 $0Machinery & Equipment $0 $0 $0 $0 $0 $0 $0 $0 $0 $0 $0 $0 $0 $0 $0 $0 $0 $0 $0 $0 $0Office Equipment $0 $0 $0 $0 $0 $0 $0 $0 $0 $0 $0 $0 $0 $0 $0 $0 $0 $0 $0 $0 $0Automobiles $0 $0 $0 $0 $0 $0 $0 $0 $0 $0 $0 $0 $0 $0 $0 $0 $0 $0 $0 $0 $0Accumulated Depreciation $0 $0 $0 $0 $0 $0 $0 $0 $0 $0 $0 $0 $0 $0 $0 $0 $0 $0 $0 $0 $0 Total Net Plant & Equipment (6) $0 $0 $0 $0 $0 $0 $0 $0 $0 $0 $0 $0 $0 $0 $0 $0 $0 $0 $0 $0 $0
Self Generating/Regenerating As (7) $0 $755,666 $2,266,999 $4,533,997 $7,556,662 $11,334,993 $11,334,993 $11,334,993 $11,334,993 $11,334,993 $11,334,993 $11,334,993 $11,334,993 $11,334,993 $11,334,993 $11,334,993 $11,334,993 $11,334,993 $11,334,993 $11,334,993 $11,334,993Total Assets $73,956 $901,749 $2,298,075 $4,551,256 $7,565,861 $12,460,588 $11,667,442 $11,603,836 $11,625,021 $11,646,206 $11,667,391 $11,688,577 $11,709,762 $11,730,947 $11,752,132 $11,773,318 $11,794,503 $11,815,689 $11,836,874 $11,858,059 $11,879,244
Liabilities & Owners' Equity Current LiabilitiesShort Term Debt $0 $0 $0 $0 $0 $0 $0 $0 $0 $0 $0 $0 $0 $0 $0 $0 $0 $0 $0 $0 $0Accounts Payable $33,156 $893,248 $712,658 $845,320 $978,803 $1,111,300 $812,783 $727,991 $727,991 $727,991 $727,991 $727,991 $727,991 $727,991 $727,991 $727,991 $727,991 $727,991 $727,991 $727,991 $727,991Other Payables $0 $0 $0 $0 $0 $0 $0 $0 $0 $0 $0 $0 $0 $0 $0 $0 $0 $0 $0 $0 $0Accrued Liabilities $0 $0 $0 $0 $0 $0 $0 $0 $0 $0 $0 $0 $0 $0 $0 $0 $0 $0 $0 $0 $0 Total Current Liabilities $33,156 $893,248 $712,658 $845,320 $978,803 $1,111,300 $812,783 $727,991 $727,991 $727,991 $727,991 $727,991 $727,991 $727,991 $727,991 $727,991 $727,991 $727,991 $727,991 $727,991 $727,991
Long Term Debt (8) $250,000 $5,250,000 $10,350,000 $16,450,000 $23,850,000 $31,550,000 $30,693,000 $29,784,580 $28,821,655 $27,800,954 $26,719,011 $25,572,152 $24,356,481 $23,067,870 $21,701,942 $20,254,059 $18,719,303 $17,092,461 $15,368,009 $13,540,089 $11,602,494 Total Liabilities $283,156 $6,143,248 $11,062,658 $17,295,320 $24,828,803 $32,661,300 $31,505,783 $30,512,571 $29,549,646 $28,528,945 $27,447,002 $26,300,143 $25,084,472 $23,795,861 $22,429,933 $20,982,050 $19,447,294 $17,820,452 $16,096,000 $14,268,080 $12,330,485
Owner/Stockholder EquityCommon Stock $0 $0 $0 $0 $0 $0 $0 $0 $0 $0 $0 $0 $0 $0 $0 $0 $0 $0 $0 $0 $0Retained Earnings ($209,200) ($5,997,165) ($11,031,582)($17,278,062)($24,819,604)($31,535,705) ($31,173,334)($30,243,728)($29,259,618)($28,217,732)($27,114,604)($25,946,560)($24,709,703)($23,399,907)($22,012,794)($20,543,725)($18,987,784)($17,339,757)($15,594,119)($13,745,014)($11,786,234Reserve: Plantation growth reva (9) $0 $755,666 $2,266,999 $4,533,997 $7,556,662 $11,334,993 $11,334,993 $11,334,993 $11,334,993 $11,334,993 $11,334,993 $11,334,993 $11,334,993 $11,334,993 $11,334,993 $11,334,993 $11,334,993 $11,334,993 $11,334,993 $11,334,993 $11,334,993Dividends Payable $0 $0 $0 $0 $0 $0 $0 $0 $0 $0 $0 $0 $0 $0 $0 $0 $0 $0 $0 $0 $0 Total Owners' Equity ($209,200) ($5,241,499) ($8,764,583) ($12,744,064)($17,262,942)($20,200,712) ($19,838,341)($18,908,735)($17,924,625)($16,882,739)($15,779,611)($14,611,566)($13,374,710)($12,064,914)($10,677,801) ($9,208,732) ($7,652,791) ($6,004,763) ($4,259,126) ($2,410,021) ($451,241
Total Liabilities & Equity $73,956 $901,749 $2,298,075 $4,551,256 $7,565,861 $12,460,588 $11,667,442 $11,603,836 $11,625,021 $11,646,206 $11,667,391 $11,688,577 $11,709,762 $11,730,947 $11,752,132 $11,773,318 $11,794,503 $11,815,689 $11,836,874 $11,858,059 $11,879,244
Appendix 9. Fuel Supply Plan 9-3

Cash Flows 5/13/03
Sources of Cash: Startup Year 1 Year 2 Year 3 Year 4 Year 5 Year 6 Year 7 Year 8 Year 9 Year 10 Year 11 Year 12 Year 13 Year 14 Year 15 Year 16 Year 17 Year 18 Year 19 Year 20 Operations during the year: Net Income After Taxes ($216,700) ($5,787,965) ($5,034,417) ($6,246,480) ($7,541,542) ($6,716,101) $362,371 $929,605 $984,110 $1,041,886 $1,103,128 $1,168,045 $1,236,856 $1,309,796 $1,387,113 $1,469,069 $1,555,942 $1,648,027 $1,745,638 $1,849,105 $1,958,780 Add items not decreasing cash Depreciation $0 $0 $0 $0 $0 $0 $0 $0 $0 $0 $0 $0 $0 $0 $0 $0 $0 $0 $0 $0 $0 Increase in Accounts Payable $33,156 $860,092 ($180,590) $132,662 $133,483 $132,497 ($298,517) ($84,792) $0 $0 $0 $0 $0 $0 $0 $0 $0 $0 $0 $0 $0 Increase in Other Payables $0 $0 $0 $0 $0 $0 $0 $0 $0 $0 $0 $0 $0 $0 $0 $0 $0 $0 $0 $0 $0 Increase in Accrued Liabilities $0 $0 $0 $0 $0 $0 $0 $0 $0 $0 $0 $0 $0 $0 $0 $0 $0 $0 $0 $0 $0
Deduct items not increasing cash Increase in Accounts Receivable $0 $0 $0 $0 $0 $96,119 $144,178 $0 $0 $0 $0 $0 $0 $0 $0 $0 $0 $0 $0 $0 $0 Increase in Inventory $0 $0 $0 $0 $0 $0 $0 $0 $0 $0 $0 $0 $0 $0 $0 $0 $0 $0 $0 $0 $0
Cash from Operations ($183,544) ($4,927,873) ($5,215,007) ($6,113,818) ($7,408,059) ($6,679,723) ($80,324) $844,813 $984,110 $1,041,886 $1,103,128 $1,168,045 $1,236,856 $1,309,796 $1,387,113 $1,469,069 $1,555,942 $1,648,027 $1,745,638 $1,849,105 $1,958,780
Financing & Other: Sale of Stock $0 $0 $0 $0 $0 $0 $0 $0 $0 $0 $0 $0 $0 $0 $0 $0 $0 $0 $0 $0 $0 Proceeds from Short Term Loans $0 $0 $0 $0 $0 $0 $0 $0 $0 $0 $0 $0 $0 $0 $0 $0 $0 $0 $0 $0 $0 Proceeds from Long Term Loans $31,550,000 $250,000 $5,000,000 $5,100,000 $6,100,000 $7,400,000 $7,700,000 $0 $0 $0 $0 $0 $0 $0 $0 $0 $0 $0 $0 $0 $0 $0 Sale of Investments $0 $0 $0 $0 $0 $0 $0 $0 $0 $0 $0 $0 $0 $0 $0 $0 $0 $0 $0 $0 $0 Collection of Notes Receivable $0 $0 $0 $0 $0 $0 $0 $0 $0 $0 $0 $0 $0 $0 $0 $0 $0 $0 $0 $0 $0 Reduction of Other Current Assets $0 $0 $0 $0 $0 $0 $0 $0 $0 $0 $0 $0 $0 $0 $0 $0 $0 $0 $0 $0 $0 Reduction of Other Assets $0 $0 $0 $0 $0 $0 $0 $0 $0 $0 $0 $0 $0 $0 $0 $0 $0 $0 $0 $0 $0
Cash from Operations & Financing $66,456 $72,127 ($115,007) ($13,818) ($8,059) $1,020,277 ($80,324) $844,813 $984,110 $1,041,886 $1,103,128 $1,168,045 $1,236,856 $1,309,796 $1,387,113 $1,469,069 $1,555,942 $1,648,027 $1,745,638 $1,849,105 $1,958,780
Applications of Cash: Payment of Dividends $0 $0 $0 $0 $0 $0 $0 $0 $0 $0 $0 $0 $0 $0 $0 $0 $0 $0 $0 $0 $0 Purchases of Fixed Assets $0 $0 $0 $0 $0 $0 $0 $0 $0 $0 $0 $0 $0 $0 $0 $0 $0 $0 $0 $0 $0 Repayment of Short Term Loans $0 $0 $0 $0 $0 $0 $0 $0 $0 $0 $0 $0 $0 $0 $0 $0 $0 $0 $0 $0 $0 Repayment of Long Term Loans $0 $0 $0 $0 $0 $0 $857,000 $908,420 $962,925 $1,020,701 $1,081,943 $1,146,859 $1,215,671 $1,288,611 $1,365,928 $1,447,883 $1,534,756 $1,626,842 $1,724,452 $1,827,920 $1,937,595 Purchase of Investments $0 $0 $0 $0 $0 $0 $0 $0 $0 $0 $0 $0 $0 $0 $0 $0 $0 $0 $0 $0 $0 Increase in Notes Receivable $0 $0 $0 $0 $0 $0 $0 $0 $0 $0 $0 $0 $0 $0 $0 $0 $0 $0 $0 $0 $0 Increase in Other Current Assets $0 $0 $0 $0 $0 $0 $0 $0 $0 $0 $0 $0 $0 $0 $0 $0 $0 $0 $0 $0 $0 Increase in Other Assets $0 $0 $0 $0 $0 $0 $0 $0 $0 $0 $0 $0 $0 $0 $0 $0 $0 $0 $0 $0 $0
Increase/(Decrease) in Cash $66,456 $72,127 ($115,007) ($13,818) ($8,059) $1,020,277 ($937,324) ($63,607) $21,185 $21,185 $21,185 $21,186 $21,185 $21,185 $21,185 $21,186 $21,186 $21,185 $21,186 $21,185 $21,185
Change in Cash Balance Ending Cash Balance $73,956 $146,083 $31,076 $17,258 $9,199 $1,029,477 $92,153 $28,546 $49,731 $70,916 $92,101 $113,287 $134,472 $155,657 $176,842 $198,028 $219,214 $240,399 $261,585 $282,769 $303,954 Beginning Cash Balance $0 $73,956 $146,083 $31,076 $17,258 $9,199 $1,029,477 $92,153 $28,546 $49,731 $70,916 $92,101 $113,287 $134,472 $155,657 $176,842 $198,028 $219,214 $240,399 $261,585 $282,769Increase/(Decrease) in Cash $73,956 $72,127 ($115,007) ($13,818) ($8,059) $1,020,277 ($937,324) ($63,607) $21,185 $21,185 $21,185 $21,186 $21,185 $21,185 $21,185 $21,186 $21,186 $21,185 $21,186 $21,185 $21,185
Appendix 9. Fuel Supply Plan 9-4

Long Term Debt Amortization Schedule 5/28/03
Prestart Year 1 Year 2 Year 3 Year 4 Year 5 Year 6 Year 7 Year 8 Year 9 Year 10 Year 11 Year 12Long term debt $250,000 $5,250,000 $10,350,000 $16,450,000 $23,850,000 $31,550,000 $30,693,000 $29,784,580 $28,821,655 $27,800,954 $26,719,011 $25,572,152 $24,356,481
Interest 6% $15,000 $315,000 $621,000 $987,000 $1,431,000 $1,893,000 $1,841,580 $1,787,075 $1,729,299 $1,668,057 $1,603,141 $1,534,329 $1,461,389
Amortization scheduleBeginning Balance $31,550,000 $30,693,000 $29,784,580 $28,821,655 $27,800,954 $26,719,011 $25,572,152
Principal $857,000 $908,420 $962,925 $1,020,701 $1,081,943 $1,146,859 $1,215,671
Interest $1,893,000 $1,841,580 $1,787,075 $1,729,299 $1,668,057 $1,603,141 $1,534,329
Payment $2,750,000 $2,750,000 $2,750,000 $2,750,000 $2,750,000 $2,750,000 $2,750,000
Ending Balance $30,693,000 $29,784,580 $28,821,655 $27,800,954 $26,719,011 $25,572,152 $24,356,481
Long Term Debt Amortization Schedule 5/28/03
Year 13 Year 14 Year 15 Year 16 Year 17 Year 18 Year 19 Year 20 Year 21 Year 22 Year 23 Year 24 Year 25Long term debt $23,067,870 $21,701,942 $20,254,059 $18,719,302 $17,092,460 $15,368,008 $13,540,088 $11,602,494 $9,548,643 $7,371,562 $5,063,856 $2,617,687 $24,748
Interest $1,384,072 $1,302,117 $1,215,244 $1,123,158 $1,025,548 $922,080 $812,405 $696,150 $572,919 $442,294 $303,831 $157,061 $1,485
Amortization scheduleBeginning Balance $24,356,481 $23,067,870 $21,701,942 $20,254,059 $18,719,302 $17,092,460 $15,368,008 $13,540,088 $11,602,494 $9,548,643 $7,371,562 $5,063,856 $2,617,687
Principal $1,288,611 $1,365,928 $1,447,883 $1,534,756 $1,626,842 $1,724,452 $1,827,920 $1,937,595 $2,053,850 $2,177,081 $2,307,706 $2,446,169 $2,592,939
Interest $1,461,389 $1,384,072 $1,302,117 $1,215,244 $1,123,158 $1,025,548 $922,080 $812,405 $696,150 $572,919 $442,294 $303,831 $157,061
Payment $2,750,000 $2,750,000 $2,750,000 $2,750,000 $2,750,000 $2,750,000 $2,750,000 $2,750,000 $2,750,000 $2,750,000 $2,750,000 $2,750,000 $2,750,000
Ending Balance $23,067,870 $21,701,942 $20,254,059 $18,719,302 $17,092,460 $15,368,008 $13,540,088 $11,602,494 $9,548,643 $7,371,562 $5,063,856 $2,617,687 $24,748
Appendix 9. Fuel Supply Plan 9-5

Appendix 9. Fuel Supply Plan 9-6
Self Generating Asset Calculation 5/13/03
Units Value Notes
First 3 years establishment costs $ $15,113,324 Also includes startup year
Number of harvests from each plot 4 Estimate
Amount harvested each time dry ton 191,294 Gatecycle data
Total harvested over 20 years dry ton 765,175 Calculation
Average cost basis for asset $/dry ton $19.75 Calculation - no inflation or interest included
Assumptions:(1) Price whole tree fuel at farm $45.85 per dry ton $2.64 per Mbtu (not including transportation costs).(1) First harvest begins at end of growing season in Year 5 - model assumes 40% of acreage is harvested and sold for fuel in Year 5.(2) Farm development costs are amortized over life of farms.(3) Crop insurance estimated at $4.00 per acre per year(4) Interest on long term debt is 6%(5) No taxes are calculated - tax loss carry-forwards are assumed to balance any net income.(6) All equipment is assumed to be leased. Cost is included in farm management costs.(7) Self generating assets are the trees planted on the farms. Asset valued at extimated development cost per ton times the annual increase in growing stock
(9) Balancing entry for self generating assets.
Notes:Model does not include the impact of potential tax benefits for using closed loop biomass, renewable energy sources or other types of benefits.