economic and social in uences on attitudes to refugees in ...uctp100/sciencespo_slides.pdf ·...
TRANSCRIPT

Immigration Workshop, Sciences Po, 22 February 2016
Economic and Social Influences on Attitudes to
Refugees in Europe
Christian Dustmann Ian Preston
University College London, Centre for Research and Analysis of Migration
@CReAM Research @IanPPreston
1

Introduction
European refugee crisis draws political response which threatens
open borders
free movement of labour
integrity of benefit systems
Sources of public concern poorly understood
Volatile media coverage and political urgency provokes hasty reforms
2

Presentation
This presentation uses large cross-European attitudinal dataset to
describe perceptions of impact of immigration
distinguish factors underlying views on immigration policy
assess relevance to refugee policy
Data from European Social Survey 2002 and 2014
Questions in special immigration module
first fielded 2002
partly repeated 2014
3

Historical context
Earlier survey conducted at end of heightened period of refugee inflow
Asylum applications to EU 28 exceeded 400,000 for three years 2000-2002
Large inflows from Iraq, Afghanistan, Serbia/Montenegro, Turkey, Russia
Asylum numbers fall back through subsequent decade before very rapid recent
growth
Large recent numbers from Syria, Afghanistan, Kosovo, Eritrea, Pakistan
4
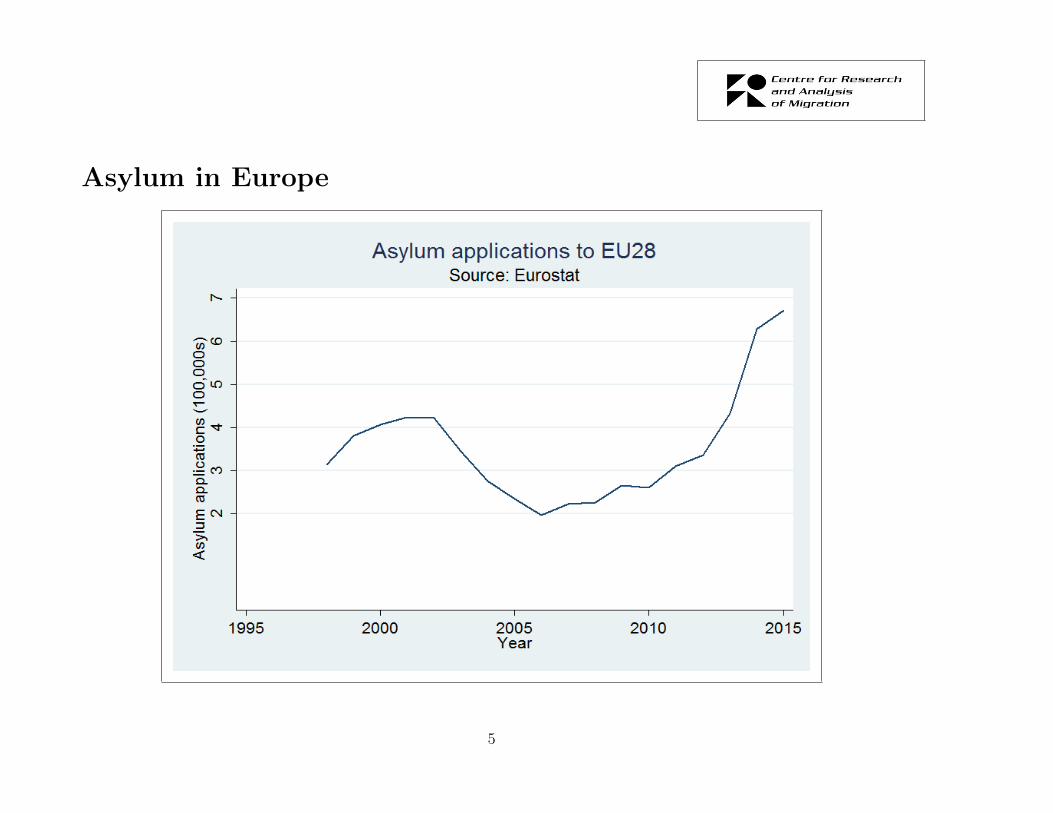
Asylum in Europe
5

Sources of attitudes to immigration policy: Economic impact
Economic impact:
labour market competition may drive down wages and reduce native
employment
impact may be different at different points in distribution
skill shortages may be alleviated
entrepreneurship and innovation may be encouraged
public finances may be affected
pressure on public services may be exacerbated
Expert and popular opinion may well be divided
6
Sources of attitudes to immigration policy: Social impact
Social impact:
immigration diminishes social homogeneity in several dimensions
cultural impact may be viewed as enriching or threatening
perceived threats to group privileges may heighten social tension
immigrants may commit and suffer as victims of crime
7
Sources of attitudes to immigration policy: International
International perspective
immigration is primarily of benefit to migrants themselves
efficient international allocation of labour ultimately benefits all
source countries may gain from remittances and skill transfers or suffer
from skill depletion
attitudes in Western countries may be coloured by colonial heritage
8

Refugee policy
Refugee immigration raises same issues as general immigration
But also raises other questions
Entitlement to enter based on claims of persecution which need to be assessed
how should refugees be treated while cases are considered?
allowed to work
dependent on public funds
detained
how generously should cases be evaluated?
should families be allowed to enter country?
9

Analytical problems
Directions of causality are murky
Policy preferences driven by one aspect of the effect may bleed into perceptions
of other dimensions of impact
Simple causal stories can be advanced but at heart we only identify associa-
tions
10

European Social Survey: Round 1, Immigration policy
Conducted in 21 countries with about 40,000 respondents in 2002
Special immigration module, designed by team based at CReAM
Asks opinion on immigration policy:
”To what extent do you think [this country] should allow people from
[specified source] to come and live here?”
Asked separately with respect to immigrants from
• rich/poor European/non-European countries
• same/different ethnicity as majority
11

Distributions of Opinions on Immigration Policy
How Many Allowed to Immigrate
Mean Std Dev None Few Some Many
Rich European Countries 2.72 0.85 9.9 32.6 43.3 14.2
Poor European Countries 2.57 0.81 9.0 36.8 42.8 11.4
Rich non-European Countries 2.53 0.84 11.3 36.2 41.1 11.4
Poor non-European Countries 2.49 0.82 10.8 39.0 40.1 10.0
Same Race/Ethnicity as Majority 2.73 0.80 6.3 30.8 47.1 15.8
Different Race/Ethnicity from Majority 2.48 0.82 11.3 38.9 40.0 9.7
Source: ESS 2002
Answers on scale 1-4, higher values more open to immigration
12

Distributions of Opinions on Immigration Policy
Opinions more open to
richer immigrants
European immigrants
immigrants of same ethnicity
but not dramatically so
13

European Social Survey: Effects of immigration
Also asks about broad effects of immigration:
• Would you say it is generally bad or good for [this country’s] economy
that people come to live here from other countries?
• Is [this country] made a worse or better place to live by people coming
to live here from other countries?
14

Distributions of Opinions on Effects of Immigration
Responses on 10 point scale
Mean Deviation 0-1 2-4 5 6-8 9-10
Immigration:
Good/Bad for the Economy 4.97 2.36 9.3 25.0 28.1 32.0 5.5
Better/Worse Place to Live 4.77 2.18 8.3 28.1 34.6 24.8 4.3
Source: ESS 2002
Answers on scale 0-10, higher values more positive to immigration
15

Cross Country Differences in Opinions
Allow Immigrants Good/Bad Make Better/Worse
(Average) for Economy Place to Live
All Countries 0.52 0.50 0.48
Germany 0.55 0.51 0.48
Spain 0.54 0.54 0.47
France 0.49 0.51 0.45
Greece 0.36 0.36 0.34
Italy 0.59 0.53 0.45
Ireland 0.57 0.50 0.53
Poland 0.57 0.45 0.52
Sweden 0.69 0.55 0.62
United Kingdom 0.49 0.44 0.46
Answers scaled to lie between 0 and 1, higher values more positive to immigration
Source: ESS 2002
16

Cross Country Differences in Opinions, 2002
17

Cross Country Differences in Opinions, 2002
Greece , Hungary particularly hostile to immigration
Sweden, Switzerland particularly liberal
Attitudes to impact on economy and quality of life strongly correlated across
(as well as within) countries
18

European Social Survey: Economic concerns
• Agree/disagree: Average wages and salaries are generally brought down by people coming to live and
work here?
• Agree/disagree: People who come to live and work here generally harm the economic prospects of the
poor more than the rich?
• Agree/diagree: People who come to live and work here help to fill jobs where there are shortages of
workers?
• Would you say that people who come to live here generally take jobs away from workers in [this country],
or generally help to create new jobs?
• Most people who come to live here work and pay taxes. They also use health and welfare services. On
balance, do you think people . . . take out more than they put in or put in more than they take out?
19

European Social Survey: Social concerns
• Agree/disagree: It is better for a country if almost everyone shares the same customs and traditions ?
• Agree/disagree: It is better for a country if there are a variety of different religions?
• Agree/disagree: It is better for a country if almost everyone is able to speak at least one common
language ?
• Would you say that [this country]s cultural life is generally undermined or enriched by people coming
to live here from other countries?
• Are [this country]s crime problems made worse or better by people coming to live here from other
countries?
• Agree/disagree: If a country wants to reduce tensions it should stop immigration?
20

European Social Survey: Internationalism
• Agree/disagree: All countries benefit if people can move to countries where their skills are most needed?
• When people leave their countries to come to live in [this country], do you think it has a bad or good
effect on those countries in the long run??
• Agree/disagree: Richer countries have a responsibility to accept people from poorer countries ?
21
European Social Survey: Refugee Policy
• Agree/disagree: While their applications for refugee status are being considered, people should be allowed
to work in [this country]?
• Agree/disagree: While their cases are being considered, applicants should be kept in detention centres?
• Agree/disagree: While their cases are being considered, the [country] government should give financial
support to applicants ?
• Agree/disagree: The government should be generous50 in judging peoples applications for refugee sta-
tus?
• Agree/disagree: Refugees whose applications are granted should be entitled to bring in their close family
members?
22

Factor model for opinions
Opinions on immigration policy y, on refugee policy r and answers to indicator
questions z hypothesised to be driven by common factors f of smaller dimension
than z, given characteristics X
y = Λf + αX + µ
r = Rf + βX + υ
z = Mf + CX + ν
f = BX + ω
23
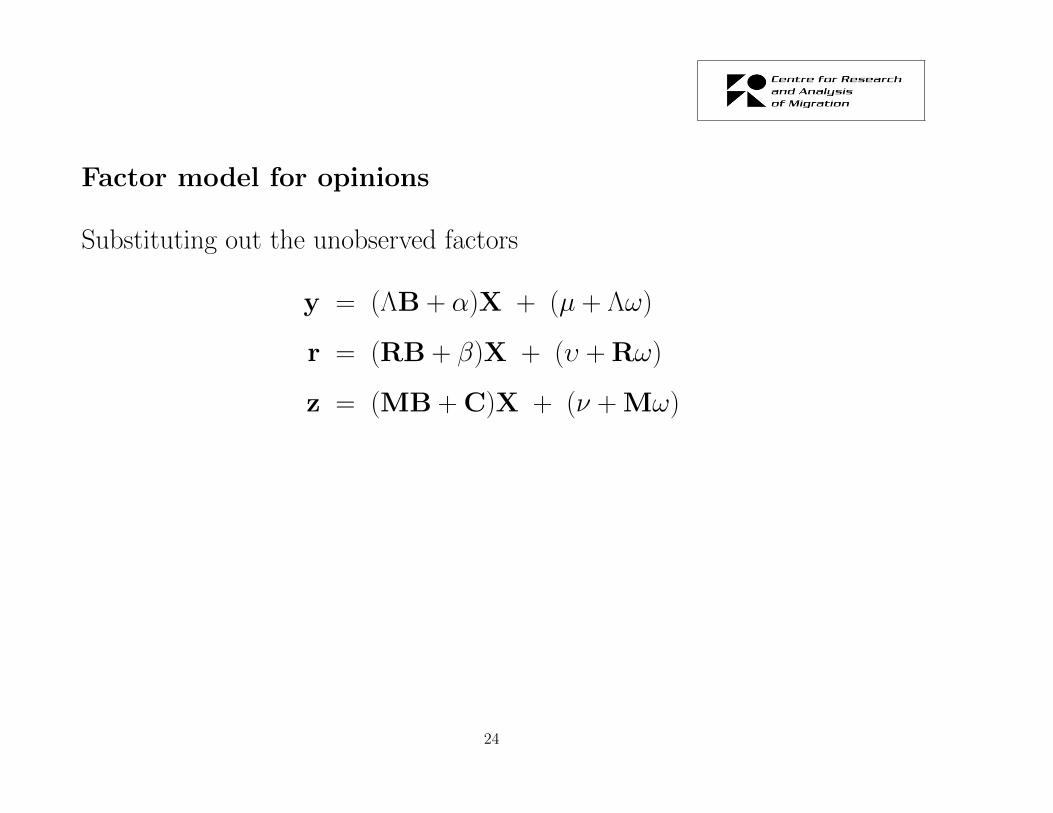
Factor model for opinions
Substituting out the unobserved factors
y = (ΛB + α)X + (µ + Λω)
r = (RB + β)X + (υ + Rω)
z = (MB + C)X + (ν + Mω)
24

Identification
Assume
• µ, υ, ν and ω mutually orthogonal
• variance-covariance matrix φ of ν diagonal
• residual variances normalised to 1
Then
• Residual variance covariance matrix of z has form MΣM + φ
• Residual covariance matrix of y, r and z have forms ΛΣM and RΣM
where Σ is variance-covariance matrix of factors.
25

Identification
M, Λ, R and Σ identified given appropriate restrictions on M
M, Σ fitted to residual correlation matrix of indicators z
Λ, R follow from residual correlation of y and r with z given M and Σ
In practice we assume exclusivity of indicator questions to known channels
(but explore robustness to weaker assumptions)
26

Factor loadings: Economy
Indicator Loading St err
Wages 0.487 (0.006)
Poor 0.555 (0.006)
Skills 0.252 (0.007)
Jobs 0.614 (0.005)
Contribution 0.615 (0.005)
Source: ESS 2002
27

Factor loadings: Social
Indicator Loading St err
Crime 0.544 (0.006)
Culture 0.676 (0.005)
Tension 0.607 (0.005)
Tradition 0.492 (0.006)
Religion 0.395 (0.006)
Language 0.218 (0.007)
Source: ESS 2002
28

Factor loadings: International
Indicator Loading St err
Home countries 0.110 (0.009)
Free movement 0.358 (0.009)
Responsibility 0.786 (0.016)
Source: ESS 2002
29

Factor correlations
Factors Correlation St err
Economy-Social 0.837 (0.006)
Economy-International 0.394 (0.011)
Social-International 0.472 (0.011)
Source: ESS 2002
Orthogonality of factors very strongly rejected
30

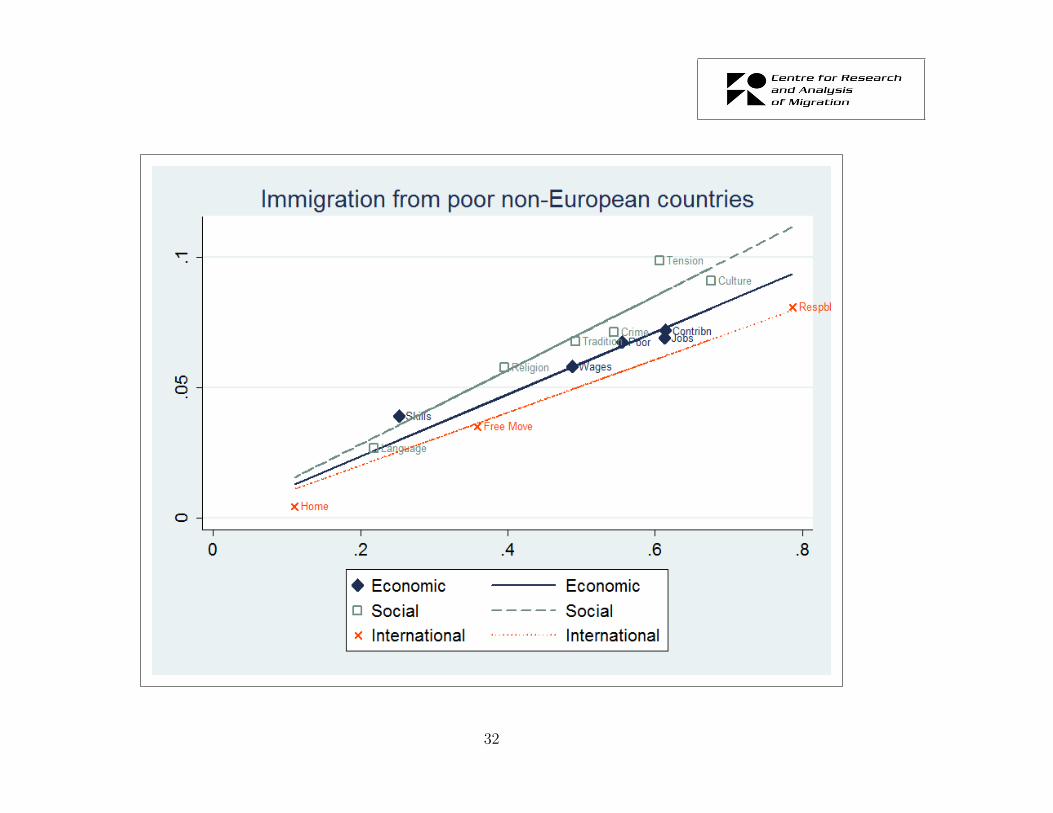
Factor structure
A visual test of the factor structure is whether the answers to policy questions
are indeed most strongly correlated with the indicators loading most heavily on
the factors
This does seem to be the case
31
32

33

34

Overall Immigration Effect
Economy Social International
Coeff St err Coeff St err Coeff St err
Good or Bad for the Economy 0.119 (0.004) 0.038 (0.004) 0.003 (0.002)
Better Place to Live 0.015 (0.004) 0.134 (0.004) 0.004 (0.002)
Source: ESS 2002
35

Overall Immigration Effect
Opinion on what is good for the economy driven by questions on wages, jobs,
fiscal effects
But social effects are much more important to what makes the country a good
place to live
Neither influenced by opinions on international effects
36

Immigration Questions
Nature of Immigration Economy Social International
Coeff St err Coeff St err Coeff St err
Rich European 0.016 (0.006) 0.079 (0.006) 0.018 (0.002)
Poor European 0.009 (0.005) 0.108 (0.005) 0.040 (0.002)
Rich Non-European 0.008 (0.005) 0.094 (0.006) 0.025 (0.002)
Poor Non-European 0.000 (0.005) 0.121 (0.005) 0.044 (0.002)
Same Ethnicity 0.023 (0.005) 0.077 (0.005) 0.035 (0.002)
Different Ethnicity -0.009 (0.005) 0.138 (0.005) 0.033 (0.002)
Source: ESS 2002
37

Immigration Policy
Social effects matter more to openness to immigration, whatever the source,
often by much more
Economic effects only significant for immigrants of similar types to native
population
Importance of social effects greater the greater the social distance of immi-
grants
International responsibility also importantly associated and more so for poorer
and non-European immigrants
38

Refugee Policy
Refugee Policy Economy Social International
Coeff St err Coeff St err Coeff St err
Work 0.029 (0.005) 0.027 (0.006) 0.053 (0.003)
Detention -0.016 (0.006) 0.123 (0.006) -0.005 (0.003)
Funds 0.001 (0.005) 0.075 (0.006) 0.050 (0.003)
Generosity -0.005 (0.005) 0.083 (0.005) 0.068 (0.003)
Family -0.006 (0.006) 0.099 (0.006) 0.050 (0.003)
Source: ESS 2002
39

Refugee Policy
Economic effects matter to opinions on whether asylum applicants should be
allowed to work but to nothing else
Preparedness to entertain detention of asylum applicants solely related to
opinion on social effects
Other questions depend on social effects and responses to international impli-
cations
40

41

42

Decomposition of attitudinal differences
If we are prepared to assume that influence of observed characteristics on the
indicators is channelled wholly through the factors then we can break down
differences in immigration opinion associated with observed characteristics
If C = 0 then z = MBX + (ν + Mω)
B can be estimated given that M has been identified
Plausibility of arguments regarding the source of such associations can be
assessed
43

Decomposition of attitudinal differences: Education
Immigration RefugeesPoor European Economy Generous Allow work
Decomposition of Education Gap (tertiary vs. lower secondary)Total estimated gap -0.039 -0.043 0.006 -0.013Gap attributed to economic factor -0.002 -0.030 0.001 -0.007Gap attributed to social factor -0.026 -0.009 -0.020 -0.006Gap attributed to international factor 0.001 v0.000 -0.002 0.001
Source: ESS 2002
44

Decomposition of attitudinal differences: Age
Immigration RefugeesPoor European Economy Generous Allow work
Decomposition of Age Gap (Age > 60 vs. Age < 30)Total estimated gap -0.084 -0.020 -0.019 0.000Gap attributed to economic factor -0.002 -0.026 0.001 -0.006Gap attributed to social factor -0.052 -0.018 -0.040 -0.013Gap attributed to international factor -0.005 0.000 0.009 0.006
Source: ESS 2002
45

Decomposition of attitudinal differences
Less educated arguably more affected by labour market consequences of im-
migration
Greater illiberality of less educated sometimes argued to be evidence for eco-
nomic determination of attitudes
But lower education also associated with greater social conservatism and this
is what accounts for most of the difference in attitude to policy
The old are also more opposed and they are least economically threatened
but also tend to share social conservatism
46
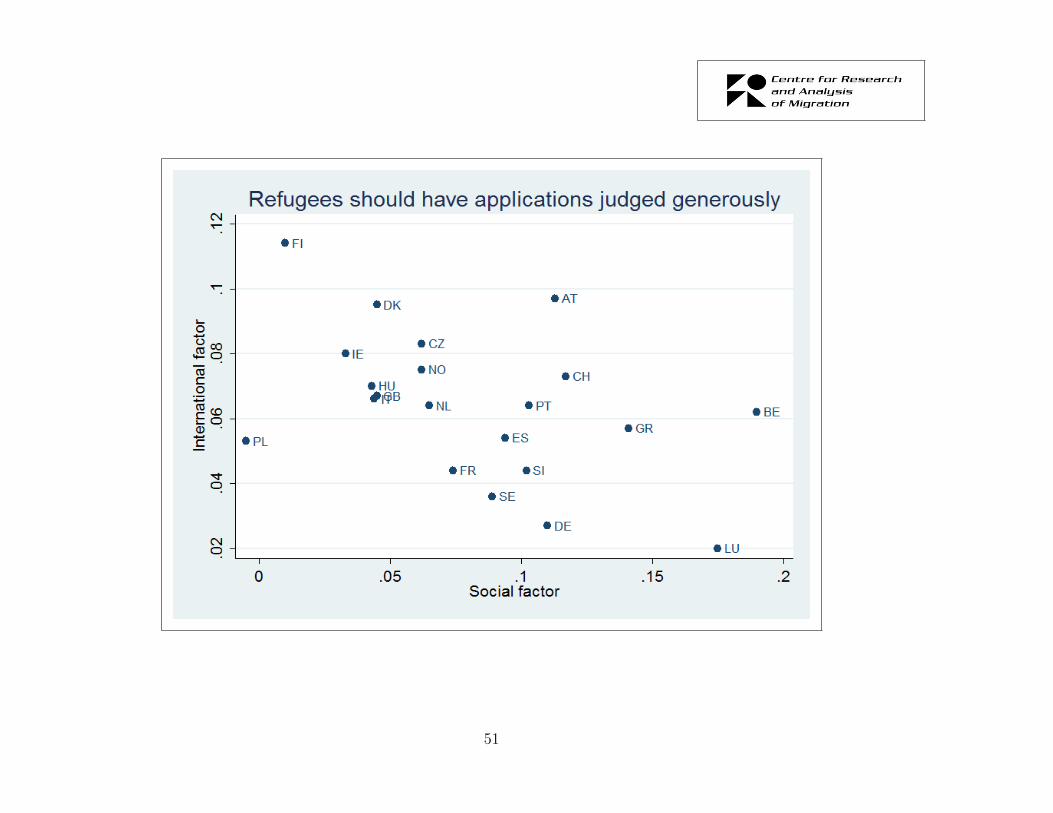
Cross-Country Differences
Estimates can be run separately on 21 different countries to investigate con-
sistency
Social factor is reliably more important than economics for both general im-
migration policy and policy towards refugees
47

48

49

50
51

52

53

Real Fear of Persecution
Respondents asked whether they believe refugees’ fear of persecution is gen-
uine
Captures common argument that this is disguised economic migration
Model can be run separately on samples who do and do do not agree that
fear is genuine
54

Real Fear of Persecution
Refugee Policy Economy Social International
Coeff St err Coeff St err Coeff St err
Most not in real fear of persecution (n=10821)
Work 0.028 (0.009) 0.021 (0.010) 0.065 (0.005)
Generosity 0.000 (0.008) 0.056 (0.008) 0.074 (0.005)
Family 0.005 (0.009) 0.076 (0.009) 0.058 (0.004)
Most are in real fear of persecution (n=6236)
Work 0.031 (0.010) 0.031 (0.010) 0.045 (0.005)
Generosity 0.000 (0.010) 0.082 (0.011) 0.058 (0.005)
Family -0.018 (0.011) 0.105 (0.011) 0.046 (0.005)
Source: ESS 2002
55

European Social Survey 2014
Small number of questions taken into main questionnaire
Seventh round repeats immigration module
However
several questions dropped
form of other questions altered
Not all data yet released
Nonetheless provides opportunity to investigate persistence of correlations
56

European Social Survey 2014 Changes
Only a minority of indicator questions remain
economic factor: questions on jobs and contribution kept,
others dropped
social factor: questions on crime, culture and traditions
kept, others dropped
international factor: all questions dropped
Wording of some immigration policy questions changed
Both questions on overall effect (economy, quality of life) remain
Only the question on generosity to refugees kept
57

Openness to immigration and generosity to refugees
58

Persistence in attitude to immigration
59

Persistence in generosity to refugees
60

Applying the factor model to 2014
Not possible to analyse a model with an internationalism factor
However the estimated loadings from 2002 can be applied to
predict the other two factors in 2014
investigate association with remaining policy questions
check for persistence of estimated effects
61

Applying the factor model to 2014
2002 2014
Economic Social Economic Social
Generosity 0.012 0.093 -0.003 0.134
Poor European -0.003 0.131 -0.012 0.167
Poor Non-European -0.015 0.147 -0.033 0.195
Economy 0.139 0.030 0.060 0.110
Place to Live -0.004 0.163 0.030 0.199
Source: ESS 2002, 2014
62

Applying the factor model to 2014
Similar picture emerges from 2014 data if we assume factor loadings persistent
Social effects more important than economic effects for determination of atti-
tudes to immigration
63
Conclusions
Attitudes to refugee policy associated, like immigration policy, mainly with
opinion on social effects and international implications
Economic effects unimportant except for question of whether asylum appli-
cants be permitted to work
Tentative evidence that similar pattern of determination in 2014 as in 2002
64