economic and housing outlookmedia01.commpartners.com/nahb/042215_spring_forecast/... ·...
TRANSCRIPT

ECONOMIC AND HOUSING OUTLOOK
David Crowe
Chief Economist
Spring Construction Forecast Webinar
April 22, 2015
Macro Indicators
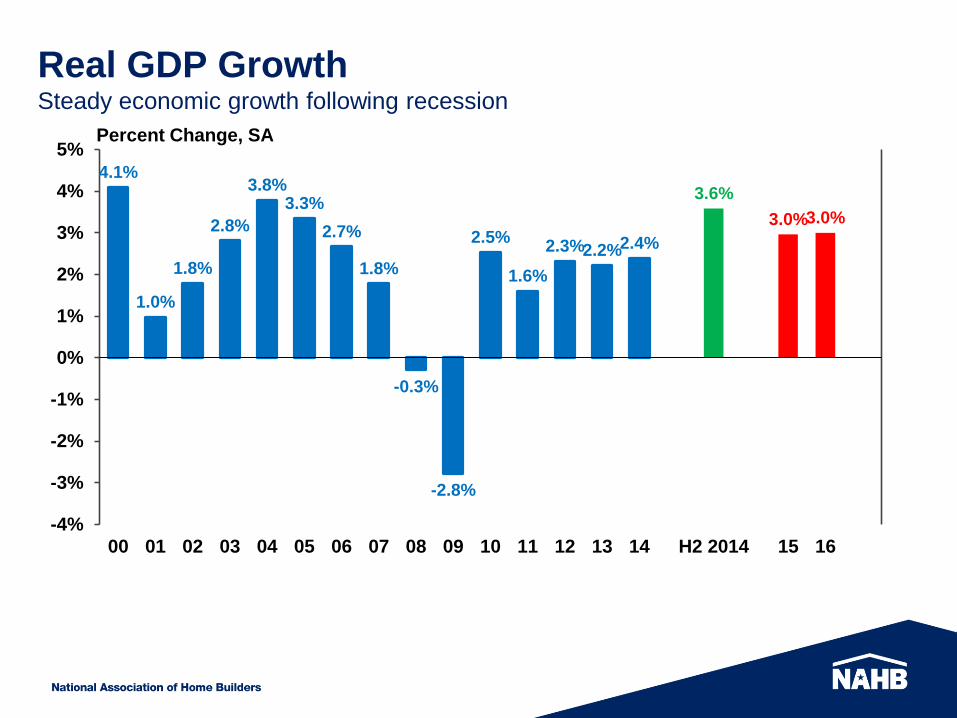
4.1%
1.0%
1.8%
2.8%
3.8% 3.3%
2.7%
1.8%
-0.3%
-2.8%
2.5%
1.6%
2.3% 2.2% 2.4%
3.6%
3.0% 3.0%
-4%
-3%
-2%
-1%
0%
1%
2%
3%
4%
5%
00 01 02 03 04 05 06 07 08 09 10 11 12 13 14 H2 2014 15 16
Percent Change, SA
Real GDP Growth Steady economic growth following recession
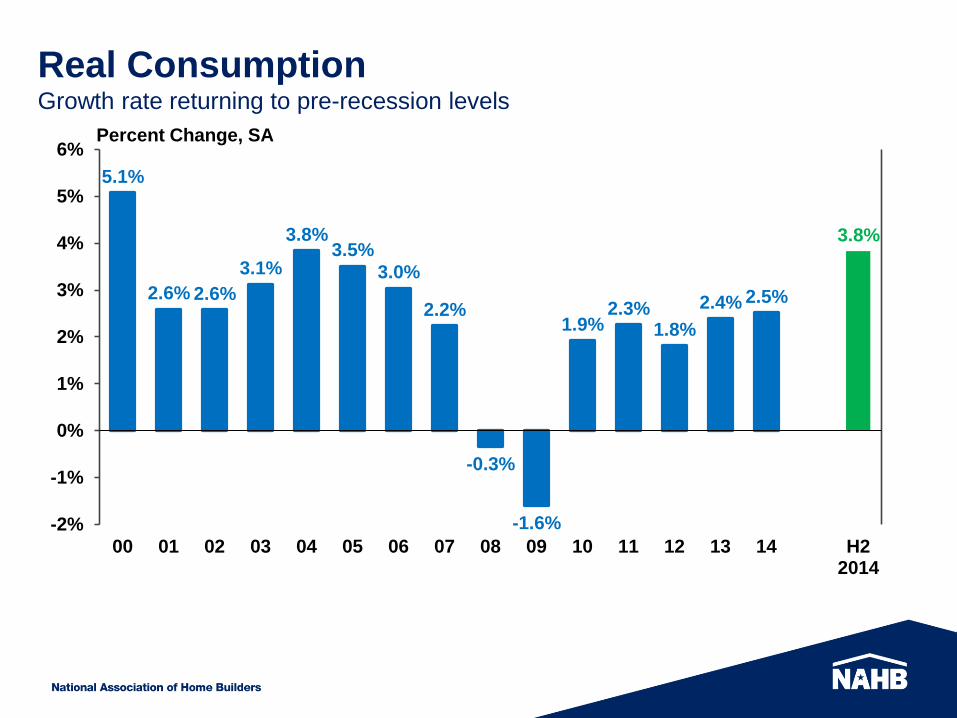
5.1%
2.6% 2.6%
3.1%
3.8% 3.5%
3.0%
2.2%
-0.3%
-1.6%
1.9% 2.3%
1.8%
2.4% 2.5%
3.8%
-2%
-1%
0%
1%
2%
3%
4%
5%
6%
00 01 02 03 04 05 06 07 08 09 10 11 12 13 14 H22014
Percent Change, SA
Real Consumption Growth rate returning to pre-recession levels
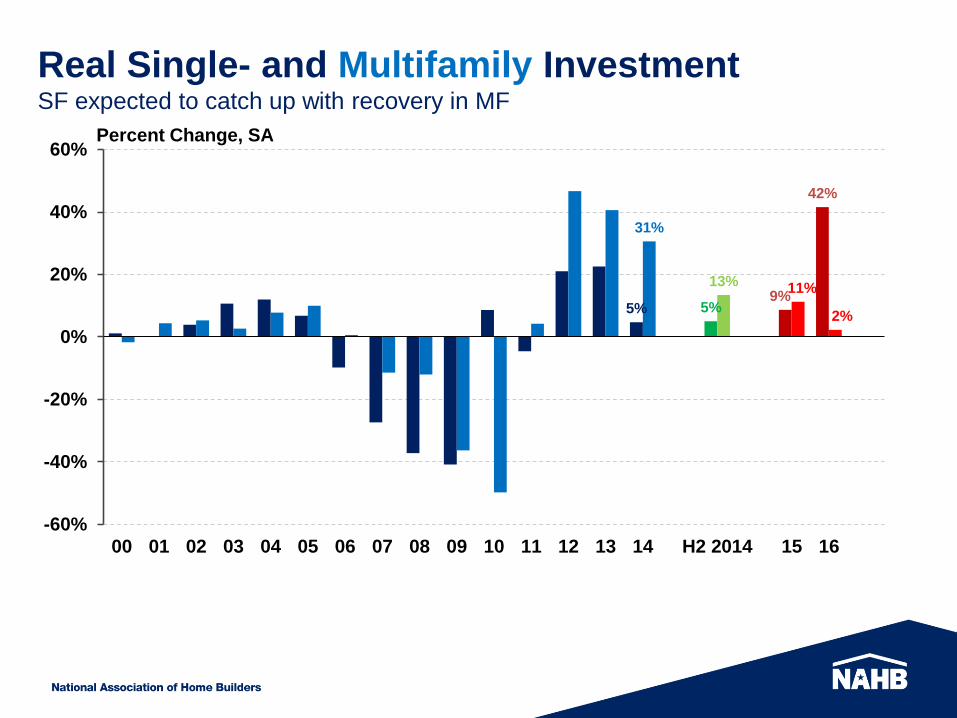
5% 5% 9%
42%
31%
13% 11%
2%
-60%
-40%
-20%
0%
20%
40%
60%
00 01 02 03 04 05 06 07 08 09 10 11 12 13 14 H2 2014 15 16
Percent Change, SA
Real Single- and Multifamily Investment SF expected to catch up with recovery in MF
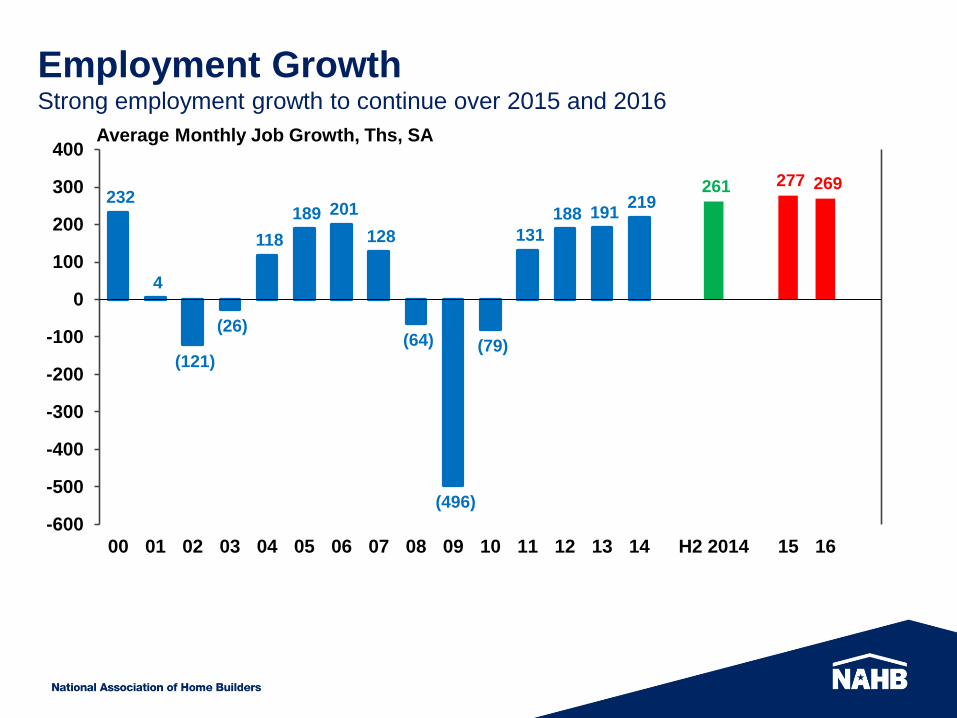
232
4
(121)
(26)
118
189 201
128
(64)
(496)
(79)
131
188 191 219
261 277 269
-600
-500
-400
-300
-200
-100
0
100
200
300
400
00 01 02 03 04 05 06 07 08 09 10 11 12 13 14 H2 2014 15 16
Average Monthly Job Growth, Ths, SA
Employment Growth Strong employment growth to continue over 2015 and 2016
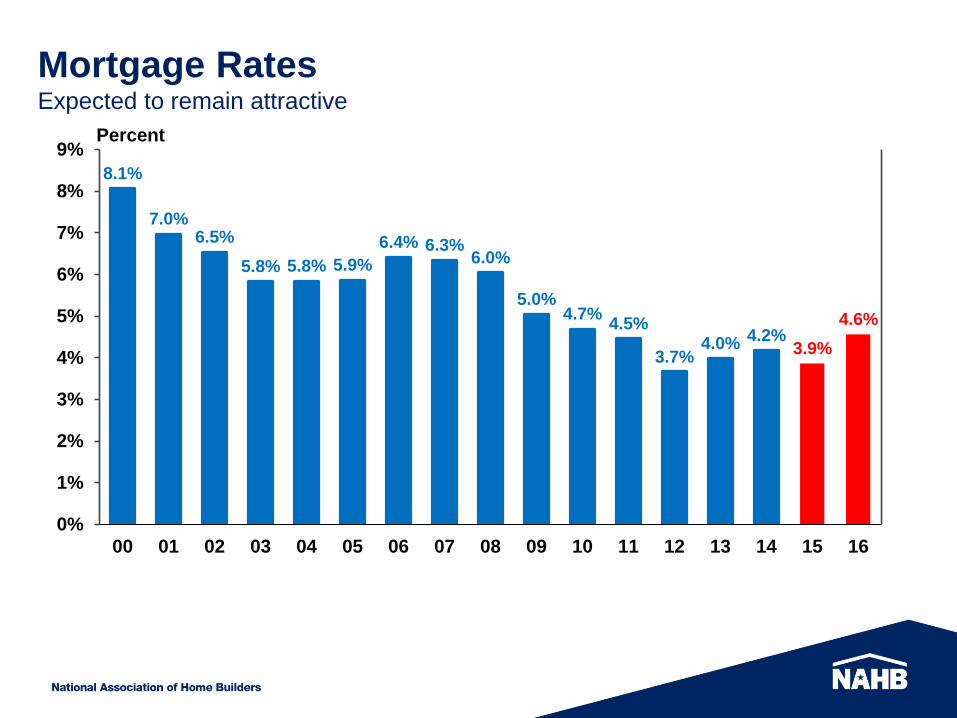
8.1%
7.0% 6.5%
5.8% 5.8% 5.9%
6.4% 6.3% 6.0%
5.0% 4.7%
4.5%
3.7% 4.0% 4.2%
3.9%
4.6%
0%
1%
2%
3%
4%
5%
6%
7%
8%
9%
00 01 02 03 04 05 06 07 08 09 10 11 12 13 14 15 16
Percent
Mortgage Rates Expected to remain attractive
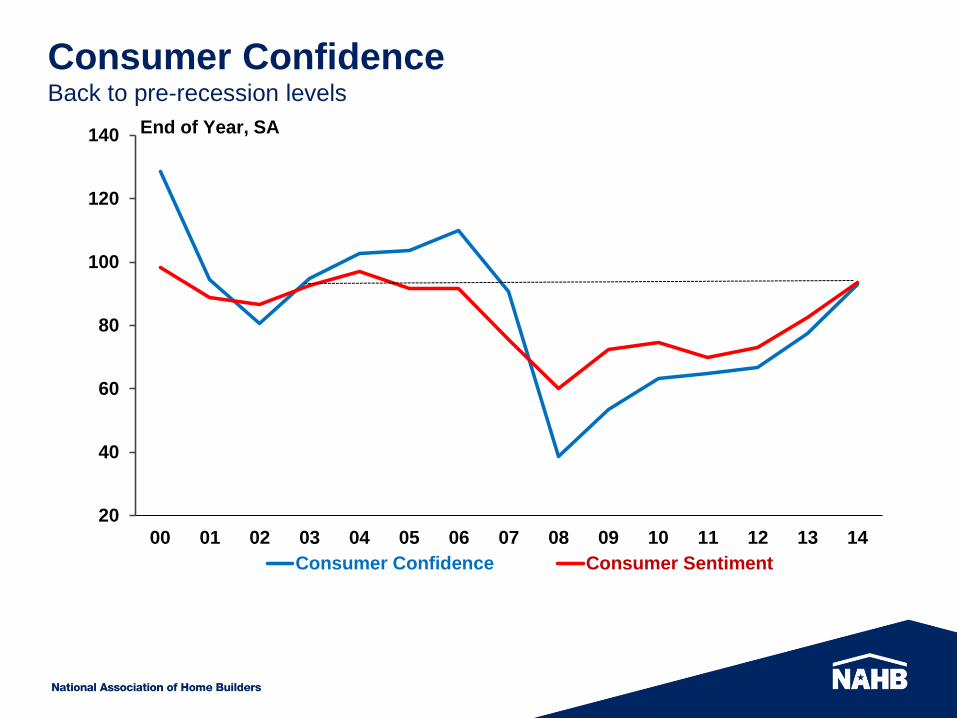
20
40
60
80
100
120
140
00 01 02 03 04 05 06 07 08 09 10 11 12 13 14
Consumer Confidence Consumer Sentiment
End of Year, SA
Consumer Confidence Back to pre-recession levels
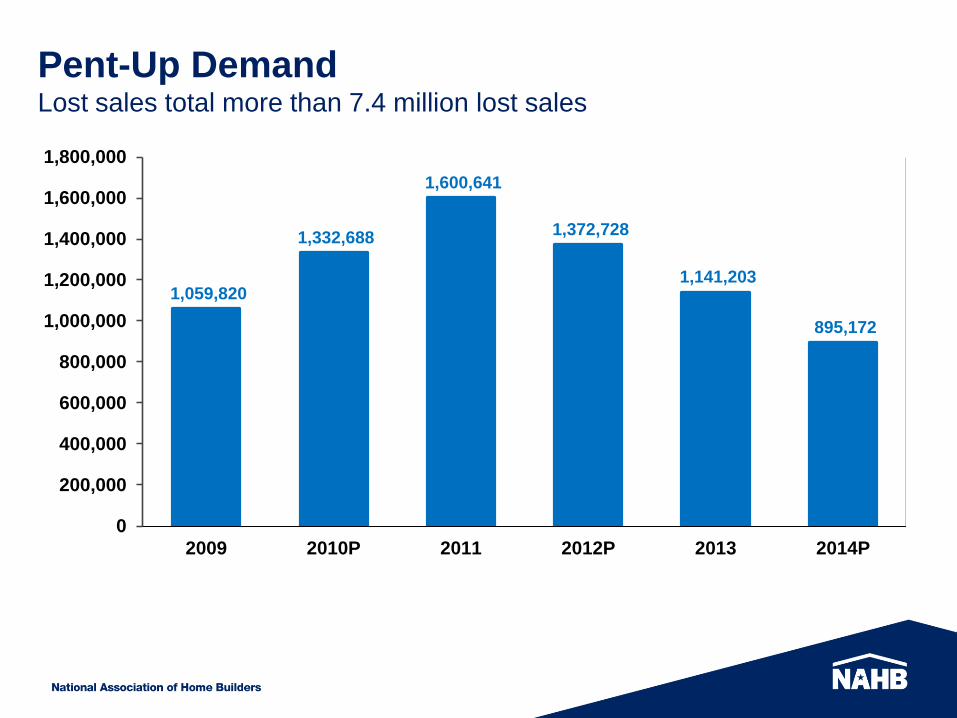
1,059,820
1,332,688
1,600,641
1,372,728
1,141,203
895,172
0
200,000
400,000
600,000
800,000
1,000,000
1,200,000
1,400,000
1,600,000
1,800,000
2009 2010P 2011 2012P 2013 2014P
Pent-Up Demand Lost sales total more than 7.4 million lost sales
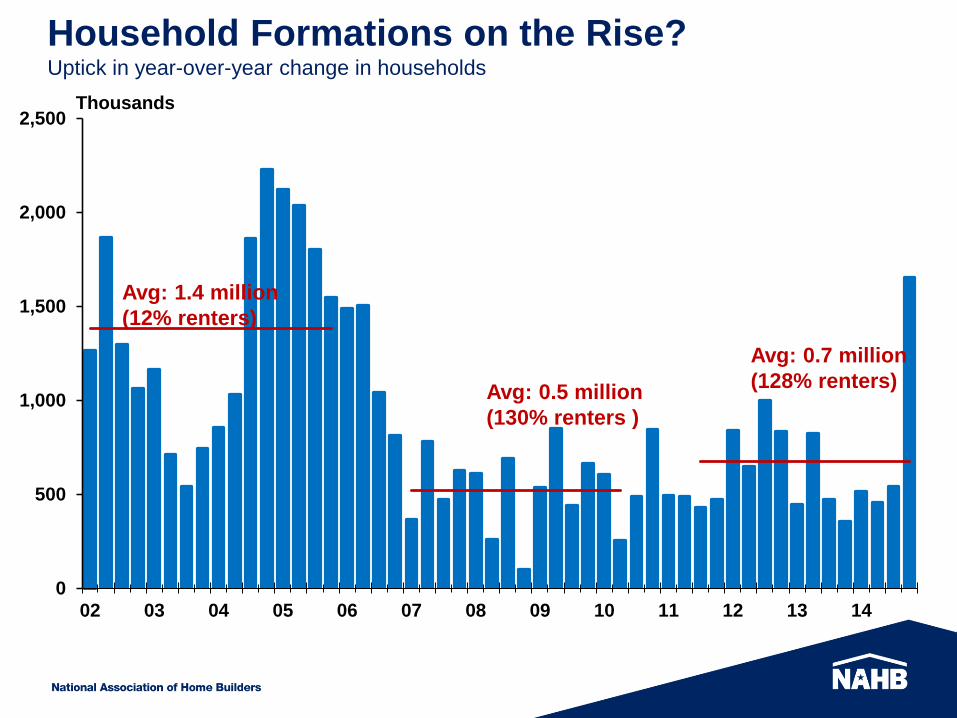
Household Formations on the Rise? Uptick in year-over-year change in households
0
500
1,000
1,500
2,000
2,500
02 03 04 05 06 07 08 09 10 11 12 13 14
Thousands
Avg: 1.4 million
(12% renters)
Avg: 0.5 million
(130% renters )
Avg: 0.7 million
(128% renters)

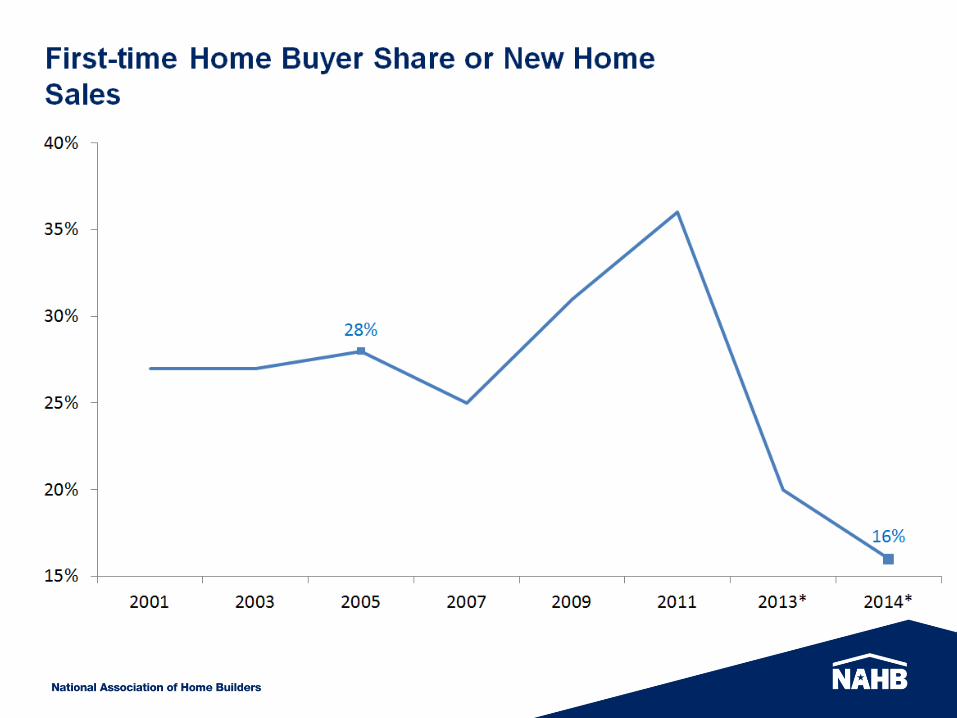
First-time Home Buyers

First-time Home Buyer Share of Existing
Home Sales
2/15: [VALUE]
42%
0%
10%
20%
30%
40%
50%
60%
Oct
-08
Jan
-09
Ap
r-0
9
Jul-
09
Oct
-09
Jan
-10
Ap
r-1
0
Jul-
10
Oct
-10
Jan
-11
Ap
r-1
1
Jul-
11
Oct
-11
Jan
-12
Ap
r-1
2
Jul-
12
Oct
-12
Jan
-13
Ap
r-1
3
Jul-
13
Oct
-13
Jan
-14
Ap
r-1
4
Jul-
14
Oct
-14
Jan
-15
13
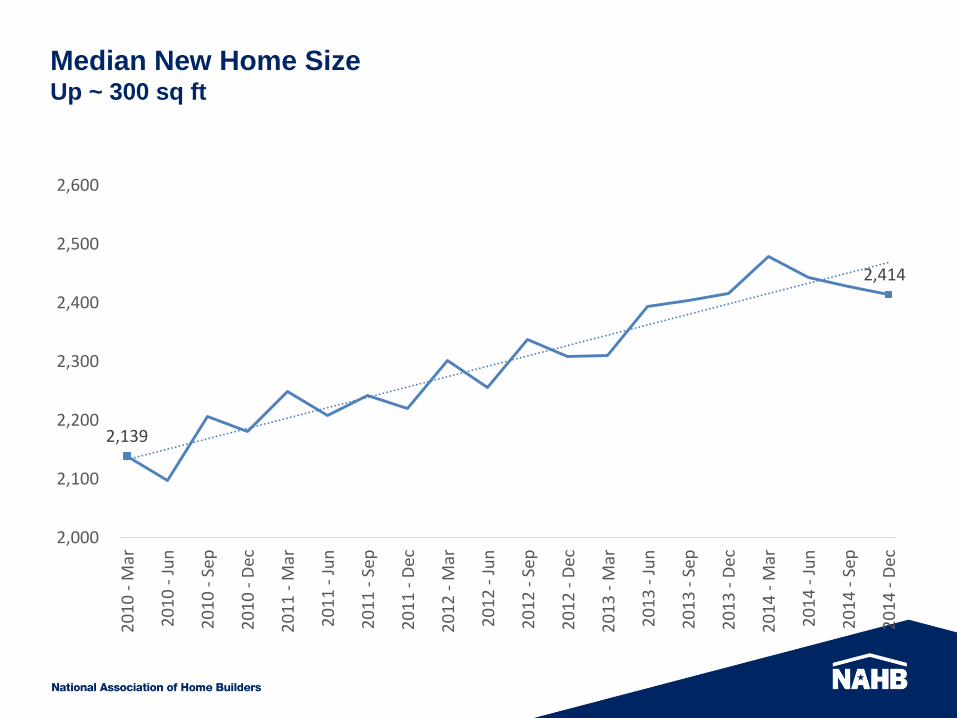
Median New Home Size Up ~ 300 sq ft
2,139
2,414
2,000
2,100
2,200
2,300
2,400
2,500
2,600
20
10
- M
ar
20
10
- J
un
20
10
- S
ep
20
10
- D
ec
20
11
- M
ar
20
11
- J
un
20
11
- S
ep
20
11
- D
ec
20
12
- M
ar
20
12
- J
un
20
12
- S
ep
20
12
- D
ec
20
13
- M
ar
20
13
- J
un
20
13
- S
ep
20
13
- D
ec
20
14
- M
ar
20
14
- J
un
20
14
- S
ep
20
14
- D
ec
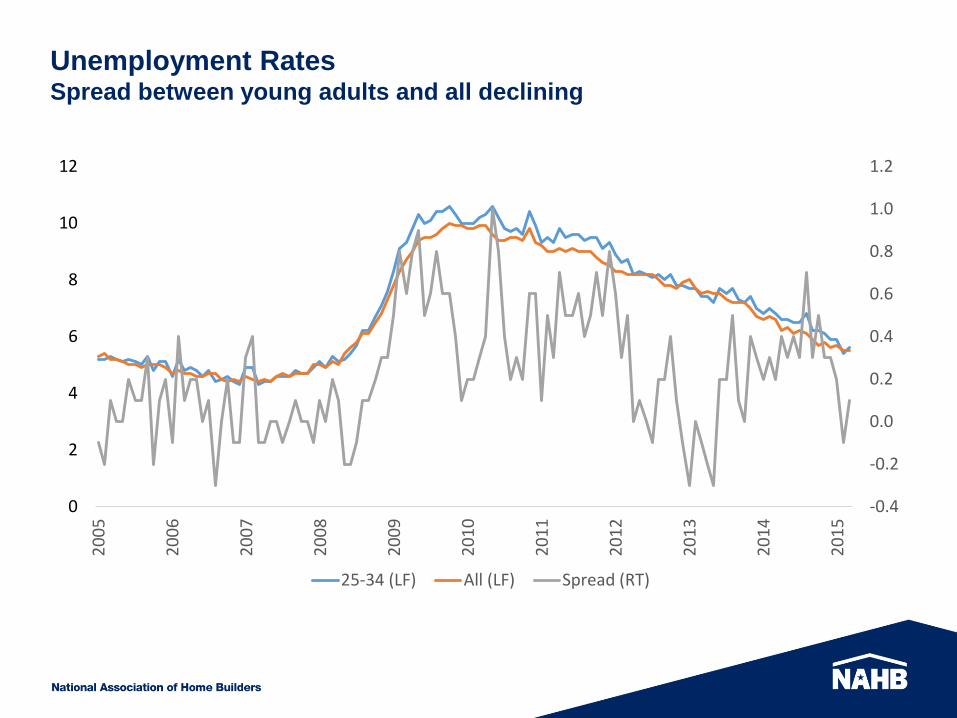
Unemployment Rates Spread between young adults and all declining
-0.4
-0.2
0.0
0.2
0.4
0.6
0.8
1.0
1.2
0
2
4
6
8
10
12
20
05
20
06
20
07
20
08
20
09
20
10
20
11
20
12
20
13
20
14
20
15
25-34 (LF) All (LF) Spread (RT)
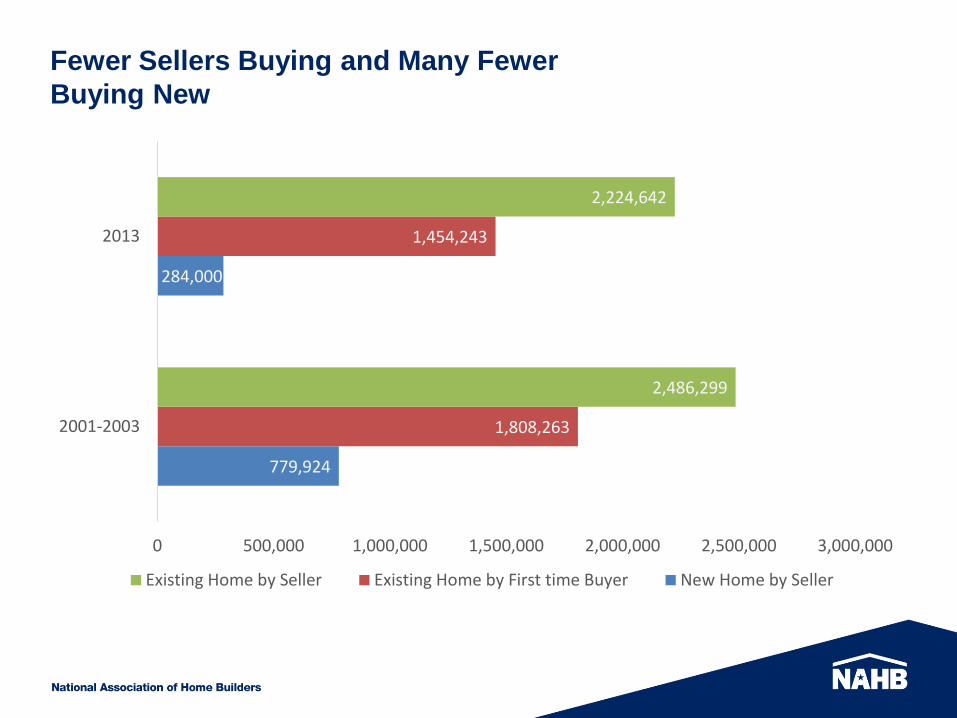
Fewer Sellers Buying and Many Fewer
Buying New
779,924
284,000
1,808,263
1,454,243
2,486,299
2,224,642
0 500,000 1,000,000 1,500,000 2,000,000 2,500,000 3,000,000
2001-2003
2013
Existing Home by Seller Existing Home by First time Buyer New Home by Seller
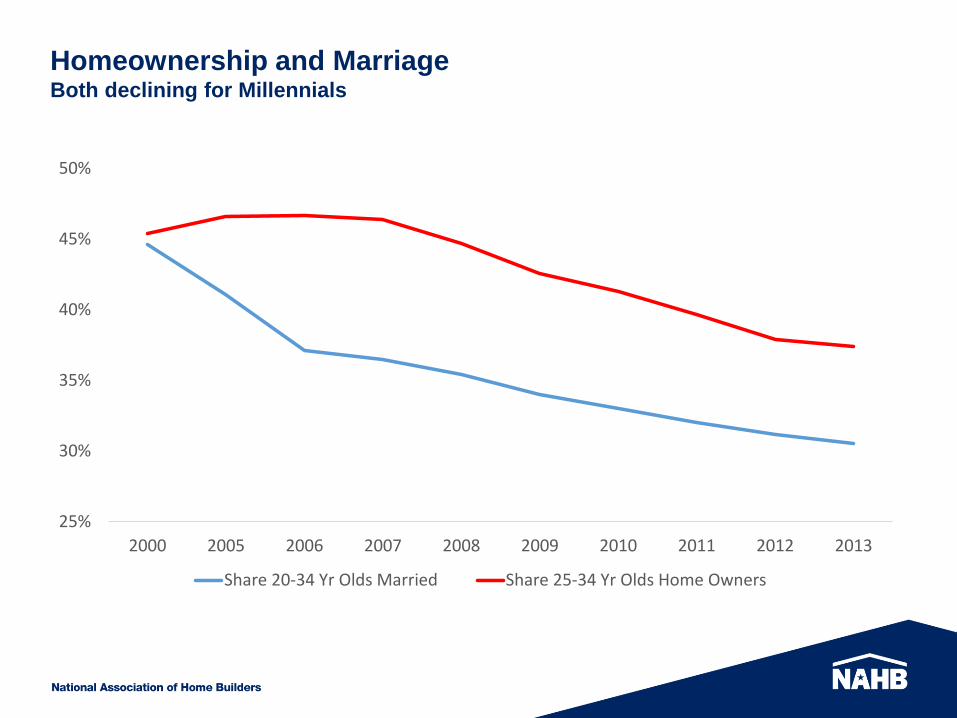
Homeownership and Marriage Both declining for Millennials
25%
30%
35%
40%
45%
50%
2000 2005 2006 2007 2008 2009 2010 2011 2012 2013
Share 20-34 Yr Olds Married Share 25-34 Yr Olds Home Owners
Forecasts
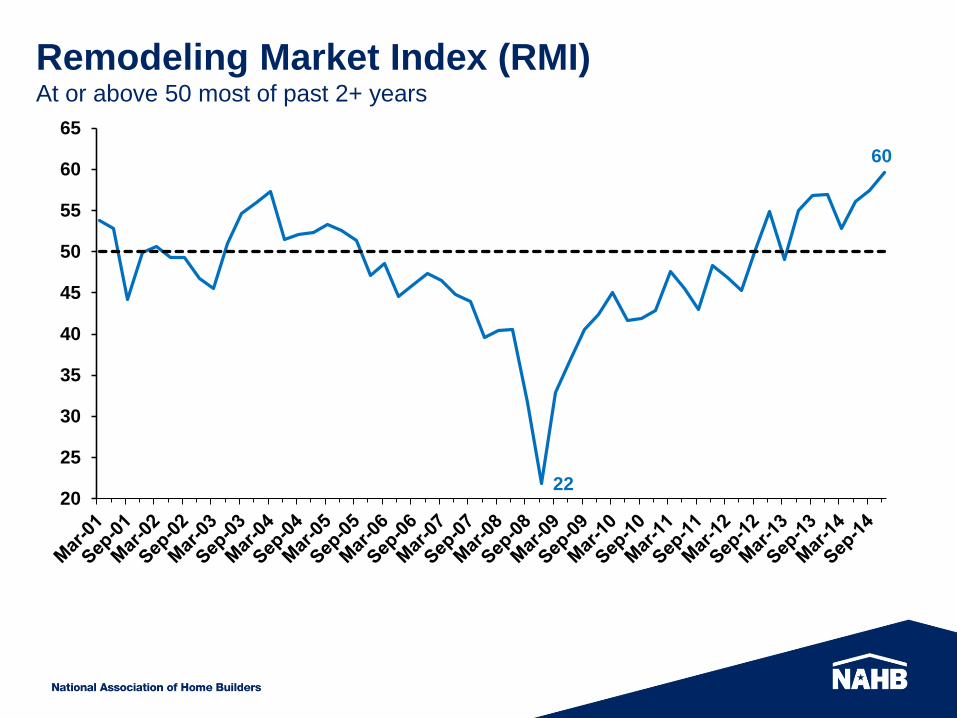
22
60
20
25
30
35
40
45
50
55
60
65
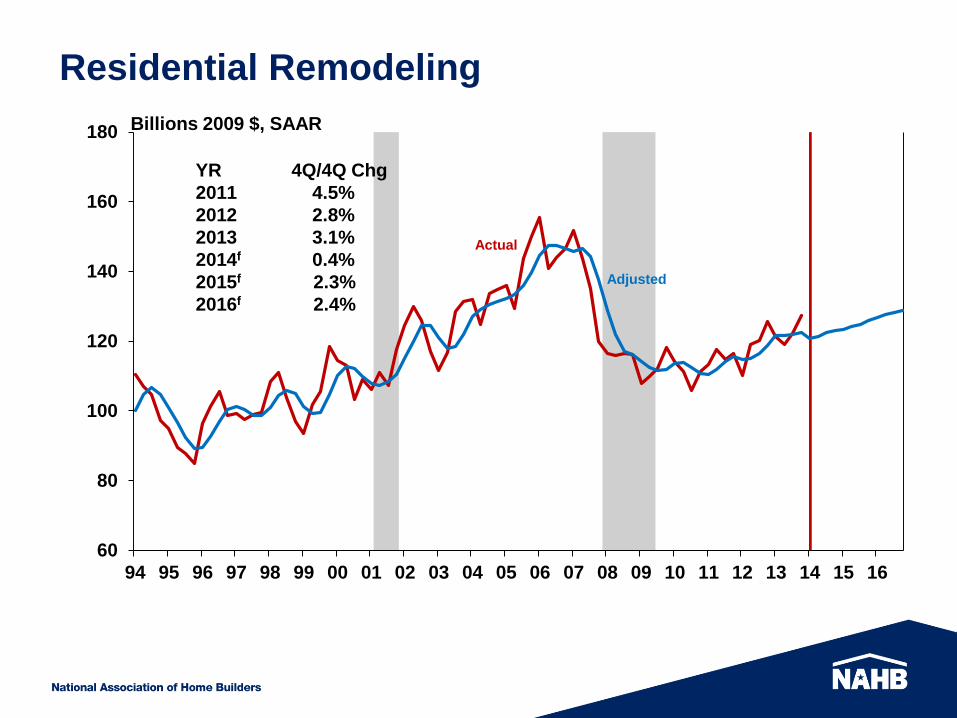
Remodeling Market Index (RMI) At or above 50 most of past 2+ years
60
80
100
120
140
160
180
94 95 96 97 98 99 00 01 02 03 04 05 06 07 08 09 10 11 12 13 14 15 16
YR 4Q/4Q Chg
2011 4.5%
2012 2.8%
2013 3.1%
2014f 0.4%
2015f 2.3%
2016f 2.4%
Residential Remodeling
Billions 2009 $, SAAR
Actual
Adjusted
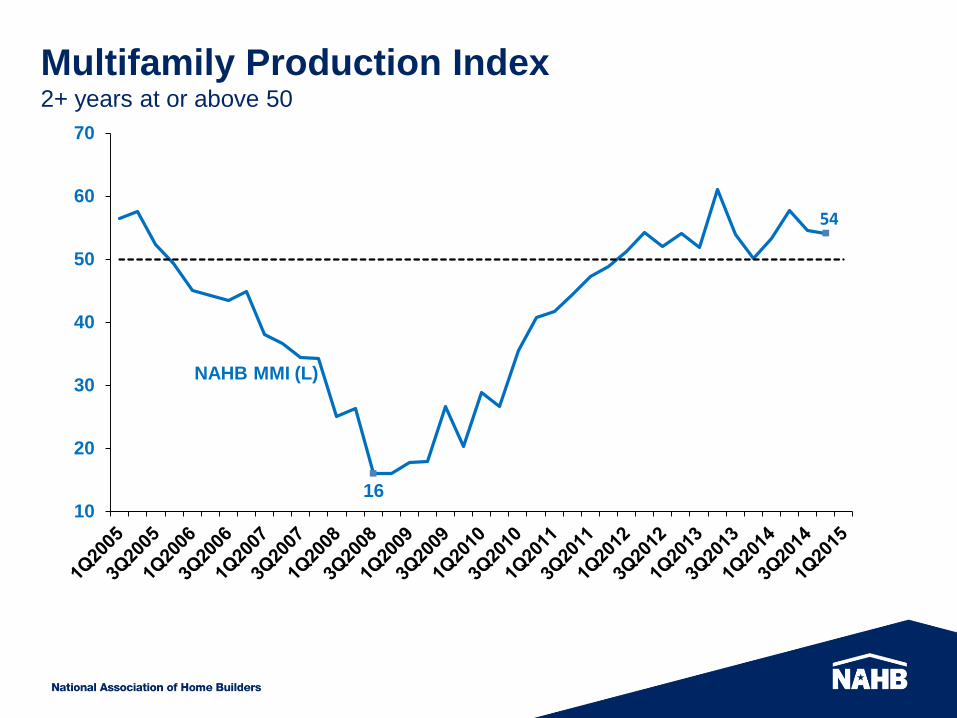
Multifamily Production Index 2+ years at or above 50
54
10
20
30
40
50
60
70
NAHB MMI (L)
16
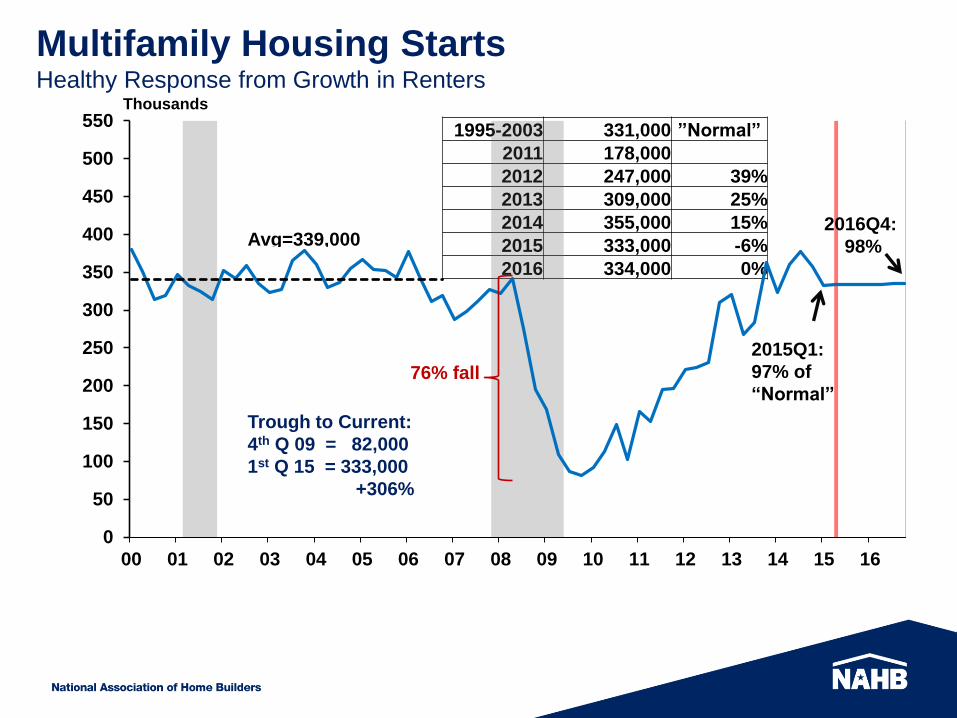
1995-2003 331,000 ”Normal”
2011 178,000
2012 247,000 39%
2013 309,000 25%
2014 355,000 15%
2015 333,000 -6%
2016 334,000 0%
Multifamily Housing Starts Healthy Response from Growth in Renters
Trough to Current:
4th Q 09 = 82,000
1st Q 15 = 333,000
+306%
2015Q1:
97% of
“Normal”
0
50
100
150
200
250
300
350
400
450
500
550
00 01 02 03 04 05 06 07 08 09 10 11 12 13 14 15 16
Thousands
76% fall
2016Q4:
98% Avg=339,000
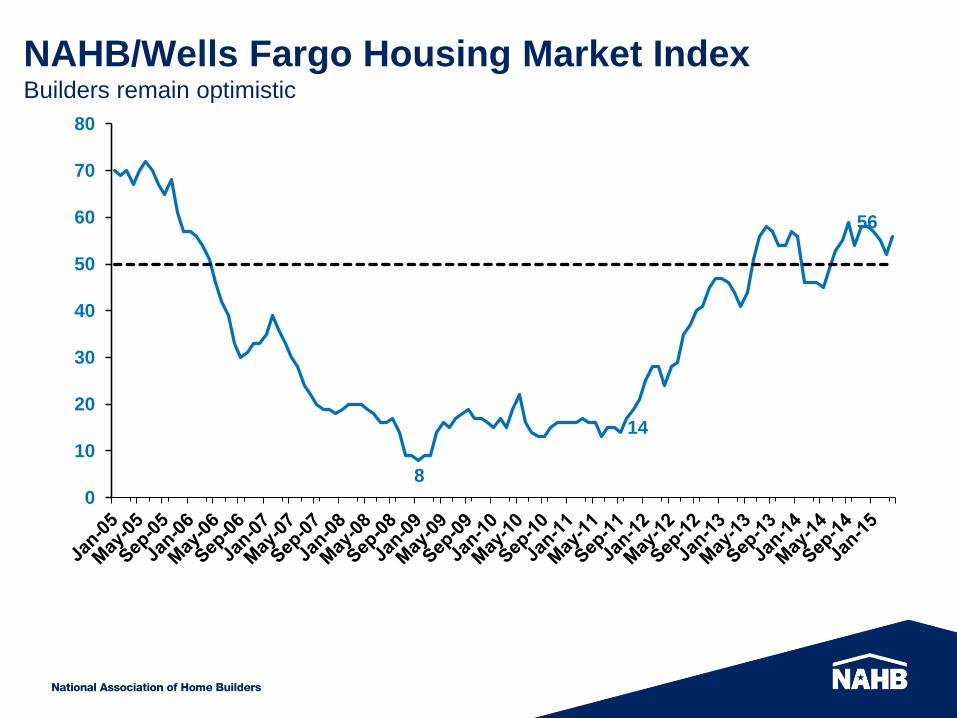
8
14
56
0
10
20
30
40
50
60
70
80
NAHB/Wells Fargo Housing Market Index Builders remain optimistic
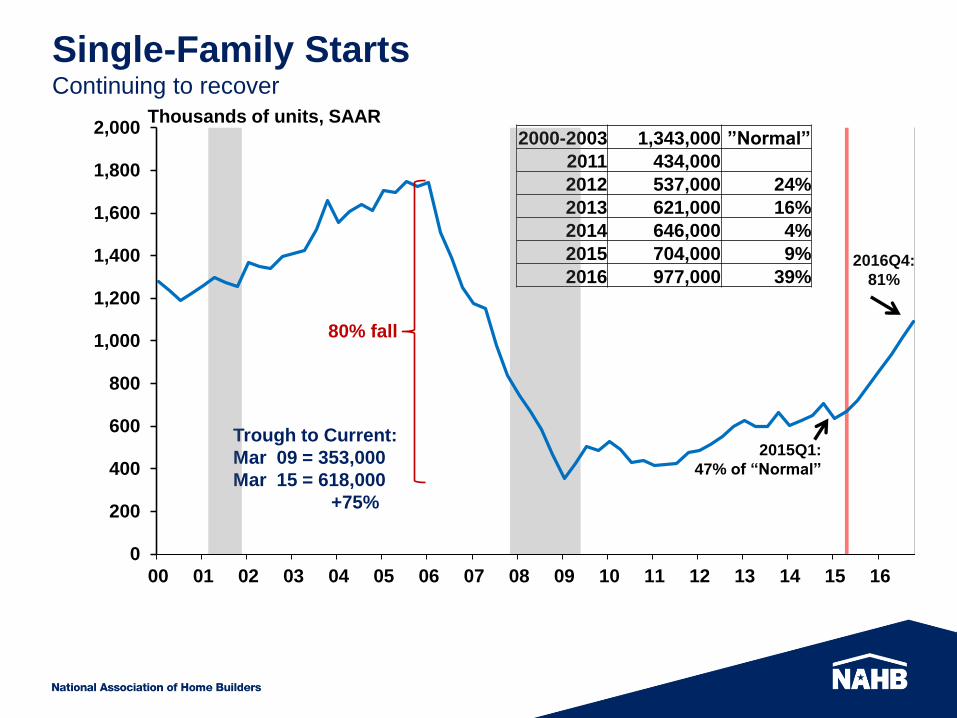
Single-Family Starts Continuing to recover
Trough to Current:
Mar 09 = 353,000
Mar 15 = 618,000
+75%
2015Q1:
47% of “Normal”
2016Q4:
81%
2000-2003 1,343,000 ”Normal”
2011 434,000
2012 537,000 24%
2013 621,000 16%
2014 646,000 4%
2015 704,000 9%
2016 977,000 39%
0
200
400
600
800
1,000
1,200
1,400
1,600
1,800
2,000
00 01 02 03 04 05 06 07 08 09 10 11 12 13 14 15 16
Thousands of units, SAAR
80% fall

New Home Market Update
Construction Forecast Conference
National Association of Home Builders
April, 2015
Outline
New home sale volumes weak, but pockets of strength exist
Eight of top 10 healthiest new sale markets in Carolinas and Texas
Waning supply of distressed sales will increase demand for lower-end new
homes
Relative to early 2000s, only 3 markets have higher new sales volumes
New home price growth fastest in coastal states and new price premium
approaching $100,000
Houston employment collapses in March. Is housing next?
| © 2014 CoreLogic, Inc. ■ Proprietary & Confidential 26

New Home Sales Market
| © 2014 CoreLogic, Inc. ■ Proprietary & Confidential 27
Very Slow Improvement
Note: CoreLogic data lagged by two months
Source: CoreLogic and Census
0
10,000
20,000
30,000
40,000
50,000
60,000
Ja
n-0
8
Apr-
08
Ju
l-0
8
Oct-
08
Ja
n-0
9
Apr-
09
Ju
l-0
9
Oct-
09
Ja
n-1
0
Apr-
10
Ju
l-1
0
Oct-
10
Ja
n-1
1
Apr-
11
Ju
l-1
1
Oct-
11
Ja
n-1
2
Apr-
12
Ju
l-1
2
Oct-
12
Ja
n-1
3
Apr-
13
Ju
l-1
3
Oct-
13
Ja
n-1
4
Apr-
14
Ju
l-1
4
Oct-
14
CoreLogic
Census
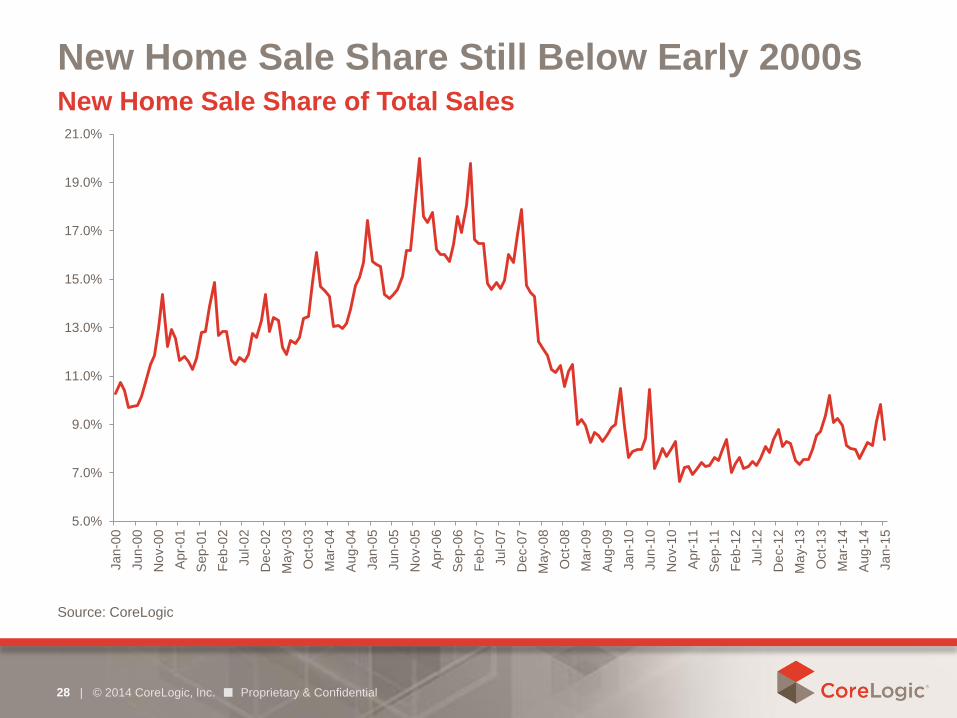
New Home Sale Share Still Below Early 2000s
| © 2014 CoreLogic, Inc. ■ Proprietary & Confidential 28
New Home Sale Share of Total Sales
Source: CoreLogic
5.0%
7.0%
9.0%
11.0%
13.0%
15.0%
17.0%
19.0%
21.0%
Jan-0
0
Jun-0
0
No
v-0
0
Apr-
01
Sep-0
1
Feb
-02
Jul-0
2
De
c-0
2
Ma
y-0
3
Oct-
03
Ma
r-0
4
Aug-0
4
Jan-0
5
Jun-0
5
No
v-0
5
Apr-
06
Sep-0
6
Feb
-07
Jul-0
7
De
c-0
7
Ma
y-0
8
Oct-
08
Ma
r-0
9
Aug-0
9
Jan-1
0
Jun-1
0
No
v-1
0
Apr-
11
Sep-1
1
Feb
-12
Jul-1
2
De
c-1
2
Ma
y-1
3
Oct-
13
Ma
r-1
4
Aug-1
4
Jan-1
5

Healthiest New Sale Markets in Texas and Carolina’s
| © 2014 CoreLogic, Inc. ■ Proprietary & Confidential 29
Avg Monthly Number of New Sales Last 12 Months
Source: CoreLogic
0% 5% 10% 15% 20% 25%
El Paso, TX
Raleigh, NC
Charleston-North Charleston, SC
Houston-The Woodlands-Sugar…
San Antonio-New Braunfels, TX
Columbia, SC
Austin-Round Rock, TX
Charlotte-Concord-Gastonia, NC-SC
Jacksonville, FL
Baton Rouge, LA
Colorado Springs, CO
Orlando-Kissimmee-Sanford, FL
Dallas-Plano-Irving, TX
Fresno, CA
Oklahoma City, OK
Washington-Arlington-Alexandria,…
Boise City, ID
Greenville-Anderson-Mauldin, SC
Las Vegas-Henderson-Paradise, NV
Nashville-Davidson--…
- 500 1,000 1,500 2,000 2,500
Houston-The Woodlands-Sugar…
Dallas-Plano-Irving, TX
Atlanta-Sandy Springs-Roswell, GA
Phoenix-Mesa-Scottsdale, AZ
Washington-Arlington-Alexandria,…
San Antonio-New Braunfels, TX
Austin-Round Rock, TX
Orlando-Kissimmee-Sanford, FL
Charlotte-Concord-Gastonia, NC-SC
New York-Jersey City-White…
Las Vegas-Henderson-Paradise, NV
Tampa-St Petersburg-Clearwater,…
Denver-Aurora-Lakewood, CO
Fort Worth-Arlington, TX
Nashville-Davidson--…
Jacksonville, FL
Seattle-Bellevue-Everett, WA
Riverside-San Bernardino-…
Raleigh, NC
Portland-Vancouver-Hillsboro,…
New Home Sale Share
The Top 100 Markets
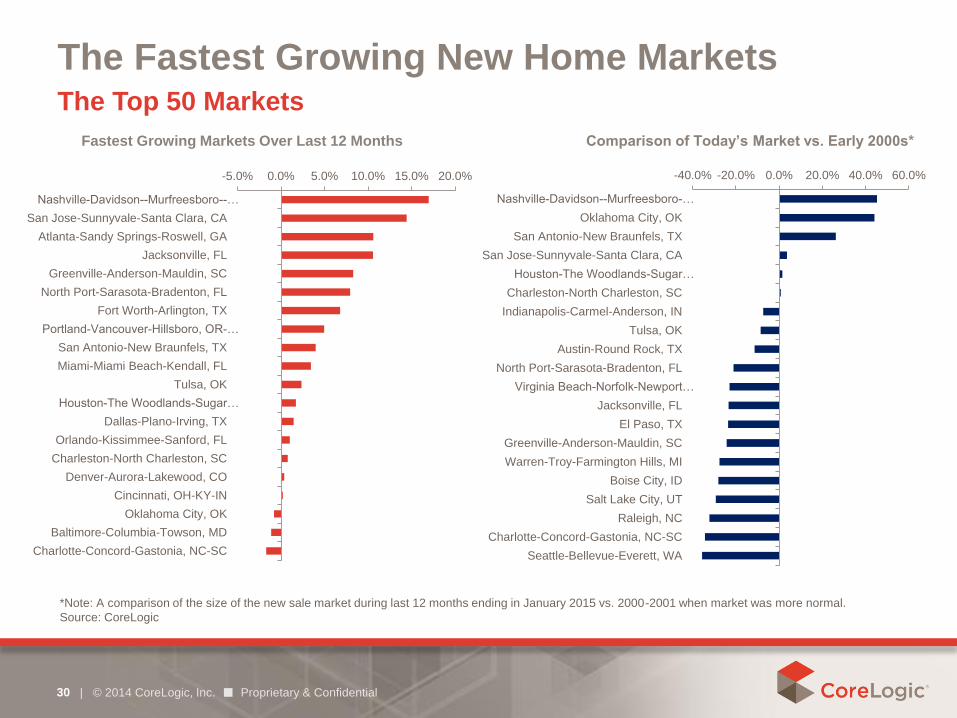
The Fastest Growing New Home Markets
| © 2014 CoreLogic, Inc. ■ Proprietary & Confidential 30
The Top 50 Markets
*Note: A comparison of the size of the new sale market during last 12 months ending in January 2015 vs. 2000-2001 when market was more normal.
Source: CoreLogic
-5.0% 0.0% 5.0% 10.0% 15.0% 20.0%
Nashville-Davidson--Murfreesboro--…
San Jose-Sunnyvale-Santa Clara, CA
Atlanta-Sandy Springs-Roswell, GA
Jacksonville, FL
Greenville-Anderson-Mauldin, SC
North Port-Sarasota-Bradenton, FL
Fort Worth-Arlington, TX
Portland-Vancouver-Hillsboro, OR-…
San Antonio-New Braunfels, TX
Miami-Miami Beach-Kendall, FL
Tulsa, OK
Houston-The Woodlands-Sugar…
Dallas-Plano-Irving, TX
Orlando-Kissimmee-Sanford, FL
Charleston-North Charleston, SC
Denver-Aurora-Lakewood, CO
Cincinnati, OH-KY-IN
Oklahoma City, OK
Baltimore-Columbia-Towson, MD
Charlotte-Concord-Gastonia, NC-SC
-40.0% -20.0% 0.0% 20.0% 40.0% 60.0%
Nashville-Davidson--Murfreesboro-…
Oklahoma City, OK
San Antonio-New Braunfels, TX
San Jose-Sunnyvale-Santa Clara, CA
Houston-The Woodlands-Sugar…
Charleston-North Charleston, SC
Indianapolis-Carmel-Anderson, IN
Tulsa, OK
Austin-Round Rock, TX
North Port-Sarasota-Bradenton, FL
Virginia Beach-Norfolk-Newport…
Jacksonville, FL
El Paso, TX
Greenville-Anderson-Mauldin, SC
Warren-Troy-Farmington Hills, MI
Boise City, ID
Salt Lake City, UT
Raleigh, NC
Charlotte-Concord-Gastonia, NC-SC
Seattle-Bellevue-Everett, WA
Fastest Growing Markets Over Last 12 Months Comparison of Today’s Market vs. Early 2000s*
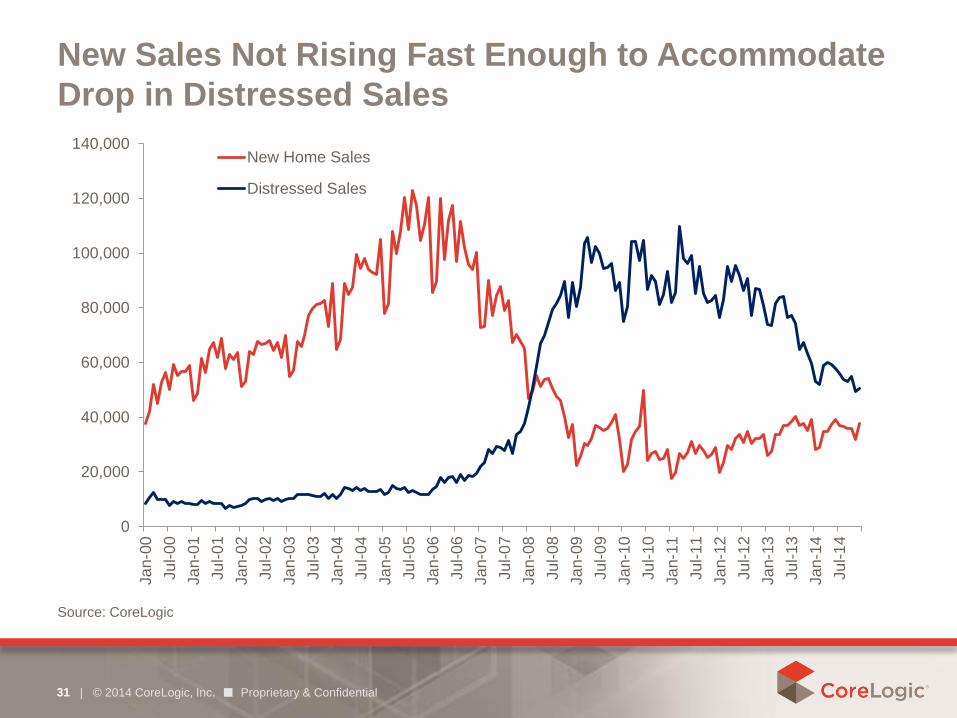
New Sales Not Rising Fast Enough to Accommodate
Drop in Distressed Sales
| © 2014 CoreLogic, Inc. ■ Proprietary & Confidential 31
Source: CoreLogic
0
20,000
40,000
60,000
80,000
100,000
120,000
140,000Ja
n-0
0
Ju
l-0
0
Ja
n-0
1
Ju
l-0
1
Ja
n-0
2
Ju
l-0
2
Ja
n-0
3
Ju
l-0
3
Ja
n-0
4
Ju
l-0
4
Ja
n-0
5
Ju
l-0
5
Ja
n-0
6
Ju
l-0
6
Ja
n-0
7
Ju
l-0
7
Ja
n-0
8
Ju
l-0
8
Ja
n-0
9
Ju
l-0
9
Ja
n-1
0
Ju
l-1
0
Ja
n-1
1
Ju
l-1
1
Ja
n-1
2
Ju
l-1
2
Ja
n-1
3
Ju
l-1
3
Ja
n-1
4
Ju
l-1
4
New Home Sales
Distressed Sales

Market Snapshots
| © 2014 CoreLogic, Inc. ■ Proprietary & Confidential 32
Atlanta, GA
Austin, TX
Cape Coral, FL Chicago, IL
Nashville, TN Phoenix, AZ
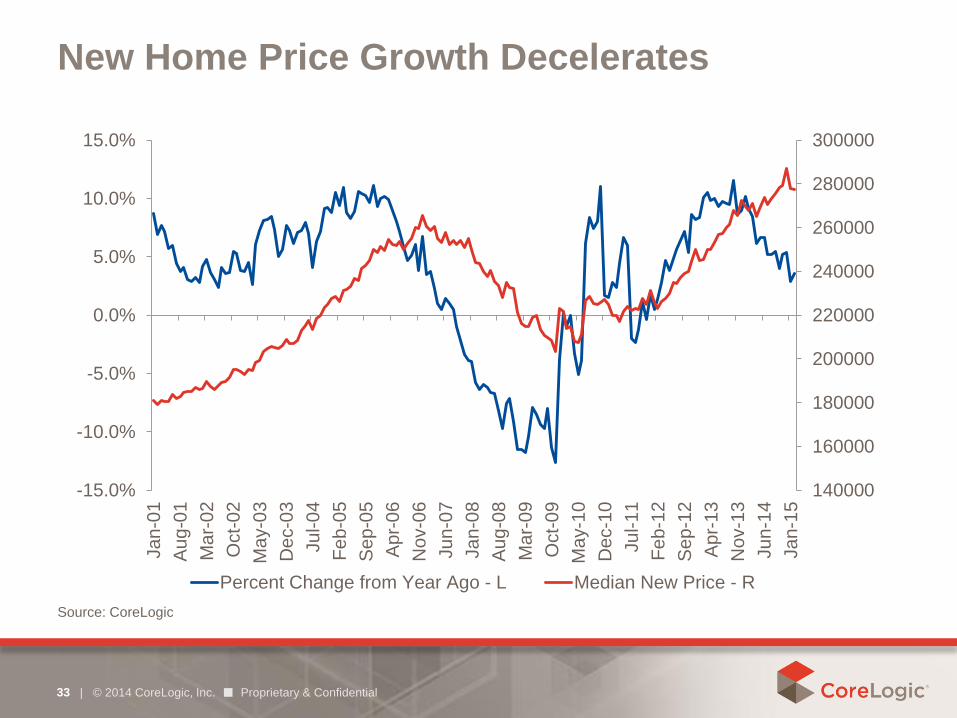
New Home Price Growth Decelerates
| © 2014 CoreLogic, Inc. ■ Proprietary & Confidential 33
Source: CoreLogic
140000
160000
180000
200000
220000
240000
260000
280000
300000
-15.0%
-10.0%
-5.0%
0.0%
5.0%
10.0%
15.0%Ja
n-0
1
Au
g-0
1
Mar-
02
Oct-
02
Ma
y-0
3
De
c-0
3
Ju
l-0
4
Fe
b-0
5
Se
p-0
5
Ap
r-0
6
No
v-0
6
Ju
n-0
7
Ja
n-0
8
Au
g-0
8
Ma
r-0
9
Oct-
09
Ma
y-1
0
De
c-1
0
Ju
l-1
1
Fe
b-1
2
Se
p-1
2
Ap
r-1
3
No
v-1
3
Ju
n-1
4
Ja
n-1
5
Percent Change from Year Ago - L Median New Price - R
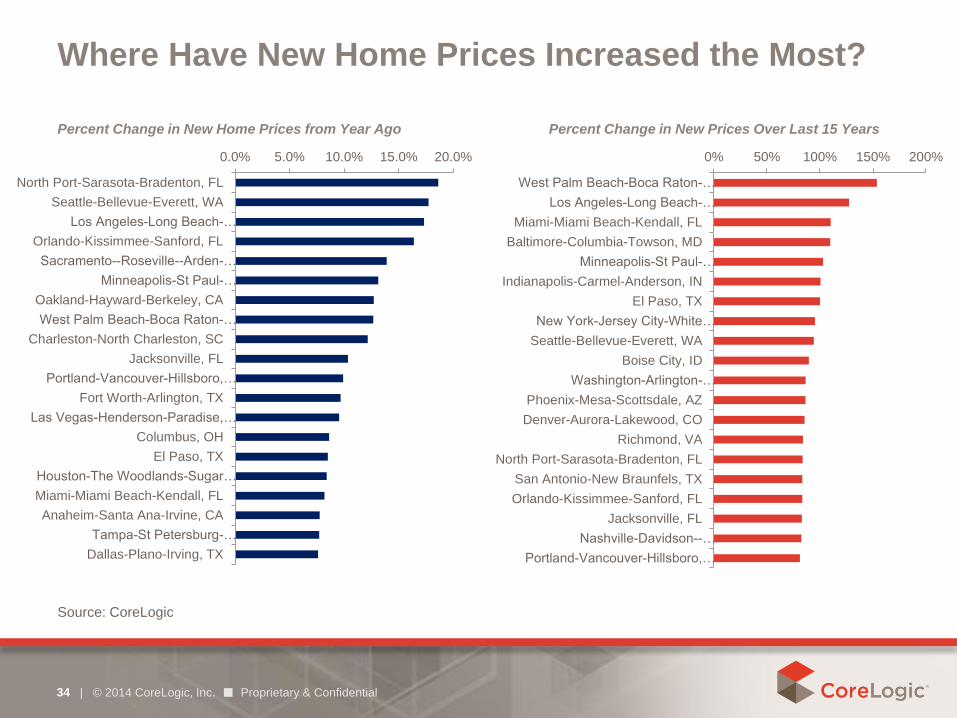
Where Have New Home Prices Increased the Most?
| © 2014 CoreLogic, Inc. ■ Proprietary & Confidential 34
Percent Change in New Home Prices from Year Ago
Source: CoreLogic
0.0% 5.0% 10.0% 15.0% 20.0%
North Port-Sarasota-Bradenton, FL
Seattle-Bellevue-Everett, WA
Los Angeles-Long Beach-…
Orlando-Kissimmee-Sanford, FL
Sacramento--Roseville--Arden-…
Minneapolis-St Paul-…
Oakland-Hayward-Berkeley, CA
West Palm Beach-Boca Raton-…
Charleston-North Charleston, SC
Jacksonville, FL
Portland-Vancouver-Hillsboro,…
Fort Worth-Arlington, TX
Las Vegas-Henderson-Paradise,…
Columbus, OH
El Paso, TX
Houston-The Woodlands-Sugar…
Miami-Miami Beach-Kendall, FL
Anaheim-Santa Ana-Irvine, CA
Tampa-St Petersburg-…
Dallas-Plano-Irving, TX
0% 50% 100% 150% 200%
West Palm Beach-Boca Raton-…
Los Angeles-Long Beach-…
Miami-Miami Beach-Kendall, FL
Baltimore-Columbia-Towson, MD
Minneapolis-St Paul-…
Indianapolis-Carmel-Anderson, IN
El Paso, TX
New York-Jersey City-White…
Seattle-Bellevue-Everett, WA
Boise City, ID
Washington-Arlington-…
Phoenix-Mesa-Scottsdale, AZ
Denver-Aurora-Lakewood, CO
Richmond, VA
North Port-Sarasota-Bradenton, FL
San Antonio-New Braunfels, TX
Orlando-Kissimmee-Sanford, FL
Jacksonville, FL
Nashville-Davidson--…
Portland-Vancouver-Hillsboro,…
Percent Change in New Prices Over Last 15 Years
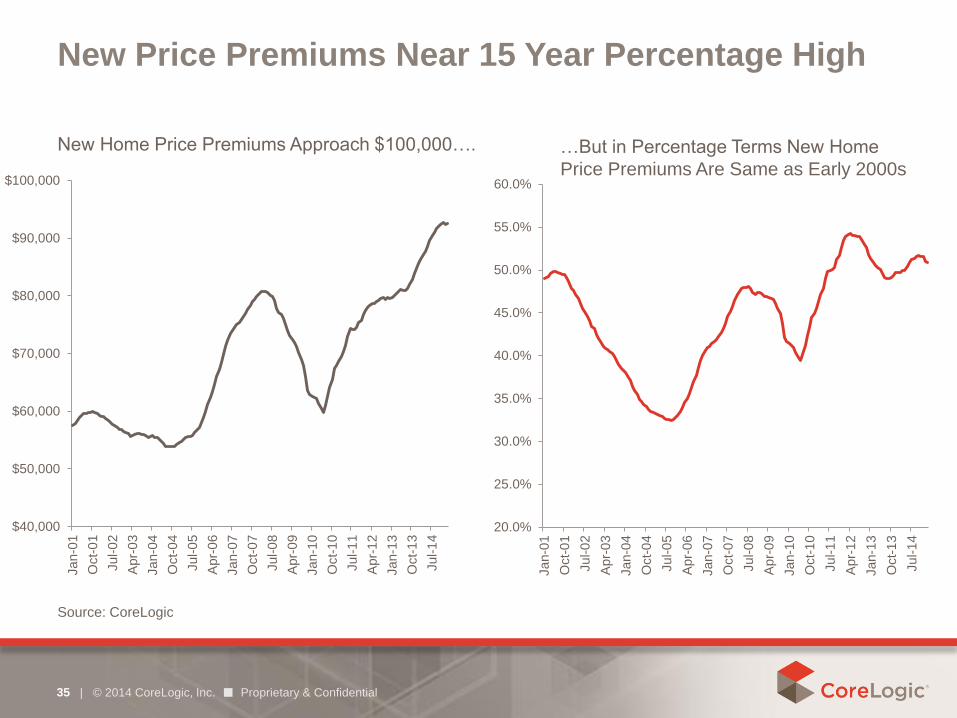
New Price Premiums Near 15 Year Percentage High
| © 2014 CoreLogic, Inc. ■ Proprietary & Confidential 35
Source: CoreLogic
$40,000
$50,000
$60,000
$70,000
$80,000
$90,000
$100,000
Jan-0
1
Oct-
01
Jul-0
2
Apr-
03
Jan-0
4
Oct-
04
Jul-0
5
Apr-
06
Jan-0
7
Oct-
07
Jul-0
8
Apr-
09
Jan-1
0
Oct-
10
Jul-1
1
Apr-
12
Jan-1
3
Oct-
13
Jul-1
4
New Home Price Premiums Approach $100,000….
20.0%
25.0%
30.0%
35.0%
40.0%
45.0%
50.0%
55.0%
60.0%
Jan-0
1
Oct-
01
Jul-0
2
Apr-
03
Jan-0
4
Oct-
04
Jul-0
5
Apr-
06
Jan-0
7
Oct-
07
Jul-0
8
Apr-
09
Jan-1
0
Oct-
10
Jul-1
1
Apr-
12
Jan-1
3
Oct-
13
Jul-1
4
…But in Percentage Terms New Home
Price Premiums Are Same as Early 2000s
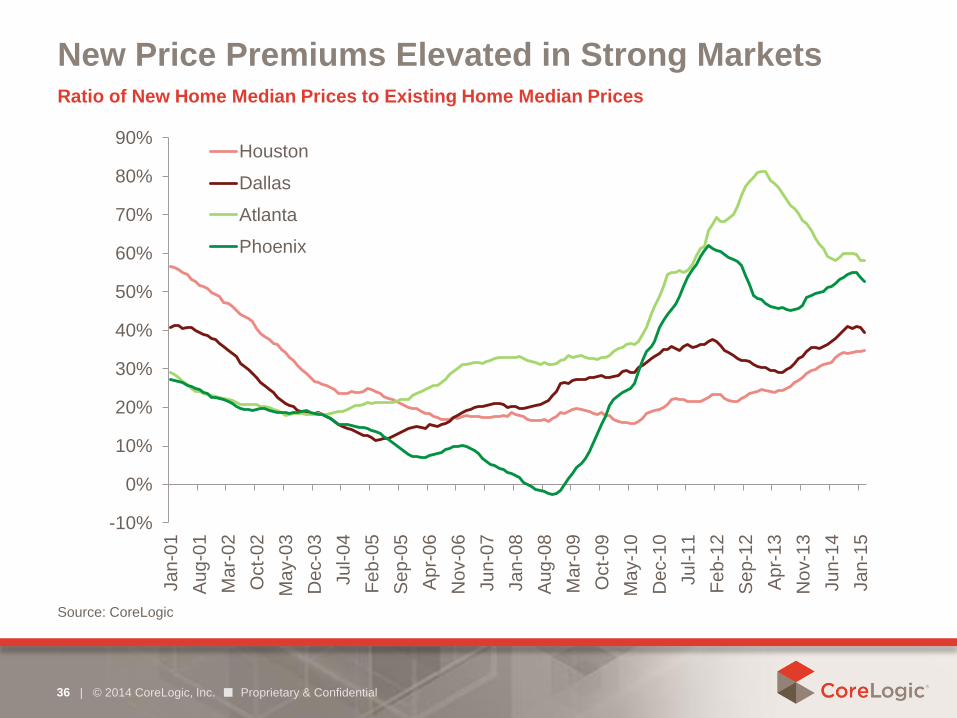
New Price Premiums Elevated in Strong Markets
| © 2014 CoreLogic, Inc. ■ Proprietary & Confidential 36
Source: CoreLogic
-10%
0%
10%
20%
30%
40%
50%
60%
70%
80%
90%
Jan-0
1
Au
g-0
1
Ma
r-0
2
Oct-
02
Ma
y-0
3
De
c-0
3
Ju
l-0
4
Fe
b-0
5
Se
p-0
5
Ap
r-0
6
No
v-0
6
Ju
n-0
7
Ja
n-0
8
Au
g-0
8
Ma
r-0
9
Oct-
09
Ma
y-1
0
De
c-1
0
Ju
l-1
1
Fe
b-1
2
Sep-1
2
Ap
r-1
3
No
v-1
3
Ju
n-1
4
Ja
n-1
5
Houston
Dallas
Atlanta
Phoenix
Ratio of New Home Median Prices to Existing Home Median Prices
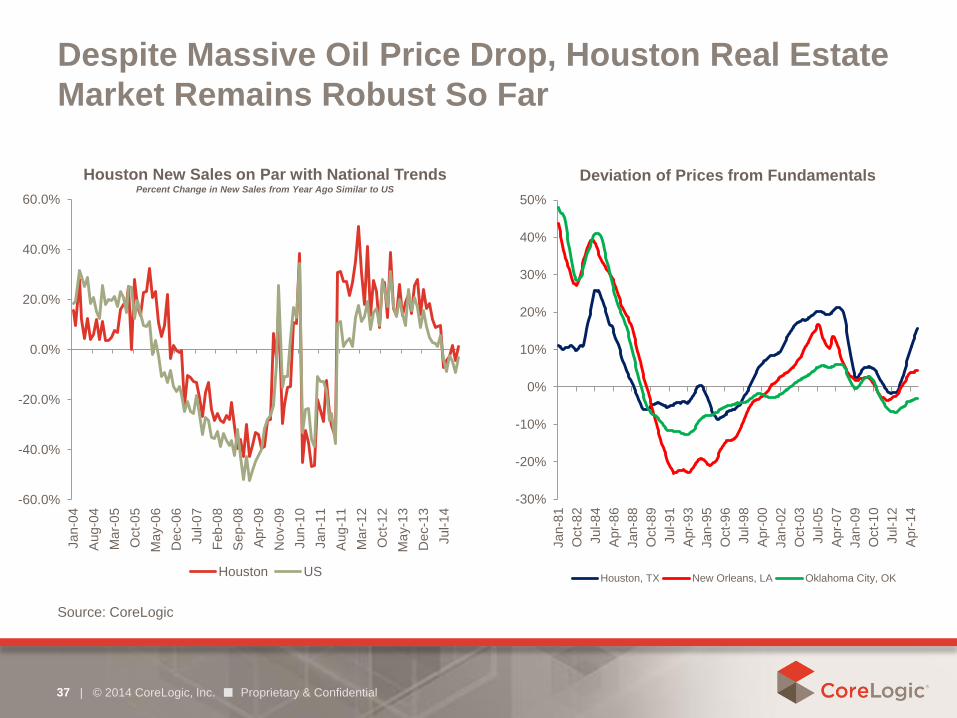
Despite Massive Oil Price Drop, Houston Real Estate
Market Remains Robust So Far
| © 2014 CoreLogic, Inc. ■ Proprietary & Confidential 37
Source: CoreLogic
-30%
-20%
-10%
0%
10%
20%
30%
40%
50%
Jan-8
1
Oct-
82
Jul-8
4
Apr-
86
Jan-8
8
Oct-
89
Jul-9
1
Apr-
93
Jan-9
5
Oct-
96
Jul-9
8
Apr-
00
Jan-0
2
Oct-
03
Jul-0
5
Apr-
07
Jan-0
9
Oct-
10
Jul-1
2
Apr-
14
Deviation of Prices from Fundamentals
Houston, TX New Orleans, LA Oklahoma City, OK
-60.0%
-40.0%
-20.0%
0.0%
20.0%
40.0%
60.0%
Jan-0
4
Aug-0
4
Ma
r-0
5
Oct-
05
Ma
y-0
6
De
c-0
6
Jul-0
7
Feb
-08
Sep-0
8
Apr-
09
No
v-0
9
Jun-1
0
Jan-1
1
Aug-1
1
Ma
r-1
2
Oct-
12
Ma
y-1
3
De
c-1
3
Jul-1
4
Houston US
Houston New Sales on Par with National Trends Percent Change in New Sales from Year Ago Similar to US

Thank You!
corelogic.com/blog | NYSE: CLGX
| © 2014 CoreLogic, Inc. ■ Proprietary & Confidential 38

Robert Denk
Assistant Vice President
Forecasting and Analysis
April 22, 2015
Spring 2015 Construction Forecast Webinar
Progress of Housing Market Recovery
A. Housing Market Conditions
Production
Prices
Foreclosures
Employment
B. The Forecast
0.0
0.2
0.4
0.6
0.8
1.0
1.2
1.4
1.6
1.8
2.0
90 91 92 93 94 95 96 97 98 99 00 01 02 03 04 05 06 07 08 09 10 11 12 13 14 15
Million Units, SAAR
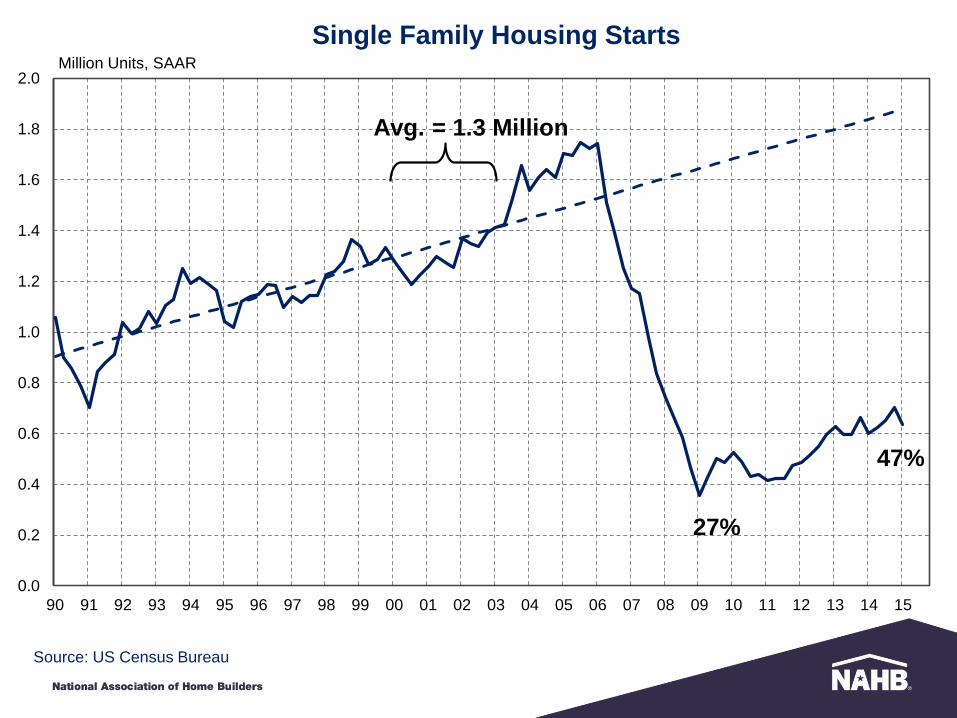
Avg. = 1.3 Million
27%
47%
Single Family Housing Starts
Source: US Census Bureau
0.00
0.10
0.20
0.30
0.40
0.50
0.60
0.70
0.80
0.90
1.00
1.10
1.20
1.30
M
I
N
V
I
L
A
Z
M
N
C
O
C
A
F
L
G
A
O
H
M
O
I
N
W
I
N
H
C
T
R
I
N
J
O
R
K
Y
M
D
I
D
U
T
V
T
A
K
K
S
M
A
N
C
W
V
N
M
V
A
P
A
N
Y
H
I
I
A
T
N
M
S
M
E
N
E
W
A
D
E
D
C
N
D
S
D
S
C
A
R
A
L
T
X
O
K
L
A
M
T
W
Y
Current
Trough
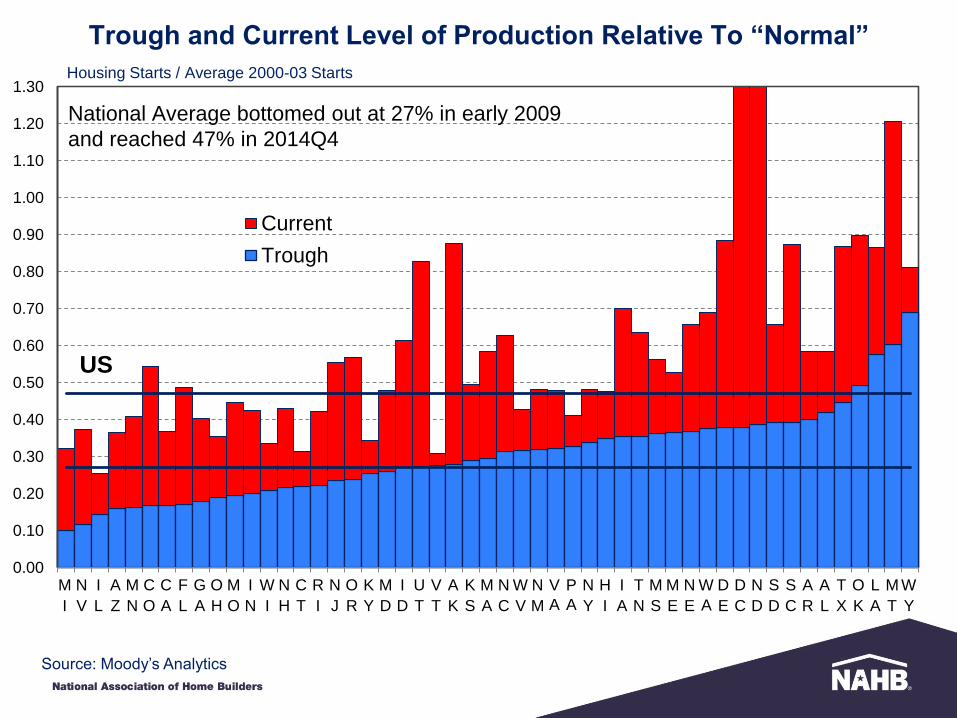
Housing Starts / Average 2000-03 Starts
National Average bottomed out at 27% in early 2009
and reached 47% in 2014Q4
US
Trough and Current Level of Production Relative To “Normal”
Source: Moody’s Analytics
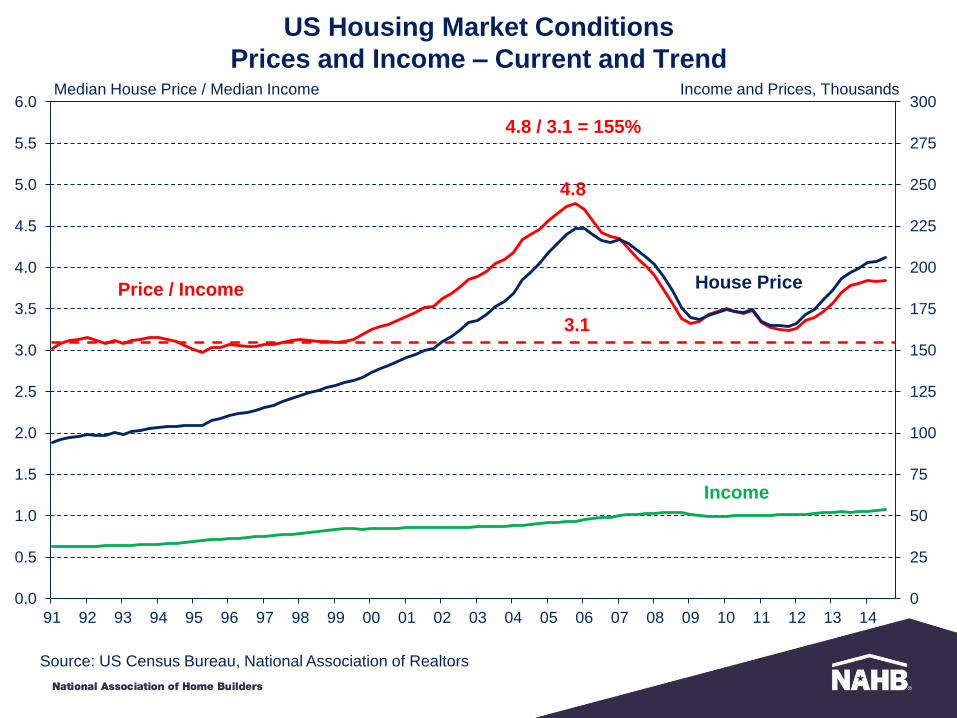
US Housing Market Conditions
Prices and Income – Current and Trend
0
25
50
75
100
125
150
175
200
225
250
275
300
91 92 93 94 95 96 97 98 99 00 01 02 03 04 05 06 07 08 09 10 11 12 13 14
0.0
0.5
1.0
1.5
2.0
2.5
3.0
3.5
4.0
4.5
5.0
5.5
6.0Median House Price / Median Income Income and Prices, Thousands
House Price Price / Income
Income
3.1
4.8
4.8 / 3.1 = 155%
Source: US Census Bureau, National Association of Realtors

US Housing Market Conditions
Prices and Income – Current and Trend
0
25
50
75
100
125
150
175
200
225
250
275
300
91 92 93 94 95 96 97 98 99 00 01 02 03 04 05 06 07 08 09 10 11 12 13 14
0.0
0.5
1.0
1.5
2.0
2.5
3.0
3.5
4.0
4.5
5.0
5.5
6.0Median House Price / Median Income Income and Prices, Thousands
House Price Price / Income
Income
3.1
4.8
4.8 / 3.1 = 155%
Percentage of 3.1
124%
Source: US Census Bureau, National Association of Realtors
0%
10%
20%
30%
40%
50%
60%
70%
80%
90%
100%
110%
120%
130%
140%
150%
160%
170%
180%
190%
200%
210%
220%
U
S
I
N
W
Y
O
H
S
D
M
O
T
N
A
L
C
T
V
T
N
M
A
R
I
A
K
S
K
Y
M
I
O
K
G
A
U
T
T
X
N
E
N
C
M
S
P
A
M
T
L
A
N
D
W
I
N
H
M
E
I
L
H
I
A
K
S
C
D
E
W
V
C
O
M
N
I
D
R
I
M
A
W
A
N
Y
O
R
V
A
N
J
M
D
D
C
A
Z
C
A
N
V
F
L
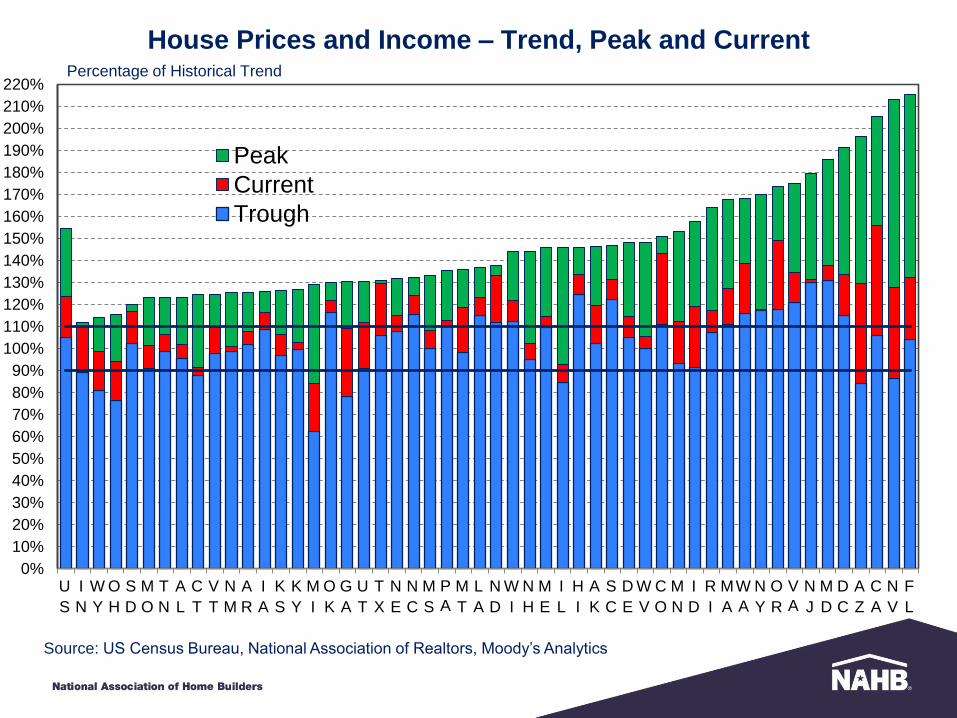
Peak
Current
Trough
Percentage of Historical Trend
House Prices and Income – Trend, Peak and Current
Source: US Census Bureau, National Association of Realtors, Moody’s Analytics

0.0
0.5
1.0
1.5
2.0
2.5
3.0
3.5
4.0
4.5
5.0
5.5
79 80 81 82 83 84 85 86 87 88 89 90 91 92 93 94 95 96 97 98 99 00 01 02 03 04 05 06 07 08 09 10 11 12 13 14
Percent
Delinquent 90+ Days
Started
Inventory
Foreclosures: Started, Inventory and Delinquent Loans
Source: Mortgage Bankers Association, National Delinquency Survey
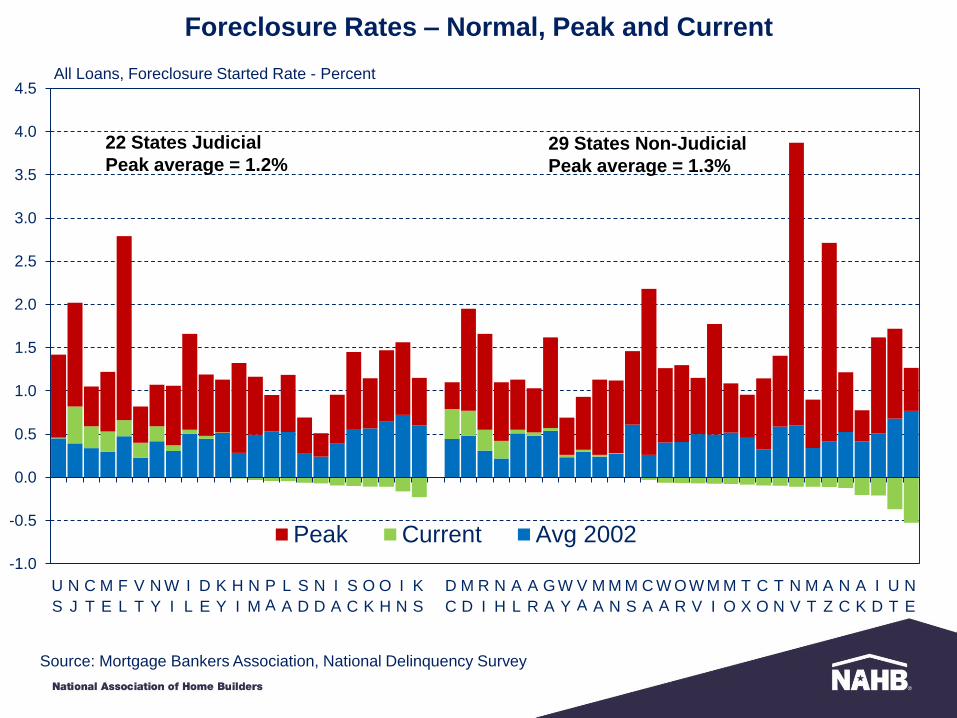
Foreclosure Rates – Normal, Peak and Current
U
S
N
J
C
T
M
E
F
L
V
T
N
Y
W
I
I
L
D
E
K
Y
H
I
N
M
P
A
L
A
S
D
N
D
I
A
S
C
O
K
O
H
I
N
K
S
D
C
M
D
R
I
N
H
A
L
A
R
G
A
W
Y
V
A
M
A
M
N
M
S
C
A
W
A
O
R
W
V
M
I
M
O
T
X
C
O
T
N
N
V
M
T
A
Z
N
C
A
K
I
D
U
T
N
E
-1.0
-0.5
0.0
0.5
1.0
1.5
2.0
2.5
3.0
3.5
4.0
4.5
Peak Current Avg 2002
All Loans, Foreclosure Started Rate - Percent
22 States Judicial
Peak average = 1.2% 29 States Non-Judicial
Peak average = 1.3%
Source: Mortgage Bankers Association, National Delinquency Survey
U
S
N
J
F
L
N
Y
M
E
C
T
H
I
V
T
I
L
D
E
N
M
O
K
W
I
P
A
I
A
S
C
L
A
K
Y
S
D
K
S
O
H
N
D
I
N
R
I
N
V
M
D
D
C
O
R
M
A
N
H
W
A
C
A
A
R
A
L
M
N
V
A
C
O
G
A
W
Y
N
C
A
Z
T
X
M
T
W
V
M
O
M
S
I
D
M
I
T
N
A
K
N
E
U
T
-2
0
2
4
6
8
10
12
14
16
Peak Current Avg 2002
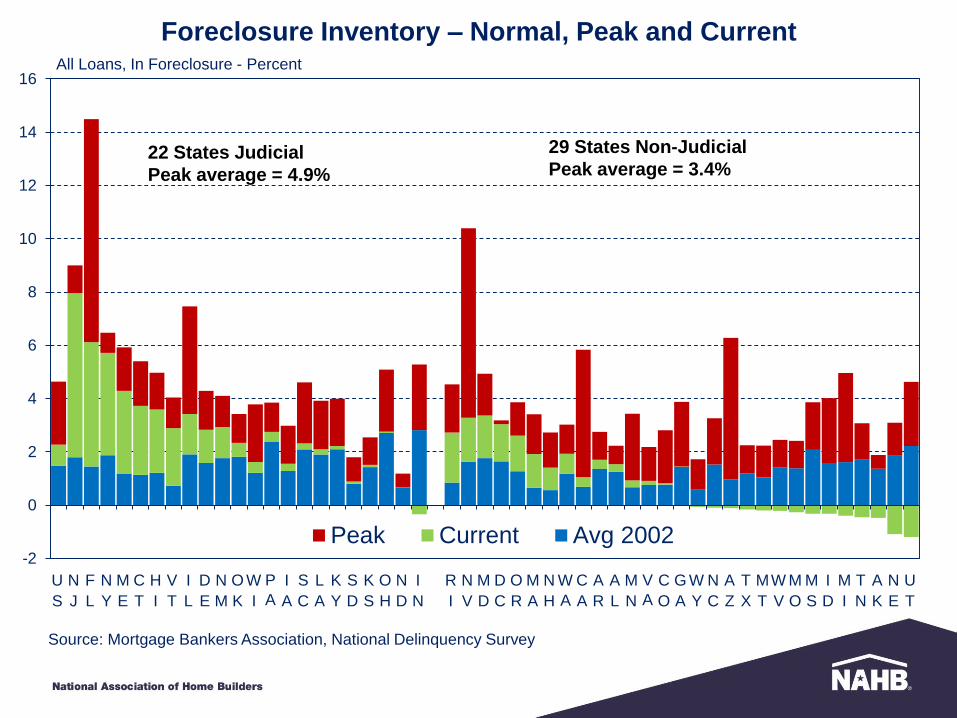
All Loans, In Foreclosure - Percent
22 States Judicial
Peak average = 4.9%
29 States Non-Judicial
Peak average = 3.4%
Foreclosure Inventory – Normal, Peak and Current
Source: Mortgage Bankers Association, National Delinquency Survey
80%
90%
100%
110%
120%
130%
140%
N
D
T
X
U
T
D
C
C
O
A
K
W
A
N
Y
S
D
M
A
C
A
O
K
N
E
I
D
I
A
M
N
M
T
L
A
S
C
G
A
T
N
K
Y
M
D
N
C
V
T
O
R
K
S
I
N
H
I
V
A
D
E
W
I
A
R
P
A
N
H
F
L
W
V
W
Y
O
H
I
L
M
O
C
T
N
M
A
Z
N
J
M
E
M
S
R
I
A
L
M
I
N
V
Current
Trough
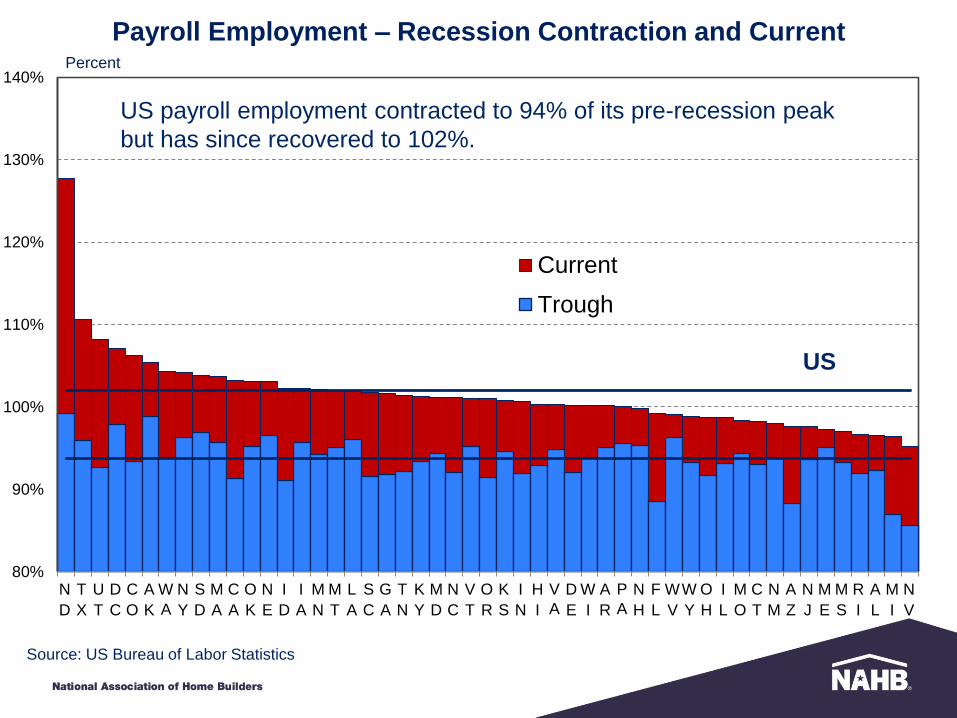
Percent
US
US payroll employment contracted to 94% of its pre-recession peak
but has since recovered to 102%.
Payroll Employment – Recession Contraction and Current
Source: US Bureau of Labor Statistics
0%
10%
20%
30%
40%
50%
60%
70%
80%
90%
100%
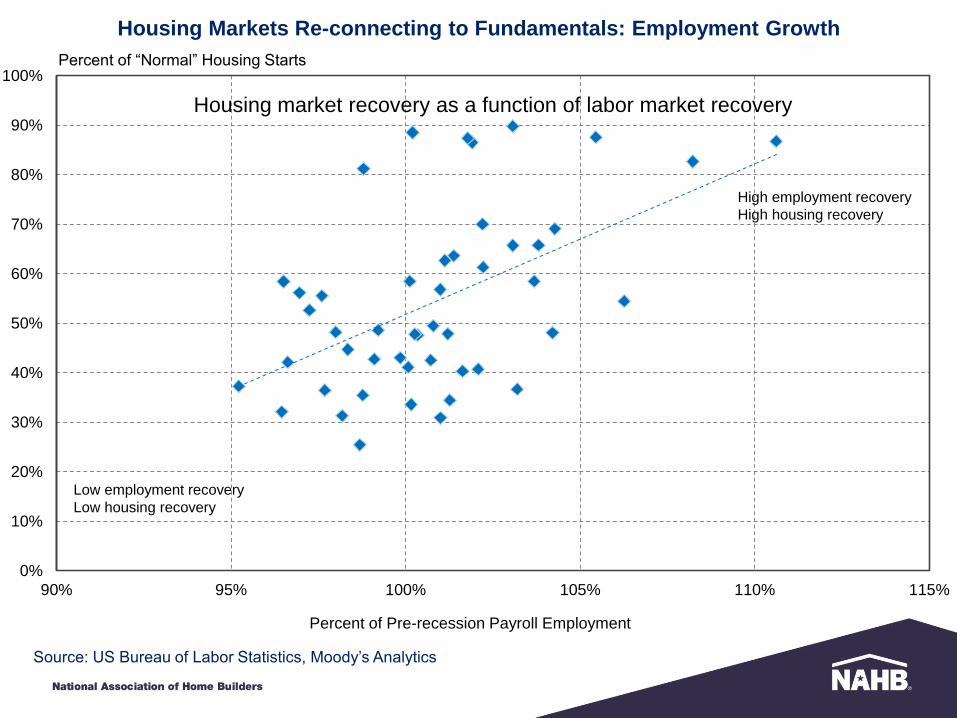
90% 95% 100% 105% 110% 115%
Percent of “Normal” Housing Starts
Housing Markets Re-connecting to Fundamentals: Employment Growth
Percent of Pre-recession Payroll Employment
Housing market recovery as a function of labor market recovery
High employment recovery
High housing recovery
Low employment recovery
Low housing recovery
Source: US Bureau of Labor Statistics, Moody’s Analytics
Progress of Housing Market Recovery
B. The Forecast

0.0
0.2
0.4
0.6
0.8
1.0
1.2
1.4
1.6
1.8
2.0
90 91 92 93 94 95 96 97 98 99 00 01 02 03 04 05 06 07 08 09 10 11 12 13 14 15 16
Million Units, SAAR
47%
90%
61%
27%
Single Family Housing Starts
Sources: US Census Bureau, NAHB
0.00
0.10
0.20
0.30
0.40
0.50
0.60
0.70
0.80
0.90
1.00
1.10
1.20
1.30
1.40
1.50
1.60
V
T
I
L
C
T
M
I
W
I
K
Y
O
H
P
A
W
V
N
H
M
N
R
I
C
A
A
Z
N
V
I
N
G
A
V
A
M
O
M
E
K
S
S
D
H
I
N
M
M
D
A
L
M
S
A
K
F
L
N
J
N
E
N
Y
A
R
M
A
I
A
O
R
D
E
W
A
C
O
T
N
I
D
W
Y
U
T
N
C
M
T
L
A
S
C
O
K
T
X
D
C
N
D
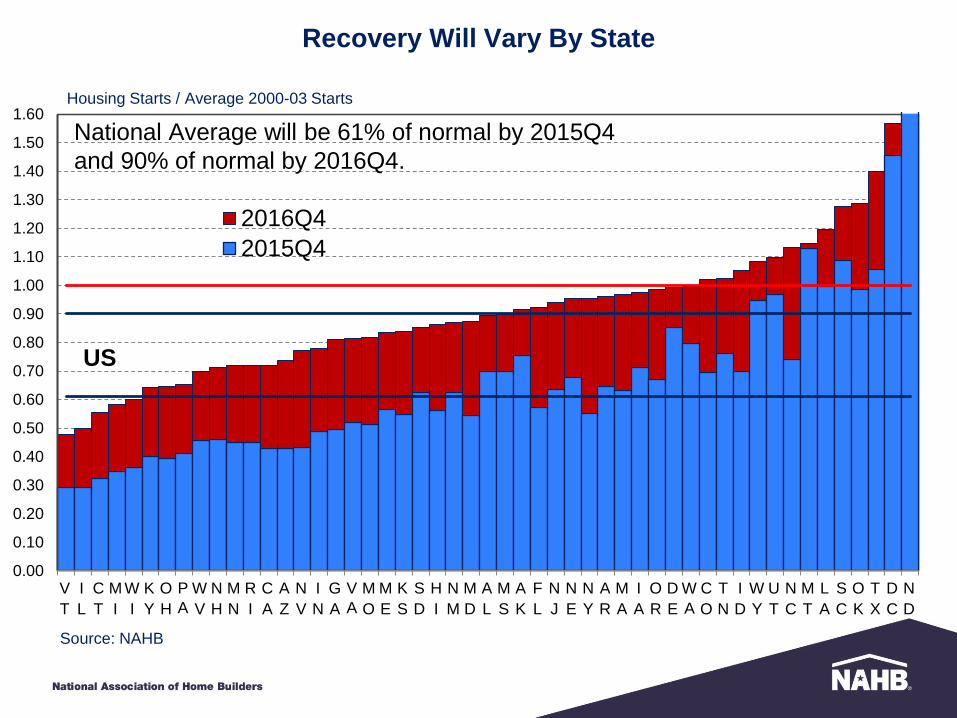
2016Q4
2015Q4
Housing Starts / Average 2000-03 Starts
National Average will be 61% of normal by 2015Q4
and 90% of normal by 2016Q4.
US
Recovery Will Vary By State
Source: NAHB

Rank Q4 2016
Bottom 20%
20% to 40%
40% to 60%
60% to 80%
Top 20%
The Long Road Back to Normal
< 72%
72% - 84%
85% - 95%
96% - 105%
105% <
Relative
to Normal
This map shows how the states rank in the return to more normal levels of housing production.
By the end of 2016, the top 40% will be back to near normal production levels.
The bottom 20% will be below 72% of normal production.