economic and environmental impacts of the kyoto protocol author(s
TRANSCRIPT

http://www.jstor.org
Economic and Environmental Impacts of the Kyoto ProtocolAuthor(s): Christoph Böhringer and Carsten VogtSource: The Canadian Journal of Economics / Revue canadienne d'Economique, Vol. 36, No. 2(May, 2003), pp. 475-494Published by: Blackwell Publishing on behalf of the Canadian Economics AssociationStable URL: http://www.jstor.org/stable/3131853Accessed: 10/09/2008 16:41
Your use of the JSTOR archive indicates your acceptance of JSTOR's Terms and Conditions of Use, available at
http://www.jstor.org/page/info/about/policies/terms.jsp. JSTOR's Terms and Conditions of Use provides, in part, that unless
you have obtained prior permission, you may not download an entire issue of a journal or multiple copies of articles, and you
may use content in the JSTOR archive only for your personal, non-commercial use.
Please contact the publisher regarding any further use of this work. Publisher contact information may be obtained at
http://www.jstor.org/action/showPublisher?publisherCode=black.
Each copy of any part of a JSTOR transmission must contain the same copyright notice that appears on the screen or printed
page of such transmission.
JSTOR is a not-for-profit organization founded in 1995 to build trusted digital archives for scholarship. We work with the
scholarly community to preserve their work and the materials they rely upon, and to build a common research platform that
promotes the discovery and use of these resources. For more information about JSTOR, please contact [email protected].

Economic and environmental impacts of the Kyoto Protocol
Christoph B6hringer and Carsten Vogt Centre for European Economic Research (ZEW), Mannheim
Abstract. In 2003 the Kyoto Protocol, which imposes legally binding greenhouse gas emission constraints on industrialized countries, is likely to enter into force. The Proto- col has been celebrated as a milestone in climate protection, but standard economic theory casts doubt that it will go beyond symbolic policy. In this paper, we show that the final concretion of the Kyoto Protocol is consistent with the theoretical prediction: Kyoto more or less boils down to business-as-usual without significant compliance costs to ratifying parties. JEL Classification: D58, Q43, Q58
Consequences economiques et environnementales du protocole de Kyoto. En 2003, le protocole de Kyoto, qui impose aux pays industrialises l'obligation de reduire leurs emissions de gaz a effet de serre, entrera probablement en vigueur. Si le protocole a et6 accueilli comme un grand pas en avant dans le combat pour proteger l'environnement, la theorie economique jette un regard sceptique sur la portee reelle d'un tel accord et le considere comme un geste symbolique. Dans ce memoire, on montre que la concr6tisa- tion finale de l'accord de Kyoto s'arrime aux predictions theoriques : Kyoto n'est rien de plus que < business-as-usual >> et n'impliquera pas de couits significatifs pour les parties qui ont sign6 le protocole.
1. Introduction
In 2003 the first legally binding international agreement on climate protection is likely to enter into force. This agreement goes back to the 3rd Conference of Parties (COP3) to the Climate Convention in 1997 in Kyoto, where industrial- ized nations committed themselves to reducing their emissions of greenhouse gases (GHG) by roughly 5% on average, compared with their 1990 emission levels, during the commitment period from 2008 to 2012 (UNFCCC 1997). The
We would like to thank Carsten Helm, Andreas Lange, Joachim Weimann, Adam Rose, and two anonymous referees for helpful comments. Regarding any remaining inadequacies, the usual caveat applies. Email: [email protected]
Canadian Journal of Economics / Revue canadienne d'Economique, Vol. 36, No. 2 May / mai 2003. Printed in Canada / Imprime au Canada
0008-4085 / 03 / 475-494 / C Canadian Economics Association

476 C. Bohringer and C. Vogt
so-called Kyoto Protocol has been celebrated as a breakthrough in international climate policy, because it implied- in its original form - substantial emission reductions for industrialized countries (as listed in Annex B of the Protocol) vis-a-vis business-as-usual emissions.
From the stance of standard economic theory, such an agreement with potentially large economic adjustment costs to industrialized nations is hard to explain, since climate protection constitutes the case of voluntarily providing a pure global public good. In fact, according to standard game theory, no country should have an incentive to abate greenhouse gas emissions above its non-cooperative level. In the short to medium run, the latter can be identified as the business-as-usual emission level, since costs of emission abate- ment occur instantly but (rather uncertain) benefits will arise only in the far distant future.
In this paper, we investigate whether the final concretion of the Kyoto Protocol is consistent with the theoretical prediction. A first back-of-the-envelope analysis shows indeed that recent changes to the Kyoto Protocol - most notably, U.S. withdrawal and unrestricted emissions trading - boil down climate policy to business as usual without any compliance costs for partici- pating countries. At second glance, however, it appears that market power on emission markets may turn the Kyoto Protocol into an agreement with binding emission constraints. Since the induced effects on regional welfare and global emissions are not directly observable, we use an established computable general equilibrium (CGE) model of global trade and energy use for impact analysis. The quantitative CGE results back the proposition of standard economic theory, because compliance costs as well as environmental effects are rather negligible.
Several studies have already pointed out that the recent amendments to the
Kyoto Protocol have substantially watered down its environmental effective- ness (see Buchner, Carraro, and Cersosimo 2001 for a synopsis). However, none of the studies links quantitative results to the prediction of standard economic
theory. Furthermore, our quantitative analysis combines central features of an
appropriated impact assessment such as market power in permit trade or terms-of-trade effects, and it proves robustness of conclusions with respect to a wide range of uncertainties in the model parameterization space.
2. The Kyoto Protocol at first view: what theory predicts
Climate protection poses the problem of providing a global public good. In the absence of any supranational authority, countries behave non-cooperatively, that is, each country decides on its GHG abatement according to a comparison of its own benefits from abatement and its own costs of abatement. For concreteness, let there be n countries and let qi denote the abatement level of
country i. Global abatement, then, simply amounts to Q= Eiqi. National

Impacts of the Kyoto Protocol 477
benefits from abatement depend on the global abatement level, hence Bi-Bi(Q), while costs depend on the national abatement level that a single country chooses: Ci= Ci(q). In a non-cooperative Nash equilibrium, countries choose abatement levels that equate their own marginal benefits from abate- ment and their own marginal abatement costs, that is, B' = C'. The non- cooperative equilibrium is suboptimal from a global planner point of view, because the decentralized national decision maker does not recognize the positive externalities spread on all other countries by its own abatement action.' Further- more, each country has an incentive to free ride on abatement in other countries without contributing by its own, which leads to the well-known prisoner's dilemma situation in climate policy.2
For the purpose of our paper, it is necessary to quantify the compliance costs a country is willing to accept in the non-cooperative solution. Although the non-cooperative solution in general implies positive contributions to the provision of the public good, we assume the optimal abatement level qi and, thus, compliance costs to be (close to) zero. Apart from the classical free-rider incentive, the main reason is that with respect to global warming, abatement measures undertaken today will not unfold a stabilizing climate effect until far in the future. Hence, benefits from climate protection will accrue to future generations, while costs have to be carried by the current generation. Any rational government, therefore, will not enter an international agreement which is likely to impose significant costs.
Prima facie, the effective outcome of the Kyoto Protocol - after five years of negotiation - backs our simple theoretical argument. Table 1 provides the quantitative evidence.
Column 'Baseline Emissions - 1990' of table 1 lists the historic emissions for all annex B regions, and column 'Nominal Reduction - OLD' provides the reduction targets as originally foreseen by the Kyoto Protocol. For example, Canada (CAN) has committed itself to reduce its GHG emissions by 6.0% compared with 1990 emission levels. Since these targets will not become legally binding before the Kyoto commitment period (2008-12), the appropriate reference for the effective targets are the business-as-usual (BaU) emissions during the commitment period that are reported for the central year 2010 in column 'Baseline Emissions - 2010.' Except for the economies in transition, which include Central and Eastern Europe (CEA) as well as the Former Soviet Union (FSU), the Kyoto targets translate into much more stringent effective targets, because
1 Simulation studies that focus on long-term cumulative emission reduction targets and identify optimal abatement paths typically assume a global planner, neglecting the incentive problem of international cooperation (see e.g. Nordhaus 1993 or Manne and Richels 1995).
2 Clearly, the purpose of climate negotiations is to achieve co-operative solutions which improve upon the outcome in the absence of any international agreement. Note, however, that the incentive for countries to free ride on the contributions of other countries remains even if such an agreement exists, since there is no supranational authority, that could coerce co-operative behavior by credible sanctions.

478 C. B6hringer and C. Vogt
TABLE 1 Baseline emissions and targets*
Baseline Kyoto Targets Effective Targets Effective Targets Emissions (MtC)a (% wrt 1990)b (% wrt 2010) (MtC wrt 2010)
Region 1990 2010 OLD NEW OLD NEW OLD NEW
AUN 88 130 +6.8 +10.2 -27.7 -25.4 -36 -33 CAN 127 165 -6.0 +7.9 -27.7 -17.0 -46 -28 EUR 929 1041 -7.8 -5.2 -17.7 -15.4 -184 -160 JPN 269 331 -6.0 -0.8 -23.6 -19.4 -78 -64 CEA 301 227 -7.1 -3.9 +23.2 +27.5 +53 +62 FSU 1036 713 0.0 +6.4 +45.3 +54.6 +323 +389
Total USA outc 2750 2607 -5.0 -0.5 +0.7 +3.8 +32 +166
USA 1347 1809 -7.0 -3.2 -30.8 -27.9 -556 -505
Total USA ind 4097 4416 -5.0 -0.5 -11.9 -7.7 -525 -339
* For reasons of data availability, we apply the GHG reduction targets to CO2 only, which is by far the most important GHG among industrialized countries. Key: AUN - Australia and New Zealand, CAN - Canada, EUR - OECD Europe (incl. EFTA), JPN - Japan, CEA - Central and Eastern Europe, FSU - Former Soviet Union (incl. Ukraine) a Based on IEO (2001): reference case b Estimates by the European Commission (Nemry 2001) c Annex B without U.S. compliance d Annex B with U.S. compliance
industrialized countries are projected to have economic growth accompanied by a considerable increase in GHG emissions from fossil fuel combustion. Apparently, the economies in transition have been endowed with emission entitlements under the Kyoto Protocol that are well in excess of their anticipated future BaU emissions. As will be elaborated below, the availability of these excess emissions, which are referred to as 'hot air' will crucially affect the potential compliance costs of OECD countries under the Kyoto Protocol.
An assessment of table 1 with respect to the implementation of the Kyoto Protocol in its original form, that is, U.S. compliance and OLD targets, indicates that the Kyoto Protocol demands a substantial cutback of BaU emissions for the industrialized world. Even in the case of unrestricted Annex B trade in emission rights, which would allow for the full availability of hot air, aggregate Annex B emissions are supposed to fall by roughly 12% compared with BaU (see intersection of row 'Total USA in' with column 'Effective
Targets - OLD'). More recently, however, there have been major modifications to the Kyoto
Protocol. In March 2001 the U.S. under President Bush declared its with- drawal from the Protocol, reasoning that the costs to the U.S. economy would be too high and exemption of developing countries from binding emis- sion targets would not be acceptable. U.S. withdrawal had a crucial impact on the climate policy negotiations at Bonn (June 2001) and Marrakech (October

Impacts of the Kyoto Protocol 479
2001). Owing to the 'double trigger' mechanism,3 entry into force of the Kyoto Protocol is no longer possible without participation of FSU and the country group of AUN, CAN and JPN. Using their implicit veto power, these regions achieved major revisions to the initial settings of the Kyoto Protocol: not only have the original emission reduction targets been considerably softened by conceding substantial credits for carbon dioxide sinks4 (see columns 'NEW' in table 1), but proposals for explicit restrictions to permit trade in order to suppress hot air also have been dropped.
In table 1, the row 'Total USA out' illustrates the dramatic implications of U.S. withdrawal and unrestricted permit trade. The total amount of hot air exceeds the cumulative cutback requirements across remaining Annex B coun- tries. Without rationing of hot air, the Kyoto Protocol boils down to business as usual confirming the proposition of standard economic theory.
3. At second glance: Kyoto is different from BaU but not much
A more realistic assessment of market mechanisms, however, warrants caution against our simple back-of-the-envelope calculation. Obviously, FSU as the dominant supplier of emission rights (due to large entitlements with hot air) may act as a monopolist, reducing its permit supply and charging a mark-up over its marginal abatement costs (which are zero for hot air) to maximize profits. The international permit price will be positive, imposing non-zero compliance costs on industrialized countries with emission cutback require- ments.
Our main interest, then, is to assess how much the implied costs for major Annex B parties differ from zero when market power is taken into account. In order to obtain such cost estimates, we make use of a standard CGE model of world trade and energy use (B6hringer 2002; B6hringer and Rutherford 2002).5 In the basic model version (see the appendix for the algebraic model summary),
3 On the one side, at least 55 countries have to ratify the treaty through their national parliaments. On the other side, those countries that ratify the treaty have to account for at least 55% of the CO2 emissions in 1990 (the Protocol's base year).
4 Credits are composed of sinks from forest management and agricultural activities that store CO2. Given that these activities largely coincide with business as usual, we assume that there are no costs to earning the credits (see Nemry 2001) that relax the cutback requirements for energy- related emissions.
5 The data and model to replicate all of our results can be obtained from the authors upon request. The aggregated regions of the model underlying our analysis are listed in table 1. The aggregated sectors include energy sectors (coal (COL), crude oil (CRU), natural gas (GAS), refined oil products (OIL), and electricity (ELE)), a composite of energy intensive sectors (EIS), and the rest of industry (ROI). Details on the mapping of the original GTAP-EG regions and sectors to the model's regions and sectors are available as a download from ftp://ftp.zew.de/pub/zew-docs/div/ cje_kyoto.pdf. This download also provides a graphical exposition of functional forms (Appendix B of the download), details on the model's forward calibration (Appendix C of the download), as well as on the assignment of emission reduction targets (Appendix E of the download).
480 C. B6hringer and C. Vogt
all factor and commodity markets are assumed to be competitive.6 For our simulations, we drop this assumption with respect to emissions trading and treat FSU as a monopoly supplier of emission permits. Profit-maximizing behaviour then entails the equalization of marginal abatement cost and per- ceived marginal revenue, which implies that the permit price set by FSU is a mark-up on marginal cost. Obviously, the mark-up rate is a decreasing func- tion of the price elasticity of permit demand. Since the concrete formula for the endogenous price elasticity is analytically intractable, we represent the mark-up in the model as an export tariff that drives a wedge between the international permit price and the marginal abatement costs in FSU. The mark-up has the same effect as a quota on the sales of permits, where the quota rents accrue to FSU. In order to determine the optimal tariff or quota numerically, we raise the tariff of FSU in sufficiently small steps and then identify that rate which maximizes its welfare.
As is customary in applied general equilibrium analysis, the model is based on economic transactions in a particular benchmark year (1995 in our case). Bench- mark data determine parameters of the functional forms from a given set of benchmark quantities, prices, and elasticities (see table A6). As to benchmark quantities and prices, we employ the GTAP-EG database (see Rutherford and Paltsev 2000), which provides a consistent representation of energy markets in physical units and detailed accounts of regional production and consumption as well as bilateral trade, including all types of (indirect) taxes.
The magnitude and distribution of abatement costs associated with the implementation of the Kyoto emission constraints crucially depend on the business-as-usual (BaU) projections for GDP, fuel prices, energy efficiency improvements, and so on. In our comparative-static framework, we infer the BaU economic structure of the model's regions for the year 2010 using projec- tions of the most recent 'International Energy Outlook' (IEO 2001) by the U.S. Department of Energy for GDP growth, fossil fuel production, and future energy prices. We incorporate autonomous energy efficiency improvement factors, which scale energy demand functions to match the exogenous IEO emission forecasts. In our simulations, we measure the economic and environ- mental consequences of abatement policies with respect to the BaU situation in 2010.
Table 2 summarizes the main economic and environmental effects of four abatement scenarios which reflect the history of negotiations on the concrete
implementation of the Kyoto Protocol along three key dimensions: fully domestic action (NTR) versus Annex B emissions trading (TRD), U.S. com- pliance (in) versus U.S. withdrawal (out), and Kyoto targets without sink credits (OLD) versus Kyoto targets updated with sink credits (NEW).
6 Supplies of primary factors are exogenous in the central model version. Model variants that incorporate elastic labour supply and savings demand (see for an analytical representation http:// www.gams.com/solvers/mpsge/cesfun.htm#gemtap) do not change our qualitative results.

Impacts of the Kyoto Protocol 481
TABLE 2 Economic and environmental impacts of implementing the Kyoto Protocol
NTR_in_OLD NTR out_OLD NTR_out_NEW TRD_out NEW
Consumption change in % vs. BaU
AUN -1.18 -1.09 -0.93 -0.29 CAN -1.48 -0.62 -0.29 -0.13 EUR -0.17 -0.24 -0.19 -0.06 JPN -0.26 -0.34 -0.22 -0.05 CEA 0.49 0.27 0.22 0.75 FSU -0.93 -0.69 -0.59 0.38 USA -0.51 0.01 0.01 0.00 ROW -0.35 -0.19 -0.15 -0.03 TOTAL -0.24 -0.12 -0.09 -0.01
Marginal abatement costs in USD97 per ton of carbon
AUN 126 123 106 18 CAN 145 132 64 18 EUR 111 106 87 18 JPN 183 176 129 18 CEA 0 0 0 18 FSU 0 00 0 USA 156 - - -
Consumption change in USD97 per capita
AUN -114 -107 -90 -28 CAN -162 -68 -32 -15 EUR -23 -31 -24 -8 JPN -53 -67 -43 -9 CEA 8 4 3 12 FSU -12 -9 -7 5 USA -92 - -
Emission reduction in % vs. BaU
TOTAL 9.6 2.8 2.3 0.7
Leakage in %*
TOTAL 14 30 30 9
*Ratio of emission change in non-abating regions over aggregate emission reduction in abating regions
Scenario NTR_in_OLD considers the implementation of the Kyoto Proto- col in its initial form with fully domestic action (NTR), that is, no trade in emission rights, U.S. compliance (in) for the Kyoto reduction targets without sink credits (OLD). We see that emission constraints as originally mandated under the Kyoto Protocol induce non-negligible adjustment costs to OECD countries for the case of fully domestic action.

482 C. B6hringer and C. Vogt
Without 'where'-flexibility, the effective emission constraints require substantial changes in the production and consumption patterns of OECD countries towards less carbon-intensity, which induces a loss of productivity and real income (consumption). Adjustment costs- measured in percentage loss of BaU consumption - range from 0.17% for EUR to 1.48% for CAN, indicating regional differences in the effective cutback requirements, carbon intensities of economies, the ease of carbon substitution within production and consumption, and indirect losses or benefits through terms-of-trade effects. The latter are the reason why CEA and FSU as well as non-Annex B countries (ROW) are affected by abatement policies of trading partners even though they do not face a binding emission constraint. Terms-of-trade effects work primar- ily through the decline of international fuel prices following the drop in energy demand under emission reduction policies: Net fuel importers such as CEA benefit from cheaper energy imports, while net fuel exporters such as FSU or ROW are negatively affected.7 Converting the percentage changes in consump- tion into implicit payments per capita, the specific costs for abating OECD regions range from 23 USD/capita of EUR to 162 USD/capita for CAN. The compliance costs for the U.S. amounts to 92 USD.
As we can see from scenario NTR_out_OLD, non-compliance of the U.S. leaves the remaining OECD countries with considerable costs, although fuel-
exporting regions AUN and, particularly, CAN benefit from U.S. withdrawal
through a smaller drop in world energy prices. Scenario NTR_out_NEW reflects a situation without international permit
trade (NTR) and without U.S. compliance (out), where the Kyoto targets are updated with sink credits (NEW): Sink credits considerably reduce com-
pliance costs, but the effective burden is still significant (with up to 90 USD per capita for AUN) if regions must meet their targets through domestic action
only. The drastic drop in costs for OECD countries comes from unrestricted
annex B emissions trading together with U.S. withdrawal, as captured in scenario TRD_out_NEW, which characterizes the final agreement on the
Kyoto implementation after the climate policy negotiations in Bonn and Marrakech. Although compliance costs for OECD countries are still different from zero, owing to monopolistic permit pricing by FSU, comparison of cost
figures under the initial Kyoto setting (NTR_in_OLD) and its final concretion
clearly backs our initial proposition that, after all, Kyoto should come down to
symbolic policy. Note in this context that the cost figures reported for monopolistic permit
trade must be seen as an upper bound, since we do not account for pro- competitive firm-to-firm emissions trading or the Clean Developing Mechanism
7 See Bohringer and Rutherford (2002) for a detailed discussion of the sources and magnitude of terms-of-trade effects from carbon abatement.

Impacts of the Kyoto Protocol 483
TABLE 3 Implications of alternative baseline projections (TRD_out_NEW)
LOW REFERENCE HIGH
Consumption change in % vs. BaU
AUN -0.13 -0.29 -0.35 CAN -0.05 -0.13 -0.18 EUR -0.02 -0.06 -0.09 JPN -0.01 -0.05 -0.07 CEA 0.38 0.75 0.68 FSU 0.09 0.38 0.60 USA 0.00 0.00 0.00 ROW -0.02 -0.03 -0.03 TOTAL -0.01 -0.01 -0.02
Marginal abatement costs in USD97
AUN 7 18 22 CAN 7 18 22 EUR 7 18 22 JPN 7 18 22 CEA 7 18 22 FSU 0 0 0 USA - -
Consumption change in USD97 per capita
AUN -14 -28 -34 CAN -6 -15 -21 EUR -3 -8 -11 JPN -2 -9 -14 CEA 7 12 12 FSU 1 5 7 USA - -
Emission reduction in % vs. BaU
TOTAL 0.3 0.7 1.0
Leakage in %
TOTAL 9 9 9
(CDM), which allows the purchase of emission credits from abatement in non- Annex B developing countries.
With the decrease in compliance costs, global environmental effectiveness drops close to zero when we incorporate step by step the changes to the initial Protocol. Except for hot air, U.S. withdrawal, and sink credits, global envir- onmental effectiveness is affected by 'leakage' (see Felder and Rutherford 1993): Sub-global abatement of carbon leads to an increase in emissions in non-abating regions, reducing the global environmental effectiveness. Not
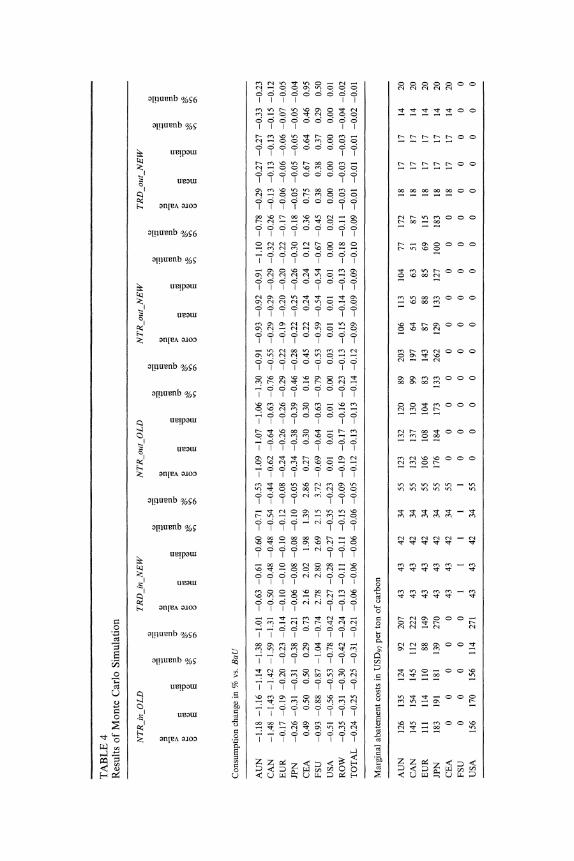
TABLE 4 Results of Monte Carlo Simulation
NTR in OLD TRD in_NEW NTR out_OLD NTR out_NEW TRD out NEW
a, _u > >a
e^- 99a CZ 35 a a a o ? a o E E 8 a a a E a
Consumption change in % vs. BaU
AUN -1.18 -1.16 -1.14 -1.38 -1.01 -0.63 -0.61 -0.60 -0.71 -0.53 -1.09 -1.07 -1.06 -1.30 -0.91 -0.93 -0.92 -0.91 -1.10 -0.78 -0.29 -0.27 -0.27 -0.33 -0.23
CAN -1.48 -1.43 -1.42 -1.59 -1.31 -0.50 -0.48 -0.48 -0.54 -0.44 -0.62 -0.64 -0.63 -0.76 -0.55 -0.29 -0.29 -0.29 -0.32 -0.26 -0.13 -0.13 -01.3 -0.15 -0.12
EUR -0.17 -0.19 -0.20 -0.23 -0.14 -0.10 -0.10 -0.10 -0.12 -0.08 -0.24 -0.26 -0.26 -0.29 -0.22 -0.19 -0.20 -0.20 -0.22 -0.17 -0.06 -0.06 -0.06 -0.07 -0.05
JPN -0.26 -0.31 -0.31 -0.38 -0.21 -0.06 -0.08 -0.08 -0.10 -0.05 -0.34 -0.38 -0.39 -0.46 -0.28 -0.22 -0.25 -0.26 -0.30 -0.18 -0.05 -0.05 -0.05 -0.05 -0.04
CEA 0.49 0.50 0.50 0.29 0.73 2.16 2.02 1.98 1.39 2.86 0.27 0.30 0.30 0.16 0.45 0.22 0.24 0.24 0.12 0.36 0.75 0.67 0.64 0.46 0.95
FSU -0.93 -0.88 -0.87 -1.04 -0.74 2.78 2.80 2.69 2.15 3.72 -0.69 -0.64 -0.63 -0.79 -0.53 -0.59 -0.54 -0.54 -0.67 -0.45 0.38 0.38 0.37 0.29 0.50
USA -0.51 -0.56 -0.53 -0.78 -0.42 -0.27 -0.28 -0.27 -0.35 -0.23 0.01 0.01 0.01 0.00 0.03 0.01 0.01 0.01 0.00 0.02 0.00 0.00 0.00 0.00 0.01
ROW -0.35 -0.31 -0.30 -0.42 -0.24 -0.13 -0.11 -0.11 -0.15 -0.09 -0.19 -0.17 -0.16 -0.23 -0.13 -0.15 -0.14 -0.13 -0.18 -0.11 -0.03 -0.03 -0.03 -0.04 -0.02
TOTAL -0.24 -0.25 -0.25 -0.31 -0.21 -0.06 -0.06 -0.06 -0.06 -0.05 -0.12 -0.13 -0.13 -0.14 -0.12 -0.09 -0.09 -0.09 -0.10 -0.09 -0.01 -0.01 -0.01 -0.02 -0.01
Marginal abatement costs in USD97 per ton of carbon
AUN 126 135 124 92 207 43 43 42 34 55 123 132 120 89 203 106 113 104 77 172 18 17 17 14 20
CAN 145 154 145 112 222 43 43 42 34 55 132 137 130 99 197 64 65 63 51 87 18 17 17 14 20
EUR 111 114 110 88 149 43 43 42 34 55 106 108 104 83 143 87 88 85 69 115 18 17 17 14 20
JPN 183 191 181 139 270 43 43 42 34 55 176 184 173 133 262 129 133 127 100 183 18 17 17 14 20
CEA 0 0 0 0 0 43 43 42 34 55 0 0 0 0 0 0 0 0 0 0 18 17 17 14 20
FSU 0 0 0 0 0 1 1 1 1 1 0 0 0 0 0 0 0 0 0 0 0 0 0 0 0
USA 156 170 156 114 271 43 43 42 34 55 0 0 0 0 0 0 0 0 0 0 0 0 0 0 0

Consumption change in USD97 per Capita
AUN -114 -113 -110 -134 -99 -62 -59 -59 -69 -52 -107 -104 -103 -128 -86 -90 -89 -86 -107 -76 -28 -26 -28 -31 -21 CAN -162 -155 -153 -174 -141 -53 -52 -53 -59 -47 -68 -70 -68 -82 -59 -32 -32 -32 -35 -29 -15 -14 -15 -15 -12
Consumption change in USD97 per Capita
EUR -23 -25 -26 -31 -18 -13 -13 -14 -16 -10 -31 -33 -34 -38 -29 -24 -26 -26 -29 -22 -8 -8 -8 -8 -7 JPN -53 -61 -61 -76 -43 -13 -15 -15 -20 -10 -67 -76 -76 -91 -57 -43 -50 -51 -59 -35 -9 -10 -9 -10 -9 CEA 8 8 8 5 12 36 33 33 23 47 4 5 5 2 7 3 4 4 2 6 12 11 11 7 16 FSU -12 -11 -11 -13 -9 34 34 33 27 46 -9 -8 -8 -10 -6 -7 -7 -6 -8 -5 5 5 4 3 6 USA -92 -102 -96 -142 -76 -49 -50 -49 -63 -41 0 0 0 0 0 0 0 0 0 0 0 0 0 0
Emission reduction in % vs. BaU
TOTAL 9.60 9.51 9.50 9.00 10.00 4.40 4.39 4.40 4.10 4.60 2.80 2.71 2.70 2.40 3.00 2.30 2.22 2.20 1.90 2.50 0.70 0.69 0.70 0.60 0.80

486 C. B6hringer and C. Vogt
surprisingly, leakage increases with the number of non-abating regions (USA in versus USA out) and decreases with carbon trade (NTR versus TRD).
4. Sensitivity analysis
The results of table 2 are based on the reference scenario of the most recent International Energy Outlook (IEO 2001) and common values for key elasti- cities (see table A6).
Obviously, the effects induced by the implementation of the Kyoto Protocol crucially depend on the business-as-usual (BaU) projections for GDP and emissions. Any careful policy assessment thus requires sensitivity analysis with respect to alternative baseline projections. We have performed "piece- meal" sensitivity analysis for two additional baseline projections reported in the International Energy Outlook, where the growth potential of the world economy is considered either more pessimistic (case: LO W) or more optimistic (case: HIGH), compared with the reference scenario. Lower economic growth is linked to lower demands for fossil fuels and lower BaU carbon emissions. The opposite applies for higher economic growth. Table 3 provides a con- densed summary of results for alternative baseline projections focusing on scenario TRD_out_NEW, which reflects the final concretion of the Kyoto Protocol. As expected, the nominal Kyoto reduction targets translate into less stringent emission constraints for the LOW case and more stringent reduction requirements for the HIGH case, resulting in, respectively, lower or higher compliance costs for OECD countries. Conversely, CEA and FSU do better for the HIGH case than for the LO W case, because they can draw higher profits from the sales of emission rights.
In order to evaluate the sensitivity of our central model results with respect to uncertainties in the elasticity space, we have conducted 1000 Monte Carlo simulations. In each simulation, values for six elasticties (trade elasticities, energy demand elasticities, and fossil fuel supply elasticities) that are key determinants for the economic adjustment costs to emission constraints were drawn from uniform probability distributions around the model central values
(see table A6). Table 4 provides a statistical summary of results. For each of the scenarios, we have listed the core (central case) values together with the mean and the median as well as the 5% quantile and 95% quantile. The central case effects are close to the mean and median values. Based on our sample distribution, there is a 90% probability that (marginal and inframarginal) adjustment costs and global emission reduction lie between the values indi- cated by the 5% and 95% quantile. Although we observe some spread, in
particular for the scenarios without emission trading that stand out for
stronger overall adjustment effects, all of our insights based on the central case general equilibrium estimates remain robust even when we account for substantial uncertainty in the parameterization space.

Impacts of the Kyoto Protocol 487
5. Conclusion
The Kyoto Protocol, which imposes emission reduction targets on industrial- ized countries, is often celebrated as a milestone in climate protection, but standard economic theory casts doubt that Kyoto will go beyond symbolic policy.
In this paper, we have quantified the final outcome of the Kyoto Protocol in economic and environmental terms to compare it with the theoretical prediction. Following a simple back-of-the-envelope calculation that backs the theoretical proposition, we have argued that market power in emissions trading might prevent Kyoto from boiling down to purely symbolic policy. However, simulations with a large-scale CGE model of world trade and global energy use show that even for extreme assumptions on market power Kyoto is not much different from business as usual. The residual costs for OECD countries complying with the Kyoto Protocol are rather small and may reason- ably be interpreted as governments' willingness to appease voters who want to see some climate policy action but are not willing to pay much.
Few would denigrate the importance of Kyoto in terms of achieving a broad-based international voluntary agreement. However, it must be kept in mind that the Kyoto Protocol has not resolved any of the fundamental incentive problems inherent to the voluntary provision of climate protection as a pure global public good. Consequently, policies that aim at more effective treaties must push for institutional settings that promote international cooper- ation. Economic theory has proposed several instruments, such as issue- linkage or sanction mechanisms but complementary applied research must focus on identifying which of these instruments are likely to provide concrete improvements in practice.
References
Bohringer, C. (2002) 'From Kyoto to Bonn: From Little to Nothing?' Energy Journal, 23, 51-71
B6hringer, C., and T.F. Rutherford (2002) 'Carbon Abatement and International Spill- overs,' Environmental and Resource Economics 22, 391-417
Buchner, B., C. Carraro, and I. Cersosimo (2001) 'On the Consequences of the U.S. Withdrawal from the Kyoto/Bonn Protocol,' FEEM Nota di Lavoro, 102.2001
Felder, S., and T.F. Rutherford (1993) 'Unilateral CO2 reductions and carbon leakage: the effect of international trade in oil and basic materials,' Journal of Environmental Economics and Management 25, 162-76
IEO (2001), International Energy Outlook 2001, U.S.Department of Energy, Energy Information Administration, http://www.eia.doe.gov
Manne, A.S., and R.G. Richels (1995) 'The Greenhouse Debate: Economic Efficiency, Burden Sharing and Hedging Strategies,' Energy Journal 16, 1-35
Nemry, F. (2001) 'LULUCF39 v4 - Quantitative implications of the decision CP.7 on LULUCF,' Personal Communication

488 C. B6hringer and C. Vogt
Nordhaus, W.D. (1993) 'Optimal Greenhouse Gas Reductions and Tax Policy in the DICE Model,' American Economic Review 83, 313-17
Rutherford, T.F., and S.V. Paltsev (2000) 'GTAP-Energy in GAMS,' University of Colorado, Working Paper 00-2, http://debreu.colorado.edu/download/gtap-eg.html
UNFCCC (1997) 'United Nations Framework Convention on Climate Change,' Kyoto Protocol to the United Nations Framework Convention on Climate Change, FCCC/CP/L.7/Add.1, Kyoto
Appendix: Algebraic model summary
This appendix provides an algebraic summary of the equilibrium conditions for our comparative-static model designed to investigate the economic implica- tions of the Kyoto Protocol in 2010, compared with a business-as-usual economic development in which no GHG emission abatement policies apply. Before presenting the algebraic exposition, we state our main assumptions and introduce the notation.
* Nested separable constant elasticity of substitution (CES) functions charac- terize the use of inputs in production. All production exhibits non-increasing returns to scale. Goods are produced with capital, labour, energy and material (KLEM).
* A representative agent (RA) in each region is endowed with three primary factors: natural resources (used for fossil fuel production), labour, and capital. The RA maximizes utility from consumption of a CES composite, subject to a budget constraint with fixed demand for investment (i.e., fixed demand for a savings good) and public good provision. The aggregate consumption bundle combines demands for fossil fuels, electricity, and
non-energy commodities. Total income of the RA consists of factor income and taxes (including revenues from carbon taxes or carbon permits).
* Supplies of labour, capital, and fossil-fuel resources are exogenous. Labour and capital are mobile within domestic borders but cannot move between
regions; natural resources are sector specific. * All goods are differentiated by region of origin. Constant elasticity of
transformation functions (CET) characterize the differentiation of produc- tion between production for the domestic markets and the export markets.
Regarding imports, nested CES functions characterize the choice between
imported and domestic varieties of the same good (Armington).
Two classes of conditions characterize the competitive equilibrium for our model: zero profit conditions and market clearance conditions. The former class determines activity levels and the latter determines price levels. In our
algebraic exposition, the notation II/. is used to denote the profit function of sector j in region r, where z is the name assigned to the associated production activity. Differentiating the profit function with respect to input and output prices provides compensated demand and supply coefficients, which appear

Impacts of the Kyoto Protocol 489
subsequently in the market clearance conditions. We use i (aliased withj) as an index for commodities (sectors) and r (aliased with s) as an index for regions. The label EG represents the set of energy goods and the label FF denotes the subset of fossil fuels. Tables A1-A6 explain the notations for variables and
parameters employed within our algebraic exposition. Figures A1-A4 provide a graphical exposition of the production and final consumption structure. For the sake of transparency, we do not provide an explicit representation of taxes
except for carbon taxes (which can be readily interpreted as the price of carbon
permits).
A.I. Zero profit conditions
1. Production of goods except fossil fuels:
IVY ( XX' X-r/ + (I - X)p -
-' E O PA ir ir- i ir ir / jirPjr jCEG
-KLE E El- ?(l - +(I E) W(aj a)l-KLE I I-
0 i FKLE -6}iKrL- -- iEr ) (Wer VrJr -- 0 i O i ? FF
2. Production of fossil fuels:
inirY =( Xp +(I- Xp)7 ir =(firPir+ (1 Pir
1QJ-aQ,i I-Q,i
oQ r i+(1-r) Lir W' -Kir r + E FF A _ _^'+a-^^fc^+G^+E-
1
=i FF
3. Sector-specific energy aggregate:
E _jE ) n~E ,Al-aELE /
nELE\ ir = Pir r P{ELE,} + (1V ELE) ir EPELE, rl +
-_ ELE I-ELE---
]-oa "i/ or COA
1 uCOA 0COA A COA + l ( COA4( pAi7 ) J O) Uir P{COA, r} jir LQ )
A COA --
EirLQ "0
4. Armington aggregate:
IIA OA aA ,~-aA + (I -- + A I
Tir A ir Irp ( A-i)P + -tC402aC02 _ 0 ir Pi ir ir P ir ? (1 )p r i

490 C. Bohringer and C. Vogt
5. Aggregate imports across import regions:
lM = pM- ( MXl-MI m) 0 ir
- Pir s isris-
6. Household consumption demand:
-rrC .- -I (J- IE EEC
- EC
7. Household energy demand:
iTE - E _ Ei?FF OE A l--'FF,C 1-tFF,C C
Hcr - Pr [ZiCFF OiCrPir ] - F
A.2. Market clearance conditions
8. Labour: Lr - = i Yir r- aWr
9. Capital: K =i Yir irr aVr
10. Natural resources: Qir Yir i EFF
11. Output for domestic markets: Yir aap- = Ajr an
markets: dir - aII,M 12. Output for export markets: Yir = -Es Mis ap
13. Sector specific energy aggregate: Eir = Yir a- ar- ir
14. Import aggregate: Mir =Air --' tgpa
15. Armington aggregate: Air -= E Yjr -A --+ arl-
16. Household consumption:
CrPC =WrLr + VrKr + E qjrQ- + tC02CO2r+Br
jEFF
+ TR - PCGD, r YCGD, r - PG, r YG, r
an,c 17. Aggregate household energy consumption: Ecr Cr aP-
18. Carbon emissions: C02r = iAiraC02

Impacts of the Kyoto Protocol 491
TABLE Al Sets
i Sectors and goods j Aliased with i r Regions s Aliased with r EG All energy goods: Coal, crude oil, refined oil, gas and electricity FF Primary fossil fuels: Coal, crude oil and gas LQ Liquid fuels: Crude oil and gas
TABLE A2 Activity variables
Yir Production in sector i and region r Eir Aggregate energy input in sector i and region r Mir Aggregate imports of good i and region r Adir Armington aggregate for demand category d of good i in region r Cr Aggregate household consumption in region r Ecr Aggregate household energy consumption in region r
TABLE A3 Price variables
Pir Output price of good i produced in region r for domestic market
px Output price of good i produced in region r for export market
pE Price of aggregate energy in sector i and region r
pM Import price aggregate for good i imported to region r
pA Price of Armington good i in region r
pc Price of aggregate household consumption in region r
pE Price of aggregate household energy consumption in region r
Wr Wage rate in region r
Vr Price of capital services in region r
qi,. Rent to natural resources in region r (i E FF) tC02 CO2 tax in region r
TABLE A4 Cost shares
o- ir
OKLE ir
ir
Share of exports in sector i and region r
Share of intermediate good j in sector i and region r (i O FF)
Share of KLE aggregate in sector i and region r (i f FF)
Share of energy in the KLE aggregate of sector i and region r (i O FF)
(continued)

492 C. B6hringer and C. Vogt
TABLE A4 concluded
aiT Share of labour (T= L) or capital (T = K) in sector i and region r (i , FF)
OQ Share of natural resources in sector i of region r (i E FF)
F Share of good i (T= i), labor (T= L), or capital (T K) in sector i and region r (i c FF)
oCOA Share of coal in fossil fuel demand by sector i in region r (i ,
FF)
O^LE Share of electricity in energy demand by sector i in region r
pjir Share of liquid fossil fuel j in energy demand by sector i in region r (i E FF, j e LQ)
OM Share of imports of good i from region s to region r
OA Share of domestic variety in Armington good i of region r
o0r Share of fossil fuel composite in aggregate household consumption in region r
7i, . Share of non-energy good i in non-e. household consumption demand in region r
oEo. Share of fossil fuel i in household energy consumption in region r iCr
TABLE A5 Endowments and emissions coefficients
Lr Aggregate labour endowment for region r
K,. Aggregate capital endowment for region r
Qir Endowment of natural resource i for region r (i E FF)
B,. Balance of payment deficit or surplus in region r (note: Br = 0)
CO02 Endowment of carbon emission rights in region r
ac02 Carbon emissions coefficient for fossil fuel i (i e FF)
TABLE A6 Elasticities
r7 Transformation between production for the domestic market and production 4 for the export
UKLE Substitution between energy and value-added in production (except fossil fuels) 0.5
aQ i Substitution between natural resources and other inputs in fossil fuel endog. production calibrated consistently to exogenous supply elasticities /tCR = 0-5, COL = 0.5, and /GAS= 1.
0ELE Substitution between electricity and the fossil fuel aggregate in production 0.3 OcCOA Substitution between coal and the liquid fossil fuel composite in production 0.5 caA Substitution between the import aggregate and the domestic input 2 aM Substitution between imports from different regions 4 aOEC Substitution between the fossil fuel composite and the non-fossil fuel 0.8
consumption aggregate in household consumption (FF,C Substitution between fossil fuels in household fossil energy consumption 0.3
For the sensitivity analysis reported in section 4, the lower and upper values of the uniform probability distributions for six key elasticities are as follows: 1 < rA < 4; 2 < CM < 8; 0.25 < OKLE < 0.75; 0.6 < cr < 1; 0.25 < /CRU < 1; 0.25 < ICOL < I.

Impacts of the Kyoto Protocol 493
CES
FIGURE Al Nesting in non-fossil fuel production
FIGURE A2 Nesting in fossil fuel production
FIGURE A3 Nesting in household consumption

494 C. Bohringer and C. Vogt
l Armington good CES If
I CES
Exports from other regions - Domestic market variety (CES aggregate) (CFIGURE A4 Nesting in Armington productionaggregate)
FIGURE A4 Nesting in Armington production