economic and environmental assessment of biogas to …
TRANSCRIPT

ECONOMIC AND ENVIRONMENTAL ASSESSMENT OF BIOGAS TO LIQUID
FUELS (BgTL) TECHNOLOGY VIA FISCHER-TROPSCH SYNTHESIS
by
IKENNA JOSEPH OKEKE
(Under the Direction of SUDHAGAR MANI)
ABSTRACT
Production of drop-in renewable diesel from biogas derived from anaerobic
digestion (AD) of Miscanthus gigentus cultivated from strip-mined soils was investigated
to evaluate energy use, environmental impacts and economic feasibilities and compared
with that of conventional fossil based diesel fuel. A process simulation model was
developed for biogas to liquid fuels (BgTL) via Fischer-Tropsch (F-T) synthesis to assess
overall mass and energy balances and to estimate the minimum selling price of renewable
F-T fuels. A base case BgTL plant size of 2000 Nm3/h required about $105 million
capital investment and $12 million annual operating expenses with a minimum F-T fuels
selling price of $5.6/GGE and the price could be reduced by up to $2/GGE, if the biogas
plant capacity can be increased by tenfold (20,000 Nm3/h). Life cycle assessment study
concluded that the net greenhouse gas (GHG) emissions could be reduced by up to 26%
compared with that of conventional diesel fuel with increased crop yield and soil carbon
sequestration rate.
INDEX WORDS: Biogas, Renewable diesel, Aspen Plus, life cycle analysis, GHG.

ECONOMIC AND ENVIRONMENTAL ASSESSMENT OF BIOGAS TO LIQUID
FUELS (BgTL) TECHNOLOGY VIA FISCHER-TROPSCH SYNTHESIS
by
IKENNA JOSEPH OKEKE
B.ENG., NNAMDI AZIKIWE UNIVERSITY, NIGERIA, 2012
A Thesis Submitted to the Graduate Faculty of The University of Georgia in Partial
Fulfillment of the Requirements for the Degree
MASTER OF SCIENCE
ATHENS, GEORGIA
2016

© 2016
IKENNA JOSEPH OKEKE
All Rights Reserved

ECONOMIC AND ENVIRONMENTAL ASSESSMENT OF BIOGAS TO LIQUID
FUELS (BgTL) TECHNOLOGY VIA FISCHER-TROPSCH SYNTHESIS
by
IKENNA JOSEPH OKEKE
Major Professor: SUDHAGAR MANI
Committee: K.C DAS
CANER KAZANCI
Electronic Version Approved:
Suzanne Barbour
Dean of the Graduate School
The University of Georgia
AUGUST 2016

iv
DEDICATION
This research work is dedicated to Almighty God for the graces and wisdom He
bestowed on me during this project. And to Our Lady of Perpetual Help for Her ad-
infinitum intercessions without which I would not have made this thus far.
Ad Maiorem Dei Gloriam

v
ACKNOWLEDGEMENTS
With hearts filled with joy, I would like to acknowledge Dr. Sudhagar Mani for
the unprecedented opportunity he afforded me to work in his Bioenergy Engineering
Research Laboratory at the College of Engineering of the University of Georgia. Your
mentorship and invaluable research experience you offered me during this project is most
appreciated.
I also would want to thank Dr. Das and Dr. Kazanci for serving in my committee
and most importantly for critically analyzing this work and lending guidance and witty
suggestions to the overall success of the thesis work.
To my resilient family members who afforded me all the love and support
throughout my program. Your irreparable sacrifices have earned me a renowned degree
for which I will ever remain indebted.
Chiamaka Rita Ogbaji, my soul mate and partner, the two-years journey cannot
be described without you. Though thousands of miles apart, you knew my daily activities,
motivated me when I was down, and prayed for me ceaselessly. You are an epitome of
love and I celebrate this success as ours. Indeed, it is our achievement and we look
forward for further accomplishments.
Last but not the least, my passionate and academically enthusiastic lab mates who
have contributed to the project: Ms Maryam Manouchehrinejad, Ms Hansole Lee, Mr
Kamalakanta Sahoo, Mr Yang Yue, and Mr Breet Berry. I am grateful and I wish you all
success in your endeavors.

iv
TABLE OF CONTENTS
ACKNOWLEDGEMENTS ................................................................................................ v
LIST OF TABLES ............................................................................................................. iv
LIST OF FIGURES ........................................................................................................... iv
CHAPTER
1 INTRODUCTION ...................................................................................................... 1
1.1 Motivation ............................................................................................................ 1
1.2 Background .......................................................................................................... 2
1.3 Objectives ............................................................................................................. 7
2 LITERATURE REVIEW ........................................................................................... 9
2.1 Background .......................................................................................................... 9
2.2 Biochemistry of Anaerobic Digestion ................................................................ 10
2.3 Anaerobic Digestion Technology....................................................................... 10
2.4 Pretreatment methods ......................................................................................... 15
2.5 Factors affecting biogas yield ............................................................................ 16
2.6 Biogas applications and challenges .................................................................... 17
2.7 Syngas Production .............................................................................................. 19
2.8 Fischer Tropsch Process ..................................................................................... 21
2.9 Fischer Tropsch Catalysts .................................................................................. 26

iv
2.10 Fischer Tropsch Reactor ................................................................................. 26
2.11 Techno-Economic Assessment ....................................................................... 29
2.12 Life Cycle Assessment ................................................................................... 31
2.13 Literature Summary ........................................................................................ 33
3 TECHNO-ECONOMIC ASSESSMENT OF BIOGAS TO LIQUID FUELS
CONVERSION TECHNOLOGY VIA FISHER-TROPSCH SYNTHESIS .................... 37
3.1 Introduction ........................................................................................................ 39
3.2 Methodology ...................................................................................................... 45
3.3 Results and Discussion ....................................................................................... 58
3.4 Conclusion .......................................................................................................... 72
3.5 References .......................................................................................................... 73
4 LIFE CYCLE ANALYSIS OF RENEWABLE DIESEL PRODUCTION VIA AD
AND F-T SYNTHESIS FROM MISCANTHUS GROWN IN STRIP-MINED SOILS. 80
4.1 Introduction ........................................................................................................ 82
4.2 Methodology ...................................................................................................... 85
4.3 Results and discussion ........................................................................................ 97
4.4 Conclusion ........................................................................................................ 113
4.5 References ........................................................................................................ 114
5 CONCLUSIONS..................................................................................................... 119
REFERENCE .................................................................................................................. 123

v
APPENDIX ..................................................................................................................... 143
iv
LIST OF TABLES
Table 2-1: Summary of Liquid State Anaerobic Digestion .............................................. 12
Table 2-2: Summary of Solid State Anaerobic Digestion ................................................ 14
Table 2-3: Summary of Integrated Anaerobic Digestion .................................................. 15
Table 2-4: Summary of Pretreatment methods ................................................................. 16
Table 2-5: Summary of factors that affect biogas yield .................................................... 17
Table 2-6: Summary of biogas upgrading methods .......................................................... 19
Table 2-7: Summary of Reforming Processes .................................................................. 21
Table 3-1: Raw biogas composition ................................................................................. 47
Table 3-2: Different process reactions .............................................................................. 51
Table 3-3: Operating condition for different unit operation ............................................. 53
Table 3-4: Investment parameters ..................................................................................... 55
Table 3-5: Total Capital Investment Approach ................................................................ 56
Table 3-6: Summary of Variable Operating Costs ........................................................... 57
Table 3-7: BgTL product distribution and energy usage .................................................. 58
Table 3-8: Electricity and Heat requirement in kWh ........................................................ 59
Table 3-9: Comparison of the techno-economic analysis of BgTL and related processes 70
Table 4-1: Elemental composition and heating value of Miscanthus ............................... 88
Table 4-2: Input parameters and values for the production of 1 GGE drop-in renewable
diesel from miscanthus ..................................................................................................... 95

iv
Table 4-3: Inventory emissions for the production of 1 GGE of Renewable Diesel ........ 98

iv
LIST OF FIGURES
Figure 1-1: Overall process flow diagram of biogas co-generation with emphasis on
biogas to liquid fuels production......................................................................................... 8
Figure 2-1: Picture of an Agricultural Anaerobic Digester [35] ......................................... 9
Figure 2-2: Anderson-Schulz-Flory chain growth distribution ........................................ 25
Figure 2-3: Fischer-Tropsch Reactors .............................................................................. 28
Figure 3-1: Block flow diagram of the biogas to liquid fuels (BgTL) process technology
........................................................................................................................................... 45
Figure 3-2: Percentage equipment installed cost distribution by section ......................... 61
Figure 3-3: Individual costs contributing to OPEX (A) and CAPEX (B) ........................ 62
Figure 3-4: OPEX and CAPEX as a function of plant capacity ....................................... 64
Figure 3-5: OPEX and CAPEX per production against plant size ................................... 65
Figure 3-6: Product selling price as a function of plant size ............................................. 65
Figure 3-7: Sensitivity analysis for the effect of process parameter on the selling price of
the base case model. .......................................................................................................... 67
Figure 3-8: Sensitivity analysis for the effect of plant cost parameter on the selling price
of the base case model. ..................................................................................................... 69
Figure 4-1: System boundary of GTL production from anaerobic digestion of miscanthus
........................................................................................................................................... 87

iv
Figure 4-2: Cradle to gate impact analysis of the production of 1 GGE of diesel from
Miscanthus ........................................................................................................................ 99
Figure 4-3: Cradle to gate life cycle of miscanthus to drop-in renewable diesel (without
lime) ................................................................................................................................ 103
Figure 4-4: Cradle to gate life cycle of miscanthus to drop-in renewable diesel (with lime)
......................................................................................................................................... 104
Figure 4-5: Comparison of the impact of production of 1 GGE of renewable diesel from
miscanthus without lime addition and 1 GGE of fossil diesel ........................................ 105
Figure 4-6: Comparison of the impact of production of 1 GGE of renewable diesel from
miscanthus with lime addition and 1 GGE of fossil diesel ............................................. 105
Figure 4-7: Sensitivity analysis for global warming potential ........................................ 106
Figure 4-8: Sensitivity analysis for acidification potential ............................................. 107
Figure 4-9: Sensitivity analysis for Ecotoxicity potential ............................................... 108
Figure 4-10: Sensitivity analysis for Eutrophication potential ....................................... 109
Figure 4-11: Sensitivity analysis for Fossil Energy use .................................................. 110
Figure 4-12: Sensitivity analysis for Photochemical Smog formation potential ............ 111

1
CHAPTER 1
1 INTRODUCTION
1.1 Motivation
In recent times, the global rate of energy consumption (1.4% increase) has
outgrown the rate of energy production (0.6% increase) [1] causing an imminent shortage
of energy supply. According to the 2008 report by Energy Watch Group, the maximum
crude oil production limit termed the ‘peak-oil’ has been exceeded [2]. In this scenario, a
world without energy can be envisioned to cause a shutdown of major energy dependent
activities. Sequel to the aforementioned, a balance between energy production and
consumption needs to be met. With an approximate world population of 7.2 billion people
estimated by the United States Census Bureau [3], the energy need of the population is
high with an estimated energy consumption of 12 billion gallons per day [4]. The high
number of vehicles used for transportation in countries such as China [5] and the U.S [6],
and the improvement in the standard of living especially in non-Organization for Economic
Co-operation and Development (OECD) countries contribute to the growth in energy
demand.
Over the years, the energy need has been supplied from petroleum derived fuels [7]
with little concern on the sustainability of the energy source and its effect on climate
change. It is very evident that the environment pays for the use of fossil fuel as the climate
has accumulated a lot of carbon emissions due to the combustion of fossil fuels.

2
Environmental impacts such as global-warming, particulate matter, smog,
sulphuric and nitrous oxide accumulation and ozone layer depletion being the adverse
effects of fossil energy usage. The consequences of such impacts include health hazards
when the particulates are inhaled, acid rain formation due to nitrous and sulfuric acid, and
global warming due to accumulation of heat trapped by emitted carbon dioxide. With more
awareness to these adverse effects, and uncertainty of energy security associated with fossil
energy usage, a shift to alternative forms of energy is currently advocated.
1.2 Background
The use of biomass for energy production has been realized as an alternative route
to reduce the carbon footprint caused by fossil fuels combustion. Hence, the Department
of Energy (DOE) and United States Department of Agriculture (USDA) are on the
collaborative Biomass Research and Development Initiative (BRDI) to enhance the use of
biomass to produce biofuels. This initiative is aimed at advancing bioenergy technology
with the ultimate goal of carbon emissions reduction and energy sustainability guaranteed
by the renewable biomass feedstock.
Sequel to the aforementioned, interests in the use of lignocellulosic biomass sources
has been explored by several researchers to produce various biofuel products. Given the
754 million acres of land potentially available for biomass production in the United States
[8], it proves the sustainability of biomass feedstock needed for biofuels production.
According to [9], there are 157,194 thousand dry tonnes per year of crop residues, 56,612
thousand dry tonnes per year of forest residues and a sum total of 144,895 thousand dry
tonnes per year of energy crops in the United States that all can be used for bioenergy
production. Hence, this biomass can be converted to bioenergy/biofuels sources either

3
through the thermochemical and biochemical routes of which the thermochemical pathway
has received a huge attention in recent times. The typical biomass thermochemical
conversion route is the gasification approach which produces syngas.
Biomass gasification technology have been a proven source of syngas for multiple
fuels production such as ethanol, mixed alcohols, hydrogen, methanol, Fischer-Tropsch
liquids, etc. [10]. These products of syngas are very useful in achieving the increasing
energy demands of the bio-based derived fuels. Of interest in the use of syngas produced
from biomass is the production of drop-in liquid transportation fuels via Fischer-Tropsch
synthesis. This process of converting biomass to liquid fuels has been studied by several
authors using different biomass feedstock. In 2002, [11] studied the prospects of liquid
fuels production using poplar wood. Willow wood was used by [12] to synthesis liquid
fuels production pathway. [13] examined the coproduction of liquid fuels and electricity
using switchgrass. Recently, corn stover low and high temperature gasification processes
were studied by [14] to determine the process feasibility in liquid fuels production.
However, biomass gasification route to generate drop-in liquid fuels produces
syngas with a high amount of impurities in the form of ash, char and particulate matter [12,
14]. Therefore, the syngas needs to be subjected to cleaning and upgrading to make it
suitable for other process applications. Attempts to clean-up the syngas to remove the
impurities has incurred high equipment and operating costs. According to [10], syngas
cleaning contributes 60-65% of the operating cost of the process and ultimately makes the
product cost expensive. This high cost of syngas production via gasification is due to the
following:
4
1. More sophisticated gasifier equipment fabrication specification due to gasifier’s
high operating temperature and pressure.
2. Additional installation of equipment needed for tar and particulate matter removal
from the syngas stream.
3. The syngas (H2/CO) ratio produced in the BTL process needs to be conditioned via
a reverse water gas shift process to meet the Fischer-Tropsch feedstock condition.
4. Some gasification process produces more methane gas which requires additional
reforming unit to produce syngas.
Such overall process requires the use of expensive unit operations which impacts
the total capital and operating cost of the BTL process. In addition, the extent of particulate
matter removal is not certain after the syngas cleaning process. Hence, downstream
equipment is subject to corrosion and rust effects.
With this established research challenges, we are proposing an alternative means of
converting biomass to drop-in liquid fuels that eliminates the complex and high cost of unit
operation requirement in the pathway to liquid fuels production. This pathway is an
existing technology inherently safe and has been used over the years. We are specifically
focusing on the biochemical conversion process, known as anaerobic digestion (AD)
process to produce biogas which is cleaned and reformed into syngas that is processed
further to produce drop-in fuels. Hence the research focuses on “Biogas conversion to drop-
in fuels”.
Biogas is a self-energy source produced from the anaerobic digestion and
breakdown of organic matter. Sewage, agricultural residues, energy crops, and food wastes
are among the feedstock used for the production of biogas via anaerobic digestion [15].

5
Liquid state anaerobic digestion has been the predominant AD process employed for the
production of biogas. Currently in the United States, liquid state feedstock such as
industrial and institutional organic wastes, landfills, wastewater, and animal manure are
used in the for biogas production with a methane potential reported to be approximately 8
million tonnes per annum [16]. With 11,000 sites reported to be developed for biogas
production, it is evident that the potential for biogas growth in the U.S is huge [17]. In
Europe, unlike the U.S, Solid-State Anaerobic digestion has been used to produce biogas
and digestate suitable for agricultural purposes. Lignocellulosic biomass feedstock such as
energy crops, agricultural residues, and woody biomass with solid content of about 25-40%
[18, 19] are generally used.
For the purpose of this research work, we are focusing on the solid state anaerobic
digestion of lignocellulosic biomass either in a single SS-AD plant or in a plant capable of
digesting both solid and liquid biomass feedstock typically referred to as an integrated
anaerobic digester (iAD) plant to produce biogas. Then the biogas is cleaned to remove
impurities and pipelined for renewable liquid fuel production via Fischer-Tropsch
synthesis. Economic feasibility of this conversion technology is necessary in order to
evaluate the technical and economic aspects of the project. This evaluation is conducted
via Techno-economic assessment (TEA) which helps to determine the capital investment,
operating cost and ultimately, the product minimum selling price which shows the
economic standing of the project. The economic analysis of the gas to liquid (GTL),
biomass to liquid (BTL) and coal to liquid (CTL) processes have been carried out by
different authors [13, 20-23] with an estimated capital investment cost between 191 – 541
$MM while the product price was between 1.85 – 3.11 $/GGE. Comparing the price of

6
these liquid fuels to the incessant change in oil price coupled with the future forecast of the
depletion of fossil fuel [24], it enabled the thriving of biomass derived liquid fuels with
future anticipation to be competitive with fossil fuels. On the contrary, the drop in oil price
to $45/bbl since 2014 [25] has ultimately led to a dip in renewable energy projects due to
the comparatively high capital and operating costs of renewable energy sources. According
to EIA, the US biodiesel and renewable diesel imports declined 36% in 2014 [26]. From
all indications, the future of bioenergy is in doubt due to the current low price of oil in
short-term.
Nevertheless, several incidences of drop and rise in oil price over the decades
indicate a need for continual research and development in alternative and renewable
energy. The energy insecurity associated with fossil energy doubles the quest for more
reliable energy sources. In addition, considering that emissions associated with fossil fuel
combustion negatively impact the world’s climate, a renewable source of energy that emits
biogenic carbons with little or no climate change, proves a healthy substitute to fossil
sources [27]. Biomass and biomass-derived feedstock are promising sources to be used in
various ways to generate alternative liquid fuels.
However, to ascertain the claim of an environmentally friendly liquid fuels from
biomass derived sources, a systematic and quantitative evaluation of the entire liquid fuels
production is conducted in a “cradle to gate” approach using life cycle assessment (LCA).
LCA is an internationally recognized procedure of assessing the energy and environmental
impacts of a product life cycle in order to determine their effects on the environment. In
the past, [6, 28-33] have all conducted an environmental assessment on GTL, BTL, and
petroleum diesel and gasoline products to evaluate the product performance on the

7
environment. With different authors reporting different observations of their life cycle
assessment, it can be understood that each process has a unique impact. Therefore, it
becomes necessary to carry out the life cycle assessment of the biomass to liquid fuels
process in order to estimate the energy and environmental impact.
1.3 Objectives
The overall goal of this research is to assess the economic and environmental
impacts of biomass to liquid fuels technology via Fischer-Tropsch synthesis to produce
drop-in diesel fuel. The overall process description is illustrated in figure 1 below showing
a biomass to biogas via anaerobic digestion. The various applications of biogas are depicted
with emphasis on the biogas to liquid fuels as highlighted by the boundary.
The specific objectives are to:
1. Develop a steady-state process simulation model of the biogas to liquid (BgTL)
technology to produce drop-in fuels via Fischer Tropsch synthesis.
2. Conduct a techno-economic analysis of the biogas to liquid (BgTL) technology to
estimate capital investment, and the operating cost of the drop-in fuel price to be
compared with conventional fuels.
3. Perform a life-cycle assessment of the proposed technology to evaluate the energy
and environmental impacts and compare with the conventional diesel fuel.

8
Figure 1-1: Overall process flow diagram of biogas co-generation with emphasis on
biogas to liquid fuels production

9
CHAPTER 2
2 LITERATURE REVIEW
2.1 Background
The history of biogas can be traced back to the 10th century as reported in the National
Renewable Energy Laboratory publication by [34]. Biogas is produced by the anaerobic
breakdown of organic matter in the absence of air/oxygen. Traditional biogas production
involves the decomposition of food wastes, sewage, animal manures in a digester such as
AD or landfills as shown in figure 2-1.
Figure 2-1: Picture of an Agricultural Anaerobic Digester [35]
Generally, anaerobic digestion is carried out at a temperature of between 35 – 45oC
(mesophilic) and 55-65oC (thermophilic) to produce a mixture of gas which consists of
CH4 (55-75%), and CO2 (25-45%) with other impurities such as H2S, NH3, and siloxane
[36, 37]. The composition, quality, and amount of biogas produced depends on carbon to

10
nitrogen (C/N) ratio of feedstock, temperature of digestion, and the percentage of solids
present in the feedstock (%Total Solid and %Volatile Solid) [38].
2.2 Biochemistry of Anaerobic Digestion
The fundamental reaction of the anaerobic digestion process starts with the microbial
action on the feedstock subjected to the digestion process. Describing the biochemistry of
anaerobic digestion by [39], the composition of the feedstock are basically proteins, fats
and carbohydrate which undergoes hydrolysis and become reduced by multicellular
enzymes to simple soluble molecules. Amino acids, long chain fatty acids, and sugars are
the respective products of the hydrolysis of proteins, fats, and carbohydrates. The further
action of fermentative bacteria converts the amino acids, sugars, and fatty acids to multiple
products such as carbon dioxide, hydrogen, volatile fatty acids, and acetic acid. Acetic acid
is converted to acetate by acetogenic bacteria. Finally, methanogens (methane loving
bacteria) produces methane by converting the acetate, carbon dioxide, and hydrogen
2.3 Anaerobic Digestion Technology
Typically, biogas is produced in a digester with a total solid less than 15% [40].
This solid content has been used to differentiate between the traditional liquid state
anaerobic digester (L-AD) operating at TS less than 15% and the solid state anaerobic
digester (SS-AD) which operates at TS greater than 15%. The L-AD and SS-AD reactors
are operated differently which gives rise to different product streams.
2.3.1 Liquid State Anaerobic Digestion
At the inception of anaerobic digestion, the Liquid state anaerobic digester (L-AD)
has been the only method for the production of biogas. Operating with a high moisture
content of about 85%, L-AD has been successfully used to digest animal and food waste.

11
According to [41], the L-AD produces biogas by the digestion of wastewater sludge and
animal manure. The digestion action in an L-AD typically operates at a mesophilic
temperature with a short retention time of about 15-20 days. The product of the L-AD is
an effluent with high liquid content. According to [42], the effluent of L-AD plagues the
process when considering the processing cost as only the handling cost of the effluent
comprises 30% of the operating cost. In addition to the large volume of effluent, the odor
of the effluents proves challenging when used as fertilizer in farmland. Similarly, [43]
reported that the L-AD rector requires high volume and even higher energy demand. This
disadvantages associated with L-AD tend to make the L-AD process economically
unfeasible. Therefore, a shift to an anaerobic digestion process that requires less a smaller
digester volume [18], lower energy and most importantly reduces the effluent handling
with a concomitant reduction in cost is implemented in solid state anaerobic digestion.

12
Table 2-1: Summary of Liquid State Anaerobic Digestion
Feedstock Operating conditions Reactor type Gas yield Ref
Temp MCa VS/TSb HRTc
Food waste 50oC 70% 83% 28 Batch 435 mL/g VS [44]
Swine
manure
37oC N/a 5.8% 15 CSTRd 188 mL/g VS [45]
Dairy
manure
35oC N/a 68% 31 SCSTRe 2.21 L/d [46]
a= Moisture content
b= Volatile solid/Total solid
c= Hydraulic retention time in days
d= Continuous stirred tank reactor
e=Sequential continuous stirred tank reactor
2.3.2 Solid State Anaerobic Digestion
In solid state anaerobic digestion, feedstock with a total solid content greater than
15% are used [19]. Unlike the liquid state AD process which forms a slurry or solution
with its substrate, the substrate of the SS-AD involves the formation of a bed of solid [47]
due to the solid nature of the feedstock. These processes generally occur at a thermophilic
temperature and a longer retention time of about 30-40 days. The high operating
temperature and extent of retention in the digester helps to ensure a complete degradation
of the feedstock. According to [15], the long retention time is due to slow mass transfer
operation in the SS-AD. Since the SS-AD operates with a feedstock of a low moisture
content, the residue (digestate) is suitable for use as fertilizer and is much easier to handle
compared to L-AD [18]. Also compared to L-AD, there are minimal odor challenges when
the digestate is used as fertilizer. Another advantage of the low water content of SS-AD is

13
the formation of compost-like end product that can serve as a soil amendment [41].
Comparing the performance of L-AD with SS-AD, [47] reported that an efficiently
designed SS-AD can digest more organic feedstock than the L-AD when carried out in a
digester of the same size.
The SS-AD process utilizes lignocellulosic biomass feedstock such as energy
crops, woody biomass, forest residues which has the solid content necessary for SS-AD
process. Lignocellulosic biomass contains 55-75% carbohydrates by dry weight [48].
However, the structure of the feedstock is a heterogeneous complex mixture of cellulose,
hemicellulose, and lignin which poses a challenge in the AD process. Also the particle size,
pore volume, and total surface area available for enzymatic reaction affects the anaerobic
biodegradability of lignocellulosic biomass [49]. Due to the complex nature of the SS-AD
feedstock, a pretreatment is necessary to disrupt the barriers imposed by the lignin so that
hydrolytic enzymes can penetrate and commence the hydrolysis of the feedstock. Also
according to [49], pretreatment helps to increase the surface area and the size of the pores
of the cellulose, decrease its crystallinity, and extent of polymerization. Pretreatment
methods used to treat lignocellulosic biomass before the SS-AD process are evaluated in
the following sections. The SS-AD process using different feedstocks were summarized in
table 2.2 below.

14
Table 2-2: Summary of Solid State Anaerobic Digestion
Feedstock Operating conditions Reactor
type
Gas yield Ref
Temp MCa VSb HRT
Corn Stover 37oC <10% 92.6% 30 Batch 81.2 L/kg VS [50]
Leaf Biomass 35oC N/a 95% 35 PFRd 360 L/kg TS [51]
a= Moisture content
b= Volatile solid
c= Hydraulic retention time in days
d= Plug flow reactor
2.3.3 Integrated Anaerobic Digestion (iAD)
The anaerobic digestion process whereby the effluent of the L-AD is combined with
the SS-AD feedstock gives rise to the iAD process. Generally, the L-AD effluent serves as
an inoculum that balances the microbial consortia which promotes a high methanogenic
activity [41]. Different authors have reported the improved performance of the iAD process
when lignocellulosic biomass is digested. According to [15], the use of iAD is more likely
to reduce operating cost since L-AD effluent handling is eliminated. Therefore, biogas
production via iAD seems to be the future of the AD process. Table 2-3 highlights a
summary of iAD processes.

15
Table 2-3: Summary of Integrated Anaerobic Digestion
Feedstock Operating condition Reactor type Gas yield Ref
Temp MCa VS/TSb HRTc
OFMSW & CMd 50oC 70% 83% 28 Batch 172m3CH4/t [52]
CW and POMEe 37oC N/A 5.8% 15 CSTR 188 mL/g VS [45]
SM & COf 35oC N/A N/A 40 PFR 0.3 m3/kg VS [53]
a= Moisture content
b= Volatile solid/Total solid
c= Hydraulic retention time in days
d= Continuous stirred tank reactor
e=Cow manure and POME
f= SM and cooking oil
2.4 Pretreatment Methods
Several pretreatments of lignocellulosic biomass have been performed to enhance
the biogas yield of lignocellulosic biomass. Pretreatment methods can be categorized as
either chemical or physical [48, 49] pretreatment with some pretreatment method having
both effects. Physical pretreatment methods include grinding, milling, extrusion
categorized as mechanical pretreatment [49] and other irradiation processes that includes
gamma rays, electron beams, microwaves, and ultrasound. Chemical pretreatment methods
are alkaline pretreatment, acid hydrolysis, organolosv, and fungal pretreatment. [48]
conducted an evaluation of several pretreatment methods such as lime pretreatment, dilute
acid, uncatalyzed steam explosion, liquid hot water, pH controlled hot water, and flow-
through liquid hot water. Pretreatment methods applied to different lignocellulosic biomass
have been studied with a summary of the pretreatment methods shown in table 2-4 below.

16
Table 2-4: Summary of Pretreatment methods
Pretreatment Type Agent Advantage Disadvantage Ref
Acid hydrolysis H2SO4,HCl,H3PO4 High solubilization
of hemicellulose
Corrosive [54]
Steam Explosion High Pressure
Steam
Improves
enzymatic access
Explosive
decompression
[48]
Alkaline hydrolysis NH3,CaOH,NaOH Improves
delignification of
biomass
Converts
agent into salts
[55]
Organosolv C2H5OH, C6H5OH, High solubilization
of hemicellulose
High cost [56]
2.5 Factors Affecting Biogas Yield
Biogas yield is typically affected by a combination of different factors that needs
to be maintained to ensure optimal yield of the biogas. The following factors that affect the
biogas yield are given in table 2-5 below.

17
Table 2-5: Summary of factors that affect biogas yield
Parameters Typical
conditions
Advantages Disadvantages
Temperature Mesophilic or
Thermophilic
Microbial survival Microbial death
Feed/Inoculum ratio Depends on
feedstock
Appropriate
consortium of
microbes
Drop in methane
yield
Carbon/Nitrogen ratio 15 - 20 Optimal digestion at
appropriate ratio
TAN and VFA
accumulation
2.6 Biogas Applications and Challenges
Biogas can be used industrially as a thermal source to produce heat or steam, as
fuels to drive process equipment, and in internal combustion engine to produce power
mostly as combined heat and power (CHP). With a calorific value of 21.48MJ/m3 [57]
compared to natural gas with a calorific value of 38 MJ/m3, biogas energy capacity is not
effectively utilized when directly combusted. Hence, the need for upgrading of the biogas
to a pure gas termed “biomethane”. Compression of biomethane to bioCNG is widely used
in Europe as a fuel in the national grid for electricity production [36]. According to [58],
after cleaning and conditioning, bioCNG satisfies the SAE J 1616 and engine
manufacturers fuel standard and can be used the same way as compressed natural gas.
Hence, this renewable fuel can power natural gas vehicles. Similarly, renewable diesel
fuels that can power diesel vehicles can be produced using biogas as feedstock in the GTL

18
process. Such use of biogas adheres to renewable fuels standard (RFS) which ensures that
the fuels used in the U.S has a minimum amount of renewable fuel [59]. With focus on
achieving the RFS target, routes on how to produce alternative diesel fuels via renewable
sources are sorted of which biogas to liquid fuels seem viable.
2.6.1 Biogas Upgrading
Although biogas has been proven a reliable energy source, it has been plagued by
the presence of contaminants that are corrosive, toxic and harmful to the system to which
biogas is applied. According to [37], one of the challenges encountered with biogas
application is the complex composition of biogas. As reported by several authors, the
composition of biogas produced from AD process is dependent on the feedstock and
digestion technology. Methane and carbon dioxide are the main composition of biogas with
the presence of H2S, N2, O2, NH3, siloxane, water vapor, and H2 [36-38] and even other
uncharacterized components. The presence of H2S in biogas mixture has been the most
difficult component because of its poisonous effect on catalyst. If biogas is directly
employed for the production of syngas in the presence of any metal catalyst, the catalyst
that speeds up the reaction will be halted by the poisonous action of H2S on catalyst.
Moreover, the application of biogas as a vehicle fuel or its injection in the gas line for
electricity generation requires the removal of CO2 that reduces its heating value [37, 60].
Hence, biogas upgrading is performed to remove the unwanted components of the biogas
that reduces its applicability.
Several upgrading technologies have been employed by different biogas facilities
to upgrade their biogas product in other to meet specification. Pressure swing adsorption,
Amine treatment, water scrubbing, membrane permeation, cryogenic method, and
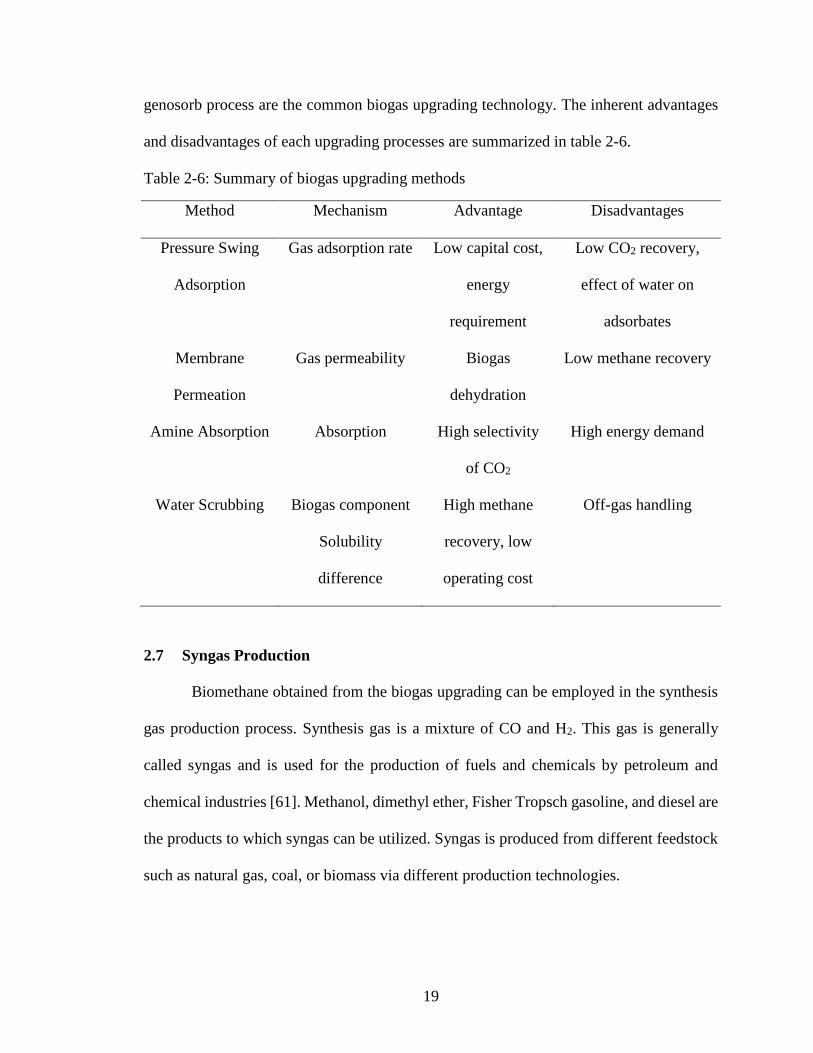
19
genosorb process are the common biogas upgrading technology. The inherent advantages
and disadvantages of each upgrading processes are summarized in table 2-6.
Table 2-6: Summary of biogas upgrading methods
Method Mechanism Advantage Disadvantages
Pressure Swing
Adsorption
Gas adsorption rate Low capital cost,
energy
requirement
Low CO2 recovery,
effect of water on
adsorbates
Membrane
Permeation
Gas permeability Biogas
dehydration
Low methane recovery
Amine Absorption Absorption High selectivity
of CO2
High energy demand
Water Scrubbing Biogas component
Solubility
difference
High methane
recovery, low
operating cost
Off-gas handling
2.7 Syngas Production
Biomethane obtained from the biogas upgrading can be employed in the synthesis
gas production process. Synthesis gas is a mixture of CO and H2. This gas is generally
called syngas and is used for the production of fuels and chemicals by petroleum and
chemical industries [61]. Methanol, dimethyl ether, Fisher Tropsch gasoline, and diesel are
the products to which syngas can be utilized. Syngas is produced from different feedstock
such as natural gas, coal, or biomass via different production technologies.
20
Production of syngas from natural gas occurs by reforming the natural gas in the
presence of a catalyst. Different reforming processes are utilized for the production of
syngas. Steam methane reforming (SMR), partial oxidation reforming (POR), dry
reforming (DR), auto thermal reforming (ATR), and combined reforming processes are the
well-known reforming processes [62-64] that have been employed by the petroleum and
pharmaceutical industries in a product development pathways [61].
Syngas is also produced from coal and biomass by gasification. Unlike the syngas
produced from natural gas, the syngas produced from gasification of coal or biomass
contains lots of impurities such as tar, ash and particulate matter [11, 14]. This increased
amount of impurities creates the need for syngas cleaning and conditioning which adds to
the capital and operating cost of the plant.
It is necessary to know that each of the reforming processes has its inherent
challenges due to the reaction and operating conditions, cost involvement, and
environmental issues. Therefore appropriate choice of syngas production process affects
the overall efficiency of GTL process [65]. As it is evident that the syngas production
contributes 60% to the overall liquid fuels production cost [65], good engineering practice
decision is generally applied in the choice of syngas production to use. In addition to the
cost of syngas formation, H2/CO ratio which affects the downstream formation of liquid
fuels helps in the decision making process of the choice of reforming.
The various reforming processes were reviewed to highlight each process reaction,
operating conditions, typical catalyst choice, and H2/CO ratio as tabulated in 2-7.

21
Table 2-7: Summary of Reforming Processes
Reforming
type
Catalyst Reaction Operating Condition H2/CO
Steam
Reforming
Ni/MgAl2O3 CH4 + H2O → CO + 3H2
700-1000oC &
15-30bar
≈ 3
Autothermal Ni/Al2O3 CH4 + 3
2O2 → CO + 2H2O
CH4 + H2O ↔ CO + 3H2
CO + H2O ↔ CO2 + H2
2000oC:
Combustion Zone
1000-1200oC:
Catalytic zone
Partial
Oxidation
CH4 + 0.5O2 → CO + 2H2 1200-1500o C &
50-70bar
≈ 1.7
Dry
Reforming
Pt, Pd, Ni,
Co, Ru, Rh,
Ire
CH4 + CO2 → 2CO + 2H2
700-900oC &
1-14bar
≈ 1
2.8 Fischer Tropsch Process
The quest for alternative forms of liquid fuels led to the development of Fischer-
Tropsch process. Initial attempt was made by Sabatier and Sanderens in 1902 to synthesize
hydrocarbons by the hydrogenating of carbon monoxide [10]. In 1920, Fischer and Trospch
devised a mechanism known as synthol process that produced rich oxygenated product
when carbon monoxide was catalytically converted in the presence of iron (Fe) catalyst
[10, 66]. This process was then termed the Fischer-Tropsch process. The development of
the F-T process brought about a promising pathway for the production of fuels from

22
biomass, natural gas and coal [61] which serves as carbon sources. According to [32], the
wide range of feedstock for the F-T process, biomass, natural gas and coal, enhances
transition from energy source which makes the process sustainable.
The U.S has large amount of natural gas, biomass and coal deposit that can be
respectively utilized for GTL, BTL and CTL, thus increasing the nation’s energy security
and in turn reduce dependence on petroleum importation [6]. Sasol in South Africa has
been the world largest CTL company which made them less dependent on crude oil derived
fuels in addition to the economic benefits of the process [32]. Currently, Chevron, Shell,
Syntroleum, even ConocoPhilips and Total are working towards the technology; GTL and
CTL [10, 32]
Fischer-Tropsch process employs a hydrogenation mechanism to convert carbon
monoxide (CO) and hydrogen (H2) to desirable and undesirable hydrocarbons as illustrated
in the following reaction below [67].
nCO + (2n+1)H2 → CnH2n+2 + nH2O…………………………….4
Conversion of the syngas to liquid fuels in the F-T process is a complex reaction.
The target product of Fischer-Tropsch process is the formation of only the straight-chain
aliphatic hydrocarbons although hydrocarbons of the branched chain type are inevitably
formed as well [68] and the specific products are given below:
Paraffins Synthesis: nCO + (2n+1) H2 ↔ CnH2n+2+ nH2O…........................5
Olefins Synthesis: nCO + 2nH2 ↔ Cn H2n + nH2O……………………….6
Alcohols Synthesis: nCO + 2nH2 ↔ Cn H2n+1OH + (n-1) H2O……………7
In addition to the reaction products, other side products are formed during the
reaction. These products are usually undesirable and efforts are made to reduce and/or

23
minimize the occurrence of these reactions. The following undesired reactions below takes
place during the FT process:
Water-gas shift reaction: CO + H2O ↔ CO2 + H2…………………………………………………8
Carbonaceous materials: (x + (y/2)) H2 + xCO ↔ CxHy + xH2O.......................9
Boudouard reaction: CO + CO ↔ C + CO2…............................................................................10
Bulk carbide formation: yCO + xM ↔ MxOy + yC….........................................11
Catalyst oxidation: yCO2 + xM ↔ MxOy + yCO………………………….12
Temperature, composition of feed gas, catalyst type and associated promoters, and
pressure are the known variables that influence the product formation [69].The operating
temperature and pressure for the Fischer Tropsch synthesis are typically 200-340oC and
25-60bar [70]. The type and activity of catalyst used during the Fischer-Tropsch synthesis
process affects the rate of reaction and likewise the conversion of syngas [71]. The
following range of products are obtained during the Fisher Tropsch synthesis; light
hydrocarbons methane (CH4), ethane (C2H4) and ethane (C2H5), LPG (C3–C4, propane and
butane), gasoline (C5–C12), diesel fuel (C13–C22), and light and waxes (C23–C33) range of
products.
Primarily, a mole of CO in the presence of cobalt or iron catalyst reacts with two
moles of H2 to form a chain of hydrocarbon. According to [10], this is a polymerization
reaction where the CO is adsorbed to the surface of the catalyst, followed by the initiation
of the cleaving of the C-O bond and the formation of -CH2- chain. The reaction completes
when the growth in chain length terminates and the product desorbs from the catalyst. Basic
F-T reaction is generally given by the equation:
CO + 2H2 → - (CH2) - + H2O ∆H = -40 kcal/gmol CO…................13

24
where:
- (CH2) – = Hydrocarbon chain extension.
The extent of the formation of the hydrocarbon chain is determined by the
Anderson-Schluz-Flory distribution [72]. Since the product selectivity during the F-T
process is determined by the ability of a catalyst to maintain the chain growth against the
chain termination, the polymerization rates are independent of the products formed. The
Anderson-Schulz-Flory model is represented by the equation
𝑊𝑛 = 𝑛(1 − 𝛼)2𝛼𝑛−1…......................................................14
Where
𝑊𝑛= mass fraction of product with n carbon atoms
𝛼 = probability of chain growth
(1 − 𝛼) = probability of chain termination
Assuming the probability of chain growth to be independent of chain length, a plot of
𝐿𝑜𝑔 (𝑊𝑛
𝑛) against 𝑛 gives a slope equals to the chain probability value,𝛼, which is typically
low for gasoline products and high (0.8-0.9) for diesel products.
𝐿𝑜𝑔 (𝑊𝑛
𝑛) = 𝑛𝑙𝑜𝑔 𝛼 + constant…................................................15

25
Figure 2-2: Anderson-Schulz-Flory chain growth distribution
The chain growth probability is also calculated using the equation developed by
[73] as illustrated below by the partial pressure and temperature interaction.
𝛼𝐴𝑆𝐹 = [0.2332𝑦𝐶𝑂
𝑦𝐻2
+ 0.663] [1 − 0.0039 (𝑇 − 533)]…………………….16
𝑦𝐶𝑂= partial pressure of CO
𝑦𝐻2= partial pressure of H2
T= temperature in K
The selectivity of the hydrocarbon product Sc5+ for cobalt catalyst has been
empirically determined by with a correlation showing the relationship between
temperature, pressure, and alpha value. The selectivity and alpha value relationship are
shown by equations 17 and 18 below
Sc5+ = 1.7 - 0.0024T - 0.088[H2/CO] + 0.18([H2] + [CO]) + 0.0078Ptotal........................17
α = 0.75-0.373*(-log (Sc5+)) + 0.25 Sc5+……………………………………………….18
26
2.9 Fischer Tropsch Catalysts
The choice of a catalyst over another during the Fischer Tropsch process is a
challenging decision to be made as it depends on several factors. Cobalt (Co), potassium
(K), iron (Fe) and ruthenium (Ru) are amongst the numerous catalysts used for Fischer-
Tropsch synthesis [66]. Due to the better activity, considerate high life expectancy and low
cost, cobalt and iron catalysts are preferentially considered for the gas to liquid process
[61]. But according to [74], there is still no catalyst developed for the F-T process that can
handle the challenge of the lifetime, activity and selectivity of the products.
The flexibility of the process variables, selectivity to the lower olefins, and higher
conversion are the characteristics exhibited by Fe-based catalyst [75]. It is used in the high
temperature FT (HTFT) process that operates at a temperature of about 300-340oC. Fe
catalyst proves a good resistance to sulphur, produces more olefin and alcohols and is
affordable [69]. One of the limitations of a Fe catalyst is the short life spans of 8 weeks
when used for commercial F-T application [76].
In as much as cobalt (Co) catalyst is 1000 times more expensive than Fe, it is more
selective, efficient, less deactivated by water since water is an F-T synthesis product and
hence has longer life span [67]. Dry et al., posited that for better activity, the cost of cobalt
catalyst should not affect its use [77]. Co catalyst is more reactive for hydrogenation and
when compared to Fe catalyst yields less unsaturated hydrocarbons and alcohols [78].
2.10 Fischer Tropsch Reactor
Over the years, the industrial and commercial reactor employed for the F-T process
has been the fluidized bed and multi-tubular fixed-bed reactors [61]. In the late nineteenth
century, the 3-phase slurry continuous stirred tank reactor has been investigated and

27
proposed as a feasible reactor for F-T synthesis process [67]. Efficient heat removal
produced during the exothermic F-T reactions and the solvent action of the “inert” are one
of the advantage of the slurry reactor being its greater ability for [67]. The slower
gas/liquid-solid interface diffusion rates obtained in comparison to both the fixed and
fluidized bed reactors pose a disadvantage to the slurry reactor. Advances in the Fischer-
Trospch process is in the development of new reactors for the technology. Fixed fluidized
bed (FFB), circulating (synthol) fluidized bed (CFB), advanced synthol reactor, and multi-
tubular fixed bed reactors were reported by [10] as the modification in the process
technology as shown in figure 2-3. The design of the new reactor for the F-T process has
resulted to a high capacity reactor and an increase in conversion efficiency to the order of
70% [10]. Replacing the circulating fluidized bed reactor, the fixed bed reactor has better
heat removal, thermal efficiency and lower pressure drop with a scale-up trend to 20,000
bpd [79]. For the same reactor capacity, the FFB can be produced at half the cost and size
of CFB. The challenge of catalyst separation have been reduced by the use of slurry bed
reactor which is 75% less than the cost of multi-tubular fixed bed reactor [10].

28
Figure 2-3: Fischer-Tropsch Reactors

29
2.11 Techno-Economic Assessment
Gas to liquid (GTL), biomass to liquid (BTL) and coal to liquid (CTL) processes
need to be economically feasible in order to serve as a supplement or even replacement
and/or substitute to the conventional fossil fuel pathway. Therefore, economic assessment
is conducted to determine the cost analysis of the product.
An Nth plant assessment of the biorefinery for the production of liquid fuels via
biomass is promising since these technologies in anticipation prove to be a future of the
bioenergy. Different technological approaches have been evaluated by several researchers
with focus on process and cost improvements. Of the techno-economic assessment of the
GTL, BTL and CTL plants carried out by different authors, the estimated capital
investment cost has been between $191 – $541 million [11-13]. The wide range difference
in capital investment is due to difference in feedstock price, plant capacity, year value of
money, process requirement, and cost estimation assumptions.
[11] performed an economic feasibility of biomass integrated gasification Fischer-
Tropsch (BIG-FT) process using poplar wood of purchase cost of US $2/GJ as feedstock.
The plant operation time was 8000 h/year with a capital investment of $380 million and an
operating and maintenance cost of $14 million per annum. The process involved in his
evaluation is the advanced high temperature gas cleaning which is not commercially
available. According to him, component level cost estimation was used which was obtained
by consultation with manufacturers (vendor quote), literature, and communication with
experts. For the calculation of the installed cost, the free on-board costs were multiplied by
the installation factor obtained from [80] and industry communication. The capacity of
each unit operation was obtained using mass and energy balance of the Aspen Plus model

30
and was scaled using a scaling exponent (n) between 0.6 and 0.8. The investment parameter
used were straightforward discounting, interest rate of 10%, and depreciation period of 15
years. Production cost of the F-T liquid fuel with a hydrocracker was calculated to be
between $13 and $30/GJ for 60% and 80% conversion scenarios respectively assuming an
electric power price of $0.057/kWh. The addition of a hydrocracker with an estimated
installed cost of $8.1 per 2000bbl/day increased the liquid fuel production cost by about
5%. Performing a sensitivity analysis, he observed the high effect of electricity on the
overall process. The production cost of $14/GJ F-T liquid was for a short term project but
comparing the long term effect of the plant, he observed that the advancement in
technology will reduce the capital cost (contributed 50% of original production cost), the
operating and manufacturing cost, feedstock cost, and the process energy efficiency.
Hence, the production cost for the F-T liquid dropped from $14 to $9/GJ.
Economic assessment of Fischer Tropsch (FT) diesel produced from the
gasification of wood was determined by [12]. The investment parameters used for
estimating the plant cost were similar to that of [11] in areas of interest rate and operating
time. However, he assumed a feedstock cost of $3/GJ, electricity cost of $0.03/kWh, and
economic and technical lifetime of 15 and 25 years respectively. The annual operating costs
were estimated as a percentage of the total capital investment. Estimating the total capital
investment, [12] used the factored estimation method which has an accuracy of ± 30%. He
applied the scale up method to estimate equipment costs for similar unit operations when
the maximum capacity was not exceeded. Calculating the total capital investment, he
obtained a value of €286 million which is 1.7 times higher than that reported by [23]. He

31
attributed the difference in cost to the gasifier and air separation unit used in his process of
which without pre-treatment and gasifier, the cost will be about €93 million.
Corn stover (2000 metric tons/day) feedstock was used by [14] to produce F-T
liquid fuels alongside excess electricity in two temperature (HT & LT) scenarios of which
he estimated a capital investment of $610 and $500 with a corresponding product value of
$4.3/GGE and $4.8/GGE respectively. Comparing his product value with that obtained by
[11] of approximately similar plant capacity and process technology, it can be inferred that
the difference lies in the time value of money at which the estimation was performed,
technology difference and most importantly, the investment parameter assumptions.
2.12 Life Cycle Assessment
Global liquid fuels consumption for the everyday transportation activities of
humans are highly indispensable. Petroleum derived fuels have been the predominate
source of transportation fuel contributing 92% of transportation fuels [81]. In 2013, the
monthly energy review of the United States Energy Information Administration (EIA)
reported an annual petroleum consumption of 203 million gallons by the transport sector
[82]. This makes the transportation sector the highest consumer of petroleum derived fuel
in the United States [82] as evident in the over 250 million registered vehicles in the U.S
reported by the Research and Innovative Technology Administration of the Department of
Transportation [83]. With rapid industrial, economic, and improved standard of living,
more vehicles are acquired on daily basis which contributes to petroleum fuel consumption
in the United States. The increase in the number of vehicles results to a higher demand of
petroleum fuel to power the increasing number of vehicles of which the security of the
fossil fuel is not guaranteed.

32
Traditionally, petroleum fuels are produced by exploration and production (E&P)
companies through the process of hydrocarbon extraction from beneath the earth crust. The
extracted product is a mixture of gas, oil, and water which are processed in their facility in
a train of separators and compressors into the individual constituents. The crude oil is then
sent to the refinery to obtain the different fractions of petroleum fuels. The combustion of
this fuel leads to emissions of pollutants such as carbon dioxide (CO2), volatile organic
compounds (VOC), nitrogen oxides (NOx), sulphur dioxide (SO2) and other pollutants
which primarily is as a result of the presence of sulphur in the fuel [84]. In the U.S, the
greenhouse gas emissions from the transportation sector is the second highest source of
GHG after the power sector [85, 86]. Increased climate change caused by the use of fossil
derived fossils has led to the search for alternative ways whereby the emissions as a result
of the production and use of fossil derived fuels will be reduced.
As a remedy to the environmental impacts fossil energy use, renewable energy
sources are tipped to mitigate climate change impact due to the biogenic nature of its
emissions. Therefore, reduction in energy use, increase in energy efficiency and carbon
sequestration, and decarbonization of energy supply by renewable energy sources are
advantages which the renewable energy tends to offer [87]. However, these assertions do
not have any proven facts and have raised many concerns about its potential to reduce
In the past, [6, 28-33] have all conducted an environmental assessment on GTL,
BTL, and petroleum diesel and gasoline products to evaluate the product performance on
the environment. Evaluating the life cycle assessment of petroleum products, [28] opined
in his assessment that the GHG of crude oil extraction, processing and storage contributed
4 - 12% GHG’s more than the actual fuel combustion. For GTL and BTL process, [30]

33
determined from his assessment that the emissions associated with transportation can be
reduced by 28 – 69% using BTL from straw or forest wood. Also, [32] reported that
vehicles operated with BTL can result to an emission of 32 – 63g CO2/km but can be
reduced to negative if carbon sequestration was employed. Reduction of GHG can be
achieved according to [6] by substitution method of allocation and even more when GTL
fuels are mixed with heavy crude oil. But on the contrary, [29] conducted the GHG
emissions of GTL diesel fuel focusing on the GTL synthesis efficiency and compared it
with conventional fuels using life cycle analysis (LCA). He observed that the GHG
emissions of GTL fuel process was higher than the petroleum diesel at a GTL synthesis
efficiency less than 75% with an improvement in emissions of GTL fuels at a synthesis
efficiency of 75% or greater. Performing a cradle to grave LCA work on the hydrogenation-
derived renewable diesel (HDRD) using three different biomass (whole tree, forest
residues, and agricultural residues), a GHG reduction up to 61.1% compared to fossil
derived fossil was estimated [88]. In the light of these conflicting results, the life cycle
assessment for the production of drop-in fuels from the miscanthus generated biogas will
be conducted to effectively evaluate and justify the environmental friendliness of the
renewable fuels process.
2.13 Literature Summary
The overall study of the production of liquid fuels have been reviewed with specifics
on the feasibility of biogas as a potential feedstock for liquid fuels production.
Biogas with a 60% methane content is proposed to be a possible replacement or co-feed
for the production of renewable fuels via Fischer-Tropsch synthesis with potential
reduction in the greenhouse gas (GHG) emission.

34
In addition to the conventional liquid state anaerobic digestion process,
lignocellulosic biomass is used as feedstock in a solid state anaerobic digester (SS-AD) to
produce biogas which is to be further converted to liquid fuels via Fischer-Tropsch
synthesis. Biogas production from lignocellulosic biomass can be challenging due to
inherent characteristics of the feedstock. Lignocellulosic biomass is composed of complex
carbohydrate structure which typically does not promote the anaerobic digestion process.
Hence, a breakdown of the structure to cellulose, hemicellulose and lignin is normally
required in order to enhance the yield of biogas [38]. Pretreatment processes such as fungal
pretreatment, wet oxidation, acid hydrolysis have been used in pretreating lignocellulosic
biomass prior to AD process [89, 90]. Similarly, the carbon to nitrogen (C/N) ratio of
lignocellulosic biomass is high than the optimum value of 25 [91].
Biogas methane potential from lignocellulosic biomass such as miscanthus have
been reported to be within the range of 0.17-0.218 m3/kg VS [92]. The produced biogas
can be cleaned via several upgrading processes [36, 37, 60] which the high pressure water
scrubbing (HPWS) process proves to be the most economical and efficient in terms of
biogas methane recovery [93].
The cleaned biogas solely can be used as feed for the liquid fuels production via F-
T synthesis or co-fed with natural gas in an existing GTL plant such as the Shell Bintulu’s
GTL plant in Malaysia [94]. The process of converting the cleaned biogas commences
with the catalytic conversion of the methane in biogas to syngas (steam methane reforming)
or the non-catalytic process (partial oxidation) and several other reforming processes
depending on the desired syngas output composition [10, 23].

35
Liquid fuels production can be carried out in diverse reactors operating at 200 –
340oC temperatures in the presence of different types of catalysts (Fe or Co) depending on
the selectivity of the final liquid fuels fraction (gasoline or diesel) [61, 64]. A temperature
of 340oC in a slurry reactor packed with Fe catalyst is typically used for gasoline fraction
fuels while Co catalyst in slurry phase reactor operating at 200oC offers a high selectivity
for the diesel fuel fraction [10]. Another key parameter that determines the length of
hydrocarbon formation is the probability of chain growth, α, which varies from 0.1-1 [70].
The techno-economic feasibility of the process reviewed showed that no available
literature data on the process and economics of the biogas to liquid (BgTL) fuels is
currently in existence which shows the novelty of this work. However, several reported
works on the renewable liquid fuels production have focused on the biomass
thermochemical conversion. Total capital investment (TCI) ranging from $191 – $541
million have been reported for different processes using different feedstocks [11-13] with
a minimum selling price of F-T fuels of up to $4.3/GGE [14]. Such estimated minimum
selling price is highly dependent on certain process and plant assumptions which are plant
specific.
Environmental concerns in terms of greenhouse gas emission of the liquid fuels
production using renewable feedstocks were ascertained. Life cycle analysis studies of the
greenhouse gas emission (GHG) of various renewable derived fuels were conducted to
determine the extent of climate change savings offered by renewables. GHG savings of up
to 61.1% lower than diesel obtained from conventional refinery was estimated when
renewable diesel was produced from agricultural residue in a cradle to grave life cycle
analysis [88].

36
Overall, the review of the processes involved in the liquid fuels production via F-
T synthesis, techno-economic assessment of F-T liquid fuels production, and the
environmental impact assessment of the renewable fuels production served as the
background, references for certain data, and rational in the F-T fuels biogas route
employed in this thesis work.

37
CHAPTER 3
3 TECHNO-ECONOMIC ASSESSMENT OF BIOGAS TO LIQUID FUELS
CONVERSION TECHNOLOGY VIA FISHER-TROPSCH SYNTHESIS1
1 Okeke, I.J., and Sudhagar Mani. To be submitted to the Biofuels, Bioproducts &
Biorefining Journal

38
Abstract
Contrary to the recent biomass gasification to liquid fuels production, a unique
biogas to drop-in fuels plant was simulated using Aspen Plus V8.8. With the aid of the
process model, the mass and energy balance was estimated which was employed in the
techno-economic analysis of BgTL model. A base case biogas feed capacity of 2000Nm3/h
was assumed which was upgraded to produce biomethane, reformed to yield syngas,
catalytically converted to F-T syncrude, and finally upgraded to generate drop-in fuels.
Electricity and steam were produced within this process utilizing the excess unconverted
syngas and integration approach (pinch points) respectively while the excess electricity
was sold. For the specified annual feed capacity, a total production capacity of 4.6 million
gallons per annum of F-T drop-in fuels was achieved resulting to a 51% yield in mass basis.
Calculating the discounted cash flow rate of return (DCFOROR) for this Nth plant (100%
equity financed) with the estimated capital and operating costs, the least selling price of
the F-T drop-in fuels was $5.99/gal ($5.59/GGE). Different biogas plant feed capacity was
explored to determine its effect on the F-T drop-in fuels selling price. Finally, sensitivity
analysis on the base case model was performed by varying critical process and cost
parameters in order to ascertain their effects on the least selling price of the drop-in fuels.
Keywords: Biogas, F-T drop-in fuels, Aspen Plus, Process model, Plant Capacity, Syngas

39
3.1 Introduction
The global demand for transportation fuels is a “conditio sine qua non” for
everyday living in the 21st century. Sequel to aforementioned, there is a high global
demand for these fuels that oil importation can be resorted to meet the domestic fuel
needs of a country. The U.S Energy Information Administration [82] have reported a
high consumption of petroleum products from the transportation sector consuming
approximately 14 million barrels per day. The increase in global population and relative
increase in standard of living of people from developing country can further fuel the
demand for transportation fuels. High global dependencies on petroleum fuels could
cause fuel price instability in addition to increasing the greenhouse gas (GHG) emissions.
Because of the increased interests in environmental sustainability, countries are
making specific rules to accommodate the use of petroleum fuels but reduce the extent of
emissions associated with its combustion. Hence, the U.S government in the Energy
Independent and Security Act (EISA) enacted the renewable fuels standard (RFS) which
regulates a number of renewable fuels blend in liquid transportation fuels [95]. Ethanol
produced from corn grain, corn stover, switchgrass, etc. has been blended with gasoline
to achieve the RFS target. In 2015, annual ethanol production in the United States has
reached to about 14.8 million gallons with a world annual ethanol production of 25.68
million gallons [96]. On the other hand, lignocellulosic feedstock and other sources of
unutilized organic sources (e.g. MSW, Food Waste and Animal Manures) can open a new
pathway to produce transportation fuels via anaerobically generated biogas into drop-in
liquid fuels.

40
Anaerobic digestion is a well-studied commercial technology to produce biogas
from waste organic sources that can further be converted to produce compressed natural
gas (Bio-CNG), and heat and power generation. A recent study [7] by National
Renewable Energy Laboratory (NREL) reported that approximately 7.9 million tonnes of
methane can be produced annually from organic waste sources in the U.S.
Lignocellulosic biomass such as agricultural crop residues and energy crops can be either
co-digested with organic wastes [8] or dry digested to produce biogas. Currently, a
LemvigBiogas plant in Europe co-digests liquid and solid feedstocks that produce 10.2
million Nm3 per annum of biogas[97]. This large amount of biogas from a single biogas
plant illustrates the potential of an AD technology in producing huge volumes of biogas
that can serve wide range of applications namely: a feedstock for both domestic and
industrial possesses and production of multiple fuels and chemicals.
Biogas is a mixture of methane (40-60%) and carbon dioxide (30-40%) with other
impurities such as H2S, NH3, O2, N2, etc. depending on the type of feedstock [37, 98].
Biogas in its raw form can be utilized in an internal combustion engine, to produce power
and heat generation, cooking applications [99]. An upgraded form of biogas, biomethane,
can be used as a substitute for natural gas or further converted in to drop-in diesel or
gasoline fuels (biogas-to-liquid, BgTL) to meet both U.S and global transportation fuel
demands [13]. However, the technical and economic feasibilities of this technology need
to be further investigated. A study on biogas cleaning to remove CO2 and H2S has been
experimentally carried out by [100] in a packed column reactor to achieve a 90% CO2
reduction efficiency and H2S reduction below detectable limit with a chemical solvents
such as NaOH, Ca(OH)2, monoethanolamine (MEA). Although the process was

41
technically feasible, the economic aspect of this cleaning approach was high due to
solvent cost, solvent regeneration challenges, and stability. However, high pressure water
scrubbing (HPWS) is a commercially employed biogas cleaning method with an effective
cost US$0.22 per Nm3 of biogas upgraded (US $ 2015), 94% yield, and a biogas purity of
98% [93]. A Kristianstad biogas plant located in Sweden processes about 70,000 tonnes
of organic wastes (50% organic manure, 45% food waste, and 5% household) [99] with
an attached biogas water scrubbing facility that produces 50,000 MWh/yr upgraded
biogas consisting of 97% methane that is primarily used as vehicle fuels [101]. The
upgraded biogas can be reformed into syngas using steam and further converted into
liquid fuels or power. A recent experimental study by Rakass et al., [102] conducted a
steam reforming of methane in the presence of unsupported Ni catalyst that achieved a
98% conversion of methane at 700oC into syngas with high H2 yield and CO selectivity.
Other studies on the steam reforming of methane has reported a complete conversion of
methane at a high steam to carbon (S/C) ratio of no less than 4 [103] in the presence of
Ni/Al2O3 catalyst. The produced syngas can be subjected to F-T synthesis to produce
liquid hydrocarbons operating at 473K and 20 bar in the presence of cobalt catalyst with
high conversion of H2 and CO at gas hourly space velocity (GHSV) of about 37 Nml.gcat-
1.h-1.
Gas-to-liquid (GTL) and coal-to-liquid (CTL) process technologies are
established liquid fuels production processes operated by different companies such as
Sasol, Shell, Syntroleum, and ExxonMobil in various parts of the world. Exploring the
different GTL plants, Greene [104] reported the different plant capacity and capital
investments by various companies that aimed at estimating the project profitability.
42
Similar to the GTL and CTL, thermochemical conversion of biomass to liquid fuels
production has gained huge attention in the recent years. The pathways such as biomass-
to-liquid (BTL), biomass-to-butanol (BTB), biomass-to-ethanol (BTE), and biomass-to-
methanol (BTM) fuels processes have been studied recently as possible commercial
routes to produce liquid biofuels [11, 13, 14, 20, 23, 105]. Considering the economic
aspect of the liquid fuels processes, a techno-economic aseesement (TEA) study on
natural gas to liquid (GTL) fuels plant conducted by Betchel [23] reported that 44,940
BPD of liquid fuels could be produced from 412 MMSCF/day of natural gas with a total
capital investment of $1842.5 milllion (US $ 1993). Williams et al., [20] conducted a
TEA of a 3000 tonnes/day biomass to methanol plant estimated a methanol selling price
of $12/GJ ($1.42/GGE) for a US $1995 cost year. Similarly, a techno-economic analysis
performed by Phillips [106] for ethanol production from hybrid poplar wood with a feed
plant capacity of 2000 tonnes/day estimated a minimum selling price of $1.01/gal
($1.49/GGE). Moreso, Tijmensen et al., [11] estimated a minimum selling price of $9/GJ
of F-T fuels from an 80 tonnes/h (1741 tonne/day) poplar wood plant worth $380 million
(US $1999) in capital investment. The cost analysis of 1327 tonnes/yr of switchgrass
biomass to F-T fuels (gasoline and diesel) studied by Larson et al., [13] produced 3897
BPD of F-T fuels with a capital investment of $541 million (without spares) (US $ 2003)
which was discounted to attain a fuel plant gate cost of $15.25/GJ. In 2010, the National
Renewable Energy Laboratory (NREL) reported an economic-study of a 2000 tonnes/day
corn stover to F-T fuels plant and estimated a product value of $4.80/GGE and
$4.30/GGE respectively in a low and high temperature scenarios with a total capital
investment (TCI) of $498 million and $606 million (US $2007) respectively [14]. Finally,

43
Okoli et al., [107] carried out an economic study of butanol liquid fuel production from a
75 tonnes/h pine woody biomass plant with a TCI of $357 million (US $2012) and a
minimum butanol selling price of $0.83/L. Although these biomass conversion routes are
promising for liquid fuels production, limited study has been published on the techno-
economic feasibility of biogas to liquid fuels production route and the interrelationship
between the plant size and capital investment.
As already stated, biogas can be produced from anaerobic digestion of
lignocellulosic biomass which can be further converted to drop-in fuels. Hence, drop-in-
biofuels such as renewable diesel and gasoline can also be produced not only via the
thermochemical conversion (gasification) of lignocellulosic biomass but also via
biochemical conversion (anaerobic digestion) of biomass. By and large, these conversion
routes are the future of green/renewable fuels production. However, each operating routes
has its inherent advantages and disadvantages. Focusing on the liquid transportation fuels
from biomass gasification, the economic feasibility of the process can be of doubt given
the high capital cost of the process technology. For instance, biomass feedstock are
typically preprocessed (screened, dried and size reduced) [80] upstream prior to
downstream processing. And the work of Tijmensen et al., [11] estimated a preprocessing
operation cost that contributed the highest installed cost (21%) compared with that of
other process operations. In addition to the high gasifier cost, the presence of
contaminants such as particulates, tars, alkali compounds [11] in the biomass-gasified
syngas negatively affects the downstream process and poisons the catalysts [10] if not
removed. Boerrigter et al., [108] reported that the technology in achieving biomass-
gasified syngas cleaning and conditioning processes possess a challenge in the liquid
44
fuels production pathway of which several authors [13, 14, 109] have estimated a high
installed cost for those unit operations. Contrary to the challenges associated with the
biomass gasification route, biogas reforming route has lower capital cost, less impurities
and no further capital intensive investment after reforming due to the purity level of
biomethane. Although biomass gasification route is relatively expensive, the rate of
conversion of biomass to syngas is high when compared with biomass to biogas prior to
biogas reforming. This high conversion achieved in biomass gasification route is an
inherent advantage when compared with biogas reforming route where a retention time of
at least 28 days is required to produce biogas prior to reforming. Nevertheless, given the
proven technology in converting solid organic matter either as a standalone feed or in an
integrated anaerobic digester (iAD), biogas production challenges have been considerably
addressed.
Therefore, the main objectives of this paper is to develop a process simulation
model to produce drop-in-biofuels from biogas via Fischer-Tropsch synthesis and to
conduct a detailed techno-economic assessment of biogas to liquid fuels technology to
estimate capital investment, operating cost and minimum selling price of biofuels.

45
3.2 Methodology
3.2.1 Process model description
A baseline Biogas to Liquid (BgTL) fuels production technology via F-T synthesis
as shown in Figure 1 was developed with a biogas processing capacity of 2000Nm3/h that
could be delivered from a large scale anaerobic digestion plant. [97]
Figure 3-1: Block flow diagram of the biogas to liquid fuels (BgTL) process technology
Raw biogas from an anaerobic digestion plant consists of mainly CH4, and CO2,
and trace amounts of H2S, N2, O2 and saturated water vapors and serves as a feedstock for
producing drop-in diesel fuel. The presence of trace gases and carbon dioxides should be
removed or stripped to enhance downstream conversion process. In this study, it was sent
to the biogas upgrading section of the plant with the overall goal of removing the impurities
(CO2 and H2S) present in the biogas stream which affects the downstream process [10].
The upgrading approach employed for the biogas cleaning is the commercial high pressure
water scrubbing process [36, 60] which produces biomethane with 97% methane
composition. The biomethane (cleaned biogas) product was sent to the syngas production
area where two reforming processes (steam and partial oxidation reforming) were

46
employed in order to attain the desired syngas ratio [23] and maintain an energy efficient
syngas production [110]. So, the biomethane stream was split and sent to the steam and
partial oxidation reforming processes that produces syngas of different compositions. As
the downstream liquid fuels production requires a hydrogen to carbon monoxide ratio
(H2/CO=2), the syngas products of the two processes were mixed and then cooled to
remove excess water in the syngas before it was sent to the F-T synthesis process. Catalytic
conversion of the syngas feed occurred in a low temperature slurry phase reactor in the
presence of cobalt catalyst to yield F-T syncrude with high selectivity for the heavy chain
fractions due to the probability of chain growth used for this model. The F-T syncrude
undergoes product upgrading to obtain the different fuels fractions. Hydrocracking,
hydrotreating, and distillation and separation were the upgrading operations that the
syncrude mixture was subjected to obtain the desired final products of drop-in fuels
fractions: LPG, gasoline, and diesel. Process steam was generated using the excess heat
produced by exothermic reactions in certain processes. The unconverted methane and
syngas were combusted to generate electricity through a combined cycle (gas and steam
turbine) to meet internal electricity demand and the excess electricity was sold to the grid.
3.2.2 Process Design and Modeling
Our process design and modeling approach for the BgTL conversion technology
used the optimal operating conditions from industry data and relevant literature sources
using an ASPEN Plus simulation platform. The raw biogas composition was defined
based on various literature sources as shown in Table 3-1.

47
Table 3-1: Raw biogas composition
Biogas
Constituents Unit
Monnet
(2003)
[20]
Appari
(2014)
[21]
Persson et
al (2009) [9]
Dirkse
(2007)
[12]
Present
work Aspen
Model
Methane Vol
% 55-70 50-75 53-70 60-70 60
Carbon
dioxide
Vol
% 30-45 25-50 30-47 30-40 37.5
Nitrogen Vol
% 0-2 0-10 0.2 <1 0.5
Hydrogen
sulphide ppm ~500 0-300 <1000 10-4000 400
Oxygen Vol
% 0 0 <0.2 0.2
Water RH
% 0 0 0 100 0.0176
Constituents
The raw biogas also consists of sediments and dust particles that should be
separated using a settling tank prior to the upgrading process [30]. Two isentropic
compressors were designed to operate at 2 and 8 bars respectively in order the satisfy the
pressure demands on the system. And each of these two compressor outlet were
connected to a 20oC TEMA coolers so as to control the temperature of the process. The
raw biogas existing the settling tank was then passed through series of compressors and
coolers that brought its temperature and pressure to that of the absorber packed tower
operating at 20oC and 8 bar [60]. The absorber and stripping columns are counter current
columns designed with a plastic intalox structured packed bed that enhanced mass
transfer operation in the gas and liquid phases when they are in contact as a result of their
interaction. This choice of packing material is due to the corrosive nature of the
contaminants in the gas as the plastic intalox packing is resistant to corrosion, has
minimum liquid holdup and causes lower pressure drop compared to other packing
materials [31]. Non-random two-liquid (NRTL) with Henry’s constant was used as the

48
activity coefficient for the property method calculations. The solubility of biogas
mixtures in water which occurred in the absorption column was estimated by Henry’s law
which is an intrinsic parameter of the property method used to simulate the biogas
upgrading section of the plant. The loss of methane during the upgrading process was
minimized by dropping the pressure of the solute-rich water stream to 2 bar in the flash
drum before the recycling and stripping operation [60]. The top product of the flash drum
containing some methane was sent back to the absorber column through the compressors
and coolers, while the bottom product containing the solute-rich water was sent to a
packed bed air stripping column. The air stripping column operating at 20oC and 1 bar
[60] was employed to regenerate the process water continuously for the absorption
operation, while 10% of the recovered water was purged to reduce buildup of undesired
gas before it was recycled into the absorber column.
Biomethane, the product of the absorption process, is the feedstock for syngas
production via steam reforming and partial oxidation processes. The two reforming
processes ensured that the F-T syngas ratio was achieved [110]. The two processes were
coupled to attain proper energy efficiency by the use of exothermic heat from the partial
oxidation reaction to drive the steam reforming process. The steam reformer modeled as a
plug flow reactor (PFR) was operated at a temperature of 850oC and a pressure of 15 bar
[111], reforming the biomethane in the presence of NiAl2O3 catalyst. The feed to the PFR
was maintained at a steam to carbon (S/C) ratio of 4.0 [103] which enhanced the
complete conversion of methane to syngas. The reaction rate and conversion was
predicted by the steam methane reforming (SMR) Langmuir Hinshelwood Hugton
Watson (LHHW) kinetics developed by [112] as shown in equation (1-3). The

49
temperature dependent Arrhenius expression for the reaction is also shown in equations
(4& 5).
R1 = 𝑘1
𝑃H22.5
𝑃CH4𝑃H2O − (𝑃H23 𝑃CO/𝐾1)
DEN12 ………………………1
R2 = 𝑘2
PH2
𝑃CO𝑃H2O − (PH2PCO2/𝐾2)
DEN12 ………………….…...2
R3= 𝑘3
𝑃H23.5
𝑃CH4PH2O2 − (PH2
4 PCO2/𝐾3)
DEN12 …..............................3
where DEN1 = 1 + KCOPCO + KH2PH2 + KCH4PCH4 + 𝐾H2O𝑃H2O
PH2
ki = koi × e−Ei/RT i = 1, 2, 3……4
Kj = Koj x e−∆𝐻j/RT j = CO, H2, CH4, H2O.…5
SMR catalyst consumption was estimated from the work of Swanson et al., [14]
on hourly basis (kg/hr) assuming a catalyst life of 3 years. Syngas production via partial
oxidation (POR) reaction is an exothermic non-catalytic reaction with an optimal
operating condition of 1127oC [113] and 50 bar [114] and the process was modelled as a
Gibbs reactor (RGibbs) which follows the minimization of Gibbs free energy to perform
a phase equilibrium and chemical equilibrium [115]. The two syngas streams from SMR
and POR were mixed and cooled to 50oC [12] and the excess water present in the syngas
was removed prior to sending it to the slurry reactor. The overall syngas composition has
a H2/CO ratio of 2.19 and was necessary to produce drop-in fuels via Fischer-Tropsch
synthesis process where the excess hydrogen was used for the syncrude upgrading. The
various reaction that occurred during Steam and partial oxidation reforming and F-T
synthesis are shown in Table 3-2
Since our target product is the diesel fraction, the F-T liquid fuels synthesis was
modeled similar to the Bechtel’s slurry phase reactor design [116]. The low temperature

50
process took place at a temperature of 200oC and 26 bar in the presence of cobalt catalyst
[10, 61, 77]. Sequel to the operating condition of the slurry reactor, the syngas feed was
conditioned using a heater and compressor upstream the F-T slurry reactor. We assumed
a 55% single pass conversion with separation and recycle to achieve an 80% overall
conversion of the syngas in the slurry reactor which was similar to the conversions
achieved by [11]. The reaction rate for the formation of the syncrude is proportional to
the weight of catalyst which is a function of the gas hourly space velocity (GHSV) [116].
The catalyst consumption rate per m3 of syngas processed was determined using the gas
hourly space velocity of 2.38 m3/hr.kgcatalyst reported by [116]. Although the use of cobalt
catalyst promotes the formation of diesel fractions, [10], it also eliminates the formation
of water-gas shift reaction [77, 117]. Since the F-T process is an exothermic process, it
served as a pinch point that was effectively recovered and used in other areas of the
process. The length of hydrocarbon product formed during F-T synthesis is dependent on
the alpha chain growth probability model predicted by Anderson-Flory mechanism [61]
according to equation (6).
𝑊𝑛 = 𝑛(1 − 𝛼)2𝛼𝑛−1……………6
where
𝑊𝑛= mass fraction of product with n carbon atoms
𝛼 = probability of chain growth
(1 − 𝛼) = probability of chain termination
A basic Fortran expression was written in Aspen Plus that estimates the 𝛼𝐴𝑆𝐹
value based on the syngas feed parameters and reactor operating condition using the
alpha correlation parameter developed by [73] as shown in equation (7).

51
𝛼𝐴𝑆𝐹 = [0.2332𝑦𝐶𝑂
𝑦𝐻2
+ 0.663] [1 − 0.0039 (𝑇 − 533)]………7
The estimated 𝛼𝐴𝑆𝐹 variable solves the product distribution expressions that
yields the Fischer-Tropsch syncrude products.
Table 3-2: Different process reactions
Processes Reaction Reference
Steam Reforming CH4 + H2O → CO + 3H2
CO + H2O → CO2 + H2
CH4 + 2H2O → CO2 + 4H2
[112]
Partial Oxidation CH4 + 0.5O2 → CO + 2H2 [114]
Fischer-Tropsch synthesis nCO + (2n+1)H2 → CnH2n+2 + nH2O
nCO + 2nH2 ↔ Cn H2n + nH2O
nCO + 2nH2 ↔ Cn H2n+1OH + (n-1) H2O
[67, 68]
F-T syncrude predominantly consist of long chain paraffin’s, olefins and
oxygenates [77] as shown in table 2. In order to use F-T liquid fuels as conventional fuels,
it has to be refined in somewhat similar fashion as crude oil product. Initially, the light
gases in the syncrude were separated in high pressure hydrocarbon recovery unit which is
collected as the LPG (C3) fractions while the heavy hydrocarbons of wax, distillates and
naphtha were further processed downstream. Hydrocracking of the wax fractions occurred
at 380oC and 50 bar [118] in the presence of platinum catalyst with a liquid hourly-space
velocity (LHSV) of 1.1 hr-1 [119]. The distillate and naphtha fractions were selectively
hydro treated in a distillate and naphtha hydrotreaters [23] on a CoMo/Al2O3 with a LHSV

52
of 1.2 hr-1 [120]. Distillate hydrotreating specifically improved the diesel fraction cetane
number while naphtha hydrotreating saturated the olefins [121] for higher paraffin
formation, which is the inherent F-T products. The different drop-in fuel fractions of
gasoline and diesel were obtained by distillation using the principle of relative volatility of
the hydrocarbons with some wax (C30) fractions recovered as heavy bottom products and
sold as a co-product. The underwood equation of the DSTWU block was employed to
achieve product slits by initially performing an iteration to determine the minimum reflux
ratio (Rmin). Hence, the actual reflux ratio was obtained using the correlation (1.5*Rmin)
[122] which calculated the corresponding number of stages.
The unconverted syngas in this process was used as a fuel gas for electricity
generation. A combined cycle approach was employed in this analysis to effectively utilize
the flue gas heat in a heat recovery steam generator (HRSG). For optimal fuel gas energy
usage, the fuel gas was subjected to a laydown system operating at 8 bar which utilizes the
internal energy of the fuel gas to produce electricity before the fuel gas was combusted in
a burner in the presence of excess air and steam. Air with 20% excess oxygen served as an
ignition medium in the burner which was calculated from the stoichiometric air fuel ratio
using the Aspen Plus calculator block. Steam was used as a thermal NOx control medium
and was varied according to [123] to reduce the amount of NOx in exhaust gas. The hot
gas was fed to the gas turbine to generate electricity while the hot flue gas heat was
recovered in a HRSG for steam and additional electricity generation in a steam turbine.
The rate of water circulation for the Rankine cycle depended on the amount of heat
recovered from the flue gas by the HRSG which was calculated using the calculator block.
The operating conditions of the unit operations are given in table 3-3

53
Table 3-3: Operating condition for different unit operation
Unit Operation Type Temp (oC) Pressure (bar)
Inlet Tank Fixed roof 20 1
Compressor 1 Isentropic − 2
Compressor 2 Isentropic − 8
Cooler (1&2) TEMA 20 −
Valve ASME − 2
Absorber Packed Tower 20 8
Flash Fixed roof 20 2
Stripper Packed Tower 20 1
Pump (1&2) Centrigual − 8
Air Compressor Isentropic ASME − 1.1
POX-Heater TEMA 1127 50
SMR-Heater TEMA 850 15
Partial Oxidation Reformer (POX) POX 1127 50
Heat exchanger TEMA 1127 −
Separator & Cooler TEMA 50 −
Steam methane reformer (SMR) SMR 850 15
Compressor Isentropic ASME − 90
Heater TEMA 180 −
Pressure Swing Absorber (PSA) Packed bed − Swing
Slurry Phase F-T reactor Slurry Phase 200 40
Separator & Recycle TEMA 50 −
Depropanizer Tray Tower − 20
Hydrocarbon Recovery Tray Tower 250 Atm
Hydrocracker UOP 380 50
Naphtha hydrotreater UOP 300 41.37
Distillate hydrotreater UOP 315 40
Distillation 1 Tray Tower/Vaccum − 1.2
Distillation 2 Tray Tower/Vaccum − 1.7
LPG Storage Tank Fixed roof Atm Atm
Gasoline Storage Tank Fixed roof Atm Atm
Diesel Storage Tank Fixed roof Atm Atm
Boiler TEMA Sat −
Pump Centrigual − 15
Laydown Isentropic ASME − 8
Burner Generic 1370 −
Air Compressor Isentropic ASME − 1.1
Steam Turbine Isentropic ASME − 0.1
Gas Turbine Isentropic ASME − 6
Heat Recovery Steam Generator TEMA 120 −
Pump Centrigual − 125
The mass and energy balance of the base case BgTL (2000 Nm3/h) plant was
obtained from the Aspen Plus model which was used in the estimation of the capital cost

54
and operating cost. For subsequent evaluation of the effect of the assumed plant capacity
on the overall project cost evaluation, we developed three additional models of different
feed capacities: 500, 10,000, and 20,000 Nm3/h employing the same design specification
as the base case to ensure comparison. These four BgTL models were useful in
evaluating the potential of biogas as a future possible drop-in fuels route when such
capacity of biogas can be delivered for conversion to liquid fuels via F-T synthesis.
3.2.3 Techno-Economic Assessment
Techno-economic assessment of the biogas to liquid fuels (BgTL) was performed
using Aspen Process Economic Analyzer (APEA) v8.8 on a (USD $ 2014) pricing basis.
The sizing of the unit operation was carried out using the Icarus cost estimator and
mapped to the appropriate equipment in APEA in order to obtain the base equipment cost
(fob) and installed cost. The estimated installed cost was escalated to USD $2015 using
the chemical engineering cost index. A discounted cash flow rate of return (DCFROR) at
a net present value (NPV) of zero was performed using the estimated total capital
investment (CAPEX) and operating cost (OPEX) obtained from the mass and energy
balance of the BgTL model at an assumed plant life of 20 years to obtain the least selling
price of fuel (LSPF). Internal rate of return (IRR) of 10% was used for this analysis
[124]. The plant was assumed to be 100% equity financed which is one major assumption
of an Nth plant [125]. Basic investment parameter assumptions are shown in table 3-4.

55
Table 3-4: Investment parameters
Parameter Value Units
Number of Periods for Analysis 20
Construction duration 2.5 Period
Tax Rate 35 Percent/period
Rate of Return 10 Percent/period
Depreciation Method MACRS
Working capital 15 Percent/period
Length of start-up 20 Weeks
Operating Hours 8000 Hours
Period = year = 52 weeks
In addition to the use of Aspen Plus Economic Analyzer for the cost estimation, we
used published literature costs data for certain equipment costs along with appropriate cost
exponents (more details in the supplementary document). Also the equipment costs were
inflated using the chemical engineering cost index to account for the time value of money.
Other costs associated with equipment installation that constituted the total capital
investment were estimated using Peter’s et al., [126] capital costs estimation relationship
as shown in table 3-5.

56
Table 3-5: Total Capital Investment Approach
Estimate Approach
Base Equipment Cost (BEC) Aspen Process Economic Analyzer
Direct Equipment Cost (DEC) Aspen Process Economic Analyzer
Balance of Plant (BOP) 12% of BOE
Total Direct Equipment Cost (TDEC) DEC + BOP
Indirect Equipment Cost (IEC)* 89% of TDEC
Total Plant Cost (TPC) TDEC + IEC
Contingency fee 20.4% of TPC
Fixed Capital Investment TPC + Contingency
Working capital 15% of FCI
Land 8% of BEC
Total capital Investment (TCI) FCI + WC + Land
ISBL Section (A-D)
OSBL Section (E-F)
* (32% Engineering and supervision, 23% Contractors and legacy fees and
34%Construction expenses)
The mass and energy balance data obtained from the process simulation model was
used to estimate the variable operating cost. The unit price of different resources used in
this study are summarized in table 3-6. The fixed operating costs consisting of plant
employees were estimated based on the work of Humbird et al., [127] [details in the
supplementary document]

57
Table 3-6: Summary of Variable Operating Costs
Variable Cost Source
Biogas $4/GJ [128]
Process Water $0.0002/kg [126]
Cooling Water $0.0000792/kg [126]
Electricity $0.1045/kWh [129]
Waste Water disposal $0.000528/kg [130]
Nickel Catalyst $35.36/kg [14]
Cobalt Catalyst $35.36/kg [14]
Platinum Catalyst $56.29/kg [131]
Oxygen $0.09/kg [132]
CoMo/Al2O3 $35.36/kg Assumed
Wax $1.13/kg [133]
Performing a discounted cash flow rate of return (DCFROR) analysis on the
estimated capital and operating cost for a plant life of 20 years, the selling price of the F-T
drop-in fuel was obtained. This selling price was achieved by iterating the net present value
of the accumulated financial inventory to zero using the revised version of the NREL
DCFROR spreadsheet.
3.2.4 Sensitivity analysis
Sensitivity analysis on the base case BgTL plant was conducted to determine the
effects of key input process and cost parameters on the least selling price of the F-T fuels.
This analysis was classified into process and plant cost sensitive parameters in order to
distinguish between parameters that are specific to the process (production dependent)
and those that are plant cost dependent. The process specific input parameters analyzed
were F-T conversion, plant availability, feedstock, oxygen, and catalyst costs, co-
products price: electricity and wax while and plant cost parameters were internal rate of
return (IRR), contingency fee, working capital, and income tax. The criteria for selecting

58
these parameters that were evaluated was based on how sensitive they are in contributing
to the fuels price. A 20% increase or decrease for each of these parameters while keeping
other parameters constant was implemented. Catalyst life assumed to have a life time of 3
yrs was varied between 1 and 5 yrs assuming a worst case and advanced catalyst
performance scenarios respectively. These variations pave an avenue for future research
in drop-in fuels process improvement, optimization and cost analysis which ensures that
drop-in fuels are competitive.
3.3 Results and Discussion
3.3.1 Process simulation
A base case process model for biogas to liquid fuels (BgTL) plant was
successfully developed and the overall product distribution and energy data were
presented in Table 3-7.
Table 3-7: BgTL product distribution and energy usage
Drop-in fuels
LPG 0.309 million gallons/yr
Gasoline 1.331 million gallons/yr
Diesel 3.014 million gallons/yr
Co-Products
Wax 233896 kg/yr
Electricity 1014.871 kWh
Energy use
Thermal Energy 19.33 GJ/h
Electricity 623.41 kWh
The process analysis of converting 2000 Nm3/h (2381 kg/h) of raw biogas
produced 4.65 million gallons per year of liquid LPG, gasoline and diesel fractions
(Table 3-7). The amount of liquid fuels produced from raw biogas showed a 53% (mass

59
basis) overall product yield which is comparable to a typical GTL yield of 40-60% [104]
and 63% natural gas to liquid fuels yield of Bechtel [23]. However, this yield value in the
BgTL process differ from the liquid fuels production from biomass gasification works of
Larson et al., [13] and Swanson et al.,[14]. Both authors reported a product yield less than
20% (mass basis). This is by and large understandable since a huge loss is usually
encountered during the reforming and conditioning of syngas obtained from biomass
gasification. The electricity co-product obtained in this work depended on the extent of
conversion in the slurry reactor. Total energy consumption in the entire process in terms
of heat and electricity can be found in table 3-7 with the breakdown of the energy balance
shown in table 3-8.
Table 3-8: Electricity and Heat requirement in kWh
Electricity Consumption Process Heat
Biogas Upgrading 398.72 300.09
Syngas Production 166.39 -891.13
Fischer-Tropsch Synthesis 55.78 6656.77
Product Upgrade - 179.25
Power Generation -1014.89 -2971.17
Table 3-8 shows the heat and power demand for the BgTL plant. Biogas upgrading
was the highest consumer (64%) of electricity in this process. The reason being that the
series of compressors and pumps installed to achieve the process design operating
condition amounts to a total power consumption of 0.2 kWh/Nm3 of biogas upgraded. This
corresponds to the HPWS specific energy consumption of 0.2-0.3 kWh/Nm3 of biogas
reported by Bauer et al., [134]. For this given amount of electrical energy consumed, a 75%
of heat was recovered similar to the HPWS electrical power recovery achieved by Dirkse
[60]. This heat recovered was used within the process accounting for a proper energy
balance. Syngas production and F-T synthesis compressors used to condition the feed

60
before being sent to the reformer and reactor were the consumers of electricity in each of
these processes sections. Although the partial oxidation was an exothermic process which
provided heat to drive the endothermic steam reforming process, additional amount of heat
was needed in the overall syngas production section of the process. Net heat utilization in
the syncrude upgrade from the reboiler and condenser served also as a pinch point. Fischer-
Tropsch process known as a high exothermic process with heat removal challenge provided
the most heat needed in the process heat integration approach. Overall, the amount of
electricity required in this process was met from the internally generated power with a
thermal efficiency of 36%. Of the total amount of electricity generated, 61% was used
within the process while 39% was sold as co-product.
3.3.2 Techno-Economic Analysis
For the base case scenario of 2000 Nm3/h feed capacity, a total production of
approximately 4.65 million gallons/yr of F-T drop-in fuels with a capital expenditure
(CAPEX) and operating expenditure (OPEX) of $104.8 million and $11.66 million
dollars (US $ 2015) respectively was estimated. And for this investment, a discounted
cash flow rate of return (DCFROR) analysis resulted to a least selling price of F-T drop-
in fuels (LSPF) of $5.59 per gasoline gallon equivalent (GGE).

61
Figure 3-2: Percentage equipment installed cost distribution by section
Detail analysis of the equipment installed costs for each section of the process
classified as the inside battery limit (ISBL) is shown in figure 3-2 above. The syngas
production section contributed 42% of the total equipment cost which is typically the
highest cost in all GTL process as reported by [10]. Syncrude upgrade and power
generation contributed 27% and 12% respectively while the Fischer-Tropsch synthesis
and biogas cleaning sections contributed the 10% and 8% of the ISBL cost.
8%
42%
10%
27%
12%
Biogas Cleaning
Syngas Production
Fischer-Tropsch Liquid fuels
Product Upgrade
Power Generation

62
Figure 3-3: Individual costs contributing to OPEX (A) and CAPEX (B)
Factors contributing to the overall capital expenditure (CAPEX) and operating
expenditure (OPEX) are depicted in figure 3-3. It can be observed that the equipment cost
contributed 49% of the fixed capital investment which without doubt is usually the
0%
10%
20%
30%
40%
50%
60%
70%
80%
90%
100%
OPEX
Per
cen
tage
con
trib
uti
on
to O
PE
X
Maintenance &
InsuranceLabour
Oxygen
Waste Disposal
Catalyst
Electricity
Process Water
Feedstock
A
0%
10%
20%
30%
40%
50%
60%
70%
80%
90%
100%
CAPEX
Per
cen
tage
con
trib
uti
on
to
CA
PE
X
Working Capital
Land
Contigency fee
Const, Engr,
Superv & legal
feesEquipment Cost
B

63
highest capital investment in a typical chemical process. Then the engineering and
construction, and contingency fee contributed 22% and 14% respectively. Working
capital and land contributed the rest of the capital investment with each contributing 13%
and 2% respectively. Advancement in technology is vital as it will definitely enhance
technical know-how needed in the design and fabrication of the unit operation thereby
promoting competition amongst dealers. The result of these is a reduction in the
investment cost tied to equipment procurement. Such achievement will invariably reduce
the other costs (engineering, construction, and supervision, land, working capital, etc.)
which are generally estimated from the equipment cost. For the operating cost, the fixed
operating cost usually accounts for the highest expensive since it is independent of
production. Labor and maintenance cost contributed 39% and 26% of the total operating
cost followed by feedstock cost which contributed 16%. Other consumables such as
catalyst, oxygen, electricity, waste disposal, and process water costs contributed 8%, 4%,
4%, 2%, and 1% respectively. The inherent cheap feedstock cost highlights the prospects
of the use of biogas as feedstock in the GTL process.
We explored the effects of plant size on the CAPEX, OPEX, LSPF, and
production capacity in order to ascertain the recommendable size of the BgTL process.
Four biogas plant scenarios: 500Nm3/h, 2000 Nm3/h (base case), 10,000 Nm3/h, and
20000 Nm3/h were considered with their relations to investment shown in figure 3-4
below.

64
Figure 3-4: OPEX and CAPEX as a function of plant capacity
It can be observed that the CAPEX and OPEX increases as the plant size
increases. However, this is not a linear relationship since the costs does not double or
quadruple when the plant capacity is increased by similar magnitude. Interesting, a plot
of CAPEX and OPEX per production capacity against plant size further explains the
effect of large plant capacity which helps depict the recommendable size of a BgTL.
Figure 3-5 shows the investment cost ($/gal) as a function of the plant size. It is clear that
operating the plant at a feed capacity of 500Nm3/h and 2000Nm3/h is not economically
feasible as the cost per production is extremely high compared to the 10,000 Nm3/h and
20,000 Nm3/h plant sizes.
62.12
104.8
223.51
346.82
6.8411.66 26.98
42.99
0
50
100
150
200
250
300
350
400
0 5000 10000 15000 20000
MM
$
Plant Size (Nm3/h)
CAPEX (MM$)
OPEX (MM$/yr)

65
Figure 3-5: OPEX and CAPEX per production against plant size
Figure 3-6 illustrates the relationship between plant capacity and the product
selling price which brings to limelight the effect of economy of scale on the proposed
BgTL process.
Figure 3-6: Product selling price as a function of plant size
$6$3
$1.16 $0.92
$54
$23
$10 $7
$59
$25
$11 $8
$0
$10
$20
$30
$40
$50
$60
0 2000 4000 6000 8000 10000 12000 14000 16000 18000 20000
Inves
tmen
t C
ost
($/g
al)
Plant Size (Nm3/h)
OPEX CAPEX Total Cost
14.13
5.99
2.642.11
0.00
2.00
4.00
6.00
8.00
10.00
12.00
14.00
16.00
0 5000 10000 15000 20000
Min
imu
m S
elli
ng P
rice
($/g
al)
Plant Size (Nm3/h)

66
The least selling price of our drop-in fuels for this analysis at a plant size of 500Nm3/h
was $14.13/gal which is unequivocally not feasible based on the market price of fossil
fuels counterpart. But assuming a biogas plant with a size of 20,000 Nm3/h, the LSPF
was $2.11/gal which seems feasible and competitive in the energy market. However, the
tendency that such biogas plant size would be achieved remains a doubt.
3.3.3 Sensitivity Analysis
Performing a sensitivity analysis on the process, factors that critically affect the
selling price of the product were outlined for possible future advancement. Figs. 3-7 & 3-
8 shows the parameters that were evaluated as arranged in the order of magnitude at
which they affect the selling price. The highest impact on the selling price was the extent
of conversion in the F-T slurry reactor. It is evident that the latest development in
research on the conversion of syngas in a slurry phase reactor is 80% which is higher than
the conversion achieved in the conventional fluidized reactor [109]. Focus on the
advancement of the overall conversion during F-T synthesis is principally of utmost
importance in this process as a higher conversion resulted to a high syncrude formation
which significantly reduced the selling price of the liquid fuels due to the high production
capacity achieved. Predicting a future technological development up to 96% conversion
of syngas in a slurry reactor, the effect of selling price was evaluated. During the F-T
process, sintering of catalyst by impurities in the feed can negatively affect the catalyst
activity [10] which results to a reduction in catalytic conversion of syngas to F-T
syncrude with a resultant effect on the selling price of the fuels. A 64% conversion was
assumed to represent the overall conversion in the slurry reactor when the catalyst is
poisoned and such effect on the selling price was evaluated as seen in figure 3-7.

67
Figure 3-7: Sensitivity analysis for the effect of process parameter on the selling price of
the base case model.
Process plant online time is also inadvertently critical to the profitability of the
project. Since we assumed a 91% online time for the process without production
interruption, the overall cost of production which includes the fixed operating cost
(independent of production) can be recovered with a minimal selling price. This analysis
showed the loss involved during a shutdown as the project handles payroll, employee
benefits and equipment maintenance costs whereas no income from product sells are
made. Feedstock cost is another sensitive parameter in the BgTL process. Biogas can be
produced from a feedstock with no monetary value (manure) or highly expensive
ligncellulosic biomass. For such scenarios, the selling price of biogas typically differs.
Average feedstock cost of $4/GJ was used as the base case which when reduced to $2/GJ
in the scenario were biogas feedstock was obtained as credit, the selling price dropped to
$5.78/gal. In addition, technological development on the life span of catalyst is crucial to
6.01
6.01
5.97
5.95
5.9
5.78
5.525.05
5.98
5.98
6.02
6.04
6.45
6.21
6.577.4
-1.00 -0.50 0.00 0.50 1.00 1.50
Electricity Sales (+20%:0.1045kWh:-20%)
Wax Sales (+20%:$1.34/kg:-20%)
Oxygen (-20%:$90/tonne:+20%)
Catalyst Price (-20%:$162.37/kg:+20%)
Catalyst Life (5yrs:3yrs:1yrs)
Feedstock Cost ($2/GJ:$4/GJ:$6/GJ)
Plant Operating Hours (8760h:8000h:7240h)
F-T Conversion (96%:80%:64%)

68
the chemical industry in terms of operating cost invested in catalyst purchase. Typical
catalyst life of 3yrs achieved with catalyst in-situ regeneration alleviated the high
purchase cost of catalyst that would have been recorded in the annual operating
expenditure. This catalyst life cost contribution to the selling price is a function of the gas
hourly space velocity (GHSV) and liquid hourly space velocity (LHSV) evaluated for a 3
yrs life cycle in this base case BgTL model. Variation of the catalyst life cycle to 1yr for
this analysis shows an 8% increase in selling price which is undesirable. Similarly, the
catalyst life determines the percentage of the operating cost invested in the purchase of a
catalyst. Figure 3-7 shows that the effect of catalyst cost on the selling price which was
really not significant as this is a function of the GHSV and LHSV used for this work. In
similar process where different GHSV and LHSV are used in the analysis, it is certain
that a significant effect on catalyst price will be observed. Purchase of oxygen for the
partial oxidation process was more economically feasible in this BgTL process than
investing money on an air separation unit (ASU). It can be observed that the oxygen cost
of $90/tonne did not have a significant impact when the price was varied within ± 20%.
Co-products such as electricity and wax obtained during the analysis played a vital role in
minimizing the selling price of the fuel as co-product credits were obtained that offsets
the project selling price of the fuel. It can be observed that a reduction in the co-product
price selling price negatively affected the selling price as more money was needed from
the sale of the liquid fuels to maintain cash flow. Therefore, the design of the process to
produce high value co-products typically aids the project profitability. Overall, this is an
arduous task of engineers to design and develop a more efficient and optimal system that
can help attain the profit aims from a given investment.
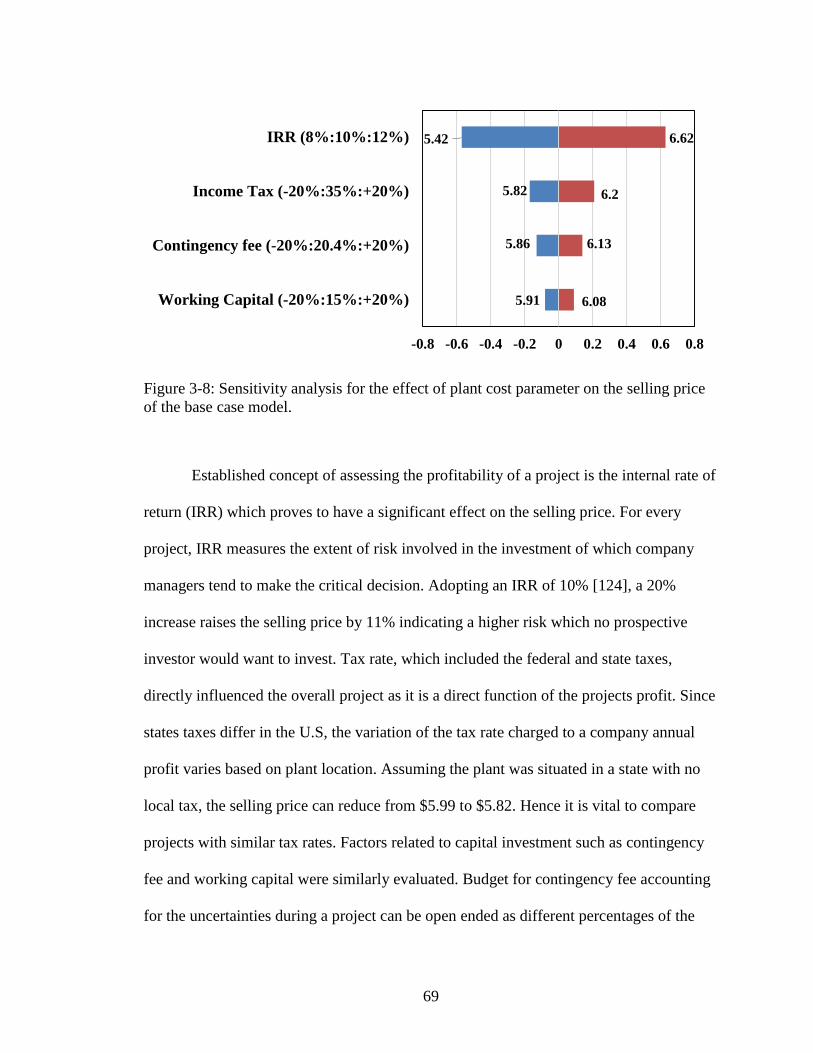
69
Figure 3-8: Sensitivity analysis for the effect of plant cost parameter on the selling price
of the base case model.
Established concept of assessing the profitability of a project is the internal rate of
return (IRR) which proves to have a significant effect on the selling price. For every
project, IRR measures the extent of risk involved in the investment of which company
managers tend to make the critical decision. Adopting an IRR of 10% [124], a 20%
increase raises the selling price by 11% indicating a higher risk which no prospective
investor would want to invest. Tax rate, which included the federal and state taxes,
directly influenced the overall project as it is a direct function of the projects profit. Since
states taxes differ in the U.S, the variation of the tax rate charged to a company annual
profit varies based on plant location. Assuming the plant was situated in a state with no
local tax, the selling price can reduce from $5.99 to $5.82. Hence it is vital to compare
projects with similar tax rates. Factors related to capital investment such as contingency
fee and working capital were similarly evaluated. Budget for contingency fee accounting
for the uncertainties during a project can be open ended as different percentages of the
5.91
5.86
5.82
5.42
6.08
6.13
6.2
6.62
-0.8 -0.6 -0.4 -0.2 0 0.2 0.4 0.6 0.8
Working Capital (-20%:15%:+20%)
Contingency fee (-20%:20.4%:+20%)
Income Tax (-20%:35%:+20%)
IRR (8%:10%:12%)
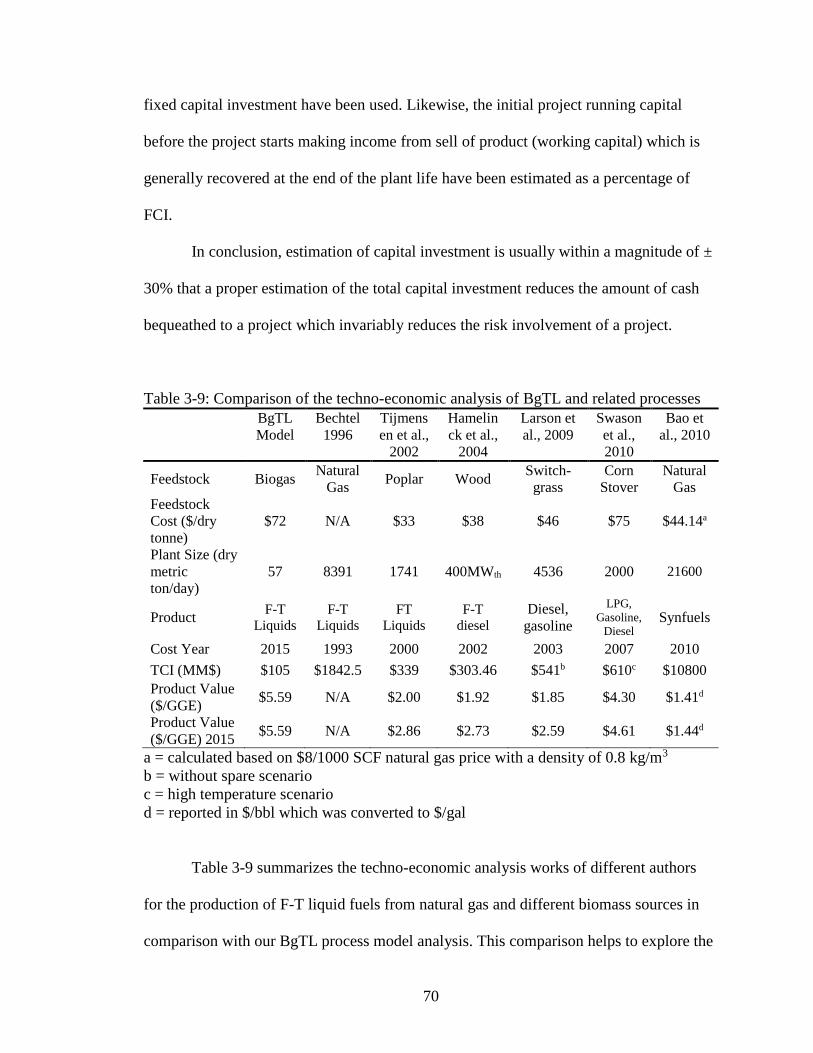
70
fixed capital investment have been used. Likewise, the initial project running capital
before the project starts making income from sell of product (working capital) which is
generally recovered at the end of the plant life have been estimated as a percentage of
FCI.
In conclusion, estimation of capital investment is usually within a magnitude of ±
30% that a proper estimation of the total capital investment reduces the amount of cash
bequeathed to a project which invariably reduces the risk involvement of a project.
Table 3-9: Comparison of the techno-economic analysis of BgTL and related processes
BgTL
Model
Bechtel
1996
Tijmens
en et al.,
2002
Hamelin
ck et al.,
2004
Larson et
al., 2009
Swason
et al.,
2010
Bao et
al., 2010
Feedstock Biogas Natural
Gas Poplar Wood
Switch-
grass
Corn
Stover
Natural
Gas
Feedstock
Cost ($/dry
tonne)
$72 N/A $33 $38 $46 $75 $44.14a
Plant Size (dry
metric
ton/day)
57 8391 1741 400MWth 4536 2000 21600
Product F-T
Liquids
F-T
Liquids
FT
Liquids
F-T
diesel
Diesel,
gasoline
LPG,
Gasoline,
Diesel Synfuels
Cost Year 2015 1993 2000 2002 2003 2007 2010
TCI (MM$) $105 $1842.5 $339 $303.46 $541b $610c $10800
Product Value
($/GGE) $5.59 N/A $2.00 $1.92 $1.85 $4.30 $1.41d
Product Value
($/GGE) 2015 $5.59 N/A $2.86 $2.73 $2.59 $4.61 $1.44d
a = calculated based on $8/1000 SCF natural gas price with a density of 0.8 kg/m3
b = without spare scenario
c = high temperature scenario
d = reported in $/bbl which was converted to $/gal
Table 3-9 summarizes the techno-economic analysis works of different authors
for the production of F-T liquid fuels from natural gas and different biomass sources in
comparison with our BgTL process model analysis. This comparison helps to explore the

71
economic viablity of liquid fuel production from these routes. Gas to liquid (GTL) and
coal to liquid (CTL) have been the commercial routes for liquid fuels production with no
detailed economic analysis data available for such processes. The gas to liquid process
analysis of Bechtel [23] provided no selling price of the F-T products while Bao et al.,
[135] reported a selling price of $58/bbl (US $ 2010). Recently, the thermochemical
conversion (gasification) of biomass has received tremendous research attention as a
promising route for F-T fuels production. Tech-economic analysis of converting different
types of biomass feedstock have been conducted by several authors for which a product
value range of $2.86/GGE - $4.61/GGE were estimated [11-14].
Table 3-9 shows that the gas to liquid fuels product price proves to be competitive
($1.44/GGE) whereas the thermochemical route seemed to be higher when compared to
the product price ($5.59/GGE) of our base case model. We could make this assertion due
to the average plant feed capacity of 1,728 tonnes/day for the thermochemical pathways
which is approximately 30 times the size of our base model plant capacity. At a plant
capacity of 20,000Nm3/h, the product value was estimated to be $1.97/GGE which offers
a better prospect for the liquid fuels production from biogas. Critical parameters that
contributed to the high product value of the thermochemical process were the feedstock
preprocessing and gasification (including syngas cleaning and conditioning) investments,
and feedstock cost. It is also noteworthy to understand that each process analysis
employed different assumptions for the plant life time, process conversion, plant
availability, catalyst life time and costs, and other process consumable costs during the
analysis which would make the comparison of different processes not very realistic.

72
3.4 Conclusion
Drop-in fuels production via biogas was successfully modeled using Aspen Plus to
obtain the mass and energy balance which was employed in the techno-economic
analysis. For the base case plant capacity of 2000 Nm3/h, the drop-in fuels selling price of
$5.99/gal ($5.59/GGE) was estimated. This selling price for a biofuel is not very
competitive judging from the $3/gal target set by the EPA’s renewable fuels standard
(RFS). And given the current drop in crude oil price, the feasible of the process stands no
chance. Although the price of the fuel is not possible in the market, certain factors
contributed to these selling price as evident in the sensitivity analysis. The yield of
syngas and extent of conversion of the syngas to liquid fuel if advanced through R&D, an
acceptable selling price can be attained. Nevertheless, these technology is absolutely
achievable at a higher plant size as a selling price of $2.46/GGE was obtained at a size of
10,000 Nm3/h which further drops to $2/GGE for a size of 20,000Nm3/h. Therefore, a
feasible Nth plant model for a biogas to drop-in F-T liquid fuels can be explored in the
future for possible implementation.

73
3.5 References
1. EIA, U.S. Energy Information Administration: Monthly Energy Review. 2014.
2. CBO, The Renewable Fuel Standard: Issues for 2014 and Beyond. 2014,
Congretational Budget Office.
3. RFA. World Fuel Ethanol Production. 2016 [cited 2016 04/19/2016]; Available
from: http://www.ethanolrfa.org/resources/industry/statistics/#1454098996479-
8715d404-e546.
4. LemvigBiogas. [cited 2015; Available from: http://www.lemvigbiogas.com/.
5. Yang, L.C., et al., Progress and perspectives in converting biogas to
transportation fuels. Renewable & Sustainable Energy Reviews, 2014. 40: p.
1133-1152.
6. Weiland, P., Biogas production: current state and perspectives. Applied
Microbiology and Biotechnology, 2010. 85(4): p. 849-860.
7. Persson, M., O. Jönsson, and A. Wellinger. Biogas upgrading to vehicle fuel
standards and grid injection. in IEA Bioenergy task. 2006.
8. Tippayawong, N. and P. Thanompongchart, Biogas quality upgrade by
simultaneous removal of CO 2 and H 2 S in a packed column reactor. Energy,
2010. 35(12): p. 4531-4535.
9. Hullu, J.d., et al., Comparing different biogas upgrading techniques. Eindhoven
University of Technology, 2008: p. 56.
10. Lennart Erfors. Biogas Kristianstad. 2009 [cited 2016 06/12/2016]; Available
from:

74
https://www.kristianstad.se/upload/Sprak/dokument/2%20Biogas%20Kristianstad
%20brochure%202009.pdf.
11. Rakass, S., et al., Steam reforming of methane over unsupported nickel catalysts.
Journal of Power sources, 2006. 158(1): p. 485-496.
12. Oliveira, E.L.G., C.A. Grande, and A.E. Rodrigues, STEAM METHANE
REFORMING IN A Ni/Al2O3 CATALYST: KINETICS AND DIFFUSIONAL
LIMITATIONS IN EXTRUDATES. Canadian Journal of Chemical Engineering,
2009. 87(6): p. 945-956.
13. Greene, D.L., An assessment of energy and environmental issues related to the
use of gas-to-liquid fuels in transportation. 1999: Oak Ridge National Laboratory
Oak Ridge, TN.
14. Bechtel, Baseline Design/Economics for Advanced Fischer-Tropsch Technology,
in Topical Report Volume VI, DOE Contract No.DE-AC22-91PC90027. 1996, US
Department of Energy.
15. Tijmensen, M.J., et al., Exploration of the possibilities for production of Fischer
Tropsch liquids and power via biomass gasification. Biomass and Bioenergy,
2002. 23(2): p. 129-152.
16. Larson, E.D., H. Jin, and F.E. Celik, Large‐scale gasification‐based coproduction
of fuels and electricity from switchgrass. Biofuels, Bioproducts and Biorefining,
2009. 3(2): p. 174-194.
17. Swanson, R.M., et al., Techno-economic analysis of biomass-to-liquids
production based on gasification. Fuel, 2010. 89: p. S11-S19.

75
18. Williams, R.H., et al., Methanol and hydrogen from biomass for transportation.
Energy for Sustainable Development, 1995. 1(5): p. 18-34.
19. Qureshi, N., et al., An economic evaluation of biological conversion of wheat
straw to butanol: a biofuel. Energy Conversion and Management, 2013. 65: p.
456-462.
20. Phillips, S., Technoeconomic analysis of a lignocellulosic biomass indirect
gasification process to make ethanol via mixed alcohols synthesis. Industrial &
Engineering Chemistry Research, 2007. 46(26): p. 8887-8897.
21. Okoli, C. and T.A. Adams, Design and economic analysis of a thermochemical
lignocellulosic biomass-to-butanol process. Industrial & Engineering Chemistry
Research, 2014. 53(28): p. 11427-11441.
22. Faaij, A., B. Meuleman, and R. van Ree, Long Term Perspectives of Biomass
Integrated Gasification with Combined Cycle Technology: Costs and Efficiency
and a Comparison with Combustion. 1998: NOVEM, The Netherlands Agency
for Energy and the Environment.
23. Spath, P.L. and D.C. Dayton, Preliminary screening-technical and economic
assessment of synthesis gas to fuels and chemicals with emphasis on the potential
for biomass-derived syngas. 2003, DTIC Document.
24. Boerrigter, H., H. den Uil, and H.-P. Calis, Green diesel from biomass via
Fischer-Tropsch synthesis: new insights in gas cleaning and process design.
2003, CPL Press: Newbury, UK. p. 371-383.

76
25. Larson, E.D., H. Jin, and F.E. Celik, Gasification-based fuels and electricity
production from biomass, without and with carbon capture and storage. Princeton
Environmental Institute, Princeton University, 2005.
26. Dirkse, E., Biogas upgrading using the DMT TS-PWS® Technology. DMT
Environmental Technology, 2007.
27. Petersson, A. and A. WeLLInGer, Biogas upgrading technologies–developments
and innovations. IEA Bioenergy, 2009: p. 12-15.
28. York, A.P., T. Xiao, and M.L. Green, Brief overview of the partial oxidation of
methane to synthesis gas. Topics in Catalysis, 2003. 22(3-4): p. 345-358.
29. Samuel, P., GTL technology-Challenges and opportunities in catalysis. Europe,
2000. 192(3): p. 8.
30. Xu, J.G. and G.F. Froment, METHANE STEAM REFORMING, METHANATION
AND WATER-GAS SHIFT .1. INTRINSIC KINETICS. Aiche Journal, 1989. 35(1):
p. 88-96.
31. Liu, J.A., Kinetics, catalysis and mechanism of methane steam reforming. 2006,
WORCESTER POLYTECHNIC INSTITUTE.
32. Eilers, J., S. Posthuma, and S. Sie, The shell middle distillate synthesis process
(SMDS). Catalysis Letters, 1990. 7(1-4): p. 253-269.
33. Aspen Technology, Aspen Plus 12.1 user guide. 2003.
34. Hamelinck, C.N., et al., Production of FT transportation fuels from biomass;
technical options, process analysis and optimisation, and development potential.
Energy, 2004. 29(11): p. 1743-1771.

77
35. Fox, J.M., Fischer-Tropsch reactor selection. Catalysis Letters, 1990. 7(1): p.
281-292.
36. Dry, M.E., High quality diesel via the Fischer–Tropsch process–a review. Journal
of Chemical Technology and Biotechnology, 2002. 77(1): p. 43-50.
37. Bartholomew, C.H. and R.J. Farrauto, Fundamentals of industrial catalytic
processes. 2011: John Wiley & Sons.
38. Espinoza, R., et al., Low temperature Fischer–Tropsch synthesis from a Sasol
perspective. Applied Catalysis A: General, 1999. 186(1): p. 13-26.
39. Song, H.-S., et al., Operating strategies for Fischer-Tropsch reactors: A model-
directed study. Korean Journal of Chemical Engineering, 2004. 21(2): p. 308-317.
40. Demirbas, A., Biofuels sources, biofuel policy, biofuel economy and global
biofuel projections. Energy conversion and management, 2008. 49(8): p. 2106-
2116.
41. Abatzoglou, N., et al. Green diesel from Fischer–Tropsch synthesis: challenges
and hurdles. in 3rd IASME/WSEAS International Conference on Energy,
Environment, Ecosystems and Sustainable Development. Greece. 2007.
42. Leckel, D., Noble metal wax hydrocracking catalysts supported on high-siliceous
alumina. Industrial & engineering chemistry research, 2007. 46(11): p. 3505-
3512.
43. DOE. 2006 [cited 04/08/2015; Available from: http://www.fischer-
tropsch.org/DOE/DOE_reports/88014638/wax-sct5.pdf.

78
44. Lamprecht, D., R. Nel, and D. Leckel, Production of On-Specification Fuels in
Coal-to-Liquid (CTL) Fischer− Tropsch Plants Based on Fixed-Bed Dry Bottom
Coal Gasification. Energy & Fuels, 2009. 24(3): p. 1479-1486.
45. Jones, D.S. and P.P. Pujadó, Handbook of petroleum processing. 2006: Springer
Science & Business Media.
46. Green, D.W., Perry's chemical engineers' handbook. Vol. 796. 2008: McGraw-
hill New York.
47. Chiesa, P., G. Lozza, and L. Mazzocchi. Using hydrogen as gas turbine fuel. in
ASME Turbo Expo 2003, collocated with the 2003 International Joint Power
Generation Conference. 2003. American Society of Mechanical Engineers.
48. Short, W., D.J. Packey, and T. Holt, A manual for the economic evaluation of
energy efficiency and renewable energy technologies. 2005: University Press of
the Pacific.
49. Montague, L., A. Slayton, and J. Lukas, Lignocellulosic biomass to ethanol
process design and economics utilizing co-current dilute acid prehydrolysis and
enzymatic hydrolysis for corn stover. 2002, Citeseer.
50. Peters, M.S., et al., Plant design and economics for chemical engineers. Vol. 4.
1968: McGraw-Hill New York.
51. Humbird, D., et al., Process design and economics for biochemical conversion of
lignocellulosic biomass to ethanol: dilute-acid pretreatment and enzymatic
hydrolysis of corn stover. 2011.
52. Mital, K., Biogas Systems: Policies, Progress and Prospects. 1997: Taylor &
Francis.

79
53. EIA. Electricity. 2014; Available from: http://www.eia.gov/electricity/state/.
54. CostWater. [cited 2016 04/05/2016]; Available from:
http://www.costwater.com/runningcostwastewater.htm.
55. Brown, T.R., et al., Techno‐economic analysis of biobased chemicals production
via integrated catalytic processing. Biofuels, Bioproducts and Biorefining, 2012.
6(1): p. 73-87.
56. Mahin Rameshni, Cost Effective Options to Expand SRU Capacity Using Oxygen
2002: WorleyParsons.
57. Argus Global Wax. 2015 [cited 2016 04/02/2016]; Available from:
argusmedia.com.
58. Bauer, F., et al., Biogas upgrading–technology overview, comparison and
perspectives for the future. Biofuels, Bioproducts and Biorefining, 2013. 7(5): p.
499-511.
59. Bao, B., M.M. El-Halwagi, and N.O. Elbashir, Simulation, integration, and
economic analysis of gas-to-liquid processes. Fuel Processing Technology, 2010.
91(7): p. 703-713.

80
CHAPTER 4
4 LIFE CYCLE ANALYSIS OF RENEWABLE DIESEL PRODUCTION VIA AD
AND F-T SYNTHESIS FROM MISCANTHUS GROWN IN STRIP-MINED
SOILS.2
2 Okeke I.J., and Sudhagar Mani. To be submitted to Environmental Science &
Technology, ACS Publications.

81
Abstract:
Climate change resulting from the production and use of transportation fuels have raised a
global concern which environmental friendly fuels are sorted. Renewable fuels obtained from
biomass and other organic carbon sources are proposed to mitigate these climate chance
challenges. In this study, a cradle to gate attributional life cycle assessment (LCA) approach which
considered the whole life cycle of the cultivation of the energy crop till the production of the fuel
(drop-in diesel). TRACI 2 v4.0 was used to calculate the overall emissions from cradle (miscanthus
cultivation) to the gate (drop-in diesel production). The functional unit of this analysis was 1
gasoline gallon equivalent (GGE) of drop-in diesel fuel which was compared to the conventional
diesel fuel in a typical U.S refinery. For the entire life cycle of the drop-in diesel production, a net
greenhouse gas (GHG) emission reduction of 41% and 26% were estimated when carbon
sequestered during the feedstock cultivation was accounted in scenarios where lime addition and
no lime addition were used for the cultivation of miscanthus. Other impact assessments such as
eutrophication potential, smog formation, acidification potential, respiratory effects, carcinogenic
and non-carcinogenic formations, ozone depletion, and ecotoxicity were assessed and reported in
comparison to the fossil derived diesel. Cumulative energy demand (CED) v1.08 was used to
assess the total energy usage for the entire life cycle of the drop-in diesel from miscanthus which
was estimated to be 29.178 MJ/GGE with a net energy balance of 100.421 MJ/GGE. With such
reduction in GHG and a positive net energy balance, the drop-in renewable diesel from miscanthus
is proven to be a sustainable pathway.
Keywords: Energy crops, biogas, renewable diesel, GHG emissions.

82
4.1 Introduction
Anaerobic digestion of lignocelluosic biomass to produce biogas used for the production of
drop-in renewable diesel fuels is a viable route to attain the EPA’s renewable fuels standard (RFS)
biomass-based diesel target of 1 billion gallons [136]. These RFS target is in the bid to reduce the
amount of greenhouse gas emissions that causes climate change in the U.S. For example, the use
of the biomass-based diesel is expected to reduce the emission of the fossil fuel it substituted by
20% [95]. In order to ascertain this claim, these renewable sources of energy need to be critically
analyzed in terms of their energy consumptions and greenhouse gas emissions impacts on the
environment.
With a 2014 greenhouse gas emission of 6,870 million metric tons CO2eq [137], the United
States is considered a high emitter of greenhouse gases which significantly contributes to climate
change. The Unite States Environmental Protection Agency (EPA) quantified the GHG emissions
and estimated that CO2 emission contributed 81% of total emissions which the electricity
generation and transportation sectors are the highest contributors [137]. Depending on the source
of electricity generation, it is evident that power generation contributes significantly to climate
change however, this work focuses on the emission from the transport sector which the use of
biomass-derived diesel tends to reduce.
Lignocellulosic biomass is digested under anaerobic condition in a solid state anaerobic
digester to produce biogas and digestate [40, 90, 138]. These process is commercially applicable
as the biogas is employed for multiple applications such as home cooking, industrial methane
source, combined heat and power (CHP), while the digestate is used for fertilizer. As opposed to
other biomass conversion, the energy efficiency of this process for the production of methane
compared to other biological and thermos-chemical processes [139] and its reduced methane

83
emissions [140] makes anaerobic digestion desirable. Anaerobic digestion and the production of
biogas is of interest in Europe because it is a renewable source of energy with less greenhouse
(GHG) emissions and guaranteed energy security [36] . Substituting fossil derived fuels with
biogas contributes to the reduction in climate change due to less greenhouse gas emissions [27].
EPA’s AgSTAR program reported in 2010 an energy production of 1600 megawatts from biogas
equivalent to the removal of 6.5 million cars off the road as it reduces global warming potential by
1.8 million metric ton of methane [141].
To employ lignocellulosic biomass in an AD process, pretreatment of the lignocellulosic
biomass is carried out. According to Zheng, Y., et al., [44], pretreatment causes structural reduction
of lignocellulosic biomass and exposes the cellulose and hemicellulose to enhanced microbial
breakdown which raises the rate of biomass degradation and biogas yield. Amongst the other
pretreatment methods, fungal pretreatment of the ground miscanthus was performed to enhance
the digestibility of the feedstock. After pretreatment, the lignin content of miscanthus was reduced
to about 25.7% with a corresponding 25% increase in specific methane yield [89].
Since lignocellulosic biomass exists in abundance in the United States which are also
available for bioenergy production, possible anaerobic digestion feedstock challenges have been
addressed. Another noteworthy development is presence of 191 anaerobic digesters in the U.S
which indicates a growth in the production of biogas [17]. The methane potential of biogas in the
United States was reported to be about 7.9 million tonnes per annum (420 billion cubic feet of
methane gas) [16]. Such growth in production of biogas ensures adequate sustainability of the
feedstock to supply the drop-in diesel production plant. In order to assess the environmental
impacts and evaluate the RFS requirement, a detailed life cycle analysis of biomass to drop-in

84
biofuel via AD technology is required. In addition, we will further evaluate the potential of this
conversion pathway in comparison with gasification routes to produce drop-in-biofuels.
Production of drop-in fuels from biogas obtained from either any other source or
lignocellulosic biomass requires the upgrading of the biogas to a clean state since it has an average
composition of 50–75% CH4, 25–50% CO2, 0–10% N2, 0–5%O2, 1000-2000ppm H2S [142]. Once
biogas is upgraded, it predominately becomes methane or what is conventionally regarded as
biomethane [60] and can be converted through several unit operations to produce the drop-in diesel
fuels.
The focus of this study is to examine the energy use and environmental emissions in the
production of drop-in diesel using biogas obtained from miscanthus SS-AD and compare with the
fossil based diesel. In order to achieve such comparison, the entire life cycle of the production of
drop-in diesel was conducted in a cradle to gate attributional life cycle analysis approach. Life
cycle assessment is an internationally recognized procedure for the systematic and quantitative
evaluation of environmental impacts on the entire stages of a product life cycle which is compared
to a similar product based on the same functional unit.

85
4.2 Methodology
This is an attributional life cycle analysis (LCA) study based on the ISO 14000
environmental management standards (ISO 14040:2006 and 14044:2006) approach. As defined
by the standard, a life cycle assessment was conducted in four separate but collective segments
namely: Goal and scope definition, Inventory analysis, Impact assessment, and Interpretation.
During the life cycle inventory (LCI) phase, all inputs (raw materials and energies) required to
produce the product of interest alongside the co-products and emissions (air, water, and land) were
accounted for. SimaPro.7, a life cycle analysis tool, and TRACI 2 v4, an impact calculation
method, were used to estimate the emissions attributed to the entire life cycle of drop-in renewable
diesel production from miscanthus. In-built U.S LCI database in SimaPro was predominantly used
for this assessment of which the GREET model was used in the absence of any input data.
Similarly, our logistics model was used in estimating the inputs for the miscanthus cultivation
through the feestock delivery at plant gate. Data for the pretreatment (tub grinding and fungal
treatment) of the feedstock and biogas production were obtained from related literature. Inputs for
the conversion of the biogas conversion drop-in renewable diesel were obtained from our biogas
to liquid fuels (BgTL) Aspen Plus model. Impact assessments categories such as global warming,
eutrophication, acidification, carcinogenic and non-carcinogenic, respiratory effects, ozone
depletion, ecotoxicity, and smog potentials were analyzed. The CED 1.02 (Cumulative Energy
Demand LCA) method was also used to evaluate the non-renewable fossil energy used in the
system entirely.
4.2.1 Goal and Scope definition
The overall goal of this study was to systematically assess and evaluate the energy and
environmental impacts of producing renewable diesel from biogas produced via solid-state AD of
86
Miscanthus cultivated from strip-mined land. Strip-mined lands are lands originally used for the
production of minerals by excavating the soil. Miscanthus feedstock cultivation was performed in
a strip-mined land at Ohio with the downstream processing facility located also in Ohio were input
data were considered to be within this geographical location. The overall assessment in this study
is to compare the emissions and impacts of the production of renewable drop-in diesel with the
production of petroleum-based diesel. The scope of the life cycle inventory (LCI) included
emissions from the energy input in the entire process which encompasses the cultivation of
miscanthus, feedstock logistics, pretreatment, anaerobic digestion of the pretreated miscanthus to
biogas, transportation and use of digestate in farmland, biogas cleaning operation, biomethane
conversion to syngas, catalytic c0onversion of syngas to Fischer-Tropsch syn-crude, electricity
generation using unconverted syngas in the F-T process, and the F-T syn-crude upgrade to drop-
in diesel.
4.2.2 System Boundary, Functional Unit and Reference System
The system examined in this work is depicted in figure 4-1. As can be seen in the outlined
boundary, the system included the cultivation of miscanthus to its anaerobic digestion to produce
biogas which was subsequently converted to drop-in renewable diesel. Inputs includes the strip-
minded land, fertilizers, pesticides, diesel for cultivation and harvesting, fungal used for
pretreatment, process water, catalyst, oxygen, and atmospheric air. All thermal and electrical
energy used in this system were internally generated and hence excludes any external supply of
energy.

87
Figure 4-1: System boundary of GTL production from anaerobic digestion of miscanthus
4.2.2.1 Feedstock Cultivation
Miscanthus, a perennial energy crop, was used as feedstock for the production of biogas
employed for the drop-in renewable diesel pathway. Miscanthus has a high biomass yield which
makes it a potential feedstock for the production of biogas via solid state anaerobic digestion.
Currently, Illinois is regarded as the highest producer of miscanthus in the United States with an
estimated yield of about 30-60 t DM ha-1 yr-1[143]. For this study, a cultivation life cycle of 20
years on a stripped-mined land located in Ohio with an average spring yield of 10 Mg DM ha-1 yr-
1 was assumed. These assumptions were judged as reasonable since the land for cultivation of
miscanthus is not arable and has lower yield compared to when grown in an arable land. All input
data (rhizome, fertilizers, herbicides, lime, and diesel) for the cultivation of miscanthus were
calculated based on an average yield of 10 Mg DM ha-1 yr-1. Miscanthus harvested in spring was
reported to have total solid (TS) and volatile solid (VS) of 90.1% and 87.2% respectively [89].
The composition of miscanthus used in this process is reported in table 4-1. During the cultivation
and harvesting of the miscanthus, some carbon is sequestered on the farmland which helps to

88
improve the soil quality of the land used for cultivation. For miscanthus cultivation, the soil organic
carbon (SOC) sequestration have been reported to be within the values of 0.16-0.82 Mg C ha-1 yr-
1 [144]. A key assumption made for this cultivation operation is the land use change which was
assumed to be negligible since the land used in this analysis does not compete with food
cultivation.
Table 4-1: Elemental composition and heating value of Miscanthus
Component weight % (dry)
Carbon (C) 47.92
Nitrogen (N) 0.54
Hydrogen (H) 5.5
Oxygen (O) 41.0
Sulphur (S) 0.11
Ash 2.78
Fixed Carbon 25.40
Net Heating Value (GJ/ Mg) 17.86
4.2.2.2 AD Feedstock Logistics
The optimum harvest time for miscanthus is between late November and early December
[145] with a higher biomass yield. According to [145], the harvest of miscanthus in late winter and
spring reduces the yield by 30-50% but with a higher specific methane yield of about 25% after
fungal pretreatment with Ceriporiopsis subvermispora [89]. For the functional unit of produce 1
GGE (gasoline gallon equivalent) of drop-in renewable diesel production, an estimated amount of
0.024 Mg DM/hr of miscanthus was harvested. Harvesting operations of swathing, stalking, and
bailing into a large square bale were carried out and piled on farmland prior to transportation to
the biorefinery intermediate storage location. During the logistics operation (storage and
transportation), approximately 10% of the harvested feedstock were lost. A single direction
distance of 30 km (farmland – intermediate storage – biorefinery) for the transportation of the
feedstock using a diesel-powered truck was estimated based on the AD plant annual capacity. The

89
entire logistics operation was carried out with a diesel-powered machine (tractor with attachment)
for which all emissions data from the use of diesel fuel and organic matter losses during the
logisitcs were considered in the overall life cycle of the process.
4.2.2.3 Feedstock Pretreatment
The cell wall composition of miscanthus giganteus consists of 52.13% cellulose, 25.76%
hemicellulose and 12.58% lignin [146]. The direct use of lignocellulosic biomass for anaerobic
digestion results to poor yield of biogas [15, 90] because of the complex carbohydrate components
which are insoluble and are covalently bounded to each other. Therefore, to achieve a high biogas
yield, pretreatment of the material is vital before the AD process. Feedstock pretreatment process
included the tub grinding of miscanthus (15% moisture content) for size reduction and then fungal
pretreatment of the chopped miscanthus to enhance breakdown of the carbohydrate structure of
miscanthus, which eventually rises methane yield. The tub grinding operation comprised the
debailing and grinding of the feedstock. Due to the bulk nature of the feedstock, grinding to reduce
the bulk feedstock to smaller particle size was carried out using a 630 hp diesel-powered tub-
grinder with an energy consumption of 3.72 liters/tonne [147]. After the grinding of miscanthus, a
front-end loader was used to convey the chopped feed to the pretreatment location. The moisture
content of the ground miscanthus was raised to 60% followed by the addition of fungal
(Ceriporiopsis subvermispora) at room temperature for 28 days [89] in an assumed bunker silo.
Dry matter loss of 12.5% was considered during the fungal pretreatment process [148]. Finally, a
front-end loader (100 hp) was used to feed the AD reactor with the pretreated feedstock.
4.2.2.4 Anaerobic Digestion
Digestion of pretreated miscanthus was carried out in a solid-state anaerobic digester (SS-
AD) due to the solid content (>10%) of the feedstock. In this analysis, the feedstock was

90
conditioned to a moisture content of 75% before it was subjected to an SS-AD that operated at a
mesophilic temperature of 35oC and atmospheric pressure. The heat and electricity required to
maintain the digester operating temperature and for stirring of the feed were estimated from the
work of [149] as 110 MJ/tonne and 66 MJ/tonne respectively. These heat and electricity demand
were supplied from the excess heat and electricity generated within this process analysis. Hence,
there was no external thermal or electrical energy requirement. Optimum carbon to nitrogen (C/N)
ratio for AD process is typically between 25-30 [91] which the C/N ratio of miscanthus is about
88. Liquid digestate from an anaerobic digester plant was used as an inoculum to maintain the
required ratio. Feed to inoculum (F/I) ratio of 2 was maintained for every batch of feed processed
in the digester [89]. An estimated distance of 30 km for the transportation of the liquid digestate
to the plant was assumed for which we account for the direct emissions in the transportation
process. According to the [92], methane yield of miscanthus is approximately between 0.179-0.218
m3 per kg volatile solid. Similarly, a miscanthus methane potential of 0.2 m3/kg VS was reported
by [150]. Therefore, an average methane yield of 0.18 m3/kg VS was used in this work to estimate
the methane production rate based on the feedstock volatile solid of 87.2% while the unconverted
solid were withdrawn from the AD reactor as digestate. For the amount of methane produced in
the process, the fugitive emission was estimated to be 5% of the total biogas produced [151].
Product allocation for the AD process was on product value (cost) basis [152]. Finally, biogas was
upgraded to natural gas quality for the production of drop-in diesel while the digestate was
transported back to the miscanthus farmland to be used as fertilizer replacement.
4.2.2.5 Transportation of Digestate
The unconverted biomass (non-volatile solids) in the SS-AD process were collected as
digestate and used as organic fertilizers in the farmland for the cultivation of the feedstock, which

91
serves as replacement for the chemical fertilizers. Using digestate in place of chemical fertilizer
serves as a recycle of nutrients in the raw material. Biogas yield of each feedstock determines the
amount of digestate produced which invariably influences the nutrient concentration of the
digestate and the amount to be spread on farmland [153]. It was assumed that the means of
transportation of the digestate from the biogas plant back to the farmland was the same as that
from the farmland to biogas plant. Hence, the diesel-powered truck traveled a round trip of 60 km.
Spraying of the digestate was with a tractor and manure spreader [27] of which the energy
consumption for the operation was estimated. In these analysis, the use of digestate as a fertilizer
substitute was not considered as a scenario to ascertain the impact assessment reduction.
4.2.2.6 Biogas Cleaning Operation
The produced biogas is a mixture of methane and carbon dioxide with other impurities like
nitrogen, oxygen, ammonia, hydrogen sulphide, water particles, dust [60]. Since biogas is to be
converted downstream into drop-in renewable diesel via F-T synthesis, impurities present in biogas
was stripped off [37] to ensure the F-T process impurity tolerance level (0.1 H2S) was maintained
[10]. High Pressure Water Scrubbing (HPWS) of biogas was employed in this operation which
generated biomethane (>96% methane) [36] product which is analogues to the natural gas
(methane) used for the GTL process [93]. During the biogas cleaning process, some amount of
thermal energy was recovered which was utilized in the overall process while the electrical energy
demand was met with the internally generated electricity. HPWS off-gas emission consisting of
2% methane loss [57] and the scrubbed impurities in biogas were considered as biogenic emissions
in this work. Our developed biogas to liquid fuels (BgTL) Aspen Plus model was used in
estimating the mass and energy balance for the HPWS process, which was used to access the
energy and environmental contribution of this process to the entire drop-in diesel production.

92
4.2.2.7 Biomethane Conversion to Syngas
In this analysis, biomethane was converted to syngas via a combination of partial oxidation
and steam reforming processes in order to achieve the overall syngas H2/CO ratio required for the
drop-in fuels production. The steam reforming process is a catalytic process that employed
Ni/Al2O3 for the conversion of biomethane to syngas. All process inputs such as catalyst, oxygen,
steam, heat, and electricity were accounted based on our process mass and energy balance obtained
from Aspen Plus model as shown in table 4-2 of life cycle inventory. Similarly, the emissions of
the process to water, land and air were considered when assessing the impact of the syngas
production to the overall drop-in fuels process.
4.2.2.8 Fischer Tropsch Synthesis
Syngas produced from biomethane was converted to synthetic crude in a similar fashion as
the commercial Fischer-Tropsch gas to liquid (GTL) process [10, 61, 77]. This technology has
grown so widely since its invention and it is renowned for its quality fuels and chemicals supply
[77]. In our model, a slurry cobalt catalyst-bubbled phase F-T reactor with an overall conversion
of 80% was employed for the liquid hydrocarbons production. The unconverted syngas stream
was used as fuel for electricity generation while the hydrocarbon product of the F-T process was
sent to the upgrading unit. An assumed 0.1% of catalyst consumed in the liquid fuels production
was estimated as solid emission to soil.
4.2.2.9 Product Upgrading
The products of F-T process are long chain hydrocarbons which includes paraffins, waxes,
and oxygenates depending on temperature of the F-T reaction process and catalyst used [10]. For
our process, the upgrading process considered consists of the hydrocarbon recovery, wax
hydrocracking, distillate hydrotreating, naptha hydrotreating, and product distillation in

93
accordance with the work of [23]. The desired product of this process, drop-in renewable diesel,
was obtained alongside other co-products such as LPG, drop-in gasoline, and wax. Product
allocation was based on energy value which corresponded to how the emissions were attributed.
4.2.2.10 Electricity Generation
The unconverted syngas was used as fuel to produce electricity in a combined cycle
process. Steam dilution was used in fuel combustion process to reduce the amount of NOx
formation [123]. Heat was recovered in a HRSG and used for the production of steam in a boiler,
which was used in the steam turbine and other plant processes while the exhaust gas was emitted
to the atmosphere. This electricity generated was used internally in whole process while the excess
was sold. The exhaust gas emission was also considered as biogenic.
The functional unit of this system was based on the main product of the process analysis.
Since the final product is a fuel, the unit was reported in energy basis: 1 gasoline gallon equivalent
(GGE) of drop-in renewable diesel. All material and energy balance were normalized based on the
functional unit. The reference system is fossil based diesel which is assumed to have the same
energy characteristics as drop-in diesel and can be used interchangeably.
4.2.3 Life Cycle Inventory (LCI) Analysis
The LCI for the Fischer Tropsch GTL process applied to the production of renewable
diesel from miscanthus includes inputs and outputs data obtained from literatures, reports and
validated miscanthus supply-chain logistics. All values were normalized based on the functional
unit (1 GGE of diesel). TRACI 2 v4.0, a life cycle assessment tool was used for the computation
of the input data and the resultant emissions associated with the inputs were generated. These
emissions were classified into water, air and soil in order to evaluate/categorize each impacts

94
appropriately. Table 4-2 shows the detailed input parameters, values and source of the data used
in this process analysis according to the specified system boundary. Detailed input data can be
found in the supplementary information document (includes ASPEN Plus data, basic
assumptions to estimate below numbers and any other emission data included for specific input
from other sources e.g. GREET model)

95
Table 4-2: Input parameters and values for the production of 1 GGE drop-in renewable diesel
from miscanthus Miscanthus Cultivation
Inputs from nature (resources) Value Unit Comment Ref
Occupation, arable, non-irrigated, fallow 0.002480351 ha Hectare based on yield Estimated
Inputs from technosphere (materials/fuels)
Rhizome 1.75 kg Average value of rhizome required [154, 155] Nitrogen fertilizer, production mix, at plant/US 0.084 kg Nitrogen input average value [156, 157]
Phosphorous fertilizer, production mix, at plant/US 0.011 Kg Estimated average input value [156, 158]
Potassium 0.175 kg Estimated average input value [156, 158] Herbicide 0.001 kg Estimated average input value [159, 160]
Diesel, combusted in industrial equipment/US 0.013 l Calculated based on operations Estimated
Feedstock Logistics
Inputs from technosphere (materials/fuels) Value Unit
Diesel, combusted in industrial equipment/US 0.073 l Diesel required for harvesting Estimated Transport, single unit truck, diesel powered/US 1.286 t km Based on plant capacity (60 km) Estimated
Feedstock Pretreatment
Inputs from nature (resources) Value Unit
Water, process and cooling, unspecified natural origin 0.032 m3
Water needed to pretreat feedstock
(60% MC) [89] Inputs from technosphere (materials/fuels)
Diesel, combusted in industrial equipment/US 0.154 l
Diesel for tub grinding operation
and pretreated feed loading to reactor [147]
Anaerobic Digestion
Inputs from nature (resources) Value Unit
Water, process and cooling, unspecified natural origin 0.027957895 t/hr Water to attain 75% MC of feed [89] Inputs from technosphere (materials/fuels)
Transport, single unit truck, diesel powered/US 0.284188 tkm Based on assumed digestate
transport distance Estimated
Inputs from technosphere (electricity/heat)
Electricity 0.10 kWh AD reactor electricity requirement [149]
Heat 0.17 kWh AD reactor thermal requirement [149]
Biogas Cleaning
Inputs from nature (resources) Value Unit
Air 10.44286227 kg Air for water scrubbing Aspen Plus
Water, process and cooling, unspecified natural origin 0.105110744 m3 Biogas absorption medium Aspen Plus
Inputs from technosphere (electricity/heat)
Electricity 0.93 kWh
Biogas upgrading electricity
required Aspen Plus
Syngas Production
Inputs from technosphere (materials/fuels) Value Unit
Steam 6.46 kg Steam biomethane reforming Aspen Plus
Oxygen 1.86 kg Partial oxidation oxygen Aspen Plus
Nickel Catalyst 0.01 kg Catalyst for steam reforming Aspen Plus Inputs from technosphere (electricity/heat)
Electricity 0.39 kWh
Unit operation electrical
requirement Aspen Plus
Heat 2.08 kWh Endothermic steam reforming heat
requirement Aspen Plus
Fischer-Tropsch Synthesis
Inputs from technosphere (materials/fuels) Value Unit
Cobalt, at plant/GLO S 0.00022303 kg F-T process catalyst requirement Aspen Plus Inputs from technosphere (electricity/heat)
Electricity 0.13 kWh
Compressor electricity
requirement Aspen Plus
Product Upgrade
Inputs from technosphere (materials/fuels) Value Unit
Platinum Catalyst 0.000101915 kg Hydrocracking catalyst Aspen Plus
Cobalt Catalyst 0.000507718 kg Hydrotreating catalyst Aspen Plus
Electricity Generation
Inputs from nature (resources) Value Unit
Water, cooling, unspecified natural origin/kg 22.28 kg Circulating water for steam cycle Aspen Plus Air 6.22 kg Excess air for fuel ignition Aspen Plus

96
4.2.4 Life Cycle Impact Assessment (LCIA)
The LCIA includes the natural resources used, energy, water and environmental impacts.
The environmental impacts to produce renewable diesel from miscanthus were estimated by
TRACI 2 developed by U.S EPA [161]. The impacts considered were ranked according to global,
regional and local impact categories showing the magnitude of its effect. Typically, global impacts
such as Global warming potential (GWP [kg CO2-eq]), Ozone depletion (kg CFC-11 eq), and
Ecotoxicity (kg 2, 4-D eq) are impacts that affects the international community. This impacts have
raised global concerns as the climate is adversely plagued. Acidification potential (H moles-eq])
is generally classified as either regional or local while Eutrophication (kg N eq) and Smog (g NOx
eq) are predominately a local impact. Other impacts such as Carcinogenic (kg benzene eq), Non-
carcinogenic (kg toluene eq), Respiratory effects (kg PM2.5 eq) are multi-ranked and can be either
of the three ranks.
4.2.5 Sensitivity Analysis
For the whole life cycle of the drop-in fuels production, a sensitivity analysis was conducted
for the critical parameters to determine the extent of impact when the parameters were varied. This
analysis is vital due to the extent of uncertainty in estimating the input parameters used in the drop-
in diesel process. In this study, factors for variation were based on the system boundary input
parameters that were judged to be sensitive to the entire process. Fertilizer inputs for the
miscanthus cultivation and the corresponding yield were key input to the process. The amount of
carbon sequestered on the soil which depends on the multiple factors was estimated from literature
data based on a range of value. Also feedstock transport distance to the bioenergy refinery is
another parameter that depends on the size of the biorefinery, yield, and other logistics. Fugitive
biogas emissions, extent of methane yield from miscanthus during AD process, methane

97
conversion to syngas, and the syngas conversion to drop-in fuels were all critical parameters that
determines the energy and environmental impacts of this process. In order to forestall the
possibility of capturing the impacts all these data, sensitivity analysis was carried out on the
abovementioned parameters. Environmental impact categories such as greenhouse gas (GHG),
smog formation, acidification, eutrophication, ecotoxicity, and fossil fuel energy consumption
were examined as the parameters were varied by 25%.
4.3 Results and Discussion
4.3.1 Impact Assessment
The analysis of the environmental impacts of the production of renewable diesel from
miscanthus was critically evaluated. Table 4-3 shows the inventory emissions data for the entire
life cycle of the miscanthus to drop-in fuel production.

98
Table 4-3: Inventory emissions for the production of 1 GGE of Renewable Diesel
Substance Unit Miscanthus
Cultivation Logistics
Feedstock
Pretreatment
Anaerobic
Digestion
Biogas
Upgrading
Syngas
Production
Fischer-
Tropsch
Synthesis
Product
Upgrade
Emissions to Air
Carbon dioxide,
biogenic g 0.142 2146.059 4763.876 725.122 3740.136 497.329 51.845 0.105
Carbon dioxide, fossil g 265.285 468.289 469.661 54.362 0.000 189.972 0.031 14.075
Carbon monoxide,
biogenic µg 0.000 0.000 0.000 378.047 247.005 106.714 29.352 0.000
Carbon monoxide, fossil µg 417.316 3187.932 4087.434 276.944 0.000 99.671 0.187621 32.838
Dinitrogen monoxide mg 264.216 8.308 0.369 1.851 0.035 0.635 0.004244 0.072
Methane, biogenic g 0.000 0.000 0.000 235.780 2.136 0.000 0.000 0.000
Methane, fossil mg 147.161 36.977 43.430 3.639 0.000 35.256 0.224 6.657
Nitrogen dioxide mg 0.000 0.000 0.000 2.422 1.582 24.588 0.188 0.000
Nitrogen monoxide mg 0.000 0.000 0.000 396.690 259.186 111.976 30.799 0.000
Nitrogen oxides g 352.524 5.829 8.570 0.392 0.000 0.572 0.002 0.049
Particulates, unspecified mg 73.099 43.174 44.972 4.841 0.000 117.388 0.094 21.467
Sulfur dioxide g 2.092 0.230 0.239 0.026 0.000 1.357 0.003 0.164
Sulfur oxides g 0.324 0.459 0.474 0.053 0.000 1.569 0.031 0.092
VOC, volatile organic
compounds mg 85.811 222.618 224.740 25.706 0.000 23.968 0.370 4.028
Emissions to Soil
Cobalt mg 0.000 0.000 0.000 0.008 0.000 0.008 0.408 1.015
Nickel mg 0.000 0.000 0.000 0.000 0.000 7.185 0.000 0.000
Emissions to Water
BOD5, Biological
Oxygen Demand mg 69.151 95.081 99.040 10.657 0.000 13.164 0.100 73.474
Chloride g 14.249 18.771 19.552 2.104 0.000 2.707 0.021 15.228
Cobalt µg 8.752 11.515 11.994 1.291 0.000 1.661 0.013 9.338
COD, Chemical Oxygen
Demand mg 116.983 180.521 188.037 20.232 0.000 22.401 0.168 123.649
Nickel µg 238.780 140.454 146.301 15.741 0.000 14.420 0.106 75.657
Suspended solids,
unspecified g 0.396 1.381 1.439 0.155 0.000 0.084 0.001 0.314

99
These emissions were categorized into air, soil and water with the top
emissions represented. It can be observed that some of the greenhouse gases
contributing to global warming such as CH4 and CO2 accrued from biogic origin
for which CO2 participates in photosynthesis and hence reduces the amount of
GHG emissions from this process.
Figure 4-2: Cradle to gate impact analysis of the production of 1 GGE of diesel
from Miscanthus
Fig. 4-2 shows the categories of impacts considered in this study
according to the different processes in the renewable diesel pathway that made
up the entire emission. Miscanthus cultivation, feedstock logistics, and
pretreatment contributed 80% of the total greenhouse gas (GHG) emission. This
0%
10%
20%
30%
40%
50%
60%
70%
80%
90%
100%
Miscanthus Cultivation Miscanthus Logistics
Feedstock Pretreatment Anaerobic Digestion
Biogas Upgrading Syngas Production
Fischer-Tropsch Synthesis Product Upgrade

100
is not far-fetched as they were the highest consumer of fossil energy. The
miscanthus cultivation was responsible for the 90% of acidification potential
due to the use of fertilizer (NPK) which is primarily the cause of acidification.
Biogas cleaning was chiefly accountable for the high eutrophication potential
of the entire process as 10% of the scrubbing water was purged in this process
to minimize build up of impurities. This purge water joins the local water bodies
contributing to the eutrophication formation. We discussed the different impact
categories in the subsection below to highlight key factors contributing to the
various categories.
4.3.1.1 Greenhouse Gas (GHG)
Emission of carbon dioxide, methane and nitrogen oxides are
greenhouse gases emitted during this process that contributed to global
warming potential. This impact is categorized by global warming potential
(GWP) reported in CO2 eq. A global warming potential of 1.8485 kg CO2
eq/GGE of renewable diesel was calculated for the base case scenario without
lime addition in the miscanthus cultivation. This high amount of emission was
due to the conversion of the carbon content in miscanthus lost during
transportation, storage, and pretreatment to carbon dioxide which adds up to the
overall GHG emission.
4.3.1.2 Smog Formation
Formation of smog are as a result of the emission of volatile organic
compounds (VOC) and nitrogen oxides which leaves airborne particles and
ground-level ozone in the atmosphere. It is estimated by the amount of ozone

101
level and reported in mass ozone equivalent (kg O3eq) which for this analysis a
9.1265 kg O3eq/GGE of renewable diesel was obtained. 96% of the
photochemical smog formation is from the combustion of the diesel fuel during
miscanthus cultivation which releases nitrogen oxides and other smog
formation causing compounds.
4.3.1.3 Acidification
Sulfur and nitrogen related emissions causes acidification which the
alteration in the pH level of the environment. Emission of nitrogen oxides,
ammonia, nitrogen dioxides, sulfur oxides, sulfur dioxides leads to atmospheric
acidification. Miscanthus cultivation is higest contributor to acidification
potential due to the amount of nitrogen related emissions accruing from the
process. The production of 1 GGE of renewable diesel resulted to a acidification
emissions of 15.37 H+ moles eq.
4.3.1.4 Eutrophication
The use of chemical fertilizers (NPK) are primarily the causes of
eutrophication emissions. This emission was as a result of miscanthus
cultivation which required fertilizer application. Environmental consequence of
the use of chemical fertilizers is the leaching of the chemicals to ground water
which generally causes algae bloom. This action occurred at the biogas cleaning
process as the water used for the absorption process is purged and would have
made its way to the ground water. A eutrophication potential of 2.0164 kg N eq
was estimated for the renewable diesel production which raises the

102
eutrophication level by approximately 99% compared to the fossil derived
diesel.
4.3.1.5 Ecotoxicity
Toxic emissions from natural or synthesized pollutants results to
adverse effects on the ecosystem. Such emissions are comparatively measured
alongside other toxic emissions to the atmosphere and reported in CTUe. 1 GGE
of renewable diesel causes 3.82 CTUe of ecotoxic emissions. Logistics and
pretreatment processes are chiefly the operations that jointly consistuted 68%
of the total ecotoxic emissions. Toxic emissions such as diesel emissions and
feedstock loss raises the ecotoxicity level.
4.3.1.6 Ozone Depletion
Main constituent of ozone depletion is the emission of
chlorofluorocarbon (CFC) and other halogenated compounds with chlorine and
bromine effects being more severe. Compared to fossil diesel, ozone depletion
potential of renewable diesel from miscanthus was calculated as 1.1734E-10 kg
CFC-11eq which 147% lower than that of fossil diesel.
4.3.2 Comparison with Fossil Derived Diesel
The cradle to gate (CTG) life cycle of miscanthus to drop-in renewable
diesel was compared with the fossil derived diesel in a typical U.S refinery.
This comparison was performed for the miscanthus cultivation without lime
addition (base scenario) and that with lime addition. The lime addition scenario
was considered due to the pH level of some strip-mined soil which might have

103
a high acid level and would need the soil condition to be balanced. For the
scenario without lime addition shown in fig 4-3, it shows that the GHG emission
of the renewable diesel from miscanthus contributed 65% of the emissions
which is approximately 86% higher than the fossil derived diesel. And for the
scenario that used lime for miscanthus cultivation, there is a 157% increase in
the greenhouse gas emission (GHG) when compared to the fossil derived
derived diesel as depicted in fig 4-4. From all indications, this defeats the
assertion of a greenhouse gas reduction from renewable sources which several
authors have reported.
Figure 4-3: Cradle to gate life cycle of miscanthus to drop-in renewable diesel
(without lime)
0%
10%
20%
30%
40%
50%
60%
70%
80%
90%
100%
Renewable Diesel Fossil Diesel

104
Figure 4-4: Cradle to gate life cycle of miscanthus to drop-in renewable diesel
(with lime)
However, it should be noted that the analysis did not consider the effect
of soil organic carbon sequesteration when accounting for the greenhouse gas
emission. Typically, some amount of carbon sequestered during the cultivation
of feedstock (biomass) is ususally taken as credit when reporting the greenhouse
gas (GHG) emission. Therefore when the amount of carbon sequestrated during
the feedstock culitvation is considered, there is a net GHG emission reduction
of 41% and 26% compared to the fossil diesel for the base scenario without
lime and that with lime addition respectively as shown in figs 4-5 and 4-6.
0%
10%
20%
30%
40%
50%
60%
70%
80%
90%
100%
Renewable Diesel Fossil Diesel

105
Figure 4-5: Comparison of the impact of production of 1 GGE of renewable
diesel from miscanthus without lime addition and 1 GGE of fossil diesel
Figure 4-6: Comparison of the impact of production of 1 GGE of renewable
diesel from miscanthus with lime addition and 1 GGE of fossil diesel
-80%
-60%
-40%
-20%
0%
20%
40%
60%
80%
100%
Renewable Diesel Fossil Diesel Net GHG
SOC
-60%
-40%
-20%
0%
20%
40%
60%
80%
100%
Renewable Diesel Fossil Diesel Net GHG
SOC

106
4.3.3 Sensitivity Analysis
Variation of the critical input parameters in the sensitivity analysis
showed the impact of certain data in the life cycle of the drop in fuels
production. Fig 4-7 – 4-12 shows the impact of F-T conversion, methane
conversion, miscanthus methane yield, feedstock cultivation yield, nitrogen
input, fugitive biogas emission, transport distance, and pretreatment loss on the
impact categories studied.
Production of the drop-in renewable diesel is highly dependent on the
F-T process and the extent of conversion to liquid fuel is vital in all respect
(economic and life cycle perspective). A drop in conversion (40% syngas
conversion) during the F-T process raises the GHG emission, acidification
potential, ecotoxicity, fossil energy consumption and smog formation to
approximately 80-100%. In the evident of an advancement in technology in
terms of better catalyst performance resulting to a 100% conversion
Figure 4-7: Sensitivity analysis for global warming potential
-100%-75% -50% -25% 0% 25% 50% 75% 100%
Yield (15Mg/ha:10Mg/ha:5 Mg/ha)
Transport Distance (40 km:60 km:80km)
Pretreatment loss (6.25%:12.5%:25%)
Methane Yield (218:180LCH4/kgVS:100)
Fugitive Biogas Emission (3%:5%:10%)
Methane Conversion (100%:96%:60%)
F-T Conversion (100%:80%:40%)
Nitrogen Input (20 kg/ha:40 kg/ha:60 kg/ha)
Global Warming

107
from the 80% maximum attainable conversion used for this analysis,
approximately 20% reduction in GHG emission, acidification potential,
ecotoxicity, fossil energy consumption and smog formation was achieved.
Another aspect of the renewable diesel production is methane conversion
during syngas production. If the presence of impurities causes catalyst sintering,
the 96% conversion achieved in the syngas productuion can drop up to 60%
with the formation of coke. As seen in figs 4-11, a 52% increase in fossil energy
use occurred while recording approximately 95% increase in photochemical
smog formation. Methane potential of miscanthus after pretreatment during
anaerobic digestion process has been reported to be within 0.179-0.218
m3CH4/kg VS.
Figure 4-8: Sensitivity analysis for acidification potential
-100% -75% -50% -25% 0% 25% 50% 75% 100%
Yield (15Mg/ha:10Mg/ha:5 Mg/ha)
Transport Distance (40 km:60 km:80km)
Pretreatment loss (6.25%:12.5%:25%)
Methane Yield (218:180LCH4/kgVS:100)
Fugitive Biogas Emission (3%:5%:10%)
Methane Conversion (100%:96%:60%)
F-T Conversion (100%:80%:40%)
Nitrogen Input (20 kg/ha:40 kg/ha:60 kg/ha)
Acidification

108
We employed an average value of 0.180 m3CH4/kg VS as the possible
methane yield in the base case process. However in unforeseen circumstances
surronding the performance of microbial activity during AD process, a 0.1
m3CH4/kg VS can be achieved. In such condition, fossil energy use increased
by 54% contributing to the GHG emission that increased by 70%. Miscanthus
cultivation on a strip-mined soil has an average yield of 10 Mg/ha which can
drop as low as of 5 Mg/ha or increase upto as 15 Mg/ha depending on
complex soil behavior. Conditions were the amount of harvestable biomass is
5 Mg/ha, there is a significant increase in emissions with acidification
potential being the most signigificant (96% increase). This is reasonable since
more fertilizers are required to achieve the amount of biomass needed for
downstream conversion.
Figure 4-9: Sensitivity analysis for Ecotoxicity potential
-100%-75% -50% -25% 0% 25% 50% 75% 100%
Yield (15Mg/ha:10Mg/ha:5 Mg/ha)
Transport Distance (40 km:60 km:80km)
Pretreatment loss (6.25%:12.5%:25%)
Methane Yield (218:180LCH4/kgVS:100)
Fugitive Biogas Emission (3%:5%:10%)
Methane Conversion (100%:96%:60%)
F-T Conversion (100%:80%:40%)
Nitrogen Input (20 kg/ha:40 kg/ha:60 kg/ha)
Ecotoxicity

109
As a result, N2O emissions from the use of Nitrogen fertilzers raises the
acid level of the atmosphere. It is not surprising that the drop in F-T conversion,
methane conversion during syngas production, and miscanthus methane yield
led to an increased demand for feedstock needed to achieve the functional unit.
Such situations raises the acidification level to 100%, 55% and 78%
respectively.
Wide range of amount of nitrogen required for miscanthus cultivation
has been reported by several authors with some authors reporting that no
nitrogen is required for miscanthus cultivation.
Figure 4-10: Sensitivity analysis for Eutrophication potential
Our analysis showed that the use of 20 kg/ha or 60 kg/ha of nitrogen
for cultivation did not result to a very significant change in emissions showing
that an optimum nitrogen input is established.
-100%-75% -50% -25% 0% 25% 50% 75% 100%
Yield (15Mg/ha:10Mg/ha:5 Mg/ha)
Transport Distance (40 km:60 km:80km)
Pretreatment loss (6.25%:12.5%:25%)
Methane Yield (218:180LCH4/kgVS:100)
Fugitive Biogas Emission (3%:5%:10%)
Methane Conversion (100%:96%:60%)
F-T Conversion (100%:80%:40%)
NOx Emission (-25%:0.26 kg/h:+25%)
Nitrogen Input (20 kg/ha:40 kg/ha:60 kg/ha)
Eutrophication

110
To enhance the breakdown of the carbohydrate structure of miscanthus,
the fungal pretreatment was employed. During the pretreatment process, a
12.5% dry matter loss of the feedstock was reported [148].
Figure 4-11: Sensitivity analysis for Fossil Energy use
Increased loss of biomass during pretreatment led to high demand of
feedstock to cover for the losses encountered during the pretreatment process.
The impact category with the most significant effect when the amount of dry
matter lost during pretreatment doubled was photochemical smog formation
(73%). Increase in fossil energy used for harvesting additional feedstock,
logistics, and pretreatment was the parameter that contributed to this extent of
emission. Biogas leaks from the digester referred to as fugitive biogas
emission was also significant when the 5% biogas fugitive emission was
doubled.
-100%-75% -50% -25% 0% 25% 50% 75% 100%
Yield (15Mg/ha:10Mg/ha:5 Mg/ha)
Transport Distance (40 km:60 km:80km)
Pretreatment loss (6.25%:12.5%:25%)
Methane Yield (218:180LCH4/kgVS:100)
Fugitive Biogas Emission (3%:5%:10%)
Methane Conversion (100%:96%:60%)
F-T Conversion (100%:80%:40%)
Nitrogen Input (20 kg/ha:40 kg/ha:60 kg/ha)
Fossil Energy Use

111
Figure 4-12: Sensitivity analysis for Photochemical Smog formation potential
The biogas plant capacity was used to estimate an average transport
distance from the farmland to the biorefinery using GIS model. An increase or
decrease in yield was modeled as the 40 km and 80 km transport distance to the
biorefinery respectively which showed the same magnitude of change in both
respects.
4.3.4 Other Impacts Analysis
4.3.4.1 Fossil Fuel Energy Consumption
Energy put in form of diesel for the cultivation, logistics (harvesting and
transportation), and pretreatement were accounted for in this analysis. The
production of 1 GGE of renewable diesel from miscanthus consumed a total of
29.178 MJ of fossil energy in its crade to gate life cycle. Fig 4-10 shows that
-100%-75% -50% -25% 0% 25% 50% 75% 100%
Yield (15Mg/ha:10Mg/ha:5 Mg/ha)
Transport Distance (40 km:60 km:80km)
Pretreatment loss (6.25%:12.5%:25%)
Methane Yield (218:180LCH4/kgVS:100)
Fugitive Biogas Emission (3%:5%:10%)
Methane Conversion (100%:96%:60%)
F-T Conversion (100%:80%:40%)
Nitrogen Input (20 kg/ha:40 kg/ha:60 kg/ha)
Smog

112
the pretreatment of miscathus is the highest consumer of fossil energy given the
amount of diesel used in the tub grinder and front-end loader.
The total energy consumed in the enitre life cycle of the drop-in diesel
production results to a positive net energy balance of 100.421 MJ/GGE. This
shows a sustainable energy production since the energy value in the product is
approximately 3 times the energy utilized for its production.
6.11
6.877.16
0.77
0.00
3.06
0.01
5.19
0
1
2
3
4
5
6
7
8F
oss
il E
ner
gy
Use
(M
J/G
GE
)
113
4.4 Conclusion
Drop-in renewable diesel production from miscanthus grown in the strip-
mined land have been explored. This process analysis was developed based on
the mass and energy balance obtained from our Aspen Plus model, certain
specific literature data and estimated GIS logistics. SimaPro v8 was used to
model the process via input and output basis and its energy and environmental
impacts calculated using TRACI 2 v4. For the entire cradle to gate (CTG) life
cycle of the renewable diesel from miscanthus, a greenhouse gas (GHG)
emission of 1.8485 kg CO2/GGE was emitted to the environment when
miscanthus was cultivated without the addition of lime. This emission is
approximately 86% higher than the fossil derived diesel which offers no
advantage to the use of renewable feedstock for the production of drop-in fuels.
Greenhouse gas (GHG) emission increased from 86% to 161% when lime was
used for the cultivation of miscanthus.
However, considering the merits of the carbon sequestered on the soil
during the cultivation of miscanthus, the greenhouse gas (GHG) emission
reported for the entire life cycle of the drop-in renewable diesel from
miscanthus is the net value. Therefore, there is a net greenhouse gas emission
reduction of 41% when the analysis is considered without the use of lime for
the cultivation of miscanthus. Even for the scenario were miscanthus was grown
with lime, there is still a 26% GHG reduction compared to the fossil derived
diesel which meets the renewable fuel standard target.

114
4.5 References
1. EPA, April 2014 Monthly Energy Review. 2014.
2. CBO, The Renewable Fuel Standard: Issues for 2014 and Beyond.
2014, Congretational Budget Office.
3. EPA. U.S Greenhouse Gas Inventory Report: 1990-2014. 2016 [cited
2016 06/06/2016]; Available from:
https://www3.epa.gov/climatechange/ghgemissions/usinventoryreport.
html.
4. Li, Y., et al., SOLID-STATE ANAEROBIC DIGESTION OF CORN
STOVER FOR BIOGAS PRODUCTION. Transactions of the Asabe,
2011. 54(4): p. 1415-1421.
5. Menardo, S., et al., Biogas production from steam-exploded
miscanthus and utilization of biogas energy and CO2 in greenhouses.
BioEnergy Research, 2013. 6(2): p. 620-630.
6. Uellendahl, H., et al., Energy balance and cost-benefit analysis of
biogas production from perennial energy crops pretreated by wet
oxidation. Water science and technology, 2008. 58(9): p. 1841-1847.
7. Deublein, D. and A. Steinhauser, Biogas from waste and renewable
resources: an introduction. 2011: John Wiley & Sons.
8. Rutz, D. and R. Janssen, Biofuel technology handbook. 2007, Munich,
Germany, WIP Renewable Energies.

115
9. Petersson, A. and A. WeLLInGer, Biogas upgrading technologies–
developments and innovations. IEA Bioenergy, 2009: p. 12-15.
10. Borjesson, P. and M. Berglund, Environmental systems analysis of
biogas systems - Part 1: Fuel-cycle emissions. Biomass & Bioenergy,
2006. 30(5): p. 469-485.
11. NRDC, Renewabale Energy for America. 2015, National Resources
Defence Council.
12. Zheng, Y., et al., Pretreatment of lignocellulosic biomass for enhanced
biogas production. Progress in Energy and Combustion Science, 2014.
42: p. 35-53.
13. Vasco-Correa, J. and Y. Li, Solid-state anaerobic digestion of fungal
pretreated Miscanthus sinensis harvested in two different seasons.
Bioresource technology, 2015. 185: p. 211-217.
14. American Biogas Council, American Biogas Council. 2015.
15. NREL, Energy Analysis-Biogas Potential in the United States. 2013,
U.S. Department of Energy.
16. Cozma, P., et al., Environmental impact assessment of high pressure
water scrubbing biogas upgrading technology. CLEAN–Soil, Air,
Water, 2013. 41(9): p. 917-927.
17. Dirkse, E., Biogas upgrading using the DMT TS-PWS® Technology.
DMT Environmental Technology, 2007.

116
18. Heaton, E.A., F.G. Dohleman, and S.P. Long, Meeting US biofuel
goals with less land: the potential of Miscanthus. Global Change
Biology, 2008. 14(9): p. 2000-2014.
19. Mishra, U., M.S. Torn, and K. Fingerman, Miscanthus biomass
productivity within US croplands and its potential impact on soil
organic carbon. GCB Bioenergy, 2013. 5(4): p. 391-399.
20. Agronomy, D.o., Factsheet | biomass: miscanthus. 2010, Iowa State
University.
21. Hodgson, E.M., et al., Variation in Miscanthus chemical composition
and implications for conversion by pyrolysis and thermo-chemical bio-
refining for fuels and chemicals. Bioresource technology, 2011.
102(3): p. 3411-3418.
22. Li, Y., S.Y. Park, and J. Zhu, Solid-state anaerobic digestion for
methane production from organic waste. Renewable and sustainable
energy reviews, 2011. 15(1): p. 821-826.
23. Kaliyan, N., et al., Commercial scale tub grinding of corn stover and
perennial grasses. Applied Engineering in Agriculture, 2012. 28(1): p.
79-85.
24. Jannasch, R., Y. Quan, and R. Samson, A process and energy analysis
of pelletizing switchgrass. Prepared by REAP-Canada (www. reap-
canada. com) for Natural Resources Canada, 2001.

117
25. Vasco-Correa, J., X. Ge, and Y. Li, Fungal pretreatment of non-sterile
miscanthus for enhanced enzymatic hydrolysis. Bioresource
technology, 2016. 203: p. 118-123.
26. Berglund, M. and P. Börjesson, Assessment of energy performance in
the life-cycle of biogas production. Biomass and Bioenergy, 2006.
30(3): p. 254-266.
27. IEA, Biogas from Crop Digestion. 2011: International Energy Agency.
28. Salter, A., Selection of Energy Crops. 2006.
29. Flesch, T.K., R.L. Desjardins, and D. Worth, Fugitive methane
emissions from an agricultural biodigester. Biomass and Bioenergy,
2011. 35(9): p. 3927-3935.
30. Wang, M., H. Huo, and S. Arora, Methods of dealing with co-products
of biofuels in life-cycle analysis and consequent results within the US
context. Energy Policy, 2011. 39(10): p. 5726-5736.
31. Jury, C., et al., Life cycle assessment of biogas production by
monofermentation of energy crops and injection into the natural gas
grid. Biomass and Bioenergy, 2010. 34(1): p. 54-66.
32. Yang, L.C., et al., Progress and perspectives in converting biogas to
transportation fuels. Renewable & Sustainable Energy Reviews, 2014.
40: p. 1133-1152.
33. Spath, P.L. and D.C. Dayton, Preliminary screening-technical and
economic assessment of synthesis gas to fuels and chemicals with

118
emphasis on the potential for biomass-derived syngas. 2003, DTIC
Document.
34. Hullu, J.d., et al., Comparing different biogas upgrading techniques.
Eindhoven University of Technology, 2008: p. 56.
35. IEA Bioenergy, Biogas upgrading and utilisation. 1999, IEA.
36. Dry, M.E., High quality diesel via the Fischer–Tropsch process–a
review. Journal of Chemical Technology and Biotechnology, 2002.
77(1): p. 43-50.
37. Bartholomew, C.H. and R.J. Farrauto, Fundamentals of industrial
catalytic processes. 2011: John Wiley & Sons.
38. Bechtel, Baseline Design/Economics for Advanced Fischer-Tropsch
Technology, in Topical Report Volume VI, DOE Contract No.DE-
AC22-91PC90027. 1996, US Department of Energy.
39. Chiesa, P., G. Lozza, and L. Mazzocchi. Using hydrogen as gas
turbine fuel. in ASME Turbo Expo 2003, collocated with the 2003
International Joint Power Generation Conference. 2003. American
Society of Mechanical Engineers.
40. Reed, D., D. Harper, and D. Hodges, Cradle-to-gate life cycle
assessment of switchgrass fuel pellets manufactured in the
southeastern United States. Wood and Fiber Science, 2015. 47(2): p.
147-159.

119
CHAPTER 5
5 CONCLUSIONS
Economic assessment of converting biogas to renewable transportation fuels
via Fischer-Tropsch synthesis was investigated as a feasible route to attain the
renewable fuels standard (RFS). Biogas is traditionally produced by the
anaerobic digestion (AD) of food wastes, animal manure, and waste water
either at a farm scale level or in a commercial scale. The farm scale AD plant
have been generally used for heating and electricity generation that serves the
farm needs while the industrial scale AD plants generates purified biogas for
direct heating or electricity production or for the production of Compressed
Natural Gas (CNG).
A process simulation model was developed using an ASPEN Plus
software platform to simulate biogas to liquid fuels (BgTL) technology via F-
T synthesis. Biogas primarily composed of methane, carbon dioxide, and
other impurities was cleaned using the high pressure water scrubbing (HPWS)
process technology which has an efficiency of 98%. By scrubbing the
impurities (CO2 and H2S) in biogas, the product of the cleaning process called,
biomethane composed of 97% methane. The energy requirement of the biogas
cleaning process was 0.2 kWh/Nm3 raw biogas upgraded. Such energy
consumption is feasible when compared to the energy value of upgraded

120
biogas which has same energy value as natural gas (39 MJ/Nm3). Hence, there
is a positive net energy balance in the biogas cleaning process which makes
the process technology viable. In addition to the minimal electrical energy
requirement of the process, proper heat integration approach recovered 75%
of the input electrical energy in the form of heat.
The biomethane product obtained after biogas cleaning was reformed
using a combination of steam and partial oxidation reforming processes to
achieve an overall methane conversion of 96% and a product yield of 68%.
Such extent of methane conversion was achieved by maintaining the steam to
carbon ratio (vol/vol) at approximately 4 in the steam reforming process while
keeping the reformer temperature at 850oC. For this combination of reforming
processes, a hydrogen to carbon monoxide ratio syngas ratio of 2.19 was
achieved which is necessary for the downstream conversion to hydrocarbon
fuels. Based on the syngas composition and slurry phase reactor (200oC and
26 bar) employed for the F-T process, Aspen Plus Fortran calculator was used
to estimate an alpha value of 0.9. An overall liquid fuels fractions yield of
53% (mass basis) was obtained when the F-T syncrude was upgraded and
distilled.
Techno-economic analysis of the biogas to drop-in renewable fuels
conducted using Aspen Process Economic Analyzer (APEA) resulted to a
total capital investment (TCI) and annual operating costs of $104.8 million
and $11.66 million for a plant size of 2000 Nm3/h. A discounted cash flow
rate of return was performed at a net present value of zero to estimate a selling

121
price of $5.99/gal ($5.59/GGE). A selling price of $2.64/gal ($2.46/GGE) was
obtained when the plant operates at a size of 10,000Nm3/h which further
reduces to $2.11/gal ($2/GGE) at a plant size of 20,000Nm3/h.
The cradle to gate life cycle analysis of the production of drop-in
diesel from miscanthus was also evaluated using TRACI 2 V4.0 based on the
mass and energy balance of the entire process. This analysis was conducted
for a functional unit of 1 gasoline gallon equivalent (GGE) of renewable drop-
in diesel which was compared to the 1 GGE of fossil derived diesel in U.S
refinery. All input and output were normalized based on the functional unit.
Processes such as miscanthus cultivation, feedstock logistics, miscanthus
pretreatment, anaerobic digestion (AD), biogas cleaning, syngas production,
Fischer-Tropsch synthesis, product upgrade, and power generation were
considered in this analysis accounting in details all the direct and indirect
emissions.
For the entire life cycle of the process, the greenhouse gas emission of
drop-in renewable diesel from miscanthus when miscanthus was cultivated
without the use of lime was 1.8485 kg CO2eq/GGE compared to the fossil
derived diesel of 0.987 kg CO2eq/GGE. This showed an 86% increase in the
greenhouse gas emission of the renewable diesel compared to the fossil
derived diesel. Analyzing the processes that contributed to the overall GHG of
the renewable diesel pathway, it was observed that miscanthus cultivation,
feedstock logistics, and feedstock pretreatment contributed 30%, 26% and
28% of the total 1.8485 kg CO2eq GHG emission respectively.

122
In an alternative case, where lime was needed to maintain the soil pH level,
the GHG emission increased from 1.8485 kg CO2eq to 2.57 kg CO2eq which
is approximately a 40% increase in overall greenhouse gas (GHG) emission
for the renewable diesel. Compared with that of the fossil derived diesel, a
greenhouse gas (GHG) emission increased to a magnitude of 161%.
Nevertheless, the proposition for a greenhouse gas emission reduction from
the use of lignocellulosic biomass for the production of drop-in fuels is still
feasible when carbon sequestration is put into consideration. The greenhouse
gas emission of the renewable diesel produced from miscanthus cultivated
without the addition of lime has a net greenhouse gas emission reduction of
41% compared to the fossil derived diesel when carbon sequestration was
considered. Even when lime was used for the cultivation of miscanthus, the
net greenhouse gas emission was reduced by 26% compared with that of the
fossil derived diesel.
In conclusion, the production of renewable diesel from miscanthus has
shown to offer a reduction in greenhouse gas emission when carbon
sequestration is considered. And the extent of reduction in emission is within
the stipulated target of 25% set by EPA’s renewable fuels standard (RFS).

123
REFERENCE
1. BP, BP Statistical Review of World Energy 63rd, Editor. 2014.
2. Schindler, J. and W. Zittel, Crude oil–The supply outlook. Energy
watch group, 2008.
3. US Census Bureau, Popluation Clock. 2015, United States Census
Bureau.
4. ExxonMobil, Outlook for Energy: A View to 2040. 2015.
5. Wang, M., et al., Projection of Chinese motor vehicle growth, oil
demand, and CO {sub 2} emissions through 2050. 2006, ANL.
6. Forman, G.S., T.E. Hahn, and S.D. Jensen, Greenhouse gas emission
evaluation of the GTL pathway. Environmental science & technology,
2011. 45(20): p. 9084-9092.
7. Floudas, C.A., J.A. Elia, and R.C. Baliban, Hybrid and single
feedstock energy processes for liquid transportation fuels: a critical
review. Computers & Chemical Engineering, 2012. 41: p. 24-51.
8. Perlack, R.D., et al., Biomass as feedstock for a bioenergy and
bioproducts industry: the technical feasibility of a billion-ton annual
supply. 2005, DTIC Document.
9. Milbrandt, A., A geographic perspective on the current biomass
resource availability in the United States. 2005: United States.
Department of Energy.

124
10. Spath, P.L. and D.C. Dayton, Preliminary screening-technical and
economic assessment of synthesis gas to fuels and chemicals with
emphasis on the potential for biomass-derived syngas. 2003, DTIC
Document.
11. Tijmensen, M.J., et al., Exploration of the possibilities for production
of Fischer Tropsch liquids and power via biomass gasification.
Biomass and Bioenergy, 2002. 23(2): p. 129-152.
12. Hamelinck, C.N., et al., Production of FT transportation fuels from
biomass; technical options, process analysis and optimisation, and
development potential. Energy, 2004. 29(11): p. 1743-1771.
13. Larson, E.D., H. Jin, and F.E. Celik, Large‐scale gasification‐based
coproduction of fuels and electricity from switchgrass. Biofuels,
Bioproducts and Biorefining, 2009. 3(2): p. 174-194.
14. Swanson, R.M., et al., Techno-economic analysis of biomass-to-liquids
production based on gasification. Fuel, 2010. 89: p. S11-S19.
15. Li, Y., S.Y. Park, and J. Zhu, Solid-state anaerobic digestion for
methane production from organic waste. Renewable and sustainable
energy reviews, 2011. 15(1): p. 821-826.
16. NREL, Energy Analysis-Biogas Potential in the United States. 2013,
U.S. Department of Energy.
17. American Biogas Council, American Biogas Council. 2015.

125
18. Li, Y.B., S.Y. Park, and J.Y. Zhu, Solid-state anaerobic digestion for
methane production from organic waste. Renewable & Sustainable
Energy Reviews, 2011. 15(1): p. 821-826.
19. Ward, A.J., et al., Optimisation of the anaerobic digestion of
agricultural resources. Bioresource technology, 2008. 99(17): p.
7928-7940.
20. Williams, R.H., et al., Methanol and hydrogen from biomass for
transportation. Energy for Sustainable Development, 1995. 1(5): p.
18-34.
21. Phillips, S. and T.J. Eggeman, Thermochemical ethanol via indirect
gasification and mixed alcohol synthesis of lignocellulosic biomass.
Vol. 112. 2007: Citeseer.
22. Dutta, Process design and economics for conversion of lignocellulosic
biomass to ethanol. Contract, 2011. 303: p. 275-3000.
23. Bechtel, Baseline Design/Economics for Advanced Fischer-Tropsch
Technology, in Topical Report Volume VI, DOE Contract No.DE-
AC22-91PC90027. 1996, US Department of Energy.
24. McKellar, J.M., et al., A life cycle greenhouse gas emissions
perspective on liquid fuels from unconventional Canadian and US
fossil sources. International Journal of Global Warming, 2009. 1(1): p.
160-178.
25. EIA, Petroleum & Other Liquids. 2015, US Energy Information
Administration.

126
26. EIA, Today in Energy. 2014, US Energy Informatin Agency.
27. Borjesson, P. and M. Berglund, Environmental systems analysis of
biogas systems - Part 1: Fuel-cycle emissions. Biomass & Bioenergy,
2006. 30(5): p. 469-485.
28. Garg, A., S. Vishwanathan, and V. Avashia, Life cycle greenhouse gas
emission assessment of major petroleum oil products for transport and
household sectors in India. Energy Policy, 2013. 58: p. 38-48.
29. Hao, H., et al., Energy consumption and GHG emissions of GTL fuel
by LCA: Results from eight demonstration transit buses in Beijing.
Applied Energy, 2010. 87(10): p. 3212-3217.
30. Swain, P.K., L. Das, and S. Naik, Biomass to liquid: a prospective
challenge to research and development in 21st century. Renewable
and Sustainable Energy Reviews, 2011. 15(9): p. 4917-4933.
31. Wang, M., H. Lee, and J. Molburg, Allocation of energy use in
petroleum refineries to petroleum products. The International Journal
of Life Cycle Assessment, 2004. 9(1): p. 34-44.
32. Van Vliet, O.P., A.P. Faaij, and W.C. Turkenburg, Fischer–Tropsch
diesel production in a well-to-wheel perspective: a carbon, energy
flow and cost analysis. Energy Conversion and Management, 2009.
50(4): p. 855-876.
33. Furuholt, E., Life cycle assessment of gasoline and diesel. Resources,
Conservation and recycling, 1995. 14(3): p. 251-263.

127
34. Lusk, P. and A. Wiselogel, Methane recovery from animal manures:
the current opportunities casebook. Vol. 3. 1998: National Renewable
Energy Laboratory Golden, CO.
35. Weltec Biopower. Agricultural biogas plants. 2016 07/11/2016];
Available from: http://www.weltec-biopower.com/Renewable-raw-
materials.1235.0.html?&L=0.
36. Petersson, A. and A. WeLLInGer, Biogas upgrading technologies–
developments and innovations. IEA Bioenergy, 2009: p. 12-15.
37. Yang, L.C., et al., Progress and perspectives in converting biogas to
transportation fuels. Renewable & Sustainable Energy Reviews, 2014.
40: p. 1133-1152.
38. Speight, J.G., The biofuels handbook. Vol. 5. 2010: Royal Society of
Chemistry.
39. Allegue, L.B., J. Hinge, and K. Allé, Biogas and bio-syngas
upgrading. Danish Technological Institute, Aarhus, Denmark, 2012.
40. Li, Y., et al., SOLID-STATE ANAEROBIC DIGESTION OF CORN
STOVER FOR BIOGAS PRODUCTION. Transactions of the Asabe,
2011. 54(4): p. 1415-1421.
41. Xu, F., et al., Comparison of different liquid anaerobic digestion
effluents as inocula and nitrogen sources for solid-state batch
anaerobic digestion of corn stover. Waste Management, 2013. 33(1):
p. 26-32.
128
42. Mata-Alvarez, J., S. Mace, and P. Llabres, Anaerobic digestion of
organic solid wastes. An overview of research achievements and
perspectives. Bioresource technology, 2000. 74(1): p. 3-16.
43. Guendouz, J., et al., High-solids anaerobic digestion: comparison of
three pilot scales. 2008.
44. Zheng, Y., et al., Pretreatment of lignocellulosic biomass for enhanced
biogas production. Progress in Energy and Combustion Science, 2014.
42: p. 35-53.
45. Hansen, K.H., I. Angelidaki, and B.K. Ahring, Anaerobic digestion of
swine manure: inhibition by ammonia. Water research, 1998. 32(1): p.
5-12.
46. Wen, Z., C. Frear, and S. Chen, Anaerobic digestion of liquid dairy
manure using a sequential continuous‐stirred tank reactor system.
Journal of Chemical Technology and Biotechnology, 2007. 82(8): p.
758-766.
47. Martin, D., L. Potts, and V. Heslop, Reaction Mechanisms in Solid-
State Anaerobic Digestion: 1. The Reaction Front Hypothesis. Process
Safety and Environmental Protection, 2003. 81(3): p. 171-179.
48. Mosier, N., et al., Features of promising technologies for pretreatment
of lignocellulosic biomass. Bioresource technology, 2005. 96(6): p.
673-686.
49. Aresta, M., A. Dibenedetto, and F. Dumeignil, Biorefinery: from
biomass to chemicals and fuels. 2012: Walter de Gruyter.

129
50. Liew, L.N., J. Shi, and Y. Li, Methane production from solid-state
anaerobic digestion of lignocellulosic biomass. Biomass and
Bioenergy, 2012. 46: p. 125-132.
51. Jagadish, K., et al., Plug flow digestors for biogas generation from leaf
biomass. Biomass and Bioenergy, 1998. 14(5): p. 415-423.
52. Macias-Corral, M., et al., Anaerobic digestion of municipal solid waste
and agricultural waste and the effect of co-digestion with dairy cow
manure. Bioresource Technology, 2008. 99(17): p. 8288-8293.
53. Lansing, S., et al., Methane production in low-cost, unheated, plug-
flow digesters treating swine manure and used cooking grease.
Bioresource Technology, 2010. 101(12): p. 4362-4370.
54. Kumar, P., et al., Methods for pretreatment of lignocellulosic biomass
for efficient hydrolysis and biofuel production. Industrial &
Engineering Chemistry Research, 2009. 48(8): p. 3713-3729.
55. Holtzapple, M.T., et al., Pretreatment of lignocellulosic municipal
solid waste by ammonia fiber explosion (AFEX). Applied
Biochemistry and Biotechnology, 1992. 34(1): p. 5-21.
56. Zhao, X., K. Cheng, and D. Liu, Organosolv pretreatment of
lignocellulosic biomass for enzymatic hydrolysis. Applied
microbiology and biotechnology, 2009. 82(5): p. 815-827.
57. IEA Bioenergy, Biogas upgrading and utilisation. 1999, IEA.
58. BioCNG, Converting biogas to CNG. 2015, BioCNG LLC.
59. AgStar, U.S. Anaerobic Digester Status Report. 2010, USEPA.

130
60. Dirkse, E., Biogas upgrading using the DMT TS-PWS® Technology.
DMT Environmental Technology, 2007.
61. Bartholomew, C.H. and R.J. Farrauto, Fundamentals of industrial
catalytic processes. 2011: John Wiley & Sons.
62. Lavoie, J.-M., Review on dry reforming of methane, a potentially more
environmentally-friendly approach to the increasing natural gas
exploitation. Frontiers in chemistry, 2014. 2.
63. Fan, M.S., A.Z. Abdullah, and S. Bhatia, Catalytic technology for
carbon dioxide reforming of methane to synthesis gas. ChemCatChem,
2009. 1(2): p. 192-208.
64. Dry, M.E., The Fischer–Tropsch process: 1950–2000. Catalysis today,
2002. 71(3): p. 227-241.
65. Ermolaev, I.S., V.S. Ermolaev, and V.Z. Mordkovich, Efficiency of
gas-to-liquids technology with different synthesis gas production
methods. Industrial & Engineering Chemistry Research, 2014. 53(7):
p. 2758-2763.
66. Balat, M., et al., Main routes for the thermo-conversion of biomass
into fuels and chemicals. Part 2: Gasification systems. Energy
Conversion and Management, 2009. 50(12): p. 3158-3168.
67. Abatzoglou, N., et al. Green diesel from Fischer–Tropsch synthesis:
challenges and hurdles. in 3rd IASME/WSEAS International
Conference on Energy, Environment, Ecosystems and Sustainable
Development. Greece. 2007.
131
68. Demirbas, A., Biofuels sources, biofuel policy, biofuel economy and
global biofuel projections. Energy conversion and management, 2008.
49(8): p. 2106-2116.
69. Anderson, R.B., H. Kölbel, and M. Ralek, The Fischer-Tropsch
Synthesis. Vol. 16. 1984: Academic Press New York.
70. Dry, M., The fischer-tropsch synthesis. Catalysis science and
technology, 1981. 1: p. 159-255.
71. Bukur, D.B., et al., ACTIVATION STUDIES WITH A PRECIPITATED
IRON CATALYST FOR FISCHER-TROPSCH SYNTHESIS .2.
REACTION STUDIES. Journal of Catalysis, 1995. 155(2): p. 366-375.
72. Ma, W.-P., et al., An investigation of chain growth probability in
Fischer-Tropsch synthesis over an industrial Fe− Cu− K catalyst.
Reaction Kinetics and Catalysis Letters, 1999. 66(2): p. 217-223.
73. Song, H.-S., et al., Operating strategies for Fischer-Tropsch reactors:
A model-directed study. Korean Journal of Chemical Engineering,
2004. 21(2): p. 308-317.
74. Steynberg, A. and M. Dry, Fischer-Tropsch Technology. 2004:
Elsevier.
75. Mirzaei, A.A., S. Vahid, and M. Feyzi, Fischer-Tropsch synthesis over
iron manganese catalysts: Effect of preparation and operating
conditions on catalyst performance. Advances in Physical Chemistry,
2008. 2009.
132
76. Boerrigter, H. and R. Rauch, Review of applications of gases from
biomass gasification. ECN Biomassa, Kolen en Milieuonderzoek,
2006. 20.
77. Dry, M.E., High quality diesel via the Fischer–Tropsch process–a
review. Journal of Chemical Technology and Biotechnology, 2002.
77(1): p. 43-50.
78. Demirbas, A., Converting Biomass derived synthetic gas to fuels via
fisher-tropsch synthesis. Energy Sources Part a-Recovery Utilization
and Environmental Effects, 2007. 29(16): p. 1507-1512.
79. Lutz, B., New age gas-to-liquids processing. Hydrocarbon
Engineering, 2001. 6(11): p. 23-28.
80. Faaij, A., B. Meuleman, and R. van Ree, Long Term Perspectives of
Biomass Integrated Gasification with Combined Cycle Technology:
Costs and Efficiency and a Comparison with Combustion. 1998:
NOVEM, The Netherlands Agency for Energy and the Environment.
81. EIA, U.S Energy Information Administration Annual Energy Review
2015.
82. EIA, U.S. Energy Information Administration: Monthly Energy
Review. 2014.
83. DOE, National Transportation Statistics. 2015, Research and
Innovative Technology Administration: Department of Transportation
84. Environment Canada, Government of Canada Energy Production:
Fossil Fuels 2013: Canada.

133
85. EPA, U.S. Environmental Protection Agency (EPA), Inventory of U.S.
Greenhouse Gas Emissions and Sinks. 2014.
86. DOE, Transportation in the United States. 2013, U.S Department of
Transportation, Bureau of Transportation Statistics.
87. Nanaki, E.A. and C.J. Koroneos, Comparative LCA of the use of
biodiesel, diesel and gasoline for transportation. Journal of Cleaner
Production, 2012. 20(1): p. 14-19.
88. Wong, A., H. Zhang, and A. Kumar, Life cycle assessment of
renewable diesel production from lignocellulosic biomass. The
International Journal of Life Cycle Assessment, 2016: p. 1-21.
89. Vasco-Correa, J. and Y. Li, Solid-state anaerobic digestion of fungal
pretreated Miscanthus sinensis harvested in two different seasons.
Bioresource technology, 2015. 185: p. 211-217.
90. Uellendahl, H., et al., Energy balance and cost-benefit analysis of
biogas production from perennial energy crops pretreated by wet
oxidation. Water science and technology, 2008. 58(9): p. 1841-1847.
91. Hills, D.J., Effects of carbon: nitrogen ratio on anaerobic digestion of
dairy manure. Agricultural wastes, 1979. 1(4): p. 267-278.
92. IEA, Biogas from Crop Digestion. 2011: International Energy Agency.
93. Hullu, J.d., et al., Comparing different biogas upgrading techniques.
Eindhoven University of Technology, 2008: p. 56.

134
94. Shell. The Worlds Largest Gas to Liquids Plant. 2016 [cited 2016
06/24/2016]; Available from: http://www.shell.com/about-us/major-
projects/pearl-gtl/the-world-s-largest-gas-to-liquids-plant.html.
95. CBO, The Renewable Fuel Standard: Issues for 2014 and Beyond.
2014, Congretational Budget Office.
96. RFA. World Fuel Ethanol Production. 2016 [cited 2016 04/19/2016];
Available from:
http://www.ethanolrfa.org/resources/industry/statistics/#14540989964
79-8715d404-e546.
97. LemvigBiogas. [cited 2015; Available from:
http://www.lemvigbiogas.com/.
98. Weiland, P., Biogas production: current state and perspectives.
Applied Microbiology and Biotechnology, 2010. 85(4): p. 849-860.
99. Persson, M., O. Jönsson, and A. Wellinger. Biogas upgrading to
vehicle fuel standards and grid injection. in IEA Bioenergy task. 2006.
100. Tippayawong, N. and P. Thanompongchart, Biogas quality upgrade by
simultaneous removal of CO 2 and H 2 S in a packed column reactor.
Energy, 2010. 35(12): p. 4531-4535.
101. Lennart Erfors. Biogas Kristianstad. 2009 [cited 2016 06/12/2016];
Available from:
https://www.kristianstad.se/upload/Sprak/dokument/2%20Biogas%20
Kristianstad%20brochure%202009.pdf.

135
102. Rakass, S., et al., Steam reforming of methane over unsupported nickel
catalysts. Journal of Power sources, 2006. 158(1): p. 485-496.
103. Oliveira, E.L.G., C.A. Grande, and A.E. Rodrigues, STEAM
METHANE REFORMING IN A Ni/Al2O3 CATALYST: KINETICS
AND DIFFUSIONAL LIMITATIONS IN EXTRUDATES. Canadian
Journal of Chemical Engineering, 2009. 87(6): p. 945-956.
104. Greene, D.L., An assessment of energy and environmental issues
related to the use of gas-to-liquid fuels in transportation. 1999: Oak
Ridge National Laboratory Oak Ridge, TN.
105. Qureshi, N., et al., An economic evaluation of biological conversion of
wheat straw to butanol: a biofuel. Energy Conversion and
Management, 2013. 65: p. 456-462.
106. Phillips, S., Technoeconomic analysis of a lignocellulosic biomass
indirect gasification process to make ethanol via mixed alcohols
synthesis. Industrial & Engineering Chemistry Research, 2007. 46(26):
p. 8887-8897.
107. Okoli, C. and T.A. Adams, Design and economic analysis of a
thermochemical lignocellulosic biomass-to-butanol process. Industrial
& Engineering Chemistry Research, 2014. 53(28): p. 11427-11441.
108. Boerrigter, H., H. den Uil, and H.-P. Calis, Green diesel from biomass
via Fischer-Tropsch synthesis: new insights in gas cleaning and
process design. 2003, CPL Press: Newbury, UK. p. 371-383.

136
109. Larson, E.D., H. Jin, and F.E. Celik, Gasification-based fuels and
electricity production from biomass, without and with carbon capture
and storage. Princeton Environmental Institute, Princeton University,
2005.
110. York, A.P., T. Xiao, and M.L. Green, Brief overview of the partial
oxidation of methane to synthesis gas. Topics in Catalysis, 2003. 22(3-
4): p. 345-358.
111. Samuel, P., GTL technology-Challenges and opportunities in catalysis.
Europe, 2000. 192(3): p. 8.
112. Xu, J.G. and G.F. Froment, METHANE STEAM REFORMING,
METHANATION AND WATER-GAS SHIFT .1. INTRINSIC
KINETICS. Aiche Journal, 1989. 35(1): p. 88-96.
113. Liu, J.A., Kinetics, catalysis and mechanism of methane steam
reforming. 2006, WORCESTER POLYTECHNIC INSTITUTE.
114. Eilers, J., S. Posthuma, and S. Sie, The shell middle distillate synthesis
process (SMDS). Catalysis Letters, 1990. 7(1-4): p. 253-269.
115. Aspen Technology, Aspen Plus 12.1 user guide. 2003.
116. Fox, J.M., Fischer-Tropsch reactor selection. Catalysis Letters, 1990.
7(1): p. 281-292.
117. Espinoza, R., et al., Low temperature Fischer–Tropsch synthesis from
a Sasol perspective. Applied Catalysis A: General, 1999. 186(1): p.
13-26.
137
118. Leckel, D., Noble metal wax hydrocracking catalysts supported on
high-siliceous alumina. Industrial & engineering chemistry research,
2007. 46(11): p. 3505-3512.
119. DOE. 2006 [cited 04/08/2015; Available from: http://www.fischer-
tropsch.org/DOE/DOE_reports/88014638/wax-sct5.pdf.
120. Lamprecht, D., R. Nel, and D. Leckel, Production of On-Specification
Fuels in Coal-to-Liquid (CTL) Fischer− Tropsch Plants Based on
Fixed-Bed Dry Bottom Coal Gasification. Energy & Fuels, 2009.
24(3): p. 1479-1486.
121. Jones, D.S. and P.P. Pujadó, Handbook of petroleum processing. 2006:
Springer Science & Business Media.
122. Green, D.W., Perry's chemical engineers' handbook. Vol. 796. 2008:
McGraw-hill New York.
123. Chiesa, P., G. Lozza, and L. Mazzocchi. Using hydrogen as gas
turbine fuel. in ASME Turbo Expo 2003, collocated with the 2003
International Joint Power Generation Conference. 2003. American
Society of Mechanical Engineers.
124. Short, W., D.J. Packey, and T. Holt, A manual for the economic
evaluation of energy efficiency and renewable energy technologies.
2005: University Press of the Pacific.
125. Montague, L., A. Slayton, and J. Lukas, Lignocellulosic biomass to
ethanol process design and economics utilizing co-current dilute acid

138
prehydrolysis and enzymatic hydrolysis for corn stover. 2002,
Citeseer.
126. Peters, M.S., et al., Plant design and economics for chemical
engineers. Vol. 4. 1968: McGraw-Hill New York.
127. Humbird, D., et al., Process design and economics for biochemical
conversion of lignocellulosic biomass to ethanol: dilute-acid
pretreatment and enzymatic hydrolysis of corn stover. 2011.
128. Beddoes, J.C., et al., An analysis of energy production costs from
anaerobic digestion systems on US livestock production facilities.
USDA NRCS Technical Note, 2007(1).
129. EIA. Electricity. 2014; Available from:
http://www.eia.gov/electricity/state/.
130. CostWater. [cited 2016 04/05/2016]; Available from:
http://www.costwater.com/runningcostwastewater.htm.
131. Brown, T.R., et al., Techno‐economic analysis of biobased chemicals
production via integrated catalytic processing. Biofuels, Bioproducts
and Biorefining, 2012. 6(1): p. 73-87.
132. Mahin Rameshni, Cost Effective Options to Expand SRU Capacity
Using Oxygen 2002: WorleyParsons.
133. Argus Global Wax. 2015 [cited 2016 04/02/2016]; Available from:
argusmedia.com.

139
134. Bauer, F., et al., Biogas upgrading–technology overview, comparison
and perspectives for the future. Biofuels, Bioproducts and Biorefining,
2013. 7(5): p. 499-511.
135. Bao, B., M.M. El-Halwagi, and N.O. Elbashir, Simulation, integration,
and economic analysis of gas-to-liquid processes. Fuel Processing
Technology, 2010. 91(7): p. 703-713.
136. EPA, April 2014 Monthly Energy Review. 2014.
137. EPA. U.S Greenhouse Gas Inventory Report: 1990-2014. 2016 [cited
2016 06/06/2016]; Available from:
https://www3.epa.gov/climatechange/ghgemissions/usinventoryreport.
html.
138. Menardo, S., et al., Biogas production from steam-exploded
miscanthus and utilization of biogas energy and CO2 in greenhouses.
BioEnergy Research, 2013. 6(2): p. 620-630.
139. Deublein, D. and A. Steinhauser, Biogas from waste and renewable
resources: an introduction. 2011: John Wiley & Sons.
140. Rutz, D. and R. Janssen, Biofuel technology handbook. 2007, Munich,
Germany, WIP Renewable Energies.
141. NRDC, Renewabale Energy for America. 2015, National Resources
Defence Council.
142. Cozma, P., et al., Environmental impact assessment of high pressure
water scrubbing biogas upgrading technology. CLEAN–Soil, Air,
Water, 2013. 41(9): p. 917-927.

140
143. Heaton, E.A., F.G. Dohleman, and S.P. Long, Meeting US biofuel
goals with less land: the potential of Miscanthus. Global Change
Biology, 2008. 14(9): p. 2000-2014.
144. Mishra, U., M.S. Torn, and K. Fingerman, Miscanthus biomass
productivity within US croplands and its potential impact on soil
organic carbon. GCB Bioenergy, 2013. 5(4): p. 391-399.
145. Agronomy, D.o., Factsheet | biomass: miscanthus. 2010, Iowa State
University.
146. Hodgson, E.M., et al., Variation in Miscanthus chemical composition
and implications for conversion by pyrolysis and thermo-chemical bio-
refining for fuels and chemicals. Bioresource technology, 2011.
102(3): p. 3411-3418.
147. Kaliyan, N., et al., Commercial scale tub grinding of corn stover and
perennial grasses. Applied Engineering in Agriculture, 2012. 28(1): p.
79-85.
148. Vasco-Correa, J., X. Ge, and Y. Li, Fungal pretreatment of non-sterile
miscanthus for enhanced enzymatic hydrolysis. Bioresource
technology, 2016. 203: p. 118-123.
149. Berglund, M. and P. Börjesson, Assessment of energy performance in
the life-cycle of biogas production. Biomass and Bioenergy, 2006.
30(3): p. 254-266.
150. Salter, A., Selection of Energy Crops. 2006.

141
151. Flesch, T.K., R.L. Desjardins, and D. Worth, Fugitive methane
emissions from an agricultural biodigester. Biomass and Bioenergy,
2011. 35(9): p. 3927-3935.
152. Wang, M., H. Huo, and S. Arora, Methods of dealing with co-products
of biofuels in life-cycle analysis and consequent results within the US
context. Energy Policy, 2011. 39(10): p. 5726-5736.
153. Jury, C., et al., Life cycle assessment of biogas production by
monofermentation of energy crops and injection into the natural gas
grid. Biomass and Bioenergy, 2010. 34(1): p. 54-66.
154. Lewandowski, I., et al., The development and current status of
perennial rhizomatous grasses as energy crops in the US and Europe.
Biomass and Bioenergy, 2003. 25(4): p. 335-361.
155. Heaton, E.A., et al., Miscanthus for renewable energy generation:
European Union experience and projections for Illinois. Mitigation
and Adaptation Strategies for Global Change, 2004. 9(4): p. 433-451.
156. Cadoux, S., et al., Nutrient requirements of Miscanthus x giganteus:
conclusions from a review of published studies. Biomass and
Bioenergy, 2012. 38: p. 14-22.
157. Heaton, E.A., F.G. Dohleman, and S.P. Long, Seasonal nitrogen
dynamics of Miscanthus× giganteus and Panicum virgatum. GCB
Bioenergy, 2009. 1(4): p. 297-307.

142
158. Christian, D., A. Riche, and N. Yates, Growth, yield and mineral
content of Miscanthus× giganteus grown as a biofuel for 14 successive
harvests. Industrial crops and products, 2008. 28(3): p. 320-327.
159. Arundale, R.A., et al., Yields of Miscanthus× giganteus and Panicum
virgatum decline with stand age in the Midwestern USA. GCB
Bioenergy, 2014. 6(1): p. 1-13.
160. Khanna, M., B. Dhungana, and J. Clifton-Brown, Costs of producing
miscanthus and switchgrass for bioenergy in Illinois. Biomass and
Bioenergy, 2008. 32(6): p. 482-493.
161. Reed, D., D. Harper, and D. Hodges, Cradle-to-gate life cycle
assessment of switchgrass fuel pellets manufactured in the
southeastern United States. Wood and Fiber Science, 2015. 47(2): p.
147-159.
162. Sinnott, R., Coulson & Richardson’s chemical engineering, vol. 6.
Chemical Engineering Design, 2005. 4.

143
APPENDIX
Supporting Information (SI) for
Techno-Economic assessments of biogas to liquid fuels conversion
technology via Fisher-Tropsch synthesis

144
1. Introduction
1.1. Biogas methane potential in the United States
Globally, food waste, animal manure and other organic solid wastes are co-
digested in an anaerobic digester to produce biogas. In the United States, the
reported methane potential from animal manure, landfill, wastewater, and
industrial, institutional and commercial organic waste is estimated to be about
8 million tonnes per year.
8 million tonnes x 1000 kg / 1 tonne x 1m3 /0.656 kg = 12 billion m3 per
annum of methane
This high annual amount of methane makes biogas a potential feedstock for
the production of drop-in fuels via Fischer-Tropsch synthesis, which formed
the basis of our work.
1.2. Biogas Plant and F-T process integration
Although biorefineries such as an ethanol production plant are normally
constructed as a stand-alone facility with feedstock sourced within some
radius away, biogas plant can be expanded to include an F-T liquid fuels
processing facility. Conventionally, biogas is pipelined for further
downstream processing such as in a liquid fuels production facility that
converts the biogas to drop-in fuels, which is the rationale for this study.
2. Aspen Plus model kinetics and equations
2.1. Simulation methods:
We employed the aid of a process simulation tool, Aspen Plus v8.8, to
model the biogas to liquid (BgTL) drop-in fuels plant. The components
specification that represents the overall feed and products compositions

145
include: N2, CO2, H2S, H2, O2, H2O, Air. CH4 and C2-C20 alkanes and akenes
compounds that are conventional compounds in Aspen Plus were specified.
C21-C29 and C30 (Wax) compounds were specified to represent the hydrocarbon
chains in order to accurately account for the paraffins, olefins and oxygenates
composition of each respective carbon number in the liquid fuels product
distribution. The activity coefficient method, non-random two liquid (NRTL)
with Henry’s constant, was used for the thermodynamic calculations of the
biogas cleaning. Henry’s constant and the default binary parameter in Aspen
Plus V8.8 predicted the performance of the absorption process in the biogas
mixture and the liquid absorbent. The equation of state (EOS) Peng-Robinson
(PR) was used to model the syngas production and Fischer-Tropsch reaction
sections while Peng-Robinson with Boston-Mathias (PR-BM) was used to
model the product upgrading section of the BgTL. The combined-cycle
electricity generation process employed a STEAM-TA and PR methods
respectively for the steam Rankine and gas Brayton cycles.
During the simulation of each sections of the BgTL process, several
assumptions were made:
1. The process was carried out in a steady-state
2. All reactors were modeled using a continuous reactor
3. The PFR catalyst density and bed voidage were specified for Ni/Al2O3.
4. Heat and work streams represented thermal and electrical energy
2.2. Biogas Cleaning
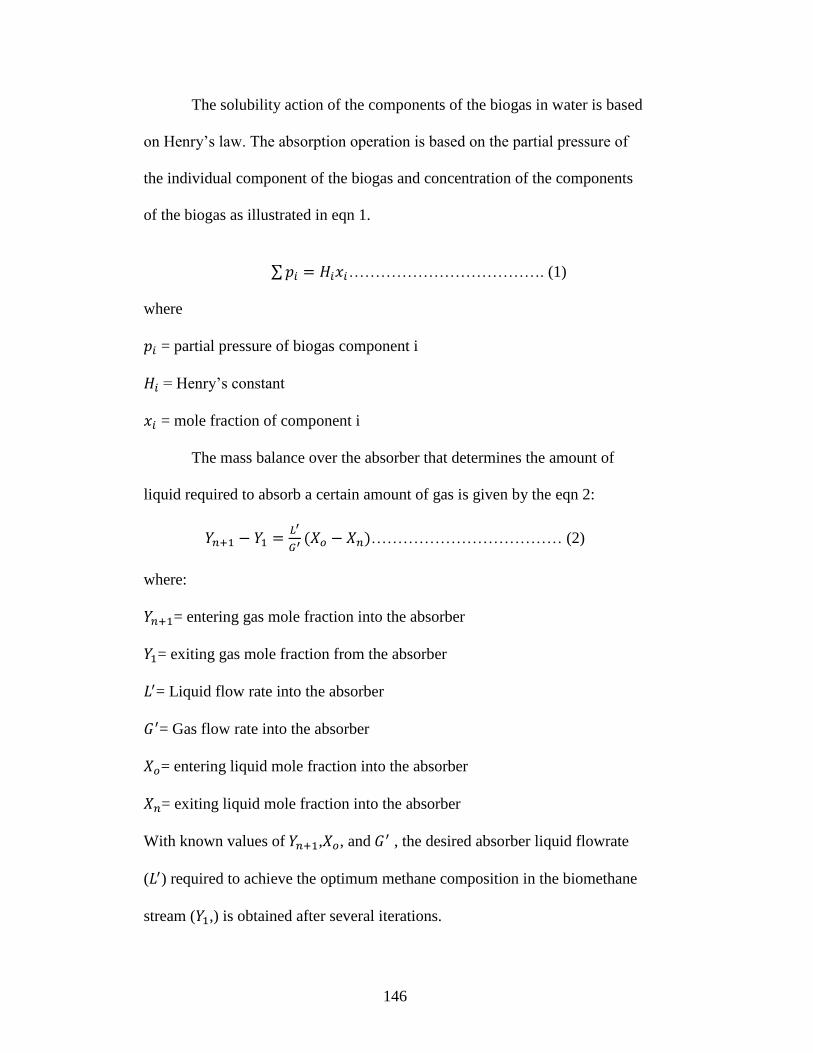
146
The solubility action of the components of the biogas in water is based
on Henry’s law. The absorption operation is based on the partial pressure of
the individual component of the biogas and concentration of the components
of the biogas as illustrated in eqn 1.
∑ 𝑝𝑖 = 𝐻𝑖𝑥𝑖………………………………. (1)
where
𝑝𝑖 = partial pressure of biogas component i
𝐻𝑖 = Henry’s constant
𝑥𝑖 = mole fraction of component i
The mass balance over the absorber that determines the amount of
liquid required to absorb a certain amount of gas is given by the eqn 2:
𝑌𝑛+1 − 𝑌1 =𝐿′
𝐺′ (𝑋𝑜 − 𝑋𝑛)……………………………… (2)
where:
𝑌𝑛+1= entering gas mole fraction into the absorber
𝑌1= exiting gas mole fraction from the absorber
𝐿′= Liquid flow rate into the absorber
𝐺′= Gas flow rate into the absorber
𝑋𝑜= entering liquid mole fraction into the absorber
𝑋𝑛= exiting liquid mole fraction into the absorber
With known values of 𝑌𝑛+1,𝑋𝑜, and 𝐺′ , the desired absorber liquid flowrate
(𝐿′) required to achieve the optimum methane composition in the biomethane
stream (𝑌1,) is obtained after several iterations.

147
The calculations for the amount of methane recovered from biogas, the ratio
of liquid (water) to biogas ratio needed for absorption, and the air to biogas
ratio needed to scrub the saturated water prior to recycling are shown in the
excel sheet of this supporting information.
2.3.Syngas Production
Peng-Robinson (PENG-ROB) EOS was used to model the vapor-liquid
equilibrium interaction of the components. This equation of state is utilized
for natural gas systems and have been modified to enhance its thermodynamic
predictions.
The Peng-Robinson equation of state is given by
𝑃 + 𝛼𝑎
�̃�2+2𝑏�̃�−𝑏2(�̃� − 𝑏) = 𝑅𝑇 ……………………………. (3)
Steam reforming of the biomethane employed for the production of
syngas followed a kinetic rate expression. Kinetic model developed by [112]
for the steam methane reforming on Ni/Al2O3 catalyst was based on the
Langmuir Hinshelwood Watson (LHHW) kinetics. To simulate the steam
reforming process in Aspen Plus, the LHHW was used to predict the reaction
rate expression. The reaction rates developed by [112] are shown below
R1 = 𝑘1
𝑃H22.5
𝑃CH4𝑃H2O − (𝑃H23 𝑃CO/𝐾1)
(1 + KCOPCO + KH2PH2 + KCH4PCH4 + 𝐾H2O𝑃H2O
PH2)
2 …………………… (4)
R2 = 𝑘2
PH2
𝑃CO𝑃H2O − (PH2PCO2/𝐾2)
(1 + KCOPCO + KH2PH2 + KCH4PCH4 + 𝐾H2O𝑃H2O
PH2)
2 …………………… (5)
R3= 𝑘3
𝑃H23.5
𝑃CH4PH2O2 − (PH2
4 PCO2/𝐾3)
(1 + KCOPCO + KH2PH2 + KCH4PCH4 + 𝐾H2O𝑃H2O
PH2)
2 .............................. (6)
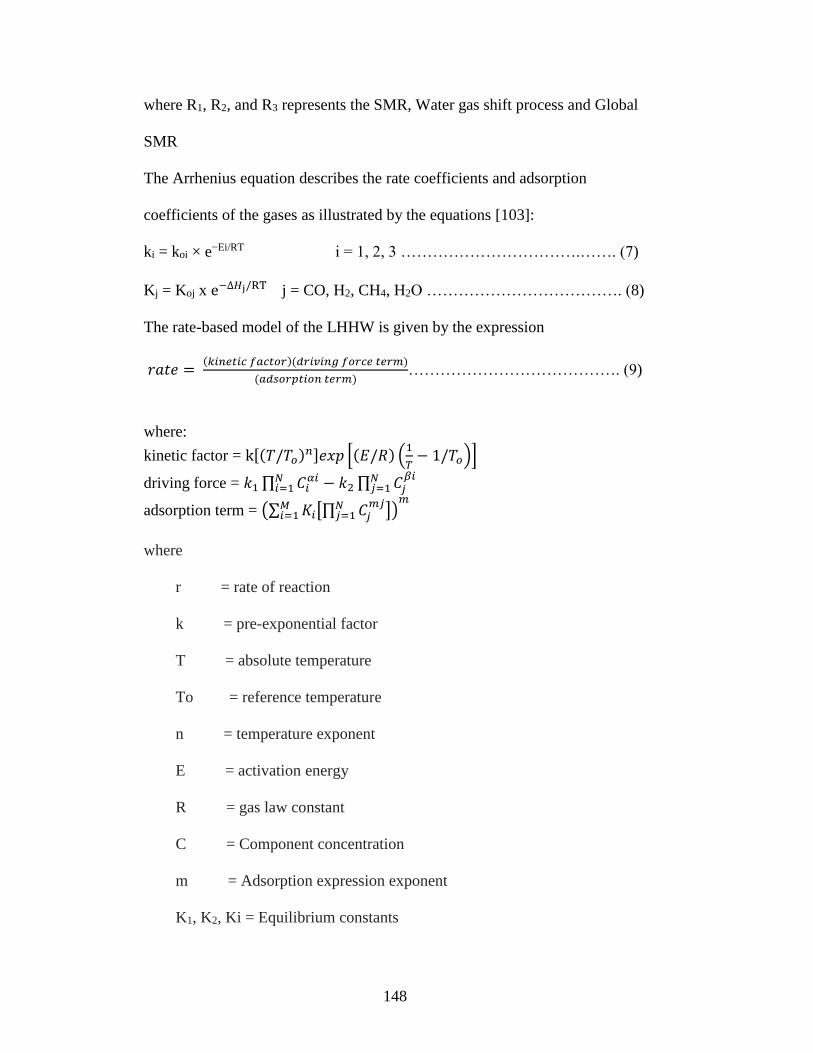
148
where R1, R2, and R3 represents the SMR, Water gas shift process and Global
SMR
The Arrhenius equation describes the rate coefficients and adsorption
coefficients of the gases as illustrated by the equations [103]:
ki = koi × e−Ei/RT i = 1, 2, 3 …………………………….……. (7)
Kj = Koj x e−∆𝐻j/RT j = CO, H2, CH4, H2O ………………………………. (8)
The rate-based model of the LHHW is given by the expression
𝑟𝑎𝑡𝑒 = (𝑘𝑖𝑛𝑒𝑡𝑖𝑐 𝑓𝑎𝑐𝑡𝑜𝑟)(𝑑𝑟𝑖𝑣𝑖𝑛𝑔 𝑓𝑜𝑟𝑐𝑒 𝑡𝑒𝑟𝑚)
(𝑎𝑑𝑠𝑜𝑟𝑝𝑡𝑖𝑜𝑛 𝑡𝑒𝑟𝑚)…………………………………. (9)
where:
kinetic factor = k[(𝑇/𝑇𝑜)𝑛]𝑒𝑥𝑝 [(𝐸/𝑅) (1
𝑇− 1/𝑇𝑜)]
driving force = 𝑘1 ∏ 𝐶𝑖𝛼𝑖𝑁
𝑖=1 − 𝑘2 ∏ 𝐶𝑗𝛽𝑖𝑁
𝑗=1
adsorption term = (∑ 𝐾𝑖[∏ 𝐶𝑗𝑚𝑗𝑁
𝑗=1 ]𝑀𝑖=1 )
𝑚
where
r = rate of reaction
k = pre-exponential factor
T = absolute temperature
To = reference temperature
n = temperature exponent
E = activation energy
R = gas law constant
C = Component concentration
m = Adsorption expression exponent
K1, K2, Ki = Equilibrium constants

149
v = Concentration exponent
i, j = Component Index
A, B, C, D = Constants
Kinetic data obtained from the work of [112] as given shown in the table S1
below were employed for calculating the input parameters in Aspen Plus to
determine the reaction rate.
Table S1. Kinetic and adsorption parameters for the kinetic rate of SMR
in Ni/Al2O3 catalyst.
Reaction parameters
KSMR (mol Pa0.5/(kg s)) 1.16 x 10¹⁶
KWGS (mol/(kg s Pa)) 5.41 x 10⁴
KGSMR (mol Pa0.5/(kg s)) 2.79 x 10¹⁵
ESMR (kJ/mol) 240.1
EWGS (kJ/mol) 67.13
EGSMR (kJ/mol) 243.9
KCO (Pa−1) 8.25 ∆HCO(kJ/mol) -70.65
KH2 (Pa−1) 6.15 x 10⁻⁴ ∆HH2(kJ/mol) -82.9
KCH4 (Pa−1) 66.6 ∆HCH4(kJ/mol) -38.28
KH2O (Pa−1) 1.77 x 10¹⁰ ∆HH2O(kJ/mol) 88.68
1) Kinetic factor = 2.79e15 exp (243.9[kJ/kmol]/RT)
In Aspen Plus, the form of the equation is
kinetic factor = k exp (E/RT)
Hence, the inputs are as follows:
pre-exponential factor k = 2.79e15
Activation Energy E = 243.9 kJ/kmol

150
2) Driving Force
The Aspen Plus form of the driving force equation is
driving force expression = K1 productsum (Ci^ai) - K2 productsum (Ci^bi)
Aspen Plus calls the first product sum term1 and the second term2.
driving force expression = term1 - term2
For this problem,
driving force expression = (Ca)
In the Aspen Plus form of the driving force expression:
driving force expression = K1 (Ca) - K2 (Ca)
and
Term 1 = Ca where K1 = 1
Term 2 = 0 where K2 = 0
driving force expression = 1 (Ca) - 0 (Ca)
Since K is in a log form
ln(K) = A + B/T + C ln(T) + D T
For term 1:
ln 1 = 0 where A = 0
For term2:
ln 0 = -infinity
Since infinity cannot be entered, it is approximated as -1000:
ln 0 ~ -1000 where A = -1000
3) Adsorption term

151
The Aspen Plus form of the adsorption term is
adsorption term = (sum Ki [productsum (Cj^nuj)])m
For this problem,
adsorption term = (1 + KCOPCO + KH2PH2 + KCH4PCH4 + KH2OPH2O)
Any number of terms are possible. For this problem there are five terms and
the adsorption expression exponent m = 2.
adsorption term = (term1 + term2 + term3 + term4 + term5)m
For term 1:
K = 1
Ln 1 = 0
Ln K = A
For term 2:
KCO = 8.25exp (70.65/RT)
Ln (KCO) = ln (8.25) + (70.65/0.00831/T)
= 15.602 + 8497.71/T
Ln K = A + B / T
For term 3:
KH2 = 6.15 x 10⁻⁴exp (82.90/RT)
Ln (KH2) = ln (6.15 x 10⁻⁴) + (82.90/0.00831/T)
= -7.39 + 9975.93/T
Ln K = A + B / T
For term 4:
KCH4 = 66.6exp (38.28/RT)

152
Ln (KCH4) = ln (66.6) + (38.28/0.00831/T)
= 4.199 + 4606.50/T
Ln K = A + B / T
For term 5:
KH2O = 1.07 x 10⁷exp (-5.78/RT)
Ln (KH2O) = ln (1.07 x 10⁷) + (-5.78/0.00831/T)
= 16.203 – 695.213/T
Ln K = A + B / T
Table S2. Summary of Aspen Plus LHHW input
Kinetic factor
k 2.79 x 10¹⁵
E 243.9 kJ/kmol
Driving force expression:
Term 1 CH4 exponent = 1; H2 exponent = 1; A = 0
Term 2 A = -100000
Adsorption term:
Term 1 no exponents; A = 0
Term 2 CO exponent = 1; A = 2.11; B = 8497.71
Term 3 H2 exponent = 1; A = -7.39; B = 9971.13
Term 4 CH4 exponent = 1; A = 4.198; B =
4604.28
Term 5 H2O exponent = 1; A = 16.203; B = -
695.213
Detailed calculations on the overall conversion of methane, syngas yield, and
syngas ratio (H2/CO) can be found in the excel sheet of this supporting
information.
2.4. Fischer Tropsch synthesis
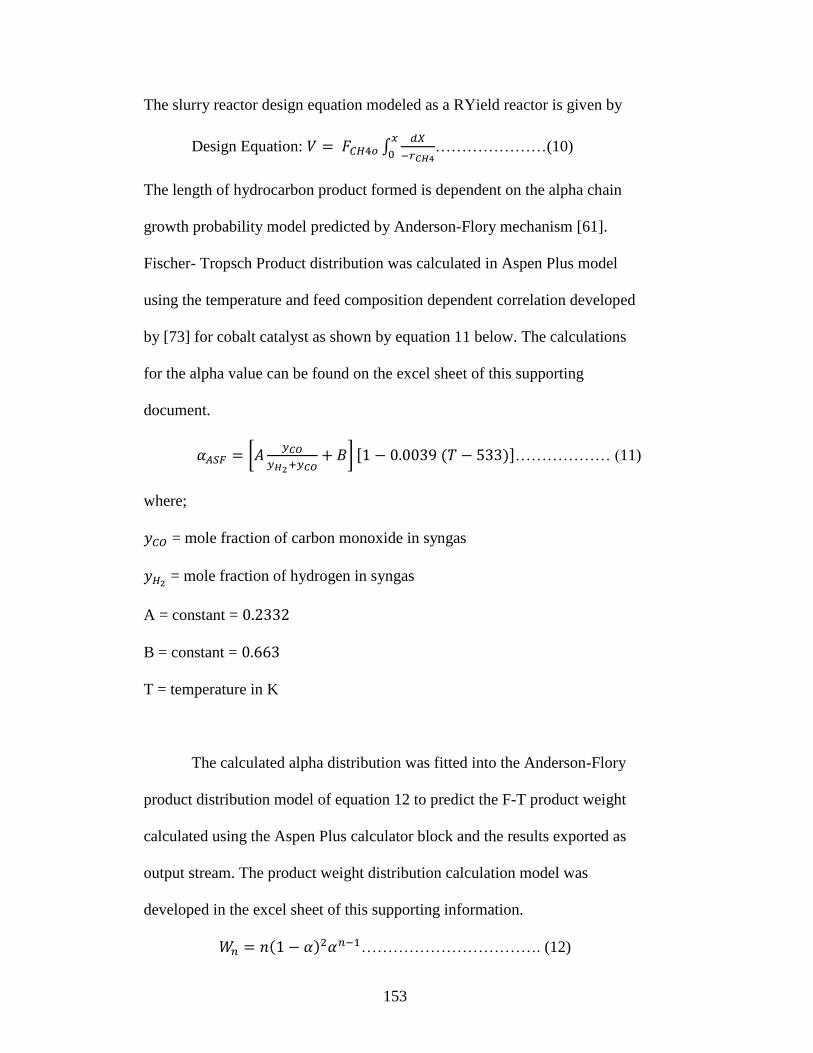
153
The slurry reactor design equation modeled as a RYield reactor is given by
Design Equation: 𝑉 = 𝐹𝐶𝐻4𝑜 ∫𝑑𝑋
−𝑟𝐶𝐻4
𝑥
0…………………(10)
The length of hydrocarbon product formed is dependent on the alpha chain
growth probability model predicted by Anderson-Flory mechanism [61].
Fischer- Tropsch Product distribution was calculated in Aspen Plus model
using the temperature and feed composition dependent correlation developed
by [73] for cobalt catalyst as shown by equation 11 below. The calculations
for the alpha value can be found on the excel sheet of this supporting
document.
𝛼𝐴𝑆𝐹 = [𝐴𝑦𝐶𝑂
𝑦𝐻2+𝑦𝐶𝑂+ 𝐵] [1 − 0.0039 (𝑇 − 533)]……………… (11)
where;
𝑦𝐶𝑂 = mole fraction of carbon monoxide in syngas
𝑦𝐻2 = mole fraction of hydrogen in syngas
A = constant = 0.2332
B = constant = 0.663
T = temperature in K
The calculated alpha distribution was fitted into the Anderson-Flory
product distribution model of equation 12 to predict the F-T product weight
calculated using the Aspen Plus calculator block and the results exported as
output stream. The product weight distribution calculation model was
developed in the excel sheet of this supporting information.
𝑊𝑛 = 𝑛(1 − 𝛼)2𝛼𝑛−1……………………………. (12)
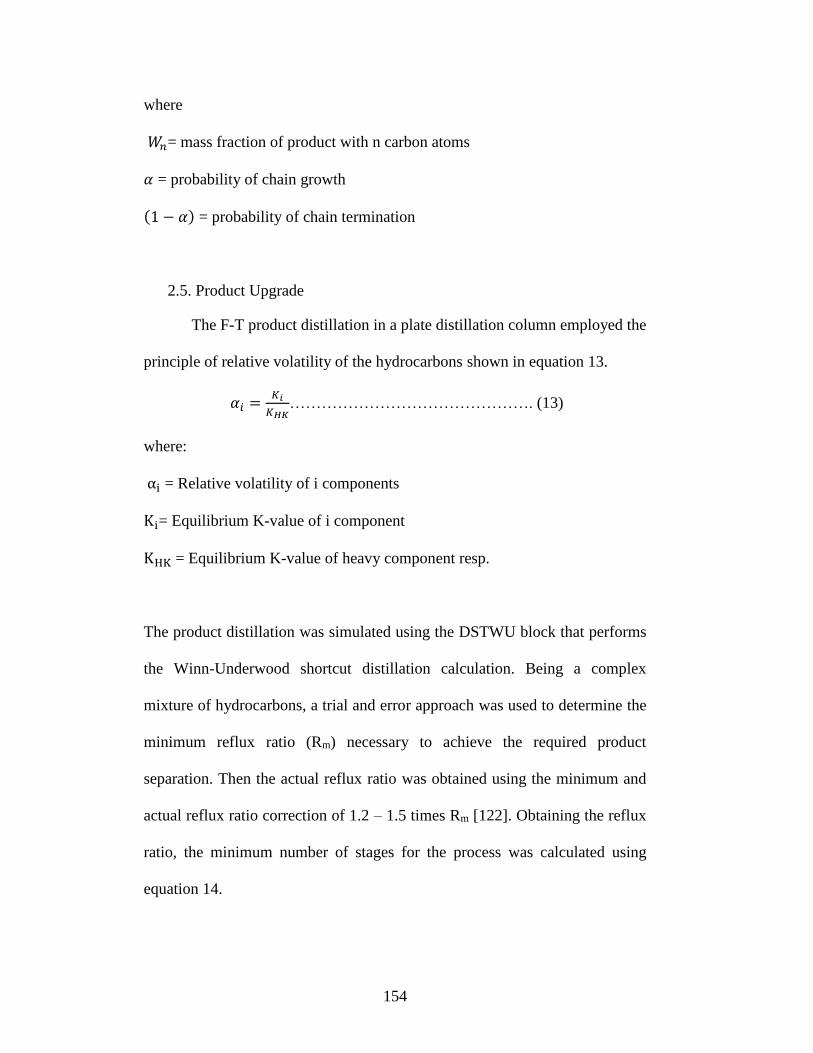
154
where
𝑊𝑛= mass fraction of product with n carbon atoms
𝛼 = probability of chain growth
(1 − 𝛼) = probability of chain termination
2.5. Product Upgrade
The F-T product distillation in a plate distillation column employed the
principle of relative volatility of the hydrocarbons shown in equation 13.
𝛼𝑖 =𝐾𝑖
𝐾𝐻𝐾………………………………………. (13)
where:
αi = Relative volatility of i components
Ki= Equilibrium K-value of i component
KHK = Equilibrium K-value of heavy component resp.
The product distillation was simulated using the DSTWU block that performs
the Winn-Underwood shortcut distillation calculation. Being a complex
mixture of hydrocarbons, a trial and error approach was used to determine the
minimum reflux ratio (Rm) necessary to achieve the required product
separation. Then the actual reflux ratio was obtained using the minimum and
actual reflux ratio correction of 1.2 – 1.5 times Rm [122]. Obtaining the reflux
ratio, the minimum number of stages for the process was calculated using
equation 14.

155
𝑁𝑚𝑖𝑛 =ln[(
𝑥𝐿𝐾𝑥𝐻𝐾
)𝐷𝑖𝑠𝑡
(𝑥𝐻𝐾𝑥𝐿𝐾
)𝐵𝑜𝑡
]
ln 𝛼𝐿𝐾−𝐻𝐾…………… (14)
where:
xHK, xLK= mole fraction of heavy & light component resp.
Nmin= minimum number of stages
The underwood equation as given by equation 15 below according to [122] was
used to determine the distillation feed point location for optimal separation of
the vapor liquid mixture.
𝑞(1 − 𝐹) = ∑𝛼𝑖𝑛𝑖,𝐹
𝛼𝑖−𝜑….........................(15)
The sizing of the column to determine the diameter and height was carried out
to help in the accurate estimation of cost. The column diameter is given by
equation 16 below:
𝐷𝑐 = √4∗𝑉𝑤
𝜋𝜌𝑣𝑢𝑣…………………………………. (16)
Estimation of column height is dependent on the plate spacing of which
recommended a plate spacing between 0.15m to 1m [162].
The final liquid fuels product distribution (mass fraction) for LPG, gasoline and
diesel is shown in table S3 with the detailed calculation in the excel sheet of the
supporting document.

156
Table S3. Drop-in fuels product mass distribution
Our model Swanson et al., 2010 Bechtel, 1996
Temperature 220 220
Alpha value 0.87 0.9 N/A
Products Mass Fraction
LPG 0.07 0.0877 0.03
Gasoline 0.32 0.261 0.37
Diesel 0.61 0.6167 0.61
3. Economic Evaluation
Capital and operating cost estimation for the BgTL model was performed using
Aspen Process Economic Analyzer, referenced cost data, and mass and energy
balance of the process to determine the overall project investment.
Unit operation costs estimated from a similar equipment were scaled-up
applying the appropriate exponent value as shown in equation ….to determine
the cost for the new equipment.
𝐸𝑞𝑢𝑖𝑝𝑚𝑒𝑛𝑡𝑛𝑒𝑤 𝑐𝑜𝑠𝑡 = 𝐸𝑞𝑢𝑖𝑝𝑚𝑒𝑛𝑡 𝑜𝑙𝑑 𝑐𝑜𝑠𝑡 [𝐹𝑙𝑜𝑤 𝑟𝑎𝑡𝑒𝑛𝑒𝑤
𝐹𝑙𝑜𝑤 𝑟𝑎𝑡𝑒𝑜𝑙𝑑]
𝑛
……………… (17)
Where n = scaling factor.
The fixed operating cost data for the various positions occupied in our BgTL
plant is shown in table S4 below

157
Table S4. Fixed Operating Cost
Employee Position (Salary 2007) Number of positions
Plant Manager $ 147,000 1
Plant Engineer $ 70,000 2
Maintenance Supervisor $ 57,000 1
Maintenance Technician $ 40,000 12
Lab Manager $ 56,000 1
Lab Technician $ 40,000 2
Shift supervisor $ 48,000 4
Shift Operators $ 48,000 20
Clerks & Secretaries $ 36,000 3
Total salaries 46
Other Fixed Operating Cost (OFOC)
Labor burden 90% of Salaries
Maintenance 3% of FCI
Property Insurance 0.7% of FCI
Total Fixed Operating Costs ∑ Total Salary + OFOC
The modified accelerated cost recovery system (MACRS) used for calculating
the depreciation of the process plant unit operation recovered the investment
for the electricity/steam section and general plant section for 20 and 7 years
respectively. Detailed depreciation calculation using the MACRS equation
shown in 18 below which switched to straight line depreciation method (eqn.

158
19) when the recovery of the later is higher than the former can be found in
the supporting excel sheet
MACRS depreciation: 2 * (1/N) …………………………. (18)
Straight-line depreciation: 𝐶𝑜𝑠𝑡−𝑆𝑐𝑟𝑎𝑝 𝑣𝑎𝑙𝑢𝑒
𝐿𝑖𝑓𝑒 𝑠𝑝𝑎𝑛 ……………… (19)
Calculations for critical cost parameters such as discount factor, annual
present value, net present value of income tax and F-T income, and discounted
cash flow are shown in the excel sheet of this supporting information.

159
Table S5A. Mass Balance of Biogas Cleaning
Stream Name RAWBIOGA TO-COMP1 TO-COOL1 TO-MIX TO-COMP2 TO-COOL2 GAS-IN LIQ-IN LIQ-OUT RE-GAS
Destination SEP COMP1 COOL1 MIXER COMP2 COOL2 ABSORBER ABSORBER FLASH MIXER
Source SEP COMP1 COOL1 MIXER COMP2 COOL2 PUMP ABSORBER FLASH
Stream Fraction VAPOR VAPOR VAPOR VAPOR MIXED VAPOR MIXED LIQUID LIQUID VAPOR
Temperature
Pressure
Mole Flow kmol/hr
Volume (Nm3/h)
Mass Flow kg/hr
METHANE 53.5779 53.5779 53.5779 53.5779 55.70335 55.70335 55.70335 0 2.173639 34.09807
CO2 33.48619 33.48619 33.48619 33.48619 91.14886 91.14886 91.14886 0 90.78895 2537.723
N2 0.4464825 0.4464825 0.4464825 0.4464825 0.4543394 0.4543394 0.4543394 0 7.94E-03 2.20E-01
O2 0.178593 0.178593 0.178593 0.178593 0.1848763 0.1848763 0.1848763 0 6.41E-03 2.01E-01
H2O 1.571618 1.571618 1.571618 1.571618 2.278767 2.278767 2.278767 2493.075 24935.41 12.73948
H2S 0.0357186 0.0357186 0.0357186 0.0357186 0.0652213 0.0652213 0.0652213 0 0.0798902 1.00551
CO 0 0 0 0 0 0 0 0 0 0
H2 0 0 0 0 0 0 0 0 0 0
C2H4 0 0 0 0 0 0 0 0 0 0
C2H6 0 0 0 0 0 0 0 0 0 0
C3H6 0 0 0 0 0 0 0 0 0 0
C3H8 0 0 0 0 0 0 0 0 0 0
BUTANE 0 0 0 0 0 0 0 0 0 0
1-BUT-01 0 0 0 0 0 0 0 0 0 0
1-BUT-02 0 0 0 0 0 0 0 0 0 0
ISOBU-01 0 0 0 0 0 0 0 0 0 0
N-PEN-01 0 0 0 0 0 0 0 0 0 0
1-PEN-01 0 0 0 0 0 0 0 0 0 0
2-MET-01 0 0 0 0 0 0 0 0 0 0
1-HEX-01 0 0 0 0 0 0 0 0 0 0
N-HEX-01 0 0 0 0 0 0 0 0 0 0
2-MET-02 0 0 0 0 0 0 0 0 0 0
1-HEP-01 0 0 0 0 0 0 0 0 0 0
N-HEP-01 0 0 0 0 0 0 0 0 0 0
1-OCT-01 0 0 0 0 0 0 0 0 0 0
N-OCT-01 0 0 0 0 0 0 0 0 0 0
N-NON-01 0 0 0 0 0 0 0 0 0 0
1-NON-01 0 0 0 0 0 0 0 0 0 0
1-DEC-01 0 0 0 0 0 0 0 0 0 0
N-DEC-01 0 0 0 0 0 0 0 0 0 0
1-UND-01 0 0 0 0 0 0 0 0 0 0
N-UND-01 0 0 0 0 0 0 0 0 0 0
1-DOD-01 0 0 0 0 0 0 0 0 0 0
N-DOD-01 0 0 0 0 0 0 0 0 0 0
1-TRI-01 0 0 0 0 0 0 0 0 0 0
N-TRI-01 0 0 0 0 0 0 0 0 0 0
C30WAX 0 0 0 0 0 0 0 0 0 0
OXHC 0 0 0 0 0 0 0 0 0 0
C29OP 0 0 0 0 0 0 0 0 0 0
C28OP 0 0 0 0 0 0 0 0 0 0
C27OP 0 0 0 0 0 0 0 0 0 0
C26OP 0 0 0 0 0 0 0 0 0 0
C25OP 0 0 0 0 0 0 0 0 0 0
C24OP 0 0 0 0 0 0 0 0 0 0
C23OP 0 0 0 0 0 0 0 0 0 0
C22OP 0 0 0 0 0 0 0 0 0 0
C21OP 0 0 0 0 0 0 0 0 0 0
1-EIC-01 0 0 0 0 0 0 0 0 0 0
N-EIC-01 0 0 0 0 0 0 0 0 0 0
1-NON-02 0 0 0 0 0 0 0 0 0 0
N-NON-02 0 0 0 0 0 0 0 0 0 0
N-OCT-02 0 0 0 0 0 0 0 0 0 0
1-OCT-02 0 0 0 0 0 0 0 0 0 0
1-HEP-02 0 0 0 0 0 0 0 0 0 0
N-HEP-02 0 0 0 0 0 0 0 0 0 0
N-HEX-02 0 0 0 0 0 0 0 0 0 0
1-HEX-02 0 0 0 0 0 0 0 0 0 0
1-PEN-02 0 0 0 0 0 0 0 0 0 0
N-PEN-02 0 0 0 0 0 0 0 0 0 0
N-TET-01 0 0 0 0 0 0 0 0 0 0
1-TET-01 0 0 0 0 0 0 0 0 0 0
AR 0 0 0 0 0 0 0 0 3.73E-18 0
TEG 0 0 0 0 0 0 0 0 0 0

160
Table S5B. Mass Balance of Biogas Cleaning continues
Stream Name TO-COOL3 TO-STRIP AIR-IN AIR OFF-GAS TO-RECYC PURGE RECYCLE LIQ-RCYC
Destination VALVE STRIPPER AIR-COMP STRIPPER SPLITTER PUMP2 ABSORBER
Source FLASH VALVE AIR-COMP STRIPPER STRIPPER SPLITTER SPLITTER PUMP2
Stream Fraction LIQUID MIXED VAPOR VAPOR VAPOR LIQUID MIXED MIXED LIQUID
Temperature
Pressure
Mole Flow kmol/hr 24955.43 24955.43 154.1918
Volume (Nm3/h) 450.6887 848.1853 3910.204
Mass Flow kg/hr
METHANE 0.9348956 0.9348956 0 0 0.0481896 9.07E-17 9.07E-18 8.16E-17 8.16E-17
CO2 1445.96 1445.96 0 0 32.49279 0.6334891 0.0633489 0.5701402 0.5701402
N2 2.79E-03 2.79E-03 3374.051 3374.051 10.99498 0.2294232 0.0229423 0.2064809 0.2064809
O2 5.01E-03 5.01E-03 1033.959 1033.959 2.88951 0.121857 0.0121857 0.1096713 0.1096713
H2O 448986 448986 0 0 1.111162 24933.59 2493.359 22440.23 22440.23
H2S 1.217313 1.217313 0 0 0.0316844 0.018703 1.87E-03 0.0168327 0.0168327
CO 0 0 0 0 0 0 0 0 0
H2 0 0 0 0 0 0 0 0 0
C2H4 0 0 0 0 0 0 0 0 0
C2H6 0 0 0 0 0 0 0 0 0
C3H6 0 0 0 0 0 0 0 0 0
C3H8 0 0 0 0 0 0 0 0 0
BUTANE 0 0 0 0 0 0 0 0 0
1-BUT-01 0 0 0 0 0 0 0 0 0
1-BUT-02 0 0 0 0 0 0 0 0 0
ISOBU-01 0 0 0 0 0 0 0 0 0
N-PEN-01 0 0 0 0 0 0 0 0 0
1-PEN-01 0 0 0 0 0 0 0 0 0
2-MET-01 0 0 0 0 0 0 0 0 0
1-HEX-01 0 0 0 0 0 0 0 0 0
N-HEX-01 0 0 0 0 0 0 0 0 0
2-MET-02 0 0 0 0 0 0 0 0 0
1-HEP-01 0 0 0 0 0 0 0 0 0
N-HEP-01 0 0 0 0 0 0 0 0 0
1-OCT-01 0 0 0 0 0 0 0 0 0
N-OCT-01 0 0 0 0 0 0 0 0 0
N-NON-01 0 0 0 0 0 0 0 0 0
1-NON-01 0 0 0 0 0 0 0 0 0
1-DEC-01 0 0 0 0 0 0 0 0 0
N-DEC-01 0 0 0 0 0 0 0 0 0
1-UND-01 0 0 0 0 0 0 0 0 0
N-UND-01 0 0 0 0 0 0 0 0 0
1-DOD-01 0 0 0 0 0 0 0 0 0
N-DOD-01 0 0 0 0 0 0 0 0 0
1-TRI-01 0 0 0 0 0 0 0 0 0
N-TRI-01 0 0 0 0 0 0 0 0 0
C30WAX 0 0 0 0 0 0 0 0 0
OXHC 0 0 0 0 0 0 0 0 0
C29OP 0 0 0 0 0 0 0 0 0
C28OP 0 0 0 0 0 0 0 0 0
C27OP 0 0 0 0 0 0 0 0 0
C26OP 0 0 0 0 0 0 0 0 0
C25OP 0 0 0 0 0 0 0 0 0
C24OP 0 0 0 0 0 0 0 0 0
C23OP 0 0 0 0 0 0 0 0 0
C22OP 0 0 0 0 0 0 0 0 0
C21OP 0 0 0 0 0 0 0 0 0
1-EIC-01 0 0 0 0 0 0 0 0 0
N-EIC-01 0 0 0 0 0 0 0 0 0
1-NON-02 0 0 0 0 0 0 0 0 0
N-NON-02 0 0 0 0 0 0 0 0 0
N-OCT-02 0 0 0 0 0 0 0 0 0
1-OCT-02 0 0 0 0 0 0 0 0 0
1-HEP-02 0 0 0 0 0 0 0 0 0
N-HEP-02 0 0 0 0 0 0 0 0 0
N-HEX-02 0 0 0 0 0 0 0 0 0
1-HEX-02 0 0 0 0 0 0 0 0 0
1-PEN-02 0 0 0 0 0 0 0 0 0
N-PEN-02 0 0 0 0 0 0 0 0 0
N-TET-01 0 0 0 0 0 0 0 0 0
1-TET-01 0 0 0 0 0 0 0 0 0
AR 0 0 57.34637 57.34637 0.127847 5.93E-03 5.93E-04 5.34E-03 5.34E-03
TEG 0 0 0 0 0 0 0 0 0

161
Table S6. Mass balance of Syngas Production
Stream Name BMETHANE TO-POX-H TO-SMR TO-POX OXYGEN TO-MIX STEAM TO-PFR P-STEAM P-WATER POX-HOT S4 POX-SYNG SMR-SYN SYNGAS W-WATER TO-FT
Destination SPLITTER POX-HX SMR-HX POX POX MIXER MIXER SMR B4 PROP B4 B5 B5 B2 $C-7
Source $C-1 SPLITTER SPLITTER POX-HX $C-6 SMR-HX $C-3 MIXER B4 POX PROP B4 SMR B5 B2 B2
Stream Fraction VAPOR MIXED MIXED VAPOR VAPOR VAPOR VAPOR VAPOR VAPOR LIQUID VAPOR VAPOR VAPOR VAPOR VAPOR VAPOR VAPOR
Temperature 32.77557 33.57395 33.57395 1127 1127 850 198.5386 366.6021 850 20 1127 1127 1116.62 850 949.889 949.889 50
Pressure 35 35 35 50 50 15 15 15 1 1 50 50 50 15 15 15 15
Mole Flow kmol/hr 55.09079 33.05447 22.03631 33.05447 42.13022 22.03631 110.7753 132.8117 0.5550844 0.5550844 98.67819 98.67819 98.67819 175.3306 274.0087 140.6477 133.3611
Volume (Nm3/h) 1234.784 740.8701 493.9134 740.8701 944.2905 493.9134 2482.876 2976.789 12.44145 2211.735 2211.735 2211.735 3929.791 6141.526 3152.422 2989.104
Mass Flow kg/hr
METHANE 852.6422 511.5853 341.0569 511.5853 0 341.0569 0 341.0569 0 0 0.713679 0.713679 0.713679 0 0.713679 0 0.713679
CO2 43.97149 26.38289 17.5886 26.38289 0 17.5886 0 17.5886 0 0 551.0997 551.0997 551.0997 17.5886 568.6883 511.8194 56.86883
N2 18.21841 10.93105 7.287364 10.93105 18.89961 7.287364 0 7.287364 0 0 29.83065 29.83065 29.83065 7.287364 37.11802 37.11802 0
O2 9.154762 5.492857 3.661905 5.492857 1280.711 3.661905 0 3.661905 0 0 2.36E-11 2.36E-11 2.36E-11 3.661905 3.661905 3.661905 0
H2O 6.73E-04 4.04E-04 2.69E-04 4.04E-04 0 2.69E-04 1995.649 1995.649 10 10 659.7852 659.7852 659.7852 1612.655 2272.441 2272.441 0
H2S 0.0608842 0.0365305 0.0243537 0.0365305 0 0.0243537 0 0.0243537 0 0 0.0365305 0.0365305 0.0365305 0.0243537 0.0608842 0.0608842 0
CO 0 0 0 0 0 0 0 0 0 0 558.015 558.015 558.015 595.4837 1153.499 0 1153.499
H2 0 0 0 0 0 0 0 0 0 0 54.56019 54.56019 54.56019 128.5691 183.1293 0 183.1293
C2H4 0 0 0 0 0 0 0 0 0 0 0 0 0 0 0 0 0
C2H6 0 0 0 0 0 0 0 0 0 0 0 0 0 0 0 0 0
C3H6 0 0 0 0 0 0 0 0 0 0 0 0 0 0 0 0 0
C3H8 0 0 0 0 0 0 0 0 0 0 0 0 0 0 0 0 0
BUTANE 0 0 0 0 0 0 0 0 0 0 0 0 0 0 0 0 0
1-BUT-01 0 0 0 0 0 0 0 0 0 0 0 0 0 0 0 0 0
1-BUT-02 0 0 0 0 0 0 0 0 0 0 0 0 0 0 0 0 0
ISOBU-01 0 0 0 0 0 0 0 0 0 0 0 0 0 0 0 0 0
N-PEN-01 0 0 0 0 0 0 0 0 0 0 0 0 0 0 0 0 0
1-PEN-01 0 0 0 0 0 0 0 0 0 0 0 0 0 0 0 0 0
2-MET-01 0 0 0 0 0 0 0 0 0 0 0 0 0 0 0 0 0
1-HEX-01 0 0 0 0 0 0 0 0 0 0 0 0 0 0 0 0 0
N-HEX-01 0 0 0 0 0 0 0 0 0 0 0 0 0 0 0 0 0
2-MET-02 0 0 0 0 0 0 0 0 0 0 0 0 0 0 0 0 0
1-HEP-01 0 0 0 0 0 0 0 0 0 0 0 0 0 0 0 0 0
N-HEP-01 0 0 0 0 0 0 0 0 0 0 0 0 0 0 0 0 0
1-OCT-01 0 0 0 0 0 0 0 0 0 0 0 0 0 0 0 0 0
N-OCT-01 0 0 0 0 0 0 0 0 0 0 0 0 0 0 0 0 0
N-NON-01 0 0 0 0 0 0 0 0 0 0 0 0 0 0 0 0 0
1-NON-01 0 0 0 0 0 0 0 0 0 0 0 0 0 0 0 0 0
1-DEC-01 0 0 0 0 0 0 0 0 0 0 0 0 0 0 0 0 0
N-DEC-01 0 0 0 0 0 0 0 0 0 0 0 0 0 0 0 0 0
1-UND-01 0 0 0 0 0 0 0 0 0 0 0 0 0 0 0 0 0
N-UND-01 0 0 0 0 0 0 0 0 0 0 0 0 0 0 0 0 0
1-DOD-01 0 0 0 0 0 0 0 0 0 0 0 0 0 0 0 0 0
N-DOD-01 0 0 0 0 0 0 0 0 0 0 0 0 0 0 0 0 0
1-TRI-01 0 0 0 0 0 0 0 0 0 0 0 0 0 0 0 0 0
N-TRI-01 0 0 0 0 0 0 0 0 0 0 0 0 0 0 0 0 0
C30WAX 0 0 0 0 0 0 0 0 0 0 0 0 0 0 0 0 0
OXHC 0 0 0 0 0 0 0 0 0 0 0 0 0 0 0 0 0
C29OP 0 0 0 0 0 0 0 0 0 0 0 0 0 0 0 0 0
C28OP 0 0 0 0 0 0 0 0 0 0 0 0 0 0 0 0 0
C27OP 0 0 0 0 0 0 0 0 0 0 0 0 0 0 0 0 0
C26OP 0 0 0 0 0 0 0 0 0 0 0 0 0 0 0 0 0
C25OP 0 0 0 0 0 0 0 0 0 0 0 0 0 0 0 0 0
C24OP 0 0 0 0 0 0 0 0 0 0 0 0 0 0 0 0 0
C23OP 0 0 0 0 0 0 0 0 0 0 0 0 0 0 0 0 0
C22OP 0 0 0 0 0 0 0 0 0 0 0 0 0 0 0 0 0
C21OP 0 0 0 0 0 0 0 0 0 0 0 0 0 0 0 0 0
1-EIC-01 0 0 0 0 0 0 0 0 0 0 0 0 0 0 0 0 0
N-EIC-01 0 0 0 0 0 0 0 0 0 0 0 0 0 0 0 0 0
1-NON-02 0 0 0 0 0 0 0 0 0 0 0 0 0 0 0 0 0
N-NON-02 0 0 0 0 0 0 0 0 0 0 0 0 0 0 0 0 0
N-OCT-02 0 0 0 0 0 0 0 0 0 0 0 0 0 0 0 0 0
1-OCT-02 0 0 0 0 0 0 0 0 0 0 0 0 0 0 0 0 0
1-HEP-02 0 0 0 0 0 0 0 0 0 0 0 0 0 0 0 0 0
N-HEP-02 0 0 0 0 0 0 0 0 0 0 0 0 0 0 0 0 0
N-HEX-02 0 0 0 0 0 0 0 0 0 0 0 0 0 0 0 0 0
1-HEX-02 0 0 0 0 0 0 0 0 0 0 0 0 0 0 0 0 0
1-PEN-02 0 0 0 0 0 0 0 0 0 0 0 0 0 0 0 0 0
N-PEN-02 0 0 0 0 0 0 0 0 0 0 0 0 0 0 0 0 0
N-TET-01 0 0 0 0 0 0 0 0 0 0 0 0 0 0 0 0 0
1-TET-01 0 0 0 0 0 0 0 0 0 0 0 0 0 0 0 0 0
AR 0.210829 0.1264974 0.0843316 0.1264974 57.19955 0.0843316 0 0.0843316 0 0 57.32605 57.32605 57.32605 0.0843316 57.41038 57.41038 0
TEG 2.55E-03 1.53E-03 1.02E-03 1.53E-03 0 1.02E-03 0 1.02E-03 0 0 0 0 0 1.02E-03 1.02E-03 1.02E-03 0

162
Table S7. Mass balance of Fischer-Tropsh Synthesis
Stream Name TO-FT TO-COMP TO-RXC FT-PRODT CO2-STRM TO-FTSEP TO-DRUM TO-UPGD FUEL H2-STRM
Destination F-T-HX FT-COMP FT-RXC CO2-SEP FT-SEP KOUT-DRM $C-13 $C-9 $C-15
Source $C-8 F-T-HX FT-COMP FT-RXC CO2-SEP CO2-SEP FT-SEP FT-SEP KOUT-DRM KOUT-DRM
Stream Fraction VAPOR VAPOR VAPOR MIXED VAPOR MIXED VAPOR MIXED VAPOR VAPOR
Temperature 50 150 199.6981 220 220 220 220 220 220 220
Pressure 15 15 20 20 20 20 20 20 20 20
Mole Flow kmol/hr 133.3611 133.3611 133.3611 80.88689 1.324495 79.5624 72.22246 7.339942 70.61988 1.602578
Volume (Nm3/h) 2989.104 2989.104 2989.104 1804.3 29.68671 1774.428 1618.766 102.4962 1582.847 35.91955
Mass Flow kg/hr
METHANE 0.713679 0.713679 0.713679 0.6519273 0 0.6519273 0.6519273 0 0.6519273 0
CO2 56.86883 56.86883 56.86883 58.29075 58.29075 0 0 0 0 0
N2 0 0 0 0 0 0 0 0 0 0
O2 0.00E+00 0.00E+00 0 0 0 0 0.00E+00 0 0 0
H2O 0 0 0 4.571841 0.00E+00 4.571841 4.571841 0 4.571841 0
H2S 0 0 0 0 0 0 0 0 0 0
CO 1153.499 1153.499 1153.499 518.4387 0 518.4387 518.4387 0 518.4387 0
H2 183.1293 183.1293 183.1293 107.6868 0 107.6868 107.6868 0 104.4562 3.230604
C2H4 0 0 0 17.87039 0 17.87039 0 17.87039 0 0
C2H6 0 0 0 19.07593 0 19.07593 0 19.07593 0 0
C3H6 0 0 0 22.26707 0 22.26707 0 22.26707 0 0
C3H8 0 0 0 23.25987 0 23.25987 0 23.25987 0 0
BUTANE 0 0 0 12.69365 0 12.69365 0 12.69365 0 0
1-BUT-01 0 0 0 12.26816 0 12.26816 0 12.26816 0 0
1-BUT-02 0 0 0 12.26816 0 12.26816 0 12.26816 0 0
ISOBU-01 0 0 0 12.69365 0 12.69365 0 12.69365 0 0
N-PEN-01 0 0 0 12.9773 0 12.9773 0 12.9773 0 0
1-PEN-01 0 0 0 25.24547 0 25.24547 0 25.24547 0 0
2-MET-01 0 0 0 12.9773 0 12.9773 0 12.9773 0 0
1-HEX-01 0 0 0 25.03272 0 25.03272 0 25.03272 0 0
N-HEX-01 0 0 0 12.76456 0 12.76456 0 12.76456 0 0
2-MET-02 0 0 0 12.76456 0 12.76456 0 12.76456 0 0
1-HEP-01 0 0 0 27.30198 0 27.30198 0 27.30198 0 0
N-HEP-01 0 0 0 24.46541 0 24.46541 0 24.46541 0 0
1-OCT-01 0 0 0 22.62164 0 22.62164 0 22.62164 0 0
N-OCT-01 0 0 0 22.97621 0 22.97621 0 22.97621 0 0
N-NON-01 0 0 0 21.20336 0 21.20336 0 21.20336 0 0
1-NON-01 0 0 0 20.9197 0 20.9197 0 20.9197 0 0
1-DEC-01 0 0 0 19.14684 0 19.14684 0 19.14684 0 0
N-DEC-01 0 0 0 19.35958 0 19.35958 0 19.35958 0 0
1-UND-01 0 0 0 17.30307 0 17.30307 0 17.30307 0 0
N-UND-01 0 0 0 17.51582 0 17.51582 0 17.51582 0 0
1-DOD-01 0 0 0 15.53022 0 15.53022 0 15.53022 0 0
N-DOD-01 0 0 0 15.67205 0 15.67205 0 15.67205 0 0
1-TRI-01 0 0 0 13.9701 0 13.9701 0 13.9701 0 0
N-TRI-01 0 0 0 13.82827 0 13.82827 0 13.82827 0 0
C30WAX 0 0 0 27.12682 0 27.12682 0 27.12682 0 0
OXHC 0 0 0 2.269256 0 2.269256 0 2.269256 0 0
C29OP 0 0 0 2.694741 0 2.694741 0 2.694741 0 0
C28OP 0 0 0 3.19114 0 3.19114 0 3.19114 0 0
C27OP 0 0 0 3.68754 0 3.68754 0 3.68754 0 0
C26OP 0 0 0 4.325768 0 4.325768 0 4.325768 0 0
C25OP 0 0 0 5.105825 0 5.105825 0 5.105825 0 0
C24OP 0 0 0 5.956795 0 5.956795 0 5.956795 0 0
C23OP 0 0 0 6.949594 0 6.949594 0 6.949594 0 0
C22OP 0 0 0 8.084222 0 8.084222 0 8.084222 0 0
C21OP 0 0 0 9.360679 0 9.360679 0 9.360679 0 0
1-EIC-01 0 0 0 5.460396 0 5.460396 0 5.460396 0 0
N-EIC-01 0 0 0 5.460396 0 5.460396 0 5.460396 0 0
1-NON-02 0 0 0 6.311367 0 6.311367 0 6.311367 0 0
N-NON-02 0 0 0 6.240453 0 6.240453 0 6.240453 0 0
N-OCT-02 0 0 0 7.233252 0 7.233252 0 7.233252 0 0
1-OCT-02 0 0 0 7.233252 0 7.233252 0 7.233252 0 0
1-HEP-02 0 0 0 8.296965 0 8.296965 0 8.296965 0 0
N-HEP-02 0 0 0 8.296965 0 8.296965 0 8.296965 0 0
N-HEX-02 0 0 0 9.573422 0 9.573422 0 9.573422 0 0
1-HEX-02 0 0 0 9.431593 0 9.431593 0 9.431593 0 0
1-PEN-02 0 0 0 10.77896 0 10.77896 0 10.77896 0 0
N-PEN-02 0 0 0 10.92079 0 10.92079 0 10.92079 0 0
N-TET-01 0 0 0 12.33908 0 12.33908 0 12.33908 0 0
1-TET-01 0 0 0 12.26816 0 12.26816 0 12.26816 0 0
AR 0 0 0 0 0 0 0 0 0 0
TEG 0 0 0 0 0.00E+00 0.00E+00 0 0.00E+00 0 0

163
Table S8. Mass balance of Syn-crude Upgrade
Stream Name FEED LPG TO-CRCK H2-STRM TO-DIST GASOLINE TO-DIST2 DIESEL WAX
Destination DEPROZE LPG-STO HYDROCRK HYDROCRK DIST1 GAS-STO DIST2 DIES-STO DIES-STO
Source F-T Section DEPROZE DEPROZE $C-16 HYDROCRK DIST1 DIST1 DIST2 DIST2
Stream Fraction LIQUID LIQUID LIQUID VAPOR LIQUID LIQUID LIQUID LIQUID LIQUID
Temperature 200 5.03969 249.3066 200 354 3.050677 280.9733 261.3634 446.6425
Pressure 40 20 20 40 50 1.7 1.7 1.2 1.2
Mole Flow kmol/hr 6.890431 1.627622 5.262809 0.1661752 5.707071 3.474824 2.232248 2.205936 0.026312
Volume (m3/h) 1.647851 0.1214779 1.656083 0.1656965 2.437541 0.4114772 1.005752 0.9577213 0.0255899
Mass Flow kg/hr 860.7821 58.04112 802.741 0.3349893 803.076 276.9149 526.1611 515.0362 11.1249
METHANE 0 0 0 0 0 0 0 0 0
CO2 0 0 0 0 0 0 0 0 0
N2 0 0 0 0 0 0 0 0 0
O2 0 0 0 0 0 0 0 0 0
H2O 0 0 0 0 0 0 0 0 0
H2S 0 0 0 0 0 0 0 0 0
CO 0 0 0 0 0 0 0 0 0
H2 0 0.3349893 0 0 0 0 0 0 0
C2H4 2.69E-13 0 0 0.2114896 2.24E-11 12.12453 0.2114896 2.69E-13 2.69E-13
C2H6 1.39E-11 0 0 3.518668 2.82E-09 12.99334 3.518668 1.39E-11 1.39E-11
C3H6 6.60E-10 0 0 7.761569 2.11E-03 16.0205 7.761569 6.60E-10 6.60E-10
C3H8 8.17E-10 0 0 6.327304 0.0167897 16.78972 6.327304 8.17E-10 8.17E-10
BUTANE 3.99E-08 0 0 9.742579 9.682822 9.692515 9.742579 3.99E-08 3.99E-08
1-BUT-01 2.96E-08 0 0 11.84193 18.6669 18.71129 11.84193 2.96E-08 2.96E-08
1-BUT-02 2.96E-08 0 0 11.84193 0 0 11.84193 2.96E-08 2.96E-08
ISOBU-01 1.51E-08 0 0 8.758978 9.614727 9.692515 8.758978 1.51E-08 1.51E-08
N-PEN-01 1.32E-06 0 0 12.49688 10.51381 10.51383 12.49688 1.32E-06 1.32E-06
1-PEN-01 9.14E-07 0 0 14.59238 20.44175 20.44178 14.59238 9.14E-07 9.14E-07
2-MET-01 1.32E-06 0 0 23.16569 10.51381 10.51383 23.16569 1.32E-06 1.32E-06
1-HEX-01 2.36E-05 0 0 16.4924 21.41081 21.41081 16.49243 2.36E-05 2.36E-05
N-HEX-01 3.25E-05 0 0 12.91798 10.96238 10.96238 12.91802 3.25E-05 3.25E-05
2-MET-02 2.48E-05 0 0 21.62021 10.96238 10.96238 21.62024 2.48E-05 2.48E-05
1-HEP-01 5.65E-04 0 0 18.84968 21.78972 21.78972 18.85024 0.000564992 5.65E-04
N-HEP-01 7.26E-04 0 0 14.20452 22.23803 22.23803 14.20524 0.000725676 7.26E-04
1-OCT-01 5.88E-03 0 0 9.874661 21.71551 21.71551 9.880543 0.00588235 5.88E-03
N-OCT-01 0.01643 0 0 16.4136 22.10259 22.10259 16.43003 0.01643 0.01643
N-NON-01 0.2699057 0 0 14.64621 21.63277 21.63277 14.91612 0.2699057 0.2699057
1-NON-01 0.1899211 0 0 16.66573 21.29528 21.29528 16.85565 0.1899211 0.1899211
1-DEC-01 1.141962 0 0 5.453486 20.62135 20.62135 6.595448 1.141962 1.141962
N-DEC-01 3.929016 0 0 11.70368 20.91552 20.91552 15.63269 3.929016 3.929016
1-UND-01 17.03035 0 0 4.682292 19.75988 19.75988 21.71264 17.03035 17.03035
N-UND-01 14.08855 0 0 2.482506 20.02899 20.02899 16.57105 14.08855 14.08855
1-DOD-01 27.21082 0 0 0.4618295 18.78808 18.78808 27.67265 27.21082 27.21082
N-DOD-01 15.25436 0 0 0.1638508 19.01135 19.01135 15.41821 15.25436 15.25436
1-TRI-01 9.291712 0 0 9.30E-03 17.73278 17.73278 9.301013 9.291712 9.291712
N-TRI-01 17.01303 0 0 0.0119095 17.92732 17.92732 17.02494 17.01303 17.01303
C30WAX 0 0 0 0 0 0 0 0 0
1-EIC-01 20.53128 0 0 0 10.38101 10.38101 20.53128 20.53128 20.53128
N-EIC-01 13.13265 0 0 0 10.45503 10.45503 13.13265 13.13265 13.13265
1-NON-02 20.40209 0 0 0 11.32262 11.32262 20.40209 20.40209 20.40209
N-NON-02 14.06085 0 0 0 11.40759 11.40759 14.06085 14.06085 14.06085
N-OCT-02 14.84563 0 0 0 12.41274 12.41274 14.84563 14.84563 14.84563
1-OCT-02 20.80045 0 0 0 12.31516 12.31516 20.80045 20.80045 20.80045
1-HEP-02 21.12414 0 0 0 13.35306 13.35306 21.12414 21.12414 21.12414
N-HEP-02 15.88985 0 0 0 13.46508 13.46508 15.88985 15.88985 15.88985
N-HEX-02 0 0 0 0 14.55973 14.55973 0 0 0
1-HEX-02 38.03182 0 0 0 14.42468 14.42468 38.03182 38.03182 38.03182
1-PEN-02 52.90186 0 0 1.61E-04 15.52415 15.52415 52.90202 52.90186 52.90186
N-PEN-02 16.92285 0 0 2.81E-05 15.67917 15.67917 16.92288 16.92285 16.92285
N-TET-01 17.21316 0 0 8.01E-04 16.80614 16.80614 17.21397 17.21316 17.21316
1-TET-01 10.87483 0 0 6.74E-04 16.63664 16.63664 10.87551 10.87483 10.87483
AR 0 0 0 0 0 0 0 0 0
N-HEN-01 15.67066 0 0 0 19.05195 19.05195 15.67066 15.67066 15.67066
N-DOC-01 17.71725 0 0 0 17.38113 17.38113 17.71725 17.71725 17.71725
N-TRI-02 16.45279 0 0 0 15.82407 15.82407 16.45279 16.45279 16.45279
N-TET-02 15.3778 0 0 0 14.37927 14.37927 15.3778 15.3778 15.3778
N-PEN-03 15.03308 0 0 0 13.0437 13.0437 15.03308 15.03308 15.03308
N-HEX-03 13.75705 0 0 0 11.81324 11.81324 13.75705 13.75705 13.75705
N-HEP-03 14.02532 0 0 0 10.68304 10.68304 14.02532 14.02532 14.02532
N-OCT-03 12.3813 0 0 0 9.647707 9.647707 12.3813 12.3813 12.3813
N-NON-03 12.435 0 0 0 8.701601 8.701601 12.44745 12.435 12.44745
N-TRI-03 0.0111235 0 0 0 85.12502 85.12502 11.12357 0.0111235 11.12357
NO 0 0 0 0 0 0 0 0 0
NO2 0 0 0 0 0 0 0 0 0
N2O 0 0 0 0 0 0 0 0 0

164
Table S9. Mass balance of Electricity Generation
Stream Name FUEL FUEL-GAS AIR TO-MIX NOXSTEAM TO-TURB TO-HRSG FLUEGAS CONDNSAT HP-WATER TO-STMTB TO-COND C-WATER
Destination LAYDOWN BURNER AIRCOMP BURNER BURNER GASTURB HRSG PUMP BOILER STMTRBN CONDENSR
Source F-T Section LAYDOWN AIRCOMP BURNER GASTURB HRSG PUMP BOILER STMTRBN CONDENSR
Stream Fraction VAPOR VAPOR VAPOR VAPOR VAPOR VAPOR VAPOR VAPOR LIQUID LIQUID VAPOR MIXED LIQUID
Temperature 200 27.47081 32 367.7176 171.0811 1134.489 1079.536 120 20 20.19915 327.7763 20 20
Pressure 40 8 1 8 8 8 6 1 0.0233586 125 125 0.0233586 0.0233586
Mole Flow kmol/hr 79.14289 79.14289 218.5791 218.5791 338.7126 598.2639 598.2639 598.2639 467.6914 467.6914 467.6914 467.6914 467.6914
Volume (m3/h) 79.04257 247.9901 5543.026 1459.532 1495.1 8760.085 11221.18 19475.74 8.440059 8.393263 113.8814 3.01E+05 8.440059
Mass Flow kg/hr 780.7264 780.7264 6329.998 6329.998 6102.003 13212.73 13212.73 13212.73 8425.592 8425.592 8425.592 8425.592 8425.592
METHANE 37.22756 37.22756 0 0 0 1.48E-23 1.48E-23 1.48E-23 0 0 0 0 0
CO2 12.26991 12.26991 0 0 0 1085.701 1085.701 1085.701 0 0 0 0 0
N2 0 0 4782.985 4782.985 0 4782.348 4782.348 4782.348 0 0 0 0 0
O2 0 0 1465.719 1465.719 0 95.06698 95.06698 95.06698 0 0 0 0 0
H2O 3.624054 3.624054 0 0 6102.003 7166.945 7166.945 7166.945 8425.592 8425.592 8425.592 8425.592 8425.592
H2S 0 0 0 0 0 0 0 0 0 0 0 0 0
CO 618.1989 618.1989 0 0 0 3.85E-03 3.85E-03 3.85E-03 0 0 0 0 0
H2 109.406 109.406 0 0 0 2.05E-03 2.05E-03 2.05E-03 0 0 0 0 0
C2H4 0 0 0 0 0 0 0 0 0 0 0 0 0
C2H6 0 0 0 0 0 0 0 0 0 0 0 0 0
C3H6 0 0 0 0 0 0 0 0 0 0 0 0 0
C3H8 0 0 0 0 0 0 0 0 0 0 0 0 0
BUTANE 0 0 0 0 0 0 0 0 0 0 0 0 0
1-BUT-01 0 0 0 0 0 0 0 0 0 0 0 0 0
1-BUT-02 0 0 0 0 0 0 0 0 0 0 0 0 0
ISOBU-01 0 0 0 0 0 0 0 0 0 0 0 0 0
N-PEN-01 0 0 0 0 0 0 0 0 0 0 0 0 0
1-PEN-01 0 0 0 0 0 0 0 0 0 0 0 0 0
2-MET-01 0 0 0 0 0 0 0 0 0 0 0 0 0
1-HEX-01 0 0 0 0 0 0 0 0 0 0 0 0 0
N-HEX-01 0 0 0 0 0 0 0 0 0 0 0 0 0
2-MET-02 0 0 0 0 0 0 0 0 0 0 0 0 0
1-HEP-01 0 0 0 0 0 0 0 0 0 0 0 0 0
N-HEP-01 0 0 0 0 0 0 0 0 0 0 0 0 0
1-OCT-01 0 0 0 0 0 0 0 0 0 0 0 0 0
N-OCT-01 0 0 0 0 0 0 0 0 0 0 0 0 0
N-NON-01 0 0 0 0 0 0 0 0 0 0 0 0 0
1-NON-01 0 0 0 0 0 0 0 0 0 0 0 0 0
1-DEC-01 0 0 0 0 0 0 0 0 0 0 0 0 0
N-DEC-01 0 0 0 0 0 0 0 0 0 0 0 0 0
1-UND-01 0 0 0 0 0 0 0 0 0 0 0 0 0
N-UND-01 0 0 0 0 0 0 0 0 0 0 0 0 0
1-DOD-01 0 0 0 0 0 0 0 0 0 0 0 0 0
N-DOD-01 0 0 0 0 0 0 0 0 0 0 0 0 0
1-TRI-01 0 0 0 0 0 0 0 0 0 0 0 0 0
N-TRI-01 0 0 0 0 0 0 0 0 0 0 0 0 0
C30WAX 0 0 0 0 0 0 0 0 0 0 0 0 0
1-EIC-01 0 0 0 0 0 0 0 0 0 0 0 0 0
N-EIC-01 0 0 0 0 0 0 0 0 0 0 0 0 0
1-NON-02 0 0 0 0 0 0 0 0 0 0 0 0 0
N-NON-02 0 0 0 0 0 0 0 0 0 0 0 0 0
N-OCT-02 0 0 0 0 0 0 0 0 0 0 0 0 0
1-OCT-02 0 0 0 0 0 0 0 0 0 0 0 0 0
1-HEP-02 0 0 0 0 0 0 0 0 0 0 0 0 0
N-HEP-02 0 0 0 0 0 0 0 0 0 0 0 0 0
N-HEX-02 0 0 0 0 0 0 0 0 0 0 0 0 0
1-HEX-02 0 0 0 0 0 0 0 0 0 0 0 0 0
1-PEN-02 0 0 0 0 0 0 0 0 0 0 0 0 0
N-PEN-02 0 0 0 0 0 0 0 0 0 0 0 0 0
N-TET-01 0 0 0 0 0 0 0 0 0 0 0 0 0
1-TET-01 0 0 0 0 0 0 0 0 0 0 0 0 0
AR 0 0 81.29305 81.29305 0 81.29305 81.29305 81.29305 0 0 0 0 0
N-HEN-01 0 0 0 0 0 0 0 0 0 0 0 0 0
N-DOC-01 0 0 0 0 0 0 0 0 0 0 0 0 0
N-TRI-02 0 0 0 0 0 0 0 0 0 0 0 0 0
N-TET-02 0 0 0 0 0 0 0 0 0 0 0 0 0
N-PEN-03 0 0 0 0 0 0 0 0 0 0 0 0 0
N-HEX-03 0 0 0 0 0 0 0 0 0 0 0 0 0
N-HEP-03 0 0 0 0 0 0 0 0 0 0 0 0 0
N-OCT-03 0 0 0 0 0 0 0 0 0 0 0 0 0
N-NON-03 0 0 0 0 0 0 0 0 0 0 0 0 0
N-TRI-03 0 0 0 0 0 0 0 0 0 0 0 0 0
NO 0 0 0 0 0 1.361198 1.361198 1.361198 0 0 0 0 0
NO2 0 0 0 0 0 6.26E-03 6.26E-03 6.26E-03 0 0 0 0 0
N2O 0 0 0 0 0 1.89E-04 1.89E-04 1.89E-04 0 0 0 0 0