economic analysis guidelines - water.ca.gov flood... · economic analysis guidelines . ... chapter...
TRANSCRIPT

i
Economic Analysis Guidelines Flood Risk Management
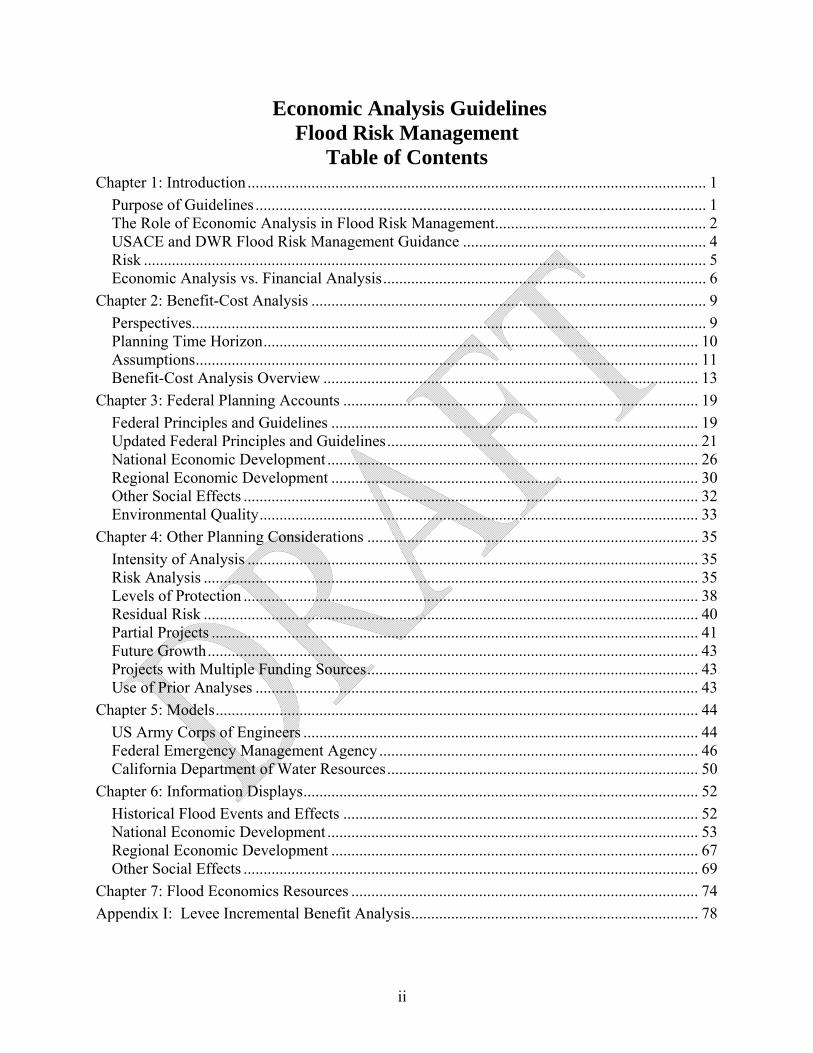
Table of Contents Chapter 1: Introduction ................................................................................................................... 1
Purpose of Guidelines ................................................................................................................. 1 The Role of Economic Analysis in Flood Risk Management..................................................... 2 USACE and DWR Flood Risk Management Guidance ............................................................. 4 Risk ............................................................................................................................................. 5 Economic Analysis vs. Financial Analysis................................................................................. 6
Chapter 2: Benefit-Cost Analysis ................................................................................................... 9 Perspectives................................................................................................................................. 9 Planning Time Horizon............................................................................................................. 10 Assumptions.............................................................................................................................. 11 Benefit-Cost Analysis Overview .............................................................................................. 13
Chapter 3: Federal Planning Accounts ......................................................................................... 19 Federal Principles and Guidelines ............................................................................................ 19 Updated Federal Principles and Guidelines.............................................................................. 21 National Economic Development ............................................................................................. 26 Regional Economic Development ............................................................................................ 30 Other Social Effects .................................................................................................................. 32 Environmental Quality.............................................................................................................. 33
Chapter 4: Other Planning Considerations ................................................................................... 35 Intensity of Analysis ................................................................................................................. 35 Risk Analysis ............................................................................................................................ 35 Levels of Protection .................................................................................................................. 38 Residual Risk ............................................................................................................................ 40 Partial Projects .......................................................................................................................... 41 Future Growth........................................................................................................................... 43 Projects with Multiple Funding Sources................................................................................... 43 Use of Prior Analyses ............................................................................................................... 43
Chapter 5: Models......................................................................................................................... 44 US Army Corps of Engineers ................................................................................................... 44 Federal Emergency Management Agency ................................................................................ 46 California Department of Water Resources.............................................................................. 50
Chapter 6: Information Displays................................................................................................... 52 Historical Flood Events and Effects ......................................................................................... 52 National Economic Development ............................................................................................. 53 Regional Economic Development ............................................................................................ 67 Other Social Effects .................................................................................................................. 69
Chapter 7: Flood Economics Resources ....................................................................................... 74 Appendix I: Levee Incremental Benefit Analysis........................................................................ 78
ii
iii
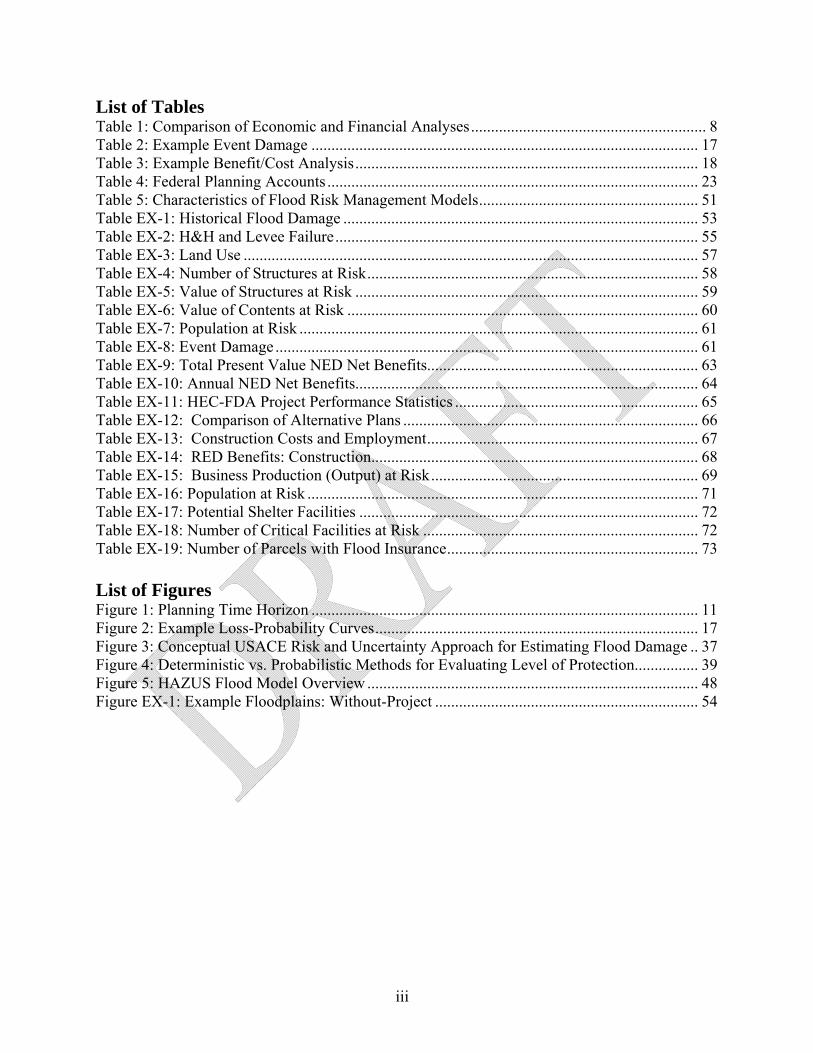
List of Tables Table 1: Comparison of Economic and Financial Analyses........................................................... 8 Table 2: Example Event Damage ................................................................................................. 17 Table 3: Example Benefit/Cost Analysis...................................................................................... 18 Table 4: Federal Planning Accounts ............................................................................................. 23 Table 5: Characteristics of Flood Risk Management Models....................................................... 51 Table EX-1: Historical Flood Damage ......................................................................................... 53 Table EX-2: H&H and Levee Failure........................................................................................... 55 Table EX-3: Land Use .................................................................................................................. 57 Table EX-4: Number of Structures at Risk................................................................................... 58 Table EX-5: Value of Structures at Risk ...................................................................................... 59 Table EX-6: Value of Contents at Risk ........................................................................................ 60 Table EX-7: Population at Risk .................................................................................................... 61 Table EX-8: Event Damage .......................................................................................................... 61 Table EX-9: Total Present Value NED Net Benefits.................................................................... 63 Table EX-10: Annual NED Net Benefits...................................................................................... 64 Table EX-11: HEC-FDA Project Performance Statistics ............................................................. 65 Table EX-12: Comparison of Alternative Plans .......................................................................... 66 Table EX-13: Construction Costs and Employment.................................................................... 67 Table EX-14: RED Benefits: Construction.................................................................................. 68 Table EX-15: Business Production (Output) at Risk................................................................... 69 Table EX-16: Population at Risk .................................................................................................. 71 Table EX-17: Potential Shelter Facilities ..................................................................................... 72 Table EX-18: Number of Critical Facilities at Risk ..................................................................... 72 Table EX-19: Number of Parcels with Flood Insurance............................................................... 73 List of Figures Figure 1: Planning Time Horizon ................................................................................................. 11 Figure 2: Example Loss-Probability Curves................................................................................. 17 Figure 3: Conceptual USACE Risk and Uncertainty Approach for Estimating Flood Damage .. 37 Figure 4: Deterministic vs. Probabilistic Methods for Evaluating Level of Protection................ 39 Figure 5: HAZUS Flood Model Overview ................................................................................... 48 Figure EX-1: Example Floodplains: Without-Project .................................................................. 54
DRAFT May 10, 2010
Chapter 1: Introduction
Purpose of Guidelines The purpose of these guidelines is to provide consistent economic analysis guidance for the
increasing number of DWR programs that include flood management objectives, such as the:
• California Water Plan,
• Central Valley Flood Protection Plan,
• State Plan of Flood Control,
• Regional flood management planning,
• Delta Risk Management Strategy, and
• Various bond grant programs, including (but not limited to):
o Early Implementation Program,
o Local Levee Urgent Repairs,
o Delta Levees System Integrity,
o Floodway Corridor, and
o Stormwater Flood Management
Although many of these programs are concerned with riverine flooding, these guidelines should
be applicable for other types of flooding as well, such as coastal and alluvial fans.
These DWR guidelines are being developed at a time when the science of evaluating the
economic effects of flood management programs is rapidly changing. Previously known as flood
control and flood damage reduction, these programs were often single-purpose (or multi-purpose
with one purpose being predominant) for which the economic analysis focused only upon net
benefits and benefit/cost ratios, which primarily included avoided damage to structures and other
physical assets. However, for the past several years, it has been increasingly recognized that
these programs must focus upon all aspects of flood risk management, i.e., they must evaluate,
communicate, and mitigate all risks society faces from flooding. Thus, the focus of the
economic analysis must be broadened to not only develop net benefit analyses based primarily
1
upon the loss of structures and other physical assets, but also upon regional and social effects.
This was further reinforced following the devastating effects of Hurricane Katrina, after which it
became apparent that neighborhoods and even entire communities may not recover following
that catastrophic event. Currently, intensive research is underway by the USACE, FEMA, and
other organizations on how to incorporate regional and social considerations into the economic
(or, more appropriately, socioeconomic) analysis. As this information is developed, it will be
incorporated into these DWR guidelines. Thus, these guidelines are very much a “work in
progress”.
The Role of Economic Analysis in Flood Risk Management Economics is the study of how and why people make decisions about the use of valuable
resources to obtain maximum net benefits, or economic efficiency. Although efficiency is not
the only goal of society, the measurement of changes in efficiency through economic analysis
provides a key framework to compare alternative courses of action:
An integrated approach to flood management requires land and water in a river basin to be considered as a single unit and aims at minimizing the losses of life from flooding while maximizing the net benefits derived from flood plains. The net benefits are the overall benefit a society derives from using flood plains (such as agricultural output and other economic activities) minus the overall cost of using the floodplains (flood damages, cost of flood protection, habitat loss, etc.) Assessing the net benefits from flood plains involves understanding the social, economic and environmental dimensions of flood risks. It requires a trade-off between development potential and the risks society has to take in occupying flood plains.1
Thus, conceptually, economics examines the efficiency (net benefits) of floodplain use which
can be used to compare alternative plans:
1 Associated Programme on Flood Management, Economic Aspects of Integrated Flood Management, June 2007.
2
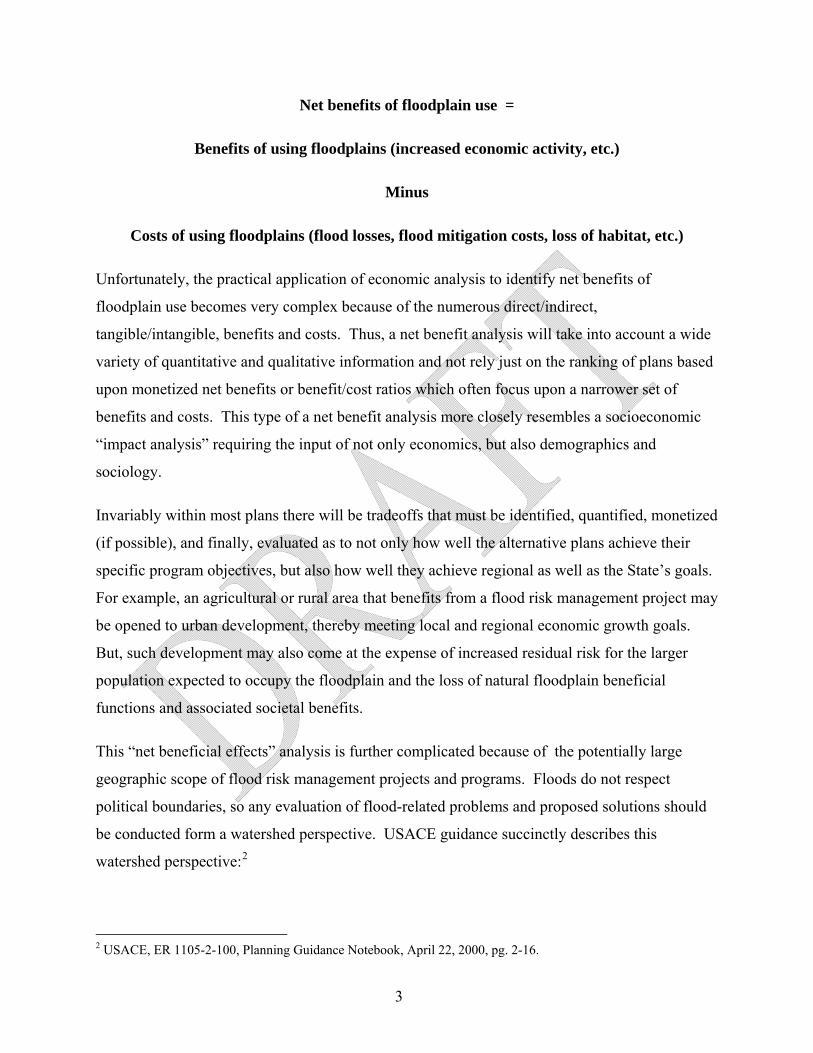
Net benefits of floodplain use =
Benefits of using floodplains (increased economic activity, etc.)
Minus
Costs of using floodplains (flood losses, flood mitigation costs, loss of habitat, etc.)
Unfortunately, the practical application of economic analysis to identify net benefits of
floodplain use becomes very complex because of the numerous direct/indirect,
tangible/intangible, benefits and costs. Thus, a net benefit analysis will take into account a wide
variety of quantitative and qualitative information and not rely just on the ranking of plans based
upon monetized net benefits or benefit/cost ratios which often focus upon a narrower set of
benefits and costs. This type of a net benefit analysis more closely resembles a socioeconomic
“impact analysis” requiring the input of not only economics, but also demographics and
sociology.
Invariably within most plans there will be tradeoffs that must be identified, quantified, monetized
(if possible), and finally, evaluated as to not only how well the alternative plans achieve their
specific program objectives, but also how well they achieve regional as well as the State’s goals.
For example, an agricultural or rural area that benefits from a flood risk management project may
be opened to urban development, thereby meeting local and regional economic growth goals.
But, such development may also come at the expense of increased residual risk for the larger
population expected to occupy the floodplain and the loss of natural floodplain beneficial
functions and associated societal benefits.
This “net beneficial effects” analysis is further complicated because of the potentially large
geographic scope of flood risk management projects and programs. Floods do not respect
political boundaries, so any evaluation of flood-related problems and proposed solutions should
be conducted form a watershed perspective. USACE guidance succinctly describes this
watershed perspective:2
2 USACE, ER 1105-2-100, Planning Guidance Notebook, April 22, 2000, pg. 2-16.
3

Civil works planning should incorporate a watershed perspective, whether that planning involves a project feasibility study or a more comprehensive watershed study. Such planning should be accomplished within the context of an understanding and appreciation of the impacts of considered actions on other natural and human resources in the watershed. In carrying out planning activities, we should encourage the active participation of all interested groups and use the full spectrum of technical disciplines in activities and decision-making. We also should take into account: the interconnectedness of water and land resources (a systems approach); the dynamic nature of the economy and the environment, and the variability of social interests over time. Specifically, civil works planning should consider the sustainability of future watershed resources, specifically taking into account environmental quality, economic development, and social well-being.
USACE and DWR Flood Risk Management Guidance Because of its considerable water management partnerships with the federal government, the
Department of Water Resources (DWR) has a policy that all economic analyses conducted for its
internal use on programs and projects be fundamentally consistent with the federal Economics
and Environmental Principles and Guidelines for Water and Related Land Resources
Implementation Studies (P&G), which was adopted by the US Water Resources Council on
March 10, 1983. The P&G set forth principles “…intended to ensure proper and consistent
planning by federal agencies in the formulation and evaluation of water and related land
resources implementation studies…” and guidelines that “…establish standards and procedures
for use by federal agencies in formulating and evaluating alternative plans for water and related
land resources implementation studies.”
It is also DWR policy to adopt, maintain, and periodically update its own Economics Analysis
Guidebook, which is consistent with the P&G but can also incorporate innovative methods and
tools when appropriate. This policy is necessary because (a) the P&G has not been updated for
almost 25 years, (b) federal and State economic analyses sometimes have different regional
analysis perspectives, and (c) water management projects and programs have become more
complex. For flood risk management projects, DWR will strive to meet USACE plan
formulation requirements when partnering with the USACE and/or requesting federal funding.
However, if after meeting these requirements, DWR believes that the use of innovative methods
which may deviate from current USACE practices but which may also help identify a “locally
4
preferred plan”, then these methods will be utilized. 3 When this occurs, collaboration will be
required between the USACE, DWR and potential local sponsors as to the implications of using
these methods upon federal cost-sharing requirements.
Risk A primary objective of flood risk flood management projects is the reduction of risk resulting
from the exposure of human and natural resources to flood waters. In its broadest sense, flood
risk is a function of the frequency of flood events over time and their corresponding damage and
other consequences. Smaller, frequent events that cause less damage may – over time –
contribute to just as much (if not more) of a flood risk than extreme, but very infrequent, flood
events that cause great damage. If levees or other structural flood protection facilities are
present, the frequency of flooding may be reduced, but if the facility fails or is overtopped, the
consequences can be devastating.
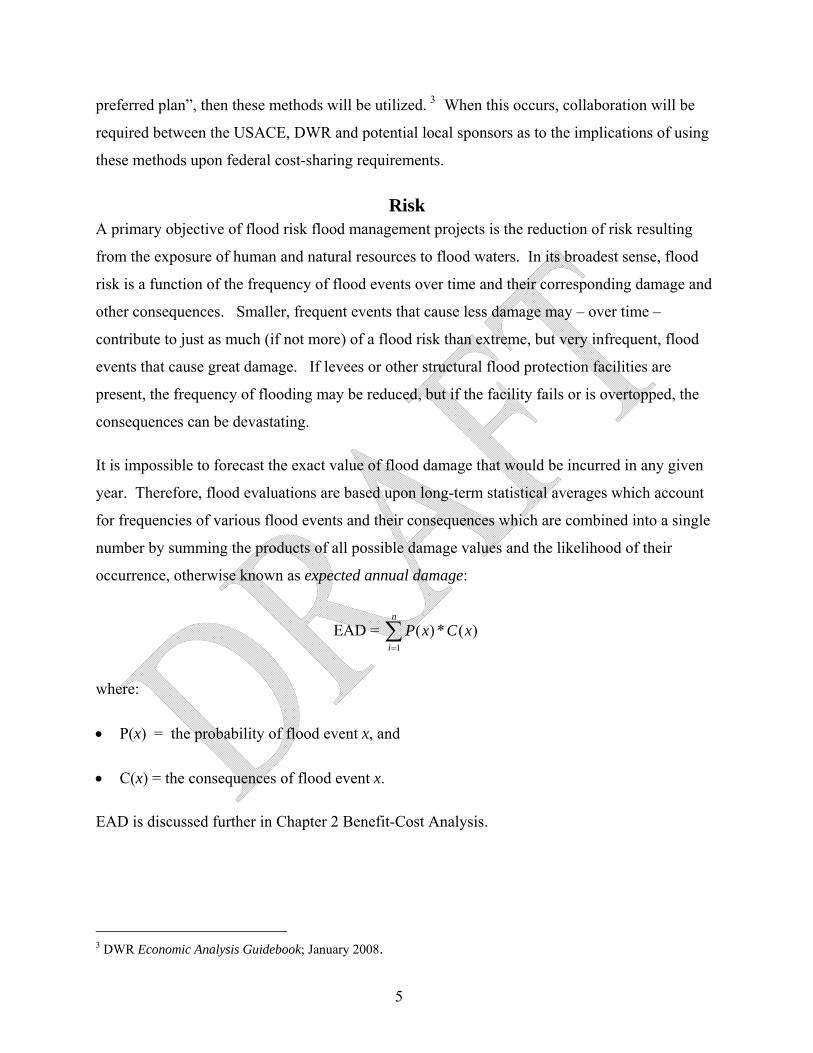
It is impossible to forecast the exact value of flood damage that would be incurred in any given
year. Therefore, flood evaluations are based upon long-term statistical averages which account
for frequencies of various flood events and their consequences which are combined into a single
number by summing the products of all possible damage values and the likelihood of their
occurrence, otherwise known as expected annual damage:
EAD = ∑ =
n
ixCxP
1)(*)(
where:
• P(x) = the probability of flood event x, and
• C(x) = the consequences of flood event x.
EAD is discussed further in Chapter 2 Benefit-Cost Analysis.
3 DWR Economic Analysis Guidebook; January 2008.
5
Economic Analysis vs. Financial Analysis
A common misconception is that economic and financial analyses are the same. Although both
are required to determine overall project feasibility and sometimes use the same data, they are
conceptually different types of analyses.
The objective of economic analysis is to determine if a project represents the best use of
resources over an analysis period (that is, the project is economically justified). The test of
economic feasibility is passed if the total benefits that result from the project exceed those which
would accrue without the project by an amount in excess of the project costs. This can be
mathematically expressed as either net benefits or the benefit/cost ratio. The objective of
financial analysis is to determine financial feasibility; that is, whether someone is willing to pay
for a project and has the capability to raise the necessary funds. The test of financial feasibility is
passed if (a) beneficiaries are able to pay reimbursable costs for project outputs over the project’s
repayment period, (b) sufficient capital is authorized and available to finance construction to
completion, and (c) estimated revenues are sufficient to cover allocated capital and operations,
maintenance and replacement costs over the repayment period.
The distinction between these two types of analyses is especially important for flood risk
management programs which focus upon economic losses:
“The intention of economic analysis as part of a flood loss assessment is to assess the deviation from likely economic activity as a result of the flood, not to take into account the financial losses to individual enterprises.” 4
Two examples:
• An owner of a firm is inundated from a flood event may suffer losses in net income.
However, another competitor outside of the flooded area may be able to substitute goods
from its own stock and therefore benefit from increased income. Thus, the economic
4 APFM, Conducting Flood Loss Assessments: A Tool for Integrated Flood Management, March 2007.
6
effect resulting from the flood event is the net difference among the firms and not the loss
to the flooded business owner.5
• Property owners in a flooded area will suffer damage to structures and their contents as
well as other physical assets. From a financial point of view to the individual, these
losses would be valued based upon full replacement costs. However, from an economic
point of view, the valuation is based upon depreciated replacement value which takes into
account the remaining economic life of the assets before they were damaged.
Table 1 summarizes the differences between economic and financial analyses.
5 The loss to the flooded business owner is still important, however, and can be included elsewhere in the analysis as discussed below.
7
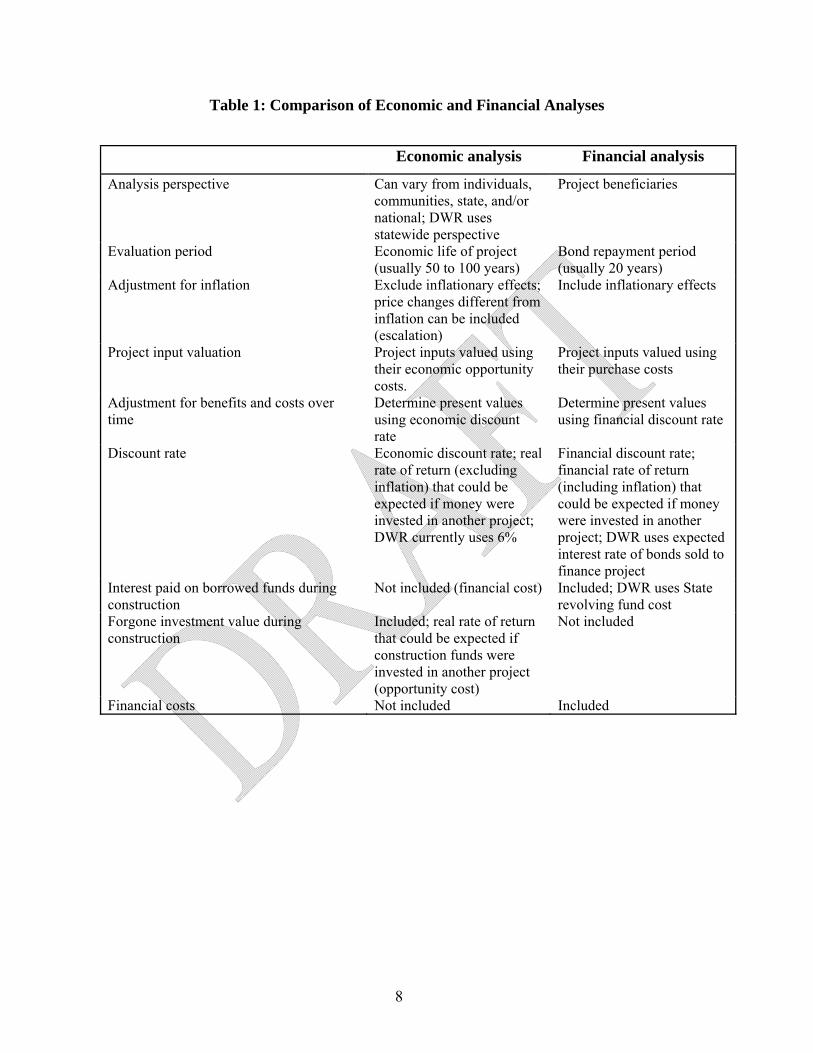
Table 1: Comparison of Economic and Financial Analyses
Economic analysis Financial analysis
Analysis perspective Can vary from individuals, communities, state, and/or national; DWR uses statewide perspective
Project beneficiaries
Evaluation period Economic life of project (usually 50 to 100 years)
Bond repayment period (usually 20 years)
Adjustment for inflation Exclude inflationary effects; price changes different from inflation can be included (escalation)
Include inflationary effects
Project input valuation Project inputs valued using their economic opportunity costs.
Project inputs valued using their purchase costs
Adjustment for benefits and costs over time
Determine present values using economic discount rate
Determine present values using financial discount rate
Discount rate Economic discount rate; real rate of return (excluding inflation) that could be expected if money were invested in another project; DWR currently uses 6%
Financial discount rate; financial rate of return (including inflation) that could be expected if money were invested in another project; DWR uses expected interest rate of bonds sold to finance project
Interest paid on borrowed funds during construction
Not included (financial cost) Included; DWR uses State revolving fund cost
Forgone investment value during construction
Included; real rate of return that could be expected if construction funds were invested in another project (opportunity cost)
Not included
Financial costs Not included Included
8
Chapter 2: Benefit-Cost Analysis
Perspectives Economic analysis greatly depends upon whose perspective is being considered in the
evaluation. For flood risk management projects that could potentially involve State and federal
participation, the following perspectives are relevant:
• Individuals: flood risk management projects provide direct outputs to individuals and
firms located within floodplains. The value of these outputs, or benefits, is measured by
the willingness of individuals and firms to pay for additional flood protection.
• Communities: the provision of additional flood protection may also provide indirect
economic benefits to communities as existing economic activity (regional income,
employment, etc.) may be stimulated within the flood protected area. This increased
economic activity is vey important to the community, but not necessarily to the State or
nation.
• State: the State perspective in funding flood risk management programs is to provide
benefits for all state taxpayers. If a flood risk management program stimulates economic
activity in one community, it may be at the expense of another community within the
State which looses economic activity. This basically represents a “transfer” of economic
activity within the State, with one community the “winner” and another the “loser”,
therefore not a benefit to the State.
• Federal: the federal perspective is similar to the State’s, except that it is for the entire
nation. The federal objective is to provide benefits for all the nation’s taxpayers.
Improved flood protection that stimulates economic activity in one state may do so at the
expense of economic activity foregone in another state, thus this is basically a “transfer”
of economic activity and not a benefit to the nation.
These perspectives are critical to understanding the federal planning accounts discussed in
Chapter 3.
9

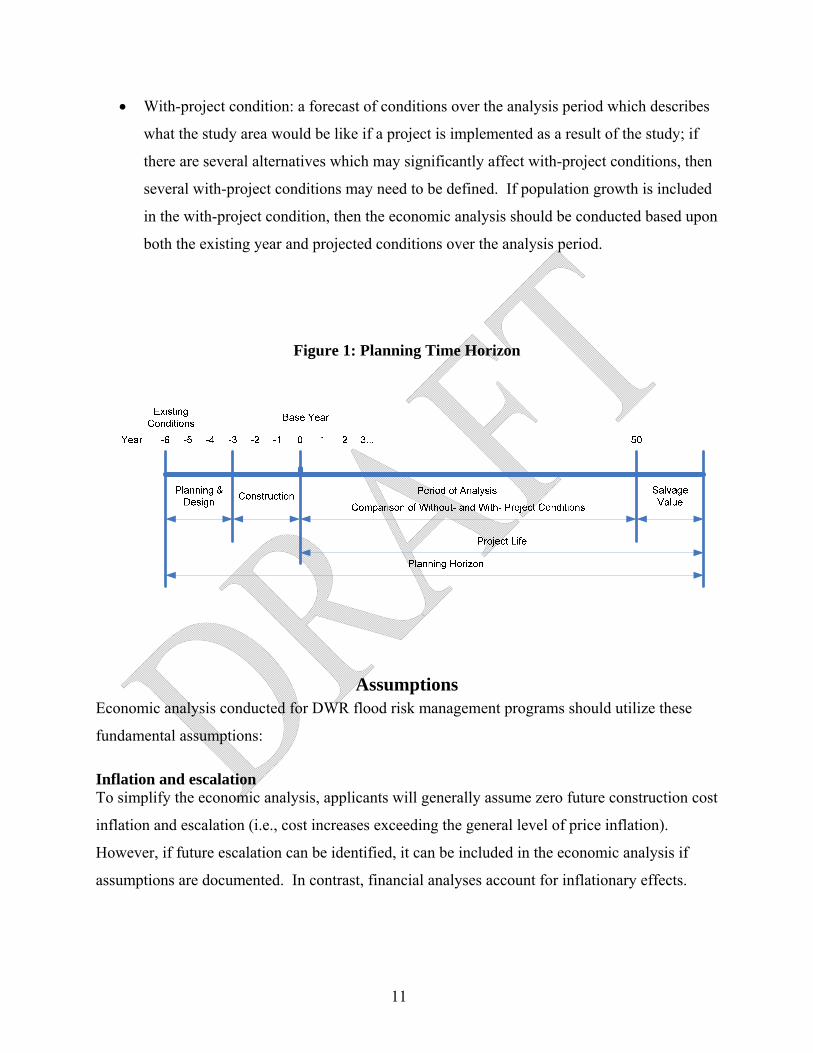
Planning Time Horizon The planning time horizon extends from the beginning of the study to the end of the project life,
as shown in Figure 1.6 The planning horizon includes planning and design, construction and
project life after construction. A subset of project life is the period of analysis over which any
alternative plans considered would likely to have significant beneficial or adverse effects.
Typical analysis periods for structural water resource projects are 50 to 100 years; for projects
considered under the FloodSAFE program, the economic analysis will be based on a analysis
period of 50 years unless other information is available that would show that a different period of
analysis should be used. If the period of analysis is shorter than the project’s life, then it may be
possible to deduct a salvage value, but often such a detailed analysis is not warranted because of
discounting since this adjustment occurs at the end of the analysis period.
Other critical concepts within the planning horizon include:
• Existing conditions: conditions at the time the study commences.
• Base year conditions: a forecast of conditions that describes the study area at the time
when the project begins operation; this may be several years from existing conditions and
in rapidly urbanizing areas, significant growth could occur between existing and base
year conditions; other flood risk management projects expected to come on line (or are
approved and funded) by the “base year” should be included.
• Without-project condition: a forecast of conditions over the period of analysis which
describes what the study area would be like if no project is implemented as a result of the
study; without-project conditions remain the same regardless of the number of
alternatives under study. The development of the without-project condition is one of the
most important tasks of a flood risk management study; this task is described further in
the USACE’s new National Economic Development Manual for Flood Damage
Reduction Studies.7
6 Project life can be further distinguished between economic life and physical life: the economic life is the period in which the project is economically viable, which means that the incremental benefits of continued use exceed the incremental costs of that use. Physical life is the period in which the project can physically perform its intended function. Economic life may be shorter than physical life but not vice versa. 7 http://www.pmcl.com/nedprototype/index.asp
10
11
• With-project condition: a forecast of conditions over the analysis period which describes
what the study area would be like if a project is implemented as a result of the study; if
there are several alternatives which may significantly affect with-project conditions, then
several with-project conditions may need to be defined. If population growth is included
in the with-project condition, then the economic analysis should be conducted based upon
both the existing year and projected conditions over the analysis period.
Figure 1: Planning Time Horizon
Assumptions Economic analysis conducted for DWR flood risk management programs should utilize these
fundamental assumptions:
Inflation and escalation To simplify the economic analysis, applicants will generally assume zero future construction cost
inflation and escalation (i.e., cost increases exceeding the general level of price inflation).
However, if future escalation can be identified, it can be included in the economic analysis if
assumptions are documented. In contrast, financial analyses account for inflationary effects.

Discount rate The discount rate is used to adjust dollars received or spent at different times to dollars of a
common value, usually present day dollars (“present worth” or “present value”). Although there
are different methods for determining discount rates, generally the value to use for this rate is the
real (that is, excluding inflation) rate of return that could be expected if the money were instead
invested in another project. In other words, the discount rate is a measure of forgone investment
opportunity (that is, “opportunity cost”) if the money allocated to the project were invested
elsewhere.
The selection of a discount rate is critical for the analysis because the larger the discount rate, the
greater the reduction in future monetary values. This tends to affect benefits more than costs
because the majority of costs are incurred early in the analysis period (for example, construction
costs); whereas, benefits typically occur later in the analysis period. DWR is currently using a
6% discount rate, which approximates the marginal pretax rate-of-return on an average
investment in the private sector in recent years. This rate will be periodically reviewed and
revised as necessary. The US Treasury Department annually sets the discount rate used by the
USACE.8 The discount rate is very much different from the bond repayment interest rate that is
used in a financial analysis.
Dollar base year All benefits and costs will be expressed in current year dollars. If dollar estimates are only
available for prior years, these can be updated using a variety of cost indices. To update project
construction costs, appropriate indices include the US Bureau of Reclamation Construction Cost
Indices (www.usbr.gov/pmts/estimate/cost_trend.html), the Engineering News-Record
Construction Cost Index (enr.construction.com), or the US Army Corps of Engineers’ (USACE)
Civil Works Construction Cost Index System (www.usace.army.mil/inet/usace-docs/eng-
manuals/em1110-2-1304/entire.pdf). To update building stock construction costs, Marshall &
Swift (or a similar appraisal services company) comparative cost multipliers can be used
(http://www.marshallswift.com). Finally, a useful “all purpose” index is the Gross Domestic
Product Implicit Price Deflator (www.research.stlouisfed.org/fred2/series/GDPDEF/21). The
analysis should identify which cost index is used.
8 The USACE discount rates are included in their Economic Guidance Memorandum found on their General Planning Guidelines website: http://www.usace.army.mil/cw/cecw-cp/library/planlib.html
12
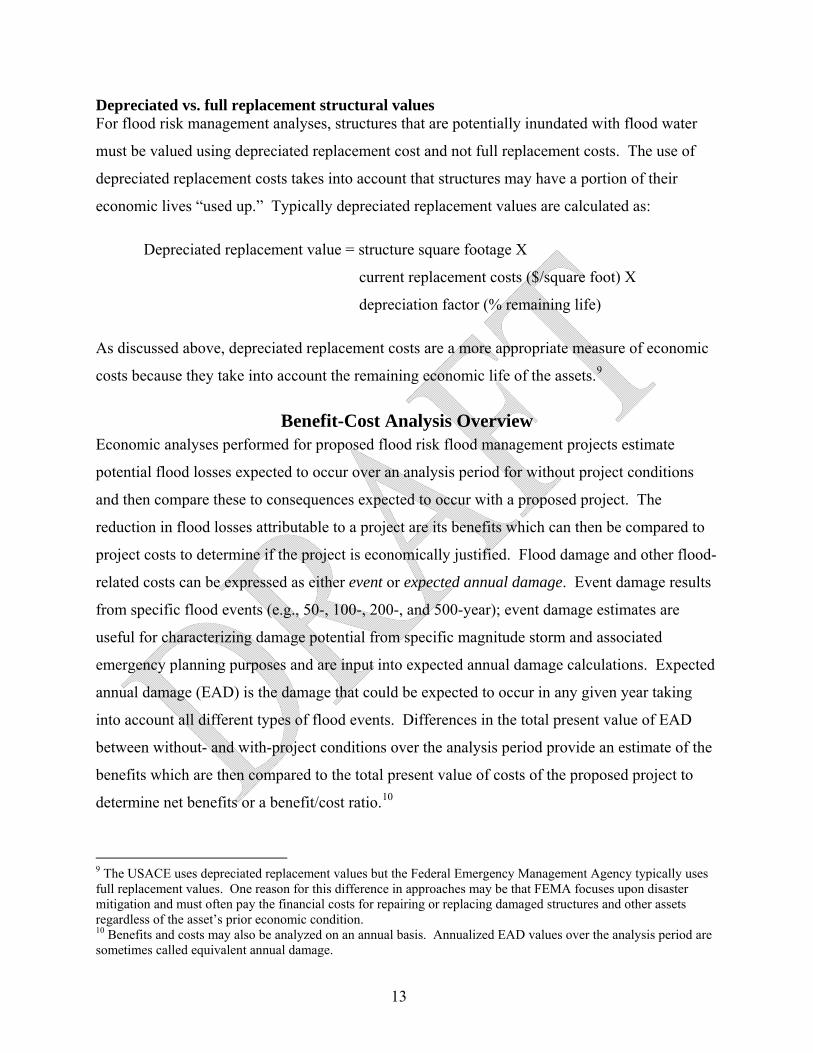
Depreciated vs. full replacement structural values For flood risk management analyses, structures that are potentially inundated with flood water
must be valued using depreciated replacement cost and not full replacement costs. The use of
depreciated replacement costs takes into account that structures may have a portion of their
economic lives “used up.” Typically depreciated replacement values are calculated as:
Depreciated replacement value = structure square footage X
current replacement costs ($/square foot) X
depreciation factor (% remaining life)
As discussed above, depreciated replacement costs are a more appropriate measure of economic
costs because they take into account the remaining economic life of the assets.9
Benefit-Cost Analysis Overview Economic analyses performed for proposed flood risk flood management projects estimate
potential flood losses expected to occur over an analysis period for without project conditions
and then compare these to consequences expected to occur with a proposed project. The
reduction in flood losses attributable to a project are its benefits which can then be compared to
project costs to determine if the project is economically justified. Flood damage and other flood-
related costs can be expressed as either event or expected annual damage. Event damage results
from specific flood events (e.g., 50-, 100-, 200-, and 500-year); event damage estimates are
useful for characterizing damage potential from specific magnitude storm and associated
emergency planning purposes and are input into expected annual damage calculations. Expected
annual damage (EAD) is the damage that could be expected to occur in any given year taking
into account all different types of flood events. Differences in the total present value of EAD
between without- and with-project conditions over the analysis period provide an estimate of the
benefits which are then compared to the total present value of costs of the proposed project to
determine net benefits or a benefit/cost ratio.10
9 The USACE uses depreciated replacement values but the Federal Emergency Management Agency typically uses full replacement values. One reason for this difference in approaches may be that FEMA focuses upon disaster mitigation and must often pay the financial costs for repairing or replacing damaged structures and other assets regardless of the asset’s prior economic condition. 10 Benefits and costs may also be analyzed on an annual basis. Annualized EAD values over the analysis period are sometimes called equivalent annual damage.
13
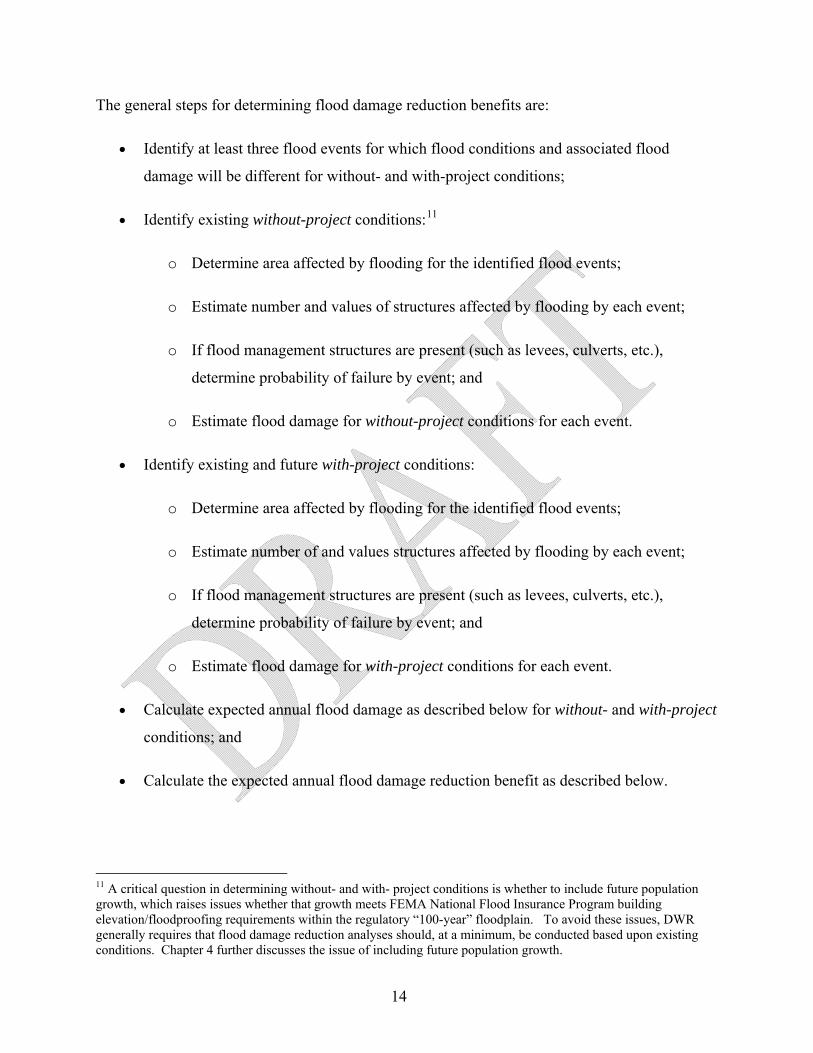
The general steps for determining flood damage reduction benefits are:
• Identify at least three flood events for which flood conditions and associated flood
damage will be different for without- and with-project conditions;
• Identify existing without-project conditions:11
o Determine area affected by flooding for the identified flood events;
o Estimate number and values of structures affected by flooding by each event;
o If flood management structures are present (such as levees, culverts, etc.),
determine probability of failure by event; and
o Estimate flood damage for without-project conditions for each event.
• Identify existing and future with-project conditions:
o Determine area affected by flooding for the identified flood events;
o Estimate number of and values structures affected by flooding by each event;
o If flood management structures are present (such as levees, culverts, etc.),
determine probability of failure by event; and
o Estimate flood damage for with-project conditions for each event.
• Calculate expected annual flood damage as described below for without- and with-project
conditions; and
• Calculate the expected annual flood damage reduction benefit as described below.
11 A critical question in determining without- and with- project conditions is whether to include future population growth, which raises issues whether that growth meets FEMA National Flood Insurance Program building elevation/floodproofing requirements within the regulatory “100-year” floodplain. To avoid these issues, DWR generally requires that flood damage reduction analyses should, at a minimum, be conducted based upon existing conditions. Chapter 4 further discusses the issue of including future population growth.
14
Expected annual damage (EAD) is the amount of annual flood damage estimated to occur on
average, taking into account all different types of flood events that might occur. EAD must be
calculated for the without-project and the with-project conditions. EAD is a function of three
variables:
• The probability of an event occurring that could result in flooding;
• The probability that, if present, any flood management structures (such as a levee or
culvert) fail given the event’s occurrence; and
• The resulting damage if the structural protection fails.
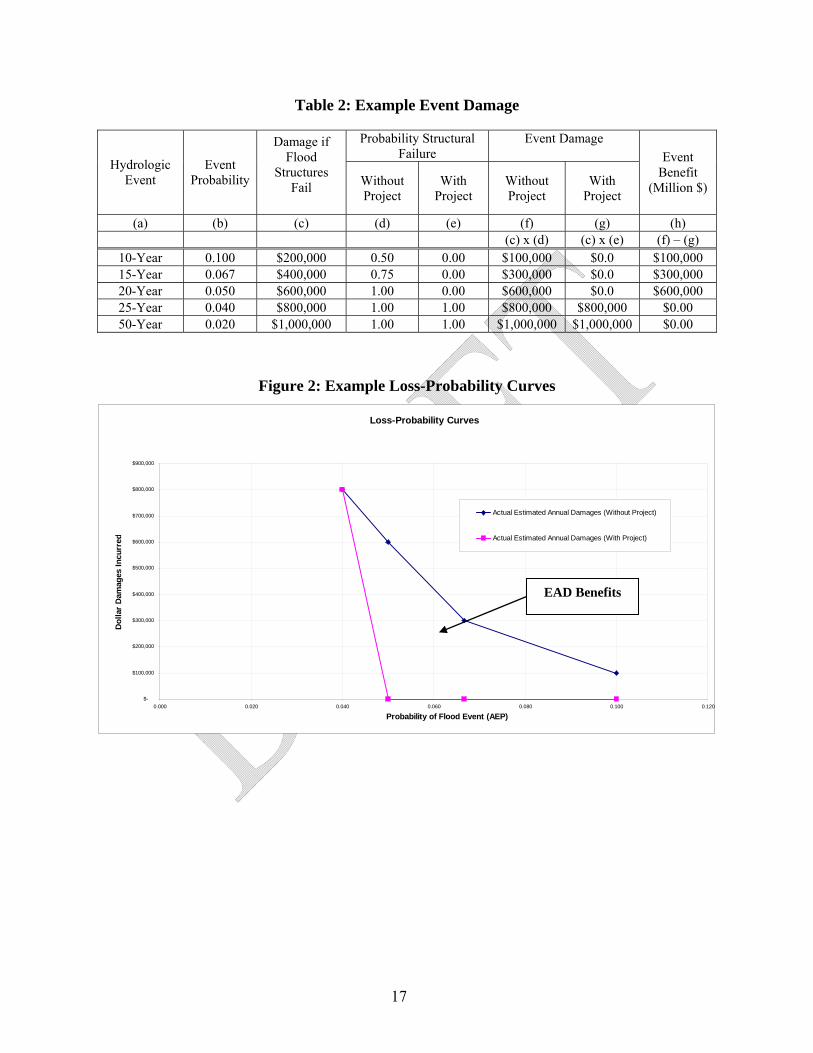
Example analysis Table 2 and Figure 2 illustrate how to estimate EAD for the without-project and with-project
conditions. Table 2 identifies five hydrologic events that could result in flooding for an area
with some form of structural flood protection (levee, culvert, etc.). The probability of an event
resulting in flooding depends on the without- and with-project level of protection provided by
flood protection structures (if present). As shown in Table 2, there is a 50 percent chance a 10-
year event will result in flooding without the project because of structural failure. With the
project, the structure is improved (or replaced) and the probability of structural failure for all
events through year 20 is reduced to zero. Event damage equals the monetary damage if the
structure fails multiplied by the probability that the structure will fail for this event. In this
example, event damage is greater for the without-project condition than for the with-project
condition for all events through year 20. Loss-probability curves are generated by plotting event
damage for the without-and with-project conditions compared with the corresponding event
probability, as in Figure 2. The area under a loss-probability curve equals the expected annual
damage (EAD) from flooding. In this example, EAD is greater for the without-project condition
than the with-project condition and the area between the two curves represents the benefits of the
project.
The estimation of EAD requires significant hydrologic, hydraulic, engineering/geotechnical (if
levees or other structures are involved) and economics data which must be analyzed to produce
the loss-probability curves shown in Figure 2. EAD is the area under the loss-probability curves
which requires integration. Computer models are available to assist with these calculations,
15
which range in complexity from the US Army Corps of Engineers’ HEC-Flood Damage
Assessment which incorporates risk and uncertainty, as well as simpler spreadsheet tools such as
the Flood Rapid Assessment Model (FRAM) developed for DWR and the Benefit Cost Analysis
(BCA) software developed by FEMA for its own mitigation programs. These models are
described in Chapter 5.
The expected annual benefit of the proposed project equals the difference between EAD without-
and with- the project for one year. Table 3 illustrates how to determine the total present value of
expected annual damage over the analysis period of the project. Continuing with the above
example, EAD without the project is estimated to be $59,200 and with the project $42,000
(integrating the areas under the loss-probability curves shown in Figure 2); therefore the
expected annual benefit is $17,200. This value is multiplied by the appropriate present value
coefficient for the project’s life cycle at a 6% discount rate (this example uses 15.76 which
assumes a 50 year period) which results in a total present value of future benefits -- $271,100. If
the total present value cost of future costs are $231,500 (including $200,000 in capital costs and
$31,500 in operations & maintenance costs over the life of the project), then the net benefits are
$39,600 and the B/C ratio 1.17.
16
17
Table 2: Example Event Damage
Probability Structural Failure
Event Damage
Hydrologic Event
Event Probability
Damage if Flood
Structures Fail
Without Project
With Project
Without Project
With Project
Event Benefit
(Million $)
(a) (b) (c) (d) (e) (f) (g) (h) (c) x (d) (c) x (e) (f) – (g)
10-Year 0.100 $200,000 0.50 0.00 $100,000 $0.0 $100,000 15-Year 0.067 $400,000 0.75 0.00 $300,000 $0.0 $300,000 20-Year 0.050 $600,000 1.00 0.00 $600,000 $0.0 $600,000 25-Year 0.040 $800,000 1.00 1.00 $800,000 $800,000 $0.00 50-Year 0.020 $1,000,000 1.00 1.00 $1,000,000 $1,000,000 $0.00
Figure 2: Example Loss-Probability Curves
Loss-Probability Curves
$-
$100,000
$200,000
$300,000
$400,000
$500,000
$600,000
$700,000
$800,000
$900,000
0.000 0.020 0.040 0.060 0.080 0.100 0.120
Probability of Flood Event (AEP)
Dol
lar
Dam
ages
Incu
rre
Actual Estimated Annual Damages (Without Project)
d Actual Estimated Annual Damages (With Project)
EAD Benefits
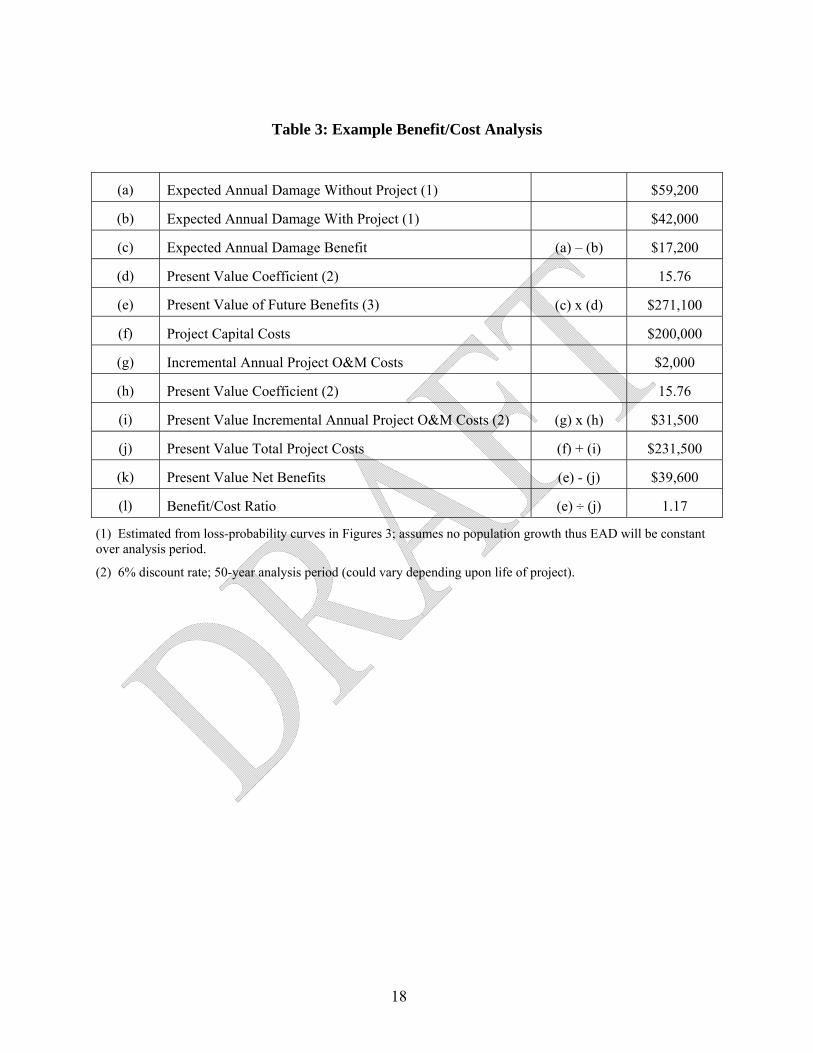
Table 3: Example Benefit/Cost Analysis
(a) Expected Annual Damage Without Project (1) $59,200
(b) Expected Annual Damage With Project (1) $42,000
(c) Expected Annual Damage Benefit (a) – (b) $17,200
(d) Present Value Coefficient (2) 15.76
(e) Present Value of Future Benefits (3) (c) x (d) $271,100
(f) Project Capital Costs $200,000
(g) Incremental Annual Project O&M Costs $2,000
(h) Present Value Coefficient (2) 15.76
(i) Present Value Incremental Annual Project O&M Costs (2) (g) x (h) $31,500
(j) Present Value Total Project Costs (f) + (i) $231,500
(k) Present Value Net Benefits (e) - (j) $39,600
(l) Benefit/Cost Ratio (e) ÷ (j) 1.17
(1) Estimated from loss-probability curves in Figures 3; assumes no population growth thus EAD will be constant over analysis period.
(2) 6% discount rate; 50-year analysis period (could vary depending upon life of project).
18
Chapter 3: Federal Planning Accounts
Federal Principles and Guidelines Given the complexity caused by the different perspectives that can be included in an economic
analysis, an analysis framework, or “road map,” can be very useful. Such a framework is
provided in the US Water Resources Council, Economic and Environmental Principles and
Guidelines for Water and Related Land Resources Implementation Studies, March 10, 1983
(P&G) which promulgates procedures for federal agencies involved in water and related land
resources planning.12 As its name implies, the P&G comprises two parts. The first part of the
P&G sets forth principles “…intended to ensure proper and consistent planning by federal
agencies in the formulation and evaluation of water and related land resources implementation
studies.” The second part of the P&G includes guidelines that “…establish standards and
procedures for use by federal agencies in formulating and evaluating alternative plans for water
and related land resources implementation studies.”
The first section identifies four planning accounts which provide a framework for federal project
evaluations:
• The national economic development (NED) account displays changes in the net value of
the national output of goods and services expressed in monetary units; they are the direct
benefits that accrue in the planning area and the rest of the nation. This account also
includes the federal objective of water and related land resources project planning “… to
contribute to national economic development (NED) consistent with protecting the
nation’s environment, pursuant to national environmental statues, applicable executive
orders, and other federal planning requirements.” Display of the NED account is required
whereas display of the other accounts is discretionary.
12 Federal agencies required to follow the P&G include the US Army Corps of Engineers, Bureau of Reclamation, Tennessee Valley Authority, and Soil Conservation Service (now called the Natural Resource Conservation Service). The P&G (plus related Corps planning guidelines) can be found at: http://www.usace.army.mil/cw/cecw-cp/library/planlib.html. FEMA follows the President’s Office of Management and Budget, Circular A-94: Guidelines and Discount Rates for Benefit-Cost Analysis of Federal Programs, (October 29, 1992) http://www.whitehouse.gov/omb/circulars/index.html. The P&G are currently (2009) under review by the federal Council on Environmental Quality.
.
19
• The environmental quality (EQ) account displays non-monetary effects on ecological,
cultural, and aesthetic resources including the positive and adverse effects of ecosystem
restoration plans.
• The regional economic development (RED) account displays changes in the distribution
of regional direct and indirect economic activity (for example, income, and employment).
• The other social effects (OSE) account displays plan effects on social aspects such as
community impacts, health, and safety, displacement, energy conservation, and other
effects.
Key elements of the second section include more detailed discussions of federal planning
standards (that is, how to implement the P&G process) as well as specific concepts and
procedures for computing NED benefits that are typically expressed in monetary units, for
example, municipal/industrial and agricultural water supply, urban and agricultural flood
damage, power (hydropower), transportation (inland and deep draft navigation), recreation, and
commercial fishing. The second section also discusses EQ evaluation concepts and procedures
(for example, developing indicators that measure changes in the physical characteristics of plant
and animal species but which are not usually assigned monetary values) as well as procedures for
the RED and OSE accounts.
Although the P&G state that the national objective is NED, the USACE has recognized that
water management planning must fully evaluate all four accounts: “Any alternative plan may be
selected and recommended for implementation if it has, on balance, net beneficial effects after
considering all plan effects, beneficial and adverse, in the four Principles and Guidelines
evaluation accounts.”13 This more comprehensive approach was made even more apparent
following the devastation of Hurricane Katrina in 2005 along the Gulf Coast, which not only
resulted in catastrophic damage to physical assets such as buildings and their contents, vehicles,
infrastructure, etc., but also to the social structure and cohesion of entire communities.
Unfortunately, analyzing information in some of these other accounts can be difficult (for
13 USACE Engineering Circular EC 1105-2-409 Planning in a Collaborative Environment, May 31, 2005.
20
example, Other Social Effects), but efforts are underway by the USACE and others to describe
the theoretical bases of these accounts and identify appropriate analytical methods. 14
Table 4 provides an overview of the major types of effects that a flood risk management project
might have and their relationship to the national economic development, regional economic
development and other social effects planning accounts, which are discussed in more detail
below. Information developed for the RED and OSE accounts should be included even if it is
qualitative rather than quantitative.
Flood risk management projects also have significant implications within the environmental
quality account, especially if they include ecosystem restoration objectives.15 One of the key
issues within the EQ account is how to evaluate the benefits of projects that provide ecosystem
restoration benefits. This issue is discussed in more detail below in “Environmental Quality.”
Updated Federal Principles and Guidelines In the Water Resources Development Act of 2007, Congress instructed the Secretary of the
Army to develop a new Principles and Guidelines for the U.S. Army Corps of Engineers. In an
effort to modernize the approach to water resources development, the Obama Administration is
expanding the scope of the Principals and Guidelines to cover all federal agencies that undertake
water resource projects, not just the four agencies (i.e., U.S. Army Corps of Engineers, Bureau of
Reclamation, Natural Resources Conservation Service and the Tennessee Valley Authority)
which are subject to the current Principles and Guidelines. The revised P&G include several
changes focusing upon:
• Achieving Co-Equal Goals
• Considering Monetary and Non-Monetary Benefits
• Avoiding the Unwise Use of Floodplains
14 For example, see C. Mark Dunning and Susan Durden (USACE), “Theoretical Underpinnings of the Other Social Effects Account,” September 2007. 15 The USACE now formulates national ecosystem restoration (NER) or Combined NED/NER plans in addition to the traditional NED plans (flood risk management, water supply, navigation, etc.).
21
22
• Increasing Transparency and “Good Government” Results
In December 2009 the Administration sent the proposed P&G revisions to the National Academy
of Sciences for their review and comment before the P&G are finalized.16
16 For more information on the P&G update, visit the COE website at: http://www.whitehouse.gov/administration/eop/ceq/initiatives/PandG
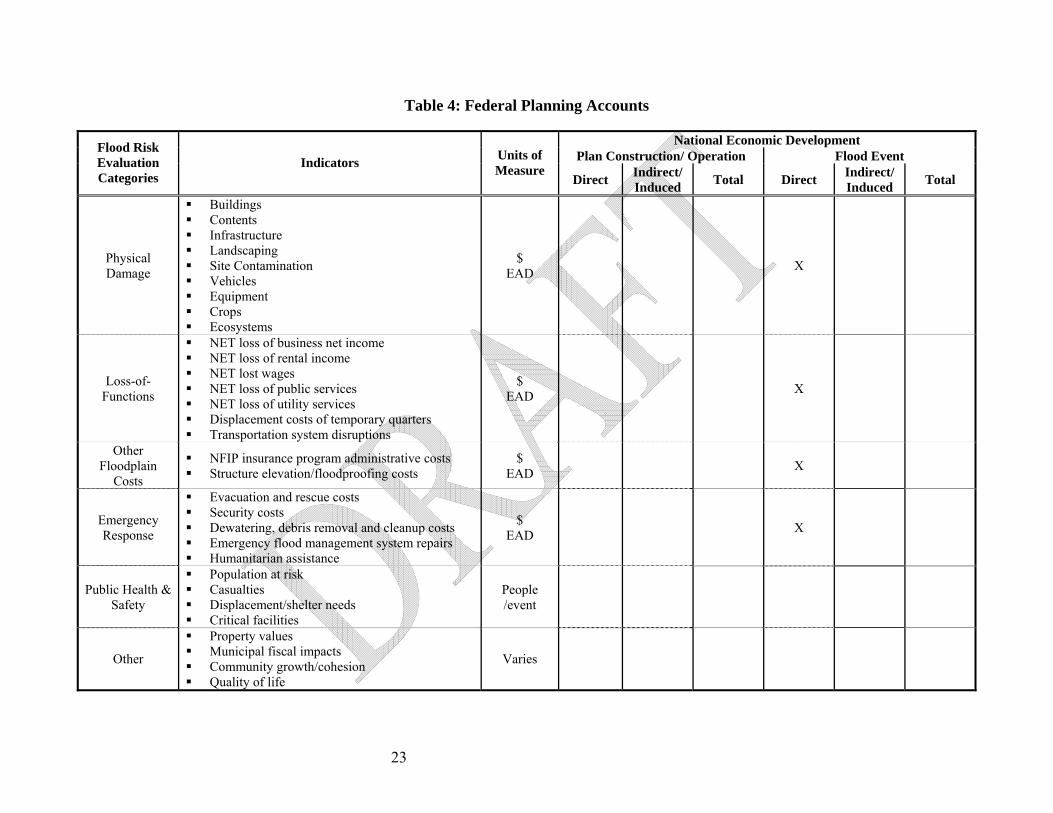
Table 4: Federal Planning Accounts
National Economic Development Plan Construction/ Operation Flood Event Flood Risk
Evaluation Categories
Indicators Units of Measure
Direct Indirect/ Induced Total Direct Indirect/
Induced Total
Physical Damage
Buildings Contents Infrastructure Landscaping Site Contamination Vehicles Equipment Crops Ecosystems
$ EAD X
Loss-of-Functions
NET loss of business net income NET loss of rental income NET lost wages NET loss of public services NET loss of utility services Displacement costs of temporary quarters Transportation system disruptions
$ EAD X
Other Floodplain
Costs
NFIP insurance program administrative costs Structure elevation/floodproofing costs
$ EAD X
Emergency Response
Evacuation and rescue costs Security costs Dewatering, debris removal and cleanup costs Emergency flood management system repairs Humanitarian assistance
$ EAD X
Public Health & Safety
Population at risk Casualties Displacement/shelter needs Critical facilities
People /event
Other
Property values Municipal fiscal impacts Community growth/cohesion Quality of life
V aries
23
Table 4: Federal Planning Accounts (Continued)
Regional Economic Development Plan Construction/ Operation Flood Event Flood Risk
Evaluation Categories
Indicators Units of Measure
Direct Indirect/ Induced Total Direct Indirect/
Induced Total
Physical Damage
Buildings Contents Infrastructure Landscaping Site Contamination Vehicles Equipment Crops Ecosystems
$ Event X X X
Loss-of-Functions
NET loss of business net income NET loss of rental income NET lost wages NET loss of public services NET loss of utility services Displacement costs of temporary quarters Transportation system disruptions
$/ jobs Event
X X X
Other Floodplain
Costs
NFIP insurance program administrative costs Structure elevation/floodproofing costs
$ Event X X X
Emergency Response
Evacuation and rescue costs Security costs Dewatering, debris removal and cleanup costs Emergency flood management system repairs Humanitarian assistance
$ Event X X X
Public Health & Safety
Population at risk Casualties Displacement/shelter needs Critical facilities
People Event X
Other
Property values Municipal fiscal impacts Community growth/cohesion Quality of life
Varies X X X X X X
24
25
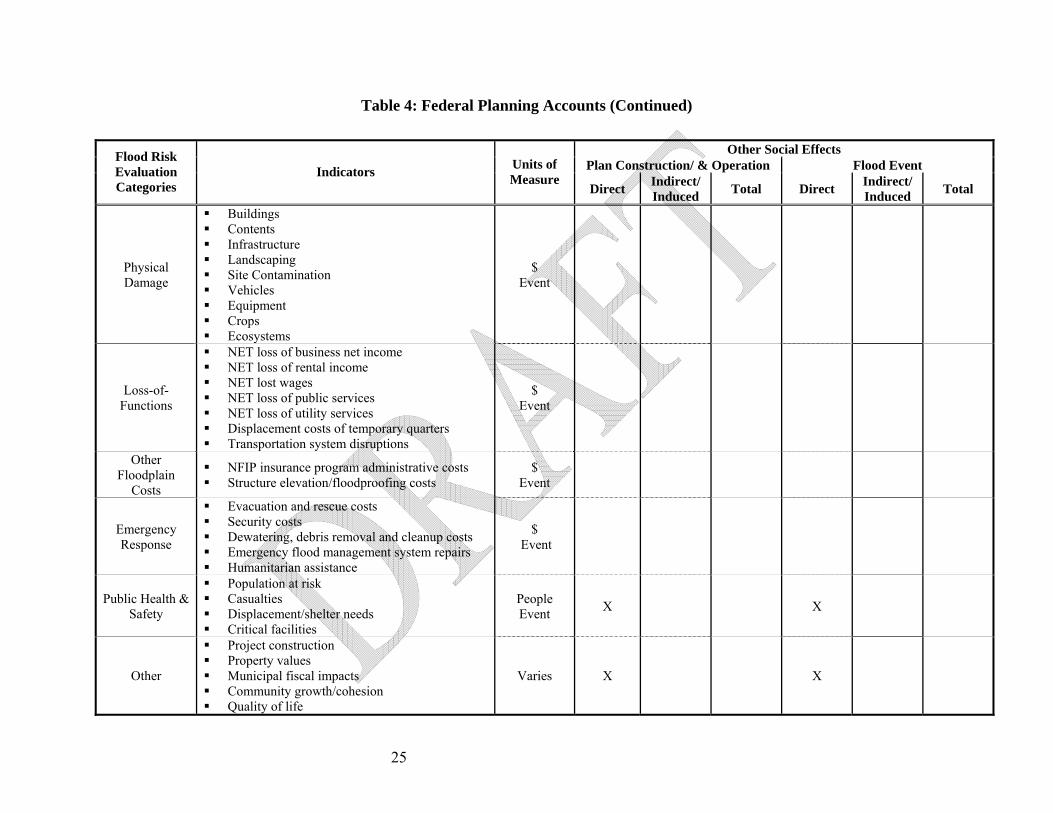
Table 4: Federal Planning Accounts (Continued)
Other Social Effects Plan Construction/ & Operation Flood Event Flood Risk
Evaluation Categories
Indicators Units of Measure
Direct Indirect/ Induced Total Direct Indirect/
Induced Total
Physical Damage
Buildings Contents Infrastructure Landscaping Site Contamination Vehicles Equipment Crops Ecosystems
$ Event
Loss-of-Functions
NET loss of business net income NET loss of rental income NET lost wages NET loss of public services NET loss of utility services Displacement costs of temporary quarters Transportation system disruptions
$ Event
Other Floodplain
Costs
NFIP insurance program administrative costs Structure elevation/floodproofing costs
$ Event
Emergency Response
Evacuation and rescue costs Security costs Dewatering, debris removal and cleanup costs Emergency flood management system repairs Humanitarian assistance
$ Event
Public Health & Safety
Population at risk Casualties Displacement/shelter needs Critical facilities
People Event X X
Other
Project construction Property values Municipal fiscal impacts Community growth/cohesion Quality of life
Varies X X
National Economic Development The national economic development (NED) account displays changes in the net value of the
national output of goods and services expressed in monetary units, or NED benefits. These
benefits are the benefits that accrue in the planning area and the rest of the nation and they
typically include water supply, flood damage reduction, transportation, power, recreation,
commercial fishing, etc, depending upon the project’s objectives. NED benefits (and costs)
provide the basis for conducting net benefit and/or benefit/cost analyses which demonstrate the
economic justification of a project (i.e., maximum net benefits, B/C ratios > 1.00). Economic
justification is an important component of determining a project’s overall feasibility
(engineering, environmental, financial, etc.).
Flood risk management projects can result in several different categories of NED benefits,
including inundation reduction, intensification and location benefits. Inundation reduction
benefits would apply to most flood risk management projects and these focus upon avoided
physical damage, avoided loss-of-function costs, avoided “other” costs of using floodplains, and
avoided emergency response costs as shown in Table 4. Intensification and location benefits
would occur if the flood risk management project results in changes in future land use in the
study area. However, the primary purpose of the NED plan is to protect existing development
and not future development; therefore plans formulated to produce primarily land development
opportunities do not reduce actual flood damage and therefore will not be funded by the USACE 17 or by the State.
NED inundation reduction benefits are usually expressed in monetary terms and on an
annualized basis (expected annual damage). These benefits include (Table 4):
• Avoided physical damage. This category (also known as direct flood damage) is typically
the most straight-forward to estimate. Structures, contents, infrastructure (transportation
systems, utilities, schools, hospitals, etc.), landscaping, vehicles, equipment and crops can
be damaged by flood events. The monetary damage is the cost to repair or value the
damaged property. If direct damage estimates are not available, then depth/damage
curves can be used to estimate damage, at least for structures and their contents. This
17 USACE, Amendment 1 of Appendix E to ER 1105-2-100; USACE National Economic Development Manual.
26
approach first requires estimating a structure’s value. Structures that are potentially
inundated with flood water must be valued using depreciated replacement cost and not
full replacement costs.
• Avoided loss-of-function costs. These costs occur when facilities are damaged thereby
disrupting their normal functions. For example, occupants of residential, commercial or
public buildings may incur displacement costs for temporary quarters when flood damage
makes buildings unsafe for occupation. Other costs include loss of business net income,
loss of rental income, loss of wages, disruption time and deterioration in the overall
“quality of life.”18 In addition, loss-of-function for some types of critical facilities may
have negative impacts on the community as a whole. These types of impacts would
include the loss of public facilities (e.g., schools, hospitals, police/fire stations, nursing
homes), transportation systems (e.g., highways, airports, ports) and utilities (e.g., water,
sewer, electricity).
• Avoided “other” costs of floodplains. Occupants of floodplains incur other costs that
may be reduced or eliminated if a proposed project is implemented. For example, flood
proofing or structure elevation costs may be avoided with a project if it can be
demonstrated that these costs would be incurred without the project. Although a project
may also eliminate the requirement for NFIP flood insurance, the only benefit that can be
claimed is the administrative cost of the program, currently estimated to be about $192
per policy.19
• Avoided emergency management costs. These costs include a wide range of disaster
response and recovery costs that may be incurred by a community during and
immediately following a flood. Examples include avoided emergency operations costs
18 Care must be taken estimating the loss of business net income and lost wages because the lost business net income of the flooded enterprise may be made up by other competitors in the region or even the State. Workers who have lost their jobs can be assumed to be mobile and locate jobs elsewhere, granted with a temporary displacement period. In practical terms, the only time that lost net business net income would be included is if it (a) had a comparative advantage over other firms producing the same products or services, thus other firms could only replace the lost output at a greater cost, or (b) the flooded firm produces unique products and services not produced elsewhere. 19 USACE Planning Guidance Notebook, ER 1105-2-100, April 22, 2000, Appendix E, pg. E-100; dollar values of NFIP administrative costs can be found at http://www.usace.army.mil/cw/cecw-cp/library/egms/egms.html
27
(e.g., personnel and equipment mobilization, materials purchases), evacuation and rescue
costs, debris removal/cleanup, temporary security costs and emergency repairs to flood
management systems (such as levees, floodwalls, etc.).
NED Costs. Project costs generally can be classified as either capital or annual operating costs.
All costs necessary to obtain project benefits over the analysis period must be included in the
cost analysis, including:
• Capital costs. Capital costs are all expenditures necessary to complete the project so
operations can commence. Capital costs (for example, construction, “fixed” or “first”
costs) include expenditures for planning and design, land, structures, materials,
equipment, and labor, as well as allowances for contingencies. Financial costs (such as
interest during construction and long-term debt service interest) are not included as a
capital cost, although they are important in a financial analysis. If most capital costs
occur in one year, then these would be included in the “base year’ for the net benefit
analysis. If capital costs are spread over several years (most likely), then the future value
of these costs must be determined; see Table 3 for an example.
• Operation and maintenance costs. O&M costs include the project’s annual administrative,
maintenance, energy and replacement costs and they are often called “variable costs”
because they vary with different levels of project output. For example, levees require
annual inspection and maintenance activities. These types of costs can vary significantly
over the lives of different flood management projects and thus have important
implications for the project’s sustainability. Identify without- and with-project O&M
costs.
• Externalities. Often the activities of producers or consumers have effects upon others
that impose costs (or sometimes benefits) for which no compensation is received. For
example, a new levee in community A may increase river stages downstream in
community B, which subsequently results in more flood damage in community B. The
economic analysis, which is performed to justify the new levee in community A, should
also take into account the cost increases for community B. Unfortunately, many
externalities are difficult to identify, quantify, and ultimately, assign monetary values.
But qualitative descriptions of these costs must be included at a minimum.
28
• “Opportunity” costs. Opportunity cost is the productivity forgone by not investing in the
next optimal project. The value of the sacrificed productivity is determined by the
monetary value placed on the output of the alternative project. For an economic analysis,
it is often difficult to determine what these opportunity values are, so purchase costs
usually are used as a “proxy.” 20
The USACE has prepared a new NED Flood Damage Reduction Manual that provides an
excellent discussion of the P&G urban flood damage reduction procedures in the context of how
these procedures are generally accomplished today.21 These procedures should be followed for
DWR urban flood risk management programs. Procedures for estimating crop flood damage
reduction benefits can be found in the P&G or in the Corps’ Planning Guidance Notebook.22
Chapter 6 presents example tables that can be used to display the assumptions data and NED
analysis results. Although these tables present a recommended way of presenting this type of
information, they are not required if the information is provided in other formats.
20 An example of a flood-related opportunity cost is if a levee is being reconstructed and the potential exists for a levee setback which could result in ecosystem restoration benefits, but the setback is not considered in the feasibility analyses. The “opportunity” of creating ecosystem benefits is then lost, at least for many years. 21 http://www.iwr.usace.army.mil/ned/
22 http://www.usace.army.mil/cw/cecw-cp/library/planlib.html
29

Regional Economic Development Although the identification and measurement of direct flood risk management benefits and costs
using NED net benefits and/or benefit/cost ratios are the key metrics used to demonstrate the
economic justification of proposed projects, by themselves they do not tell the “complete story.”
Floods can also result in significant regional economic and other social disruptions to a
community, as demonstrated by the devastating effects of Hurricane Katrina upon New Orleans
and the Gulf Coast. In the Gulf Region, many neighborhoods and even entire communities may
never fully recover from that devastating storm. Thus, to the extent these types of
socioeconomic effects can be understood and assessed, the decision-making process can be much
better informed.23 Although quantification of many of these effects can be very complex, it is
recommended that at minimum they be qualitatively assessed.
Floods can have significant regional economic effects (including income and employment)
outside of those directly affected within floodplains; these effects can occur within entire
counties, watersheds, or even the State. Thus, the RED account shows the effects of project
alternatives on the distribution of regional economic activity in the area where the plan will have
significant income and employment effects.24
Regional income effects include the direct
NED effects plus income transfers to and from
the region. Income transfers include project
implementation outlays; transfers of economic
activities from other regions that have been
attracted by improved flood protection;
indirect and induced effects; humanitarian
assistance, NFIP insurance payments and any
State liability payments following a flood
event. The effects of a project upon regional
employment usually parallel those on regional
Direct, Indirect and Induced Economic Effects
Direct effects: changes in output, income and employment of a given industry resulting from changes in final demand. Indirect effects: changes in output, income and employment of a given industry resulting from the iterations of industries purchasing from other industries caused by the direct economic effects. Induced effects: changes in output, income and employment caused by household expenditures generated by direct and indirect economic effects.
23In addition to project feasibility analyses, information developed for the regional economic and social effects analyses can also inform a community’s flood emergency planning programs. 24 This area of “significant” economic effects may be difficult to delineate but a practicable solution may be to define this area on a county basis.
30
income. Typically regional economic analyses are conducted using input-output (I-O) models
which measure the flow of commodities and services among industries, institutions and final
consumers in an economy.
For flood risk management analyses, regional changes in output, income and employment can be
measured for economic effects caused by project construction as well as the effect of a flood
event upon a regional economy. In general, project construction activities would have a
temporary beneficial impact on a regional economy whereas flood events would have an adverse
effect because structural inundation would result in declines in business production over long
periods. Specific types of effects include:
• Construction
o Construction expenditures and labor requirements and
o Effects upon other sectors (recreation, agriculture, etc.)
• Flood events
o Reduction in business net income within flood zone,
o Increase in business net income outside of flood zone as residents and businesses
respond to the flood emergency within their community,
o Changes in agricultural production,
o Emergency services,
o Humanitarian assistance/insurance payments,
o Loss in property values,
o Transportation effects, and
o Fiscal impacts (property and sales tax revenues, public services such as schools,
police and fire protection, etc.) within communities.
There is an overlap between NED and RED benefits, thus the two are not addictive. In addition,
NED benefits are usually estimated for several flood events but then annualized for inclusion in
net benefit or benefit/cost ratio calculations. RED benefits are typically described on a per event
basis.
31

Chapter 6 presents example tables that can be used to display RED analysis results. Although
these tables present a recommended way of presenting this type of information, they are not
required if the information is provided in other formats.
Other Social Effects According to the P&G, the OSE planning account should “display plan effects on social aspects
such as community impacts, health and safety, displacement, energy conservation and others.”
As with the RED analysis, the OSE analysis includes effects caused by project construction as
well as the effects of a flood event upon communities. Construction effects can include both
temporary and permanent effects caused by construction activities and by the potential relocation
of residents and businesses within the project “footprint.” Flood events can also include
temporary and permanent effects, depending upon the community’s ability to recover from the
flood event. Some types of effects that should be analyzed include:
• Construction
o Public health and safety
o Displacement
o Community growth/cohesion
• Flood events
o Public health and safety
o Displacement
o Shelter needs
o Casualties
o Saturation of flood insurance within communities25
o Community growth/cohesion
o Quality of life
In addition to the extent and depth of flooding, other factors that can significantly affect the OSE
analysis include:
25 The ability of a community to recover from a flood event can be enhanced if significant numbers of property owners have purchased flood insurance.
32

• Warning times
• Timeline of flood events (how many acres/structures are inundated after 6, 12, 24, 48,
etc. hours?
• Duration of flooding
• Duration of recovery/rebuilding efforts
Chapter 6 presents example tables that can be used to display the assumption data and RED/
OSE analysis results. Although these tables present a recommended way of presenting this type
of information, they are not required if the information is provided in other formats.
Environmental Quality Water resource management projects and programs are becoming multi-objective, and often one
of those objectives is ecosystem restoration. For most objectives, monetary benefits can be
reasonably estimated (for example, water supply and quality, hydropower, flood damage
reduction, recreation). However, for ecosystem restoration, the economic evaluation is much
more difficult. Should monetary benefits be assigned to ecosystem resources? Ecosystems
perform a multitude of complex and interrelated functions that not only provide basic biological
support but also provide valuable goods and services to society (for example, enhanced water
supply and quality, flood damage reduction, recreation). If these goods and services can be
identified and measured, then it may be possible to place monetary values on them using market
or non-market valuation methods26. However, if these ecosystem goods and services are
monetized, the resulting values should not be interpreted as the total value of the ecosystem but
rather of the particular services it provides for society.
Ecosystem evaluation methods are discussed in the DWR Economic Analysis Guidebook,
Chapter 4. Two flood management example analyses are presented in the Appendix B that
illustrate different ways of evaluating ecosystem benefits in an economic analysis.27 The
Hamilton City Flood Damage Reduction and Ecosystem Restoration feasibility study follows
USACE planning guidance by utilizing cost-effectiveness/ incremental cost analysis to evaluate 26 Identifying ecosystem goods and services requires the measurement and quantification of ecosystem outputs, which is, by itself, a major challenge in which there is not unanimity of opinion among environmental scientists on how to accomplish. 27 Websiste: http://www.economics.water.ca.gov/guidance.cfm.
33
ecosystem benefits—basically, determining which ecosystem alternative gives the “most bang
for the buck” and combining this information (through a trade-off analysis) with flood damage
reduction benefits of the proposed project. This method requires a cost allocation of the project
costs between flood damage reduction and ecosystem restoration (or other project purposes),
often using the separable cost-remaining benefits (SCRB) method. After the cost allocation,
project costs allocated to flood damage reduction can be compared to flood damage reduction
benefits, ecosystem restoration costs can be compared to ecosystem restoration benefits (or
physical outputs), etc. In contrast, the Colusa Basin Drainage District Integrated Watershed
Management Study places monetary values on ecosystem benefits, which are then directly
incorporated into a benefit-cost analysis along with flood damage reduction benefits. However,
this type of analysis would not be acceptable to the USACE.
34

Chapter 4: Other Planning Considerations
Intensity of Analysis To perform economic analyses of flood risk management projects, the following types of data
are required:
• Hydrologic: analysis of the frequency, location and amount of runoff throughout a study
area,
• Hydraulics: analysis of stream water surface profiles, flood inundation boundaries, and
other stream flow characteristics (for example, stage-frequency),
• Geotechnical: analysis of levee failure including development of levee fragility curves
based upon different levee failure causes,
• Economics: identification of population, structural and other physical assets at risk,
development of stage-damage functions and estimation of expected annual damage and
project performance statistics.
The quality of the economic analysis (data, methods and models) needs to be commensurate with
the cost of the project and with the proximity of the benefit-cost ratio to 1.0. In other words, if a
multi-million dollar project is being proposed and the benefit-cost ratio is close to 1.0, then the
“best available” data, methods and models must be used. For agencies also seeking USACE
funding and/or levee certification, it is strongly recommended that “risk analysis” be conducted.
Risk Analysis The USACE requires that “risk analysis” be conducted for all of its flood damage reduction
studies (ER 1105-2-101). “Risk analysis” is an evaluation and decision making approach that
explicitly, and to the extent practical, analytically incorporates considerations of risk and
uncertainty in a flood damage study. The goal of “risk analysis” is a comprehensive approach in
which the values of all key variables, parameters, and components of flood damage reduction
studies are subject to probabilistic analysis (hydrology, hydraulics, geotechnical and economics).
35
The USACE software HEC-FDA (Flood Damage Assessment) incorporates risk-based analysis
by quantifying uncertainties in the hydraulics, geotechnical, and economics data using Monte
Carlo simulation. The two primary outputs from HEC-FDA include expected annual damage
estimates and project performance statistics. Expected annual flood damage is the average of all
possible damage values, taking into account all expected flood events and associated hydrologic,
hydraulic, geotechnical, and economic uncertainties. Project performance statistics describe the
hydraulic performance of a plan incorporating geotechnical levee failure assumptions. These
include expected annual exceedance probability (the annual probability of having a damaging
flood event in a given year, such as a levee failure), long-term risk (the chance of having one or
more damaging events over a period of time, similar to the question: what’s the chance my house
could be flooded during my 30 year mortgage?), and conditional non-exceedance probability
(the probability of containing specific flood events and avoiding damage). Figure 3 illustrates
the conceptual components of a HEC-FDA risk-analysis. HEC-FDA is available at:
http://www.hec.usace.army.mil/software/hec-fda/hecfda-hecfda.html
For agencies seeking USACE funding and/or levee certification, it is strongly recommended that
“risk analyses” be conducted. USACE guidance on “risk analysis” can be found in:
• EM 1110-2-1619, Risk-Based Analysis for Flood Damage Reduction Studies, August,
1996 and
• ER 1105-2-101, Risk Analysis for Flood Damage Reduction Studies, January 2006.
36

37
Figure 3: Conceptual USACE Risk and Uncertainty Approach for Estimating Flood Damage
1. Hydrology1. Hydrology1. Hydrology2. Hydraulics2. Hydraulics2. Hydraulics
4. EconomicsSource: Adapted from Moser (1997)
Stage (H, floodplain)
Dam
age
(D)
Disc
harg
e (Q
)
Stage (H, channel)
Disc
harg
e (Q
)
Exceedance Probability (p)
Typical Levee Probability of Failure
Stag
e, H
, cha
nnel
3. Geotechnical
Exceedance Probability (p)
Dam
age
(D)
EAD =
∫D(p)dp
4. EconomicsSource: Adapted from Moser (1997)
Stage (H, floodplain)
Dam
age
(D)
Stage (H, floodplain)
Dam
age
(D)
Disc
harg
e (Q
)
Stage (H, channel)
Disc
harg
e (Q
)
Stage (H, channel)
Disc
harg
e (Q
)
Exceedance Probability (p)
Disc
harg
e (Q
)
Exceedance Probability (p)
3. Geotechnical3. Geotechnical
Typical Levee Probability of Failure
Stag
e, H
, cha
nnel
Typical Levee Probability of Failure
Stag
e, H
, cha
nnel
Exceedance Probability (p)
Dam
age
(D)
EAD =
∫D(p)dp
Exceedance Probability (p)
Dam
age
(D)
EAD =
∫D(p)dp
Levels of Protection Flood risk management projects are often characterized as having a certain “level of protection”
(for example, 100- or 200- year). Often these labels are misleading because of (a) the inherent
uncertainties in their estimation, (b) the wrong connotations they sometimes give to the public
(i.e., a 100-year flood will only occur once every 100 years), and (c) they ignore residual risk.
However, despite these limitations, it is still necessary to report levels of protection (without- and
with-project) using consistent methods.
The two primary methods of measuring levels of protection include:
• Deterministic method: this method relies on defining a potential water surface elevation
for a specific frequency flow event and then applying a specific freeboard on top of this
water surface elevation to account for uncertainty. Often the freeboard is three feet, but it
can be higher depending on local conditions. The water surface elevation would be
determined by traditional hydrologic, hydraulic and related methods. No uncertainty in
these parameters would be considered.
• Probabilistic method: directly incorporates “risk-based” analysis, usually using the HEC-
FDA model and the project performance statistics; uncertainty in each of the major
physical parameters is considered. The USACE uses the conditional non-exceedence
statistic to certify to FEMA that levees and other flood structures meet the 100-year
standard (i.e., it must be shown that there is at least a 90% confidence of passing the 100-
year event).28
Figure 4 illustrates the differences between these approaches for a levee project being designed
to provide 100-year level of protection (note: the probabilistic method may result in a levee
height that is greater, lesser or equal to that determined by the deterministic method).
28 For more information on levee certification issues, see the DWR Quick Guide at http://www.fpm.water.ca.gov/docs/CAQG-screen.pdf
38
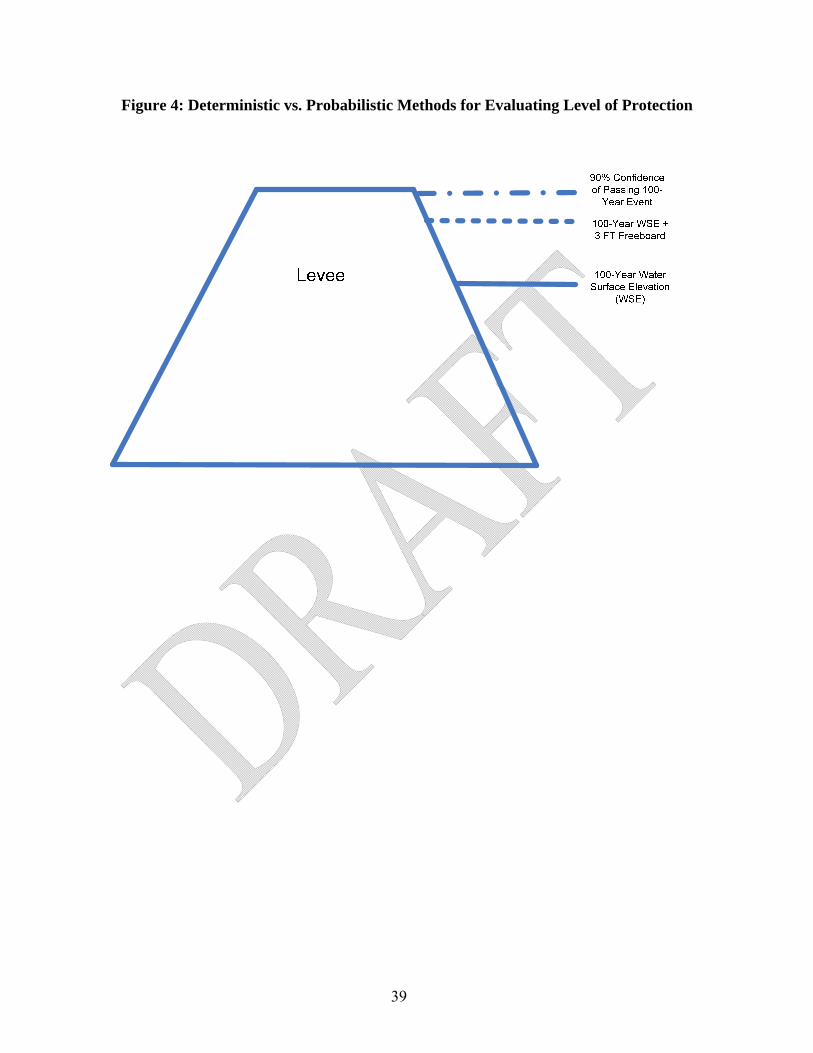
39
Figure 4: Deterministic vs. Probabilistic Methods for Evaluating Level of Protection

Residual Risk Residual risk is the flood risk that remains if a proposed flood risk reduction project is
implemented. Residual risk includes the consequences of capacity exceedence or project failure
prior to capacity exceedence. Often residual risk can be catastrophic. Thus, even though an
expected annual damage assessment may indicate positive net benefits, applicants must evaluate
residual risk which can assist their flood emergency planning.
There are a couple of different ways to evaluate residual risk. The first is through the expected
annual damage computation. For example, if the without-project EAD is $500,000 and the with-
project EAD is $300,000, then the project has reduced EAD by $200,000 (i.e., project benefits)
but $300,000 in EAD remains with project. This is a measure of residual risk and it takes into
account both the probabilities and consequences of flooding without- and with-project, but
unfortunately it tends to mask the potentially catastrophic effects if project failure or exceedence
occurs because it is annualized.29 Knowledge of these potentially catastrophic effects is critical
for flood emergency planning purposes (what will be the extent of such a flood event, how deep,
how fast it will spread, how many people affected, for how long, etc.).
Another way to evaluate residual risk is to focus upon floodplains of specific events, especially
the largest floodplain expected to be “protected” by the project because the community may have
a fall sense of security with the project in place. In reality, residents within this protected
floodplain are still at risk, albeit with a smaller probability of flooding. Thus, for the largest
floodplain protected by the project, information should be developed describing the
socioeconomic activities at risk (much of this information is developed in the RED and OSE
accounts), including:
• Magnitude of flooding (extent, depth, velocity, evacuation times, and speed and duration
of flooding),
• Population at risk (including high-risk groups such as low income, handicapped, elderly,
etc.),
29 As discussed above, risk is defined as Probabilities X Consequences where probability includes the frequency of the flood event and structure failure, and consequences are the effects of the flood water upon the human and natural environments.
40
• Community infrastructure at risk (such as hospitals, emergency response facilities,
schools, utilities, transportation facilities, military facilities, etc.) and
• Major employment centers at risk.
Focusing upon the assets at risk within a specific floodplain ignores the probabilities of flooding,
but these can be incorporated into the analysis. For example, if the largest floodplain to be
protected by a project is the 200-year floodplain, then the annual probability of flooding for this
floodplain is 0.005. If a project is constructed, then the residents in this floodplain are still at
risk, but with a reduced annual probability of flooding (for example, 0.003).
Partial Projects A major problem in analyzing flood damage reduction benefits occurs when a community is
surrounded by a levee system comprised of multiple levee segments. Although intuitively it
would seem that repairing one segment should result in at least some incremental benefit to a
community, it is difficult to quantitatively estimate this incremental benefit taking into account
remaining deficiencies in the levee system.
A procedure is available to estimate the incremental benefits of repairing individual segments of
a levee system using the Corps’ HEC-FDA model. This procedure estimates the annual
exceedence probability (AEP) and expected annual damage (EAD) for each levee segment for
the without-project condition and then estimates a weighted EAD using AEP as the weighting
factor. These steps are repeated again for the with-project condition, taking into account changes
in the levee failure assumptions attributable to the proposed levee segment improvements. The
difference between the weighted EAD for the without-project condition compared to the with-
project condition is the benefit of the levee segment improvements. However, this procedure
will only work if the levee segments are independent of each other; i.e., they have discrete
hydraulic and/or levee failure characteristics. If not, this procedure will not be applicable.
Thus, this procedure typically works best if:
a. The communities are protected on two or more sides by levees on different streams,
b. These streams have different hydraulic characteristics (i.e., water surface profiles),
c. Each stream has differing hydraulic characteristics “upstream” vs. “downstream,” and/or
41

d. The levee segments have different physical characteristics due to construction and/or
maintenance practices.
If a community is only protected on one side by a levee system but is proposing multiple levee
“fixes,” this procedure should still be applicable if for each fix if (c) and/or (d) are present.
David Ford Consulting Engineers, Inc. applied this DWR-approved methodology to estimate the
incremental benefits of alternative levee segment improvement plans for the Plumas Lakes area
which is subject to flooding from multiple water sources, including the Yuba River to the north,
Feather River to the west, Bear River to the south and the Western Pacific Interceptor Canal to
the east.30 Appendix I includes an excerpt from David Ford’s report describing how this
procedure was applied for the Plumas Lakes area.
30 David Ford Consulting Engineers, Inc., Report on Alternatives Analysis—Phase IV: Feather River Levee Repair Project (Appendix VI), Three Rivers Levee Improvement Authority, December 2006.
42
Future Growth A critical task within an economic analysis is defining without project conditions, and over a 50-
year analysis period, these conditions are likely to include population growth, especially in the
rapidly urbanizing areas of the Central Valley. However, DWR requires that an economic
analysis must first demonstrate that the net benefits of a proposed flood risk management project
are positive with existing development before including population growth. If planned
population growth is included in the without project condition, it must be assumed that the
community has or will adopt floodplain regulations pursuant to the National Flood Insurance
Program that prohibit development in the 100-year floodplain unless its elevated or flood
proofed (for commercial structures).
If future growth would not occur without the project but would occur with the project, then the
project is inducing growth. Benefits associated with land use changes can be measured and are
called “location” benefits. However, DWR will not fund flood risk management projects
providing primarily future land development opportunities, therefore “location” benefits will be
excluded.
Projects with Multiple Funding Sources The economic analysis must include the total costs of the project, regardless of funding sources.
All project costs--capital and operations and maintenance (O&M)--must be included even if
State or other funding is available.
Use of Prior Analyses The use of prior analyses (reconnaissance or feasibility studies, benefit/cost analyses, etc.) is
permitted as long as that analysis and supporting data are not older than five years, unless
approved by the DWR Economic Analysis Section. Benefit and cost data must be updated to the
current year using appropriate cost indices.
43
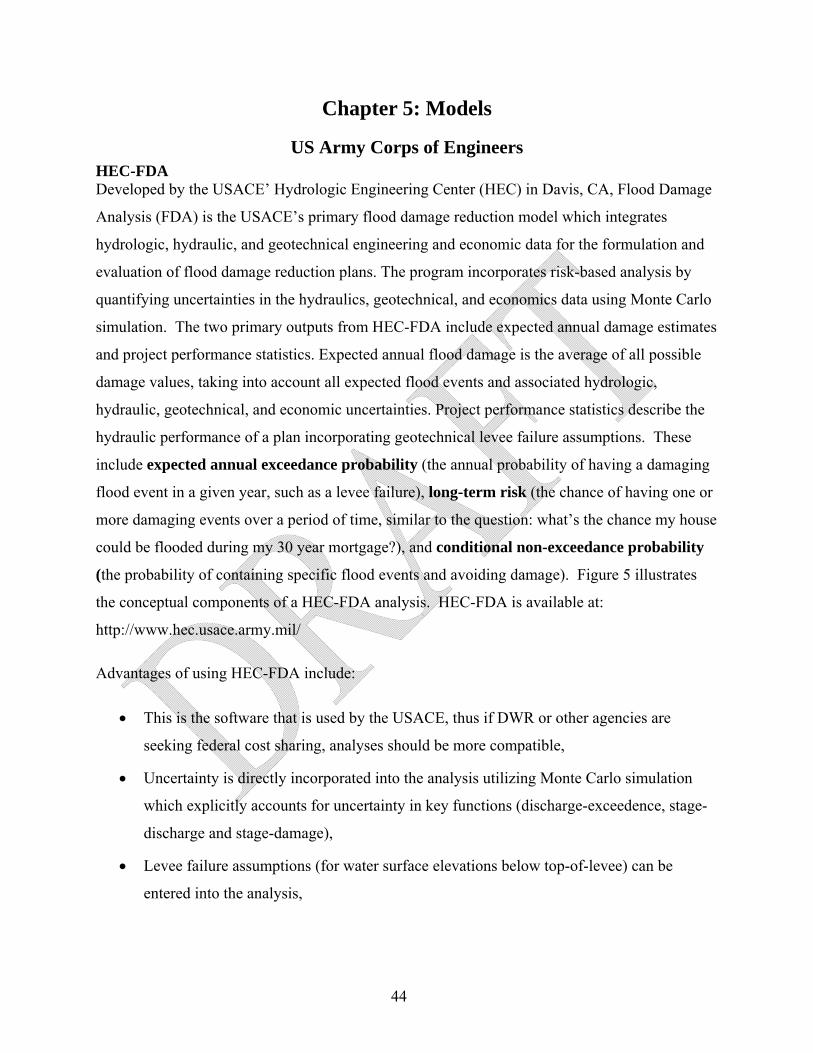
Chapter 5: Models
US Army Corps of Engineers HEC-FDA Developed by the USACE’ Hydrologic Engineering Center (HEC) in Davis, CA, Flood Damage
Analysis (FDA) is the USACE’s primary flood damage reduction model which integrates
hydrologic, hydraulic, and geotechnical engineering and economic data for the formulation and
evaluation of flood damage reduction plans. The program incorporates risk-based analysis by
quantifying uncertainties in the hydraulics, geotechnical, and economics data using Monte Carlo
simulation. The two primary outputs from HEC-FDA include expected annual damage estimates
and project performance statistics. Expected annual flood damage is the average of all possible
damage values, taking into account all expected flood events and associated hydrologic,
hydraulic, geotechnical, and economic uncertainties. Project performance statistics describe the
hydraulic performance of a plan incorporating geotechnical levee failure assumptions. These
include expected annual exceedance probability (the annual probability of having a damaging
flood event in a given year, such as a levee failure), long-term risk (the chance of having one or
more damaging events over a period of time, similar to the question: what’s the chance my house
could be flooded during my 30 year mortgage?), and conditional non-exceedance probability
(the probability of containing specific flood events and avoiding damage). Figure 5 illustrates
the conceptual components of a HEC-FDA analysis. HEC-FDA is available at:
http://www.hec.usace.army.mil/
Advantages of using HEC-FDA include:
• This is the software that is used by the USACE, thus if DWR or other agencies are
seeking federal cost sharing, analyses should be more compatible,
• Uncertainty is directly incorporated into the analysis utilizing Monte Carlo simulation
which explicitly accounts for uncertainty in key functions (discharge-exceedence, stage-
discharge and stage-damage),
• Levee failure assumptions (for water surface elevations below top-of-levee) can be
entered into the analysis,
44
• It can estimate most direct flood damage losses (for example, single-family residential,
multi-family residential, commercial, industrial, etc.),
• Although designed for urban flood damage analyses, can be adapted for agricultural
analyses,
• Structural inventories can be directly input into the software and it will develop the stage-
damage functions, or stage-damage functions can be developed outside of the software
and then directly input into it,
• Project performance statistics (annual exceedence probability, long-term risk and
conditional non-exceedence) are output which can be used for determining “levels of
protection” and levee certification purposes, and it’s
• Very useful for plan formulation purposes.
Disadvantages of using HEC-FDA include:
• Typically can not be run “off the shelf” without training,
• Extremely data intensive; requires hydrologic, hydraulics, geotechnical (if levees are
present), and economics data,
• Not GIS-based, but GIS can be used to develop data inputs (such as structural
inventories),
• Not applicable for coastal analyses, and
• It does not estimate indirect or regional impacts (income, employment, etc.).
HEC-FIA HEC is developing Flood Impact Analysis (HEC-FIA) to estimate flood event direct urban and
agricultural damage and loss of life. Although EAD estimates will not be developed by HEC-
FIA, event damage estimates can be input into HEC-FDA and other models to do the integration
analyses required for the EAD estimates.
45

Federal Emergency Management Agency HAZUS-MH (Multi Hazard) FEMA has developed this GIS-based US multi-hazard assessment software which contains a
Flood Loss Estimation Model that includes flood hazard analysis and flood loss estimation
modules for riverine and coastal analyses.31 The flood hazard analysis module uses
characteristics such as frequency, discharge, and ground elevation to estimate flood depth, flood
elevation, and flow velocity. The loss estimation module estimates direct and indirect economic
losses using the results of the flood hazard analysis and structural inventories. These losses
include structural and contents damage and loss of functions to general building stock
(residential, commercial, industrial, etc.), essential facilities (emergency centers, medical care
centers, schools, etc.), transportation systems (highways, rails, airports, bus, etc.), utilities
(potable water, waste water, electrical, communications, etc.), and agricultural products. Impacts
to population, especially groups of special concern (low income, ethnicity, age groups over 65,
etc.), and shelter requirements are also estimated. In addition to the Flood Loss Module,
HAZUS-MH also contains earthquake and hurricane wind assessment models. HAZUS-MH
analyses can be conducted at different levels of rigor. A Level 1 analysis utilizes default
hydrologic, hydraulics and economic inventory information; Level 2 and 3 analyses incorporate
user-input local data to improve accuracy of analyses. HAZUS information is available at
http://www.fema.gov/plan/prevent/hazus/index.shtm
Advantages of using HAZUS-MH include:
• It is GIS-based, which greatly facilitates analyses and displaying results,
• It can be adapted to different analysis “levels” depending upon user-input data; default
values are available for “reconnaissance” studies,
• The availability of default values allows for analyses which otherwise could not be
conducted because of the lack of local data,
• It can be used for riverine and coastal flood analyses,
31 HAZUS-MH Version MR4 is currently available.
46
• It can estimate direct flood damage losses as well as indirect regional impacts (income,
employment, casualties, etc.) and
• It is often used by communities in preparing their FEMA-required local hazard mitigation
plans.
• Disadvantages of using HAZUS-MH include:
• Because it is GIS-based, HAZUS-MH requires ArcGIS software and expertise,
• It does not directly incorporate uncertainty, although this can be alleviated by sensitivity
analyses,
• It does not provide a rigorous analyses of levees, although a levee can be “drawn” into
the study area and a “level of protection” assigned to it,32 and
• Project performance statistics are not estimated.
Figure 5 presents a schematic overview of HAZUS.
32 The next version of HAZUS (fall 2008) may incorporate levee failure analysis.
47
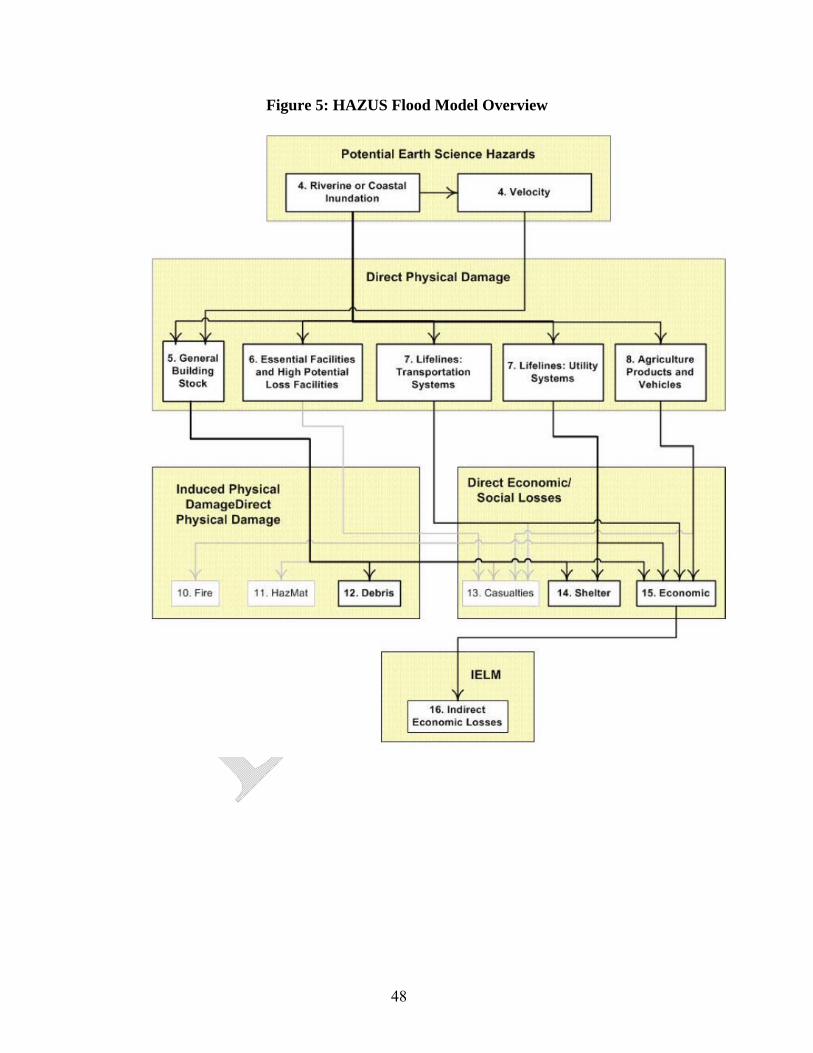
48
Figure 5: HAZUS Flood Model Overview
Mitigation BCA Toolkit
FEMA has developed new BCA Software (version 4.5.5; August 2009) to perform benefit-cost
analyses for floods, hurricane winds, earthquakes, tornados, wild fires, and a “generic” damage
frequency assessment. FEMA developed the BCA software for specific use by local and state
agencies applying for funding in several mitigation grant programs. The software is menu-
driven and leads the user through several screens in which data pertinent to the costs and benefits
(depending upon the hazard being studied) are entered. Default data is provided for many
variables (for example, the contents percentage of structures) although local data can be input
into the model. The software then computes net benefits and the B/C ratio. The software comes
with extensive on-line resources, including a Recourse Kit and training, and is available at
http://www.bchelpline.com/
Advantages of using the BCA Software include:
• It can be used for riverine and coastal flood analyses,
• It can estimate direct flood damage losses (including physical damage, loss of functions,
and emergency management costs),
• It is used by communities in preparing their FEMA-required local hazard mitigation plans
so locally prepared models may already be available,
• It is menu-driven and therefore relatively easy to use,
• Separate modules store project and structural inventory data so multiple projects with
different data sets (for example, structural inventories) can be analyzed, and
• It estimates costs and benefits.
Disadvantages of using BCA Software include:
• It does not directly incorporate uncertainty, although this can be alleviated by sensitivity
analyses,
• It does not allow for rigorous analyses of levees, although a levee can be included and a
“level of protection” assigned to it,
• Regional impacts (income, employment, casualties, etc.) are not estimated,
49
• Project performance statistics are not estimated, and
• The discount factor is fixed at 7% which FEMA uses and it can not be changed.
California Department of Water Resources Flood Rapid Assessment Methodology (FloodRAM) Consultants to DWR have developed a spreadsheet model to estimate flood damage. This model
develops loss-probability curves for without- and with-project conditions (see Figure 3) based
upon hydrologic and hydraulics data, probability of levee failure data, structural and crop
inventories, depth-damage curves, etc. Damage categories include residential, commercial and
industrial properties, crops and roads, but other categories can be added. An adjustment (for
example, 25%) is added to damage estimates to account for indirect damage not specifically
included in the model. The model is flexible in that many of the analysis assumptions and
parameters can be changed (for example, structural foundation heights, unit replacement values,
and depreciation factors; depth-damage curves; discount rates; analysis period; other indirect
damage “adjustment factor”; etc.). Like all other models, the quality of the Flood RAM analyses
is directly dependent upon the quality of the input data (for example, floodplain extents and
depths, structural inventories, etc.). FloodRAM is available from DWR economics staff.
Advantages of using Flood RAM include:
• It can provide relatively quick estimates of EAD depending upon the availability of input
data,
• It can be adapted to different analysis “levels” depending upon the quality of the input data,
• It incorporates probability of levee failure,
• It can be used for riverine analyses but could be applicable to coastal analyses, and
• Users can easily see data inputs and calculations (i.e., it is “transparent”).
Disadvantages of using FloodRAM include:
• It does not directly incorporate uncertainty, although this can be alleviated by sensitivity
analyses,
• It does not estimate regional impacts (income, employment, casualties, etc.), and
50

• Project performance statistics are not estimated (although FloodRAM inputs and model
outputs can be input into HEC-FDA to obtain project performance statistics).
Table 5 compares key characteristics of the flood risk management models.
Table 5: Characteristics of Flood Risk Management Models
Models
Characteristics HEC-FDA HEC-FIA
HAZUS
MH
BCA
Toolkit FloodRAM
Sponsoring Agency USACE USACE FEMA FEMA DWR Model Outputs Event Damage YES YES YES YES YES Expected Annual Damage YES NO YES YES YES Project Performance Stats YES NO NO NO NO Casualties NO YES NO (4) NO NO Type of Damage Direct (1) YES YES YES YES YES Indirect (2) NO NO YES NO NO
Levee Failure Analysis Fragility Curves
Fragility Curves
Assumed LOP (3)
Assumed LOP (3)
Assumed Failure
Probability Uncertainty YES NO NO NO NO
(1) Includes physical damage, loss of functions, other costs of floodplain, and emergency
management costs. (2) Regional income and employment effects. (3) Level of protection (e.g., “100-year”)
(4) HAZUS does estimate casualties in the earthquake and hurricane wind modules.
51
Chapter 6: Information Displays
The following example tables (labeled EX--__) illustrate the types of information that should be
presented in a flood risk management economic analysis, although other formats may be used
provided similar information is displayed. Information in these tables should be shown for
existing, base year conditions (if different than existing conditions) and for projected conditions
if included in the analysis. Most of these tables require information for flood events.
Recommended analysis events include the 25-, 50-, 100-, 200-, and 500-year events, but other
events may be used depending upon study circumstances.
Historical Flood Events and Effects Provide qualitative/quantitative descriptions of historical flood events, including:
• Sources of flooding,
• Estimated event frequency,
• Extent, depth and durations of inundated areas,
• Performance of existing flood management facilities,
• Estimated flood damage, including physical damage to structures and contents, vehicles,
etc.; loss of functions; and emergency management costs;
• Impacts upon population (especially at risk groups such as low income, handicapped and
the elderly),
• Impacts upon regional employment and income, and
• Estimated casualties (numbers of deaths, injuries and illnesses.
Table EX-1 can be used to display historical flood damage, which should be expressed in current
year (2007) dollar values using the Gross Domestic Product Implicit Price Deflator.
52
Table EX-1: Historical Flood Damage
Event Year
Estimated Event
Frequency
Flood Depths
Flood Duration
Flood Damage
(1)
(1) Flood damage includes physical damage (structures and contents, vehicles, etc), loss of functions, and emergency management costs.
National Economic Development The following tables illustrate the types of data that generally are required to perform flood risk
management NED analyses.
Floodplains Include figures showing without- project floodplains for each of the events included in the EAD
analysis. If available, with-project floodplains should also be displayed. As an example, Figure
EX-1 shows floodplains developed for the Hamilton City Flood Damage Reduction and
Ecosystem Restoration Project.
53
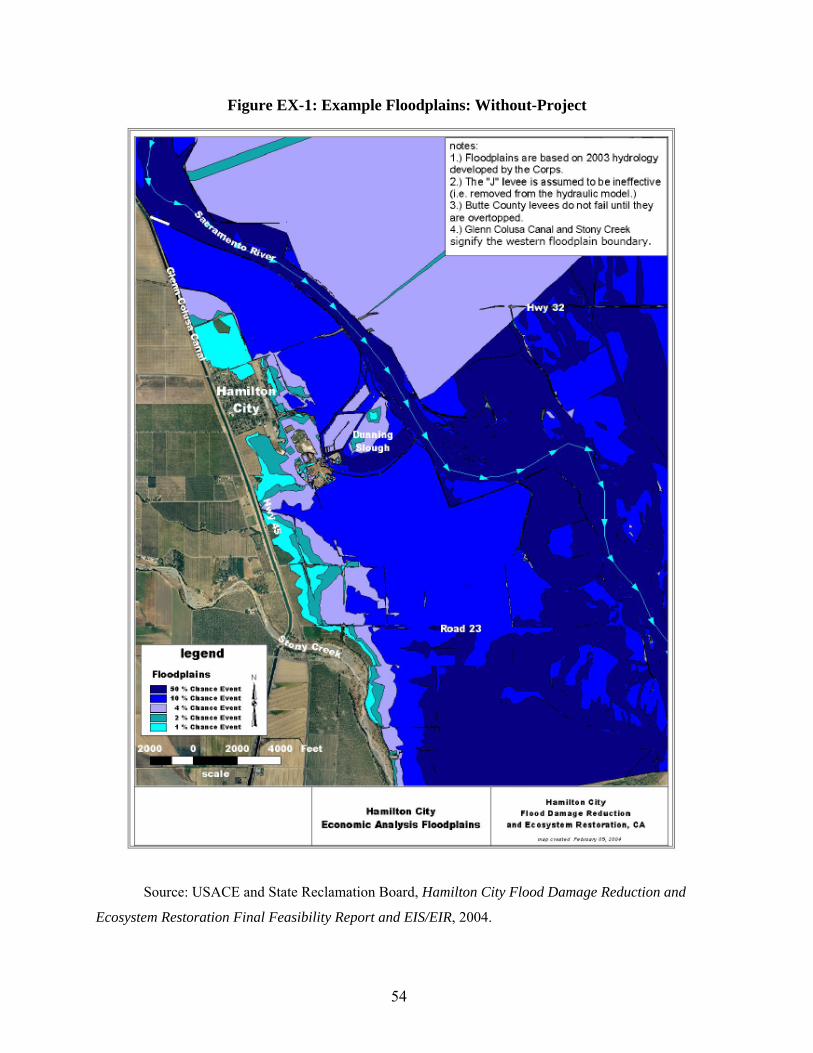
54
Figure EX-1: Example Floodplains: Without-Project
Source: USACE and State Reclamation Board, Hamilton City Flood Damage Reduction and
Ecosystem Restoration Final Feasibility Report and EIS/EIR, 2004.
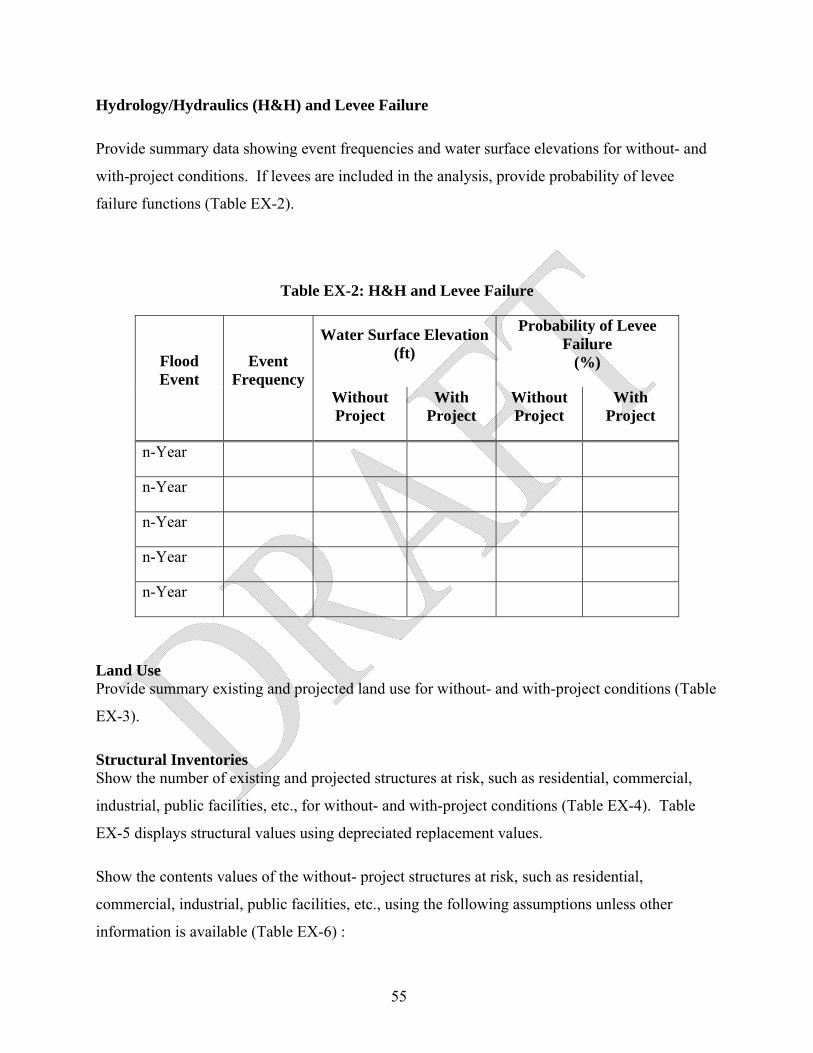
Hydrology/Hydraulics (H&H) and Levee Failure
Provide summary data showing event frequencies and water surface elevations for without- and
with-project conditions. If levees are included in the analysis, provide probability of levee
failure functions (Table EX-2).
Table EX-2: H&H and Levee Failure
Water Surface Elevation (ft)
Probability of Levee Failure
(%) Flood Event
Event Frequency
Without Project
With Project
Without Project
With Project
n-Year
n-Year
n-Year
n-Year
n-Year
Land Use Provide summary existing and projected land use for without- and with-project conditions (Table
EX-3).
Structural Inventories Show the number of existing and projected structures at risk, such as residential, commercial,
industrial, public facilities, etc., for without- and with-project conditions (Table EX-4). Table
EX-5 displays structural values using depreciated replacement values.
Show the contents values of the without- project structures at risk, such as residential,
commercial, industrial, public facilities, etc., using the following assumptions unless other
information is available (Table EX-6) :
55
56
• Residential: 50% of structural value
• Commercial: 100% of structural value
• Industrial: 150% of structural value
• Public: 100% of structural value
• Other: 50% of structural value
Population. Estimate the population at risk for exisiting and projected conditions, without- and
with-project (Table EX:-7)
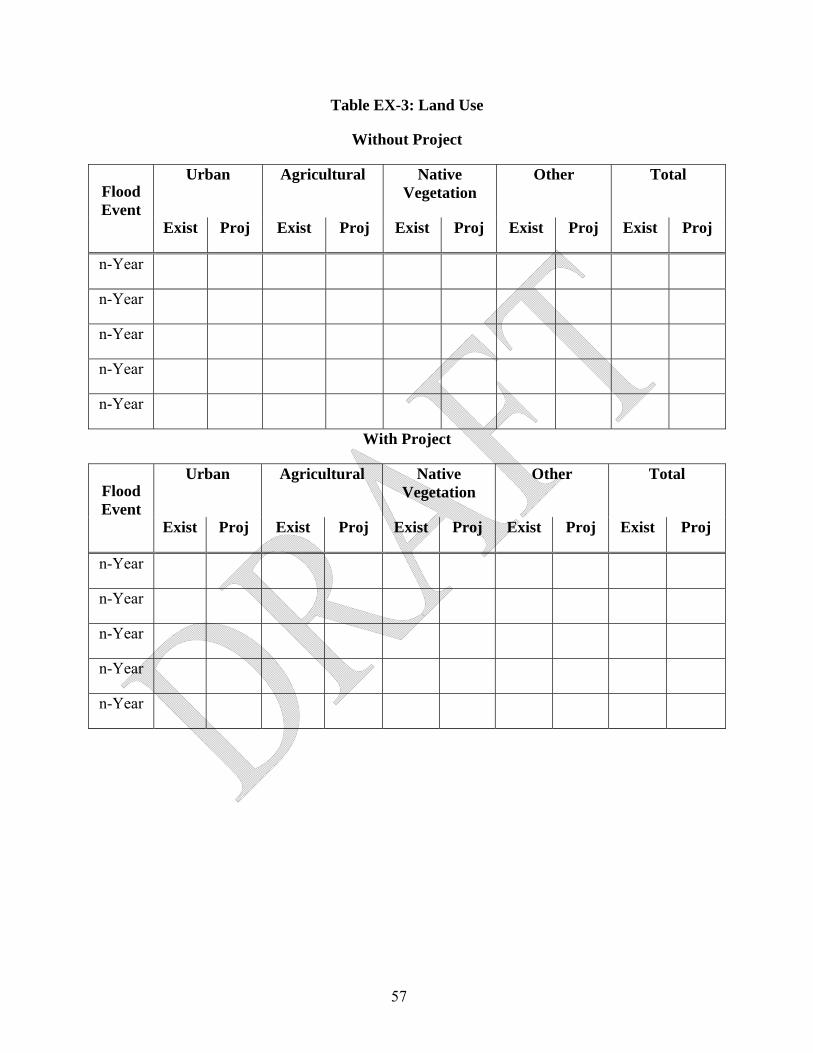
Table EX-3: Land Use
Without Project
Urban Agricultural Native Vegetation
Other Total Flood Event
Exist Proj Exist Proj Exist Proj Exist Proj Exist Proj
n-Year
n-Year
n-Year
n-Year
n-Year
With Project
Urban Agricultural Native Vegetation
Other Total Flood Event
Exist Proj Exist Proj Exist Proj Exist Proj Exist Proj
n-Year
n-Year
n-Year
n-Year
n-Year
57

Table EX-4: Number of Structures at Risk
Without-Project
Residential Commercial Industrial Public Other Total Flood Event Exist Proj Exist Proj Exist Proj Exist Proj Exist Proj Exist Proj
n-Year
n-Year
n-Year
n-Year
n-Year
With Project
Residential Commercial Industrial Public Other Total Flood Event Exist Proj Exist Proj Exist Proj Exist Proj Exist Proj Exist Proj
n-Year
n-Year
n-Year
n-Year
n-Year
58
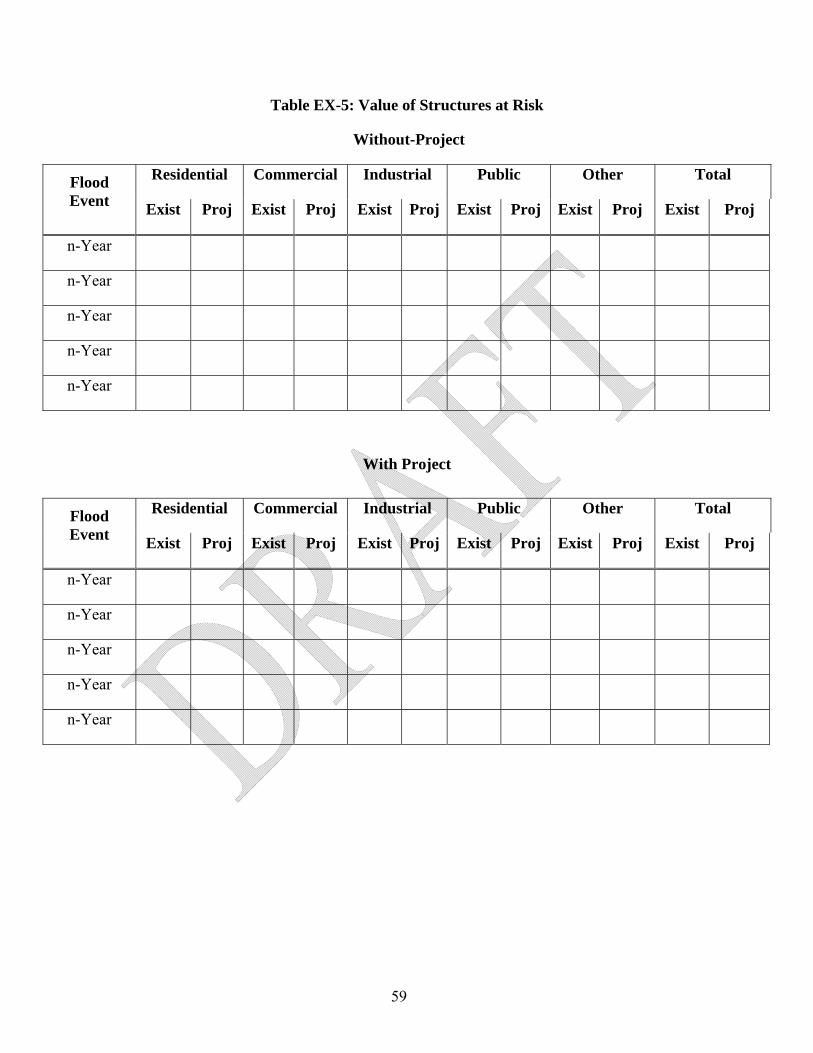
Table EX-5: Value of Structures at Risk
Without-Project
Residential Commercial Industrial Public Other Total Flood Event Exist Proj Exist Proj Exist Proj Exist Proj Exist Proj Exist Proj
n-Year
n-Year
n-Year
n-Year
n-Year
With Project
Residential Commercial Industrial Public Other Total Flood Event Exist Proj Exist Proj Exist Proj Exist Proj Exist Proj Exist Proj
n-Year
n-Year
n-Year
n-Year
n-Year
59
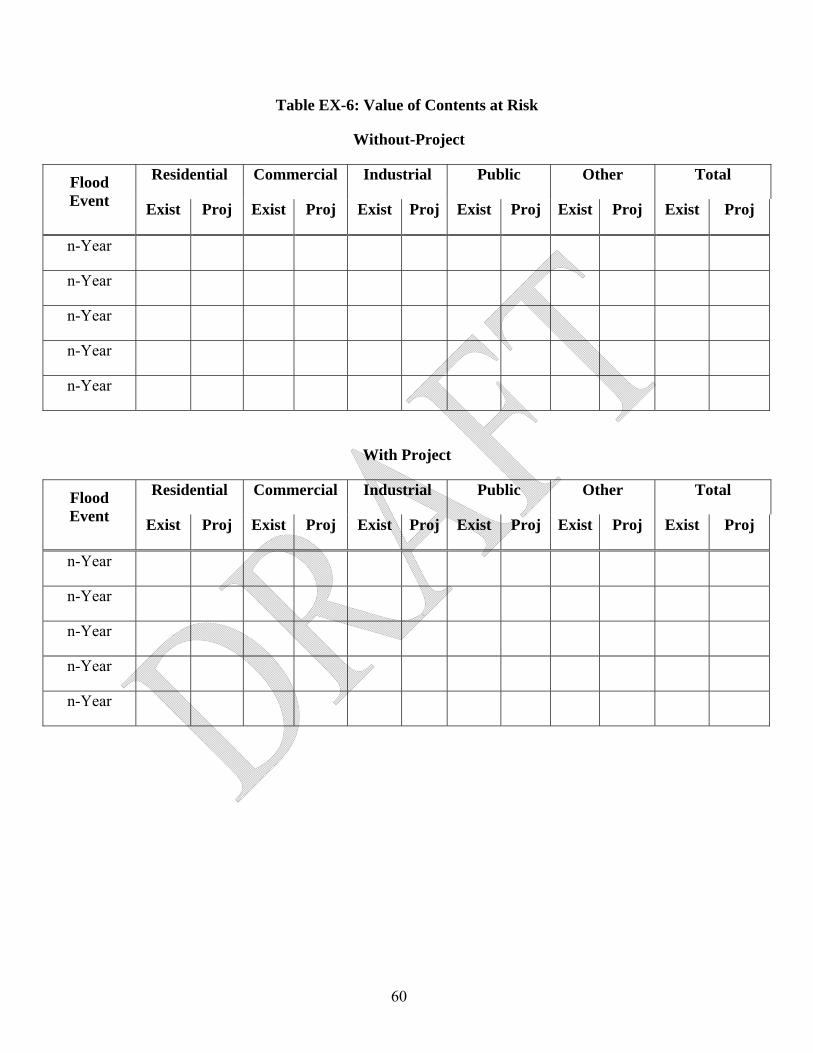
60
Table EX-6: Value of Contents at Risk
Without-Project
Residential Commercial Industrial Public Other Total Flood Event Exist Proj Exist Proj Exist Proj Exist Proj Exist Proj Exist Proj
n-Year
n-Year
n-Year
n-Year
n-Year
With Project
Residential Commercial Industrial Public Other Total Flood Event Exist Proj Exist Proj Exist Proj Exist Proj Exist Proj Exist Proj
n-Year
n-Year
n-Year
n-Year
n-Year
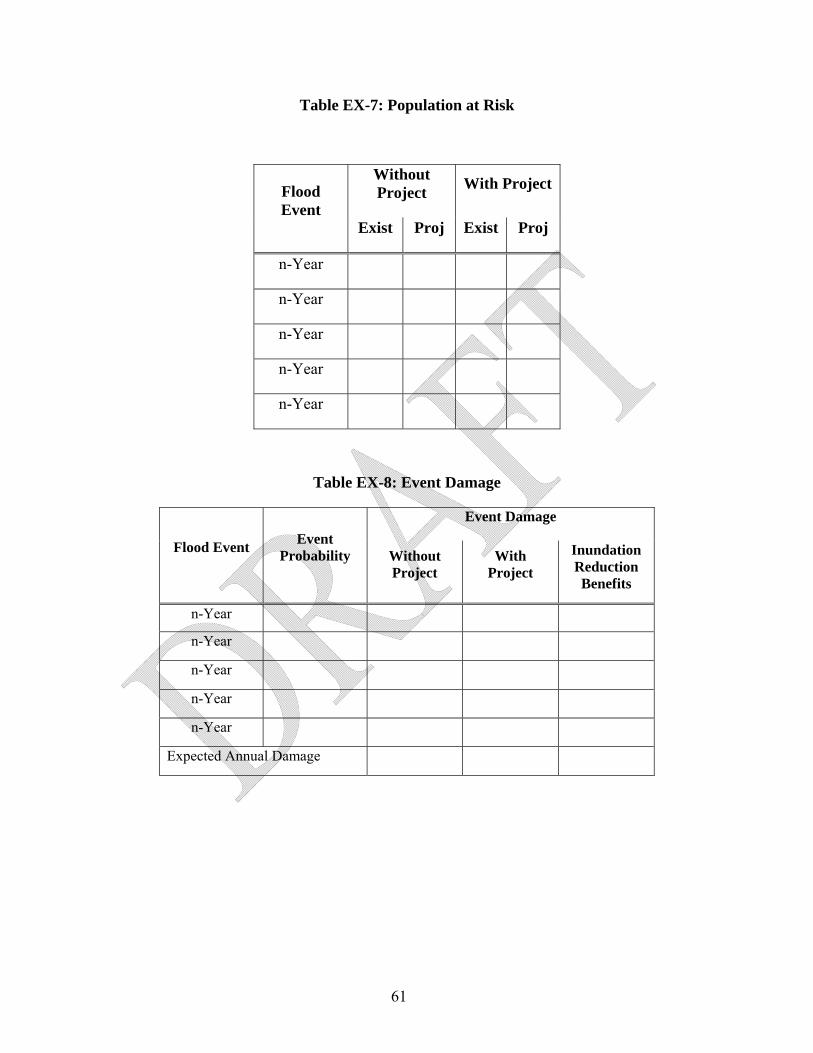
Table EX-7: Population at Risk
Without Project With ProjectFlood
Event Exist Proj Exist Proj
n-Year
n-Year
n-Year
n-Year
n-Year
Table EX-8: Event Damage
Event Damage
Flood Event Event Probability Without
Project With
Project Inundation Reduction Benefits
n-Year
n-Year
n-Year
n-Year
n-Year
Expected Annual Damage
61
62
Analysis Results Display without- and with project event damage (for the recommended plan (Table EX-8). The
difference between expected annual damage between without- and with- conditions is the
inundation reduction benefit. Table EX-8 must be completed for existing year conditions and
separately for projected conditions if included in the analysis.
Table EX-9 summarizes the NED net benefit analysis for the recommended plan based upon
total present value of benefits and costs. This table includes all types of flood risk management
benefits (inundation reduction, intensification and location) as well as benefits from other project
objectives. Table EX-9 is completed for existing year conditions and separately for projected
conditions if included in the analysis.33 Table EX-10 displays the same information, but
calculated on an annualized basis.
Table EX-10 displays the project performance statistics for the recommended plan if HEC-FDA
was used.
Table EX -11 summarizes net benefits and benefit/cost estimates for all the alternatives that were
analyzed. Detailed information for these other alternatives does not need to be displayed but
must be available upon request.
33 If projected conditions were not evaluated, then there would not be any intensification or location benefits.

Table EX-9: Total Present Value NED Net Benefits
Recommended Plan
(a) Annual Benefits
(b) Flood Risk Management
(c) Inundation Reduction Benefits
(d) Intensification Benefits (1)
(e) Location Benefits (1)
(f) [c + d +e] Subtotal Flood Risk Management
(g) Other Objectives (2)
(h) [f + g] Subtotal Annual Benefits
(i) Present Value Coefficient (3) 15.67
(j) [h x i] Present Value of Future Benefits
(k) Project Costs
(l) Capital
(m) Annual Operations and Maintenance (O&M)
(n) Present Value Coefficient (2) 15.67
(o) [m x n] Present Value of O&M Costs
(p) [l + o] Subtotal Project Costs
(q) [j – p] NED Net Benefits
(r) [j / p] NED Benefit/Cost Ratio
(1) Intensification and location benefits may result from changes in land use caused by a project. However, DWR will not fund flood risk management projects providing primarily future land development opportunities, therefore “location” benefits will be excluded.
(2) Water supply, water quality, etc.
(3) 6% discount rate; 50-year analysis period.
63
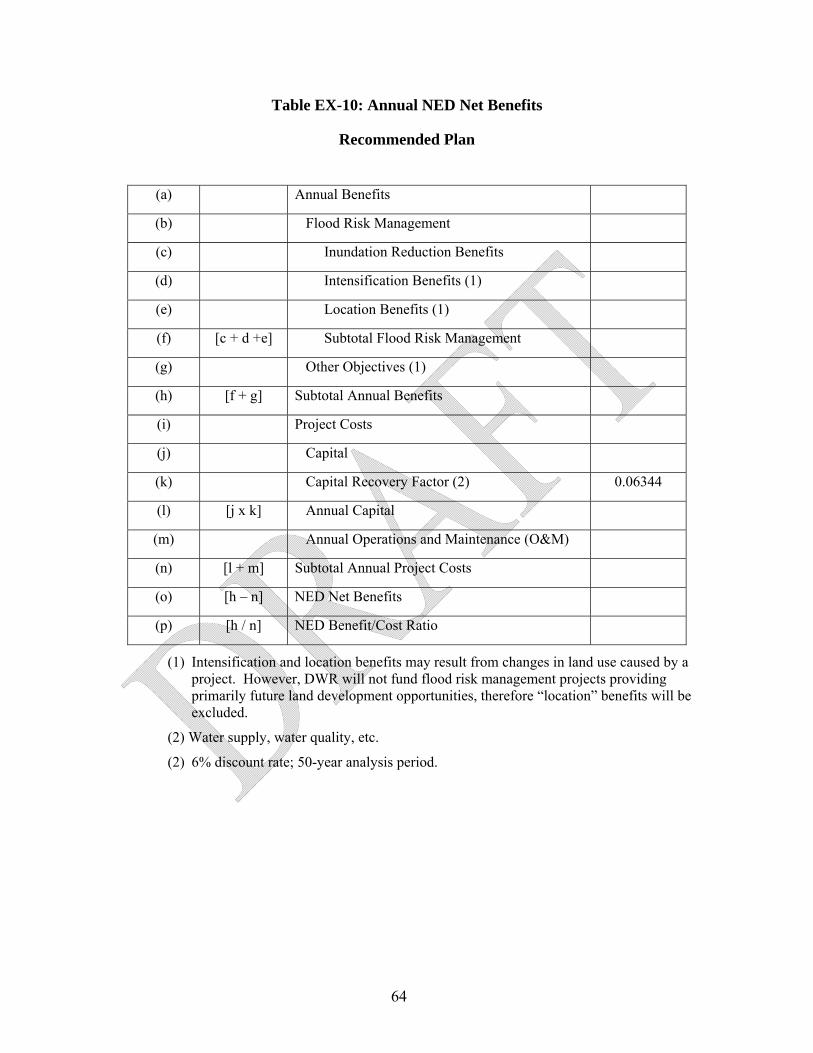
Table EX-10: Annual NED Net Benefits
Recommended Plan
(a) Annual Benefits
(b) Flood Risk Management
(c) Inundation Reduction Benefits
(d) Intensification Benefits (1)
(e) Location Benefits (1)
(f) [c + d +e] Subtotal Flood Risk Management
(g) Other Objectives (1)
(h) [f + g] Subtotal Annual Benefits
(i) Project Costs
(j) Capital
(k) Capital Recovery Factor (2) 0.06344
(l) [j x k] Annual Capital
(m) Annual Operations and Maintenance (O&M)
(n) [l + m] Subtotal Annual Project Costs
(o) [h – n] NED Net Benefits
(p) [h / n] NED Benefit/Cost Ratio
(1) Intensification and location benefits may result from changes in land use caused by a project. However, DWR will not fund flood risk management projects providing primarily future land development opportunities, therefore “location” benefits will be excluded.
(2) Water supply, water quality, etc.
(2) 6% discount rate; 50-year analysis period.
64

Table EX-11: HEC-FDA Project Performance Statistics
Project Performance Statistic Without Project
Recommended Plan
Annual Exceedence Probability (1)
Long-Term Risk (2)
10 Year Period
25 Year Period
50 Year period
Conditional Non-Exceedence Probability (3)
10-Year Event
25-Year Event
50-Year Event
100-Year Event
250-Year Event
500-Year Event
(1) Annual exceedence probability: the annual probability of having a damaging flood event in a given year, such as a levee failure
(2) Long-term risk: the chance of having one or more damaging events over a period of time, similar to the question: what’s the chance my house could be flooded during my 30 year mortgage?
(3) Conditional non-exceedence probability: the probability of containing specific flood events and avoiding damage.
65
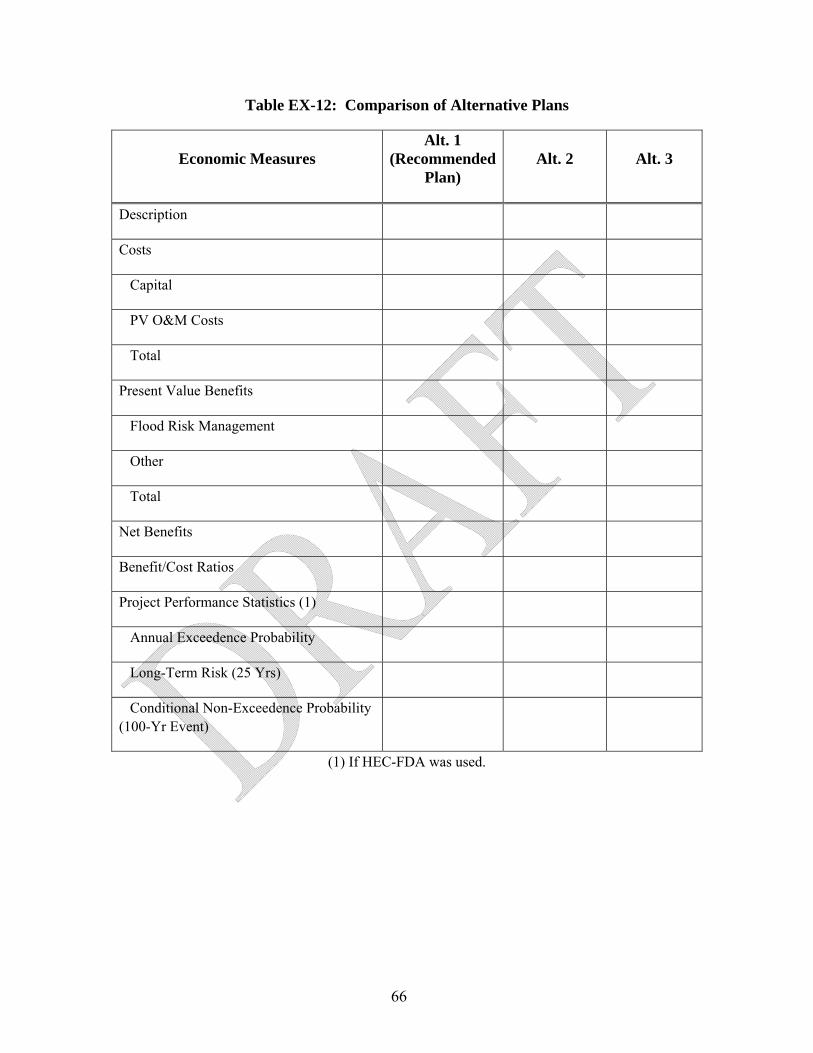
Table EX-12: Comparison of Alternative Plans
Economic Measures Alt. 1
(Recommended Plan)
Alt. 2 Alt. 3
Description
Costs
Capital
PV O&M Costs
Total
Present Value Benefits
Flood Risk Management
Other
Total
Net Benefits
Benefit/Cost Ratios
Project Performance Statistics (1)
Annual Exceedence Probability
Long-Term Risk (25 Yrs)
Conditional Non-Exceedence Probability (100-Yr Event)
(1) If HEC-FDA was used.
66
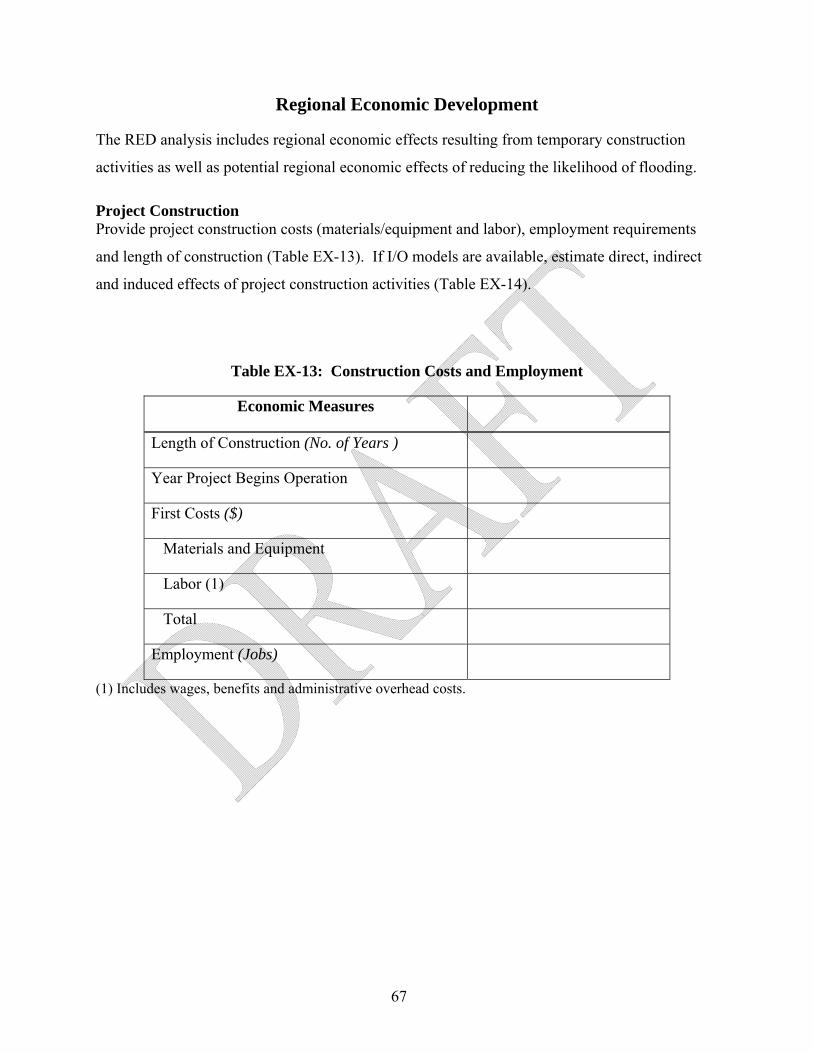
Regional Economic Development
The RED analysis includes regional economic effects resulting from temporary construction
activities as well as potential regional economic effects of reducing the likelihood of flooding.
Project Construction Provide project construction costs (materials/equipment and labor), employment requirements
and length of construction (Table EX-13). If I/O models are available, estimate direct, indirect
and induced effects of project construction activities (Table EX-14).
Table EX-13: Construction Costs and Employment
Economic Measures
Length of Construction (No. of Years )
Year Project Begins Operation
First Costs ($)
Materials and Equipment
Labor (1)
Total
Employment (Jobs)
(1) Includes wages, benefits and administrative overhead costs.
67
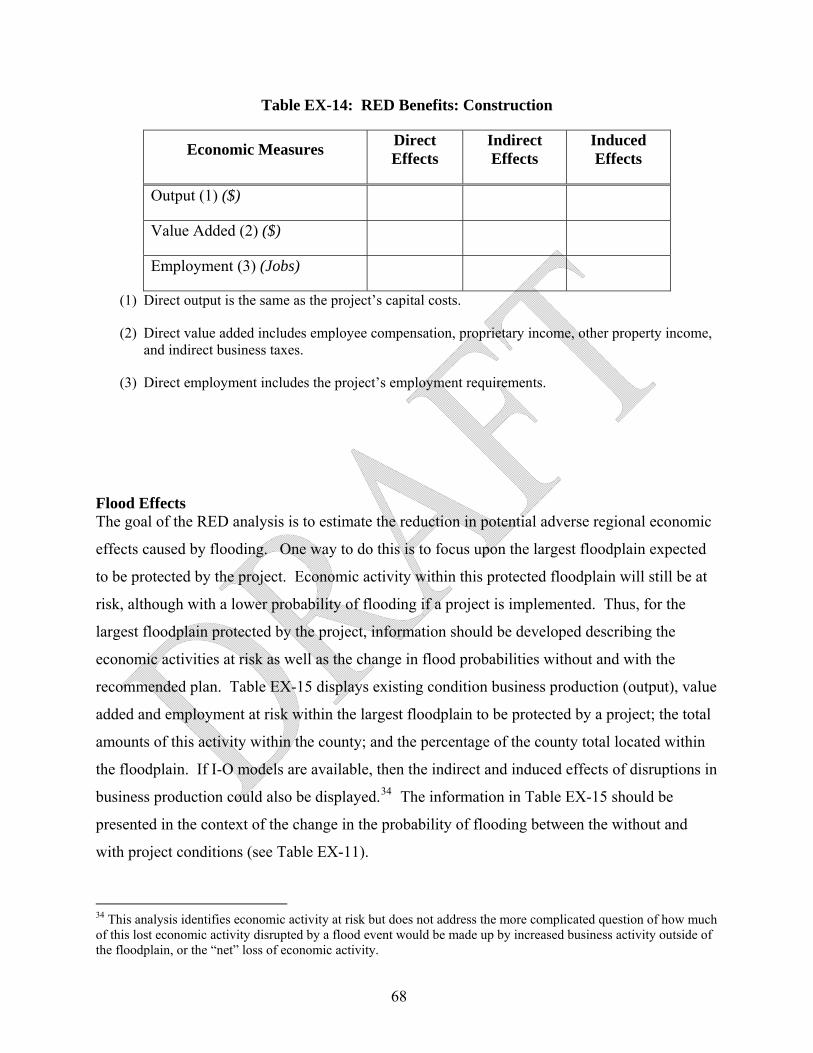
Table EX-14: RED Benefits: Construction
Economic Measures Direct Effects
Indirect Effects
Induced Effects
Output (1) ($)
Value Added (2) ($)
Employment (3) (Jobs)
(1) Direct output is the same as the project’s capital costs.
(2) Direct value added includes employee compensation, proprietary income, other property income, and indirect business taxes.
(3) Direct employment includes the project’s employment requirements.
Flood Effects The goal of the RED analysis is to estimate the reduction in potential adverse regional economic
effects caused by flooding. One way to do this is to focus upon the largest floodplain expected
to be protected by the project. Economic activity within this protected floodplain will still be at
risk, although with a lower probability of flooding if a project is implemented. Thus, for the
largest floodplain protected by the project, information should be developed describing the
economic activities at risk as well as the change in flood probabilities without and with the
recommended plan. Table EX-15 displays existing condition business production (output), value
added and employment at risk within the largest floodplain to be protected by a project; the total
amounts of this activity within the county; and the percentage of the county total located within
the floodplain. If I-O models are available, then the indirect and induced effects of disruptions in
business production could also be displayed.34 The information in Table EX-15 should be
presented in the context of the change in the probability of flooding between the without and
with project conditions (see Table EX-11).
34 This analysis identifies economic activity at risk but does not address the more complicated question of how much of this lost economic activity disrupted by a flood event would be made up by increased business activity outside of the floodplain, or the “net” loss of economic activity.
68
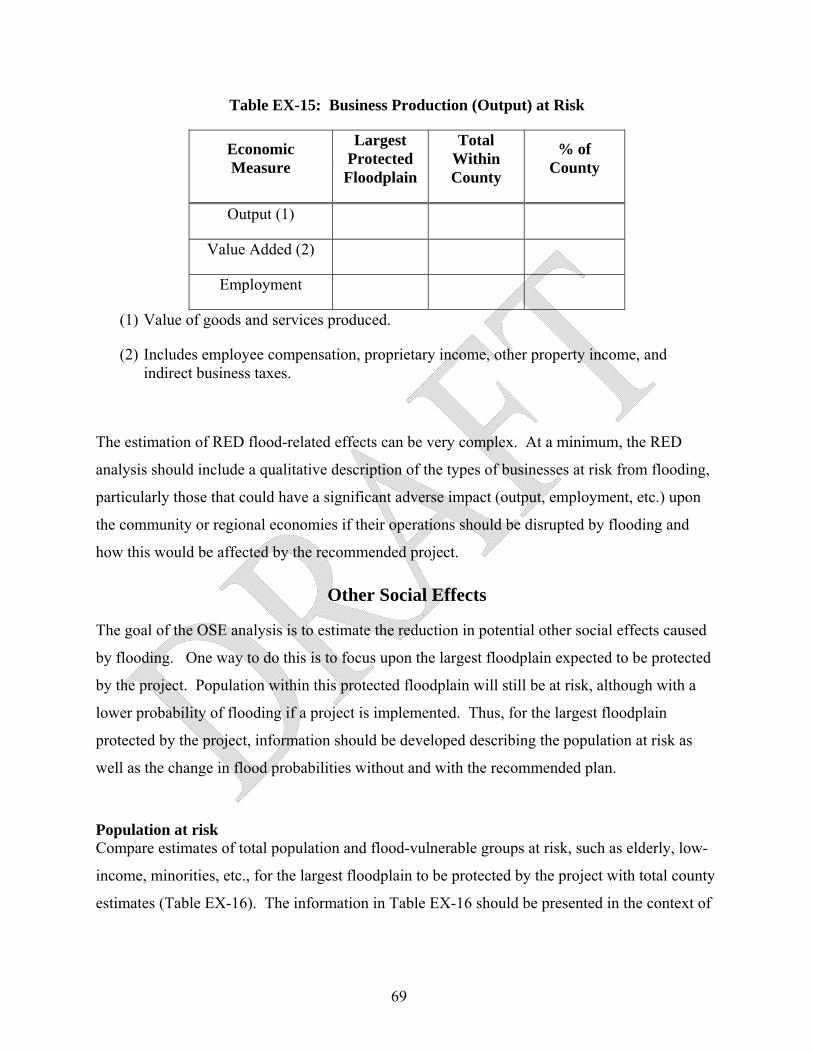
Table EX-15: Business Production (Output) at Risk
Economic Measure
Largest Protected Floodplain
Total Within County
% of County
Output (1)
Value Added (2)
Employment
(1) Value of goods and services produced.
(2) Includes employee compensation, proprietary income, other property income, and indirect business taxes.
The estimation of RED flood-related effects can be very complex. At a minimum, the RED
analysis should include a qualitative description of the types of businesses at risk from flooding,
particularly those that could have a significant adverse impact (output, employment, etc.) upon
the community or regional economies if their operations should be disrupted by flooding and
how this would be affected by the recommended project.
Other Social Effects
The goal of the OSE analysis is to estimate the reduction in potential other social effects caused
by flooding. One way to do this is to focus upon the largest floodplain expected to be protected
by the project. Population within this protected floodplain will still be at risk, although with a
lower probability of flooding if a project is implemented. Thus, for the largest floodplain
protected by the project, information should be developed describing the population at risk as
well as the change in flood probabilities without and with the recommended plan.
Population at risk Compare estimates of total population and flood-vulnerable groups at risk, such as elderly, low-
income, minorities, etc., for the largest floodplain to be protected by the project with total county
estimates (Table EX-16). The information in Table EX-16 should be presented in the context of
69

the change in the probability of flooding between the without and with project conditions (see
Table EX-11).
Since this population is at risk of being displaced by flood events, determine the number of
potential shelter and evacuation facilities not likely to be directly affected by the flood event
(Table EX-17). This type of analysis can be greatly enhanced by using GIS to map potential
inundation areas (extents and depths) for given time periods (i.e., 6, 12, 24, 48 hours, etc.) into a
flood event. For example, after 6 hours, a flood event could be shown to cover x acres with
depths up to y feet, displacing z people.
Critical facilities at risk Compare the number of critical facilities at risk, such as hospitals, emergency response, schools,
utilities, transportation, etc., for the largest floodplain to be protected by the project with total
county estimates (Table EX-18). Information in this table can be enhanced by providing
descriptive information concerning the facilities (for example, number of beds in hospitals,
number of students in schools, etc.).
.
70
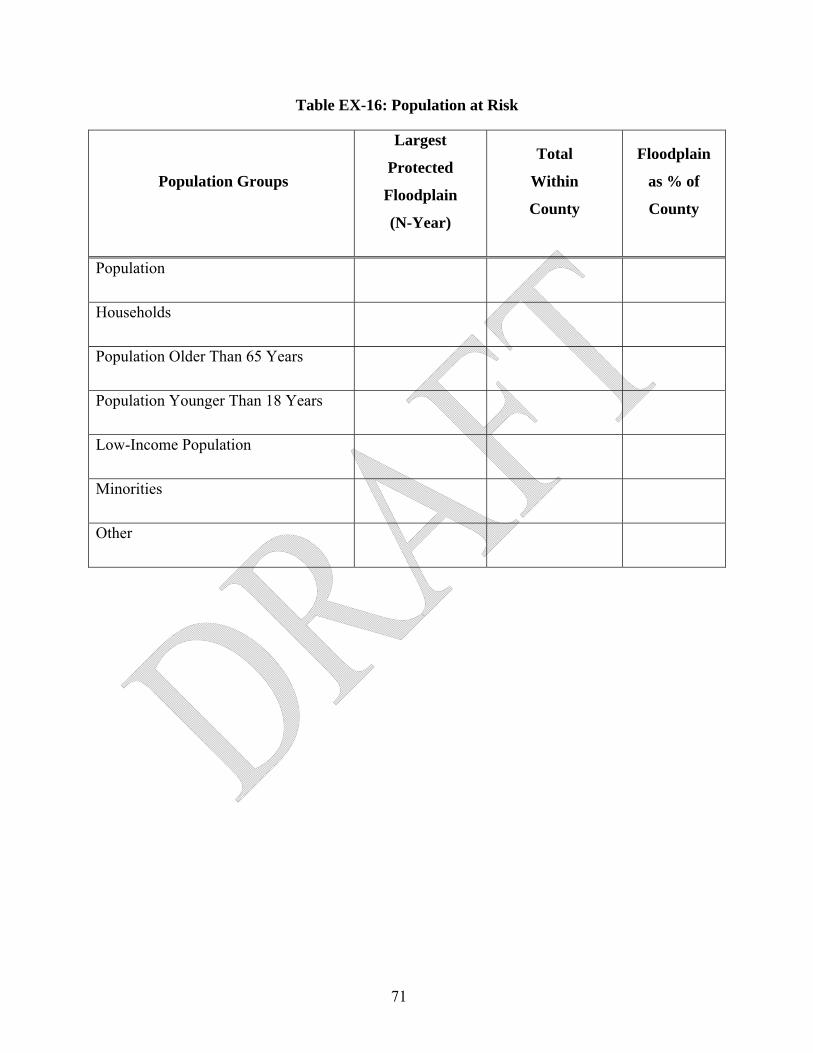
Table EX-16: Population at Risk
Population Groups
Largest
Protected
Floodplain
(N-Year)
Total
Within
County
Floodplain
as % of
County
Population
Households
Population Older Than 65 Years
Population Younger Than 18 Years
Low-Income Population
Minorities
Other
71
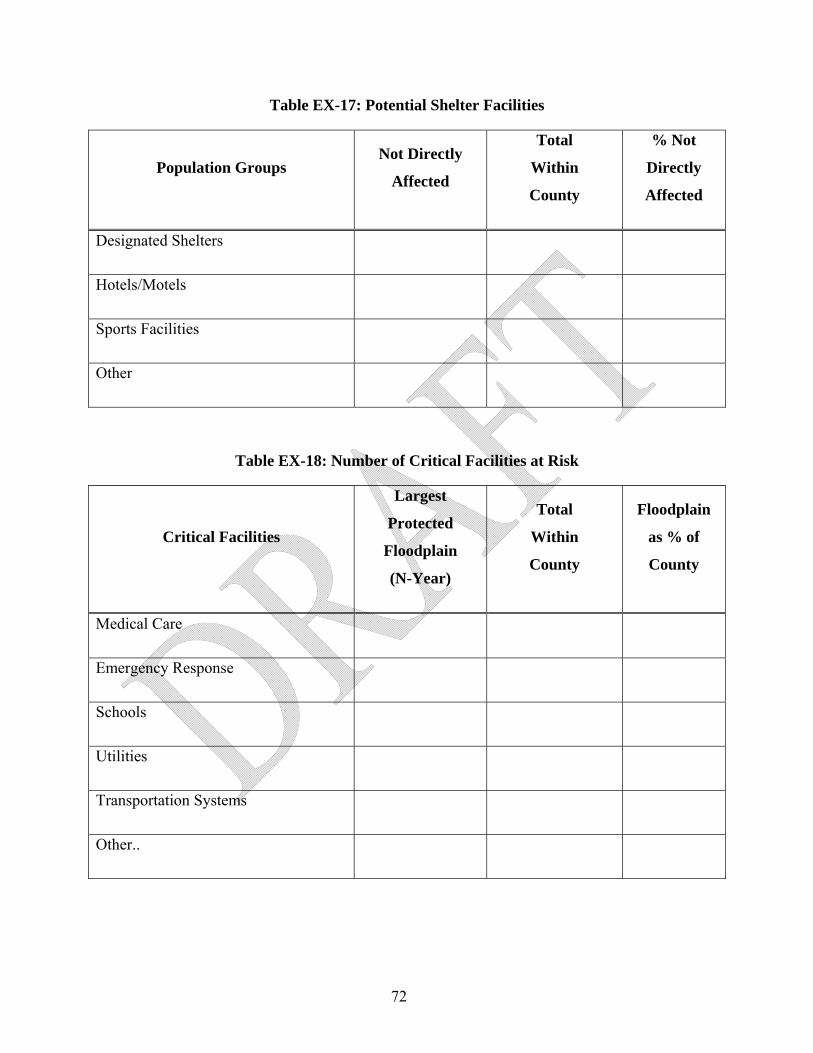
Table EX-17: Potential Shelter Facilities
Population Groups Not Directly
Affected
Total
Within
County
% Not
Directly
Affected
Designated Shelters
Hotels/Motels
Sports Facilities
Other
Table EX-18: Number of Critical Facilities at Risk
Critical Facilities
Largest
Protected
Floodplain
(N-Year)
Total
Within
County
Floodplain
as % of
County
Medical Care
Emergency Response
Schools
Utilities
Transportation Systems
Other..
72
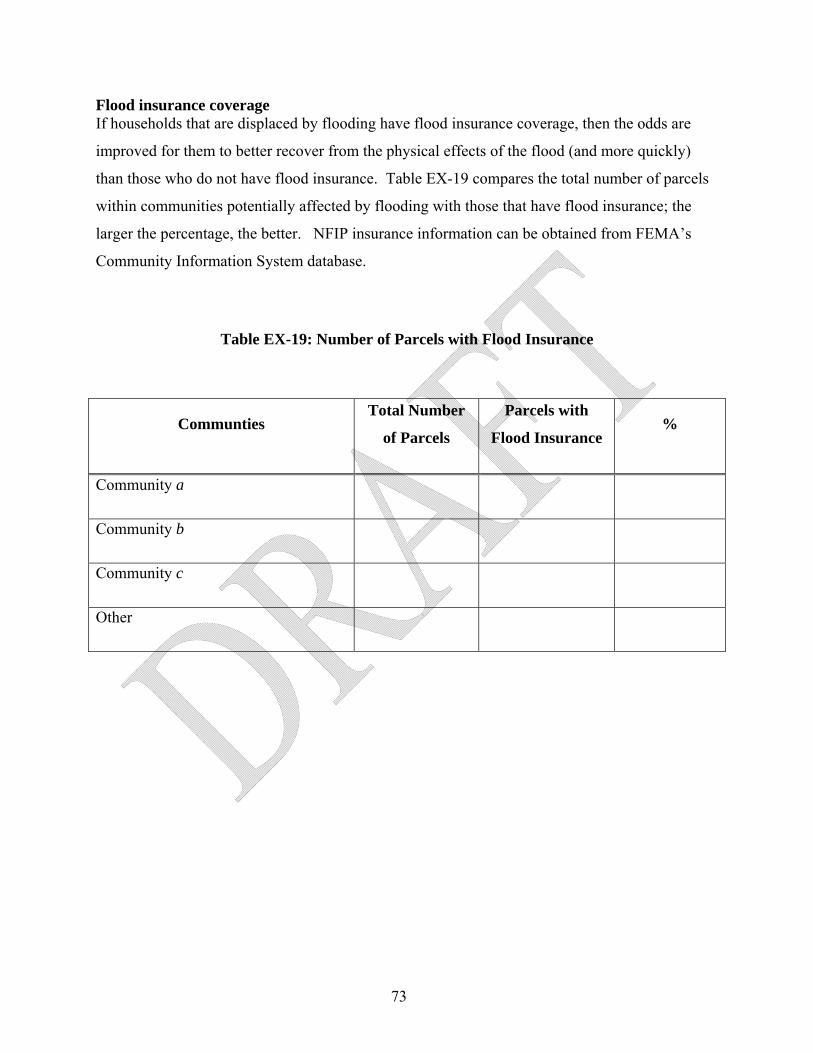
73
Flood insurance coverage If households that are displaced by flooding have flood insurance coverage, then the odds are
improved for them to better recover from the physical effects of the flood (and more quickly)
than those who do not have flood insurance. Table EX-19 compares the total number of parcels
within communities potentially affected by flooding with those that have flood insurance; the
larger the percentage, the better. NFIP insurance information can be obtained from FEMA’s
Community Information System database.
Table EX-19: Number of Parcels with Flood Insurance
Communties Total Number
of Parcels
Parcels with
Flood Insurance %
Community a
Community b
Community c
Other
Chapter 7: Flood Economics Resources
USACE Planner’s Library
• Planning Manual
• Planning Guidance Notebook (ER 1105-2-100)
• Economic and Environmental Principles and Guidelines for Water and Related Land
Resources Implementation Studies
• Economic Guidance Memoranda (interest rates, depth-damage curves, unit day values,
etc.)
http://www.usace.army.mil/cw/cecw-cp/library/planlib.html
Flood Risk Management Engineering Manuals and Regulations
• EM 1110-2-1619, Risk-Based Analysis for Flood Damage Reduction Studies, August,
1996
• ER 1105-2-101, Risk Analysis for Flood Damage Reduction Studies, January 2006.
http://140.194.76.129/publications/index.html
National Economic Development Manuals (Revised Web-based Versions)
• Flood Risk Management
• Coastal Storm Risk Management
http://www.iwr.usace.army.mil/ned/
National Economic Development Manuals (Original Text Versions)
74

• National Economic Development Procedures Manual – Urban Flood Damage (IWR
Report 88-R-2), March 1988
• National Economic Development Procedures Manual – Agricultural Flood Damage
(IWR Report 87-R-10), March 1988
• National Economic Development Procedures Manual – Overview Manual for
Conducting National Economic Development Analysis (IWR Report 91-R-11), October
1991.
http://www.iwr.usace.army.mil/inside/products/pub/pubsearchS.cfm?series=NED
Hydrologic Engineering Center
• HEC-FDA software and documentation (manual and certification report)
• HEC-FIA software (currently under development)
http://www.hec.usace.army.mil/
National Flood Risk Program
http://www.iwr.usace.army.mil/nfrmp/
FEMA • HAZUS-MH
http://www.fema.gov/plan/prevent/hazus/index.shtm
• Mitigation Benefit-Cost Analysis Software
http://www.fema.gov/government/grant/bca.shtm
• Mitigation BCA Toolkit (including “What is a Benefit?” publication) is available at
FEMA Regional Offices or by contacting the BC Helpline [email protected] or
calling (866) 222-3580
75
• President’s Office of Management and Budget, Circular A-94: Guidelines and Discount
Rates for Benefit-Cost Analysis of Federal Programs, (October 29, 1992) [used by
FEMA]
http://www.whitehouse.gov/omb/rewrite/circulars/a094/a094.html DWR
• Economic Analysis Guidebook (January 2008)
http://www.economics.water.ca.gov/guidance.cfm
• Comprehensive Floodplain Management: Promoting Wise Uses of Floodplains
(workshop modules)
http://www.economics.water.ca.gov/studies.cfm
• Quick Guide: The NFIP in California
http://www.fpm.water.ca.gov/
Other President’s Council on Environmental Quality
• Updated Federal Principles & Guidelines for Water and Related Land Resources
Implementation Studies
http://www.whitehouse.gov/administration/eop/ceq/initiatives/PandG
Associated Programme on Flood Management
• Integrated Flood Management: Concept Paper (2004)
• Conducting Flood Loss Assessments: A Tool for Integrated Flood Management (March
2007)
• Economic Aspects of Integrated Flood Management (June 2007)
http://www.apfm.info/ifm_tools.htm
76
Association of State Floodplain Managers
http://www.floods.org/
Floodplain Management Association
http://www.floodplain.org/
National Park Service (Rivers, Trails and Conservation Program)
• Economic Impacts of Protecting Rivers, Trails and Greenway Corridors (1995)
http://www.nps.gov/ncrc/programs/rtca/helpfultools/ht_publications.html
National Research Council/National Academy of Sciences
• Flood Risk Management and the American River Basin (1995)
• Risk Analysis and Uncertainty in Flood Damage Reduction Studies (2000)
• The Impacts of Natural Disasters: A Framework for Loss Estimation (1999)
• Analytical Methods and Approaches for Water Resources Project Planning (2004)
• Valuing Ecosystem Services (2005)
http://www.nap.edu/
L. Douglas James and Robert R. Lee, Economics of Water Resources Planning (1971)
77

Appendix I: Levee Incremental Benefit Analysis
78

79
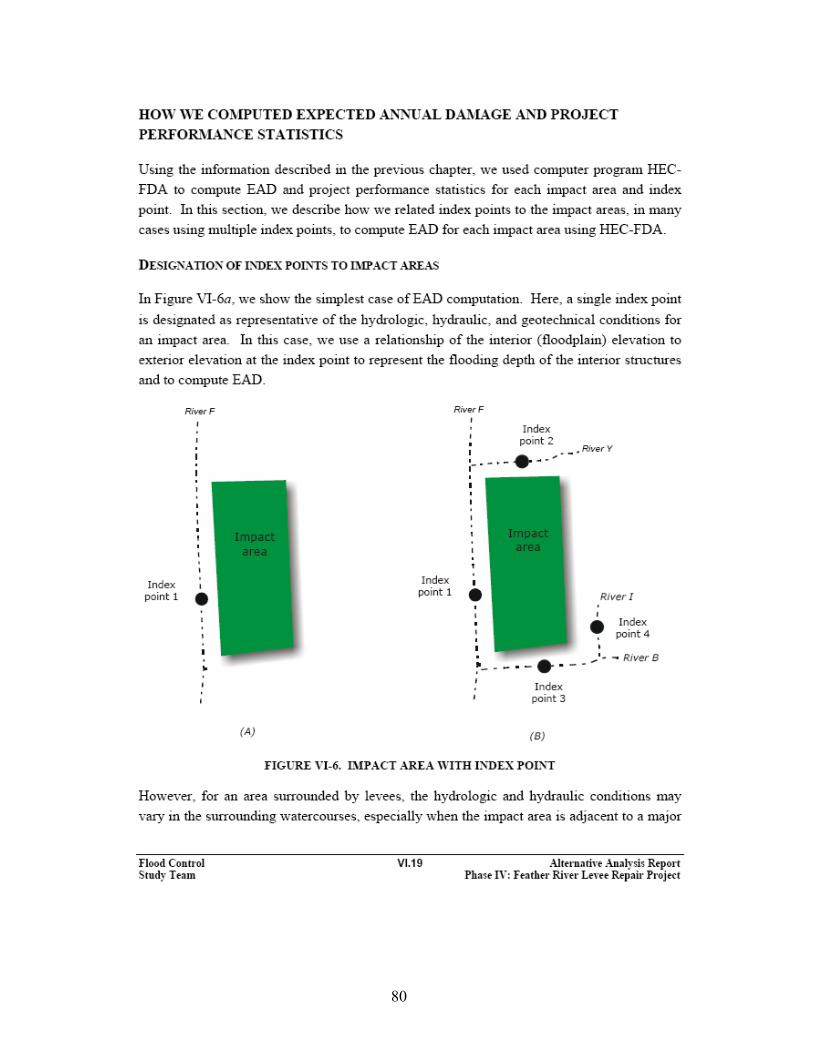
80
81
82
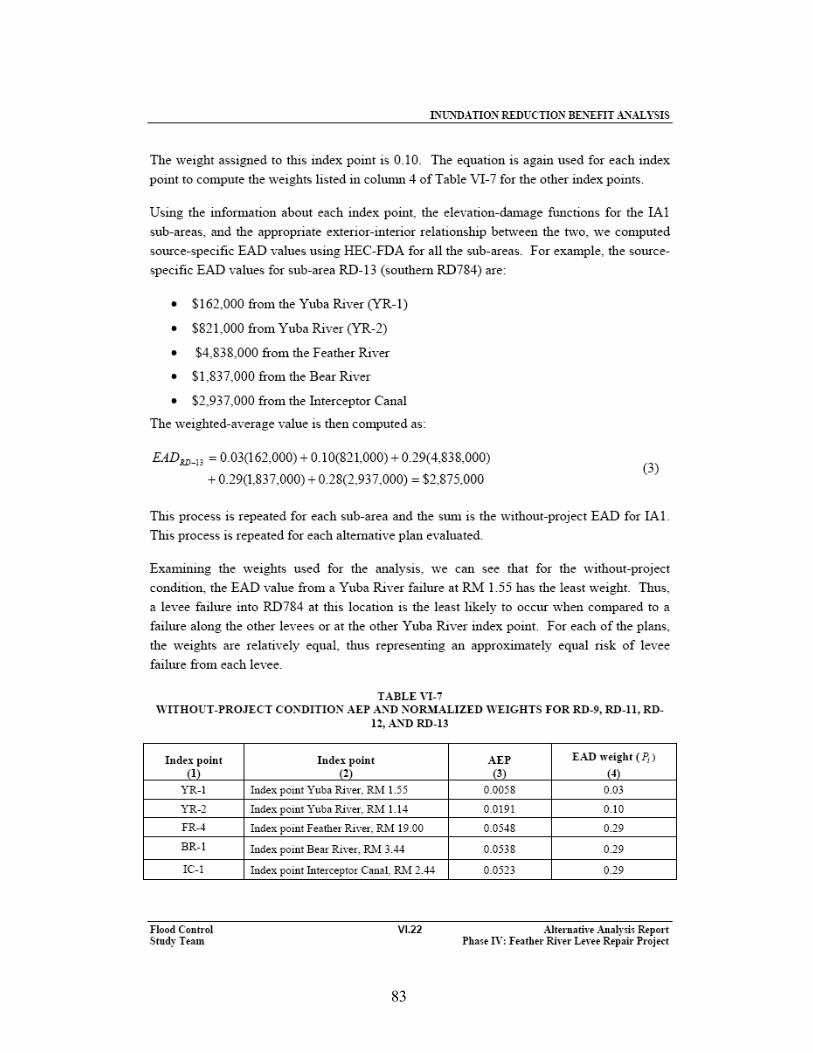
83
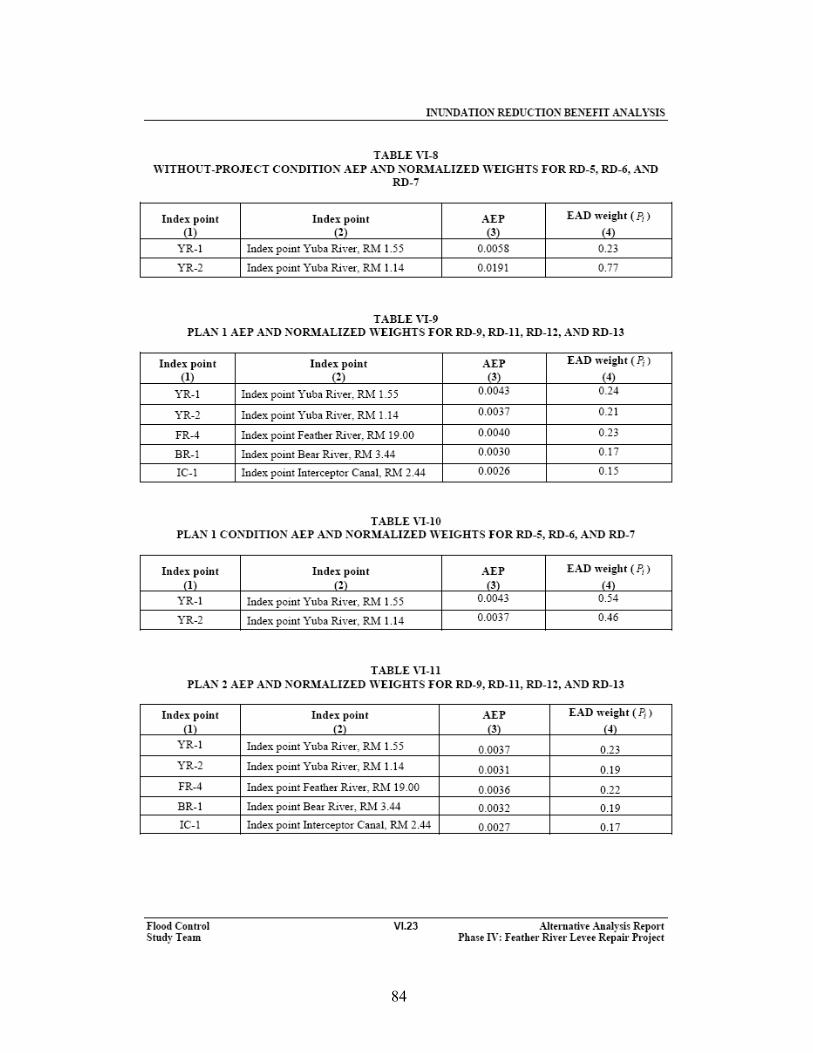
84
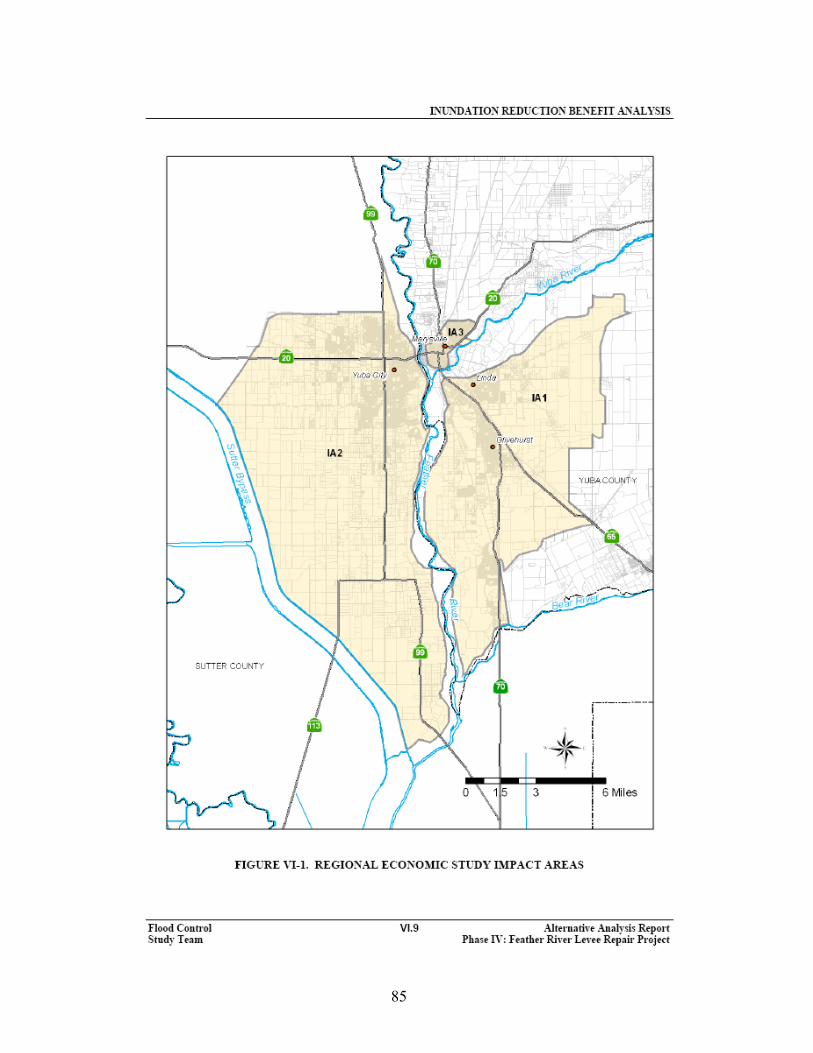
85

86