ecology field guide
TRANSCRIPT

Ecology Field GuideEcology Field Guide
A GUIDE TO WOLFTREE’SWATERSHED SCIENCE EDUCATION PROGRAM
5th Edition

Central Oregon: 215 North Cedar Street • PO BOX 524 • Sisters, Oregon 97759 541.549.1549
Western Oregon: PO BOX 646 • Beavercreek, Oregon 97004503.730.5999
www.beoutside.org
Ecology Field GuideEcology Field GuideA guide to
Wolftree’s wATERSHED science programS
© 2004 Wolftree, Inc.

How to Use the Guide INTRO 1
Introduction INTRO 2Benchmarks INTRO 4Educational Approach to Science Ed. INTRO 6Wolftree and Safety INTRO 7Teacher Responsibility Checklist INTRO 8Mentoring INTRO 10Mentor Guidelines INTRO 11The Name “Wolftree” INTRO 12Science Inquiry INTRO 13
Ecological System EC 1Disturbance (Change) EC 5Food Web EC 8Adaptation EC 10Species Relationships EC 13Habitat and Species Diversity EC 15
Field Studies FIELD 1General Field Procedures FIELD 2 Standard Field Equipment FIELD 4Field Journaling FIELD 5Science Inquiry Planning Form FIELD 8Getting a Representative Sample FIELD 9Terrestrial Invertebrates FIELD 15Wildlife Ecology FIELD 26Forest Ecology FIELD 37Plant Ecology FIELD 49Lichen Ecology FIELD 67Aquatic Invertebrates FIELD 79Water Chemistry FIELD 90
Temperature FIELD 91pH FIELD 95Dissolved Oxygen FIELD 100Turbidity FIELD 104
Streamflow FIELD 112Wetland Ecology FIELD 121
Glossary GLOS 1
Bibliography BIB 1
contents
“The most beautifulexperience we can
have is the mysterious. It isthe fundamental
emotion thatstands at the
cradle of true art and
science.”
--Albert Einstein

The Ecology Field Guide is designed to be a concise and user-friendly guide that servesa wide variety of ages, grades, skill levels andlearning styles. A majority of the text is supported by pictures, graphics and charts.We have also included real world applicationsfor relevance.
Introduction. The introduction lays out thegoals and student outcomes of the guideand the overall programs. It also puts forthour educational approach, addressesteacher and mentor responsibilities, dis-cusses tips for mentoring in the field andthe science inquiry process.
Ecological Concepts. This section providesimportant background information on thestudy of ecology and how to investigate it.These core ecological concepts will beemphasized and weaved throughout the fieldstudy.
Program Field Activities. For each field activity, we have provided backgroundinformation, general procedures for fieldstudies, data sheets, key questions, tips forteaching, calculation sheets, and resourcesfor learning more. Each activity section hasa thematic icon, for example rain drops forwater chemistry, for ease of use in theclassroom and in the field.
Bibliography and Glossary. A bibliography ofresources that were used in the creation ofthis guide, and a comprehensive glossary ofterms are included.
How to use the guide
INTRO 1
“Science is a creative andexploratory field that
draws upon many kinds of knowledge.”
-- Karen GallasAuthor, Elementary SchoolTeacher and Professor at
the Univ. of Maine

introduction
INTRO 2
“Wisdom begins in wonder.”--Socrates
Wolftree's award winning Watershed Scienceprograms give participants the opportunityto experience the wonders of the naturalworld while being challenged with rigorous fieldstudies. Dynamic programs range from one-day field trips that introduce students toinquiry driven ecological science to multi-daysummer research camping expeditions. Ourlong term Enrichment project begins at thefourth grade with basic science skills, know-ledge, and comprehension and builds to moresophisticated and rigorous scientific applica-tion and analysis as they progress throughschool on into adulthood.
The Ecology Field Guide is an integral part of Wolftree’s programs. It isdesigned to provide students, teachers and mentors with the necessarybackground content and program information to prepare for field experiences. The guide also allows participants to extend their ecologystudies in their own communities.
Goal:Wolftree’s Watershed Science programs seek to IINNCCRREEAASSEE SSCCIIEENNCCEE LLIITTEERRAACCYY*,
Student OutcomesUpon completion of a Wolftree Watershed Science program, students areable to: 1. Demonstrate an understanding about the structure and functions of
watersheds;2. Apply advanced observation and awareness techniques;3. Formulate testable questions or hypotheses based on observations;4. Design an investigation to test their hypotheses. 5. Collect watershed data using contemporary scientific tools and
technology;6. Analyze, organize, and summarize their data;7. Answer their scientific questions or assess whether their hypothesis
is supported by data; 8. Effectively communicate their observations and conclusions; and9. Fulfill national and state requirements for science and science inquiry.
*According to the American Association for the Advancement of Science, science literacy requires citizensto have the ability to: (A) Grasp what science, engineering, technology and math are about; (B) Understandhow the natural and designed worlds work; (C) Critically and independently think to recognize and weigh alternative explanations of events and design trade-offs; and (D) Deal sensibly with problems that involve evidence, numbers, patterns, logical arguments, and uncertainties.

WATERSHED SCIENCECORE ELEMENTSTo accomplish our goal, Wolftreeprovides programs that have the following core elements.
FFIIEELLDD BBAASSEEDD. Students explore thenatural world at several diversefield sites located throughout thePacific Northwest.
EEXXPPEERRIIEENNTTIIAALL. Teams use contemp-orary scientific research tools,technology and techniques to collect and analyze scientific data.
SSMMAALLLL TTEEAAMMSS. Research teams of usually seven, five students and twomentors, immerse themselves in the study of ecology.
IINNQQUUIIRRYY DDRRIIVVEENN. Students learn how to make observations, develop questions and hypotheses, design investigations to test their hypotheses and present their conclusions.
GGUUIIDDEEDD BBYY SSCCIIEENNTTIISSTT MMEENNTTOORRSS. Over 250 professional scientists from nearly70 public and private organizations support Wolftree students.Mentors are trained to engage students with challenging questions,encourage critical and creative thinking, and guide students towardsmeaningful conclusions.
CCLLAASSSSRROOOOMM AACCTTIIVVIITTIIEESS AANNDD MMAATTEERRIIAALLSS CCOOMMPPLLEEMMEENNTT FFIIEELLDD SSTTUUDDIIEESS. Wolftreestaff and mentors facilitate pre and post classroom activities to provide a seamless link between the classroom and the field. Teachersare provided with a host of supplemental instructional materials including this Ecology Field Guide.
AACCCCOOMMMMOODDAATTEESS TTHHEE FFUULLLL RRAANNGGEE LLEEAARRNNIINNGG AABBIILLIITTIIEESS AANNDD CCUULLTTUURREESS. Females andminorities are especially encouraged to succeed through special projects.
TTIIEEDD TTOO NNAATTIIOONNAALL AANNDD SSTTAATTEE SSTTAANNDDAARRDDSS AANNDD BBEENNCCHHMMAARRKKSS. All our programsprovide students the opportunity to fulfill school benchmark requirements, especially regarding science inquiry.
INTRO 3

INTRO 4
Oregon sciencebenchmarks
Identify & explain patterns of change as cycles and trends.
Identify a systems inputs & outputs. Explain the effects of changing thesystem’s components.
Use a model to make predictions about familiar & unfamiliar phenomena inthe natural world.
Describe & explain the theory of natural selection as a mechanism for evolution.
Based on observations & scientific concepts, ask questions or formhypotheses that can be explored through scientific investigations.
Describe & explain the structure and functions of an organism in terms ofcells tissues and organs.
Identify and describe the relationship between structure and function atvarious levels of organization in life, physical or Earth/space science
Explain how equilibrium can be achieved through the interaction of forces &changes.
Identify and explain evidence of physical and biological changes over time.
Un
ify
ing
Co
nce
pt
sS
cie
nt
ific
Inq
uir
y
Terr
estr
ial I
nver
tsW
ildlif
e Ec
olog
yFo
rest
Eco
logy
Plan
t Ec
olog
yLi
chen
Eco
logy
Aqu
atic
Inve
rts
Wat
er C
hem
istr
yS
trea
mflo
w
about Benchmarks : Wolftree's programs are designed to be vehiclesto help students achieve benchmarks in science and science inquiry by creatinga learning environment rich with possibility. Teachers, please use this chart toassist you and your students in achieving benchmarks.
LIfe
Sci
enc
e
Grade 8
Design a scientific investigation to answer questions or test hypotheses.
Collect, organize, & display sufficient data to support analysis.
Summarize & analyze data including possible sources of error. Explainresults & offer reasonable and accurate interpretations & implications.
✓ ✓ ✓ ✓ ✓ ✓ ✓
✓ ✓ ✓ ✓ ✓ ✓ ✓ ✓
✓ ✓ ✓ ✓ ✓ ✓ ✓ ✓
✓ ✓ ✓ ✓ ✓ ✓ ✓ ✓
✓ ✓ ✓ ✓ ✓ ✓ ✓ ✓
✓
✓ ✓ ✓ ✓ ✓ ✓ ✓ ✓
✓ ✓ ✓ ✓ ✓ ✓
✓ ✓ ✓ ✓ ✓ ✓ ✓ ✓
✓ ✓ ✓ ✓ ✓ ✓ ✓ ✓
✓ ✓ ✓ ✓ ✓ ✓ ✓ ✓
✓ ✓ ✓ ✓ ✓ ✓ ✓ ✓
✓
✓✓
Identify & describe the factors that influence or change the balance of populations in their environment.
(Updated February 2002)

Oregon sciencebenchmarks
Define a system by specifying boundaries and subsystems, indicating itsrelation to other systems, and identifying its inputs and outputs.
Use conceptual &/or mathematical models to explain natural systems.
Explain how change occurs over time arising from materials & forms of thepast.
Collect, organize and display sufficient data to facilitate scientific analysis and interpretation.
Summarize & analyze data, evaluating sources of error/bias. Proposeexplanations that are supported by data & knowledge of scientific terms.
Based on observations & scientific concepts, ask questions or form hypotheses that can be answered/tested through scientific investigations.
Describe & explain the structure and functions of an organism in terms ofcells, tissues, and organs.
Analyze how physical, biological, or geological systems can maintain equilibrium.
Describe & analyze the effect of species, including humans, on an ecosystem.
Un
ify
ing
C
onc
ep
ts
Sci
en
tif
ic
Inq
uir
y
Terr
estr
ial I
nver
tsW
ildlif
e Ec
olog
yFo
rest
Eco
logy
Plan
t Ec
olog
yLi
chen
Eco
logy
Aqu
atic
Inve
rts
Wat
er C
hem
istr
yS
trea
mflo
w
about Benchmarks : Wolftree's programs are designed to be vehiclesto help students achieve benchmarks in science and science inquiry by creatinga learning environment rich with possibility. Teachers, please use this chart toassist you and your students in achieving benchmarks.
INTRO 5
LIfe
S
cie
nce
Grade 10
✓ ✓ ✓ ✓ ✓ ✓ ✓ ✓
✓ ✓ ✓ ✓ ✓ ✓ ✓ ✓
✓ ✓ ✓ ✓ ✓ ✓ ✓ ✓
✓ ✓ ✓ ✓ ✓ ✓ ✓ ✓
✓ ✓ ✓ ✓ ✓ ✓ ✓ ✓
✓ ✓ ✓ ✓ ✓ ✓ ✓ ✓
✓ ✓ ✓ ✓ ✓ ✓ ✓ ✓
Design a scientific investigation that provides sufficient data to answer aquestion or test a hypothesis.
✓✓
✓
✓✓
(Updated February 2002)

Wolftree’sapproach toScience educationOur educational goal at Wolftree is to accommodate the fullrange of learning abilities, attention spans, cultures, andages through rigorous science in the outdoors. We challengestudents to use their creative and critical higher order thinking skills, instill an intense interest in science and nature,and inspire all participants to be life-long learners.
Wolftree staff, mentors and teachers have developed scienceprograms that actively involve students in real world science.Our programs focus on the science of ecology and its coreconcepts. Students learn through inquiry, testing their ideasand critiquing their results. Guided by mentors, studentsare empowered to take initiative and assume responsibilityfor their own learning. Students are encouraged to construct and interpret their own meanings about their discoveries.
The heart of our programs lies in the efforts of mentors thatguide small teams of students (our programs average a 5:1 student to mentor ratio). Professional biologists and educa-tors, trained as mentors, support student investigation andanalysis. Mentors work alongside students to help themexamine their findings and draw their own conclusions.Mentors engage students in dialogue that aims to uncover,examine and discern truth about their studies. Studentsshare their questions about how the natural world works andmentors guide the "testing" of these questions for clarity,precision, accuracy, logical coherence and relevance.
Bringing students out of the confines of the classroom andinto wild places allow them to observe the world in a differentlight. We take this opportunity to awaken, exercise and ultimately sharpen sensory awareness skills. We encouragestudents to carefully observe and listen. For many students,this will be their first opportunity to use their multitude ofsenses to experience the richness of nature.
“Educationis, at itsessence,learning
about lifethrough
participa-tion and
relationshipin
community,including notonly people,but plants,
animals, andthe whole of
nature.”
-- Dr. GregoryCajete,
Tewa IndianEducator and
Artist
INTRO 6

Wolftree & SafetySafety is Wolftree’s highest priority. We believe verystrongly that students learn more when they are in asafe environment. Because of this, Wolftree has developed the following safety policies for our field programs.
1. All Wolftree staff are First Aid/CPR certified andtrained to administer epinephrine in the event of an anaphylactic reaction. At least one Wolftree staff person with Wilderness First Aid or Responder certification will be on every field day.
2. Wolftree works closely with teachers to ensure that students arrivefrom the field day prepared for outdoor studies. Students are instructed to: dress in layers, bring rain gear, wear long pants and shirts,have closed toed shoes, bring a full water bottle and adequet food. Wehave extra clothes on hand for student use.
3. Wolftree staff rigorously inspect each site before students arrive.Any safety hazards discovered are eliminated or made off limits.
4. Every Wolftree site has a specific emergency action plan. Within thisplan are detailed instructions of everyone’s role in the case of an emergency situation.
5. Each Wolftree program begins with a safety talk for all staff, interns,and mentors who will be out in the field with students. This meetingaddresses safety precautions, site and activity specific hazards, andemergency protocols.
6. All Wolftree affiliated adults are instructed to never to be alone witha student.
7. All staff on site, including Wolftree employees, mentors, and teachers, communicate via short wave radio. The Wolftree Program Manageralways has a cell phone.
8. Wolftree staff leaders carry extensive first aid kits. All mentors havefield first aid kits appropriate for minor injuries.
9. All injuries are documented and reviewed by the Wolftree SafetyCommittee. This committee analyzes safety protocols, sites, and curriculum to ensure safety.
INTRO 7

It is the responsibility of Wolftree teachers to:
❒❒ SSeeccuurree TTrraannssppoorrttaattiioonn. Well in advance of the field day,arrange for transportation to and from the field studysite (bus, vans, carpools, etc.). If field trip transportationfunds are not available from your school, contact Wolftree.
❒❒ BBrriinngg ffuullll ccllaasssseess. We put a great deal of effort intorecruiting mentors and securing funds to serve 30 students. If only 19 students show up, mentors and fundsare not effectively utilized. If you have a small class, thencombine classes, incorporate students from anotherteacher’s class, involve Ecology/Science Club students,etc. in order to bring your number up to 30.
❒❒ RReevviieeww ccoonnffiirrmmaattiioonn eemmaaiill.. After scheduling your field day, the ProgramManager will send you a confirmation email with the location, date, time andother essential details of your trip. Please review these very IMPORTANTDETAILS very carefully to make sure we are all planning for the same thing.
❒❒ CCoommmmuunniiccaattee. It is very important to keep in close contact with yourWolftree Program Manager. If there are any changes or issues that come upwith regard to your field trip, please contact us immediately at 503-239-1820(Wolftree office). Please be sure to get the Program Manager’s cell phone number as well.
❒❒ PPrreeppaarree ssttuuddeennttss. Use the Ecology Field Guide to make sure students areready for the field study (we strongly recommend that you review the ScienceInquiry and Ecological Concepts sections). We have observed that the morefamiliar students are with the information prior to the field day, the higher quality experience they have.
❒❒ DDiissttrriibbuuttee aanndd ccoolllleecctt ppeerrmmiissssiioonn sslliippss. A Wolftree permission slip, signed byteacher and parent for all students attending the field day, is mandatory.(School permission slips will not suffice - sorry!) Please make sure the correctnumber and names of people correspond with the class list and both are handedto the Program Manager at the beginning of the field day.
❒❒ CCoommpplleettee WWoollffttrreeee ccllaassss lliisstt. Include names of all attending students andadults. (There is also a ‘Wolftree Permission Slip’ check off space.)
CONTINUED-->
teacher responsibility checklist
INTRO 8
“Let nature be your teacher.”--William Wordsworth

❒❒ FFoorrmm tteeaammss. Program Managers will inform you howmany teams and how many students in each team.Prior to the field day, divide your students into WORKABLE and COOPERATIVE teams. Please do notallow students to form their own teams.
❒❒ IInnffoorrmm WWoollffttrreeee aabboouutt ssppeecciiaall nneeeeddss ssttuuddeennttss.Wolftree staff need to know about students with any medical issues (like allergies to bee stings) that maybe of concern during the field day. Also, inform usabout any physically, academically or behaviorally challenged students, and provide instruction as tohow we might accommodate them. If you have EnglishLanguage Learner students, we will try our best toprovide mentors with relevant language skills (NOTE:Only our Wildwood site is wheelchair accessible).
❒❒ PPrroovviiddee ssuuppppoorrtt. On the field day, we ask teachers to “float.” This providesyou with a great opportunity to observe your students in a unique setting andto observe, perhaps, new scientific and teaching approaches. You will be given aradio for the day, so that all mentors and Wolftree staff can communicate withyou. If a behavior issue does arise, we ask that you intervene.
❒❒ CCoommpplleettee PPrrooggrraamm EEvvaalluuaattiioonn. A Program Manager will provide you with aProgram Evaluation form at the end of the field day. It is MANDATORY thatyou complete and return a Program Evaluation within TWO WEEKS of your fieldday. We improve the program based on these evaluations, and it is a require-ment from our funders that we have all teachers comply.
❒❒ SSeenndd ““TThhaannkk YYoouuss”” ttoo mmeennttoorrss aanndd ffuunnddeerrss. Within a week of your field day,you will receive a post card in the mail with the addresses of the scientists whomentored your students, and of the funders who helped sponsor your field day.Direct recognition and appreciation from program participants is invaluable tothem and Wolftree’s future.
❒❒ IImmpplleemmeenntt SSeerrvviiccee LLeeaarrnniinngg. Our Watershed Ecology programs are designedto be either a springboard to, or a culmination of, inquiry-based ecology fieldstudies and research at your school or in your community. Please inform us ofservice learning projects in which your class is involved. We like to highlight service learning projects on our website and/or in our membership newsletter.Also, please let us know if you need any assistance. We’d love to help if we can!
❒❒ BBeeccoommee aa WWoollffttrreeee mmeemmbbeerr. Annually, Wolftree serves thousands of Pacific Northwest students through our award-win-ning programs free of charge. Approximately 80% of the schools wework with are designated as under-served, with little or no accessto quality science programs. Demand for Wolftree’s programs is fargreater than our current capacity. In addition, education reformscontinue to emphasize hands-on, experiential and community-basedlearning in the natural resources. Please become a Wolftree memberso that we can continue to offer valuable science education andresearch programs in the outdoors to students like yours. To joincall 503-239-1820 or go to www.beoutside.org/membership.
INTRO 9

Mentoring“Live with wolves, and you learn to howl.”
--Spanish Proverb
INTRO 10
A cornerstone of our programs is mentoring. Professional biologists, natural resource specialists, and individuals who enjoy working with young people guide field activitiesand get students excited about science and learning. Our mentors provide support tostudents through education, data collection and safety. Our student-to-mentorratios consistently range from 2:1 to 5:1, which provide excellent learning environments.
Responsibilities of a Wolftree Mentor:✔ GGeett TTrraaiinneedd. We ask that all new mentors attend a training session. If you areunable to make it, we ask that you spend a day in the field “shadowing” a Wolftree staffperson or seasoned mentor.
✔ BBee PPrreeppaarreedd. Before the field day, please review the appropriate sections in theEcology Field Guide (Ecological concepts and specified activity).
✔ AArrrriivvee oonn TTiimmee. Mentors are scheduled to arrive at the field site at least one hourbefore the students arrive (staff, interns, and capstone students arrive two hoursbefore students). During this time, you are briefed on the day’s participating class,program themes, safety protocols and other key information. Times are posted on ourwebsite: www.beoutside.org.
✔ GGuuiiddee. Experience has shown that the best way to mentor is to assist and support students’ learning experience. Students are expected to lead the scientific investigation. Facilitate this by asking leading questions, making helpful suggestions,infusing valuable information and encouraging inquiry. Work and co-learn with students, guiding their experience in the field with enthusiasm.
✔ RReeqquuiirree SSaaffeettyy. Demonstrate and explain appropriate and safe use of field equip-ment. Read and know safety protocols, and provide safety leadership and awarenessand model expected behavior (especially around water!).
✔ FFaacciilliittaattee PPrreesseennttaattiioonn PPrreeppaarraattiioonn. Help students organize and make sense oftheir data and prepare them to present findings to their classmates, teachers andmentors.
✔ WWrraapp--uupp && DDeebbrriieeff. Please plan to stay the entire time scheduled, including the wrapup presentation and the debriefing session that Wolftree staff hold after the students leave. This debriefing session is key to improving the program, as well as discussing with other mentors how things went, and how we all can improve our teaching skills.

Mentor GUIDELINES
INTRO 11
“Ideas...start with sense impressions; and all learning comes from making
connections among observations and ideas.”
--Kathleen Dean Moore, American Author
✴ Set a respectful tone from the beginning
✴ Establish clear expectations
✴ Foster team unity
✴ Challenge students to lead
✴ Inspire through encouragement
✴ Model behavior you seek
✴ Build upon what students know
✴ Engage with challenging questions
✴ Excite with fascinating facts and compelling stories
✴ Encourage critical and creative thinking
✴ Guide students to discover new meaning
✴ Practice safe and ethical science
✴ Effectively manage time
✴ Co-learn with students
✴ Be scientifically unbiased and use non-value laden language
✴ Take advantage of “teachable moments”
✴ Have fun!

the name“wolftree”
“Wolftree” is a forester’s term for remnantold-growth trees growing in an emergingforest. They grow without the bufferingeffect of neighboring trees and are oftensculpted by wind, lightning, snow and otherforces of nature. They often look like theyhave weathered many storms. Wolftreesstand out above the rest of the trees onthe landscape. They received their namebecause foresters once thought theyresembled lone wolves.*
Wolftrees are left alone by loggers,because so many limbs left many knots andpoor lumber quality. They have had little competition from neighbors, allowing themto grow quickly, with their branches reaching out in all directions and all the wayto the ground. This state of being is whatforesters call “free to grow.” Little prevents them from growing at theirfullest capacity. Today, biologists heraldwolftrees as the keystones of developingforests because they provide pockets ofseasoned refuge for wildlife and supply thelandscape with seeds for a new emergentforest.
We hope to instill wolftree characteristicsin our program participants -- enable themto stand out amongst their peers, weathermany storms, reach out in all directions,realize their maximum potential... be “freeto grow.”
*The term “lone wolf” came into use at a time whenpeople believed wolves to be solitary creatures.Since then, we have come to understand thatwolves live in complex social systems.
INTRO 12

ScienceInquiry
INTRO 13
Science inquiry is a process to help under-stand and investigate how the world works.It is an approach that involves an explorationof the world that leads to asking questionsand making discoveries in search for newunderstandings. Science inquiry requires youto puzzle through problems, seek multipleways of finding solutions, gather and weighevidence, and apply and test scientific ideas.
Science inquiry is not necessarily a straightand narrow pathway. It is often a back-and-forth, or a circular series of events, wheremore observations and questions emergealong the way. The process forges the opportunity for the construction of a newway of looking at the world, and a deeperunderstanding of how the world works. It also helps keep wonder and curiosity alive.
What is a hypothesis?
Observations give usanswers to
questions about theworld, but they
almost always giverise to still more
questions. When ascientist wants to
know the answer to avery specific
question, forming a hypothesis that canbe tested is usuallythe best way to find
the answer. A hypothesis is a
testable explanationfor an observation.
Often a hypothesis iscalled an educated
guess or a prediction.
“In spite of all our scientificadvances, we are only just beginning
to understand how ecosystemswork”
-- Dr. David Suzuki, 2004
“If you notice anythingit leads you to notice
more and more.”
-- Mary OliverAmerican Poet

HERE’S HOW SCIENCE INQUIRY WORKS:
BE CURIOUS. The inquiry process is driven bycuriosity and an interest to understand anobservation or solve a problem.
OBSERVE. Make observations of your surroundings usingall your senses. Pay attention to what you see, hear, smell,and feel. Notice things that intrigue or surprise you, thatbring about questions, or challenge your understanding ofthe world. Write about or sketch observations in a journalas a way to remember what you’ve experienced.
FORMULATE. Ask lots of questions about your observations and thenfocus on the one question or develop one hypothesis that you are mostinterested in. Make sure that it is clear, simple and testable.
DESIGN AN INVESTIGATION. Use your creativity todesign a method for collecting data to answer yourquestion or determine whether or not your hypothesis is correct.
COLLECT & RECORD DATA. Conduct your investigationand gather data. Continue to record observations,raise questions, make predictions, and create theories.Often the process of answering a question leads tomore questions.
MAKE SENSE OF YOUR DISCOVERIES. Organize, categorize, analyzeand interpret what you found so that you can answer your question orconfirm your hypothesis. Draw upon as many resources as you can, suchas field guides, the expertise or insights of others, websites and/or ref-erence materials.
COMMUNICATE. Tell people about your discoveries and conclusions. Use multiple ways of communicating - make models, use pictures, graphs,charts, photos, maps, or poetry. Discuss with others their findings.Make comparisons and connections.
FOLLOW UP. Giving meaning to the inquiry experience requires continuedreflection, conversations, and comparisons of findings with others.
INTRO 14
To learn more about science inquiry visit the Institute forInquiry’s website at www.exploratorium.edu/IFI/index.html
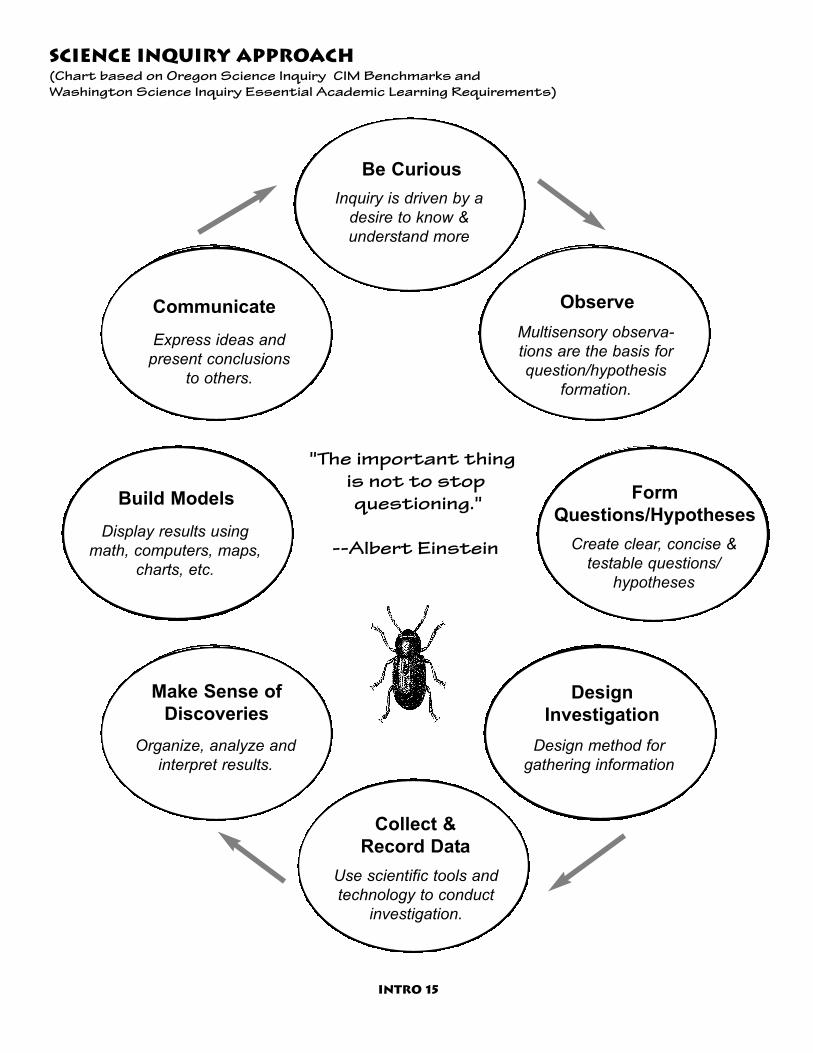
"The important thing is not to stopquestioning."
--Albert Einstein
Science Inquiry approach(Chart based on Oregon Science Inquiry CIM Benchmarks and Washington Science Inquiry Essential Academic Learning Requirements)
INTRO 15
Inquiry is driven by adesire to know & understand more
Use scientific tools andtechnology to conduct
investigation.
Collect &
Record Data
Design
Investigation
Build Models
Display results usingmath, computers, maps,
charts, etc.
Be Curious
Form
Questions/Hypotheses
Create clear, concise &testable questions/
hypotheses
Make Sense of
Discoveries
ObserveCommunicate
Express ideas and present conclusions
to others.
Multisensory observa-tions are the basis forquestion/hypothesis
formation.
Design method for gathering information
Organize, analyze andinterpret results.

theEcologicalSystemEcology
The word eeccoollooggyy is from the Greekroot “oikos,” meaning “house.”Simply put, ecology is the study ofhouses or habitats, or more broadly,of organisms and their relationshipsto their environment. The modernscientist defines ecology as “thestudy of the structure and functionof nature.”
Ecosystem
An ecological system, eeccoossyysstteemm,includes all the different organisms living in a certain area, along withtheir physical environment. While“eco” refers to environment, “system” refers to a collection ofrelated parts that work as a whole.Some parts in an ecosystem areaabbiioottiicc, or non-living, such as solarenergy, water, rock, and minerals(chemical and physical components).Other parts are bbiioottiicc, or living, suchas plants and animals (biological).The ecosystem is the place whereabiotic and biotic parts interact.Ecosystems are dynamic and complex. They change over time and space.
ec 1
BIOTIC
ABIOTIC
“I go to Nature to besoothed and healed,
and to have my senses put
in tune once more.”
--John Burroughs (1837-1921)
American Naturalist
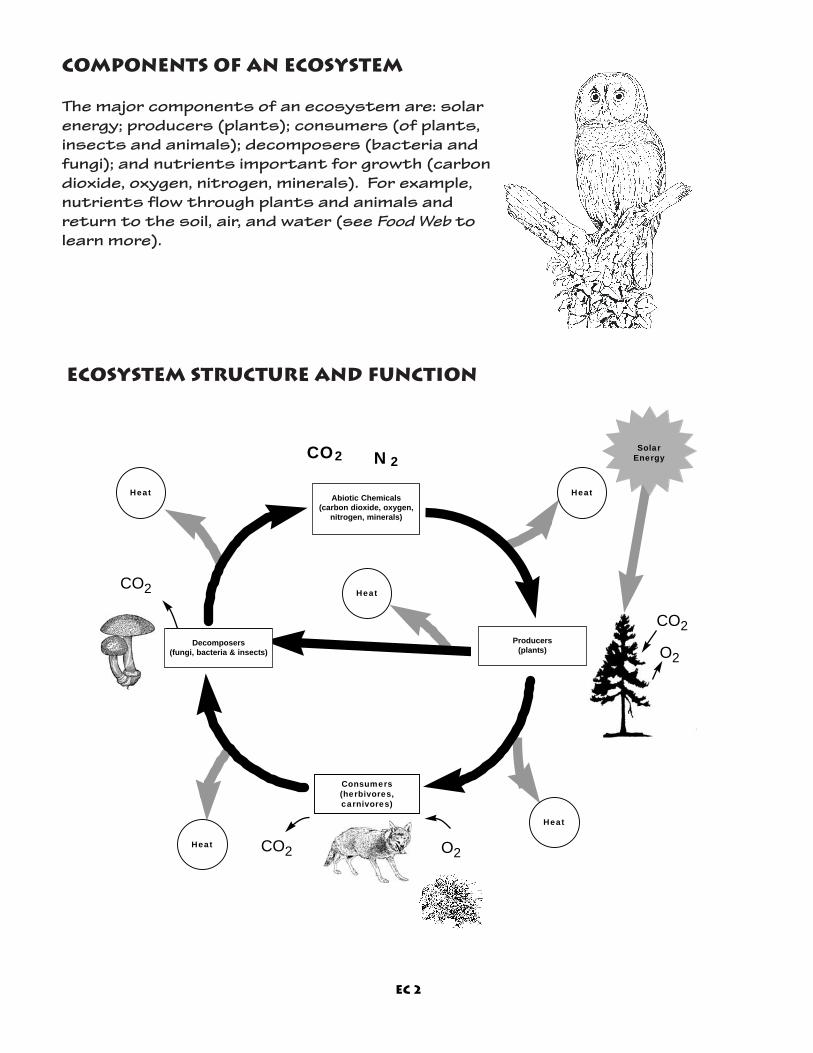
components of an ecosystem
The major components of an ecosystem are: solarenergy; producers (plants); consumers (of plants,insects and animals); decomposers (bacteria andfungi); and nutrients important for growth (carbondioxide, oxygen, nitrogen, minerals). For example, nutrients flow through plants and animals andreturn to the soil, air, and water (see Food Web tolearn more).
Ecosystem Structure and Function
Abiotic Chemicals(carbon dioxie,
oxyegen, nitrogen,minerals)
Consumers(herbivores,carnivores)
Decomposers
(baceria, fungi)
SolarEnergy
Heat Heat
Heat
Heat
Heat
CO2 N 2
O2
Producers
(plants)
CO2
CO2
CO2
O2
O2
ec 2
Abiotic Chemicals (carbon dioxide, oxygen,
nitrogen, minerals)
Producers(plants)
Decomposers(fungi, bacteria & insects)

Species and their Habitats
Biologists examine the biotic parts of an ecosystem as species, their habitats, populations, and communities. A ssppeecciieess is the smallest unit ofclassification for biological organisms. Individuals of a species are alike instructure and function. IInnddiivviidduuaallss of the same species can successfullybreed with each other. Each species needs specific conditions to surviveand reproduce. The place or location where an organism can meet theseneeds is called its hhaabbiittaatt. Habitat can be described in terms of its structure. Habitat structure describes the shape, size and placement ofabiotic and biotic features of an ecosystem. Because these non-living andliving features change over time, so will the habitat structure.
When Species Come Together
A group of individuals of the same species that live in a particular habitatare called a ppooppuullaattiioonn. Different populations of species exist together in overlapping habitats in a ccoommmmuunniittyy. Several different complex communities mix together creating an eeccoossyysstteemm.
FOR EXAMPLE:Consider a Douglas-Fir tree (individual). The tree captures sunlight anduses water and soil nutrients to grow. The tree makes seeds incones to reproduce, creating other Douglas-Fir trees (population).Other organisms that live on/in/off/with the Douglas-Fir that are tolerant of shade can grow and reproduce in the understory, belowthe Douglas-Fir tree (community). The Douglas-Fir trees, understoryplants, and other organisms are part of the forest (ecosystem).
Individual
Ecosystem
Community
Population
ec 3

niches
The way of life a species pursues within its habitat is called a nniicchhee. Inother words, a niche is the role a species plays in its habitat. An organism’s niche is composed of both biotic and abiotic parts. Somebiotic factors that help define a niche are food sources and predators.Each species needs a specific types of food, such as insects or a speciesof plant. Temperature, the amount of sunlight and water are abiotic factors. All the biotic and abiotic factors taken together help define theorganism’s niche.
Within a niche, a species satisfies its basic needs in four specific categories (there may be others as well, like space):
FOOD, WATER , SHELTER AND REPRODUCTION
An organism’s niche includes how much water itneeds, what it eats, where it lives, what it uses forshelter from enemies and the elements, when andhow it reproduces, how it raises its young and othersuch factors that make up its life. Some animalshave very broad niches, like black bear. Black bearare ggeenneerraalliissttss that eat a wide variety of plantsand animals and can find food and water in a widerange of environments. Some niches are very narrow like the Lynx’s. At times, this ssppeecciiaalliisstt willfeed exclusively on snowshoe hares, thus limitingwhere it can live, reproduce and rear its young.
What do you think happens when two species try toshare the same niche in the same habitat?
Loose Boundaries
Because some organisms can moveamong ecosystems, it can be difficultto define the boundaries of an ecosystem. However, defining anecosystem with loose boundaries mayhelp us better understand how thenatural world works.
For example, frogs generally repro-duce in a wetland ecosystem, but mayalso live in a forest ecosystem. Thewetland ecosystem serves as breedinghabitat and the forest ecosystem isimportant for rearing habitat.
ec 4
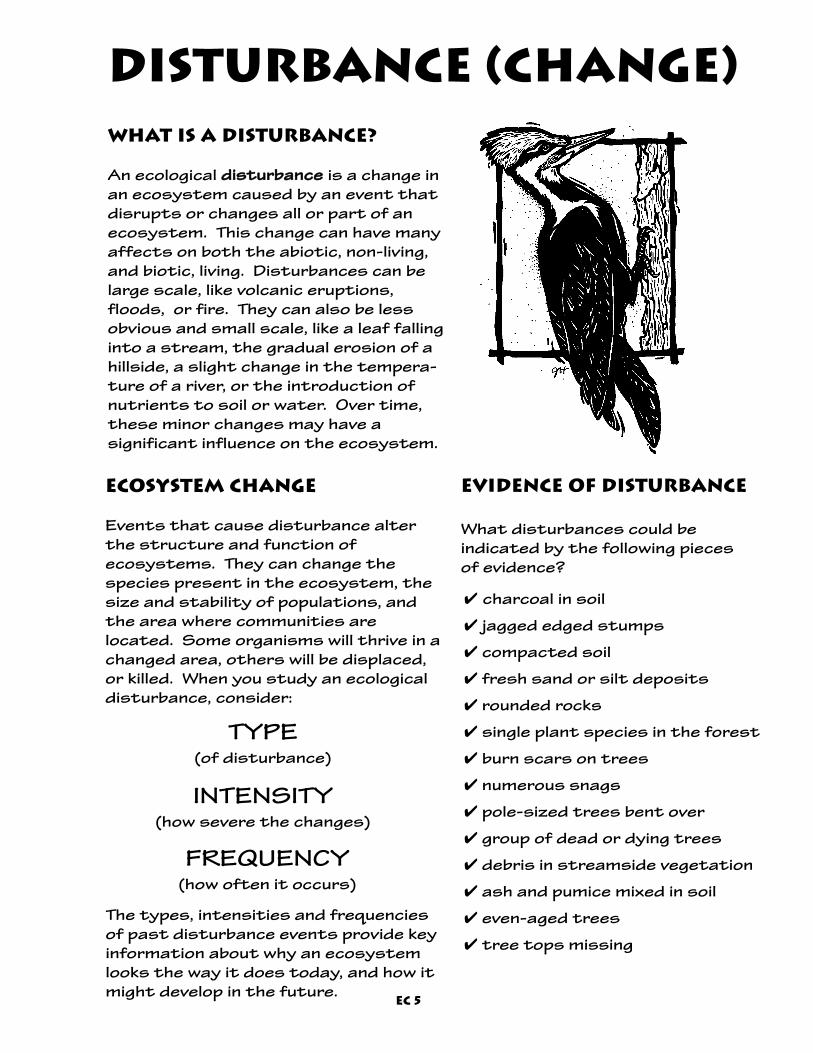
Disturbance (change)What is a disturbance?
An ecological ddiissttuurrbbaannccee is a change inan ecosystem caused by an event thatdisrupts or changes all or part of anecosystem. This change can have manyaffects on both the abiotic, non-living,and biotic, living. Disturbances can belarge scale, like volcanic eruptions,floods, or fire. They can also be lessobvious and small scale, like a leaf fallinginto a stream, the gradual erosion of ahillside, a slight change in the tempera-ture of a river, or the introduction ofnutrients to soil or water. Over time,these minor changes may have a significant influence on the ecosystem.
ecosystem change
Events that cause disturbance alterthe structure and function of ecosystems. They can change thespecies present in the ecosystem, thesize and stability of populations, andthe area where communities are located. Some organisms will thrive in achanged area, others will be displaced,or killed. When you study an ecological disturbance, consider:
TYPE(of disturbance)
FREQUENCY(how often it occurs)
INTENSITY (how severe the changes)
The types, intensities and frequenciesof past disturbance events provide keyinformation about why an ecosystemlooks the way it does today, and how itmight develop in the future.
Evidence of Disturbance
What disturbances could be indicated by the following piecesof evidence?
✔ charcoal in soil
✔ jagged edged stumps
✔ compacted soil
✔ fresh sand or silt deposits
✔ rounded rocks
✔ single plant species in the forest
✔ burn scars on trees
✔ numerous snags
✔ pole-sized trees bent over
✔ group of dead or dying trees
✔ debris in streamside vegetation
✔ ash and pumice mixed in soil
✔ even-aged trees
✔ tree tops missing
ec 5

Looking for disturbance
Consider how types of disturbances may havearranged, destroyed, removed or added different biotic components - such as theplants, soil, animals and insects - in the ecosystem that you are studying. Also, consider how the abiotic components havechanged - such as the rocks, water, light, temperature - as a result of the disturbances.How would a large fire that burns all the treesin a forest be different from the harvesting oftrees (clearcut)? How would organismsrespond in an ecosystem that is regularly disturbed? How would the structure of a habitat change in the absence of a disturbance?
disturbance and succession
Change is a fact of life in all ecosystems, andliving things respond to change in differentways. As an ecosystem changes, the community living in that ecosystem changesas well.
Consider the devastation on Oregon CoastRange forest ecosystems during the series ofmassive fires (1933, 1939, 1945 and 1951)called the Tillamook Burn. After the flamesand smoke dissipated, leaving a charred land-scape, organisms moved into this devastatedhabitat almost immediately. These communities sprouted from charred stumpsor root crowns, or grew from seeds well-adapted to withstand intense heat. Thesefirst organisms were followed by othersbrought in by wind and wildlife. Fast-growinggrasses and non-woody plants were followedby larger shrubs. Fast-growing trees, likeDouglas-fir, then crowded out the shrub community. SSuucccceessssiioonn is a pattern ofchanges in the types of species in a community over time. Many describe this as aseries of steps towards a final destinationwhile others consider succession to be aprocess or a cycle with no end or beginning.One description is linear while the other is circular.
ec 6

2-5 years
Grass ForbMeadow
3-30 years
Shrubs
10-35 years
MixedDeciduousw/ YoungConifer
30-80 years
MixedConiferTopping
Deciduous
80-250 years
ConiferForest
250years
OldGrowthForest
CHANGES IN A FOREST COMMUNITY OVER TIME 1
Immature Forest Community Maturing Forest Community
Disturbing Questions:
What natural event in May 1980 caused major disturbance in a large areaof Washington state? How did that event change the biotic and abiotic components of ecosystems in the region? How could the event havechanged ecosystems all over the world?
What major event in 1996 resulted in changes to many local stream ecosystems? How did that event change the biotic and abiotic parts ofecosystems in the region? How could the event have changed ecosystems all the way down to the ocean?
What natural and human disturbances have occurred in the last ten yearsin your area?
What disturbances might occur in a natural grassland on the plains ofSouth Dakota? In a suburban backyard lawn?
1 Note: this is a simple description (model) tohelp illustrate a complex process. In nature, there may be numerous variations of this theme.
ec 7

food WebThe Transfer of Energy
A food chain is defined as the one-way transfer of energy fromone organism to another in anecosystem. Food chains aredescribed using ttrroopphhiicc lleevveellss. A trophic level is a category oforganisms classified by what theyeat.
A food chain begins with the transfer of energy from the sun, which ismade into food by primary producers. Plants are usually the PRIMARYPRODUCERS that make up the first trophic level. The next trophic levelis made up of FIRST LEVEL CONSUMERS, or plant-eaters, called hheerrbbiivvoorreess. The next trophic level is made up of animals that feed on herbivores and are called ccaarrnniivvoorreess. Animals in this trophic level arecalled SECOND LEVEL CONSUMERS. The next trophic level is made up ofanimals that eat other carnivores and are called THIRD LEVEL CONSUMERS. Organisms that receive energy from recycling nutrients byeating dead organisms are called ddeettrriittiivvoorreess or decomposers.
ENER
GY
ENER
GY ENERGY
ENERGY
ENERGY
PRIMARY PRODUCERS,
plants
FIRST TROPHICLEVEL
CONSUMERS,herbivores
DECOMPOSERS,detritivores
THIRD TROPHICLEVEL
CONSUMERS,carnivores
SECOND TROPHICLEVEL
CONSUMERS,carnivores
A FOOD CHAIN
ec 8
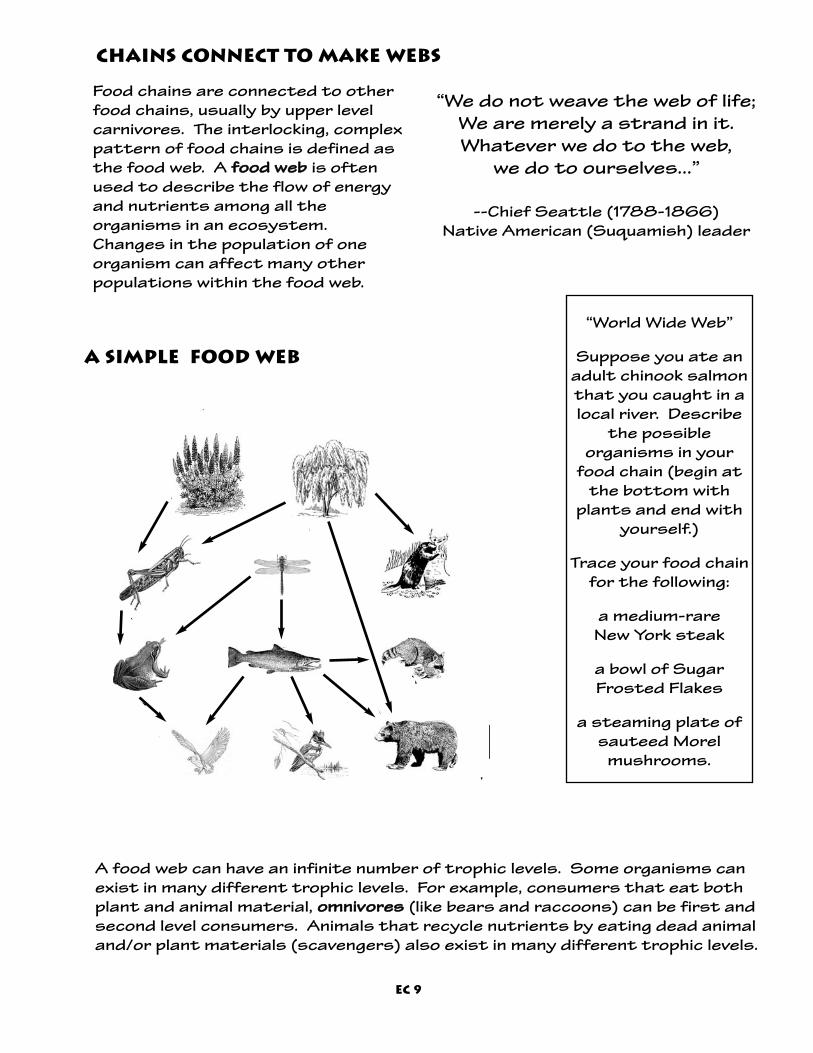
Chains Connect to Make Webs
Food chains are connected to otherfood chains, usually by upper level carnivores. The interlocking, complexpattern of food chains is defined asthe food web. A ffoooodd wweebb is oftenused to describe the flow of energyand nutrients among all the organisms in an ecosystem.Changes in the population of oneorganism can affect many other populations within the food web.
A food web can have an infinite number of trophic levels. Some organisms canexist in many different trophic levels. For example, consumers that eat bothplant and animal material, oommnniivvoorreess (like bears and raccoons) can be first andsecond level consumers. Animals that recycle nutrients by eating dead animaland/or plant materials (scavengers) also exist in many different trophic levels.
“We do not weave the web of life;We are merely a strand in it.Whatever we do to the web,
we do to ourselves...”
--Chief Seattle (1788-1866)Native American (Suquamish) leader
“World Wide Web”
Suppose you ate anadult chinook salmonthat you caught in alocal river. Describe
the possible organisms in your
food chain (begin atthe bottom with
plants and end withyourself.)
Trace your food chainfor the following:
a medium-rare New York steak
a bowl of SugarFrosted Flakes
a steaming plate ofsauteed Morel
mushrooms.
a simple food web
ec 9

adaptationWhat is adaptation?
An aaddaappttaattiioonn is a characteristic that may help organisms survive and reproduce in their environment.Adaptations can be genetic or learned.
Adaptations may occur to an organism’s:
BEHAVIORBODY STRUCTUREBODY PROCESSES
COLOR
For example, if an ecosystem haslong, cold winters, a species mayhibernate (a behavioral adaptation),have thick fur (a body structureadaptation), or have the ability tostore a lot of fat (a body processadaptation). Animals that live in asnowy environment, like the snow-shoe hare, become white in winter,to provide them ccaammoouuffllaaggee from predators (a color adaptation).
The characteristics of plants and animals offer great insight
to the physical and biologicalconditions of the ecosystem.
Natural selection and evolution
Charles Darwin, an English naturalist, proposed that the environment has a strong influenceover which individuals have off-spring. Some individuals, becauseof certain traits, are more likely tosurvive and have offspring thanother individuals. He used the termnnaattuurraall sseelleeccttiioonn to describe theunequal survival and reproductionthat results from the presence orabsence of particular traits. Darwinfurther proposed that over manygenerations, natural selectioncauses the characteristics of populations to change. A change inthe genetic characteristics of populations from one generation tothe next is known as eevvoolluuttiioonn.According to Darwin’s theory, theprocess of natural selection isresponsible for evolution.
ec 10

PLANTS that experience drought (wateror heat stress), like cacti, usually havesome or all of the following characteristics:
examples of species adaptation
Some aquatic INSECTS, like mayflies, haveadapted to live in fast-moving water. Theyhave:
TThhiicckk lleeaatthheerryy eevveerrggrreeeenn lleeaavveessRReedduucceedd lleeaaff aarreeaaDDeeeepp rroooott ssyysstteemmssTThhiicckk wwhhiittee hhaaiirr oorr wwaaxx oonn tthheeiirr lleeaavveess..
These adaptations help reduce water loss,increase heat loss and/or reduce theamount of light absorbed by the leaf.
FFllaatt bbooddiieessCCllaawwss wwiitthh hhooookkss
These adaptations allow water to flow overthe insects and help them cling to rocks in aswift current.
ANIMAL species that are often prey, likerabbits, evolved to have:
LLaarrggee eeaarrss tthhaatt ccaann ppooiinntt iinn aallll ddiirreeccttiioonnssEEyyeess llooccaatteedd oonn tthhee oouuttssiiddee ooff tthheeiirr hheeaaddAA llooww bbooddyy pprrooffiillee wwhheenn oonn aallll ffoouurr lleeggssTThhee aabbiilliittyy ttoo ssttaanndd uupprriigghhtt oonn llaarrggee rreeaarrlleeggss
These adaptations give rabbits a keensense of hearing, great peripheral vision,the ability to hide easily and stand uprightto scope out potential danger.
ec 11

species adaptations - Northern flicker
Flight takes an enormous amount of energy.
Birds have a very high metabolic rate - the speed
at which they can burn upfood and turn it into energy.
To survive in cold temperatures at a high altitude, birds have the
highest body temperaturesof all warm-blooded animals -up to 110o F, compared with
98.6oF in humans.
Birds have to stay withinstrict weight limits if they
are to be able to fly. They dothis with a lightweight
skeleton. The long bones offlying birds are hollow and are
reinforced with light weightinternal supports.
Birds have more neckbones than most othervertebrate animals. A
bird needs a flexible neckso that it can catch itsfood and also reach allparts of its body forpreening (cleaning).
Highly insulatingplumage (feathers)
keeps birds from losingtoo much heat.
Birds have no teeth. Thedigestive system has to
break down all the food. Inbirds that eat plant
matter, the gizzard grindsthe food into a pulp.
The secret of birds success in flying lies in
the design of their wings,which are light, strong,
and flexible. They arealso slightly curved fromfront to back, producing
an airfoil profile that pullsthe bird upward as itflaps through the air.
A Northern Flicker’s longtail is used for balance,
perching, and for attracting the attention
of a mate.
Norther Flickers call aloud “kekekekeke” for
territory advertisement.During courtship they
sing “woikawoikawoika” inaddition to drumming,wing and tail flashing,
billing and bobbing.
Woodpeckers, like theNorthern Flicker, have
feet with two toes pointing forward, and twopointing backward. This
toe arrangement helpsto anchor them onto
tree trunks and branches.
Northern Flickers are atype of woodpecker.
Woodpeckers use theirpointy beaks to pick large
insects out of tree andground crevices. Their long
tongues have spear-liketips that are used for
stabbing their prey.
Birds have good hearing.They can distinguish notes
that are far too fast forhumans to separate.
Birds’ sense of vision is highly developed to
pursue food and avoid predators.
ec 12
species relationshipsHow species get along
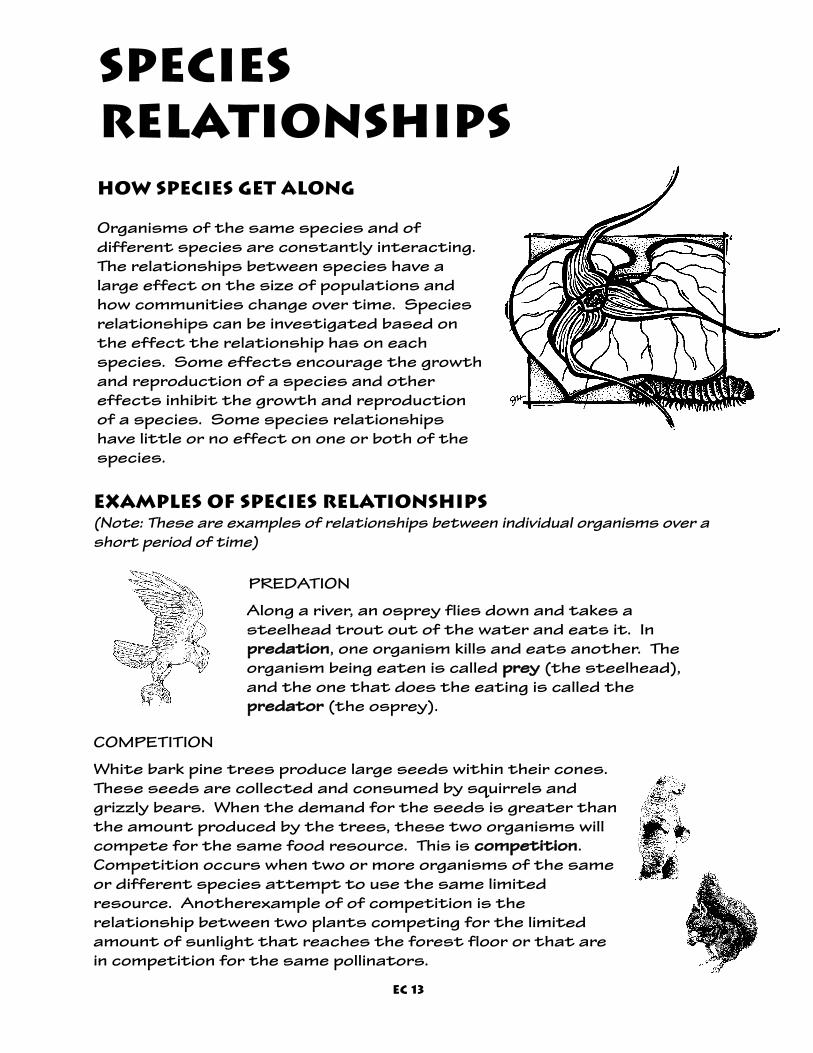
Organisms of the same species and of different species are constantly interacting.The relationships between species have alarge effect on the size of populations andhow communities change over time. Speciesrelationships can be investigated based onthe effect the relationship has on eachspecies. Some effects encourage the growthand reproduction of a species and othereffects inhibit the growth and reproductionof a species. Some species relationshipshave little or no effect on one or both of thespecies.
ec 13
examples of species relationships(Note: These are examples of relationships between individual organisms over ashort period of time)
PREDATION
Along a river, an osprey flies down and takes a steelhead trout out of the water and eats it. In pprreeddaattiioonn, one organism kills and eats another. Theorganism being eaten is called pprreeyy (the steelhead),and the one that does the eating is called the pprreeddaattoorr (the osprey).
COMPETITION
White bark pine trees produce large seeds within their cones.These seeds are collected and consumed by squirrels and grizzly bears. When the demand for the seeds is greater thanthe amount produced by the trees, these two organisms willcompete for the same food resource. This is ccoommppeettiittiioonn.Competition occurs when two or more organisms of the sameor different species attempt to use the same limitedresource. Anotherexample of of competition is the relationship between two plants competing for the limitedamount of sunlight that reaches the forest floor or that arein competition for the same pollinators.

MUTUALISMA honey bee is feeding on flower nectar. While thebee flies and eats from different flowers, it transfers pollen from one plant to another of thesame species. While the bee pollinates the flowers,the flower provides a food source for the bee. Bothspecies benefit. This is mmuuttuuaalliissmm.
COMMENSALISMA lichen attaches itself to the trunk or branch of atree. The lichen enjoys a place to capture light, feedon nutrients from the air and receive moisture fromwater running down the tree. Although the tree provides resources for the lichen, the tree is unaffected. One species has benefitted and theother is neither harmed nor helped. This is ccoommmmeennssaalliissmm.
PARASITISM
The tick, a small arthropod, lives on the skin of somespecies of mammals such as mice, deer and chip-munks. The tick bites through the mammal’s skin andeats the blood. The tick swells with the blood andfalls off. The tick itself does not usually kill the hostmammal. This is ppaarraassiittiissmm. The key difference inthis relationship is that unlike predation, the parasite gets resources from its host withoutimmediately killing it. The organism the parasitetakes its nourishment from is known as the hhoosstt.
ec 14
Two trees are growing next to each other in the forest. They are the sameheight and their branches are growing into each other.
You are at a lake in the late afternoon. You notice fish rising to the surfaceto eat insects.
A mosquito begins to suck blood from your arm. You grab it and eat it. Isthis parasitism, predation, cannibalism, all of these? (Hint: You are eatinghuman blood).
Name thatRelationship

habitat & speciesdiversityWhat is habitat diversity?
HHaabbiittaatt ddiivveerrssiittyy refers to the variety ofdifferent places for organisms to livewithin an ecosystem. Habitat diversity isoften determined by the types andarrangement of plant species, soil types,bodies of water and landforms (cliffs,rocky outcrops, etc.).
What is species diversity?
SSppeecciieess ddiivveerrssiittyy is the variety of species inan ecosystem. There are two important components of species diversity: richnessand evenness. Species rriicchhnneessss refers to the number of species in an ecosystem. Specieseevveennnneessss is determined by comparing the numbers of individuals within each species.An ecosystem with a similar number of individuals of many species is considered tohave high richness and high evenness. Anecosystem with only a few species, but equalnumbers of individuals per species, is considered to have low richness and highevenness. Low evenness occurs when somespecies have many individuals, and somespecies have few.
You are standing in your back-yard watching about 50 birds.You determine that there are
four small black-speckled birds(starlings), one large blue bird
(scrub jay) and 45 pigeons. Is this high or low species
richness? Evenness? Why?
You are surveying plants in awetland community. At the end of the survey, you have
recorded:
10 species of aquatic grasses3 species of algae8 species of aquatic shrubs5 species of wetland trees.
There are between two and fiveindividuals of every species. Is
this high or low species richness? Evenness? Why?
Diverse Populations?
SEE CHART ON NEXT PAGE-->
ec 15

High and low diversity
Different habitats provide food and shelter for many different species.Therefore, ecoystems with high habitat diversity often have high species diversity. An ecosystem with few habitat types may support a lowerspecies diversity.
diversity and ecosystem stability
Species diversity helps determine the stability of an ecosystem. Eachspecies differs in its ability to survive. Some species may be more well-suited to conditions after a disturbance or may even require a disturbance to exist. A diverse community is often able to recover morequickly from disturbance.
High Richness & High Evenness
Low Richness & High EvennessHigh Richness & Low Evenness
ec 16

field studies
CCOONNTTEENNTTSS FFOORR TTHHIISS SSEECCTTIIOONN::
field 1
GGeenneerraall FFiieelldd PPrroocceedduurreess FFiieelldd 22 SSttaannddaarrdd FFiieelldd EEqquuiippmmeenntt FFiieelldd 44FFiieelldd JJoouurrnnaalliinngg FFiieelldd 55SScciieennccee IInnqquuiirryy PPllaannnniinngg FFoorrmm FFiieelldd 88GGeettttiinngg aa RReepprreesseennttaattiivvee SSaammppllee FFiieelldd 99TTeerrrreessttrriiaall IInnvveerrtteebbrraatteess FFiieelldd 1155WWiillddlliiffee EEccoollooggyy FFiieelldd 2266FFoorreesstt EEccoollooggyy FFiieelldd 3377PPllaanntt EEccoollooggyy FFiieelldd 4499LLiicchheenn EEccoollooggyy FFiieelldd 6677AAqquuaattiicc IInnvveerrtteebbrraatteess FFiieelldd 7799WWaatteerr CChheemmiissttrryy FFiieelldd 9900SSttrreeaammffllooww FFiieelldd 111122WWeettllaanndd EEccoollooggyy FFiieelldd 112211
"Must we always teach our children with books? Let them look atthe mountains and the stars above. Let them look at the beautyof the waters and the trees and flowers on earth. They will thenbegin to think, and to think is the beginning of a real education."
--David Polis
for all modules
(1) Get to kknnooww yyoouurr tteeaamm. Find out about anyhealth concerns. Make sure everyone has food,water and appropriate clothing.
(2) DDiissttrriibbuuttee sscciieennttiiffiicc eeqquuiippmmeenntt. Discussequipment care and safety .
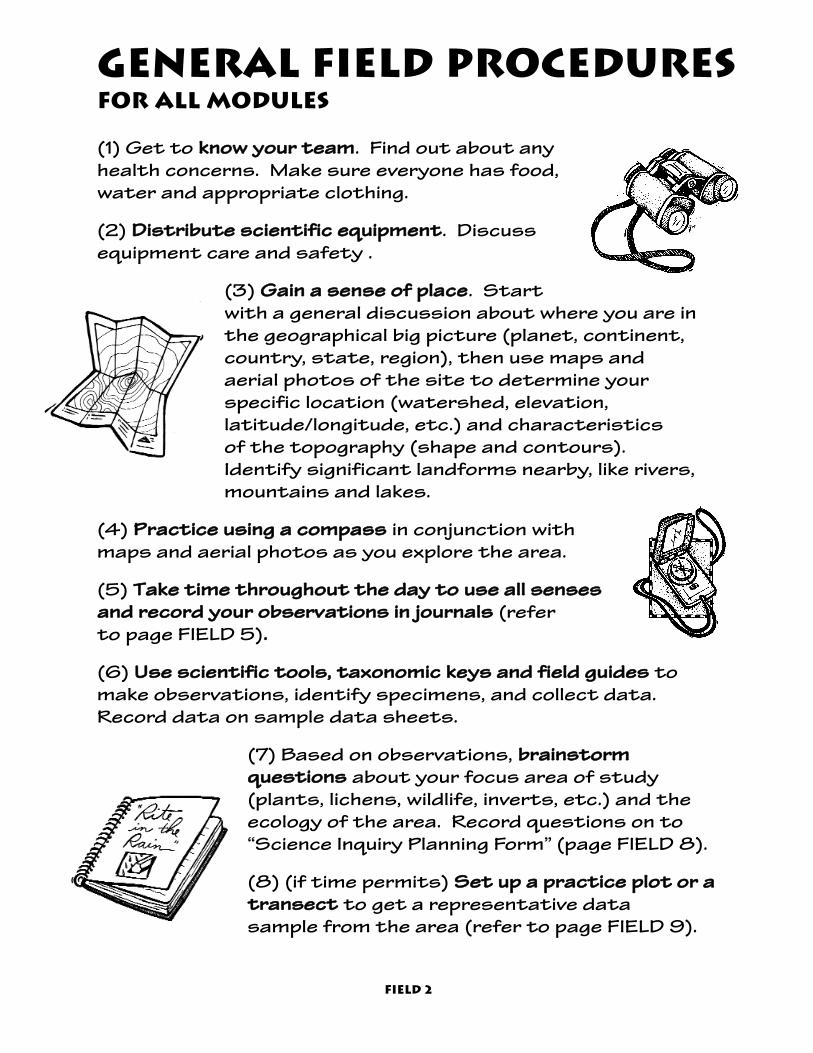
(3) GGaaiinn aa sseennssee ooff ppllaaccee. Startwith a general discussion about where you are inthe geographical big picture (planet, continent, country, state, region), then use maps and aerial photos of the site to determine your specific location (watershed, elevation, latitude/longitude, etc.) and characteristics of the topography (shape and contours). Identify significant landforms nearby, like rivers,mountains and lakes.
(4) PPrraaccttiiccee uussiinngg aa ccoommppaassss in conjunction withmaps and aerial photos as you explore the area.
(5) TTaakkee ttiimmee tthhrroouugghhoouutt tthhee ddaayy ttoo uussee aallll sseennsseessaanndd rreeccoorrdd yyoouurr oobbsseerrvvaattiioonnss iinn jjoouurrnnaallss (refer to page FIELD 5)..
(6) UUssee sscciieennttiiffiicc ttoooollss,, ttaaxxoonnoommiicc kkeeyyss aanndd ffiieelldd gguuiiddeess tomake observations, identify specimens, and collect data.Record data on sample data sheets.
(7) Based on observations, bbrraaiinnssttoorrmm qquueessttiioonnss about your focus area of study(plants, lichens, wildlife, inverts, etc.) and theecology of the area. Record questions on to“Science Inquiry Planning Form” (page FIELD 8).
(8) (if time permits) SSeett uupp aa pprraaccttiiccee pplloott oorr aattrraannsseecctt to get a representative data sample from the area (refer to page FIELD 9).
field 2
General Field procedures

(9) Record any more questions that comeup. As a team, decide which question is themost interesting and testable given yourequipment and time constraints. Turn thefocus question into a cclleeaarr,, ccoonncciissee aannddtteessttaabbllee hhyyppootthheessiiss. Record the hypothesisonto the “Science Inquiry Planning Form.”
(10) DDeessiiggnn aann iinnvveessttiiggaattiioonn to test yourhypothesis. Make sure to control your variables by using measured plots, timewindows, etc. Consider fieldwork time con-straints. If necessary, create your owndata sheets that will help you efficientlyand effectively record your data.
(11) CCoonndduucctt yyoouurr iinnvveessttiiggaattiioonn.. Collect and record data.
(12) OOrrggaanniizzee,, aannaallyyzzee aanndd iinntteerrpprreett yyoouurr ddaattaa. Come to conclusions about your hypothesis. Use field guides to identify specimens.
(13) CCrreeaattee vviissuuaall ddiissppllaayyss ttoo explain your experiment and toshow the results of your investigation. You may use charts,graphs, tables, maps, profiles/transects, specimen examplesand/or sketches, and include the scientific tools used to collect and record your data.
(14) DDeevveelloopp aa tteeaamm pprreesseennttaattiioonn using your visual displaysand clear verbal communications. Make sure your presentation:• Gives all team members an opportunity to participate;• Has a logical and coherent introduction,
body and conclusion; and• Is completed within the allocated time.
(15) DDeelliivveerr pprreesseennttaattiioonn to fellow scientists. After your presentation,respond to questions and make connectionsto the discoveries of other teams.
(16) CCoolllleecctt aallll eeqquuiippmmeenntt. field 3

standard field equipmentfor all modules
✓ Calculators
✓ Clip Boards
✓ Compasses
✓ Field Guides
✓ First Aid Kit
✓ Flagging
✓ Hand Lenses
✓ Hand Sanitizer
✓ Journals
✓ Pencils
✓ Rulers
✓ Sample Data Sheets
✓ Science Inquiry Planning Form
✓ Specimen Bags & Containers
✓ Site Aerial Photos
✓ Site Maps
✓ Tadem
✓ Tape Measure
✓ Two-Way Radio
✓ Whistle
field 4

field journalingguidelines & techniques
A field journal is essential to a scientist'sfieldwork. Humans have kept field journalsfor centuries. The classic journals of Lewisand Clark, Henry David Thoreau, John Muir,Aldo Leopold, Ann Zwinger, and EdwardAbbey are priceless records that teach usmuch about the natural world.
Part of the appeal of field journaling lies in its flexibility. There are asmany ways to keep a field journal as there are people who keep them.Some people prefer to make precise scientific observations with charts,lists and labels, while others will write long, detailed descriptions. Othersuse poetry or prose to record their views of nature. Still others drawwhat they see. Perhaps field journals reach their full potential when they combine all of these ingredients.
Field journals can be in whatever language you are most comfortable with,and correct spelling and complete sentences should not be a worry. Noone else needs to see what you put in your journal. You can even takeyour journal pages home with you if you’d like.
The PPUURRPPOOSSEE of keeping a field journal on a Wolftree field day is to:
•• MMaakkee oobbsseerrvvaattiioonnss,, ggaatthheerr eevviiddeennccee aanndd iinnffoorrmmaattiioonn •• JJoott ddoowwnn qquueessttiioonnss,, iiddeeaass,, tthhoouugghhttss aanndd tthheeoorriieess •• RReeccoorrdd sscciieennttiiffiicc ddaattaa•• CCrreeaattiivveellyy eexxpprreessss oonnee’’ss sseellff
field 5

FFIIEELLDD JJOOUURRNNAALLLLIINNGG GGUUIIDDEELLIINNEESS::
• Before journaling, be sure to move away from theother groups and get to a natural area where youlikely will begin your field studies.
• Before putting pencil to paper, take several minutes to stop, close your eyes, take some deepbreathes, listen, smell, feel, and then look aroundfor a while - awaken your senses and shut out distractions.
• Start with a title page that includes your name, the date, time, siteand general weather conditions.
• The initial journal time is primarily designed to get in tune with the natural world and to get all the senses going. For this time, consider thefive S’s: (1) Safe Spot, (2) Sit, (3) Silence, (4) Solitude, and (5) Senses.
• Often, a field journal is a tool for remembering some of the details of aparticular plants, rocks, insects, wildlife sign, etc. that you encounterthroughout your day. This allows you to then use field guides and/or reference books later to learn more. With whatever you are examining,write down specific details about the organism or object, like color, texture, shape, patterns and markings. Make sketches and include lotsof arrows pointing out these details. Be sure to include measurements.Use descriptive language that vividly tells the story of the sounds,smells, characteristics, and structure. This will allow you to accurately trigger your memory when you refer to your journal later.
field 6

field 7
FFooccuusseedd JJoouurrnnaall AAccttiivviittyy EExxaammpplleess::
SSOOUUNNDD MMAAPPPPIINNGG
Put a dot in the middle of your journal pageto represent yourself. Draw two or three circles around the dot. Listen carefully towhat you hear surrounding you. When youhear something (wind, bird, airplane, etc.)mark on the map approximately where youheard it. Use symbols to represent whatyou heard.
BBLLIINNDD CCOONNTTOOUURR DDRRAAWWIINNGG
When making a blind contour drawing, the eye is not watching the hand asit draws on the paper. Contour drawing trains your eye to draw what itsees rather than what it thinks it sees, thus challenging you to carefullyobserve the subject. You will be surprised at how accurate these drawings can be.
FFIIRRSSTT PPEERRSSOONN OOBBJJEECCTT
Write as if you are the object or organism that you are observing, like atree, frog, or rock. What do you see, feel, hear, sense? What is your personality like? Who are your friends? Who are your enemies? Fromwhere do you get your energy? What is your life cycle? Another relatedactivity is to write a biography of a subject you are observing.
SSEENNSSOORRYY EEXXPPLLOORRAATTIIOONN
You can do a broad exploration of the senses. What do you see, smell,feel, hear, taste (can be figurative) around you? Or, you can focus on asubject and describe what it looks like, feels like, smells like, sounds like,and, perhaps, even tastes like.
SSKKEETTCCHHIINNGG FFRROOMM MMEEMMOORRYY
Closely observe a subject and then walk away from it until it is out ofsight. Sketch the subject from memory. Go back and look to see how youdid. You may choose to modify the drawing. Continued practice sketch-ing by memory will improve your observational skills.
TTIIMMEELLIINNEE
Describe the place around you: theplants, wildlife signs, weather, light, etc.What do you think it will be like in fivehours, five days, five months, five years,fifty years, or five hundred years? Youcan also go back in time.

science inquiry planning form
Team____________________________________________________________
Date______________ Site_________________________________________
field 8
Hypothesis:
Key Questions:
Investigation Design:

Getting a REpresentative sample
To answer these questions, counting or measuring all points in a largearea usually takes too much time. Therefore, scientists make observations and draw conclusions based on a rreepprreesseennttaattiivvee ssaammppllee ora portion of the focus item (plant, tree, insect, etc.) of an area - a pieceof the pie! In addition, when comparing items from two different areas,methods are needed to sample a representative number of items fromeach area (controlling variables!).
There are three methods of selecting representative samples:(I) Transect - A linear sample, usually of a specified length, often constructed by laying out a cloth measuring tape in a straight lineacross the area being sampled. The tape is usually laid out in a specificdirection using a compass.
(2) Fixed-Area Plot - A sample area of specified size with definedboundaries. Although it can be any shape, the most common shapes arecircles, triangles, and rectangles. Boundaries of triangles and rectanglesare often marked by cloth tapes used to measure them, or they can bemarked with string or flagging. The boundaries of plots larger than 1/100acre need to be constructed using a compass.
(3) Random Selection - A sample consisting of randomly selectedpoints (individual trees, plants, etc.) throughout an area. This is themost difficult method. Three major difficulties of this method include:(a) If sample locations are not random, the data may not be representative of the overall area; (b) samples may be difficult to quantify; (c) Locating and traveling between single points is often tootime consuming.
Getting a representative sample islike examining a piece of pie that
represents the whole pie.
While exploring an ecosystem, one might ask: • How many trees are in the forest?• What percentage of standing trees are
dead?• Is there more lichen diversity near the
stream or in the uplands?• Are there more wildlife sightings and signs
below 1000 ft. elevation or above?• How does the vegetation change moving
from a wetland meadow to the dense forest?• What percent of the forest floor receives
sunlight?
field 9
TRANSECTS
Transects are most useful in sampling along linear areas, such as streamcorridors. They are also useful in documenting change as you move fromone land condition to another (like from the forest edge towards thecenter of the forest-or from lowland towards upland).
AA.. LLIINNEE IINNTTEERRSSEECCTT MMEETTHHOODDOne use of this method would be to estimate what proportion of a givenarea is covered by the foliage of specific plant species-such as dwarfOregon grape.
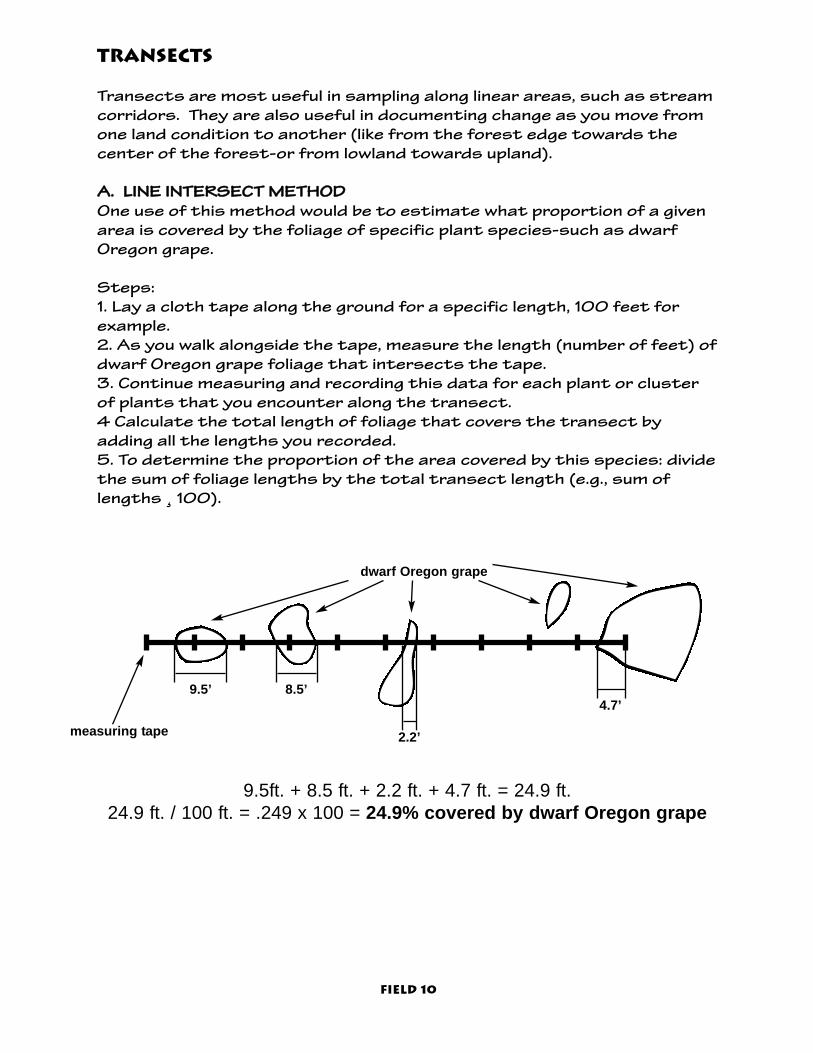
Steps:1. Lay a cloth tape along the ground for a specific length, 100 feet forexample.2. As you walk alongside the tape, measure the length (number of feet) ofdwarf Oregon grape foliage that intersects the tape. 3. Continue measuring and recording this data for each plant or clusterof plants that you encounter along the transect. 4 Calculate the total length of foliage that covers the transect by adding all the lengths you recorded.5. To determine the proportion of the area covered by this species: dividethe sum of foliage lengths by the total transect length (e.g., sum oflengths ¸ 100).
9.5ft. + 8.5 ft. + 2.2 ft. + 4.7 ft. = 24.9 ft.24.9 ft. / 100 ft. = .249 x 100 = 24.9% covered by dwarf Oregon grape
field 10
9.5’ 8.5’
2.2’
4.7’
measuring tape
dwarf Oregon grape
BB.. LLIINNEE IINNTTEERRSSEECCTT//PPOOIINNTT SSAAMMPPLLEE MMEETTHHOODD::One use of this method would be to estimate what proportion of an areais shaded by tree foliage for trees taller than 6 feet.
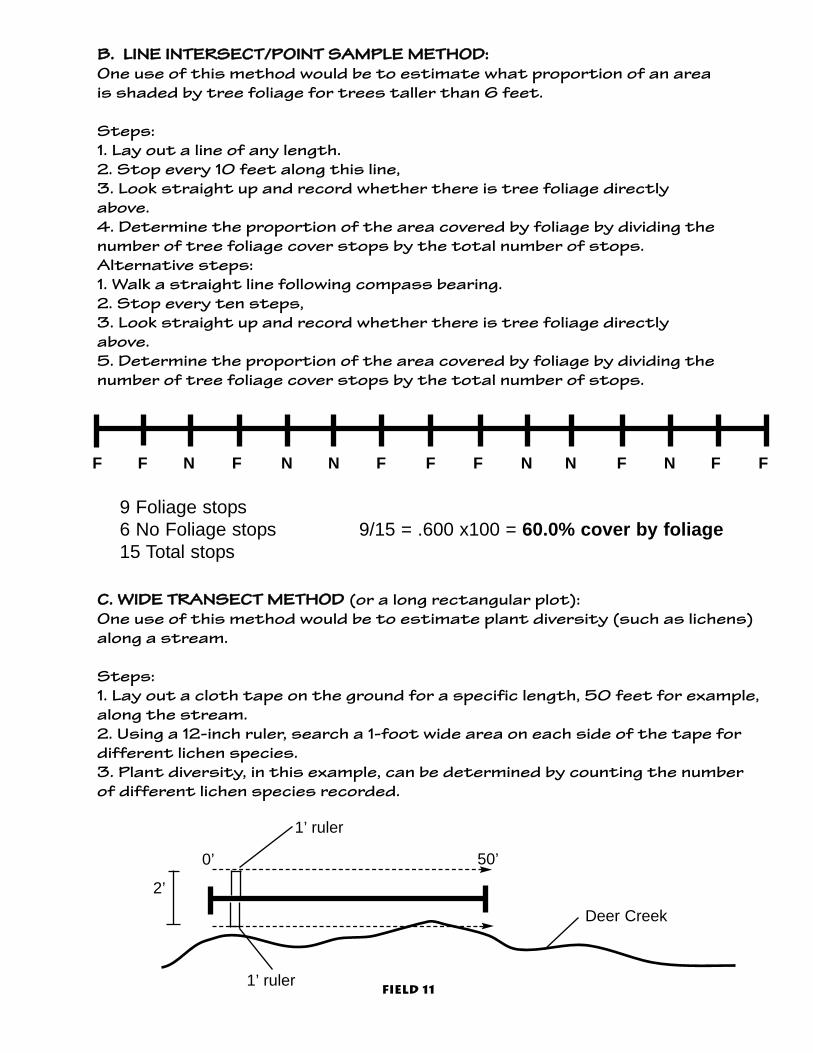
Steps:1. Lay out a line of any length. 2. Stop every 10 feet along this line, 3. Look straight up and record whether there is tree foliage directlyabove.4. Determine the proportion of the area covered by foliage by dividing thenumber of tree foliage cover stops by the total number of stops. Alternative steps:1. Walk a straight line following compass bearing. 2. Stop every ten steps, 3. Look straight up and record whether there is tree foliage directlyabove.5. Determine the proportion of the area covered by foliage by dividing thenumber of tree foliage cover stops by the total number of stops.
F
9 Foliage stops6 No Foliage stops 9/15 = .600 x100 = 60.0% cover by foliage15 Total stops
0’ 50’
1’ ruler
2’
field 11
F FFFFFF FN N N N N N
CC.. WWIIDDEE TTRRAANNSSEECCTT MMEETTHHOODD (or a long rectangular plot):One use of this method would be to estimate plant diversity (such as lichens)along a stream.
Steps:1. Lay out a cloth tape on the ground for a specific length, 50 feet for example,along the stream. 2. Using a 12-inch ruler, search a 1-foot wide area on each side of the tape fordifferent lichen species. 3. Plant diversity, in this example, can be determined by counting the numberof different lichen species recorded.
1’ ruler
Deer Creek

FIXED-AREA PLOTS
Fixed-area plots are often used to make area estimates such as: (a) thenumber of trees per acre, or (b) the number of plants per square foot.They are also used to (c) compare different areas.
All three methods below can be used to investigate this same examplequestion: How many trees larger than 5 inches in diameter are in theforest?
field 12
AArreeaa1 acre1/4 acre1/5 acre1/10 acre1/24 acre1/100 acre1/300 acre
RRaaddiiuuss iinn FFeeeett117.858.9 52.737.224.011.76.8
CCIIRRCCUULLAARR PPLLOOTT DDIIMMEENNSSIIOONNSS::
AA.. CCIIRRCCUULLAARR PPLLOOTTSS (easiest to establish)
Steps:1. Select a plot size. (1/10 acrehas a radius of 37.2 feet, forexample).
2. Mark the center of the circle.
3. Use a cloth tape to record every tree larger than 5 inches indiameter within 37.2 feet of thecenter.
4. Every tree recorded represents 10 trees per acre.
field 13
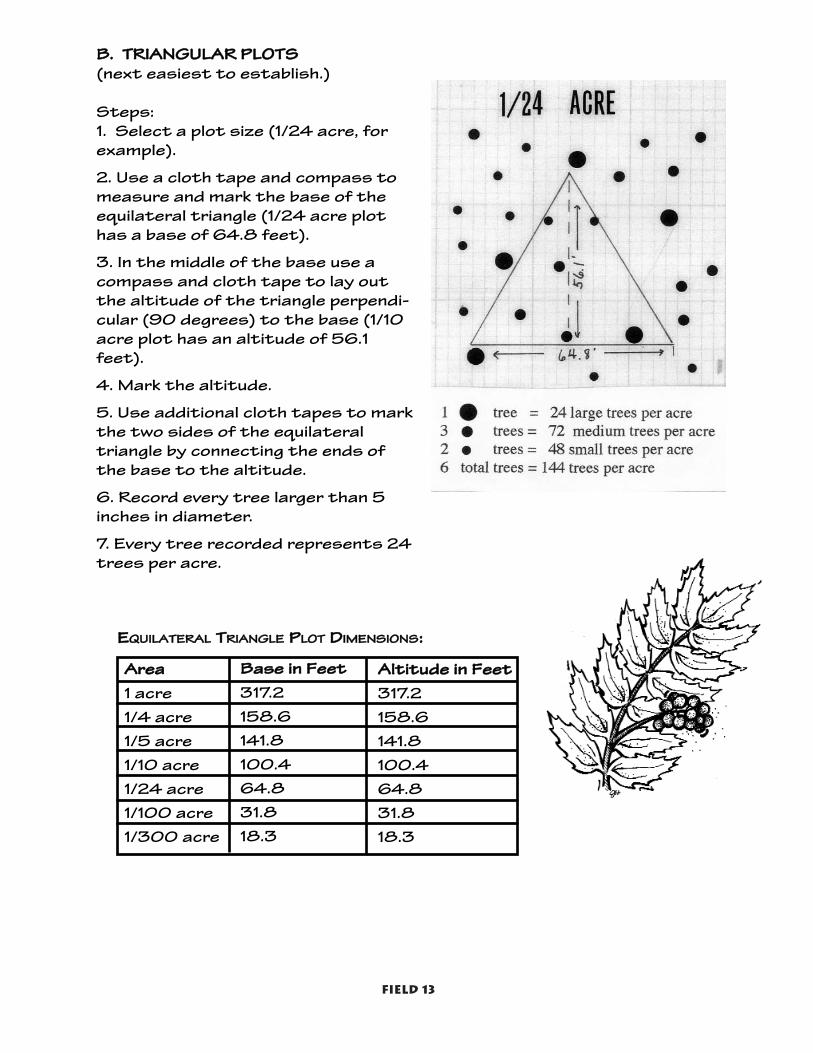
BB.. TTRRIIAANNGGUULLAARR PPLLOOTTSS(next easiest to establish.)
Steps:1. Select a plot size (1/24 acre, forexample).
2. Use a cloth tape and compass tomeasure and mark the base of theequilateral triangle (1/24 acre plothas a base of 64.8 feet).
3. In the middle of the base use acompass and cloth tape to lay outthe altitude of the triangle perpendi-cular (90 degrees) to the base (1/10acre plot has an altitude of 56.1feet).
4. Mark the altitude.
5. Use additional cloth tapes to markthe two sides of the equilateral triangle by connecting the ends ofthe base to the altitude.
6. Record every tree larger than 5inches in diameter.
7. Every tree recorded represents 24trees per acre.
AArreeaa1 acre1/4 acre1/5 acre1/10 acre1/24 acre1/100 acre1/300 acre
BBaassee iinn FFeeeett317.2158.6141.8100.464.831.818.3
AAllttiittuuddee iinn FFeeeett317.2158.6141.8100.464.831.818.3
EEQQUUIILLAATTEERRAALL TTRRIIAANNGGLLEE PPLLOOTT DDIIMMEENNSSIIOONNSS::
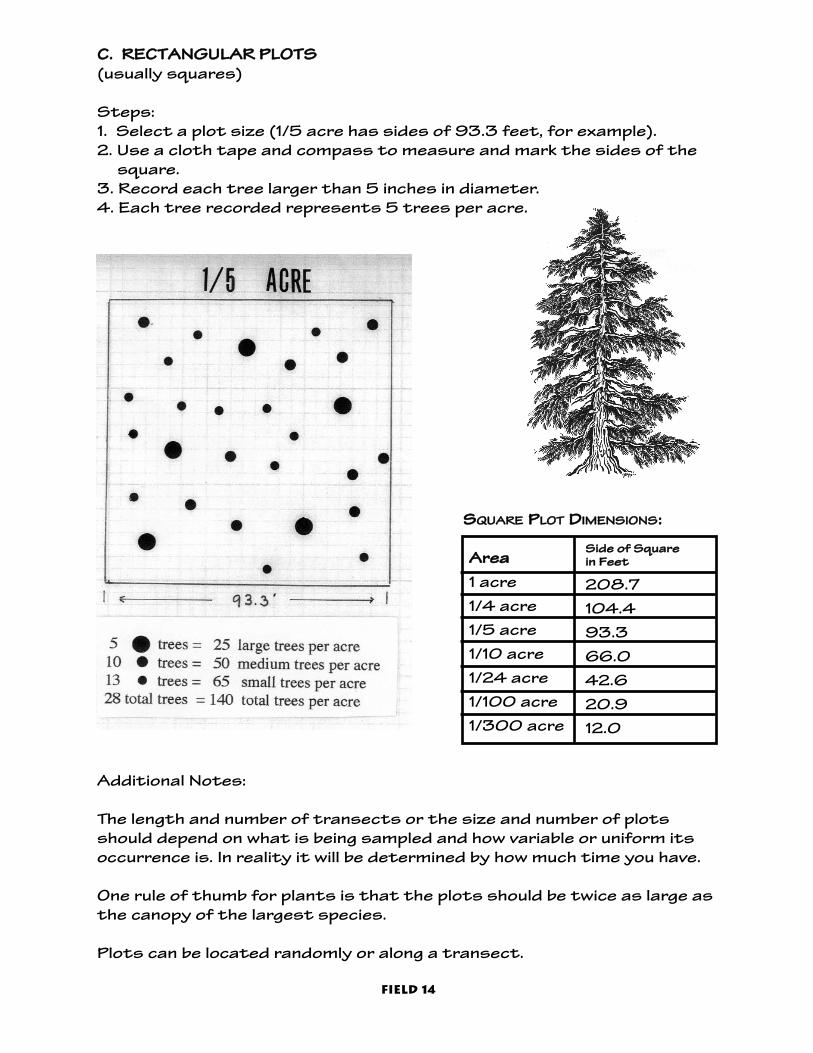
CC.. RREECCTTAANNGGUULLAARR PPLLOOTTSS (usually squares)
Steps:1. Select a plot size (1/5 acre has sides of 93.3 feet, for example).2. Use a cloth tape and compass to measure and mark the sides of the
square.3. Record each tree larger than 5 inches in diameter.4. Each tree recorded represents 5 trees per acre.
AArreeaa1 acre1/4 acre1/5 acre1/10 acre1/24 acre1/100 acre1/300 acre
SSiiddee ooff SSqquuaarreeiinn FFeeeett
208.7104.4 93.366.042.620.912.0
SSQQUUAARREE PPLLOOTT DDIIMMEENNSSIIOONNSS::
field 14
Additional Notes:
The length and number of transects or the size and number of plotsshould depend on what is being sampled and how variable or uniform itsoccurrence is. In reality it will be determined by how much time you have.
One rule of thumb for plants is that the plots should be twice as large asthe canopy of the largest species.
Plots can be located randomly or along a transect.
terrestrialinvertebrates
terrestrial invertebrate groups
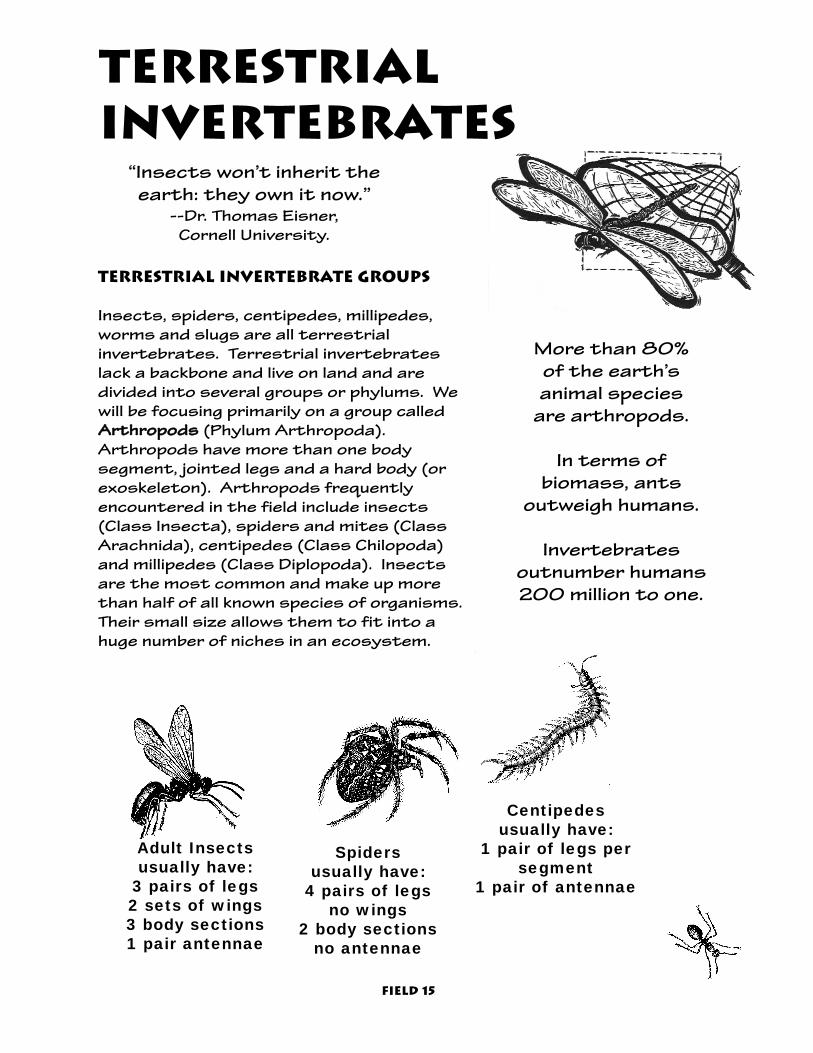
Insects, spiders, centipedes, millipedes,worms and slugs are all terrestrial invertebrates. Terrestrial invertebrates lack a backbone and live on land and are divided into several groups or phylums. Wewill be focusing primarily on a group calledAArrtthhrrooppooddss (Phylum Arthropoda).Arthropods have more than one body segment, jointed legs and a hard body (orexoskeleton). Arthropods frequentlyencountered in the field include insects(Class Insecta), spiders and mites (ClassArachnida), centipedes (Class Chilopoda) and millipedes (Class Diplopoda). Insects are the most common and make up morethan half of all known species of organisms.Their small size allows them to fit into a huge number of niches in an ecosystem.
“Insects won’t inherit the earth: they own it now.”
--Dr. Thomas Eisner,Cornell University.
Adult Insects usually have:
3 pairs of legs2 sets of wings3 body sections1 pair antennae
Spidersusually have:
4 pairs of legsno wings
2 body sectionsno antennae
Centipedes usually have:
1 pair of legs persegment
1 pair of antennae
More than 80% of the earth’s animal species
are arthropods.
In terms of biomass, ants
outweigh humans.
Invertebrates outnumber humans200 million to one.
Field 15

insect Anatomy
Generally, insects are characterized by having three pairs of legs, twosets of wings during some part of their life cycle and three body sections- head, thorax and abdomen. Insects possess a wide array of types ofantennae and mouthparts. These structures have fascinating formsthat reflect how the organism relates to its environment.
Wings
Thorax
Head
Mouthparts
Antenna
Abdomen
cercus (tail)
Tarsus
Field 16
How do individual body parts help the invertebrate adapt to or function in its environment?
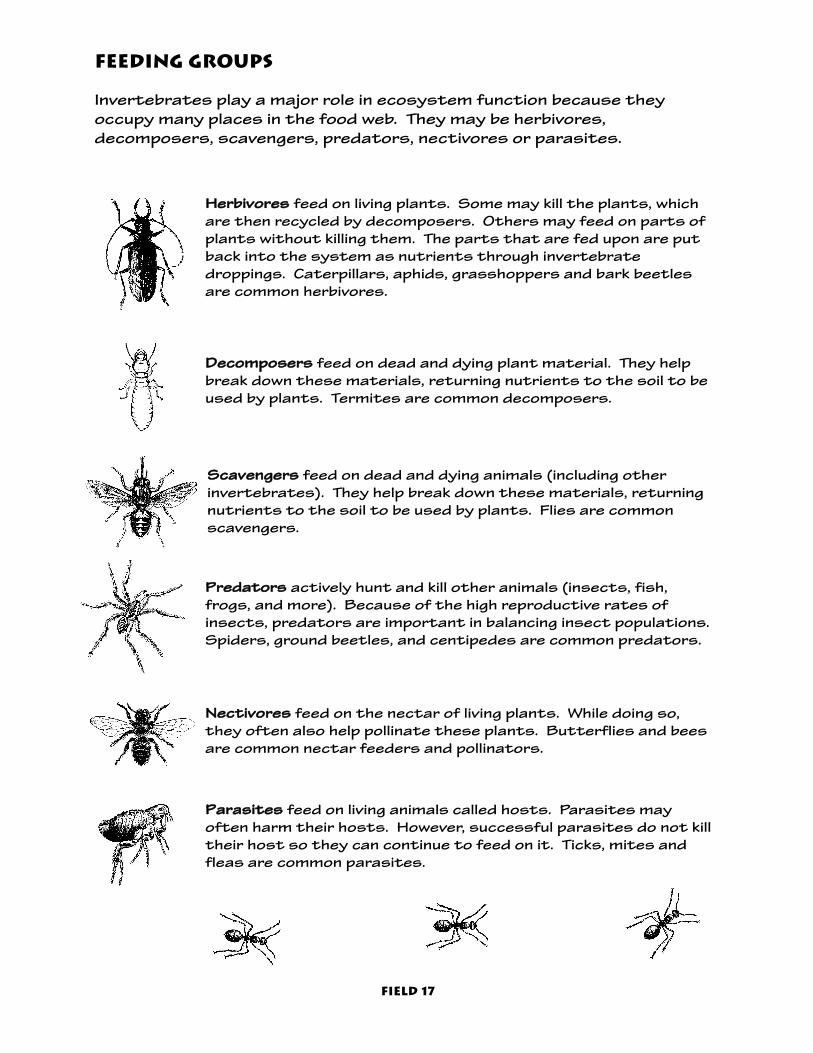
feeding groups
Invertebrates play a major role in ecosystem function because theyoccupy many places in the food web. They may be herbivores, decomposers, scavengers, predators, nectivores or parasites.
DDeeccoommppoosseerrss feed on dead and dying plant material. They helpbreak down these materials, returning nutrients to the soil to beused by plants. Termites are common decomposers.
SSccaavveennggeerrss feed on dead and dying animals (including other invertebrates). They help break down these materials, returningnutrients to the soil to be used by plants. Flies are commonscavengers.
PPaarraassiitteess feed on living animals called hosts. Parasites mayoften harm their hosts. However, successful parasites do not killtheir host so they can continue to feed on it. Ticks, mites andfleas are common parasites.
PPrreeddaattoorrss actively hunt and kill other animals (insects, fish,frogs, and more). Because of the high reproductive rates ofinsects, predators are important in balancing insect populations.Spiders, ground beetles, and centipedes are common predators.
Field 17
HHeerrbbiivvoorreess feed on living plants. Some may kill the plants, whichare then recycled by decomposers. Others may feed on parts ofplants without killing them. The parts that are fed upon are putback into the system as nutrients through invertebrate droppings. Caterpillars, aphids, grasshoppers and bark beetles are common herbivores.
NNeeccttiivvoorreess feed on the nectar of living plants. While doing so,they often also help pollinate these plants. Butterflies and beesare common nectar feeders and pollinators.

invertebrate Relationships
Invertebrates are an abundant food source formany animals, from other invertebrates tobirds and large mammals. Invertebrates alsostrongly influence the food web because of theway they help and harm plants. Invertebrates consume huge amounts of plant material,which limits the primary production of energyin the food web, yet invertebrates help to pollinate plants and disperse seeds as theyfeed on plant materials.
Careful examination ofinvertebrates revealsmany examples of speciesrelationships among eachother and other livingorganisms. Their specialized adaptationsreflect their roles in theecosystem.
Great Resources toLearn More Aboutinvertebrates:
Websites:www.natural partners.org/Insect Zoo/Orkin Insect Zoo. NationalMuseum of Natural History.Smithsonian Institute.
www.colostate.edu/Depts/Entomology/www.-sites.html.Provides a long list of entomologywebsites.
www.insects.orgBug Bios. “Shameless promotion of insect appreciation.”
Books/Field Guides:The Practical Entomologist byRick Imes. An excellent introduc-tion to the world of insects with glossy photos.
National Audubon Society FirstField Guide: Insects by ChristinaWilsdon. Provides much of what a beginning entomologist mightwant to know about insects.
Bugs of Washington andOregon by John Acorn, Ian Sheldon.Bright colors stair-stepped alongthe fore edge of this easy-to-useintroductory insectopediaAcorn, a bug enthusiast, has cho-sen the biggest, most colorful,hardest to miss, or weirdest 125of the approximately 25,000species thought to inhabitWashington and Oregon.
The Guide to Butterflies ofOregon and Washington byWilliam Neill, et al . A good book of100 common species of theNorthwest.
Field 18
Evidence of invertebrates
On cold and/or wet days in the field, invertebrates may not be easily observed orcollected. However, careful exploration usuallyreveals evidence, or signs, that invertebratesare around. Think about what kinds of invertebrates might leave these common signs:
✔ Chewed leaves
✔ Empty exoskeletons
✔ Trails, or galleries, in wood under bark
✔ Sawdust
✔ Small holes in trees
✔ Small hills
✔ Webs

Collection Tools & methods
SWEEP NET: Use this tough canvasnet with a sweeping motion alongbrush, grass, and short vegetation.
AERIAL NET: Use this delicate nylon mesh net to catchflying invertebrates with a similarmotion as the sweep net, but inopen areas, away from vegetation.
(To prevent invertebrates from getting outof sweep and arial nets, close the openingof the net by giving the handle a quick halfturn)
BEAT TRAY: Assemble the tray byplacing each stick in opposite cor-ners of the white square. Place thetray beneath vegetation and andshake the branches and stems.
PIT TRAPS: Each plot has two pittraps located near flagging.Remove the cover, pull the top cupfrom the ground and pour ontocover to check for invertebrates.Put the cup back into the cup stillin the ground. Replace the cover,making sure it is propped up justhigh enough for invertebrates topass beneath.
Terrestrialinvertebratesin the Field
invert fieldequipment:
standard field gear
field vests
collection tools
invertebrate traps
trowel/shovel
terrarium
kill jars & ethylacetate
invert lab equipment:
vials & ethyl alco-hol
pins & pinning block
small invertebrateboxes
labels
microscope
flashlight
probe
tweezers
identification keys
glue & scissors
Field 19

Collection guidelines
TToo ccoolllleecctt ssppeecciimmeennss,, divide into teams oftwo or three. Share the variety of tools andtechniques for collecting. As one team member collects, the other(s) assists withgetting the invertebrate into the kill jar orterrarium. Small specimens must be in killjars at least 15 minutes before pinning. Largespecimens, like bumble bees, dragonflies, andgrasshoppers must be left in the kill jars atleast 25 minutes. Use the data sheet tokeep a running list of invertebrates collected,the habitat where they were collected, andwhat they were doing at the time of collection.
kill jar
Field 20
aerial net
sweep net
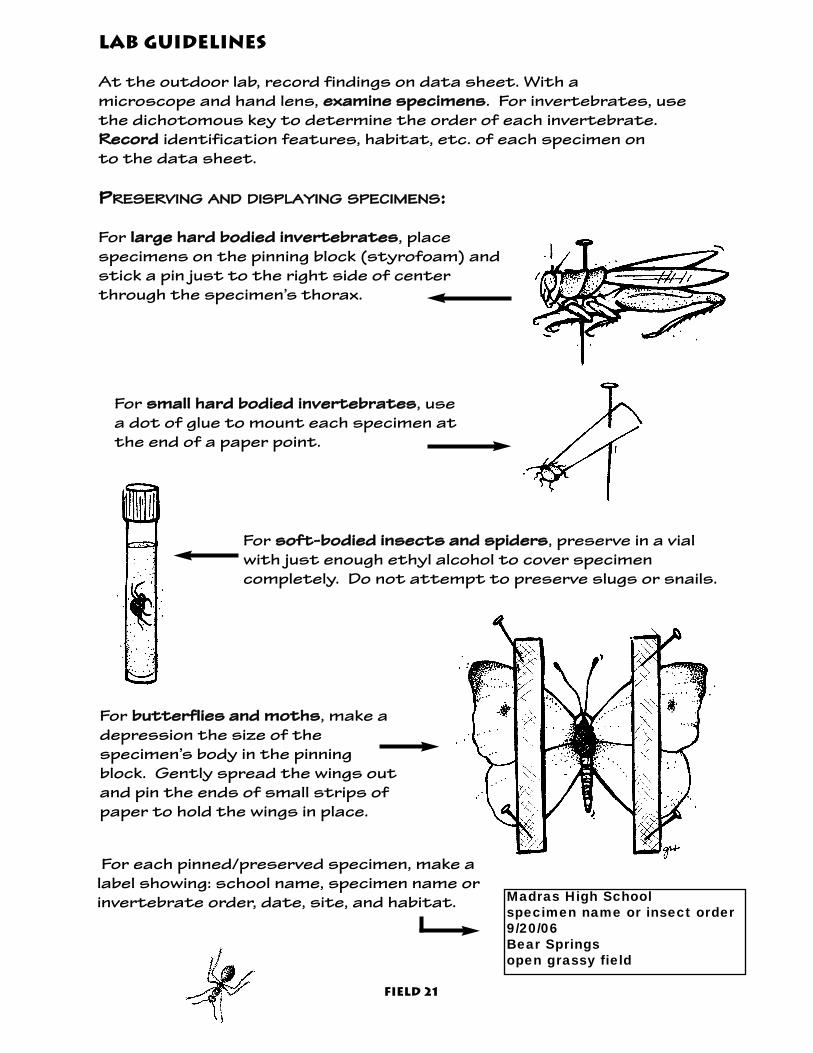
lab guidElines
At the outdoor lab, record findings on data sheet. With a microscope and hand lens, eexxaammiinnee ssppeecciimmeennss. For invertebrates, usethe dichotomous key to determine the order of each invertebrate. RReeccoorrdd identification features, habitat, etc. of each specimen on to the data sheet.
Madras High Schoolspecimen name or insect order9/20/06Bear Springs open grassy field
Field 21
PPRREESSEERRVVIINNGG AANNDD DDIISSPPLLAAYYIINNGG SSPPEECCIIMMEENNSS::
For llaarrggee hhaarrdd bbooddiieedd iinnvveerrtteebbrraatteess, place specimens on the pinning block (styrofoam) andstick a pin just to the right side of centerthrough the specimen’s thorax.
For ssmmaallll hhaarrdd bbooddiieedd iinnvveerrtteebbrraatteess, usea dot of glue to mount each specimen atthe end of a paper point.
For bbuutttteerrfflliieess aanndd mmootthhss, make a depression the size of the specimen’s body in the pinningblock. Gently spread the wings outand pin the ends of small strips ofpaper to hold the wings in place.
For ssoofftt--bbooddiieedd iinnsseeccttss aanndd ssppiiddeerrss, preserve in a vialwith just enough ethyl alcohol to cover specimen completely. Do not attempt to preserve slugs or snails.
For each pinned/preserved specimen, make alabel showing: school name, specimen name orinvertebrate order, date, site, and habitat.

invertebrate ecology Teaching Tips
Students may question the killing ofinvertebrates: Why do we do it? Doesit hurt the invertebrates?, etc. Thereasons we give are:
• EEdduuccaattiioonn. Crawling, flying specimensare hard to study.
• SShheeeerr nnuummbbeerrss. There are more invertebrates than any other organism. Invertebrates outnumberhumans 200 million to one.
• MMaassssiivvee rreepprroodduuccttiioonn rraatteess and relatively short life spans allow populations to survive and thrive evenwith our small impact.
Out of respect and necessity, we do highly recommend that student groups collect only one sample of each differentinvertebrate.
It is important to remind students tolabel specimens.
Be sure to allow at least an hour forexamination and preservation.
Safety Concerns:
Bee stings are more likely withthis activity. Ask students,point blank, if anyone is allergicto bee stings. If so, this is notthe activity for them.
Ethyl Acetate in kill jars is a toxic substance. Do notinhale!
Remind students that netsare not to be used as weaponsagainst one another.
Remind students to sanitizeor clean hands after examininginverts and before lunch.
Inquiring Minds Want to Know:
How has the site’s disturbance history affected the invertebrates in thearea?
How do the invertebrates at the site fit into the overall food web of thesite?
How are the invertebrates at the site adapted specifically to their habitat and to the types of food they eat?
How do the invertebrates interact with and affect the plant, wildlife andtree species at the site?
Field 22

School_________________________________ Mentors_______________________________________
Field Study Team______________________________________________________________________
Date_______________________________ Site_______________________________________________
Weather________________________________________________________________________________
Specimen Collected(Describe or sketch it if you
don’t know what it is)Example: metallic, green beetle.
Habitat/EcosystemWhere did you find it?
Example: on the tip of a blade of grass.
ActivityWhat was it doing? or What do
you think it was doing?Examples: Eating, searching for
food, mating
wolftreeinvertebrate ecology data
running field list
Field 23
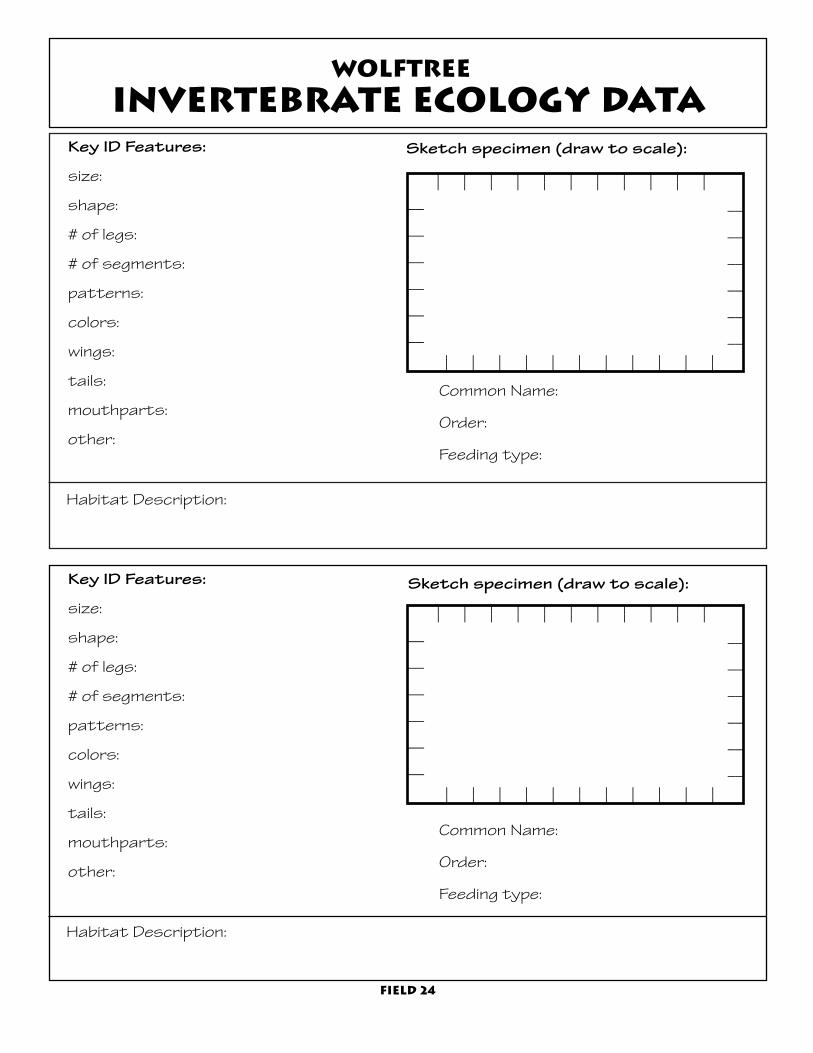
wolftreeInvertebrate ecology data
Habitat Description:
Key ID Features:
size:
shape:
# of legs:
# of segments:
patterns:
colors:
wings:
tails:
mouthparts:
other:
Common Name:
Order:
Feeding type:
Sketch specimen (draw to scale):
Habitat Description:
Key ID Features:
size:
shape:
# of legs:
# of segments:
patterns:
colors:
wings:
tails:
mouthparts:
other:
Common Name:
Order:
Feeding type:
Field 24
__
__
__
__
__
__
__
__
__
__
__
__
______________________
______________________
__
__
__
__
__
__
__
__
__
__
__
__
______________________
______________________
Sketch specimen (draw to scale):
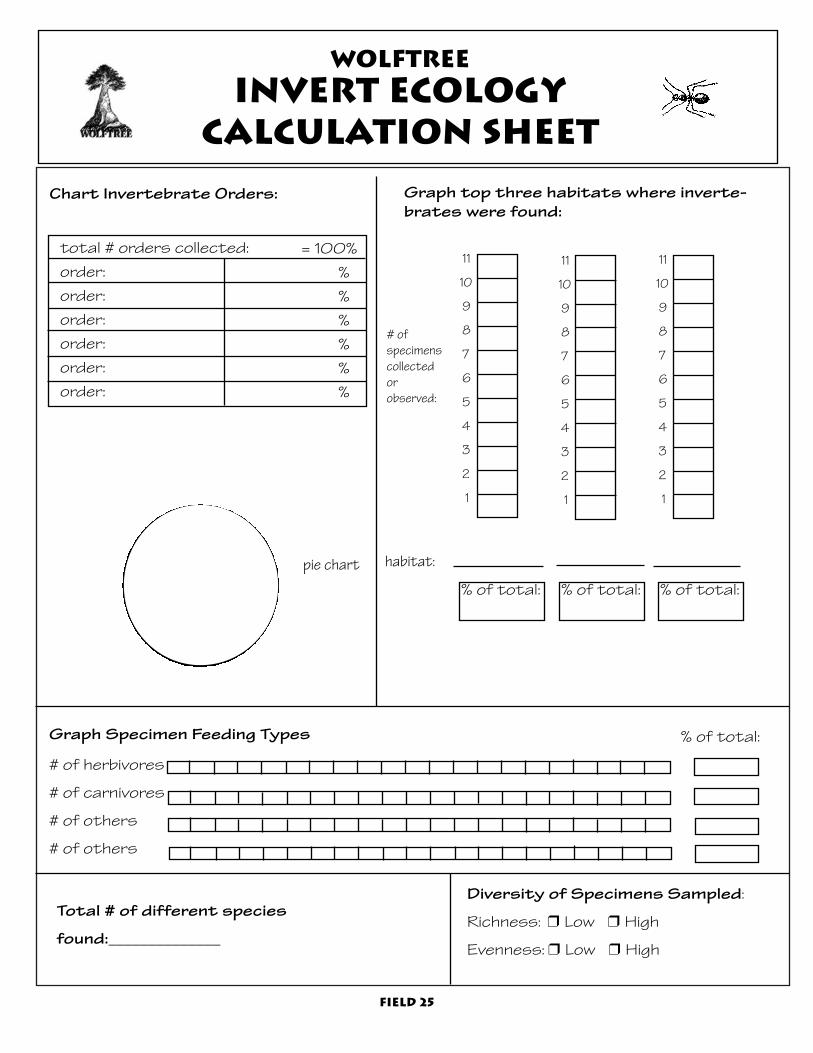
wolftreeInvert ecology
calculation sheet
Field 25
= 100%%%%%%%
total # orders collected:order:order:order:order:order:order:
pie chart
Graph Specimen Feeding Types
# of herbivores
# of carnivores
# of others
# of others
Chart Invertebrate Orders: Graph top three habitats where inverte-brates were found:
Diversity of Specimens Sampled:
Richness: ❒ Low ❒ High
Evenness: ❒ Low ❒ High
% of total:
% of total: % of total: % of total:
Total # of different species
found:______________
habitat:
11
10
9
8
7
6
5
4
3
2
1
11
10
9
8
7
6
5
4
3
2
1
11
10
9
8
7
6
5
4
3
2
1
# ofspecimenscollectedorobserved:

WildlifeEcology“When one tugs at a single thingin nature, he finds it attached to
the rest of the world.”--John Muir
Field 26
Wildlife and adaptation
The diversity of animal species in an area depends on the existence of different habitats in the system. Wildlife species adapt to survive in theconditions of a specific habitat. A physical adaptation takes place overmany generations, while a behavioral adaptation can occur within an animal’s lifetime. The claws and teeth of wildlife may adapt in response tofeeding behavior. Organisms that rely heavily on sight and hearing mayhave large eyes and sensitive ears. The sounds that organisms make toclaim territory, attract mates and call for help is another way in which theyadapt. Individuals of a species also adapt in terms of their relationshipswith other species, as in warning signals meant to deter predators.

Observing wildlife
Because most animals often hide or flee fromhumans, wildlife observers look for signs ofwildlife in addition to directly observing an animal. Wildlife species leave signs as theymove through their habitat, alter their habitatin search of food, and leave droppings behindafter eating.
Wildlife signs
TTrraacckkss - Footprints, or tracks, are a sign left by wildlife as they movethrough their habitat. Observe the number of toes and the presence ofclaws as well as the size, shape, and placement of tracks to identify the animals. Muddy and wet sandy areas are great areas to look for tracks!
RRuunnss - Trampled vegetation in distinct paths, or runs, indicates a routecommonly traveled by animals. Observe the run’s size, where it’scoming from and where it’s going, to try and identify the animal that made it.
MMaarrkkss - Wildlife species may leave marks on tree trunks as they sharpenclaws, search for food, or rub their antlers.
SSccaatt - Some animals are picky in choosing where they leave their droppingsor scat -- others will go anywhere. Bones and hair in dark colored scat mayindicate a predatory/carnivorous species; partially digested plant matterand light color may indicate a herbivorous species.
SSoouunnddss - The sounds an organism makes are a great identifier. Birdspecies usually have a distinct song and call, chipmunks and squirrelschatter, elk bugle, coyotes howl, pikas chirp and bats squeak.
BBeeddss - Beds are frequently-used sleeping areas. These may be foundin hollow logs, trees, rock piles, brush piles, grasses, or even out in theopen. Beds are characterized by well-worn depressions that can bethe size and shape of the animal’s body. They also may contain fur - another clue to the animal’s identity.
CChheewwss - Some of the most distinctive animal signs are left by the teeth ontrees, cones, grasses, and twigs. Noting the type of cut and estimatingthe size of the teeth that made it, can help you identify the animal.
HHoolleess - The size and shape of a hole in the ground or in a tree may be helpfulin figuring out the identity of the animal.
Field 27
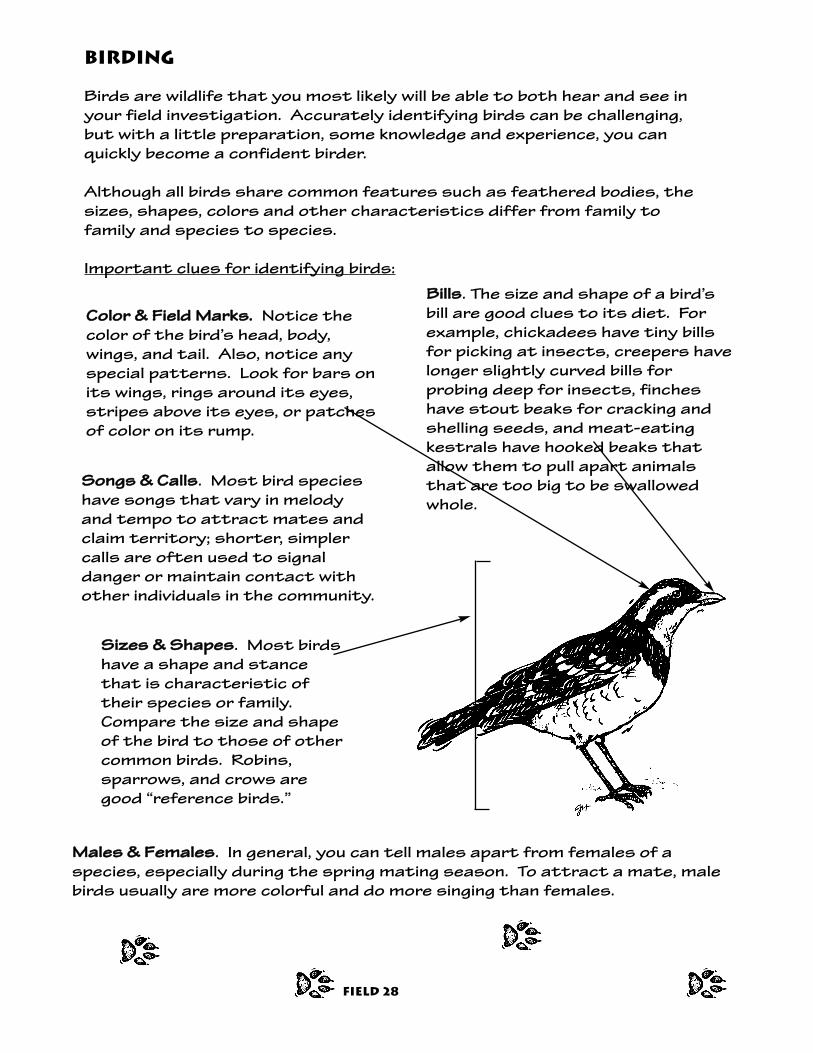
Birding
Birds are wildlife that you most likely will be able to both hear and see inyour field investigation. Accurately identifying birds can be challenging,but with a little preparation, some knowledge and experience, you canquickly become a confident birder.
Although all birds share common features such as feathered bodies, thesizes, shapes, colors and other characteristics differ from family tofamily and species to species.
Important clues for identifying birds:
CCoolloorr && FFiieelldd MMaarrkkss.. Notice thecolor of the bird’s head, body,wings, and tail. Also, notice anyspecial patterns. Look for bars onits wings, rings around its eyes,stripes above its eyes, or patchesof color on its rump.
SSiizzeess && SShhaappeess. Most birdshave a shape and stancethat is characteristic oftheir species or family.Compare the size and shapeof the bird to those of othercommon birds. Robins, sparrows, and crows aregood “reference birds.”
BBiillllss. The size and shape of a bird’sbill are good clues to its diet. Forexample, chickadees have tiny billsfor picking at insects, creepers havelonger slightly curved bills for probing deep for insects, fincheshave stout beaks for cracking andshelling seeds, and meat-eatingkestrals have hooked beaks thatallow them to pull apart animalsthat are too big to be swallowedwhole.
SSoonnggss && CCaallllss. Most bird specieshave songs that vary in melodyand tempo to attract mates andclaim territory; shorter, simplercalls are often used to signal danger or maintain contact withother individuals in the community.
MMaalleess && FFeemmaalleess. In general, you can tell males apart from females of aspecies, especially during the spring mating season. To attract a mate, malebirds usually are more colorful and do more singing than females.
Field 28
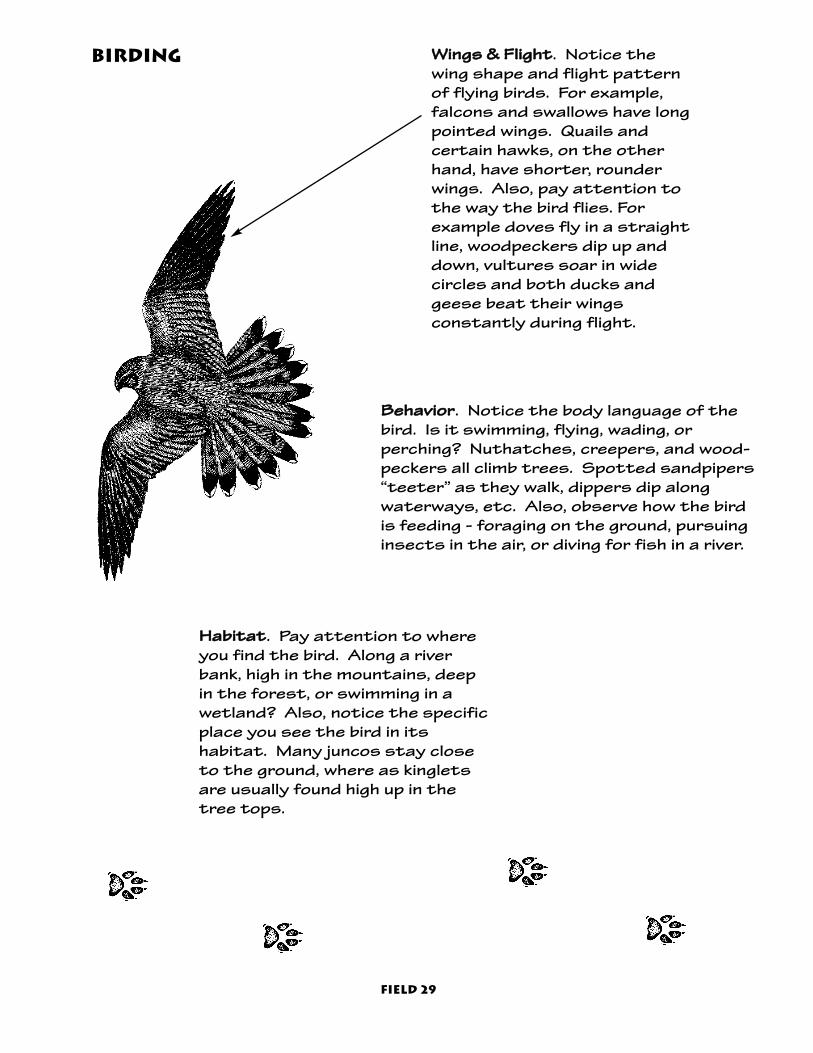
WWiinnggss && FFlliigghhtt. Notice thewing shape and flight patternof flying birds. For example,falcons and swallows have longpointed wings. Quails and certain hawks, on the otherhand, have shorter, rounderwings. Also, pay attention tothe way the bird flies. Forexample doves fly in a straightline, woodpeckers dip up anddown, vultures soar in wide circles and both ducks andgeese beat their wings constantly during flight.
HHaabbiittaatt. Pay attention to whereyou find the bird. Along a riverbank, high in the mountains, deepin the forest, or swimming in awetland? Also, notice the specificplace you see the bird in its habitat. Many juncos stay closeto the ground, where as kingletsare usually found high up in thetree tops.
BBeehhaavviioorr. Notice the body language of thebird. Is it swimming, flying, wading, or perching? Nuthatches, creepers, and wood-peckers all climb trees. Spotted sandpipers“teeter” as they walk, dippers dip alongwaterways, etc. Also, observe how the birdis feeding - foraging on the ground, pursuinginsects in the air, or diving for fish in a river.
Field 29
Birding

Wildlife Ecology in the Field
Field 30
Before launching your wildlife ecology investiga-tion, spend some time practicing a few of thefollowing methods and techniques that will helpyour team observe and be aware in nature.These are adapted from Tom Brown Jr.’s booksand field guides.
Stop - talking - become a tree, a rock, an animal...Stop - when there is an alarm call.Stop - when an animal looks at you.Stop - learn to freeze.
Look - with splatter vision to see movement.Look - at edges of fields and forests and water.Look - for tracks and signs.Look - deeply at patterns, shapes and shadows.
Listen - to what the birds are saying.Listen - near and far for sounds.Listen - for a rustle, swish or crunch...Listen - with deer ears.
Move - with the fox walk.Move - in slow motion.Move - when an animal looks away from you.Move - with the wind.
methods Materials Needed:
ssttaannddaarrdd ffiieelldd ggeeaarr
bbiinnooccuullaarrss
ffiieelldd vveessttss
GGPPSS ((iiff aavvaaiillaabbllee))
ppeerrmmaanneenntt mmaarrkkeerr
ssoouunndd rreeccoorrddeerr ((iiff aavvaaiillaabbllee))
TTRRAACCKK CCAASSTTIINNGG MMAATTEERRIIAALLSS:: ppllaasstteerr mmiixx
ppllaassttiicc ffrraammee && cclliipp
wwaatteerr
mmiixxiinngg bboowwll
ssttiirrrriinngg ddeevviiccee

field 31
MOVING IN NATURE - THE FOX WALK
Watching our sly four-legged friends, we can learn to effectively move through nature using the following techniques:
sensory skillS and techniques
11.. SSttoopp ttaallkkiinngg..
22.. MMoovvee iinn ssllooww mmoottiioonn..
33.. SShhoorrtteenn yyoouurr ssttrriiddee..
44.. LLiigghhttllyy ttoouucchh yyoouurr ffoooott oonn tthhee ggrroouunndd bbeeffoorree ccoommmmiittttiinngg yyoouurr wweeiigghhtt..
55.. PPllaaccee tthhee oouuttssiiddee eeddggee ooff yyoouurr ffoooott oonn tthhee ggrroouunndd..
66.. GGeennttllyy rroollll yyoouurr ffoooott ddoowwnn ((iinnwwaarrddllyy)) ffllaatt..
77.. SSlloowwllyy mmoovvee yyoouurr wweeiigghhtt ffoorrwwaarrdd iinn aa fflloowwiinngg mmoottiioonn..
88.. CCeenntteerr yyoouurr ggrraavviittyy aatt tthhee cceenntteerr ooff yyoouurr hhiippss..
Fox walkers should be able to feel exactly what they are stepping on. Ifyou feel a twig that might snap, you now have the ability to pick up yourfoot and place it in a new spot without looking down.
In conjunction with the fox walk, learn and practice freezing and becoming invisible. When you hear wildlife sounds, smell something, or sense movement, enlist your skill to freeze and you’ll have a great chance of observing wildlife.
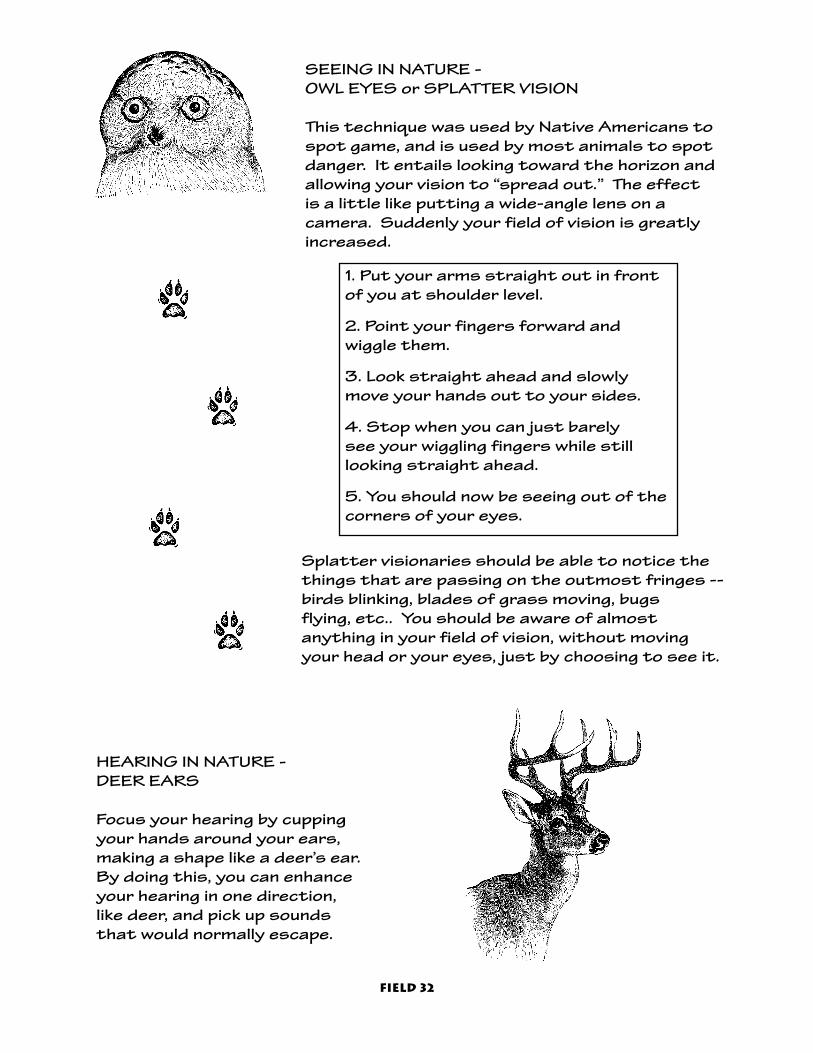
HEARING IN NATURE - DEER EARS
Focus your hearing by cuppingyour hands around your ears, making a shape like a deer’s ear.By doing this, you can enhanceyour hearing in one direction,like deer, and pick up soundsthat would normally escape.
SEEING IN NATURE - OWL EYES or SPLATTER VISION
This technique was used by Native Americans tospot game, and is used by most animals to spotdanger. It entails looking toward the horizon andallowing your vision to “spread out.” The effectis a little like putting a wide-angle lens on a camera. Suddenly your field of vision is greatlyincreased.
Splatter visionaries should be able to notice thethings that are passing on the outmost fringes --birds blinking, blades of grass moving, bugs flying, etc.. You should be aware of almost anything in your field of vision, without movingyour head or your eyes, just by choosing to see it.
1. Put your arms straight out in frontof you at shoulder level.
2. Point your fingers forward and wiggle them.
3. Look straight ahead and slowlymove your hands out to your sides.
4. Stop when you can just barely see your wiggling fingers while still looking straight ahead.
5. You should now be seeing out of thecorners of your eyes.
field 32

casting a Track:
1. Do not alter track in any way before casting it.
Framing:2. Use plastic strip to make a wall around track leaving at least one inchof space between wall and track. Fasten plastic strip together withpaper clip. Do not disturb track when placing frame around it.
Mixing:3. Pour enough water into a mixing bowl that will completely cover trackand fill plastic frame.
4. Ratio of plaster to water is about 2:1. Slowly add plaster to water
5. Stir quickly (Stirring starts a chemical reaction between water andplaster). The mixture should be like pancake batter (The wetter themix,the longer it will take to dry).
Pouring:6. Pour mixture slowly, but steadily fillingthe lowest portion of framed area first.
7. Completely cover framed area to depth ofat least 1/2 inch above the highest point ofthe track.
8. Tapping the top of the plaster with theflat of the stirring device will flatten it out.
9. Wait approximately 30 minutes.
Releasing Cast:10. When cast has hardened, carefully digaway soil from its sides.
11. Gently pry beneath the thickest part ofcast with your fingers or a stick.
12. Lift and pull up until cast turns over or releases straight up. Claysoils and fine mud sometimes require excavating beneath cast torelease.
13. Write the date, location, and species (if known) on back of cast.
14. Cast details are fragile for the first 24 hours - avoid extensive cleaning. Leaving some soil on the cast can add to its appearance andenhance some details.
field 33

Field 34
resources on wildlife ecology
Websites:www.dfw.state.or.us/The Oregon Department of Fish and Wildlife’swebsite offers hot topics on wildlife, areas tosee wildlife and wildlife education programs.
www.wa.gov/wdfw/The Washington Department of Fish andWildlife’s website offers outdoor recreationsites, information on wildlife science and habitat, and school programs.
www.PartnersInFlight.org/The Partners in Flight website offers anextremely comprehensive site on birds and birdconservation.
www.audubon-pdx.org/The Portland Audubon Society’s website isgreat for learning about the area’s birds, birdtrips, field notes, conservation news andclasses.
Books:All the DK, Eyewitness Books are excellentresources with fabulous photography. Titlesinclude Amphibian, Bird, Mammal, and Reptile.
Tom Brown’s Field Guide to Nature andSurvival for Children by Tom Brown Jr. withJudy Brown. Tom Brown is one of the foremost trackers and tracking educators ofour time.
Atlas of Oregon Wildlife by BlairCsuti, A. Jon Kimerling, Thomas A.O'Neil, Margaret M. Shaughnessy,Eleanor Gaines, and ManuelaHuso. From the OSU Press. TheAtlas of Oregon Wildlife makesinformation on all of Oregon'sdiverse terrestrial wildlife availablefor the first time in a single, com-prehensive volume.
Field Guides:Animal Tracks of Washington andOregon by Ian Sheldon. A compact guide that will help youidentify tracks of all sizes andshapes. Includes detailed drawings along with concisedescriptions of the animals.
National Audubon Society FirstField Guide to Birds. A guide foryoung birders with over 450 colorphotographs and illustrations.
Inquiring Minds Want to Know:
How has the site’s disturbance history affected the wildlife in the area?
How do the wildlife you identified fit into the overall food web of the site?
How have the wildlife adapted specifically to their habitat?
How do the wildlife interact with and affect the plants, insects, treesand water at the site?

School_________________________________ Mentors_______________________________________
Student Scientists____________________________________________________________________
Date_______________________________ Site_______________________________________________
Wildlife Present
note: confirmed (C), probable (P) or
Questionable (Q)
Sign/EvidenceTrack, sound,
sight, scat, bed,chew, etc.
Habitat/Ecosystem
Where did you findit?
ActivityWhat was it
doing? or Whatdo you think it
was doing?
Field 35
Use journals for sketching signs/wildlife and recording specific information!!
Wolftree
wildlife ecology data
Feeding Type
❒ herbivore❒ carnivore❒ omnivore
❒ herbivore❒ carnivore❒ omnivore
❒ herbivore❒ carnivore❒ omnivore
❒ herbivore❒ carnivore❒ omnivore
❒ herbivore❒ carnivore❒ omnivore
❒ herbivore❒ carnivore❒ omnivore
❒ herbivore❒ carnivore❒ omnivore

Wolftree
wildlife ecology calculation sheet
Total # of wildlife species: = 100%
feeding type # sampled %
carnivore
herbivore
omnivore
pie chart
Calculate Percentages and Chart:Graph top three habitats whereyou found the most wildlife signs:
habitat:
Diversity of Organisms Sampled:
Richness ❒ Low ❒ High
Evenness ❒ Low ❒ High
% of total % of total % of total
Graph wildlife types:
M R A B
#
M = mammalR = reptileA = amphibianB = bird
14__13__12__11__10__9 __8 __7 __6 __5 __4 __3 __2 __1 __
Field 36
11
10
9
8
7
6
5
4
3
2
1
11
10
9
8
7
6
5
4
3
2
1
11
10
9
8
7
6
5
4
3
2
1
# of wildlifesigns
Diversity of Habitats:
Richness ❒ Low ❒ High
Evenness ❒ Low ❒ High
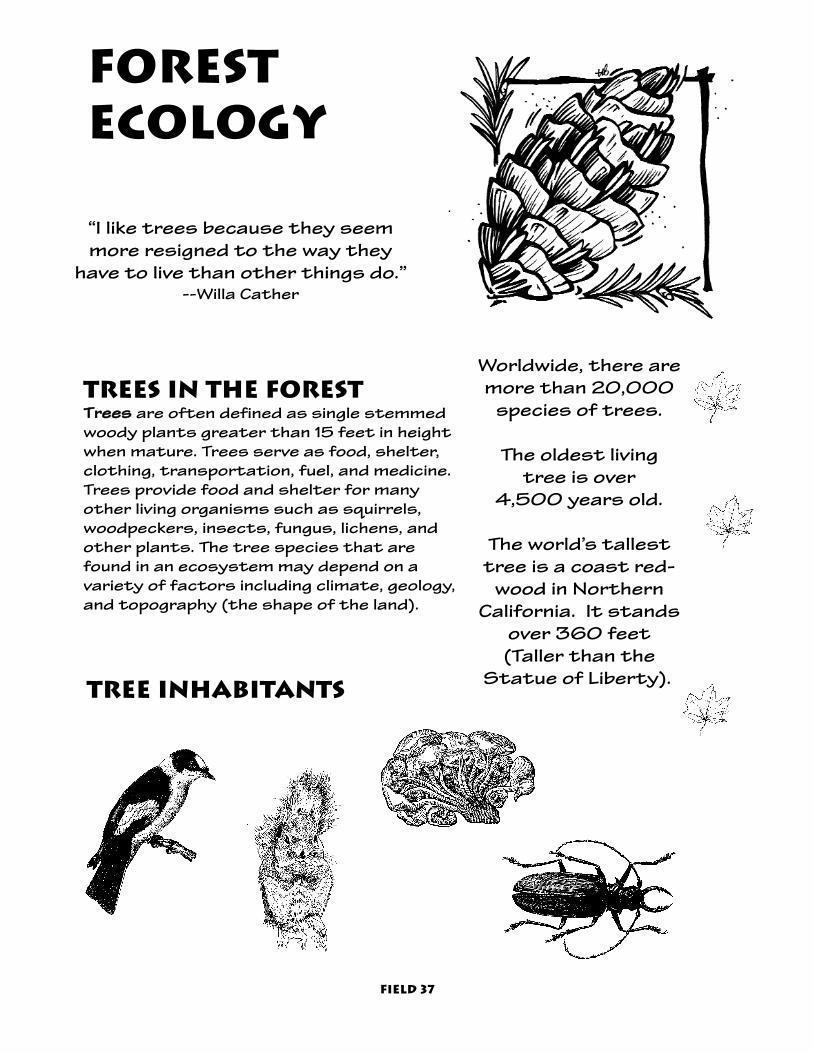
ForestEcology
TTrreeeess are often defined as single stemmedwoody plants greater than 15 feet in heightwhen mature. Trees serve as food, shelter, clothing, transportation, fuel, and medicine.Trees provide food and shelter for manyother living organisms such as squirrels,woodpeckers, insects, fungus, lichens, andother plants. The tree species that arefound in an ecosystem may depend on a variety of factors including climate, geology,and topography (the shape of the land).
Trees in the Forest
“I like trees because they seemmore resigned to the way they
have to live than other things do.”--Willa Cather
Worldwide, there aremore than 20,000
species of trees.
The oldest living tree is over
4,500 years old.
The world’s tallesttree is a coast red-
wood in NorthernCalifornia. It stands
over 360 feet (Taller than the
Statue of Liberty).Tree inhabitants
Field 37
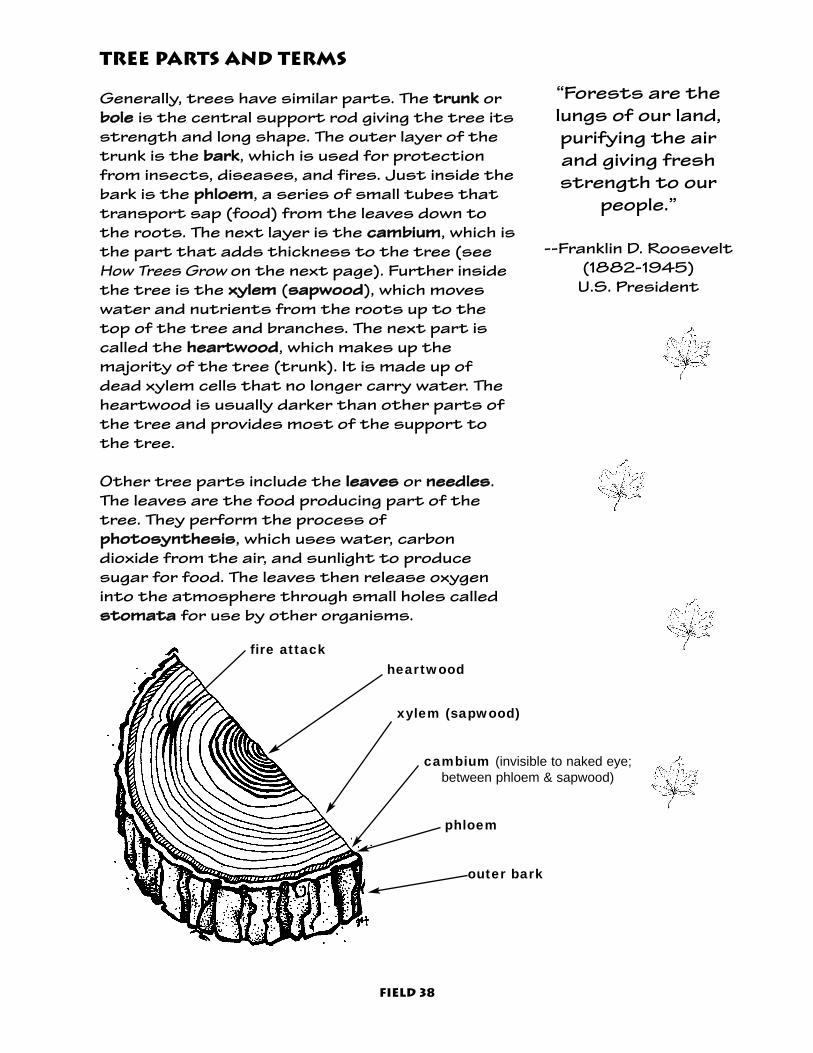
“Forests are thelungs of our land,purifying the air and giving freshstrength to our
people.”
--Franklin D. Roosevelt(1882-1945)
U.S. President
Tree parts and terms
Generally, trees have similar parts. The ttrruunnkk orbboollee is the central support rod giving the tree itsstrength and long shape. The outer layer of thetrunk is the bbaarrkk, which is used for protectionfrom insects, diseases, and fires. Just inside thebark is the pphhllooeemm, a series of small tubes thattransport sap (food) from the leaves down tothe roots. The next layer is the ccaammbbiiuumm, which isthe part that adds thickness to the tree (seeHow Trees Grow on the next page). Further insidethe tree is the xxyylleemm (ssaappwwoooodd), which moveswater and nutrients from the roots up to thetop of the tree and branches. The next part iscalled the hheeaarrttwwoooodd, which makes up the majority of the tree (trunk). It is made up ofdead xylem cells that no longer carry water. Theheartwood is usually darker than other parts ofthe tree and provides most of the support tothe tree.
Other tree parts include the lleeaavveess or nneeeeddlleess.The leaves are the food producing part of thetree. They perform the process of pphhoottoossyynntthheessiiss, which uses water, carbon dioxide from the air, and sunlight to producesugar for food. The leaves then release oxygeninto the atmosphere through small holes calledssttoommaattaa for use by other organisms.
cambium (invisible to naked eye; between phloem & sapwood)
outer bark
phloem
xylem (sapwood)
heartwood fire attack
Field 38
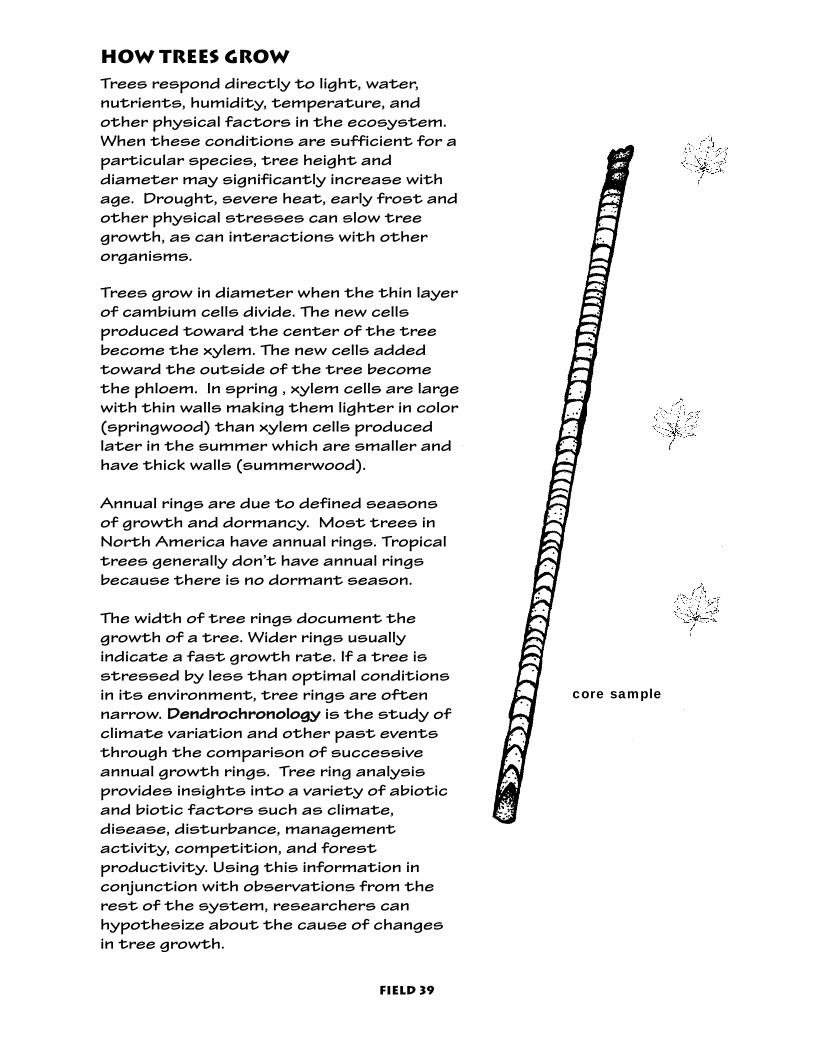
How trees Grow Trees respond directly to light, water,nutrients, humidity, temperature, andother physical factors in the ecosystem.When these conditions are sufficient for aparticular species, tree height and diameter may significantly increase withage. Drought, severe heat, early frost andother physical stresses can slow treegrowth, as can interactions with otherorganisms.
Trees grow in diameter when the thin layerof cambium cells divide. The new cells produced toward the center of the treebecome the xylem. The new cells addedtoward the outside of the tree becomethe phloem. In spring , xylem cells are largewith thin walls making them lighter in color(springwood) than xylem cells producedlater in the summer which are smaller andhave thick walls (summerwood).
Annual rings are due to defined seasonsof growth and dormancy. Most trees inNorth America have annual rings. Tropicaltrees generally don’t have annual ringsbecause there is no dormant season.
The width of tree rings document thegrowth of a tree. Wider rings usually indicate a fast growth rate. If a tree isstressed by less than optimal conditionsin its environment, tree rings are oftennarrow. DDeennddrroocchhrroonnoollooggyy is the study ofclimate variation and other past eventsthrough the comparison of successiveannual growth rings. Tree ring analysisprovides insights into a variety of abioticand biotic factors such as climate, disease, disturbance, management activity, competition, and forest productivity. Using this information inconjunction with observations from therest of the system, researchers canhypothesize about the cause of changesin tree growth.
core sample
Field 39

Forest Structure
Forests are made up of vertical layers of plants. Each layer may contain different plant and animal communities that have different habitat requirements. The uppermost layer is oftencalled the ccaannooppyy. The next layer down is called the uunnddeerrssttoorryy or ssuubb--ccaannooppyy. Continuing down is the sshhrruubb llaayyeerr and then the hheerrbb llaayyeerr.Finally we reach the forest floor, which contains many organisms including insects, fungi, moss, and lichen. It is important to rememberthat these layers are not separate from each other. They usuallyoverlap and exist together through a complex series of relation-ships (see species relationships concept for examples).
CCrroowwnn ccllaassss describes the position of the tree's height relative to theother trees in the stand. Crown class indicates the result of competi-tion between trees for sunlight, water, nutrients and physical growingspace. DDoommiinnaanntt trees are the top of the canopy; the tops of iinntteerr--mmeeddiiaattee trees are just below the dominant trees; oovveerrttooppppeedd treesgrow below intermediate trees. By understanding crown class, the habitat needs of certain trees becomes clear. To help improve yourknowledge of forest ecology it is helpful to take some measurements.Crown class, total height, and diameter are three measurements usedto understand a tree's form and function. For instance, we sometimesfind Douglas-Fir trees growing in the canopy as dominant trees. They area sun loving species and may be the tallest and widest trees is a stand.Western Hemlock trees can grow in the understory as suppressed trees.They are shade tolerant and may be an equal in height to the dominanttrees or in the understory as a suppressed tree.
Field 40
overtoppeddominant intermediate
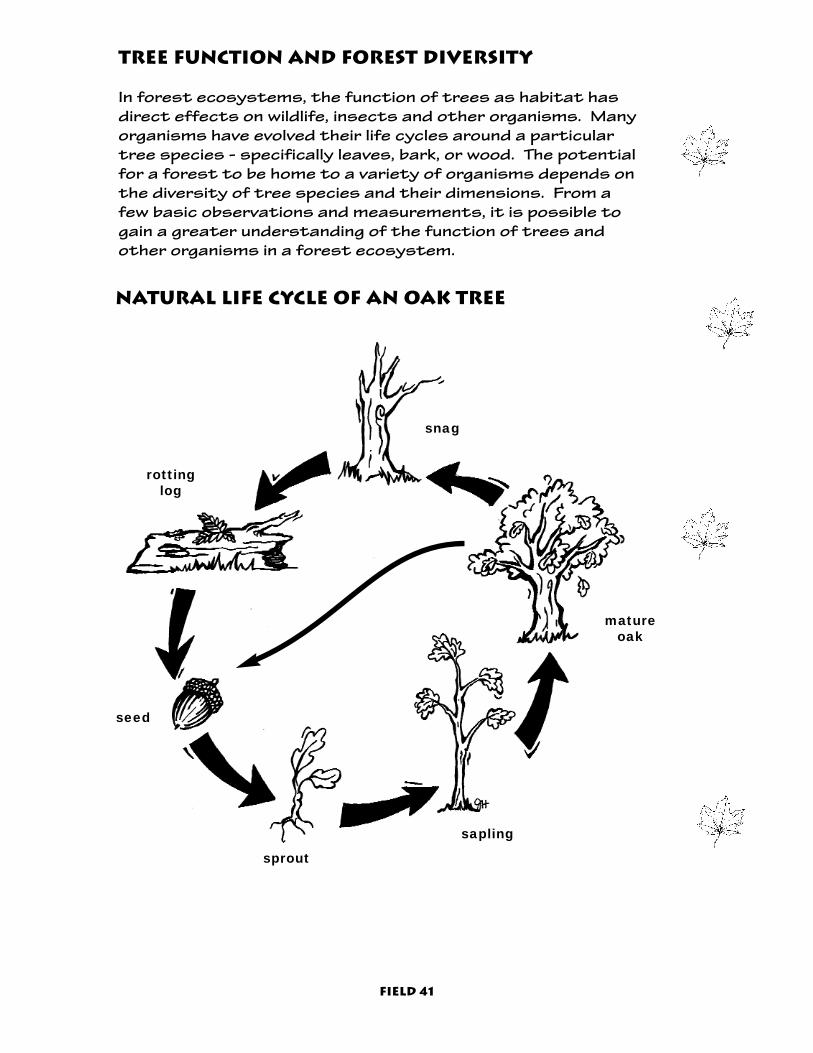
tree function and forest diversity
In forest ecosystems, the function of trees as habitat hasdirect effects on wildlife, insects and other organisms. Manyorganisms have evolved their life cycles around a particulartree species - specifically leaves, bark, or wood. The potentialfor a forest to be home to a variety of organisms depends onthe diversity of tree species and their dimensions. From afew basic observations and measurements, it is possible togain a greater understanding of the function of trees andother organisms in a forest ecosystem.
natural life cycle of an oak tree
seed
sprout
sapling
matureoak
snag
rottinglog
Field 41

Forest Ecologyin the field
MaterialsNeeded:
standard field gear
clinometers
field vests
logger’s tapes
increment borers
straws
Field 42
data collection methods & techniques
MMEEAASSUURRIINNGG DDIIAAMMEETTEERR AATT BBRREEAASSTT
HHEEIIGGHHTT ((DDBBHH)):: A logger's tape measures standard feet on one side and"diameter equivalents in terms of circumference" on the other.
Measure the tree's diameter at 4.5 feetheight above the base. Wrap the logger'stape around the tree using the side ofthe tape that says "diameter equivalents in terms of circumference."Be sure the tape is straight and perpendicular to the tree.
Record the DBH.
logger’s tape

MMEEAASSUURRIINNGG TTRREEEE HHEEIIGGHHTT..
Baseline distance: Using the standard feetside of the logger's tape, back away from thetree a convenient distance between 50 and100 feet (make sure you can see the baseand top of the tree).
Hold a clinometer up to your eye and lookthrough the eyepiece. Site the top of thetree and read the percent scale of the clinometer. Then site the bottom of the treeand read the percent scale. Add the two percents together (note: this procedure mayvary on sloping ground).
Multiply the final percentage by the baseline distance to get the total height.
Record tree height.
64%
6%
Baseline distance - 80 feet
For example, the baseline distance is 80 feet. The percentto the top of the tree is 64% and the percent to the bottom of the tree is 6%. The total percentage is 70%.Multiply the total percentage with the baseline distance toget the total tree height.
.70 x 80 feet = 56 feet. The total tree height is 56 feet.
clinometer
Field 43
eye piece

MMEEAASSUURRIINNGG TTRREEEE AAGGEE AANNDD
DDEETTEERRMMIINNIINNGG GGRROOWWTTHH PPAATTTTEERRNNSS..
Assemble the increment borer.
Extract the core sample from 4.5 feet up on the bole of thetree. Making sure the borer is perpendicular to the tree,screw the sharp end of the increment borer into the tree ina clockwise direction. Continue to drill the borer into thetree until you reach the pith (center). Complete two revolutions past the pith of the tree. Insert the spoon intothe open end of the borer and apply firm but gentle pressure to the spoon. Once the spoon is inserted all theway into the borer, unscrew the borer one full revolution toseparate the core from the rest of the tree. Slowly removethe spoon from the borer trying to prevent the core samplefrom falling.
Determine the age of the tree. Count the rings on the coresample. Add five years to the number of rings to accountfor the time it took for the tree to grow 4.5 feet.
Further examine the core sample to determine the growthpatterns. Narrow widths between rings, usually mean slower growth rates. Wider widths usually mean fasterWhat are possible factors for slow, fast and stable growthrates?
Use straws to store the cores. Tape the ends closed withmasking tape and label the straw with the species. If thecore is too big for one straw, tape two straws together.
Record tree age and growth patterns.
increment borer
Field 44
tips for teaching forest ecology
Make this as multi-sensory as possible. Have students touch, smell,and hear trees to understand them.
Please do not let students try tounplug an increment borer (put itaside and Wolftree staff will take careof it).
The logger’s tape and increment borercan be hazardous. Have students bewary of the sharp edges and nail.
Have students really read and under-stand the measurements on the log-ger’s tape (division of standard sidefeet into tenths of feet, not inches)
INQUIRING MINDS WANT TO KNOW:
How might the area’s disturbance history have affected the trees you examined?
How do the trees that you observed fit into the overall food web of thesite?
How are the tree species that you observed adapted to their habitat?
What are some relationships between the trees sampled and the plant,wildlife and insect species in the area?
What are major influences on the growth of trees you examined?
How many different populations of life are the trees supporting?
Resources on Forest Ecology
Books:Northwest Trees: Identifying &Understanding the Region’sNative Trees by Stephen Arno &Ramona Hammerly. A comprehen-sive and well-written guide.
Field Guides:Trees to Know in Oregon from theOSU Extension Service and Dept.of Forestry. An inexpensive anduser-friendly guide to identifying
Field 45
Extension Activities: With a dead tree, pull away the bark to look for beetle galleries. Discusshow wood boring beetles fit into the overall food web. The concept ofspecies relationships can also discussed.
Have students sketch a side view of the transect including downedwoody debris and layers.
Have students measure the organic matter or duff layer at several different areas. Compare, contrast, and discuss.

School________________________Site_________________________________Date____________Study Team_________________________________________________________________________Weather_____________________________________________________________________________
Tree Identification
Sketch General Tree Shape to Scale
Sketch Branch with Leavesto scale
Sketch or Describe Cone or Fruitto scale
Describe Bark (Color, Texture, etc.): Species Common Name:
Measurements with Units
DBH____________ Height____________ Age____________
Field 46
Wolftree
forest ecology data
Evergreen ❒ Deciduous ❒
Tree core sample
Accurately draw in growth lines:
Explain growth patterns (use arrows to point to specific patterns):

Field 47
Wolftree
forest ecology data
Tree Ecology
Crown Class: Dominant ❒ Intermediate ❒ overtopped ❒
Evidence of Insect Activity: Yes ❒ No ❒Describe the type of relationship* with tree:
Moss Present: Yes ❒ No ❒Describe the type of relationship* with tree:
Evidence of Wildlife Activity: Yes ❒ No ❒List species and describe the type of relationship*with tree:
Fungus Present: Yes ❒ No ❒Describe the type of relationship* with tree:
Lichens Present: Yes ❒ No ❒Describe the type of relationship* with tree:
Evidence of Disturbance near tree:Fire Yes ❒ No ❒Flood Yes ❒ No ❒Wind Yes ❒ No ❒Lightening Yes ❒ No ❒Harvesting Yes ❒ No ❒Recreation Yes ❒ No ❒Other _____________ Yes ❒ No ❒Explain how disturbances have impacted the area:
Examine the Forest Floor near the tree:
% living material:% non-living material:
List the roles and functions of downed woodydebris in this forest ecosystem:
pie charts% shade:% sun:
*There are several types of relationships: Mutualism (both species benefit), commensalism (one species benefits, the other is not affected), competition, predation, and parasitism.

Total # of trees sampled: = 100%
Tree species # sampled %
pie chart
Tree Measurements:
Tree species
Calculate Percentages and Chart: Graph Crown Class:
Dominant Intermediate Overtopped
Diversity of Trees Sampled:
Richness ❒ Low ❒ High
Evenness ❒ Low ❒ High
field 48
% of total % of total % of total
Wolftree
forest ecology calculations sheet
avg. height avg. ageavg. DBH
Total Averages
# oftreespecies
11
10
9
8
7
6
5
4
3
2
1
11
10
9
8
7
6
5
4
3
2
1
11
10
9
8
7
6
5
4
3
2
1

plantEcology
plants and place
Examining plants can reveal manysecrets about an ecosystem. Plantsneed unique combinations of light, temperature, moisture, nutrients, and soil conditions for ggeerrmmiinnaattiioonn(sprouting), growth, and reproduction.
With the exception of a few species,plants share one significant characteristic - the ability to performphotosynthesis. PPhhoottoossyynntthheessiiss isthe ability to produce food in the formof sugars from carbon dioxide, waterand sunlight. The adaptations of eachplant species allow them to photosynthesize in specific biotic (living) and abiotic (non-living)
"Earth laughs in flowers."--Ralph Waldo Emerson
Over 260,000species of plants
have been identified.
One square meter ofsoil may hold up to2000 earthworms
and 40,000insects.
Shrub - Oregon Grape
Herb - Shooting
Star
plant variety
Plants are complex organisms thatoften differ greatly in structure. Instudying plants, you may discoverwoody-stemmed shrubs, floweringherbs, and ferns, all of which are thesame in some ways, but different inothers.
Field 49
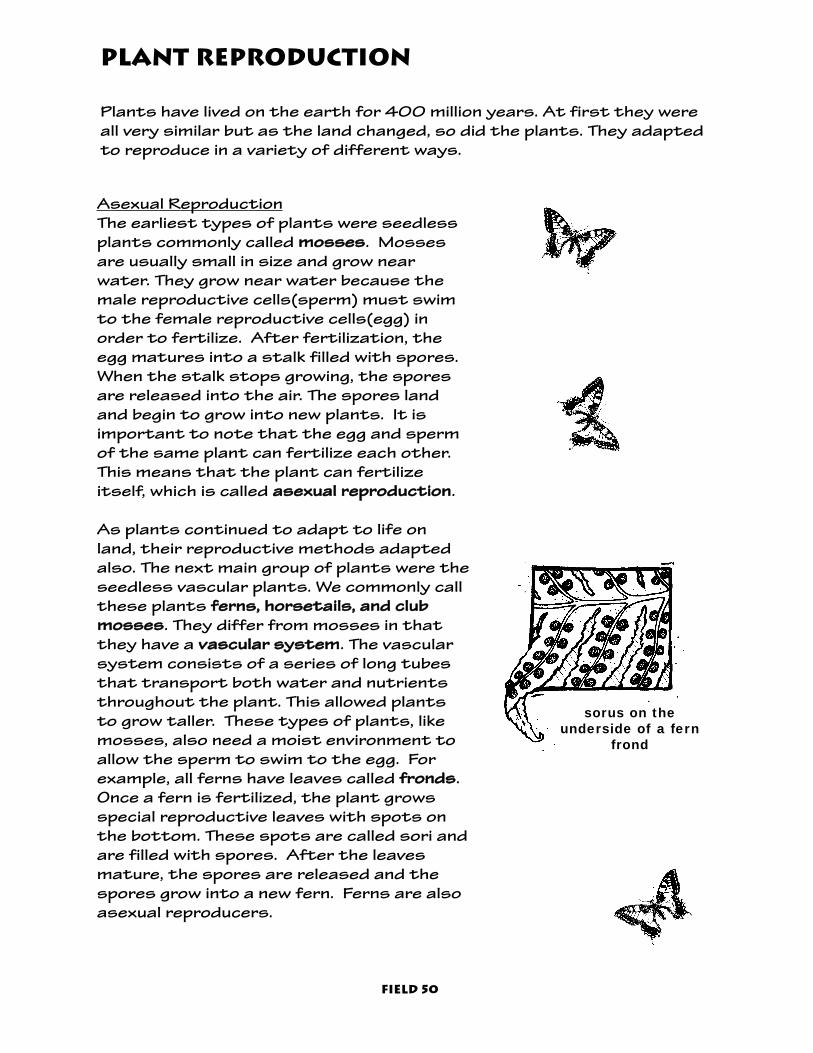
Field 50
Plant reproduction
Plants have lived on the earth for 400 million years. At first they wereall very similar but as the land changed, so did the plants. They adaptedto reproduce in a variety of different ways.
Asexual ReproductionThe earliest types of plants were seedlessplants commonly called mmoosssseess. Mossesare usually small in size and grow nearwater. They grow near water because themale reproductive cells(sperm) must swimto the female reproductive cells(egg) inorder to fertilize. After fertilization, theegg matures into a stalk filled with spores.When the stalk stops growing, the sporesare released into the air. The spores landand begin to grow into new plants. It isimportant to note that the egg and spermof the same plant can fertilize each other.This means that the plant can fertilizeitself, which is called aasseexxuuaall rreepprroodduuccttiioonn.
As plants continued to adapt to life onland, their reproductive methods adaptedalso. The next main group of plants were theseedless vascular plants. We commonly callthese plants ffeerrnnss,, hhoorrsseettaaiillss,, aanndd cclluubbmmoosssseess. They differ from mosses in thatthey have a vvaassccuullaarr ssyysstteemm. The vascularsystem consists of a series of long tubesthat transport both water and nutrientsthroughout the plant. This allowed plantsto grow taller. These types of plants, likemosses, also need a moist environment toallow the sperm to swim to the egg. Forexample, all ferns have leaves called ffrroonnddss.Once a fern is fertilized, the plant growsspecial reproductive leaves with spots onthe bottom. These spots are called sori andare filled with spores. After the leavesmature, the spores are released and thespores grow into a new fern. Ferns are alsoasexual reproducers.
sorus on the underside of a fern
frond

Sexual ReproductionAs plants adapted further, they becameseed plants, called ggyymmnnoossppeerrmmss. Theseplants produce uncovered seeds. Themost common types are conifer (coneproducing) plants. In these plants, themale (sperm producing) and female (eggproducing) reproductive parts are separated. For example, conifers like aDouglas-Fir, have both a male and femalecone. The female cone holds many eggsand the male cone holds many spermcalled ppoolllleenn. When the male cone ismature it releases the pollen. The pollenis carried by the wind, water or animalsto the female cone. Once fertilizationoccurs, the fertilized egg becomes aseed. The seed is then released and carried by the wind to grow into a newtree. Unlike mosses and ferns, the eggand sperm of most gymnosperms cannot fertilize themselves; they must fertilize adifferent plant. This is called sseexxuuaall rreepprroodduuccttiioonn.
Like gymnosperms, most angiosperms reproduce sexually. AAnnggiioossppeerrmmss produceseeds enclosed in fruits. Flowering plants arethe most common and diverse plant group,with over 250,000 species. The flower is thereproductive part of flowering plants and itcontains both the male and female parts. Themale part holds the pollen and the female partholds the eggs. Some plants are fertilizedwith the help of birds, insects, or wind, whichcarry the pollen(sperm) to other plants whereit comes into contact with the female egg.Once this happens, the fertilized egg developsinto a fruit. Within the fruit are the seeds.Some seeds may be dispersed by animals,water and wind.
Field 51
Soil and plant growth
Plants make their own food using energy from sunlight and essential nutrients in the form of chemical elements. Plants require some nutrients in large amounts for rapid growth.These nutrients include: carbon, oxygen, hydrogen, nitrogen, phosphorus, and potassium.Plants get carbon, oxygen, and hydrogen fromwater and air and get nitrogen, phosphorus, andpotassium from the soil.
Water, entering the soil, dissolves nutrients inthe soil, forming a soil solution. Plant rootsabsorb dissolved nutrients from the soil solutionwhich is transported throughout the plant.Often nutrients are present in the soil, but not ina form that plants can use. Many factors affectthe “availability” of soil nutrients. One importantfactor is soil pH.
Columbia orTiger Lily
Red Columbine
Soil pH and plants
pH is a measure of how acidic or basic things areon a number scale from 0 to 14.
A pH less then 7 is acidic. Vinegar is acidic witha pH of about 3.5. A pH above 7 is basic.Ammonia is basic with a pH of 10. When soil pHis basic, it is usually called “alkaline.”
When soil is too acidic or too basic, essential soil nutrients, like nitrogen, phosphorus, and potassium, may not be available to plants.Most plants prefer neutral or slightly acidicsoils in the pH range of 6.0 - 6.8.
(SEE pH SCALE FOR SOILS AT THE END OF THIS SECTION)
0 7 14
acidic basicneutral
field 52

plants and the food web
Since plants make their own food, they are the PRIMARY PRODUCERS in the food web. Herbivores (plant eaters) includingmany insects, have adapted to eat the leaves, seeds, fruits,flowers, pollen, wood, sap, and other parts of plants. The typesof plant species that exist in an ecosystem can determine whatorganisms may feed and live there.
Decomposers (often referred to as the ‘FBI’--fungi, bacteria,and insects) break down organic and non-organic matter intonutrients needed by plants. A conifer needle usually passesthrough several organisms’ bodies before it’s carbon andnitrogen are available to plants.
a green habitat
The cchhlloorroopphhyyllll in plants gives them their green color (chloro-phyll is also necessary for the process of photosynthesis).Green leaves shelter many organisms from harsh weatherand predators. Many birds, insects, and wildlife make theirhomes in, on, under, and around plants. The type of habitatthat plant communities provide may be described in terms ofhabitat structure. HHaabbiittaatt ssttrruuccttuurree is the shape, size, andplacement of vegetation--understory, mid-section, and over-story. As plant communities in a given area change over time,so do the organisms that live there.
“The flower is the poetryof reproduction. It is anexample of the eternalseductiveness of life.”
--Jean Giraudoux (1882-1944)
French Author
Field 53

disturbance and diversity
Changes in plant communities mayresult from disturbance. Some plantsquickly move in and thrive in recentlydisturbed areas, while others slowlytake root as the ecosystem recovers.Disturbances such as clear-cutting,windstorms, landslides or fire usuallyalter the lifeforms found in soils too.Such changes often affect the diversity of plants, which in turn mayaffect the diversity of other organisms present.
Reed Canary Grass - an invasive plant
invasive plants
IInnvvaassiivvee, exotic, introduced and non-native plants are terms that apply toplants that do not occur naturally in anarea. Some examples found in thePacific Northwest are Reed CanaryGrass, Scotch Broom, HimalayanBlackberry and English Ivy. Non-nativesmay enter ecosystems on the fur ofwildlife, through the intestines of birds,flooding, trains livestock, or by plant-ings of exotic species. These invasiveplants may adversely affect nativeplants by competing for resourcessuch as space, nutrients, or moisture.Many invasive plants lack naturalenemies and are adapted to disturbed conditions, thus makingthem difficult to eradicate. The invasion of non-native plants intoecosystems is a complex issue, and iscurrently the focus of many management activities.
Common Fox Glove - thrives in disturbed areas
field 54

plant Ecology in the Field
Materials Needed:
standard field equipment
clippers
densiometer
digital camera (if available)
field vests
GPS (if available)
HHeelllliiggee--TTrruuoogg SSooiill RReeaaccttiioonn((ppHH)) TTeesstt KKiitt
leaf rubbing materials: charcoal pencil & tracing paper
plant presses
Plant Transect Map
shovel
soil auger
trowel
field 55
methods and techniques
CCOOMMPPLLEETTIINNGG AA PPLLAANNTT TTRRAANNSSEECCTT MMAAPP
Record azimuth. Fill in rosette with cardinal directions (N,S,E,W). With numbers,record where you collect each specimen andthe characteristics of that spot (Rememberto record the length of the transect). Seeexample below.

CCOOLLLLEECCTTIINNGG AANNDD PPRREESSSSIINNGG PPLLAANNTTSS**Number plants in your presses to match yourtransect map. Collect specimens (using the 1 in20 rule**) that grow in various habitats and rep-resent different kinds of plants (herbs, shrubs,etc.). Record the habitats along the transect.
* Before beginning collection, discuss local endangered/threatened/rare species to observe,but not collect.
** The 1 in 20 rule means that if there are morethan 20 species of a plant in an area, then youmay take a sample. If there are less than 20,sketch it.
field 56
CCOOLLLLEECCTTIINNGG AA SSOOIILL SSAAMMPPLLEE
Use a trowel, shovel, or soil auger to collect asoil sample from a depth of 2-6 inches.
On your Soil Data Sheet, describe the:
Soil Sample Area. What kinds of plants (if any) are growing there?Is the area sunny or shaded? sloping or flat?etc.
Soil Color (see chart).This information helps to determine whetherthe soil is fertile or aerated.
soil auger

SSOOIILL CCOOLLOORR AANNDD PPLLAANNTT GGRROOWWTTHH
The color of the soil is affected by organic matter, minerals,moisture, oxidation, weathering, decaying plant and animal material. Soil fertilityrefers to the ability of the plant to grow (affected by the amount oforganic material). Soil aeration is the ability of air to penetrate the soil,and thus water, which also affects the ability of the plant to grow. Darksoils are usually rich in plant nutrients. Grey soils may contain more clayor indicate waterlogged soil. Light brown soils may contain more sand.Red or orange colors may show that iron in the soil has reacted with airor water.
field 57
SSooiill CCoolloorr AAeerraattiioonnFFeerrttiilliittyy
Dark (grey or brownish black)
Moderately Dark (brown to yellow-brown)
Light (pale brown to yellow)
High
Low
Medium
Low
High
High
SSOOIILL PPHH TTEESSTTIINNGG UUSSIINNGG TTHHEE HHEELLLLIIGGEE--TTRRUUOOGG SSOOIILL RREEAACCTTIIOONN ((PPHH)) TTEESSTT KKIITT
(1) Place a small amount of dry soil from your sample in a testplate cavity, filling it one-fourth full.
(2) Add about two drops of the Triplex Indicator solution tothe soil, until the soil sample is saturated but not flooded.
(3) Use the spatula to mix the solution and soil. Move thesoil to one side of the cavity, smoothing the sloping surfacewith the spatula. A film of solution should be present on thesoil surface and a trace of solution should rest at the bottom of the cavity. If more than a trace of solutionappears in the cavity bottom, mix in more soil from your sample to absorb the excess solution.
(4) Immediately cover the moist soil surface with a dusting of Soil Reaction Powder, adding just enough to uniformly cover the soil surface and completely hide the soilcolor.
(5) Wait for two minutes, then compare the color of the reaction powder to the Color and pH Scale. Make the closest match possible to estimate the pH of your soil sample. Record your data. Refer to pH Scale for Soils Chart.
(6) Discard the soil sample in a waste container.
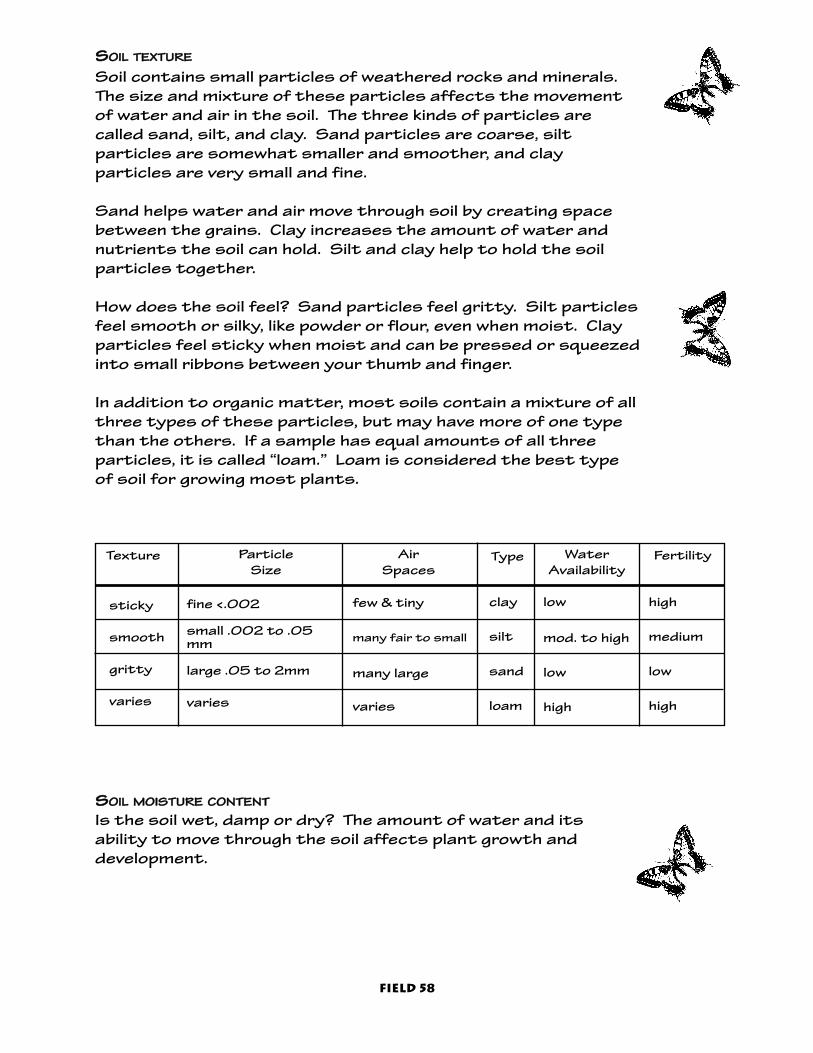
Texture Particle Size
Type Water Availability
Air Spaces
sticky
smooth
gritty
varies
fine <.002
small .002 to .05mm
large .05 to 2mm
varies
clay
silt
sand
loam
few & tiny
many fair to small
many large
varies
Fertility
high
medium
low
high
low
mod. to high
low
high
field 58
SSOOIILL MMOOIISSTTUURREE CCOONNTTEENNTT
Is the soil wet, damp or dry? The amount of water and its ability to move through the soil affects plant growth and development.
SSOOIILL TTEEXXTTUURREE
Soil contains small particles of weathered rocks and minerals.The size and mixture of these particles affects the movementof water and air in the soil. The three kinds of particles arecalled sand, silt, and clay. Sand particles are coarse, silt particles are somewhat smaller and smoother, and clay particles are very small and fine.
Sand helps water and air move through soil by creating spacebetween the grains. Clay increases the amount of water and nutrients the soil can hold. Silt and clay help to hold the soilparticles together.
How does the soil feel? Sand particles feel gritty. Silt particlesfeel smooth or silky, like powder or flour, even when moist. Clayparticles feel sticky when moist and can be pressed or squeezedinto small ribbons between your thumb and finger.
In addition to organic matter, most soils contain a mixture of allthree types of these particles, but may have more of one typethan the others. If a sample has equal amounts of all three particles, it is called “loam.” Loam is considered the best typeof soil for growing most plants.

Inquiring Minds Want to Know:
How has the site’s disturbance history affected the plantsin the area?
How do these plants fit into the overall food web of the ecosystem?
How are the plants at the site adapted specifically to thebiotic and abiotic conditions?
How do the soil characteristics affect the plants that growin the immediate area?
How do the plants affect the insect and wildlife species atthe site?
How much effect do invasive plant have on the area?
field 59
plant ecology Teaching Tips
Remind students that plant clippersand soil auger are potentially dangerous with sharp edges andmust be used safely.
Bee stings are a greater possibilitywith this activity. Ask students,point blank, if anyone is allergic tobee stings. If so, this probably is notthe team for them.
Remind students to sanitize handsafter examining plants and soil andbefore eating.
Leading Questions to ask students:What animals and insects use plantsfor food? For habitat? For shelter?
How do herbivores influence plantgrowth? Carnivores?
How do different leaf adaptationsaffect intake of sunlight? Moisture?
How do slope and ground coveraffect soil erosion?
Why do invasive species often overtake native plants? How did theinvasives arrive?
How do plant communities under thecanopy differ from those growing inopen fields? Why?
Are there patterns in the way plantsare distributed in a habitat?Random? Clumped? Uniform?
What do think is the most important management issue forplants in a terrestrial ecosystem?
Resources toLearn MoreAbout plants:
Websites:http://district.gresham.k12.or.us/ghs/nature/plants/flwrid.htm Simple flower idkey with bright, beautiful photos ~ very easy to use.
http://www.id.blm.gov/iso/931/soil/soil.htm “The dirton Dirt” ~ and it really is! Soilbasics, including food web, aswell as advanced information.
Books/Field Guides:Plants of the PacificNorthwest Coast Editedby Pojar and MacKinnon.Great details and photos ofeach plant, with a section onnative/historical uses.
Oregon Wildflowers: A children’s guide to thestate’s most commonflowers by Beverly Magley &DD Dowden. A beautifullyillustrated guide!
First Field Guide:Wildflowers by the NationalAudubon Society.
Curriculum:Celebrating Wildflowers: AnEducators Guide to theAppreciation andConservation of NativePlants of Washington byWendy Scherrer & TracieJohannessen. Obtainthrough the North CascadesInstitute.
field 60

____
____
____
____
____
____
____
____
____
____
____
____
____
____
____
pla
nt
tr
an
sec
t m
ap
Sch
oo
l:
Sit
e:
Da
te:
Pla
nt
Te
am
:
Ro
se
tte
Be
sur
e to
ad
d n
orth
ar
row
and
labe
l ros
ette
Len
gt
h o
f Tr
an
se
ct__
____
____
____
Azi
mu
th
: ___
____
__ o
Dis
cus
s:
Why
do
plan
ts a
long
thi
s t
rans
ect
grow
is s
uch
a w
ay (
Thin
k d
istu
rban
ce a
nd d
ispe
rsal
)?
Field 61

Plant Description Habitat/Ecosystem Description
wolftreeplant ecology data
running field list
Plant #
1
2
3
4
5
6
7
8
9
10
11
12
13
14
15
16
Field 62

field 63
School_______________________________Site_____________________________Date____________
Plant Team____________________________________________________________________________
Weather Conditions____________________________________________________________________
wolftreeplant ecology data
Plant I.D. #: Sketch plant or plant part to scale:
Key Identification Features:
Evidence of Wildlife Activity on Plant? ❒ Yes ❒ No If yes, describe:
% Shade Cover_______________
Evidence of Insect Activity on Plant? ❒ Yes ❒ No If yes, describe:
Common Name:
Native or Invasive?
Describe how the plant has adapted to survivein this habitat?
Method of Reproduction
❒ Asexual Describe:
❒ Sexual: ❒ Gymnosperm ❒ AngiospermDescribe:
Method of Dispersal (i.e. wind, wildlife, etc.):
__
__
__
__
__
__
__
__
__ __ __ __ __ __ __ __ __ __ __
__
__
__
__
__
__
__
__
__ __ __ __ __ __ __ __ __ __ __

field 64
SOIL SAMPLE 1 SOIL SAMPLE 2
Describe soil sample area
in detail.(Plants
present,sun/shade,slope, etc.)
Is soil erosionoccurring?Why or why
not?
Color(Refer to chart
on page 46)
Moisture
Texture(Refer to chart
on page 47)
❒ Dark (grey or brownish-black)
❒ Moderately Dark (brown to yellow-brown)
❒ Light (pale brown to yellow)
❒ Wet❒ Damp❒ Dry
❒ sticky = clay❒ smooth = silt❒ gritty = sand❒ varied = loam
pH
❒ sticky = clay❒ smooth = silt❒ gritty = sand❒ varied = loam
❒ Wet❒ Damp❒ Dry
❒ Dark (grey or brownish-black)
❒ Moderately Dark (brown to yellow-brown)
❒ Light (pale brown to yellow)
wolftreePlant Ecology
soil data
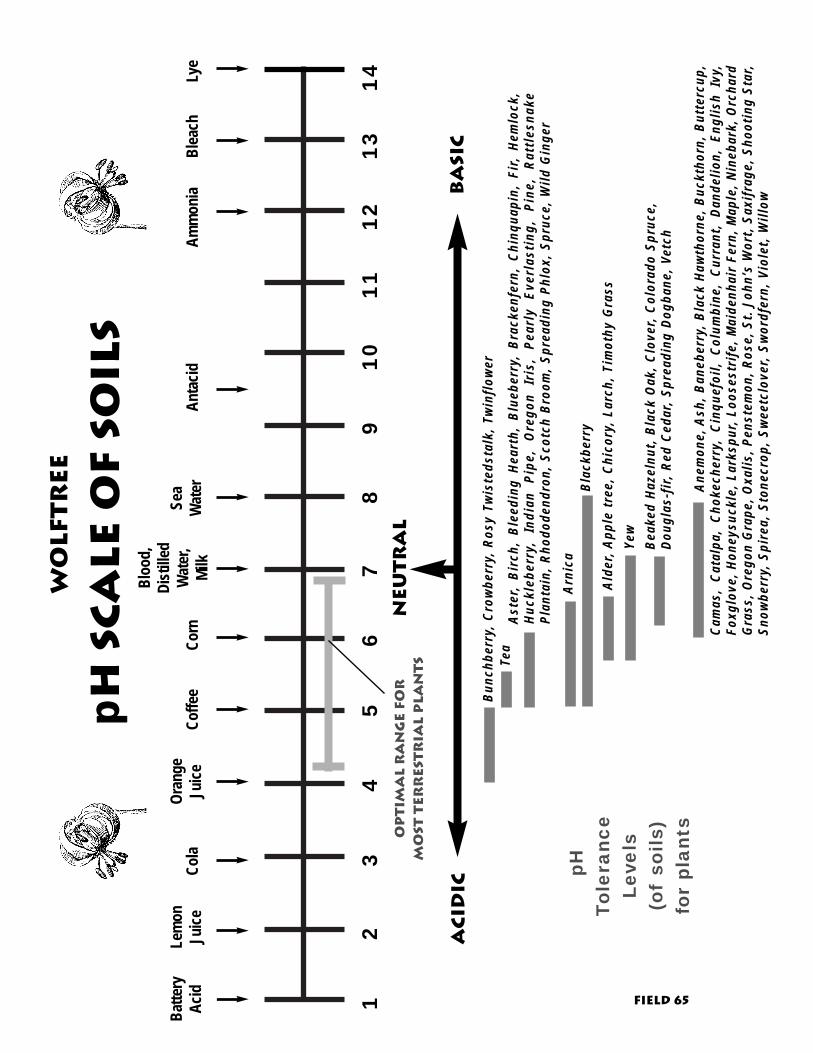
12
34
56
78
910
1112
1314
Ne
ut
ra
l
ba
sic
ac
idic
Bat
tery
Aci
dLe
mon
Juic
eC
ola
Cof
fee
Cor
n
Blo
od,
Dis
tille
dW
ater
,M
ilkA
mm
onia
Ant
acid
Ble
ach
Lye
Ora
nge
Juic
eSe
aW
ater
p H S
ca
le o
f so
ils
pHTo
lera
nce
Leve
ls(o
fso
ils)
fo
r pl
ants
Blac
kber
ry
Beak
ed H
azel
nut,
Blac
k O
ak, C
love
r, Co
lora
do S
pruc
e,Do
ugla
s-fir
, Red
Ced
ar, S
prea
ding
Dog
bane
, Vet
ch
Aste
r, Bi
rch,
Ble
edin
g He
arth
, Bl
uebe
rry,
Bra
cken
fern
, Ch
inqu
apin
, Fi
r, He
mlo
ck,
Huck
lebe
rry,
Ind
ian
Pipe
, O
rego
n Ir
is,
Pear
ly E
verl
asti
ng,
Pine
, Ra
ttle
snak
ePl
anta
in, R
hodo
dend
ron,
Sco
tch
Broo
m, S
prea
ding
Phl
ox, S
pruc
e, W
ild G
inge
r
Alde
r, Ap
ple
tree
, Chi
cory
, Lar
ch, T
imot
hy G
rass
Tea
Bunc
hber
ry, C
row
berr
y, R
osy
Twis
teds
talk
, Tw
inflo
wer
Op
tim
al
ra
ng
e f
or
mo
st t
er
re
str
ial
pla
nt
s
Wo
lft
re
e
Arni
ca
Yew
Anem
one,
Ash
, Ban
eber
ry, B
lack
Haw
thor
ne, B
uckt
horn
, But
terc
up,
Cam
as,
Cata
lpa,
Cho
kech
erry
, Ci
nque
foil,
Col
umbi
ne,
Curr
ant,
Dand
elio
n, E
nglis
h Iv
y,Fo
xglo
ve, H
oney
suck
le, L
arks
pur,
Loos
estr
ife, M
aide
nhai
r Fe
rn, M
aple
, Nin
ebar
k, O
rcha
rdG
rass
, Ore
gon
Gra
pe, O
xalis
, Pen
stem
on, R
ose,
St.
John
’s W
ort,
Saxi
frag
e, S
hoot
ing
Star
,Sn
owbe
rry,
Spi
rea,
Sto
necr
op, S
wee
tclo
ver,
Swor
dfer
n, V
iole
t, W
illow
field 65
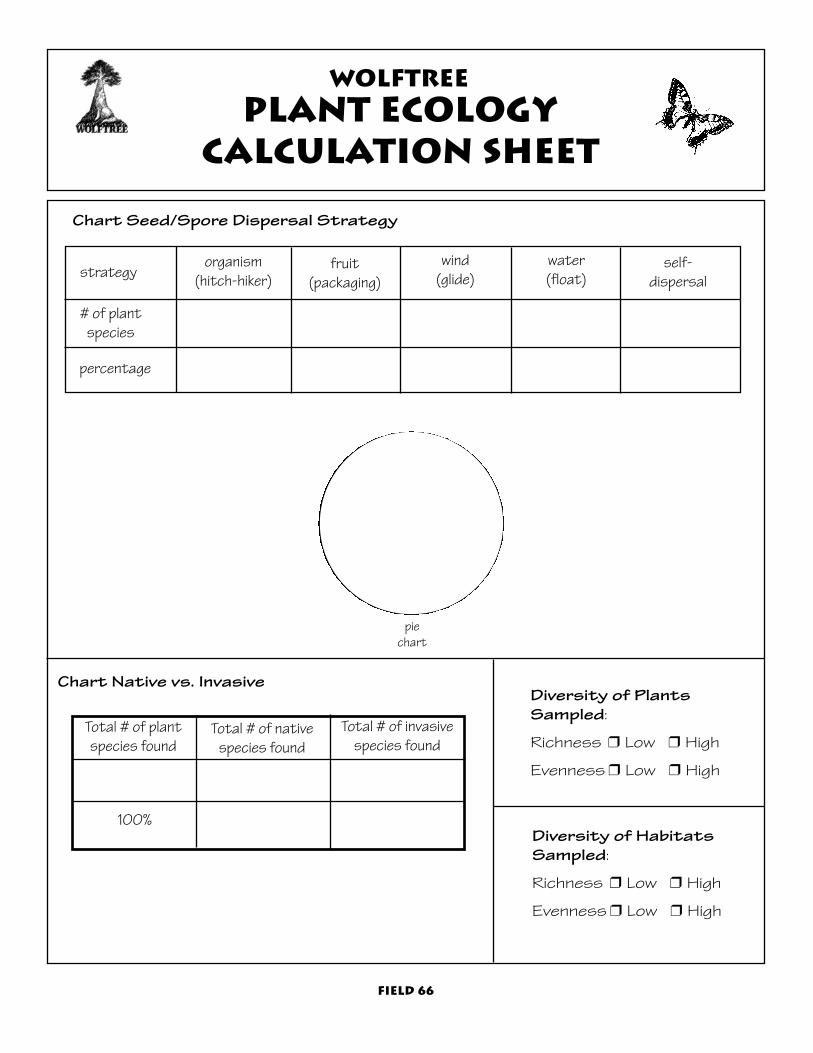
field 66
wolftreeplant ecology
calculation sheet
Chart Native vs. InvasiveDiversity of PlantsSampled:
Richness ❒ Low ❒ High
Evenness ❒ Low ❒ High
Total # of plant species found
Total # of nativespecies found
Total # of invasive species found
100%
Chart Seed/Spore Dispersal Strategy
self-dispersal
fruit(packaging)
strategy
# of plantspecies
percentage
organism(hitch-hiker)
wind(glide)
water(float)
piechart
Diversity of HabitatsSampled:
Richness ❒ Low ❒ High
Evenness ❒ Low ❒ High
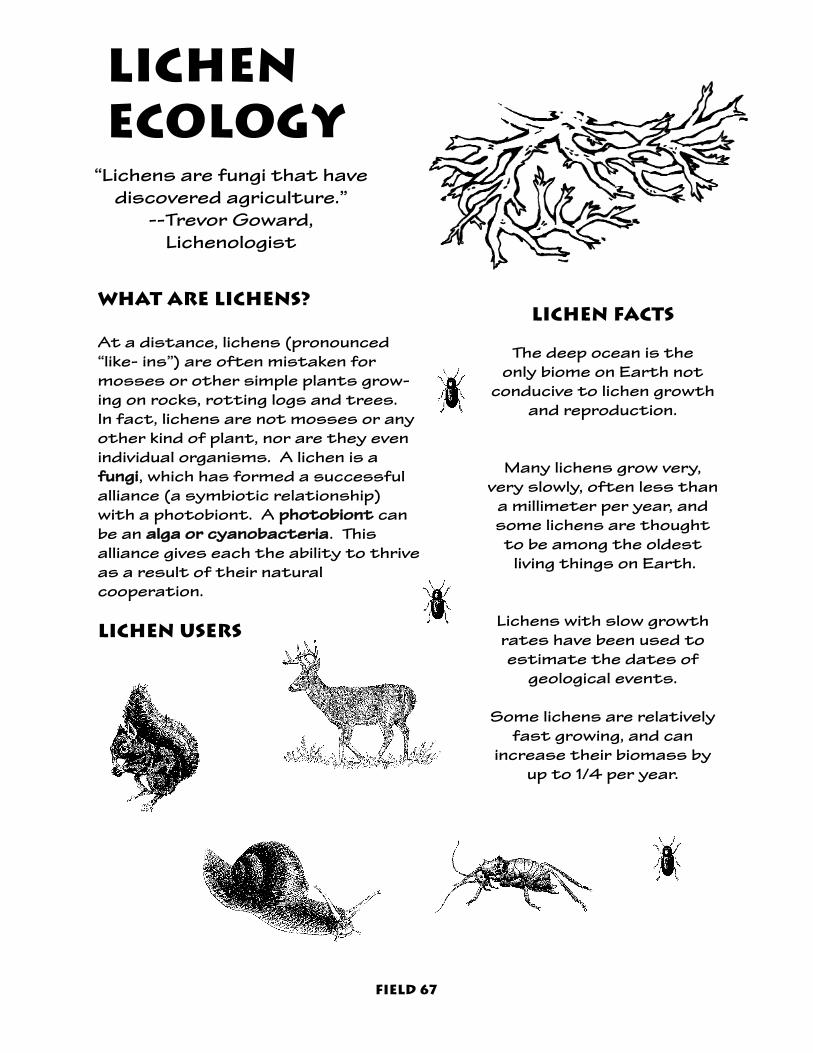
LichenEcology
What are lichens?
At a distance, lichens (pronounced “like- ins”) are often mistaken formosses or other simple plants grow-ing on rocks, rotting logs and trees.In fact, lichens are not mosses or anyother kind of plant, nor are they evenindividual organisms. A lichen is affuunnggii, which has formed a successfulalliance (a symbiotic relationship)with a photobiont. A pphhoottoobbiioonntt canbe an aallggaa oorr ccyyaannoobbaacctteerriiaa. Thisalliance gives each the ability to thriveas a result of their natural cooperation.
lichen users
“Lichens are fungi that have discovered agriculture.”
--Trevor Goward,Lichenologist
Field 67
lichen FACTS
The deep ocean is the only biome on Earth not
conducive to lichen growthand reproduction.
Many lichens grow very,very slowly, often less than
a millimeter per year, andsome lichens are thought
to be among the oldestliving things on Earth.
Lichens with slow growthrates have been used to estimate the dates of
geological events.
Some lichens are relativelyfast growing, and can
increase their biomass byup to 1/4 per year.

FUNGI, and photobionts
FUNGI (Kingdom Fungi). The namefungi comes from the Latin word fungus, which means “mushroom.”Fungi are organisms that obtainfood by decomposing organicmatter, like wood and leaves.Fungi are not plants - they can-not carry out photosynthesis.
PHOTOBIONTS contain chlorophyll and carryout photosynthesis to produce food throughsunlight.
There are two photobionts that can ally with a fungus to create a lichen:
ALGAE (Kingdom Protista) are simple, mostlywater, but also land dwelling, organisms. Algaeare so plentiful that they produce 90 percentof the worlds’ atmospheric oxygen.
CYNOBACTERIA (Kingdom Monera) are a groupof blue-green bacteria that live throught theworld, mostly in water, but also on land. Somecynobacteria carry out important nitrogen fix-ation.
Some lichens contain both algae and cynobacteria. These lichens then are made upof members from three kingdoms!
How lichens work
The fungi usually gives the lichen its overallshape and structure. The photobiont part, usually in an inner layer below the lichen surface, makes its food directly from sunlight(photosynthesis) and shares it with the fungus. In all cases, each partner providesthings the other could not get on its own.
A Lichen Love Story:Frieda Fungi &
Alec Algae
Alec Algae was wandering the forest
looking for a place to live.Frieda Fungi had a nice
place to live, but did notknow how to cook. Alec
came upon Frieda’s housein the woods. He toldFrieda that he was a
great cook. Frieda wasquite pleased and invited
him to cook up a meal.So Alec cooked a
fabulous meal andoffered to provide all thefood for the two of them.
In turn, Frieda offeredhim a place to live. Alecand Frieda took a lichento one another and lived
happily ever after.
Field 68
From Hale, Univ. of Michigan

tough yet sensitive
Lichens live successfully in many different habitatsand some can live to be hundreds and even thousands of years old. Lichens have a remarkableresistance to drought. A dry lichen can absorbfrom 3 to 35 times its weight in water in seconds!Lichens can also absorb moisture from dew or fog,even from the air itself if the humidity is very highand the temperature is low. They also dry out slowly, making it possible for the algae to makefood for as long as possible. This ability to quicklyabsorb and retain water from many sources makesit possible for lichens to live in harsh environmentslike deserts and polar regions, and on exposed surfaces like bare rocks, roofs and tree branches.
As tough as lichens are, many do not stand up verywell to changes in the condition of the air. Lichensare like little sponges that absorb everything thatcomes their way. They obtain most of their waterand nutrients from the air. As a result, they areparticularly sensitive to changes in air quality. Thedeath of sensitive lichens and an increase in hardieror better adapted species in an area can be anearly warning, or indicator, that conditions in theair are changing. Heavy metals, gasses, and acidrain all effect lichens in one way or another.
NOTE: In the field you can often detect stressed outlichens by dramatic increase of the number of their reproductive structures (like apothecia).
Field 69
lichen habitat
Lichens can be found in almost anynatural habitat in the PacificNorthwest. The surface that alichen grows on is called the ssuubbssttrraattee. The substrate of lichenis usually wood, rock or soil, but canalso be sand, animal bones, or metal,and occasionally even free-living,blowing in the wind.

Why like lichens?
Diversity. Lichens contribute to diversity in nature. There areat least 1,000 known species in the Pacific Northwest, 3,600in the United States and over 25,000 worldwide.
Food Web. Lichens provide food, shelter and nesting materialfor wildlife such as deer, elk, moose, caribou, mountain goats,bighorn sheep, squirrels, mice, bats, insects and birds. Amonginvertebrates, katydids, grasshoppers, webspinners, butterflies, moths, mites, spiders, snails, slugs and many beetles live on, mimic or eat lichens. In deep snow conditions,lichens provide important winter survival food for deer andother mammals.
Pioneer Species. Lichens are pioneers on newly cleared rockand soil surfaces, such as burned forests, volcanic flows andnewly exposed surfaces when a glacier retreats.
Erosion Control. In deserts, lichens stabilize soils and reduce erosion.
Nitrogen Fixers. Some lichens make nitrogen in the air usableto plants.
Usable. Lichens also produce an arsenal of more than 500unique biochemical compounds. Some of these are used by humans inmedicines, perfumes, and dyes.
Did you know that lichen extract in some underarm deoderantshelps us stay fresh smelling?
Field 70
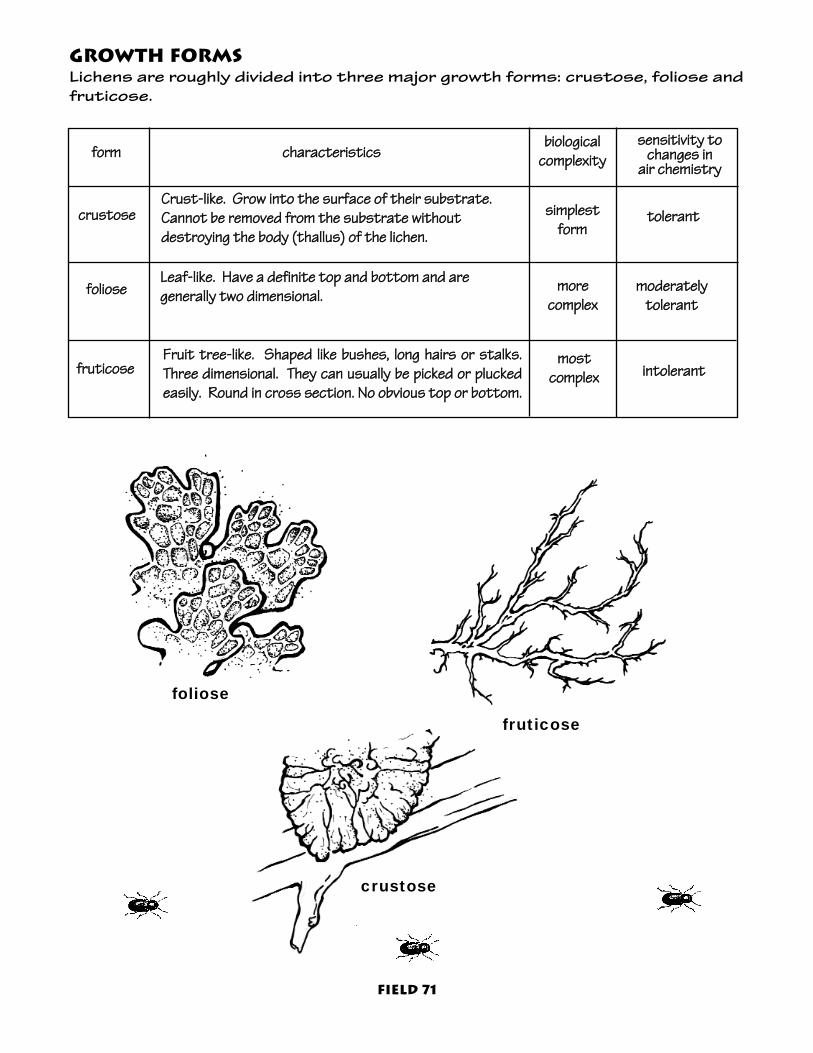
foliose
fruticose
crustose
Growth formsLichens are roughly divided into three major growth forms: crustose, foliose and fruticose.
ccrruussttoossee
ffoolliioossee
ffrruuttiiccoossee
ffoorrmmsseennssiittiivviittyy ttoo
cchhaannggeess iinn aaiirr cchheemmiissttrryy
CCrruusstt--lliikkee.. GGrrooww iinnttoo tthhee ssuurrffaaccee ooff tthheeiirr ssuubbssttrraattee..CCaannnnoott bbee rreemmoovveedd ffrroomm tthhee ssuubbssttrraattee wwiitthhoouuttddeessttrrooyyiinngg tthhee bbooddyy ((tthhaalllluuss)) ooff tthhee lliicchheenn..
bbiioollooggiiccaallccoommpplleexxiittyycchhaarraacctteerriissttiiccss
ssiimmpplleesstt ffoorrmm
mmoorree ccoommpplleexx
mmoosstt ccoommpplleexx
ttoolleerraanntt
iinnttoolleerraanntt
mmooddeerraatteellyyttoolleerraanntt
LLeeaaff--lliikkee.. HHaavvee aa ddeeffiinniittee ttoopp aanndd bboottttoomm aanndd aarree ggeenneerraallllyy ttwwoo ddiimmeennssiioonnaall..
FFrruuiitt ttrreeee--lliikkee.. SShhaappeedd lliikkee bbuusshheess,, lloonngg hhaaiirrss oorr ssttaallkkss..TThhrreeee ddiimmeennssiioonnaall.. TThheeyy ccaann uussuuaallllyy bbee ppiicckkeedd oorr pplluucckkeeddeeaassiillyy.. RRoouunndd iinn ccrroossss sseeccttiioonn.. NNoo oobbvviioouuss ttoopp oorr bboottttoomm..
Field 71

REPRODUCTION AND DISPERSAL
Currently, there are several known ways inwhich lichens can reproduce:
SEXUALLYCommonly, the fungal partner producessaucer-like fruiting bodies, called aappootthheecciiaa.These disk-shaped structures produce fungalspores, which are similar to seeds. However,this only reproduces another fungus, whichcan not live without its photobiont partner.
ASEXUALLYLichens also reproduce by making little packages that contain both the fungus andthe photobiont. Sometimes the inner “stuffing” of the lichen may become exposedhere and there at the surface as clusters oftiny, powdery balls. In other cases, the uppersurface may bear tiny, wart-like outgrowths.When these powdery balls, called ssoorreeddiiaa, orwart-like outgrowths, called iissiiddiiaa, are carriedto new places, by birds for example, they maygrow into new lichens.
Field 72
Apothecium
Isidian (“icicle-like”)
Soredia (“open sores”)
Podetium
Lobe
All images on this page are from the Department of Botany, Oregon State University
structural features
Features commonly used to identify lichensand distinguish species include shape, size andcolor of the tthhaalllluuss, or body, and lloobbeess, whichare branches or fingers of the thallus. Theaappootthheecciiaa of a lichen are the disk or cupshaped structures on the end of the lobeswhich bear spores. A ppooddeettiiuumm is a thallusshape which resembles an upright, hollow column or stalk.

Field 73
Wolf Lichen
Wolf lichen (Letharia vulpina), a brilliant fluorescent yellow green lichen, was the most widely used dyelichen for native people in North America, especiallyalong the west coast.
Wolf lichen is poisonous because of vulpinic acidwithin its yellow pigment. Its name reflects its traditional use in northern Europe as a poison forwolves, and the Achomawi used it (sometimes withrattlesnake venom added) to make poison arrowheads. Nonetheless, the Blackfoot and theOkanagan-Colville took Letharia as a medicinal tea.The Apache painted wolf lichen crosses on their feetso they could pass their enemies unseen. Althoughcommon and widespread, Letharia species sufferfrom local harvesting for floral arrangements.
In another example of ritualistic use of lichens, theGitksan in British Columbia associated the lichen(Lobaria pulmonaria) with frogs and used it an aspring bathing ritual to bring health and long life.
Letharia Vulpina“Wolf Lichen”
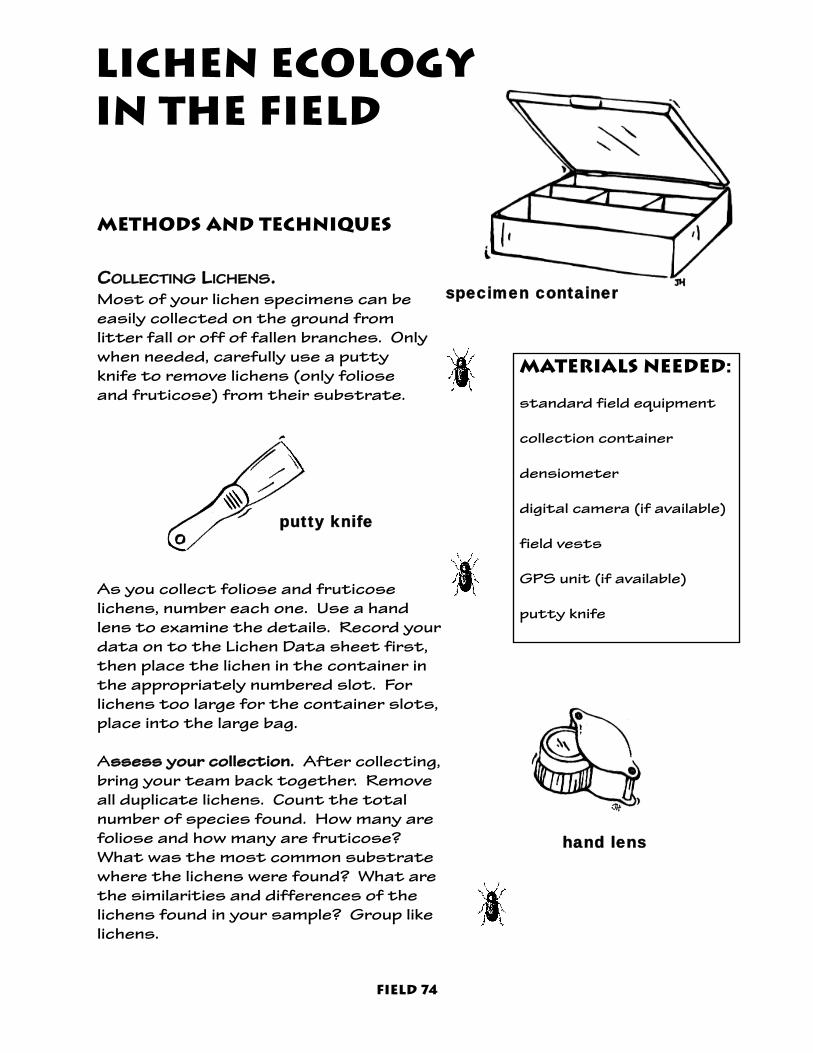
lichen Ecology in the Field
Materials Needed:
standard field equipment
collection container
densiometer
digital camera (if available)
field vests
GPS unit (if available)
putty knife
Field 74
methods and techniques
CCOOLLLLEECCTTIINNGG LLIICCHHEENNSS..Most of your lichen specimens can beeasily collected on the ground from litter fall or off of fallen branches. Onlywhen needed, carefully use a puttyknife to remove lichens (only folioseand fruticose) from their substrate.
specimen container
putty knife
As you collect foliose and fruticoselichens, number each one. Use a handlens to examine the details. Record yourdata on to the Lichen Data sheet first,then place the lichen in the container inthe appropriately numbered slot. Forlichens too large for the container slots,place into the large bag.
Asssseessss yyoouurr ccoolllleeccttiioonn.. After collecting,bring your team back together. Removeall duplicate lichens. Count the totalnumber of species found. How many arefoliose and how many are fruticose?What was the most common substratewhere the lichens were found? What arethe similarities and differences of thelichens found in your sample? Group likelichens.
hand lens

Field 75
IIDDEENNTTIIFFYY FFOOLLIIOOSSEE AANNDD FFRRUUTTIICCOOSSEE LLIICCHHEENNSS..
Foliose - Leaf- like. Lichens in this group havea definite top and bottom and are generallytwo dimensional. More complex form oflichen and more sensitive to pollution.
Fruticose - Fruit tree-like. Lichens shapedlike little bushes, long hairs, or stalks. Theyare three dimensional and stick up or hangdown and can be picked or plucked. Mostcomplex form of lichen and most sensitive topollution.
foliose“leaf-like”
fruticose“fruit tree-like”

Field 76
lichen Resources:
Web Siteswww.fs.fed.us/r6/ag/lichen
http://mgd.NACSE.ORG/hyperSQL/lichenland/
http://www.herb.lsa.umich.edu/Kidpage/lichens.htm
http://lichen.com/
Field GuideMacrolichens of the Pacific Northwest byBruce McCune and Linda Geiser. Oregon StateUniversity Press. Corvallis. 1997.
inquiring minds want to know:
How might the area’s disturbance history affect the lichensyou collected and examined?
Did you notice any patterns to lichen growth and distribution?
Any similarities or differences between the two plots?
How do the lichens you collected fit into overall food web ofthe site?
How do you think the lichens that you collected are adaptedto their habitat?
What are some relationships between the lichens you col-lected and the other organisms in the area?
What are the major influences on the growth of lichens?
Did the lichens you collected tell you anything about the con-ditions of the air in the area?
Do lichens change as you look up and down in the canopy?

Field 77
School_________________________________ Mentors_______________________________________
Student Scientists____________________________________________________________________
Date_______________________________ Site_______________________________________________
Lichen #
Growth Form
Substrate Description or Name
Wolftree
Lichen ecology data
Abundance
❒ foliose
❒ fruticose
❒ foliose
❒ fruticose
❒ live wood❒ dead wood❒ soill❒ other________❒ litter fall
❒ live wood❒ dead wood❒ soil❒ other________❒ litter fall
❒ live wood❒ dead wood❒ soil❒ other________❒ litter fall
❒ live wood❒ dead wood❒ soil❒ other________❒ litter fall
❒ live wood❒ dead wood❒ soil❒ other________❒ litter fall
❒ live wood❒ dead wood❒ soil❒ other________❒ litter fall
❒ live wood❒ dead wood❒ soil❒ other________❒ litter fall
❒ live wood❒ dead wood❒ soil❒ other________❒ litter fall
❒ only one❒ less than ten❒ more than ten
❒ only one❒ less than ten❒ more than ten
❒ only one❒ less than ten❒ more than ten
Sensitivity (If species is known. UseMacrolichens Field Guide)
❒ sensitive❒ intermediate❒ tolerant
❒ sensitive❒ intermediate❒ tolerant
❒ sensitive❒ intermediate❒ tolerant
❒ foliose
❒ fruticose
❒ foliose
❒ fruticose
❒ foliose
❒ fruticose
❒ foliose
❒ fruticose
❒ foliose
❒ fruticose
❒ foliose
❒ fruticose
❒ only one❒ less than ten❒ more than ten
❒ only one❒ less than ten❒ more than ten
❒ only one❒ less than ten❒ more than ten
❒ only one❒ less than ten❒ more than ten
❒ only one❒ less than ten❒ more than ten
❒ sensitive❒ intermediate❒ tolerant
❒ sensitive❒ intermediate❒ tolerant
❒ sensitive❒ intermediate❒ tolerant
❒ sensitive❒ intermediate❒ tolerant
❒ sensitive❒ intermediate❒ tolerant

field 78
WolftreeLichen Data
calculation sheet
= 100%
%
%
total # of differentlichens collected:
# at plot 1:
# at plot 2:
pie chart
Graph Substrate Type
# using live wood
# using dead wood
# using soil
# using other
Plot 1 vs. Plot 2 Lichen Collections
Diversity of Plot 1 Sample:
Richness: ❒ Low ❒ High
Evenness: ❒ Low ❒ High
% of total:
Graph lichen forms:
FO FR
#
FO = folioseFR = fruticose14__
13__12__11__10__9 __8 __7 __6 __5 __4 __3 __2 __1 __
Diversity of Plot 2 Sample:
Richness: ❒ Low ❒ High
Evenness: ❒ Low ❒ High

Many aquatic insectslose their mouthparts
as adults and some onlylive in that stage for a
few hours.
The waterstrider“walks” across the
surface of water, usinghydrophobic hairs onthe end of its legs.
Prehistoric dragonflieslived around 300 millionyears ago. The wingspan
of this creature wasoften wider than 3 feet!
aquaticinvertebratesWhat are aquatic invertebrates?
Aquatic invertebrates are organisms thatlack a spine and live in water. Examples ofaquatic invertebrates include worms, crayfish, snails, clams and insects, such as dragonflies.
Incomplete Metamorphosis
(3 stages)Complete
Metamorphosis(4 stages)
Egg
Larva
Pupa
Winged Adult(Flying or Aquatic)
nymph
Flying Adult
egg
field 79
Aquatic insect life cycles
Some aquatic invertebrates are insects. Theybegin their life cycle as an egg, then go throughphysical changes with each stage in their lifecycle (mmeettaammoorrpphhoossiiss). Some invertebrates, likecaddisflies, have four stages in their life cycle,called ccoommpplleettee mmeettaammoorrpphhoossiiss. Mayflies andstoneflies are examples of insects that haveonly three stages in their life cycle. This is callediinnccoommpplleettee mmeettaammoorrpphhoossiiss. Insects’ forms andfunction are different at each stage.

MOUTH PARTS
TAILS OR CERCI
LEGS
aquatic Invertebrate anatomy
Some body parts of aquatic invertebrates are similar to terrestrial (land-based) insects. They have three body parts(head, thorax and abdomen), three pairs of legs and a set ofantennae. Some larvae will have unique structures, like gills,tails, claws and distinct mouthparts. These structures canhelp you distinguish different groups of invertebrates. Forinstance, many stoneflies have two tails and two claws oneach leg, while many mayflies have two or three tails and oneclaw on each leg.
ABDOMENTHORAX
ANTENNAE
HEAD
GILLS
GIANT STONEFLY
field 80
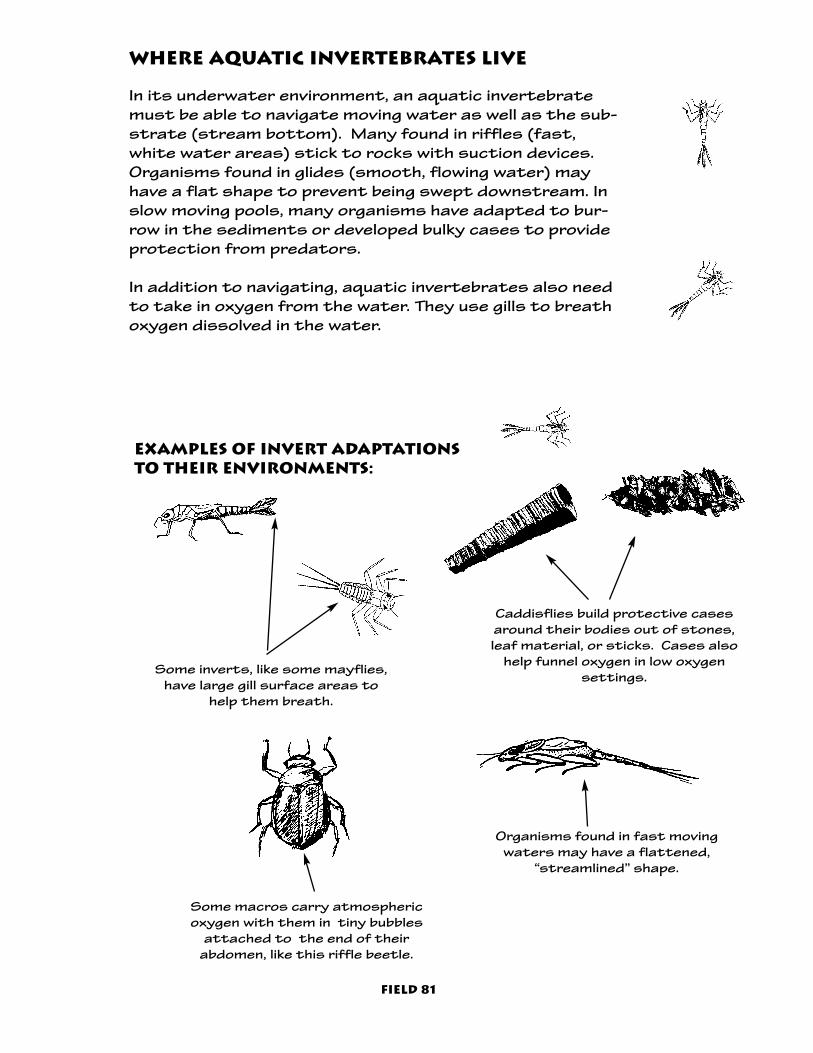
Some inverts, like some mayflies,have large gill surface areas to
help them breath.
Some macros carry atmospheric oxygen with them in tiny bubbles
attached to the end of their abdomen, like this riffle beetle.
Organisms found in fast movingwaters may have a flattened,
“streamlined” shape.
Caddisflies build protective casesaround their bodies out of stones, leaf material, or sticks. Cases also
help funnel oxygen in low oxygen settings.
Where aquatic invertebrates live
In its underwater environment, an aquatic invertebratemust be able to navigate moving water as well as the sub-strate (stream bottom). Many found in riffles (fast,white water areas) stick to rocks with suction devices.Organisms found in glides (smooth, flowing water) mayhave a flat shape to prevent being swept downstream. Inslow moving pools, many organisms have adapted to bur-row in the sediments or developed bulky cases to provideprotection from predators.
In addition to navigating, aquatic invertebrates also needto take in oxygen from the water. They use gills to breathoxygen dissolved in the water.
field 81
Examples of invert adaptationsto Their environments:

aquatic inverts and the Food Web
In addition to moving and breathing, an aquatic invertebrate must also get food in its underwaterenvironment in order to survive. Aquatic inverts can be separated into four main ffeeeeddiinngg ggrroouuppss (refer tochart below). Each feeding group has specific adaptations for obtaining and eating food, and lives ina specific part of the stream. What an inverte-brate eats may determine its role in the food web.For instance, plant life is eaten by a herbivorousmayfly, who is eaten by a predacious stonefly. A fish,in turn, eats the stonefly and an osprey eats the fish.
Collectors(caddisflies,
mayflies)
Dissolved organic
materials, suchas algae,
bacteria, feces,& small plants.
Physically gather food, or construct net-like structuresto catch food.
Shredders (mayflies, stoneflies,
caddisflies)
Leaves and vegetation
that have falleninto the water.
Use chewingmouthpartsdesigned to
shred, cut, bite,or bore.
Scrape algaeoff of rocks.
Scrapers(caddisflies,
mayflies)
Predators(Stoneflies,
beetles, dragonflies, alderflies)
Use specialrazor-like
mouthparts toscrape acrosshard surfaces.
Bodiesdesigned to
chase, capture and kill
their prey.
Live organisms.
FEEDINGGROUPS
WHAT THEY EAT
HOW THEYEAT
HABITAT
Substrate(Stream bottom)
Areas withlots of tree
canopycover.
Areas withenough light
to makealgae grow.
All habitattypes.
field 82

What Aquatic invertebrates tell us about the water
Scientists often use aquatic invertebrate populations to learn more about a riveror stream. They are used as iinnddiiccaattoorrss of water conditions for several reasons:
1) They are easy to collect.
2) Many, called sseennssiittiivvee , cannot survive changes in stream conditions such asthe introduction of pollution, high levels of sediments, high water temperatures, or low levels of dissolved oxygen (environmental stressors).Other species of aquatic invertebrates, called ttoolleerraanntt , can survive in waterswith changes in stream conditions and environmental stressors.
3) Many stay in a small area most of their lives.
The sensitivity and feeding groups of macroinvertebrate samples offer clues to how the aquatic system is functioning. For example, a sample taken from apool area with a sandy substrate is usually rich in insects that shred organicmaterials. This sample may indicate that the pool area is functioning as a holdingspot for organic debris and sediments. The diversity of macroinvertebrates in asample also informs aquatic biologists whether or not the ecosystem can support populations of amphibians, fish, birds, and other wildlife species.
Sensitive SomewhatTolerant
Tolerant
Caddisflies
Stoneflies
Mayflies
Dobsonflies
Alderflies
Craneflies
AquaticSowbug
Crayfish
Clams
Damselflies
Dragonflies
Midges
Black Flies
Riffle Beetles
Boatman
Backswimmers
Leeches
AquaticWorms
field 83

Sampling aquatic invertebrates
Materials Needed:
two large nets
3 1-gallon white tubs
white ice cube trays
waders
waterproof gloves
turkey baster
tweezers
magnifying boxes
small nets
FOR FAST MOVING WATER:life vests
throw rope
MMeetthhooddss aanndd TTeecchhnniiqquueess
Designate a section of the streamto sample from.
Organize and become familiar with equipment. Designate holding containers (white tubs) according towhere you will be sampling from: riffles, pools, and glides (This willallow you to compare and contrastmacros from different areas of thestream). Place 3-4 inches ofstream water in the containers.
In each of the spots that youchoose to sample, place the net onthe stream bottom, with the opening of the net facing upstream.The handle should be stickingstraight up from the water. Makesure you take note of the streamarea type (riffle, pool or glide) thatyou are sampling from. Collect froman area the width of your net by 3foot area upstream of your net.There are two methods of collection:
field 84
UNDERSTAND SAFETY PROTOCOLS. Before entering the water, make sure that yourteam understands how to: use life vests, walk
carefully in moving water with slippery rocks andwork together to prevent injury. In fast-moving
rivers, there should always be a person in thewater downstream with a throw rope.

field 85
(A) PPiicckk uupp tthhee rroocckkss,, oonnee bbyy oonnee.. Holdeach rock upstream of the net opening,and rub the surface to dislodge thesmall insects that are clinging to therock's surfaces. Place the “clean” rocksoutside the sample area; OR
(B) DDoo tthhee ““iinnvveerrtt sshhuuffffllee..”” Upstream ofthe net opening, move the rocks and substrate around with your boot, thus dislodging the insects.
Remove the net from the water with aforward scooping motion, so you don’tlose your sample.
Invertebrates can also be foundamongst aquatic plants and leaf packs.Use the net to sweep through the leafdebris and through the stands of aquatic plants. In addition, inspect logs,stumps or large boulders for macros.Simply pick the insects off by hand.
PPllaaccee ssaammpplleess iinn hhoollddiinngg ccoonnttaaiinneerrss..After sampling, turn your net inside outand rinse all macros into a the appropri-ate white tub (riffle, pool or glide). Ifthere are large pieces of organic debris(leaves, sticks, etc.), “wash” them free ofinsects, and then remove them from thetub.
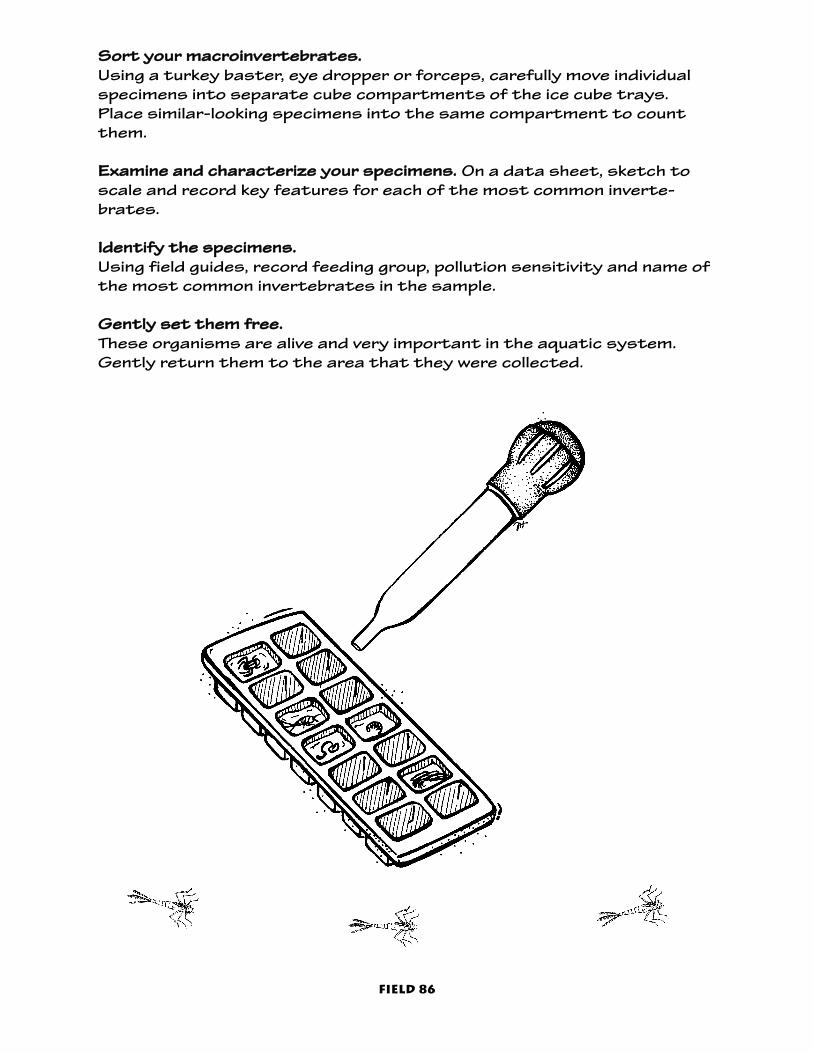
field 86
SSoorrtt yyoouurr mmaaccrrooiinnvveerrtteebbrraatteess.. Using a turkey baster, eye dropper or forceps, carefully move individualspecimens into separate cube compartments of the ice cube trays.Place similar-looking specimens into the same compartment to countthem.
EExxaammiinnee aanndd cchhaarraacctteerriizzee yyoouurr ssppeecciimmeennss.. On a data sheet, sketch toscale and record key features for each of the most common inverte-brates.
IIddeennttiiffyy tthhee ssppeecciimmeennss.. Using field guides, record feeding group, pollution sensitivity and name ofthe most common invertebrates in the sample.
GGeennttllyy sseett tthheemm ffrreeee..These organisms are alive and very important in the aquatic system.Gently return them to the area that they were collected.

TIPS FOR TEACHINGabout aquatic inverts
Have each student choose aninvert to identify, then havethem teach the rest of thegroup about their insect.
Have students describe spec-imens in their own wordsbefore using the field guides.
Use specimens to talk aboutadaptations, diversity anddisturbance.
Inquiring Minds Want to Know:
How are the different aquatic invertebratesyou sampled connected to other organismsin the aquatic ecosystem?
How do the different body parts of aquaticinvertebrates--their shape (skinny and flat,or round and large), presence or absence ofwings, mouthparts, special appendages andoutside covering--relate to what they eat,where they were found, and how they live?
How does stream velocity affect the kindsof invertebrate species that live in differentparts of the aquatic system? The presenceor absence of overhanging vegetation?Dissolved oxygen?
What does your aquatic invertebrate diversity tell you about the types of food(energy) available in different parts of thesystem?
What does the pollution sensitivity of theaquatic invertebrates tell you about thesystem?
How do you think your sample of aquaticinvertebrates compares with those collected in other habitats?
resources on aquaticinvertebrates
Field Guides
Guide to Pacific NW AquaticInvertebrates by Rick Hafele & SteveHinton. Published by Oregon Trout(503-222-9091).
Websiteswww.eosc.osshe.edu/~twelch/aquaticinsects/aquinsect.htm
www.osf1.gmu.edu/~avia/stonefly.htm
field 87
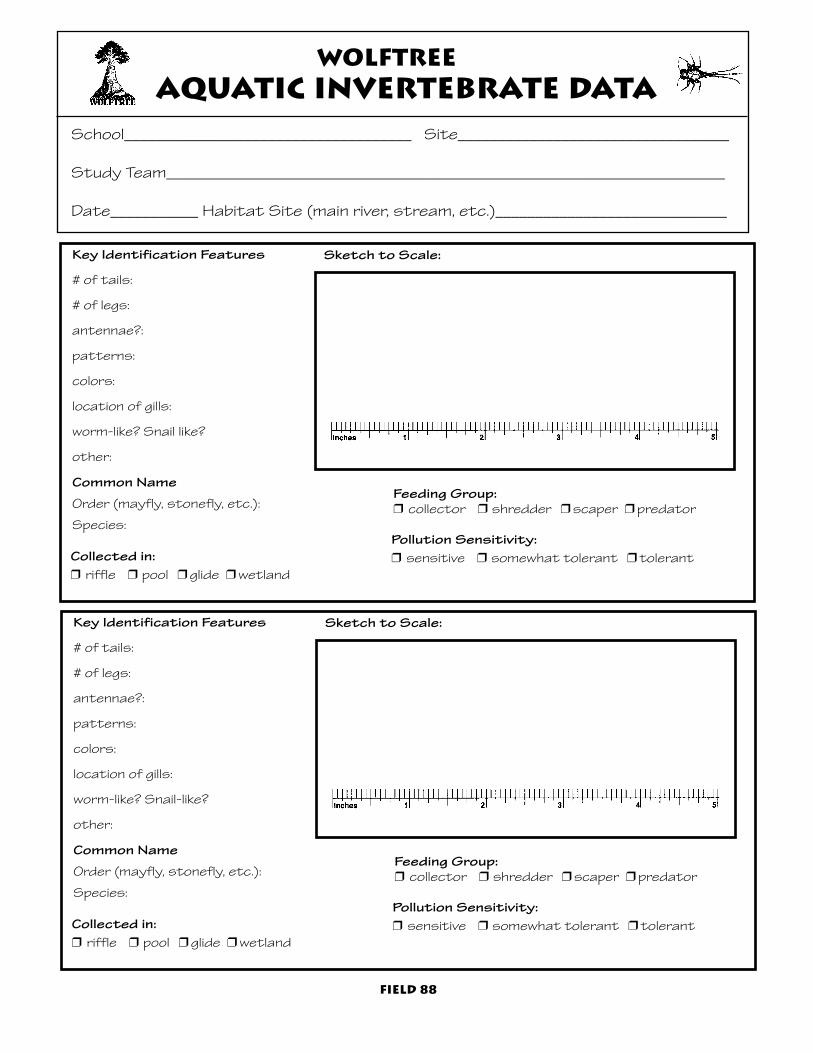
field 88
WolftreeAquatic invertebrate Data
School____________________________________ Site__________________________________
Study Team______________________________________________________________________
Date___________ Habitat Site (main river, stream, etc.)_____________________________
Key Identification Features
# of tails:
# of legs:
antennae?:
patterns:
colors:
location of gills:
worm-like? Snail like?
other:
Common Name
Order (mayfly, stonefly, etc.):
Species:
Feeding Group:❒ collector ❒ shredder ❒ scaper ❒ predator
Pollution Sensitivity: ❒ sensitive ❒ somewhat tolerant ❒ tolerant
Sketch to Scale:
Collected in: ❒ riffle ❒ pool ❒ glide ❒ wetland
Key Identification Features
# of tails:
# of legs:
antennae?:
patterns:
colors:
location of gills:
worm-like? Snail-like?
other:
Common Name
Order (mayfly, stonefly, etc.):
Species:
Feeding Group:❒ collector ❒ shredder ❒ scaper ❒ predator
Pollution Sensitivity: ❒ sensitive ❒ somewhat tolerant ❒ tolerant
Sketch to Scale:
Collected in: ❒ riffle ❒ pool ❒ glide ❒ wetland

Wolftreeaquatic invertebrate
calculation sheet
= 100%%%%
total # collected:# found in riffles:# found in pools:# found in glides:
pie chart
Graph Feeding Groups
# of collectors
# of shredders
# of scrapers
# of predators
Estimate and Chart Total Sample(fast water only):
Graph sensitivity to changing waterconditions or environmental stressors:
Sensitive SomewhatTolerant
Tolerant
Diversity of Sample:
Richness: ❒ Low ❒ High
Evenness: ❒ Low ❒ High
% of total:
field 89
% of total: % of total: % of total:
Total # of species
found:______________
In the system that you were collecting from, what would a....
collector eat?_____________________________________________
shedder eat?_____________________________________________
scaper eat?_______________________________________________
predator eat?_____________________________________________
# ofmacro(orders):
total # ofordersfound:
__________
11
10
9
8
7
6
5
4
3
2
1
11
10
9
8
7
6
5
4
3
2
1
11
10
9
8
7
6
5
4
3
2
1
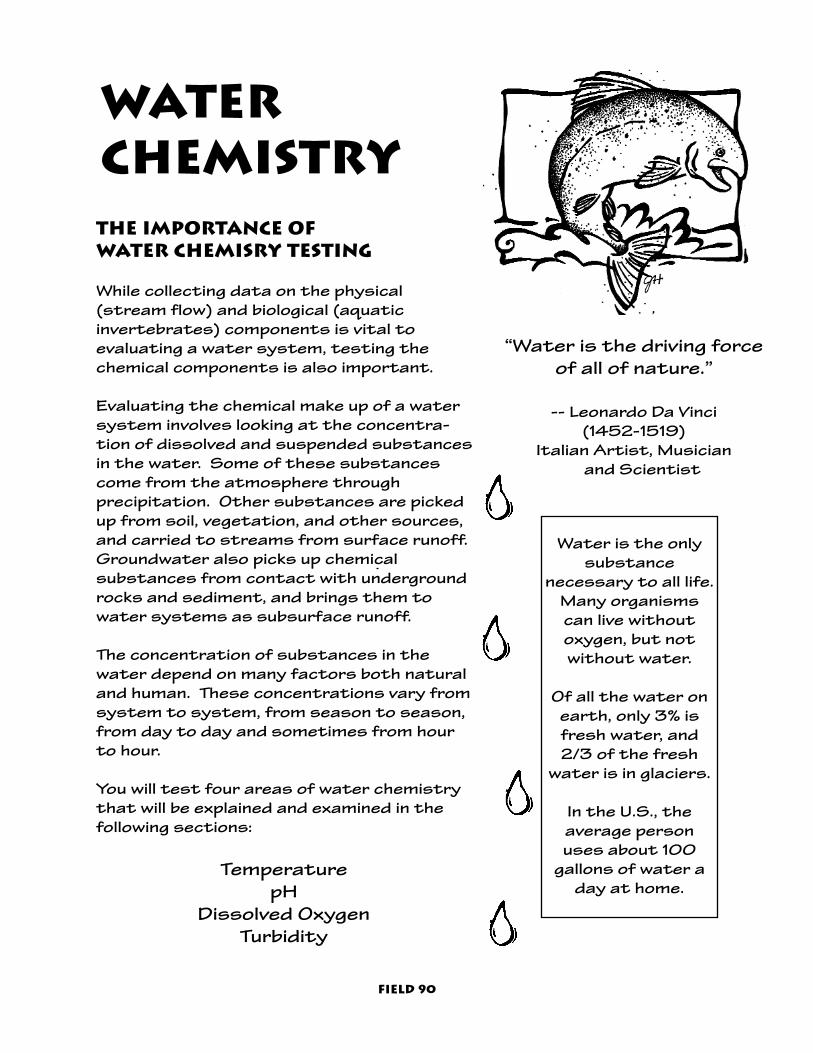
water chemistrythe importance of water chemisry testing
While collecting data on the physical(stream flow) and biological (aquatic invertebrates) components is vital to evaluating a water system, testing thechemical components is also important.
Evaluating the chemical make up of a water system involves looking at the concentra-tion of dissolved and suspended substancesin the water. Some of these substancescome from the atmosphere through precipitation. Other substances are pickedup from soil, vegetation, and other sources,and carried to streams from surface runoff.Groundwater also picks up chemical substances from contact with undergroundrocks and sediment, and brings them towater systems as subsurface runoff.
The concentration of substances in thewater depend on many factors both naturaland human. These concentrations vary from system to system, from season to season,from day to day and sometimes from hourto hour.
You will test four areas of water chemistrythat will be explained and examined in thefollowing sections:
Water is the onlysubstance
necessary to all life.Many organismscan live withoutoxygen, but notwithout water.
Of all the water onearth, only 3% isfresh water, and2/3 of the fresh
water is in glaciers.
In the U.S., theaverage personuses about 100
gallons of water aday at home.
TemperaturepH
Dissolved OxygenTurbidity
“Water is the driving forceof all of nature.”
-- Leonardo Da Vinci (1452-1519)
Italian Artist, Musician and Scientist
field 90
TemperatureWhat is Temperature?
TTeemmppeerraattuurree is the measurement of moving molecules within a substance,called kkiinneettiicc eenneerrggyy. As the kinetic energyin a substance, rises, the molecules movefaster, and the temperature rises.
WWhhaatt iinnfflluueenncceess tteemmppeerraattuurree iinn aann aaqquuaattiicc ssyysstteemm??
AIR TEMPERATURE. Water temperaturewill rise as air temperature rises.
DIRECT SUNLIGHT. The temperature of anaquatic system rises as it absorbsdirect sunlight.
STREAMSIDE OR RIPARIAN PLANTS.Riparian plants can block direct sunlightand keep water temperatures cool.Streams that lack overhanging trees andshrubs receive high doses of sunlight andtend to be warmer.
WATER LEVELS. Shallow bodies of waterheat up more readily.
STREAMFLOW. Slow-moving water inlakes or wetlands heat up faster andmore readily than fast-moving water instreams and rivers.
SNOW AND ICE. Melting snow and glacierfields at the headwaters of a streamprovide cool water (subsurface inputs arealso important).
TURBIDITY. Water with suspended sediments from things like soil erosion andpollution absorbs more heat than clearwater.
“The water is all I hearAs I watch it rush byThe trees stand tall Like hands in the sky
Like they’re hiding the wild river”
Student Journal Entry 1999
field 91
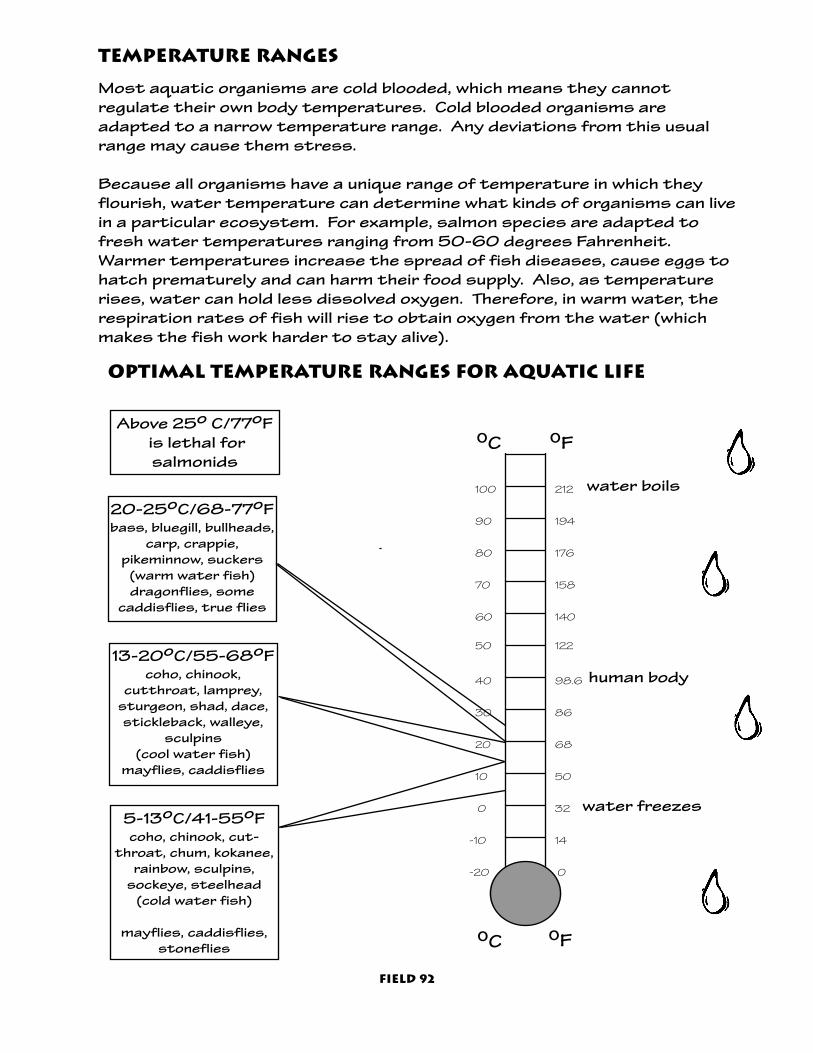
Temperature ranges
Most aquatic organisms are cold blooded, which means they cannot regulate their own body temperatures. Cold blooded organisms are adapted to a narrow temperature range. Any deviations from this usualrange may cause them stress.
Because all organisms have a unique range of temperature in which theyflourish, water temperature can determine what kinds of organisms can livein a particular ecosystem. For example, salmon species are adapted tofresh water temperatures ranging from 50-60 degrees Fahrenheit.Warmer temperatures increase the spread of fish diseases, cause eggs tohatch prematurely and can harm their food supply. Also, as temperaturerises, water can hold less dissolved oxygen. Therefore, in warm water, therespiration rates of fish will rise to obtain oxygen from the water (whichmakes the fish work harder to stay alive).
212
194
176
158
140
122
98.6
86
68
50
32
14
0
90
80
70
60
50
40
30
20
10
0
-10
-20
100
oC oF
water boils
human body
water freezes
20-25oC/68-77oFbass, bluegill, bullheads,
carp, crappie,pikeminnow, suckers
(warm water fish)dragonflies, some
caddisflies, true flies
13-20oC/55-68oFcoho, chinook,
cutthroat, lamprey, sturgeon, shad, dace,stickleback, walleye,
sculpins(cool water fish)
mayflies, caddisflies
5-13oC/41-55oFcoho, chinook, cut-
throat, chum, kokanee,rainbow, sculpins,
sockeye, steelhead (cold water fish)
mayflies, caddisflies,stoneflies
Above 25o C/77oFis lethal forsalmonids
oC oF
Optimal Temperature Ranges for Aquatic Life
field 92
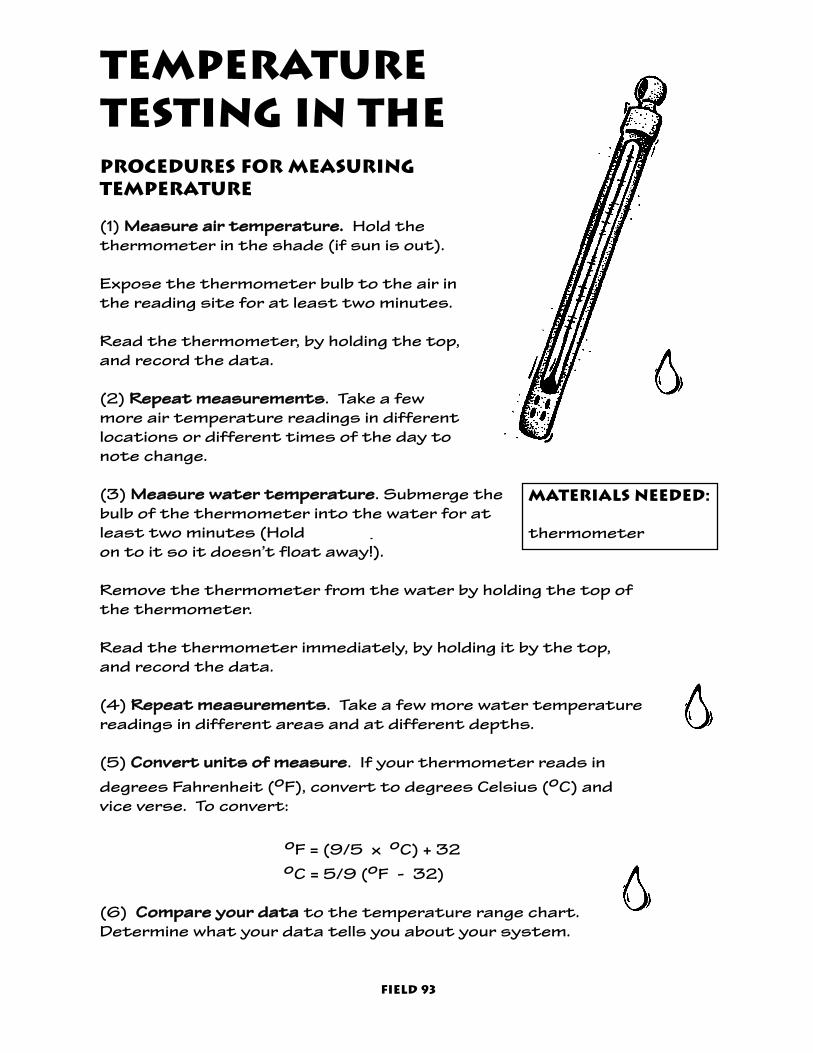
Procedures for measuring temperature
(1) MMeeaassuurree aaiirr tteemmppeerraattuurree.. Hold the thermometer in the shade (if sun is out).
Expose the thermometer bulb to the air in the reading site for at least two minutes.
Read the thermometer, by holding the top, and record the data.
(2) RReeppeeaatt mmeeaassuurreemmeennttss. Take a few more air temperature readings in differentlocations or different times of the day tonote change.
(3) MMeeaassuurree wwaatteerr tteemmppeerraattuurree. Submerge thebulb of the thermometer into the water for atleast two minutes (Hold on to it so it doesn’t float away!).
Remove the thermometer from the water by holding the top ofthe thermometer.
Read the thermometer immediately, by holding it by the top,and record the data.
(4) RReeppeeaatt mmeeaassuurreemmeennttss. Take a few more water temperaturereadings in different areas and at different depths.
(5) CCoonnvveerrtt uunniittss ooff mmeeaassuurree. If your thermometer reads indegrees Fahrenheit (oF), convert to degrees Celsius (oC) andvice verse. To convert:
oF = (9/5 x oC) + 32oC = 5/9 (oF - 32)
(6) CCoommppaarree yyoouurr ddaattaa to the temperature range chart.Determine what your data tells you about your system.
temperature testing in the
field 93
Materials Needed:
thermometer
inquiring minds want to know
How are water and air temperature related?
Why do water temperatures vary withdepth and with different bodies ofwater?
What kind of human activities affectwater temperature in the watershed?
How do the ecosystem components atyour field site affect water tempera-ture, such as velocity and streamflow?water source? plant cover? substrate materials?
How do you think water temperatureaffects the presence or absence of different aquatic organisms (macroinvertebrates, fish, etc.)?
tips for teachingtemperature
Have students refer tothe chart, “OptimalTemperature Ranges forAquatic Life,” to under-stand the temperatureimpact on different formsof aquatic life.
Discuss with studentsthe effect temperaturehas on Dissolved Oxygenand pH.
Based on a scientificstudy of the needs of
cold-water aquaticspecies, the Oregon
Department ofEnvironmental Quality
(DEQ) recently developeda new temperature
standard for Oregonrivers. The new standardset the temperature at64oF statewide unlessthere is cold-water fishspawning or bull trouthabitat. These special
habitat areas have standards of 55oF and50oF respectively. The
temperature standard inthe lower Columbia andWillamette rivers is set
at 68oF.
field 94

pH
What is pH?
A water molecule is made upof one positively chargedhhyyddrrooggeenn iioonn ((HH++)) and onenegatively charged hhyyddrrooxxyylliioonn ((OOHH--)). Acids and basesare defined by the activityof these two very reactiveions. A solution that hasmore hydrogen ion activitythan hydroxyl activity isconsidered aacciiddiicc; one thathas more hydroxyl ion activity than hydrogen ionactivity is considered bbaassiicc.
The Importance of pH
pH is an important limiting chemical factor for aquatic life. Ifthe water in a stream is too acidicor too basic, the H+ or OH- ionactivity may disrupt crucial biochemical reactions, harming orkilling aquatic organisms.
The pH of aquatic systemsaffects the diversity and produc-tivity of aquatic life. Organismsare adapted to specific ranges ofpH. The organisms cease to function and reproduce when thepH is outside their range of toler-ance. Generally, fish can survive insystems with a pH range of 5.0 -9.0. However, low pH can impairtheir sense of smell and preventseggs from hatching. pH levelsabove 9.0 impairs the bodily functions of many species.
field 95

What Affects pH?
Acids released during decomposition of dead plant oranimal material, called tannic acids, can cause the pH ofaquatic systems to decline.
Any input of an acidic solution such as typical rainfall ata pH of 5.6 - can also cause a decrease in pH. Acid rain,caused by air pollution can further reduce the pH ofaquatic systems.
Fertilizers and other human-made substances thatenter the aquatic system have varying effects on pH,and usually tend to make waters more acidic.
Water naturally erodes the rock materials it travelsover. The charged particles in weathered rock (such as magnesium (Mg++), calcium (Ca++) or sodium (Na+)) canalter pH levels.
How pH is Measured
pH is expressed in a scale which ranges from 0 - 14. A solution with a pH of 7 is consideredneutral -- neither acidic or basic. Solutions below7 are considered acidic (more H+ ions) and thoseabove 7 are considered basic (more OH- ions).
0 7 14
acidic basicneutral
more H+ ions more OH- ions
field 96
logarithmic scale
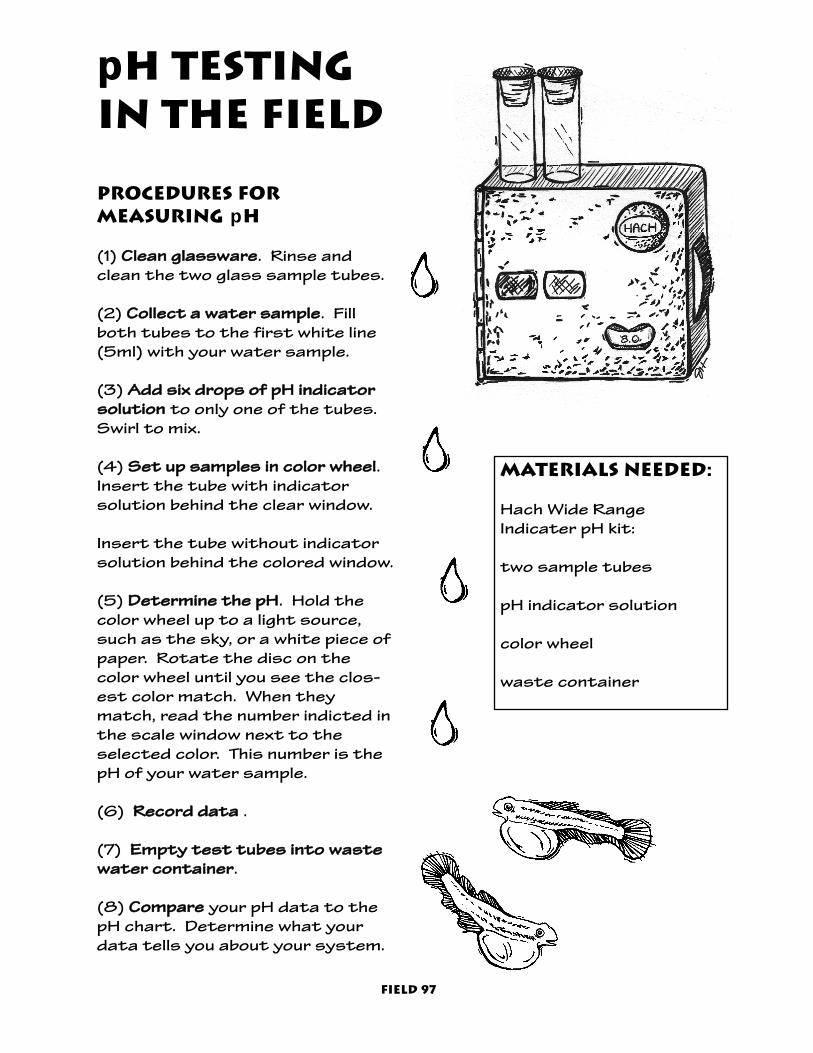
Procedures forMeasuring pH
(1) CClleeaann ggllaasssswwaarree. Rinse andclean the two glass sample tubes.
(2) CCoolllleecctt aa wwaatteerr ssaammppllee. Fillboth tubes to the first white line(5ml) with your water sample.
(3) AAdddd ssiixx ddrrooppss ooff ppHH iinnddiiccaattoorrssoolluuttiioonn to only one of the tubes.Swirl to mix.
(4) SSeett uupp ssaammpplleess iinn ccoolloorr wwhheeeell.Insert the tube with indicator solution behind the clear window.
Insert the tube without indicatorsolution behind the colored window.
(5) DDeetteerrmmiinnee tthhee ppHH. Hold thecolor wheel up to a light source,such as the sky, or a white piece ofpaper. Rotate the disc on thecolor wheel until you see the clos-est color match. When theymatch, read the number indicted inthe scale window next to theselected color. This number is thepH of your water sample.
(6) RReeccoorrdd ddaattaa .
(7) EEmmppttyy tteesstt ttuubbeess iinnttoo wwaasstteewwaatteerr ccoonnttaaiinneerr.
(8) CCoommppaarree your pH data to thepH chart. Determine what yourdata tells you about your system.
pH testing in the Field
Materials Needed:
Hach Wide RangeIndicater pH kit:
two sample tubes
pH indicator solution
color wheel
waste container
field 97

TIPS FOR TEACHING pH
Before the pH test, talkwith students about common things that havevarying pH like bleach andsoda pop (Use the pHScale as a reference).
Discuss why swimmingpools and hot tubs arechecked for pH.
Discuss possible influences on pH like pollution, decompositionof organic materials, minerals, etc..
Discuss the effects ofhigh or low pH on aquatic organisms.
Be sure to emphasizeholding the pH color wheelup to a light source -important for discerningcolor differences.
Inquiring Minds Want to Know
What processes at your studysite can affect pH?
How do you think your system’spH would differ from other systems? For example a riverfrom a wetland?
Is the pH at your study site suitable for aquatic life? Whatkind of aquatic life?
field 98
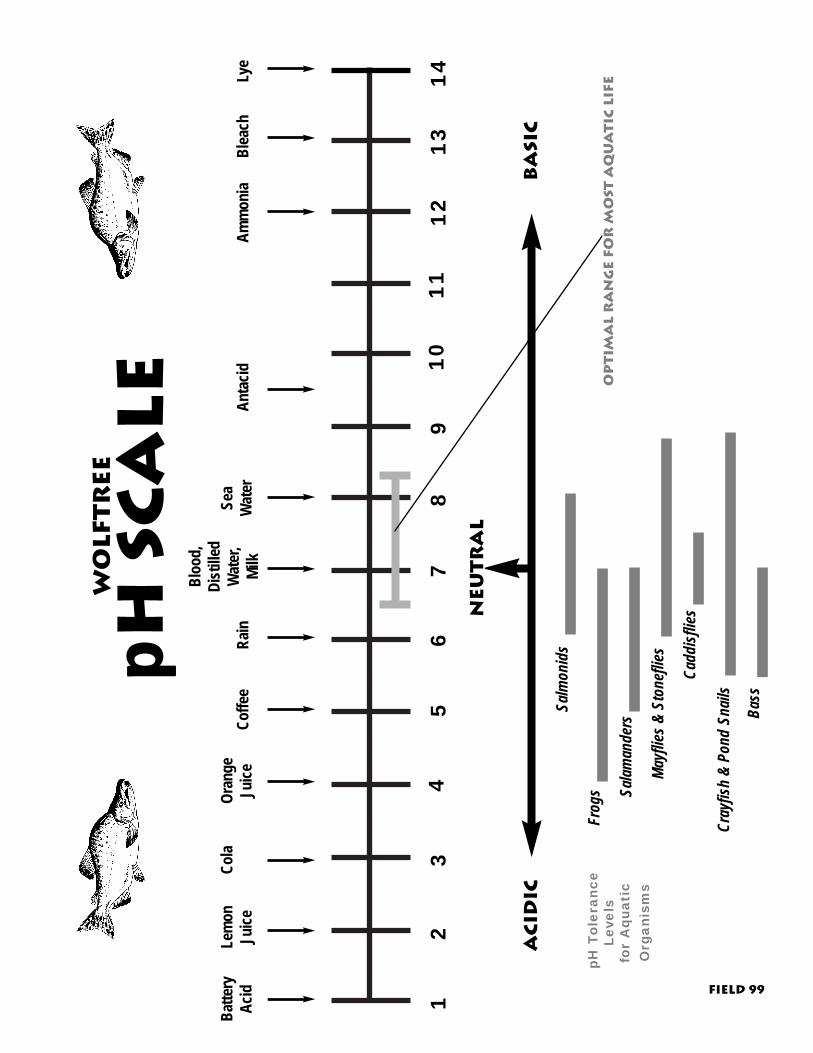
12
34
56
78
910
1112
1314
Ne
ut
ra
l
ba
sic
ac
idic
Bat
tery
Aci
dLe
mon
Juic
eC
ola
Cof
fee
Rai
n
Blo
od,
Dis
tille
dW
ater
,M
ilkA
mm
onia
Ant
acid
Ble
ach
Lye
Ora
nge
Juic
eSe
aW
ater
p H S
ca
le
pH T
oler
ance
Leve
ls
for
Aqu
atic
O
rgan
ism
s
Salm
onid
s
Frog
s Salam
ande
rs
Mayf
lies &
Sto
nefli
es
Cadd
isflie
s
Cray
fish
& Po
ndSn
ails
Bass
Op
tim
al
ra
ng
e f
or
mo
st A
qu
at
ic L
ife
Wo
lft
re
e
field 99

Dissolved oxygen
What is dissolved oxygen?
Oxygen is as important to life inwater as it is to life on land. Mostaquatic animals require oxygen forsurvival. The availability of oxygenaffects their growth, developmentand overall condition. Dissolved oxygen (DO) refers to the O2molecules that are dissolved in awater solution (H20). This O2 is aseparate and different form than theoxygen in a water molecule.
Water systems both produce and consume oxygen. They gain oxygenfrom the atmosphere and fromplants as a result of photosynthesis.
the importance of DO
DO levels are an importantmeasure of the condition of astream. Aquatic organisms consume oxygen through theirgills, or directly through theirbody’s outer layer. Oxygen isessential to break down food,and to maintain and build cells.Most aquatic organisms cannot survive with little or nolevels of oxygen. We measurethe DO of water samples inour aquatic ecosystem to seehow well it can support life.
How is DO measured?
DO is usually measured inparts per million (ppm). Forexample, 8 ppm of O2 meansthat there are 8 parts of oxygen in one million parts ofwater. That seems like a tinyamount of oxygen; howeveraquatic organisms in mostNorthwest water systemsneed 8-12 ppm of DO to survive.
field 100

ooppttiimmaallrraannggee ffoorrmmoosstt NNWWaaqquuaattiicc
oorrggaanniissmmss
factors affecting do
TEMPERATURE. Water temperaturehas a significant influence on DO.Water temperature determines themaximum amount of oxygen that canbe dissolved in water. This is called the“saturation level” of DO. Oxygen ismore easily dissolved in cold water. Asthe temperature rises, the saturationlevel of DO water goes down. If there isa difference between the measured DOand the saturation level, ecosystemprocesses are actively influencing theoxygen status of the aquatic ecosystem.
STREAM FLOW. Oxygen concen-trations vary with the volume andvelocity of water flowing. Faster flowswith white water tend to be more oxygen-rich because more oxygenenters the water from the atmospherethrough breaks in the water’s surface.
AQUATIC PLANTS. The presence ofaquatic plants in a stream affects theDO concentration by releasing oxygeninto the water during photosynthesis.In water systems with many greenplants, the DO levels will fluctuate withthe amount of sunlight.
ALTITUDE. Oxygen more easily dissolves in water at low altitudes.There is less oxygen at higher altitudes.
TURBIDITY. Oxygen more easily dissolves in water with low levels of suspended sediments.
1
2
4
5
3
6
7
8
9
10
11
12
13
14
15
16ppm
ppm0
mmiinniimmuummrreeqquuiirreemmeennttffoorr ssaallmmoonn
eemmbbrryyoo
mmiinniimmuummrreeqquuiirreemmeennttffoorr ssppaawwnniinngg
ssaallmmoonn
mmiinniimmuummrreeqquuiirreemmeenntt
ffoorr aadduullttssaallmmoonn
field 101
DO Chart

Procedures for Measuring DO
(1) Collect a water sample. Fill the sample cup to the25 mL mark.
(2) Snap ampoule tip by sliding an ampoule down theside of the sample cup so that the tip rests againstthe edge of the bottom slide. Press the ampouleagainst the side of the cup to snap the tip. Theampoule will fill with water.
(3) Mix the contents of the ampoule by inverting itseveral times, allowing the air bubble to travel fromend to end. Wait for two minutes for the color todevelop.
(4) Find the best color match between the ampouleand color standards on the comparator. Hold thecomparator in a nearly horizontal position underbright light. Place the sample ampoule between thecolor standards, moving it until the best color matchis found. This will indicate the dissolved oxygen levelin parts per million (ppm). An estimate can be madefor those sample colors falling between standards.
(5) Record DO level.
(6) Discard used ampoules and sample cup water intowastewater container.
(7) Compare your data to the DO chart. Determinewhat your data tells you about your system.
DO testing in the field
Materials Needed:
CHEMets DO KitK-7512:
25 ml sample cup
self-filling ampoules
comparator colorstandards
waste container
field 102

Inquiring Minds Want to Know:
What do your measurements of DO indicate about water chemistry?
How does your estimate of DO compare to that which is needed byfish and other aquatic organisms?
How could the characteristics of your research site be altered toincrease DO?
How do humans affect DO?
TIPS FOR TEACHING DO
Have students look at riffles in the water system and ask themwhat is happening with regard to dissolved oxygen.
Utilize the DO chart.
Talk about how the presence of plants, both in and around thewater, can affect DO.
“Water, thou hast no taste,no color, no odor; canst not
be defined, art relishedwhile ever mysterious. Not
necessary to life, butrather life itself, though
fillest us with a gratifica-tion that exceeds thedelight of the senses.”
--Saint-ExuperyWind, Sand and Stars
(1939)
field 103

What is turbidity?
Turbidity refers to how cloudy or clear thewater is. It is an indicator of how muchlight can pass through water. Highly turbid water has floating materials, calledssuussppeennddeedd sseeddiimmeennttss, that block light.These suspended sediments can be soilparticles, micro-organisms or plant materials. Clear water has a turbiditynear zero because there are no or fewmaterials in the water that scatter orabsorb light.
The importance of turbidity
Turbidity is another indicator of the condition of the water system youare studying. High turbidity can indicate contamination, pollution,and/or both natural and non-natural disturbance in the watershed.
IIFF WWAATTEERR IISS HHIIGGHHLLYY TTUURRBBIIDD::Needed sunlight cannot reach submerged aquatic plants and theamount of oxygen created by photosynthesis is decreased.
Organisms, including macroinvertebrates and fish eggs, on the streambottom can be buried by suspended sediments.
Suspended sediments absorb heat from sun, thus increasing the temperature of the water. Warmer water holds less oxygen, so dissolved oxygen (DO) levels often begin to drop.
Floating materials can get caught in the gills of fish and amphibians,which can hinder their ability to breathe.
Organisms have more difficulty seeing and/or smelling their food, thusthe food chain is directly affected.
As temperature rises in slow-moving or stagnant water, algae populations may explode, thus further blocking sunlight.
turbidity
field 104

causes of turbidity
The turbidity of a river, stream or wetland is affected by conditions in the entire watershed. The following are just a few potential causes of turbidity.
SOIL EROSION. Vegetation on the hillsidesin a watershed hold soil in place. If vegeta-tion is removed or disturbed, soil can slidedownhill during heavy rainfalls and into riversystems. Soil erosion is a key process thatcan increase turbidity.
POLLUTION. As runoff flows over roads andhomes, it carries dirt, oil, and any otherdebris with it to rivers.
FLOODS. Floods and sudden high stream-flows stir up the fine sediments on thebottom of a stream and can cause turbidity to rise rapidly. Floods also bringrunoff from both disturbed and undis-turbed hillsides, causing turbidity to rise.
ANIMALS. When humans or other largemammals walk or recreate in water, fine sediments on the streambed are disturbed,causing a rise in turbidity.
CurrentEnvironmental
Protection Agency(EPA) regulations
require turbidity indrinking water notto exceed 5 NTU.
The ability ofsalmonids to find
and capture food isimpaired at
turbidities in therange of 25-70
NTU.
EPA Studies indicate that fishgrowth is reduced
and gill tissue isdamaged after
5-10 days of exposure to waterwith a turbidity of
25 NTU.
During a floodevent, turbiditiescan jump to 100
NTU or more than 1000 NTU.
field 105

How turbidity is measured
Turbidity can be measured with an expensiveinstrument called a ttuurrbbiiddiimmeetteerr or throughan inexpensive turbidity test kit. A turbidimeter is an electronic meter thatmeasures the amount of light scattered by asample of water. The greater the amount ofsuspended particles, the greater the intensity of scattered light. Turbidity recorded with a turbidimeter is inNNeepphheelloommeettrriicc TTuurrbbiiddiittyy UUnniittss ((NNTTUU’’ss)).
The test kit involves viewing a dot located atthe end of a tube. As the turbidity of a sample increases, the dot becomes increasingly blurred. The turbidity of the sample is then compared with an identicalamount of clear water to which a standardized turbidity reagent has beenadded. Turbidity recorded with a turbidity test kit is in JJaacckkssoonn TTuurrbbiiddiittyy UUnniittss((JJTTUU’’ss))
Both NTU's and JTU s are interchangeableunits. They differ only in that their namereflects the device used to measure turbidity.
turbidimeter
field 106

Turbidity testing in the Field
Materials Needed:
Clear Tap Water
Waste WaterContainer
LaMotte TurbidityTest Kit (7519):Turbidity Reagent
2 Turbidity Columns
Test Tube Brush
Stirring Rod
Procedures for MeasuringTurbidity
This test is made by comparing the turbidity ofa measured amount of the sample with an identi-cal amount of clear water containing a measuredamount of standardized turbidity reagent. Thereadings are made by looking down through thecolumn of liquid at a black dot. If turbidity ispresent, it will interfere with the passage oflight through the column of liquid. Small amountsof turbidity will cause a "blurring" of the blackdot in the bottom of the tube. Large amounts ofturbidity may provide sufficient "cloudiness" sothat it is not possible to see the black dot whenlooking down through the column. Any color thatmay be present in the sample should be disre-garded. This determination is concerned onlywith the haziness or cloudy nature of the sam-ple. Turbidity test is best performed at site butmay be delayed 2 hours if necessary. If delayed,shake or stir sample very well before testing.
(1) Fill one Turbidity Column (0835) to the 50 ml linewith the sample water.
NOTE: Do not view the test in direct sunlight
(2) If the black dot on the bottom of the tube is not visible when looking down through the column of liquid,pour out a sufficient amount of the test sample so thatthe tube is filled to the 25 ml line.
(3) Fill the second Turbidity Column (0835) with anamount of turbidity-free water that is equal to theamount of sample being measured. This is the "clearwater" tube.
(4) Place the two tubes side by side and note the difference in clarity. If the black dot is equally clear inboth tubes, the turbidity is zero. If the black dot in thesample tube is less clear, proceed to Step 5.
field 107

(5). Shake the Standard Turbidity Reagent (7520) vigorously. Add 0.5ml to the "clear water" tube. Use the sitting rod (1114) to stir contentsof both tubes to equally distribute turbid particles.
(6) Check for amount of turbidity by looking down through the solutionat the black dot (ignore the color - focus only at the blurriness of thedot). If the turbidity of the sample water is greater than that of the"clear water", continue to add Standard Turbidity Reagent in 0.5 mlincrements to the "clear water" tube, MIXING AFTER EACH ADDITIONuntil the turbidity equals that of the sample.
(7) Record total amount of Turbidity Reagent added. Each 0.5 ml addition to the 50 ml size sample is equal to 5 Jackson Turbidity Units(JTU's). If a 25 ml sample size is used, each 0.5 ml addition of theStandard Turbidity Reagent is equal to 10 Jackson Turbidity Units(JTU's). Use the table below to calculate turbidity in JTU. Rinse bothtubes carefully after each determination.
(8) Think about your turbidity data and determine what it tells youabout your water system. Look for clues in the system to explain your turbidity reading.
field 108
# of measuredadditions
1
2
3
4
5
6
7
8
9
10
15
20
amount in mL
0.5
1.0
1.5
2.0
2.5
3.0
3.5
4.0
4.5
5.0
7.5
10.0
50 mLGraduation
5 JTU
10 JTU
15 JTU
20 JTU
25 JTU
30 JTU
35 JTU
40 JTU
45 JTU
50 JTU
75 JTU
100 JTU
25 mLGraduation
10
20
30
40
50
60
70
80
90
100
150
200
TTuurrbbiiddiittyy TTeesstt RReessuullttss

TIPS FOR TEACHINGTurbidity
Making comparisonsbetween different areaswithin the river, creek orwetland is a great wayto facilitate learningabout turbidity.
Be aware of studentimpact on turbidity readings. Point out howupstream readings maybe quite different than downstream readings.
Talk about how activitiesupstream (includingthose of other stu-dents) can affect thedata.
Inquiring Minds Want toKnow:
What features at the research siteaffect turbidity most?
How do you account for differing turbidity readings for wetland, riverand creek sites?
What are the most common materialsfloating in your water sample thataffect turbidity? Sediments? Algae?Organic matter? Others?
How does turbidity relate to otherwater chemistry measurements?
How might aquatic organisms be affected by turbidity?
How do humans affect turbidity?
How might your turbidity readings be different three months from now?Three months ago?
field 109
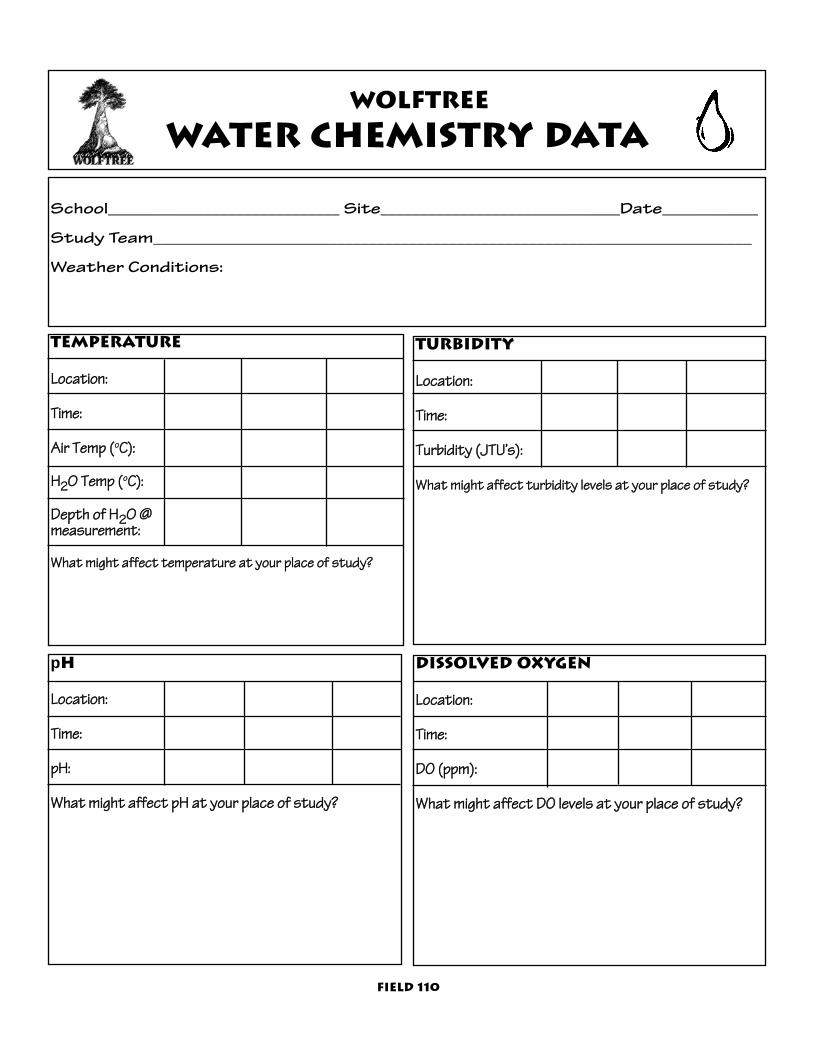
School_____________________________ Site______________________________Date____________
Study Team___________________________________________________________________________
Weather Conditions:
Wolftree
water chemistry data
field 110
Temperature
LLooccaattiioonn::
TTiimmee::
AAiirr TTeemmpp ((ooCC))::
HH2200 TTeemmpp ((ooCC))::
DDeepptthh ooff HH2200 @@ mmeeaassuurreemmeenntt::
WWhhaatt mmiigghhtt aaffffeecctt tteemmppeerraattuurree aatt yyoouurr ppllaaccee ooff ssttuuddyy??
pH
LLooccaattiioonn::
TTiimmee::
ppHH::
WWhhaatt mmiigghhtt aaffffeecctt ppHH aatt yyoouurr ppllaaccee ooff ssttuuddyy??
Turbidity
LLooccaattiioonn::
TTiimmee::
TTuurrbbiiddiittyy ((JJTTUU’’ss))::
WWhhaatt mmiigghhtt aaffffeecctt ttuurrbbiiddiittyy lleevveellss aatt yyoouurr ppllaaccee ooff ssttuuddyy??
Dissolved Oxygen
LLooccaattiioonn::
TTiimmee::
DDOO ((ppppmm))::
WWhhaatt mmiigghhtt aaffffeecctt DDOO lleevveellss aatt yyoouurr ppllaaccee ooff ssttuuddyy??

resources to learn more aboutwater and water chemistry
WWeebbssiitteesswwwwww..eeppaa..ggoovv//oowwooww//mmoonniittoorriinngg//vvoolluunntteeeerr//ssttrreeaamm//UUnniitteedd SSttaatteess EEnnvviirroonnmmeennttaall PPrrootteeccttiioonn AAggeennccyy VVoolluunntteeeerrSSttrreeaamm MMoonniittoorriinngg:: AA MMeetthhooddss MMaannuuaall..
wwaatteerrqquuaalliittyy..ddeeqq..ssttaattee..oorr..uuss//wwqq//ootthheerrbbrroowwsseerrss..hhttmmOOrreeggoonn DDeeppaarrttmmeenntt ooff EEnnvviirroonnmmeennttaall QQuuaalliittyy’’ss WWaatteerrQQuuaalliittyy PPrrooggrraamm HHoommee PPaaggee..
wwwwww..wwaatteerr..ccii..ppoorrttllaanndd..oorr..uuss//CCiittyy ooff PPoorrttllaanndd BBuurreeaauu ooff WWaatteerr WWoorrkkss HHoommee PPaaggee..
wwwwww..uussggss..ggoovvUUnniitteedd SSttaatteess GGeeoollooggiicc SSoocciieettyy ssiittee..
CCuurrrriiccuulluummTThhee SSttrreeaamm SScceennee -- WWaatteerrsshheeddss,, WWiillddlliiffee aanndd PPeeooppllee..11999922.. OOrreeggoonn DDeeppaarrttmmeenntt ooff FFiisshh aanndd WWiillddlliiffee.. ((550033)) 222299--55440033..
SSttrreeaammkkeeeeppeerr’’ss FFiieelldd GGuuiiddee bbyy TToomm MMuurrddoocchh aannddMMaarrtthhaa CChheeoo.. 11999966.. AAddoopptt--AA--SSttrreeaamm FFoouunnddaattiioonn.. ((442255)) 331166--88559922.. wwwwww..ssttrreeaammkkeeeeppeerr..oorrgg
NNaattiioonnaall WWiillddlliiffee FFeeddeerraattiioonn’’ss AAnniimmaall TTrraacckkss SSeerriieess::WWaatteerr.. AAnn iinnttrroodduuccttoorryy uunniitt oonn tthhee wwaatteerr ccyyccllee aanndd wwaatteerrcchheemmiissttrryy iissssuueess.. GGrraaddeess 33--88.. ((441100)) 551166--66558855..wwwwww..nnwwff..oorrgg//aattrraacckkss
field 111

streamflow
What is streamflow?
SSttrreeaammffllooww is the total amount of waterthat passes a given spot each second. Thetwo main components of streamflow arevveelloocciittyy - how fast the water is flowing,and the ccrroossss sseeccttiioonnaall aarreeaa - how deepand wide the channel is.
What affects Streamflow?
PRECIPITATION - As precipitation falls from the sky, it travels over the landto the lowest point as ssuurrffaaccee rruunnooffff. This surface runoff forms small channels which connect into larger water systems. Streamflows usuallyincrease when a watershed receives a lot of precipitation.
GROUND WATER - Some precipitation enters the soil, seeping down to afirm layer of clay or rock. Here the water collects as ggrroouunndd wwaatteerr. Some ofthis water finds its way to springs, streams and eventually rivers and seas.
UPLAND CONDITIONS - Vegetated areas above streams are called uplands.They use and hold water, slowing down increases in stream flows duringheavy rain events and maintaining flows during dry summer months. If vegetation is removed or replaced with impermeable or hard surfaces (likeroads and houses), water flows directly into the rivers. A lot of iimmppeerrmmeeaabblleessuurrffaacceess in a watershed can increase stream flows during rain events andlower flows during dry months.
Cross section of a water system
water surface
substrate
riparian areastream width
depth intervals
field 112
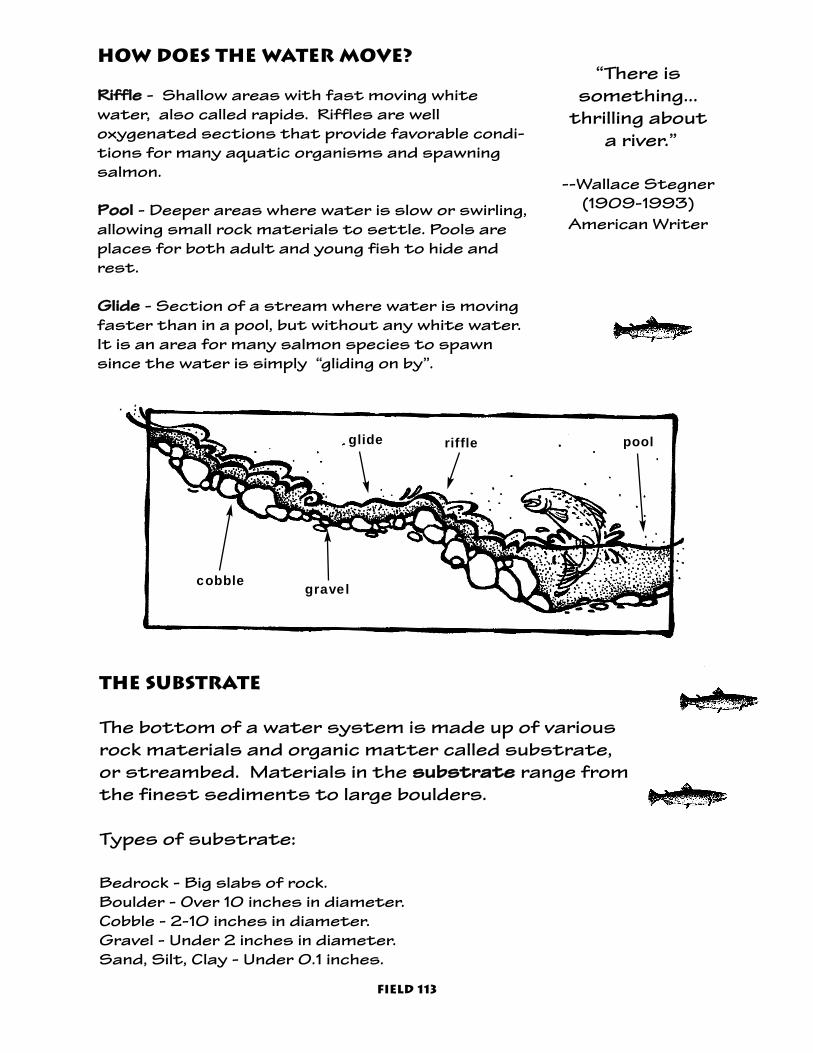
How does the water move?
RRiiffffllee - Shallow areas with fast moving whitewater, also called rapids. Riffles are well oxygenated sections that provide favorable condi-tions for many aquatic organisms and spawningsalmon.
PPooooll - Deeper areas where water is slow or swirling,allowing small rock materials to settle. Pools areplaces for both adult and young fish to hide andrest.
GGlliiddee - Section of a stream where water is movingfaster than in a pool, but without any white water.It is an area for many salmon species to spawnsince the water is simply “gliding on by”.
“There is something...
thrilling abouta river.”
--Wallace Stegner(1909-1993)
American Writer
riffleglide pool
the substrate
The bottom of a water system is made up of variousrock materials and organic matter called substrate,or streambed. Materials in the ssuubbssttrraattee range fromthe finest sediments to large boulders.
Types of substrate:
Bedrock - Big slabs of rock. Boulder - Over 10 inches in diameter.Cobble - 2-10 inches in diameter.Gravel - Under 2 inches in diameter.Sand, Silt, Clay - Under 0.1 inches.
cobble gravel
field 113
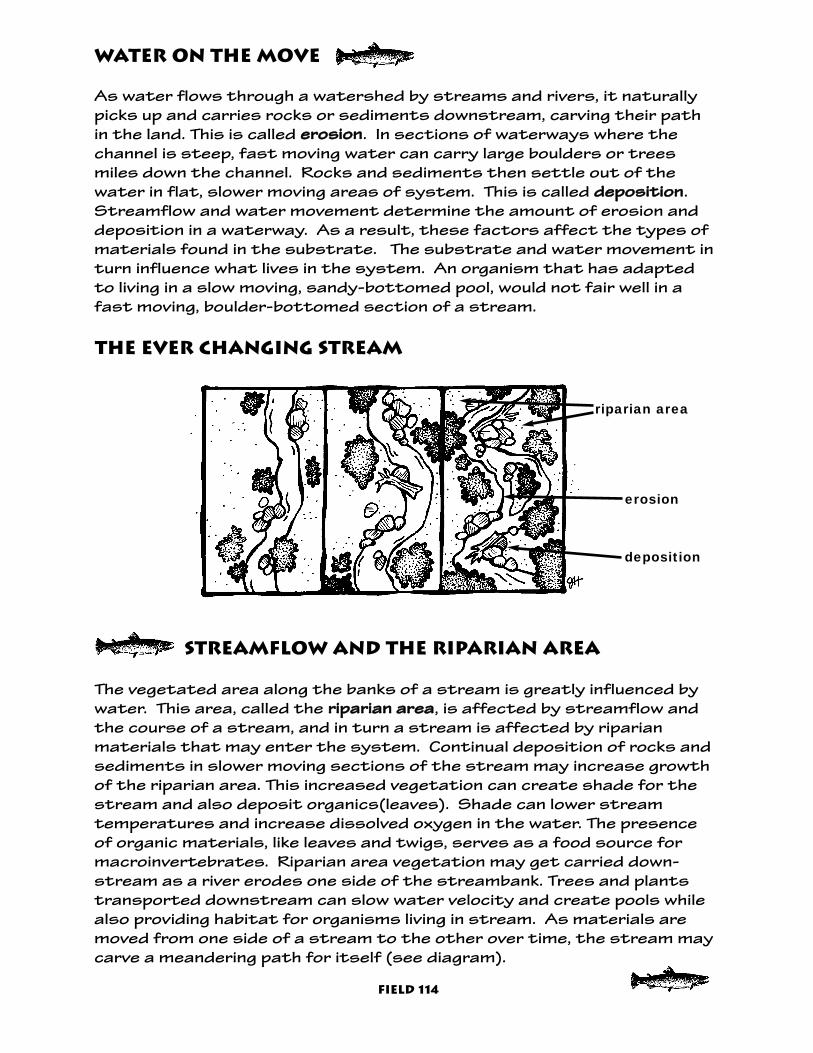
Streamflow and the Riparian Area
The vegetated area along the banks of a stream is greatly influenced bywater. This area, called the rriippaarriiaann aarreeaa, is affected by streamflow andthe course of a stream, and in turn a stream is affected by riparianmaterials that may enter the system. Continual deposition of rocks andsediments in slower moving sections of the stream may increase growthof the riparian area. This increased vegetation can create shade for thestream and also deposit organics(leaves). Shade can lower stream temperatures and increase dissolved oxygen in the water. The presenceof organic materials, like leaves and twigs, serves as a food source formacroinvertebrates. Riparian area vegetation may get carried down-stream as a river erodes one side of the streambank. Trees and plantstransported downstream can slow water velocity and create pools whilealso providing habitat for organisms living in stream. As materials aremoved from one side of a stream to the other over time, the stream maycarve a meandering path for itself (see diagram).
The Ever Changing Stream
Water ON THE MOVE
As water flows through a watershed by streams and rivers, it naturallypicks up and carries rocks or sediments downstream, carving their pathin the land. This is called eerroossiioonn. In sections of waterways where thechannel is steep, fast moving water can carry large boulders or treesmiles down the channel. Rocks and sediments then settle out of thewater in flat, slower moving areas of system. This is called ddeeppoossiittiioonn.Streamflow and water movement determine the amount of erosion anddeposition in a waterway. As a result, these factors affect the types ofmaterials found in the substrate. The substrate and water movement inturn influence what lives in the system. An organism that has adaptedto living in a slow moving, sandy-bottomed pool, would not fair well in afast moving, boulder-bottomed section of a stream.
erosion
deposition
riparian area
field 114
WHY MEASURE STREAMFLOW?
The speed and amount of water in a streamaffect the organisms and habitats in anaquatic ecosystem. Imagine a small tricklingcreek. Then think about a big river, like theColumbia, Willamette, or Deschutes. Wouldyou expect to find the same organisms inthe small creek as the large river? Theamount of water in a stream is an importantfactor in determining where organisms liveand spawn.
When streamflow increases, water systemsbecome wider or deeper, creating more habitat for aquatic organisms. During stormevents, an area in the river that was a pool, aresting area for fish, may become a fastmoving riffle habitat This change of habitatmay cause displacement of some organisms,while making room for others. Faster movingwater, associated with increased stream-flow, alters habitat by transporting dissolved oxygen, food particles and pollutants in an aquatic system. Conversely,a shallow, slow moving system may decreasethe available habitat, and the transport of materials in the system. Aquatic organismshave specific adaptations to habitat basedon streamflow. For fish, streamflow affectsaccess to spawning gravels, expenditure ofenergy, and the amount of oxygen availableto eggs.
Seasonal Changes in N.W. Streamflow - 1998
Columbia River(below The Dalles Dam)
RIVER FALL SPRING
Willamette River(at Salem)
Sandy River (below Bull Run)
336,100 cubic feetper second (cfs)
1,782 cfs385 cfs
15,850 cfs8,458 cfs
115,200 cfs
“Sitting in a canoe, riding the back of the
flooding river as itflows down into a
bend, and turns, the currents racing andcrashing among thetrees along side theshore, and flow on,
one senses the volume and power
all together.”
--Wendell Berry
field 115
Notice the difference in streamflows between fall andspring! What factors would influence this change?

(3) MMEEAASSUURREE VVEELLOOCCIITTYY (the velocity of the water passingthrough the calculated channel area).
With the tape measure, establish a distance in thestream to determine velocity.
With a stopwatch, record how long it takes a stick totravel your measured distance in the stream (This willestimate how fast the water is moving.).
Water moves at different speeds across the streamchannel. Record at least three velocity measurements toaccount for the different stream velocities along thewidth of the stream.
(4) MMEEAASSUURREE TTOOTTAALL SSTTRREEAAMMFFLLOOWW.. Calculate the total streamflowby multiplying velocity and total area. Record streamflow onthe data sheet.
measuringstreamflowin the field
field 116
measuring streamflow procedures:
(1) CCHHOOOOSSEE AA SSAAMMPPLLEE AARREEAA. Designate a 100’ footsection of the stream to sample from.
(2) MMEEAASSUURREE SSTTRREEAAMM AARREEAA.. Measure the channelwidth with a tape measure. Record stream width.
Divide the stream width into equal sized areas.For example, if the stream is 30 feet wide, divideit into six areas of five feet each (Refer to thedata sheet for a visual).
Record depth measurements at each individualarea.
Calculate the area of each individual section bymultiplying ddeepptthh xx wwiiddtthh.
Calculate the total stream area by adding theindividual areas. Record on your data sheet.
MaterialsNeeded:
standard equipment
height pole
life vests (if necessary)
stopwatch
tape measure
underwater viewers
waders

field 117
MMEEAASSUURREE RRIIPPAARRIIAANN FFEEAATTUURREESS.. Identifythe riparian area. The riparian areastarts at the edge of a stream andends where the stream water doesnot influence vegetation. Look for aterrace or hill that would hold water inas flows rise. Also look for a change invegetation to determine where theriparian area ends.
Identify the dominant plant/treespecies in your riparian area.
Use the field guide to determine theplant/tree species.
Record the plant species, and whetherthe species is understory or overstory, evergreen or deciduous.
Riparian Vegetation-Red Alder
EEXXAAMMIINNEE TTHHEE SSUUBBSSTTRRAATTEE AANNDD OORRGGAANNIISSMMSS
with stream viewers. Use underwaterviewers to closely examine the substrate of your plot. What are theshapes of the rocks? Are they smoothor jagged? Where do you think therocks came from?
Record the size and type of substrateyou discover in the water, as well as onthe banks.
Repeat the process in another section of your water system. Pick anarea with different features such as:deeper water and faster velocity. (Ifwater is too deep or fast to examinewith viewers, make observations andrecord information from a distance.)
underwater viewer
OTHER streamflow studies:
Inquiring minds want to know
What kinds of substrate are found in slowerdepositing sections of your stream? Whatkinds are found in fast eroding sections?
Where is erosion happening in the streamcross section? Where is deposition happening?
How do seasonal, storm related, and otherchanges in streamflow impact aquatic organisms?
How does streamflow affect a riparian area?
How do evergreen or deciduous trees in the riparian area affect stream habitat?
Tips for teaching streamflow
Refer to “Seasonal Changes in Streamflow 1998”on page 95 to understand how streamflow differs between systems.
Use the cubic foot box to illustrate a cubic footof water.
Convert cubic feet/seconds into gallons/seconds to help students understand the volume of water movement.(7.5 gallons/cubic ft.)
field 118

Re
se
arc
h S
ite
: __
____
____
____
____
____
____
____
____
____
_D
ate
: ___
____
____
____
____
____
___
Sch
oo
l: __
____
____
____
____
____
____
____
____
____
____
__ _
__R
es
ea
rch
ers
:___
____
____
____
____
____
____
____
____
__
Me
nto
rs:_
____
____
____
____
____
____
____
____
____
____
____
_
Wo
lft
re
e s
tr
ea
mfl
ow
da
ta
Ske
tch
the
str
eam
fro
m a
bove
(bir
d’s
eye
vie
w).
S
ketc
h w
hat
you
saw
in t
he s
trea
mvi
ewer
. In
clud
e: r
iffl
es, p
ools
, glid
es,s
hape
and
rip
aria
n.In
clud
e: s
ubs
trat
e, a
nd o
rgan
ism
s o
bser
ved
.
field 119

Str
ea
m A
re
a (
a c
ro
ss-s
ec
tio
n)
Str
eam
cha
nnel
wid
th:
____
___
ftIn
div
idua
l are
as w
ill b
e __
___
ft w
ide
Are
a #
Dep
thW
idth
Pro
duc
t
Are
a 1
ft2
Are
a 2
ft2
Are
a 3
ft2
Are
a 4
ft2
Are
a 5
ft2
Are
a 6
ft2
Are
a 7
ft2
Are
a 8
ft2
Are
a 9
ft2
Tota
l Str
eam
Are
a =
__
____
__
Str
ea
m V
elo
cit
y
Dis
tanc
e yo
u’re
mea
sur
ing:
____
__ f
t
Tim
e it
tak
es t
he o
bjec
t to
tra
vel:
Tria
l #1:
____
__ s
econ
ds
Tria
l #2
: ___
___
sec
ond
s
Tria
l #3
: ___
___
sec
ond
s
Ave
rage
tim
e =
____
__ s
econ
ds
Str
eam
vel
ocit
y =
____
__ ft
/ se
cond
To
tal
Str
ea
mfl
ow
Are
a(ft
2)
x V
eloc
ity(
ft/s
econ
d)
= __
____
ft
3/s
ec
rip
ar
ian
ar
ea
ever
gree
n
ove
rsto
ryor
or
dec
iduo
us
und
ers
tory
Spe
cies
1. 2.
3.
Ar
ea
2A
re
a3
Ar
ea
4
depth
Rip
aria
n ar
eaR
ipar
ian
area
wid
thA
re
a1
Sub
str
ate

Wetlandecologywetlands and their FUNCTION
Wetlands are areas that are adapted tothe presence of water for some time during the growing season. Some common wetland types are marshes,bogs and swamps. Wetlands offer thesebenefits to the ecosystem:
FILTERS. Wetlands help rivers andstreams by filtering sediments and pollutants. Due to the slow moving waterin wetlands, pollution and sediments settle to the bottom of the system. Inaddition, aquatic vegetation holds materials in wetlands that would otherwise flow directly into streams.
FOOD, SHELTER & HABITAT. The wetlandhabitat provides food and shelter formany wildlife species including waterfowl, amphibians, and fish. Wetlands are also habitat for larger mammals such as deer,elk, and bears.
CONTROL FLOWS. Wetlands help controlwater flows by acting as a sponge. Intime of flooding, wetlands soak up andhold water. In dry summer months, wetlands maintain streamflows by slowlyreleasing water stored in vegetation andsoils.
“Civilization beganaround wetlands;
today’s civilization hasevery reason to leavethem wet and wild.”
-- Edward MaltbyAmerican Writer
field 121

Wetland Plants
Wetland vegetation has evolved over time tosurvive in either standing water, or saturated soil. Many of these adaptationsare visible on the plant. Wetland habitatswith a few feet of standing water can provide little support for heavy woody vegetation. Plants in this type of habitatare often herbaceous, or without woodystems. Some plants in standing water havetheir roots under water and leaves abovethe water. Air pockets or holes in plantstems help transport oxygen and othergases through the plant. As water becomesmore shallow in wetlands, woody vegetationis able to survive. To prevent falling over inloose, wet soils, woody shrubs often branchmany times. Wetland habitats with saturated soil may have a few inches of drysoil on the ground surface. Wetland plants inthese areas have developed shallow rootsystems.
Over 1/3 of the animals and plants
listed as threatenedor endangered in the
U.S. either live in wetlands or depend
on them in some way.
National WildlifeFederation
pond lily
field 122

Wetland Soils
Soil plays a large role in the types of plant communities we find in a wetland. In general, soilsare made up of plant materials (organic soils) andweathered rock materials (mineral soils). Thelargest mineral materials are ssaanndd, middle sizedmineral particles are called ssiilltt, and the smallestmeasured mineral soil particle is ccllaayy. Each of thesematerials feel different. Sand feels gritty; silt feelssmooth; and clay feels sticky. The relative amountsof sand, silt, and clay soil is called ssooiill tteexxttuurree. Soiltexture affects the amount of water and supportavailable for plants.
Wetland soils can be saturated all year long or for a portion of the growing season. Wetland soils areoftendifferent than upland soils in their odor, texture, and color. Often, wetland soils have astrong rotten egg or earthy smell, which is associated with a high amount of decomposingplant materials. These decomposing materials canalso make the soil feel very slimy.
Plankton
Wetlands support a diverse population of animalsby providing water and shelter. They also serve asan abundant food source for many animals. Thesmallest of all life in the food web are free-floating,microscopic organisms called ppllaannkkttoonn. Althoughmany have “false feet,” hair (cilia), or long whip-likeparts (flagellum) that help them move, they are toosmall to propel themselves through water and thusat the mercy of winds and tides. Plankton consistsof plants, such as algae and diatoms (phytoplank-ton) and animals, including copapods, fish larvae andsmall eggs (zooplankton). Most pphhyyttooppllaannkkttoonn aresingle-celled organisms. They use photosynthesisand energy from the sun to grow. ZZooooppllaannkkttoonn inturn feed on phytoplankton. Macroinvertebrateseat zooplankton .and energy continues to travelthrough the food web!
plankton -copepods
field 123

wetland study activities:
WWIILLDDLLIIFFEE SSIIGGHHTTIINNGGSS && SSIIGGNN.. Wetlands areincredible places to view wildlife and signs ofwildlife (refer to the “Wildlife Ecology” sectionof this guide for more information).Throughout your investigation, record wildlifesightings and sign you observe.
AAQQUUAATTIICC IINNVVEERRTTEEBBRRAATTEESS. In awetland area, aquatic invertebrates (Refer to the“Aquatic Invertebrates” section of this guide) can be free swimming, crawling, attached to vegetation or along the bottomof the wetland. Choose a siteand record sample site information on the data sheet.
To collect aquatic invertebrates in a wetlandit is not necessary to get into the water.From the boardwalk or bank, gently sweep netthrough your sample area (Be careful not touproot or crush the vegetation). Pay attention and note where the specimenswere collected from (plants, silt, rocks, etc.).
WWAATTEERR CCHHEEMMIISSTTRRYY. Follow procedures from “WaterChemistry” section ofthis guide for tempera-ture, pH, dissolved oxygen and turbidity.Record results.
WWAATTEERR DDEEPPTTHH. Use a measuring device to measure the water depth from the edge ofthe dock/deck. Record results.
Wetland Ecologyin the field
MaterialsNeeded:
standard equipment
binoculars
nets
white tubs
turkey basters
forceps
ice cube trays
magnifying boxes
thermometer
Hach pH kit
CHEMets DO Kit
turbidity kit
waste water container
soil auger or shovel
soil pH kit
depth measuringdevice
microscope
petrie dishes
dropper
bucket or pitcher
field 124
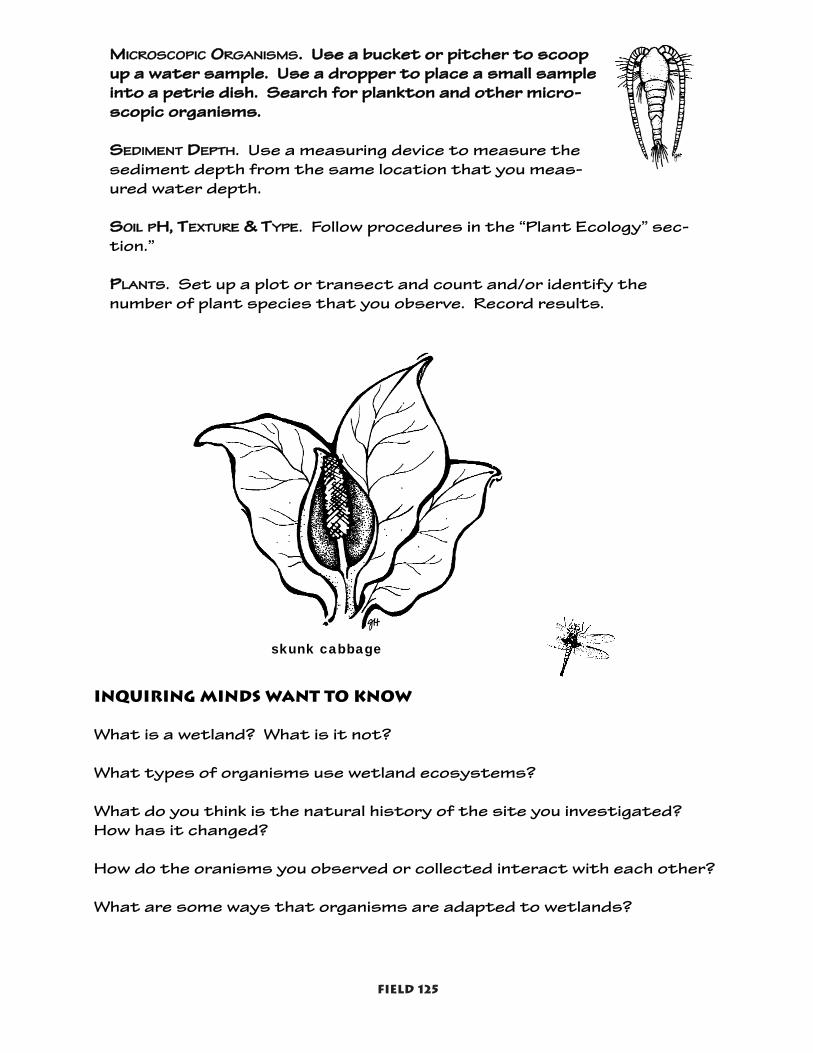
field 125
Inquiring minds want to know
What is a wetland? What is it not?
What types of organisms use wetland ecosystems?
What do you think is the natural history of the site you investigated?How has it changed?
How do the oranisms you observed or collected interact with each other?
What are some ways that organisms are adapted to wetlands?
MMIICCRROOSSCCOOPPIICC OORRGGAANNIISSMMSS.. UUssee aa bbuucckkeett oorr ppiittcchheerr ttoo ssccooooppuupp aa wwaatteerr ssaammppllee.. UUssee aa ddrrooppppeerr ttoo ppllaaccee aa ssmmaallll ssaammpplleeiinnttoo aa ppeettrriiee ddiisshh.. SSeeaarrcchh ffoorr ppllaannkkttoonn aanndd ootthheerr mmiiccrroo--ssccooppiicc oorrggaanniissmmss..
SSEEDDIIMMEENNTT DDEEPPTTHH. Use a measuring device to measure thesediment depth from the same location that you meas-ured water depth.
SSOOIILL PPHH,, TTEEXXTTUURREE && TTYYPPEE. Follow procedures in the “Plant Ecology” sec-tion.”
PPLLAANNTTSS. Set up a plot or transect and count and/or identify the number of plant species that you observe. Record results.
skunk cabbage
Resources to learn more about Wetlands
BooksAdopt-A-Wetland: A Northwest Guide by Steve Yates. From theAdopt-A-Stream Foundation. An illustrated and understandable guide towetlands.
CurriculumAnimal Tracks: Wetland Action Pack by National Wildlife Federation. AK-6th curriculum. www.nwf.org/atracks.
Wading into Wetlands by National Wildlife Federation. Includes activities,games, puzzles, etc. A K-8th curriculum.
Wow! The Wonders of Wetlands: An Educator’s Guide. A comprehen-sive guide for developing wetlands study programs, K-12th.
Field GuidesWetland Plants of Oregon and Washington by Jennifer Guard.
Wetlands Nature Guide by National Audubon Society. A comprehensiveguide with color photos.
Websiteswww.nwrc.gov/. This is the USGS National Wetlands Research Centersite. Very comprehensive!
www.nwf.org/nwf/wetlands/index.html. This is the National WildlifeFederation’s site on wetlands.
field 126

glossaryAcidic - A substance that has more hydrogen ion activity than hydroxyl activity.
Adaptation - A genetically-controlled characteristic that helps organismssurvive and reproduce in their environment.
Angiosperms - Flowering plants that produce seeds in fruit .
Anther - The upper portion of the stamen containing pollen grains.
Arthropods - Any of the numerous invertebrate organisms of the phylumArthropoda, which includes insects, spiders, centipedes and millipedes.
Bark - The outer layer of a tree trunk used to protect the tree from insects,diseases, and fires.
Basic - A substance that has more hydroxyl ion activity than hydrogen ionactivity.
Bole - The trunk of a tree, which is the central support rod giving the tree itsstrength and long shape.
Cambium - The part that adds thickness to a tree. The living dividing tissue.
Camouflage - A coloration or form adaptation by a species designed to hidefrom predators.
Cannibalism - A special type of predation in which one species eats an individ-ual of the same species.
Canopy - The uppermost layer of a forest.
Carnivores - A consumer that eats only other consumers.
Chlorophyll - A green pigment found in plants that is necessary for theprocess of photosynthesis.
Commensalism - A relationship between two species in which one species ben-efits and the other is neither harmed nor helped.
Community - A group of interacting populations of different species in over-lapping habitats.
Glos 1
Competition - The relationship between species that attempt to use thesame limited resource.
Coniferous - Needle-leaved trees that usually produce seed cones.
Cross Section Area - How deep and wide a stream is.
Crown Class - The position of a tree’s height relative to the other trees in thestand.
Cynobacteria - A group of blue-green bacteria that live throught the world,mostly in water, but also on land. Can be a photobiont component of somelichens.
Deciduous - Trees that lose their leaves during a particular season each year.
Decomposers - Organisms that feed on dead plant and animal material.
Dendrochronology - The study of climate change and other past eventsthrough the comparison of successive annual growth rings of trees.
Deposition - Rock and organic materials that settle out within a water system.
Detritivores - Decomposers. Receive energy from recycling nutrients by eat-ing dead organisms.
Dissolved Oxygen (DO) - The oxygen in a water solution as molecular oxygen(O2).
Disturbance - An event that disrupts or changes all or part of an ecosystem.
Diversity - The variety in an ecosystem; usually referring to habitats orspecies.
Dominant Trees - Trees that are at the top of the canopy.
Ecology - The study of how living things interact with each other and withtheir nonliving environments.
Ecosystem - All living organisms in a certain area as well as their physical envi-ronment.
Erosion - Natural process of weathering by which material is removed from theearth’s surface.
Glos 2
Evenness - In terms of diversity, species evenness is determined by comparing the numbers of individuals within each species.
Evolution - A change in the genetic characteristics of a population from onegeneration to the next.
Feeding Groups - Referring to the classification of what and how aquaticorganisms eat.
Food Chain - The sequence in which energy is transferred from one organism tothe next as each organism eats and is then eaten by another.
Food Web - The interlocking, complex pattern of food chains in an ecosystem.
Forest Floor - The lowest layer of a forest consisting of many organismsincluding insects, fungi, moss, and lichen.
Frond - The leaf of a fern.
Germination - In a plant seed, to sprout growth.
Glide - Section of a water system where the water is moving faster than in apool, but without white water.
Ground Water - Water beneath the earth’s surface between saturated soiland rock that supplies springs, streams and eventually rivers and seas.
Gymnosperms - Plants that produce seeds in cones.
Habitat Structure - The shape, size and placement of vegetation - understo-ry, mid-section, and overstory.
Heartwood - The majority of a tree trunk’s mass. Consists of old dead xylemcells that no longer carry water. It is usually darker that other parts of thetree and provides most of the support to a tree.
Herbivores - Plant eaters. First level consumers.
Herbivory - A special variation of predation in which an animal eats a plant orplant part.
Herb Layer - The layer of a forest in between the shrub layer and the forestfloor, made up of small plants.
Host - An organism on which a parasite feeds.
Glos 3
Hydroxyl Ion (OH-) - The highly reactive negative ion in a water molecule. Awater molecule that has more hydroxyl ion activity than hydrogen ion activityis considered basic.
Hydrogen Ion (H+) - The highly reactive positive ion in a water molecule. Awater molecule that has more hydrogen ion activity than hydroxyl ion activityis considered acidic.
Hypothesis - Implies insufficient evidence to provide more than a tentativeexplanation. An educated guess that is testable.
Impermeable surfaces - Hard surfaces, like roads or roof tops that watercannot penetrate.
Intermediate Trees - Trees that are just below the canopy in a forest.
Invasive - Non-native species that invade, spread and out compete the naturalspecies.
Kinetic Energy - The movement of molecules within a substance.
Larva - The immature stage of an organism. Often times very different fromthe adult form.
Law - Implies a statement of order and relation in nature that has been foundto be invariable under the same conditions.
Leaves - The food processing part of a tree, where (generally) photosynthesistakes place.
Lichen - A fungi, which has formed a successful alliance (a symbiotic relation-ship) with an algae.
Macroinvertebrates - Animals without backbones large enough to identifywith the unaided eye; often aquatic insects.
Meander - Refers to water systems that follow a winding and turning course.
Mutualism - A relationship between two species in which both benefit.
Natural Selection - A term used to describe the unequal survival and repro-duction of organisms that results from the presence or absence of particularinherited traits.
Nephelometric Turbidity Unit (NTU) - The unit of measurement for turbidity.
Niche -The role of an organism in an ecosystem.
Glos 4
Nitrogen - A nutrient that is released when organic matter decomposes. Thisnutrient is critical to stimulating plant growth.
Nymph - One of the young of any insect that undergoes incomplete metamorphosis.
Omnivore - A consumer that eats both plants and animals.
Overtopped Trees - Trees under the dominant and intermediate crown classlayers in a forest.
Ovule - A rudimentary seed of a plant that develops into a seed after fertil-ization.
Parasite - Feeds on living animals called hosts.
Parasitism - The relationship where a parasite receives resources from itshost without killing it.
Petals - Serve as a banner to attract pollinators and a landing platform.
pH - The measure of the acidity or basicity of a substance.
Phloem - A series of small tubes that transports the sap (food) from theleaves down to the roots of a tree.
Phosphorus - A nutrient found in soil which aids in plant growth.
Photobiont - The photosynthetic component of a lichen.
Photosynthesis - The process green plants use to produce food as sugar fromcarbon dioxide, water and sunlight.
Pistil - the central organ of a flower which contains the female parts: stigma,style and ovary.
Pool - Deep areas in a water system where the water is slow or swirling.
Pollen - Fine, yellowish powder-like grains, which contain the male germ cells of aplant.
Pollination - The transfer of pollen from anther (male) to the stigma (female)of a plant from fertilization.
Population - A group of individuals of the same species that live in a particularhabitat.
Glos 5
Potassium - A nutrient found in soil, which aids in plant growth and survival.
Predation - The act of killing and eating another organism.
Predator - Organisms that actively hunt, kill, and eat other organisms.
Prey - An organism upon which a predator feeds.
Richness - The number of species in an ecosystem.
Riffle - Fast moving portion of a stream, characterized by white water. Alsocalled rapids. riffles are well oxygenated sections that provide great condi-tions for many aquatic organisms.
Riparian Area - The vegetated area along the banks of a stream that is influenced by stream water.
Scavengers - Organisms that feed on dead organisms.
Sensitive Species - Referring to aquatic organisms that cannot survive inpoor water quality conditions.
Shrub Layer - The layer of the forest in between the understory and herb lay-ers, made up of shrubs.
Springwood - Tree cambium (xylem) cells that are created in the beginning ofthe growing season. Usually larger and appear lighter than summerwood.
Stamen - The male organ of the flower consisting of anther and filament,which produces the pollen.
Stigma - The most elevated part of a flower’s pistil, which receives the pollen.
Stomata - Small holes in leaves, where oxygen and water is released into the atmosphere.
Streamflow - The total volume of water that passes in a water system.Often expressed in cubic feet per second (cfs).
Style - A slender column of tissue that connects the ovary and the stigma ofa flower pistil.
Substrate - The composition of rock materials and organic mater that makeup stream bottom.
Succession - A pattern of on-going changes (a process) over time in the
Glos 6

types of species in a community.
Summerwood - Tree cambium (xylem) cells that are created towards the endof the growing season. Usually appear smaller and darker than springwood.
Surface Runoff - The water that flows over the surface to the lowest pointon the landscape after precipitation.
Suspended Sediments - Floating materials in water that block light causingturbidity.
Temperature - The measurement of moving molecules or kinetic energy withina substance. The faster the molecules move, the warmer the temperature.
Theory - A proposed but unverified explanation. Implies greater range of evi-dence and greater likelihood of truth than a hypothesis.
Tolerant Species - Referring to aquatic organisms that can survive in poorwater quality conditions.
Trees - Single stemmed woody plants greater than 15 feet in height whenmature.
Trophic Level - A step in the transfer of energy through an ecosystem. Thelevel of a food chain that an organism occupies. A category of organisms clas-sified by what they eat.
Trunk - The central support rod giving the tree its strength and long shape.Also called a bole.
Turbidimeter - The instrument used to measure turbidity.
Turbidity - The amount of suspended matter in a water body. The measure ofhow cloudy or clear water is.
Understory - The next layer down from the canopy of a forest. Also called asub-canopy.
Velocity - The measurement of how fast something is traveling, i.e. - water.
Xylem - Living xylem moves water and nutrients from the roots up to the topof the tree and branches to the leaves. Also called sapwood.
Glos 7

Aquatic Insects of North America by Merrit and Cummins.
Bird: Eyewitness Books by David Burnie. Alfred A. Knopf. New York. 1988.
Cascade Olympic Natural History: A Trailside Reference by Daniel Mathews. Raven Editions.1994.
Discover Wetlands: A Curriculum Guide by Brian Lynn. Washington State Department of Ecology.1988.
Elements of Ecology. Smith, Addison, Wesley, Longman, Inc. 1998.
Environmental Science, 3rd Edition by DuBay, Lapinski, Schoch & Tweed. Addison Wesley Longman,Inc. 1999.
Eyewitness Science : Ecology by Steve Pollock. A Dorling Kindersley Book. New York. 1993.
Guide to Marine Coastal Plankton by DeBoyd L. Smith. West Coast Plankton Studies. 1971.
Hands-On Nature: Information and Activities for Exploring the Environment with Children edit-ed by Jenepher Lingelbach. Vermont Institute of Natural Science, Woodstock, Vermont. 1986.
Holt Environmental Science by Karen Arms. Holt, Rinehart and Winston. Austin. 2000.
LaMotte Soil Handbook, LaMotte Co., Chestertown, MD. 1985.
Lichen.com by Stephen and Sylvia Sharnoff.
Macrolichens of the Pacific Northwest by Bruce McCune and Linda Geiser. Oregon StateUniversity Press. Corvallis. 1997.
Monitoring Guidelines to Evaluate Effects of Forestry Activities on Streams in the PacificNorthwest and Alaska by the Environmental Protection Agency. Seattle. 1991.
Plants of the Pacific Northwest Coast by Pojar & Mackinnon. Lone Pine Publishing. 1994.
Practical Entomologist: An Introductory Guide to Observing and Understanding the World ofInsects by Rick Imes. A Fireside Book. Simon & Schuster, Inc. New York. 1992.
Project Learning Tree, Pre K-8 Activity Guide. American Forest Foundation. 1996.
Secret Forest Experience: A Middle School Curriculum Guide by Forest Service Employees forEnvironmental Ethics. Eugene, OR. 1999.
Streamkeeper’s Field Guide: Watershed Inventory and Stream Monitoring Methods by TomMurdoch and Martha Cheo with Kate O’Laughlin. Adopt-A-Stream Foundation, Evcerett, WA1996.
Tom Brown’s Field Guide to Nature Observation and Tracking by Tom Brown, Jr. with BrandtMorgan. A Berkley Book. New York. 1983.
Topsoil Tour by the LaMotte Company. LaMotte Company. 1993.
Trees Are Terrific! by National Wildlife Federation. McGraw-Hill. New York. 1989.
Wow! The Wonders of Wetlands: An Educator’s Guide by Britt Eckhardt Slattery. EnvironmentalConcern, Inc. and The Watercourse. 1995.
bibliography
Page BIB 1

Fires have burned across the earth for millions of years and continue to do sotoday. We have all seen tremendous imagesof forest fires. Many of us have seen wildfire first hand. These images can befrightful. When reporting about fire, termslike “hazard,” “risk” and “catastrophic” areoften used. However, from an ecologist’spoint of view, fire is an interesting and complex agent of change. Fires are an essential feature of forests in the PacificNorthwest. They perform a variety of functions and produce a range of effects.Depending on the severity and frequency offire in a forest, it can dramatically or slightlychange ecosystems. Fires can simultane-ously create or enhance habitat for one organism- while destroying it for another.
Fire ecology is a branch of ecology that focuses on the origins, cycles and effects ofwildland fire on ecosystems. A wildland fireis defined as any fire burning in a natural environment. A fire ecologist tries to understand the relationships between fire,living organisms and their habitat.
Fire Ecology“Historically, the vast majority of theforests in the western United Stateswere fire-dependent ecosystems. Fire
molded the forests.”Stephen Arno,
Research Forester-Fire Ecologist
Of all known planets, onlyEarth has the
ingredients essential forfire: oxygen, plants to
grow fuel, and lighteningto ignite the two into
flames.
Some scientists estimate that,
before the arrival of Europeans, 100
million acres of theNorth American
continent burned annually.
from OFRI
Fire 1

Fire Ecology Concepts
There are three main concepts that provide the basis for fire ecology:
1) FIRE HISTORY. Fire history is the study of how often fire occurs in a geographic area. Trees provide a historical record through a system of growth rings that develop on the trees each year. When a fire strikes an area, growth rings will show scarring.Fire scars are seen in a core sample of a tree (obtained using a tool called an increment borer). The scars allow us to determine when fires occurred in the past, and possibly theirintensity, seasonality and direction as well as other weatherpattern information in the area. Fire scars on the tree barkcan also determine the size and intensity of recent fires.
Soil can also provide clues of fire history of an area. For example, ash layers in soil can show fire patterns. Additionally,recent intense fires can leave soils hydrophobic, which meansthe soil repels water. This is a result of a waxy substance thatcomes from burned plant material, which condenses on soilparticles.
2) FIRE REGIME. Fire regime refers to patternsand cycles of fire that occur over a period oftime. Determining forest fire regime requiresconsidering fire frequency, severity, intensity,seasonality, pattern and extent. Fire severityrefers to ecological impact. Fire intensityrefers to fire behavior. For example, there canbe a high intensity fire (high burn scars, fire intotree crowns), but low severity in terms of itsimpact on parts of the ecosystem, like soil.Nearly half of the Upper Deschutes Basin canbe characterized has having a frequent fireregime, where periodic fires burn every 0-35years. Oregon’s Coast Range, has a fire regimeof every 30-100+ years. In much of the wetOlympic Peninsula in NW Washington, the fireregime is every 200+ years.
Tree core sample
Fire 2

3) FIRE ADAPTATIONS. Plants and animals develop special traits to helpthem survive- and even thrive, in fire prone environments.
PLANTS. Plants highly adapted to fire are called pyrophytes (“fire loving”). For example, many PacificNorthwest trees, like Ponderosa Pine, have thick bark toinsulate them from flames. Many plants protect theirbuds with layers of foliage or by a thick cluster of needles. Some plants even protect their buds by producing them within the main stem and roots, whichsprout following fire. Some trees, like lodgepole pine,have serotinous (pronounced sir-OT-in-ous) cones thatrequire intense heat, like that from fire, to open andallow seeds to be released.
There are species of plants that rely on fire to make the environmentmore hospitable for regeneration and growth. Fire assists critical naturalprocesses by breaking down organic matter into soil nutrients. Soil, rejuvenated with nitrogen from ash, provides a fertile seedbed for plants.With less competition and more sunlight certain seedlings, such as Douglas fir, grow quickly.
Lodge pole pine cones
are serotinous.
TRAIT FUNCTION EXAMPLE
Thick Bark Protects cambial tissues from heat
damage
Ponderosa pine, coast redwood,
western larch, Douglas fir
Resprouting Regrowth from dormant buds protected
by bark on branches and stems
Rose, Oregon ash, true oaks, tanoak,
coast redwood
Protected buds from
dense leaf bases
Protects buds from heat-induced death Sword fern, Idaho fescue, bluebunch
wheatgrass
Adaptations of Pacific Northwest Vegetation to Fire (Kauffman 1990)
Adaptations that help the survival of the INDIVIDUAL
TRAIT FUNCTION EXAMPLE
Dormant seed buried
in soil
Dormant seeds with capacity to survive
many decades until cracked by fire
Manzanita, snow brush, lupine
Fire-stimulated
flowering
Increased reproductive effort in years
following fire
Rose, Oregon ash, true oaks, tanoak,
coast redwood
Protected buds from
dense leaf bases
Protects buds from heat-induced death Sword fern, Idaho fescue, bluebunch
wheatgrass
Windborne seeds Early deposition on post-fire soils Fireweed, woodland groundsel
Adaptations that help the survival of the SPECIES
Fire 3

ANIMALS. During a fire, most animals adapt byeither fleeing or, in the case of burrowing animals, moving deeper underground. Even so,many wildlife species benefit from fire. Light ormoderately burned areas are reestablished byherbaceous plants, shrubs and seedlings. Theseenvironments provide an environment for manysmall mammals and birds, such as voles andsparrows. The abundance of small prey attracts predators like foxes, hawks, andweasels. Burned trees provide sites for cavitynesting birds like flickers, and chickadees, whilewoodpeckers thrive on the insects that inhabitfire-killed trees.
Fire and Insects
During or immediately following a fire, firefightersoften report swarming insects. Collectivelytermed “fire bugs,” these insects are most oftensome type of wood borer. The most commonwood borers are longhorned beetles, metallicwood boring beetles, and wood wasps (also calledhorntails). Wood borers follow smoke to recently-damaged or killed trees to reproduce in.Borer larvae feed within the tree. Ecologically,they are instrumental in beginning the breakdownprocesses that prepare nutrients for reuse bynew plants.
Eggs laid by wood borers right after a fire develop inside the damagedtrees, and the larvae emerge one to several years later. Wood borer larvawill only attack highly stressed trees or wood pieces with bark still attached. Large, white, segmented wood borer larvae are responsible formunching sounds often reported by visitors to burned areas or by ownersof salvaged logs and firewood. Sometimes noise of scraping on woodunder the bark can be heard up to several yards away! In addition to thesetelltale sounds, wood borer activity may produce a fine whitish, powderedor granular, boring dust that accumulates in bark crevices and at the treebase.
Whitespotted Sawyer
Long-Horned Beetle
Fire 4

Egg------------->Larvae------->Pupa------> Adult
Adult & larval stages are the longest in duration
& are encountered most frequently
Bark beetles attack and kill trees usually within thefirst season and, more or less, at the same time aswood borers. These beetles, including “engraver beetles,” Douglas-fir beetles, red turpentine beetles,and mountain pine beetles, can kill trees that other-wise would not have died from the fire affects alone. Itis also possible for bark beetles to accumulate inburned trees and spread to nearby healthy trees. Thepresence of these insects is determined by a brownboring dust, called frass, located at the base of thetree or masses of resin (pitch tubes) on the trunk.Beetle galleries on the underside of the bark provideevidence that bark beetles were present (see page 6).
Reading the Lines Under the Bark: Beetle Galleries
The most common insects in the dark world under tree bark are bark beetles. Most bark beetles live and reproduce in stressed, weakened ordead trees - especially after a fire. Most feed and reproduce in a singlespecies of tree, called the host. These beetles leave behind ample evidenceof their activities. To determine the identity of the bark’s inhabitants,you’ll need to do some detective work.
The first bark beetles to enter to a tree are called pioneer beetles. Forsome species, the females are the pioneers. Only one male generally joinseach female. For other species, the male is the pioneer. In these species,two to five females join each male. Once a pioneer beetle has found a suitable host tree, it bores in and begins to release chemical attractantscalled pheromones that attract both males and females. Each pioneerbeetle enters the tree through a small, round entrance hole that it boresthrough the bark. Once inside the tree, mating occurs in a mating or nuptial chamber, and the females chew through the inner bark making longtunnels called galleries. Females construct their egg galleries in the innerbark tissue of the tree. The inner bark, or phloem, is a think layer of softand nutritious tissue that is sandwiched between the outer bark and thehard sapwood. These bark beetle galleries are often so characteristic ofspecies that it is possible to identify the bark beetle without seeing thebeetles themselves.
Bark Beetle
Life Stages of Bark Beetle
From: Field Guide To Bark Beetles of Idaho
by Malcom Furniss & James Johnson
Fire 5
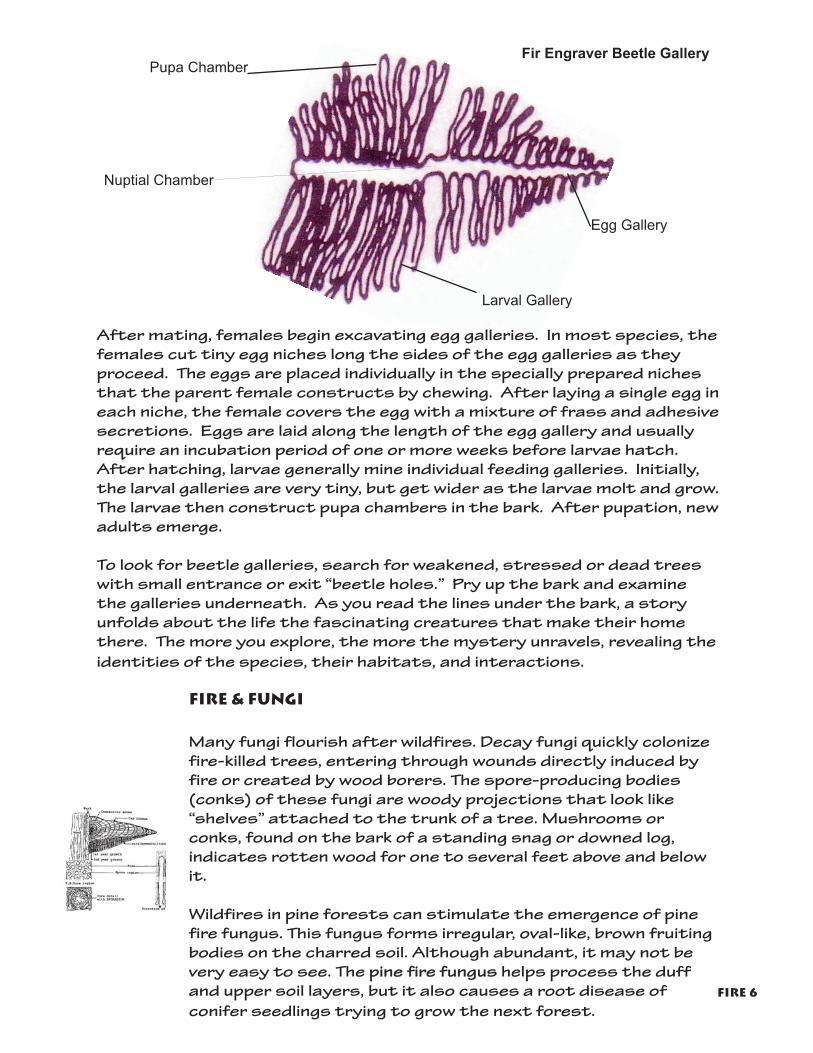
Fire & Fungi
Many fungi flourish after wildfires. Decay fungi quickly colonizefire-killed trees, entering through wounds directly induced byfire or created by wood borers. The spore-producing bodies(conks) of these fungi are woody projections that look like“shelves” attached to the trunk of a tree. Mushrooms orconks, found on the bark of a standing snag or downed log, indicates rotten wood for one to several feet above and belowit.
Wildfires in pine forests can stimulate the emergence of pinefire fungus. This fungus forms irregular, oval-like, brown fruitingbodies on the charred soil. Although abundant, it may not bevery easy to see. The pine fire fungus helps process the duffand upper soil layers, but it also causes a root disease ofconifer seedlings trying to grow the next forest.
After mating, females begin excavating egg galleries. In most species, thefemales cut tiny egg niches long the sides of the egg galleries as theyproceed. The eggs are placed individually in the specially prepared nichesthat the parent female constructs by chewing. After laying a single egg ineach niche, the female covers the egg with a mixture of frass and adhesivesecretions. Eggs are laid along the length of the egg gallery and usuallyrequire an incubation period of one or more weeks before larvae hatch.After hatching, larvae generally mine individual feeding galleries. Initially,the larval galleries are very tiny, but get wider as the larvae molt and grow.The larvae then construct pupa chambers in the bark. After pupation, newadults emerge.
To look for beetle galleries, search for weakened, stressed or dead treeswith small entrance or exit “beetle holes.” Pry up the bark and examinethe galleries underneath. As you read the lines under the bark, a storyunfolds about the life the fascinating creatures that make their homethere. The more you explore, the more the mystery unravels, revealing theidentities of the species, their habitats, and interactions.
Fir Engraver Beetle GalleryPupa Chamber
Larval Gallery
Egg Gallery
Nuptial Chamber
Fire 6
Climate Change and Fire
Recent computer models show thatthe Western United States will havewetter winters, warmer summers andan overall warmer climate throughoutthe 21st Century. A warmer climateleads researchers to believe there willbe a “woody expansion” in the West, thespread of juniper trees into grasslandsand increased understory growth inforests. Many scientists believe thatan increase in vegetation density inforests, combined with hot summers,will lead to an increase in the number ofwildland fires.
MORE FIRE FACTS
Humans start approxi-mately 90 percent of wild-land fires in the U.S. Mosttimes, they are accidental.
Lightning and lava startthe remaining 10 percent
of wildland fires. (NationalPark Service)
In Oregon, there are over240,000 homes and
other structures that liewithin the wildland-urban
interface areas. (StephenA. Fitzgerald, OSU).
In August-September2003, the Booth and BearButte Fires (known as theB & B Complex Fire) near
Sisters burned 91,915acres (about 144 square
miles).
Fires burn faster up hillsides than they do on
flat ground. The heat risingfrom the flames pre-heats
the grasses, shrubs ortrees on the upslope. Likesheets of paper, grasses
burn quickly, at a rate of upto several miles per hour
under extreme conditions.
Fire 7

The Legacy of Human-Caused Fire in America
Throughout human history people have purposely set fire to the land. It isa myth that Europeans came to an untouched wilderness when they arrived in North America. Forests and prairies were to a significant extent the creation of native peoples. Accounts by early trappers andsettlers in Oregon described widespread use of fire, especially in theWillamette Valley. In 1826, as botanist David Douglas traveled throughthe southern Willamette Valley noted in his journals, the entire area was“all burned and not a single blade of grass except on the margins ofrivulets to be seen.”
Native Americans greatly altered and changed ecosystems. Fire was themost powerful tool they had to create diverse landscapes capable ofsustaining thriving, growing societies. Burning season varied by region,but fires tended to be set when conditions permitted controllable, low-intensity burns, often in late summer or early fall. Wherever they burned,they usually did so at regular intervals of up to five years.
Native Americans generally burned parts of ecosystems to promotehabitat diversity. The result was a mosaic of forests and grasslandsthat maintained a variety of habitats and gave them food security andresource stability. By contrast, European settlers used fire to promote large-scale ecosystem uniformity, especially when it came tocrop production and pasturelands.
It has been documented that Native Americans burned the landscape forat least seventy different reasons. The following highlights eight motivesfor changing ecosystems through fire.
IMPROVE HUNTING. Fires were used to channel deer, elk, rabbits andbison into small areas for easier hunting. The Seminoles (in present dayFlorida) even used fire to hunt alligators. Some Indians used torches tospot deer and attract fish for spearing or netting. Some used smoke todislodge raccoons and bears from tree cavities. In forests and brush-lands, burning improved visibility for hunting.
MANAGE CROPS & GATHER FOOD. Fire was used to facilitate harvestand improve crop yields (especially seeds and berries), clear areas forplanting, such crops as corn and tobacco, and obtain minerals such as salt from grasses.
CONTROL PESTS. Burning was sometimes used to reduce pest popula-tions, including rodents, poisonous snakes, and insects such as black fliesand mosquitoes.
MANAGE RANGES. Fire was often used to keep prairies and meadowsopen from encroaching shrubs and trees, and to improve browse for deer,elk, antelope, bison, horses, and waterfowl.
Fire 8

FIRE PROOFING. Some tribes used fire to clear vegetation from areasaround settlements and near special medicinal plants to protect themfrom wildland fires.
WARFARE & SIGNALING. Fire was used to deprive the enemy of hidingplaces in tall grass and underbrush, to destroy enemy property, and tocamouflage an escape. Large fires were ignited to signal enemy move-ments and to gather forces for combat.
ECONOMICS. Some tribes burned large areas to prevent settlers and furtraders from finding big game, therefore profiting from supplying themwith pemmican and jerky.
TREE FELLING. Native Americans used fire in different ways to fell trees.One method was to bore two intersecting holes into the trunk, and dropburning charcoal into one hole and allow the smoke to exit from the other.Another method was to surround the base of the tree with fire, thereby“girdling” the tree and eventually killing it.
Fire Management
Fire managers are interested in the potential of fire in wildland areas. Torate an area’s fire potential, fire managers take many factors into consideration, including:
RREEGGIIMMEEFire patterns &
cycles for the area
DDEENNSSIITTYYConcentration or thickness
of forest vegetation
MMOOIISSTTUURREEPlant &/or soil moisture levels
TTOOPPOOGGRRAAPPHHYYThe lay of the land
BBUUGGSS//CCRRUUDD
Insect affects & plant diseases
WWEEAATTHHEERR//CCLLIIMMAATTEE
Current conditions
FFUUEELLBuild up of biomass
Fire 9

Today, fire managers can access internet based fire information such as the Wildland Fire Assessment System (www.wfas.net). This system provides a nationalview of weather and fire potential, including national firedanger and weather maps, and satellite derived "Greenness" maps.
There is also Fire Regime Condition Class (FRCC) (www.frcc.gov), which isan interagency, standardized tool for determining the degree of departure from reference condition vegetation, fuels and disturbanceregimes. Assessing FRCC can help guide management objectives and setpriorities for treatments.
Fire Management TermsWhen discussing fire management, it is important to become familiar withthe following frequently used terms.
WILDLAND URBAN INTERFACE. The wildland urban interface describesareas where residences are closely built to wildland areas where wildfiresnaturally occur, such as forests and rangelands. People living in theseareas must take preventative measures to protect their property fromwildfire. For example, it is recommended that people living in a wildlandurban interface create 30-foot defensible zones around their houses, usefire resistant landscaping (called firescaping), and non-combustible build-ing materials.
PRESCRIBED FIRE. Forest managers sometimes treat forests with prescribed or intentional fires (also called controlled burns). Intentionalfires are used in areas with a build up of forest materials and a potentialfor severe wildfires. Prescribed fires are set under specified conditionsthat confine the fire to a predetermined area and produce fire behaviorand characteristics required to attain planned fire treatment and resource management objectives. Prescribed fire is often used to treatareas adjacent to wildland-urban interface. WILDLAND FIRE USE. Wildland Fire Use (WFU) is the management of naturally started fires toachieve resource benefits, in areas where fire is a major component of theecosystem. Especially in wilderness areas, allowing fire to burn and playits natural role, enhances many resource values, like wildlife habitat.
Fire 10

FIRE SUPPRESSION. Following the European settlement of the westernU.S., fire was considered a destructive force. This view resulted in policiesand funding to support fire suppression efforts (putting out all fires) to“protect” forests and watersheds from the “devastating” effects of wildfire and the loss of timber revenues.
Many believe that altering the fire has changed our Pacific Northwestforests. In addition, the removal of large, fire-resistant trees and the increase of fuels and tree density with the lack of fire over the last century are at risk for high severity fires. The absence of fire has allowednatural plant succession to proceed changing wildlife habitat in manyareas.
FIRE TRIANGLE. Fire is a chemical reaction that requires the presence of three essential elements: FUEL(carbon) – something that will burn (such as grasses,needles, leaves, brush and trees etc.), HEAT – enough tostart and make the fuel burn, and OXYGEN. Usually,these three elements are expressed as a triangle, calledthe “FIRE TRIANGLE.” Remove one of these three elements and the fire will go out.
FIRE BEHAVIOR. Success in planning and suppressing wildfires is directly related to how well Fire Managers understand and predict fire behavior. The safety of all firefighting personnel also depends on this knowledge.
Fire Behavior is defined as: the manner in which fuel ignites, flame develops, and fire spreads as determined bythe interaction of FUEL, WEATHER, and TOPOGRAPHY.
What makes some wildfires burn so hot and others not? What makesfires spread fast one day and slow on another day? A wildfire behaves according to the environment in which it is burning. This environment consists of various elements of fuels, topography and weather. These elements and their relationships with one another determine the behaviorof fire.
There are many elements that affect how a fire behaves. A change in anyone of these elements will cause a change in the behavior of the fire-- thischange can be very abrupt and rapid.
Fire 11

Wind can push a fire along; fires also
create their own wind currents. Low
relative humidity can dry out fuels causing
them to ignite more easily. Precipitation
can put out a fire and conversely a lack of
precipitation allows fuels to dry out.
A fire moves more rapidly up hill because
flames are tilted toward the slope and more
efficiently dries out the oncoming fuel.
The dryer and lighter the fuels the more
easily they will ignite. A continuous layer of
fuels on the forest floor can aid in the
spread of a fire. Fuels on the surface and
small trees and shrubs can act like a
ladder and allow fire to move from the for-
est floor up into the crowns. This is known
as a "fuel ladder."
WEATHER
(Wind, Temperature, Humidity, Precipitation, etc.)
TOPOGRAPHY(steep, flat, etc.)
FUELS(light, heavy, arrangement, moisture, etc.)
Fire Behavior Triangle Elements:
Fire 12
FIRE ECOLOGYIN THE FIELD
The following activities complement Wolftree’sfield modules. They are designed to challengeteams to focus on wildland fire. Within the firetheme, a team may wish to focus on the firehistory/cycles of the site, or focus on the firepotential of the site, or both. Nevertheless, allteams should examine the relationship of firewith organisms (including humans) and theirhabits (adaptations, dependence, effects, etc.)at the site.
Equipment:
Standard Field Gear
GRS Densiometers
DBH Tapes
Clinometers
Increment borers
Wind Meter
Sling Psychrometer
GPS Units
Digital Cameras
Soil Pit Protocols &Materials
Photo series oncoarse woody debris
KEY FIRE QUESTIONS:
How have organisms and their habitats been effected by fire/absence of fire?
How might organisms and their habitats be af-fected by fire/absence of fire in the future?
What is the fire history of the site? What isthe fire cycle (or regime)?
What is the potential for wildfire at this site?
What might be some management strategiesfor dealing a high or moderate potential forwildfire?
If fire were to occur what would be its behavior?
Fire 13

Data Collection Methods & Techniques
FIRE HISTORY/REGIMEAs your team travels through the site look for SIGNS OF FIRE, which maylead to determining the fire history/regime of the area.
Look for and document evidence of:
FIRE SCARS on trees (often called “cat faces” because of their triangle shape)
BURN SCARS on the landscapeLIGHTENING STRIKES on trees
CHARCOAL on the ground.
Also look for PATTERNS on the landscape that could havebeen caused by a FIRE DISTURBANCE such as:OPEN AREAS,
NUMEROUS SNAGS, MULTIAGE STANDS,
LACK OF MOSS OR LICHEN, AND “FIRE PLANTS” (i.e. fire weed or
bracken fern)
Looking at FIRE EVIDENCE, try to determine the ORIGIN of the fire: NATURAL,
PRESCRIBED, LOGGING SLASH BURN,
CAMPFIRE, LIGHTENING, or
OTHER
Use your GPS, maps and aerial photos to MAP where significant SIGNS of fire exist.
If you have a camera, PHOTOGRAPH evidence and/or patterns of fire.
Fire 14
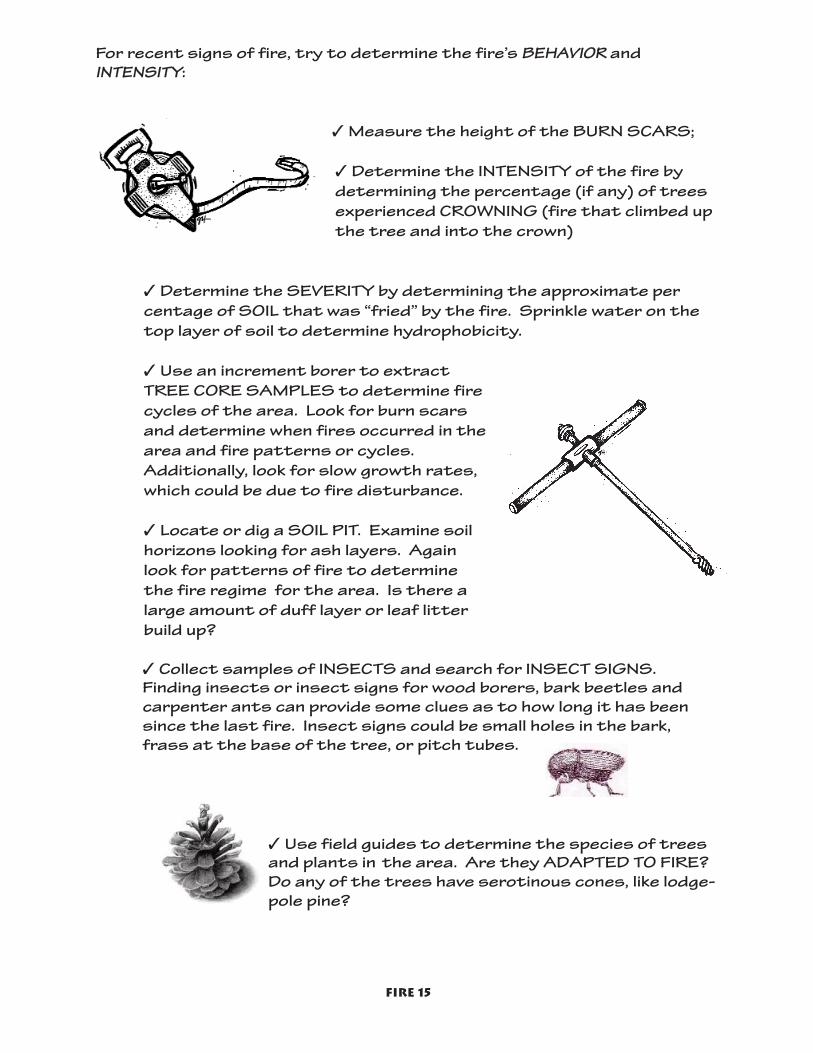
For recent signs of fire, try to determine the fire’s BEHAVIOR and INTENSITY:
✓ Measure the height of the BURN SCARS;
✓ Determine the INTENSITY of the fire by determining the percentage (if any) of trees experienced CROWNING (fire that climbed up the tree and into the crown)
✓ Determine the SEVERITY by determining the approximate percentage of SOIL that was “fried” by the fire. Sprinkle water on the top layer of soil to determine hydrophobicity.
✓ Use an increment borer to extract TREE CORE SAMPLES to determine fire cycles of the area. Look for burn scars and determine when fires occurred in the area and fire patterns or cycles. Additionally, look for slow growth rates, which could be due to fire disturbance.
✓ Locate or dig a SOIL PIT. Examine soil horizons looking for ash layers. Again look for patterns of fire to determine the fire regime for the area. Is there a large amount of duff layer or leaf litter build up?
✓ Collect samples of INSECTS and search for INSECT SIGNS. Finding insects or insect signs for wood borers, bark beetles and carpenter ants can provide some clues as to how long it has been since the last fire. Insect signs could be small holes in the bark, frass at the base of the tree, or pitch tubes.
✓ Use field guides to determine the species of treesand plants in the area. Are they ADAPTED TO FIRE?Do any of the trees have serotinous cones, like lodge-pole pine?
Fire 15

FIRE POTENTIAL
To determine the fire potential for a given area, investigate the followingelements of the forest:
VEGETATION BIOMASS/DENSITYINSECTS AND PATHOGENS
MOISTURE LEVELS (SOIL, PLANTS, ETC.)TOPOGRAPHY
MICROCLIMATE
After each investigation, determine if the evidence leads you to believethere is an increase in fire potential. When all investigations are complete,determine if there is a high, moderate or low chance of fire potential.
DETERMINE VEGETATION BIOMASS/DENSITY(Amount, type and density of vegetation contained within a given area)
Count # of trees.
Use a densiometer to determine % crown cover.
Use a DBH tape to determine diameters of trees.
Use tape measure to determine the average distance between trees.
Use tree field guides to determine the species of trees. Are they adapted to fire? Or are they intolerant to fire (easily killed by it)? (Evidence of pitch could help determine if trees are intolerant)Do any have serotinous cones, like lodge pole?
Use photo series to estimate the % of downed dead wood (coarse woody debris).
Use plant field guides to determine the species of dominant shrubs/plants/grasses. Are they adapted to fire? If so, how?
Examine the duff layer for percentage of rotting branches, leaves & needles.
Option: Measure distances from ground to lowest branch.
Fire 16

SEARCH FOR EVIDENCE OF INSECTS &/OR PATHOGENS (“BUGS &CRUD”) Does the insect/pathogen evidence lead you to believe they are increasing the potential for fire?
• Collect samples of beetle galleries, grubs, etc. .• The presence of bark beetles is indicated by a brown boring dust
located at the base of the tree or masses of resin (pitch tubes) on the trunk.
• Look for parasites like mistletoe.• Look for tree fungi.
DETERMINE THE MOISTURE CONTENT OF THE SOIL, PLANTS, LICHENS.Does evidence suggest that they are dry enough to increase fire potential? Do twigs bend or break?
DETERMINE TOPOGRAPHY. How might the topography effect fire behavior?
• Slope (clinometer)• Nearby water• Aspect
DETERMINE MICROCLIMATE. If there were a fire today, how would the microclimate effect fire behavior?
• Determine the direction and speed of the wind (wind meter).
• Determine the humidity (sling psychrometer) • Determine the temperature (thermometer).
If equipment is available, GPS AND PHOTOGRAPH THE PLOT.
CONCLUSION: Based on the information you gathered, what is the fire potential for this area? What can that tell you about plants, lichens, etc?
Fire 17
BIBLIOGRAPHYEntomology Notes: Bark Beetles by Therese Poland & Robert Haack,Michigan Entomological Society, December 1998.
Field Guide to Bark Beetles of Idaho by Malcolm Furniss & James Johnson,University of Idaho, 2002.
Fire in Oregon Forests, Oregon Forest Resources Institute, 2002.
Western Forests, Fire Risk, & Climate Change, Science Update, PNW Re-search Station, US Forest Service, Jan. 2004.
Insects and Diseases Associated with Forest Fires by D. Lathernam, Col-orado State University, Dec. 2002.
Living with Fire - The Science of Fire, US Forest Service
Wildland Fire – An American Legacy, Fire Management Volume 60, No. 3, USForest Service, Summer 2000.
Fire in Oregon’s Forests: Risks, Effects, and Treatment Options byStephen A. Fitzgerald, Extension Forestry Program, Oregon State Univer-sity, Oregon Forest Resources Institute, Oct. 2002.
REVIEWERS:Sandra Ackley, Biologist, U.S. Fish and Wildlife Service, Bend Field Office
Geoff Babb, Fire Ecologist, Central Oregon Fire Management Service, USForest Service/BLM
Mike Cloughesy, Director of Forestry, Oregon Forest Resources Institute
Stephen Fitzgerald, Extension Forester & Associate Professor, OregonState University Extension Forestry Program, Central Oregon Region
Kelly Pohl, Researcher, The Fire Initiative, The Nature Conservancy
Julie Woodward, Rediscovery Forest Education Specialist, Oregon ForestResources Institute
Fire 18
Fungal Ecology
Why Study Fungi?
Mushrooms, molds, yeasts…all ofthese organisms fall into a singlekingdom: fungi (= plural, "fungus" = singular). While fungi are consideredbeautiful to many, they are feared bysome and a mystery to others. Nomatter what people think of fungi,there’s little argument about how fascinating they are. In addition tobeing intriguing objects of study,fungi play important roles in ecosystems. They also offer manyamazing insights into how ourecosystems work.
A person that makes a career out ofstudying fungi is called a mmyyccoollooggiisstt,and the study of fungi is calledmmyyccoollooggyy.
“Ecosystems would collapse without fungi...”--Dr. Neil Campbell,
University of California
Field 1
FFUUNN FFUUNNGGII FFAACCTTSS
Approximately 80,000species of fungi have been
identified. However, it isestimated that there areapproximately 1.5 millionspecies of fungi on the
planet. This means thatover 90% of all fungi have
yet to be documented!
The largest known organism on earth is thefungus Armillaria ostoyaefound in the Blue Mts. ofNE Oregon. The body of
this individual covers over2,300 acres and is atleast 1,900 years old.
A giant puffball mushroom produces
about seven trillion spores!
Out of the several thousand different kinds
of wild mushrooms inNorth America, only sixare known to be deadly.
fungi consumers
DRAFT
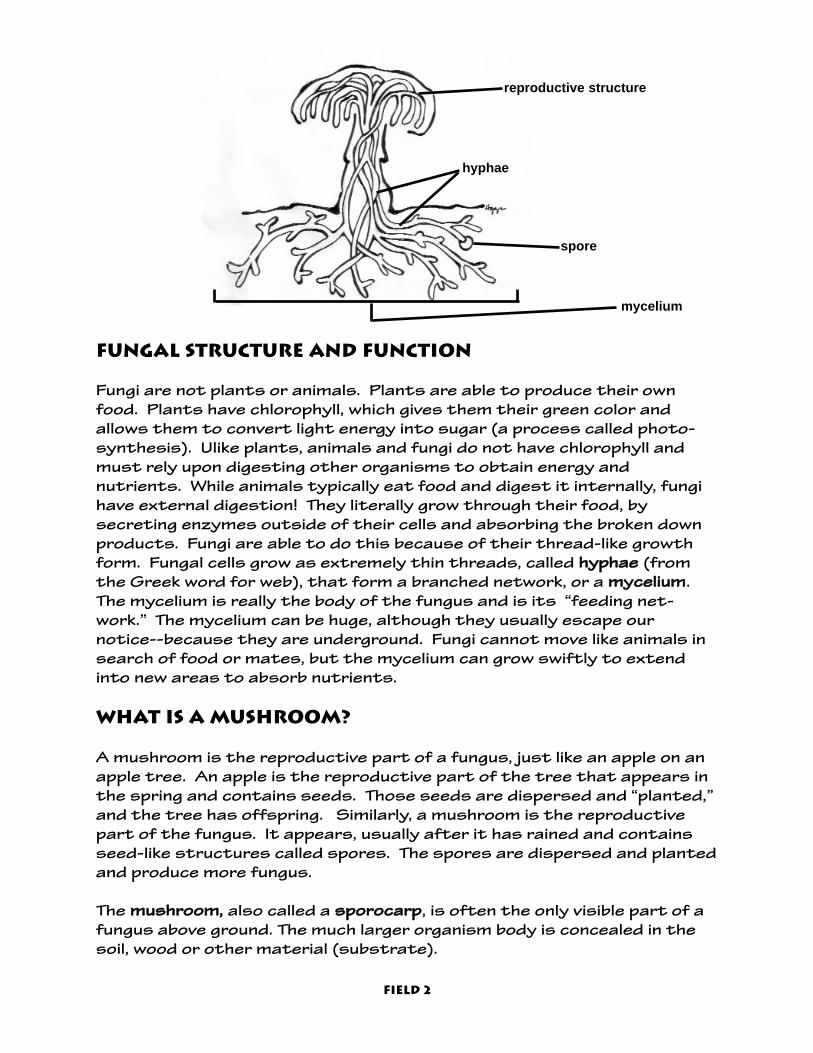
FUNGAL STRUCTURE AND FUNCTION
Fungi are not plants or animals. Plants are able to produce their ownfood. Plants have chlorophyll, which gives them their green color andallows them to convert light energy into sugar (a process called photo-synthesis). Ulike plants, animals and fungi do not have chlorophyll andmust rely upon digesting other organisms to obtain energy and nutrients. While animals typically eat food and digest it internally, fungihave external digestion! They literally grow through their food, by secreting enzymes outside of their cells and absorbing the broken downproducts. Fungi are able to do this because of their thread-like growthform. Fungal cells grow as extremely thin threads, called hhyypphhaaee (fromthe Greek word for web), that form a branched network, or a mmyycceelliiuumm.The mycelium is really the body of the fungus and is its “feeding net-work.” The mycelium can be huge, although they usually escape ournotice--because they are underground. Fungi cannot move like animals insearch of food or mates, but the mycelium can grow swiftly to extendinto new areas to absorb nutrients.
What is a Mushroom?
A mushroom is the reproductive part of a fungus, just like an apple on anapple tree. An apple is the reproductive part of the tree that appears inthe spring and contains seeds. Those seeds are dispersed and “planted,”and the tree has offspring. Similarly, a mushroom is the reproductivepart of the fungus. It appears, usually after it has rained and containsseed-like structures called spores. The spores are dispersed and plantedand produce more fungus.
The mmuusshhrroooomm,, also called a ssppoorrooccaarrpp, is often the only visible part of afungus above ground. The much larger organism body is concealed in thesoil, wood or other material (substrate).
Field 2
reproductive structure
hyphae
mycelium
spore

Habitats and Reproduction
Fungi have adapted to almost every environment where organic material andmoisture are available. They flourish inforests, grasslands, and other areaswhere dead wood and leaves are abundant.Some species of fungi live in deserts.Others live high atop mountains. Certainmarine fungi live on the remains of deadbacteria and plankton trapped in polar icecaps.
Fungi are able to reach these diverse environments by means of spores. A single mushroom may produce millions oreven trillions of spores at a time (Think ofspores as tiny seeds). Wind, water, animals, insects, and birds spread thespores.
Put simply, spores begin to grow (germinate) if they land in a moist placewhere there is an appropriate substrateor surface, like wood.
Field 3
mature mushroom
spores
spore germination
myceliummushroom
early growth
Spore Dispersal Strategies
Fungi, like plants, are immobile, and depend onmany means to disperse their spores. Manyplants depend upon wind to disperse theirseeds over long distances. The spores of fungiare smaller and lighter than all plant seeds, butthey encounter more barriers than seeds do forsuccessful dispersal. A major problem is thatmany fungi do not grow tall enough to clear the“boundary layer” of still air next to the ground.Most plants grow through the boundary layer.Fungi have adapted to the problem by eithershooting their spores above the still air, or byusing animals or water instead.
life cycle of a mushroom
early morel mushroom

AAccttiivvee ddiissppeerrssaall ooccccuurrss wwhheenn tthhee mmuusshhrroooomm hhaass aassppeecciiaall mmeecchhaanniissmm tthhaatt EEJJEECCTTSS oorr PPRROOPPEELLSS tthheessppoorreess wwhheenn tthheeyy rreeaacchh mmaattuurriittyy.. TThhee ssppoorreess tthheennuussee tthhee wwiinndd ttoo ccaarrrryy tthheemm ggrreeaatt ddiissttaanncceess.. WWeewwiillll ccaallll tthhiiss aann AACCTTIIVVEE WWIINNDD ddiissppeerrssaall ssttrraatteeggyy..
Some mushrooms, like cup fungi, use a bursting cellto “shoot” spores through the boundary layer. InPilobus fungi, a sticky cell mass containing manyspores is propelled through the air. The sporemass ejects away from the fungus at 35 feet persecond to a height of six feet, and lands as faraway as eight feet!!
PPAASSSSIIVVEE MMEECCHHAANNIISSMMSS ffoorr ddiissppeerrssaall iinncclluuddee WWIINNDD,, WWAATTEERR && AANNIIMMAALLSS..Fungi that rely on wind for spore dispersal, like giant puffballs, must produce trillions of spores to increase their chances of landing on anappropriate substrate and producing more fungi. Other fungi dispersetheir spores on the surface of water or by drops of water. Some sporeshave a chemical composition that makes them float. They can be carriedalong the surface of the water like rafts. Other spores are dispersed byraindrops, in an entirely different way. For example, a raindrop depressesa sack containing spores in leathery puffballs. The inelastic spore sackacts like a bellows, and when the sack rebounds, the spores are puffedout. “Bird’s nest” fungi produce spore-containing “eggs” in a “splash cup”.When raindrops hit the cup, its shape causes the spores to be splashedout and away from it.
Truffles are an example of fungi dispersal by animals. Truffles are produced below the ground,so they have to be unearthed to be dispersed. As truffle spores mature, they developan aroma which attracts animals that dig up thetruffles for food. The spores are not digested buteventually pass through animal at some distancefrom where the truffle was dug up. Similarly,Stinkhorn Fungi spores are contained in a slime that smells like rotten meat.The odor attracts flies, which become coated withthe spore-containing slime as they feed on it andcarry away the spores.
activedispersal images
Field 4
giant puffball dispersal

How fungi shape the forest
DDEECCOOMMPPOOSSEERRSS ((SSAAPPRROOPPHHYYTTEESS)) - Saprophitic fungiare decomposers, or recyclers, that live ondead organic material from plants, animals, andother fungi. The air is so loaded with fungalspores that as soon as a leaf falls or an insectdies, it is covered with spores and is eventuallyswarmed by fungi. In the forest, fungi play alarger role in decomposition than any othertype of organism. Decomposer fungi replenishthe soil by breaking down complex organic matter (wood, dung, humus, etc.) into simpler,reusable raw materials for new generations oflife. Imagine what would become of a forest ifits decomposers (the FBI - fungi, bacteria andinsects) rested. Leaves, logs, feces, and dead animals would pile up on the forest floor and soilwould become devoid of nutrients.
MMYYCCOORRRRHHIIZZAALL - The word mycorrhizae means “fungus roots.”Mycorrihizal fungi grow amongst the roots of plants andexchange nutrients with the plants. Plants give the fungus sugars, while the fungus provides water and nutrients. This isan example of mmuuttuuaalliissmm - where two different organisms benefit one another. Some plants cannot grow without theirmycorrhizal fungi and many mycorrhizal fungi cannot growwithout plants. Scientists suspect that up to 90% of allland plants are mycorrhizal in all types of ecosystems;becoming mutualistic with fungi can make the differencebetween a successful and an unsuccessful plant.
PPAARRAASSIITTEESS ((NNEECCRROOTTRROOPPHHSS)) AANNDD PPAATTHHOOGGEENNSS- Some fungi gain theirnutrition from consuming living organisms. This feeding strategy is called ppaarraassiittiissmm. Parasitic fungi or fungalpathogens in forests often attack weak and/or suppressedtrees. This creates what we call a “disease”. A disease iswhen there is sustained damage to a plant over time. Lightening strikes, fire, or insect damage would NOT be considered disease because they occur in a short amount oftime. However, a parasite or pathogen that continually causes damage to the tree IS considered a disease. There aretwo types of tree parasites. One type is when fungi canspend time as a ssaapprroopphhyyttee on dead material, but can alsoinfect living trees. The other is an oobblliiggaattee ppaarraassiittee such aswhite pine blister rust where the fungus requires a living hostto sustain itself. There are hundreds of native fungi in ourforests.
IMAGE OF SHELF FUNGUS
Field 5

Field 6
How Fungi Affect us
SOME FUNGI…• Are a source of ffoooodd for people and animals allaround the world. In Oregon, the annual commercialmushroom harvest is a multi-million dollar industry.In Washington, Oregon, and Idaho, more than 25species of commercially valuable mushroom specieshave been identified.
• Are used for ffeerrmmeennttaattiioonn (bread, alcohol, cheese,soy sauce, etc.).
• Can ssppooiill our food and produce mycotoxins (mush-room toxins).
• Cause ccrroopp ddiisseeaasseess such as potato blight, aplant disease that led to massive Irish immigrationto the United States in the 1840's.
• Cause opportunistic ddiisseeaasseess in ppeeooppllee (theyattack only when the immune system isdepressed).
• Produce cchheemmiiccaallss that are used as medicine(most antibiotics come from fungi, including peni-cillin).
fungi & biodiversity
Nearly all forest mammals - from the smallestmice and squirrels to large elk, deer and bear --eat fungi, including both truffles and mush-rooms. Critters like the northern flying squirrel(the main prey for the northern spotted owl)depend heavily on eating truffle fungi for mostof their diet through out the year. So, forendangered owls to survive they need healthysquirrel populations which in turn need healthyfungal truffle populations -- and the fungi needhealthy trees. When you talk about maintainingforest biodiversity, everything is tied together.
Even in the soil, the majority of microscopic insects eat fungi mycelium(the fugus body). These mycelium play important roles in maintaininghealthy soil. Not only do they feed these important soil insects, whichcontribute to soil fertility, but they also keep the organic nutrients inthe soil by preventing leaching or loss. Furthermore, mycelium plays a bigrole in strcturing soil particles to create pores and aerate the soil.
Fungal Humor:
Why did the mushroom get invited to the
party?
Because he’s a fungi!
(get it? - “fun guy”)
MMOORREE FFUUNN FFUUNNGGII FFAACCTTSS
After Mt. St.Helens erupted in1980, fungi wereamong the first
organisms to recolonize the
volcano.
If you laid out thefungal hyphae
associated with theroots of a singletree, they would
encircle the worldseveral times.

Mushroom Identification
weather and seasonal factorsFungi only produce mushrooms when conditions areright. Mushrooms need moisture to develop. Whenmushrooms are first formed, they are very smallversions of their mature selves. When rain falls, thefungal cells swell up with water, and the mushroompops above ground. This usually means that 3-7days of rain are needed before you will find mushrooms. In every region around the world thereis a “mushroom season” when most of the mush-rooms appear. The peak season in the PacificNorthwest is September to November. In manyareas, especially those with a snowpack during thewinter, a smaller crop of mushrooms appear in thespring.
DiversityMushrooms come in many colors, from white to red toblue to black. Some mushrooms have no odor, somehave delicious food odors, some smell sweet like flowers or perfumes, and some smell extremely bad.Many mushrooms are so small that we can only seethem with a microscope. Most of the ones you wouldnotice are several inches tall. The biggest mushroomscan grow to be as big as a beach ball, and could weigh upto 150 pounds. Mushrooms grow in a wide variety ofshapes. The following are some common descriptionsof those forms:
Cap and StemStem Off-Center or AbsentSaddle Like CapHoneycomb-Like CapBracketlikeSkin- or Crust-like Club-ShapedPhallus-ShapedAntlerlikeTough & Leathery
Field 7
Coral-likePear- to Pestle- ShapedCup- or Disk- ShapedCup-Shaped Containing “Eggs”Trumpet ShapedStar-ShapedEarlikeCagelikeLobed and Gelatinous

Field 8
Parts of a typical gilled mushroom:
CCAAPP: The top umbrella like fleshy structure of a mushroom.
GGIILLLLSS: Radially arranged platelike structures on the undersides ofthe caps. This is the fertile surface that bears spores for reproduction.
SSTTEEMM: The stalk that supports the cap and gills.
VVEEIILL: The veil, if present, protects all or part of a young mushroom.It is the tissue covering the young gills of certain fungi; as the capexpands this tissue breaks and may leave remnants along the capmargin or a ring on the stalk
RRIINNGG: The remains of the partial veil on the stalk of certain mushrooms
CCUUPP:: A cup surrounds the bottom of the stem.
CCAAPP SSCCAALLEESS:: Cap scales are pieces of developmental tissueremaining on the cap of the mushroom.

indian paint fungus
Indian paint fungus (Echinodontium tinctorium), also known as brownstringy trunk rot, is a unique fungus commonly found on hemlock and truefir tree species in the Pacific Northwest. The most obvious sign of thisrot are large (4 inches by 6-12 inches) ccoonnkkss, which develop on the trunksof suppressed mature living trees, usually on the underside of branchstubs. The conks are hard, woody and hoof-shaped, with grey teeth-likestructures on the underside and a roughly cracked black upper surface.The inside of the conk is dark brick red and was used by certain NativeAmerican tribes as a red dye.
Indian paint fungus causes the heartwood of the tree to decay. One conkcan indicate up to 20 feet of heartwood decay above and below the conk!The heartwood in early stages of decay appear tan in color. As the decayadvances, the wood darkens to red or yellow brown. At the mostadvanced stage of decay, the heartwood becomes a brown, stringy massthat is often very wet.
Indian paint fungus can play an important role in forests. Since it causesdecay in the heartwood of living trees it creates a soft substrate fororganisms, like birds, to hallow out cavities or chambers for nesting,roosting, resting, and denning. Decayed and hollow stems also provideareas of weakness where stem breakage may occur. Stem breakage contributes to the formation of canopy gaps, increasing structural diversity, and adds decayed wood elements to the forest floor.
Indian paint fungus conk
Field 9

Field Materials :
standard field gear
wax paper bags
flat wicker baskets
trowels
hand lenses
densiometer
forceps
putty knife
Field guides:All the Rain Promises…and More by David Arora
Mushrooms of NorthwestNorth America by HeleneSchalkwijk-Barendsen
Common Tree Diseases ofBritish Columbia by Allen,Morrison, & Wallis.
If available:GPS Unit
digital camera
lab Materials :
clear glass jars, glasses,bowls for spore prints
black & white paper
knife
clear acrylic spray (topreserve spore print)
microscope
Mushrooms Demystifiedby David Arora
Field 10
FUNGAL Ecologyin the field
Guidelines for mushroom collecting
Mycologists use flat wicker baskets for collecting mushrooms. These provide plenty ofair to specimens, are easy to carry and give asingle layer of storage (unlike, say, a back-pack), to avoid smashing mushrooms on thebottom.
Waxed paper bags are used to hold, store and preserve specimens as long as possible.Do not store mushrooms in plastic.Mushrooms are stored best in dry and coolenvironments.
Because some fungal structures are under-ground, the entire mushroom must be dug up.Be sure to collect the entire mushroom by digging into the soil under the mushroom, orby cutting the mushroom out of wood.
Collections of different fungi species need tobe kept separate. Put them in their own bags.When different species get mixed together, identification can become difficult.
While touching mushrooms will not hurt you,only experts will know whichare safe to eat.There are a few mushrooms that are deadly ifeaten. Keep in mind that mushroom identification can be very difficult, even for amycologist. Never "identify" a mushroom toeat by simply matching it to a picture in a fieldguide!
image of wicker basket w/ bagged
shrooms
image of trowel digging up a shroom

mushroom examination
Although hyphae are the main part of the fungus, theyare underground and can't easily be identified. However,mushrooms can be identified. These reproductivestructures can give us the information we need to identify fungal species. Identifying mushrooms givesresearchers information about which fungi are in anarea, and may help us to figure out what roles they playin an ecosystem.
EXAMINE AND NOTE:1. How the GILLS (if present) attach to the stem
2. How widely spaced the GILLS are
3. What the RING (if present) looks like (direction on stem, cobwebby,solid, etc.)
4. SHAPE of the STEM (bulbous on bottom, same size all the way down,etc.)
5. SHAPE of the CAP (bell-shaped, cone-shaped, flat, sunken)
6. TEXTURES of cap and stem (smooth, velvety, hairy, fibrous, scaly)
7. COLORS of different parts of the mushroom (cap, stem, gills, insidemushroom)
8. The POSITION of the STEM (off to the side, in the middle of the cap,etc.)
9. Mushrooms in different STAGES (try to get them from very small tofully developed)
In addition to looking for the cap, gills, and stem, you may need to checkother features. Your field guide will let you know which characteristicswill help you distinguish each species (color, smell, shapes, spore color,etc.).
Field 11
mushroom images
mushroom images
mushroom images

in the field data collection techniques
SKETCH each collected mushroom.
MEASURE the size of each collected mushroom (see page FIELD ) and place measurements alongside of sketches.
SMELL each collected mushroom and record theodor (often a key identification feature).
RECORD each collected mushroom’s:SUBSTRATE or from where it grows (dead wood, live wood, under a tree,soil, leaf litter, etc.).
FORM OF GROWTH (in clusters or singly)
HABITAT (nearby trees, plants, wildlife sign, characteristics of the soil,etc.)
ROLE IN THE FOREST (What you think it might be doing - decomposer,mycorhizal, or parasite).
IN THE FIELD, LOOK FOR:The MYCELIUM or body of a fungus by turning over rotting logs and leaflitter. Check for white, cottony, mats or strands of HYPHAE.Examine the mycelium with a hand lens and/or microscope and try tomake out single strands of hyphae. Some hyphae even have a yellowcolor.
PARASITIC MUSHROOMS by checking the bark of live standingtrees for shelf fungi. These are often the sporocarps of parasitic fungi. Shelf fungi, such as Indian Paint, decay the heartwood of trees.
Field 12
mushroom images
mushroom images

Back in the lab…
MMAAKKEE SSPPOORREE PPRRIINNTTSS.. Fungi reproduce from spores. In mushrooms, spores are released fromgills or pores that form on the undersurface of the mushroom cap.
Spores are so tiny that they’re difficult to see with the unaided eye.However, if you take a mushroom into a dark room and shine a light on it,you can often see the falling spores reflecting light.
Another way of examining spores is by amaking a spore print. The color of sporesmay also help you with the identification ofa mushroom. Here are the steps:
1. Cut off the stalk as close to the cap as possible.
2. Place the cap (gills down) on a piece ofpaper. If the gills are white, put the cap onblack paper. If the gills are colored, usewhite paper.
3. To keep the spores from being sweptaway by air currents, cover with a clearglass bowl, or jar. However, place some-thing, like a pencil, under the rim of thecover to let a tiny amount of air in (too much humidity under a cover may slow down spore release).
4. Let the sample sit for as long as you can (overnight is best).
5. Lift up the mushroom cap and check for the color and pattern of thespores deposited on the paper. Record this in your journal.
6. If you want to preserve yourspore print, spray with clear acrylicspray.
EEXXAAMMIINNEE SSPPOORREESS UUSSIINNGG AAMMIICCRROOSSCCOOPPEE
Microscopic details (I.e.- the sizeof the spores, their shape, whetherthey are smooth or patterned,etc.) often help mycologistsdecide what species a mushroom is.
image of spore print in progress
Field 13
spore print

Field 14
protocols for taking mushroom Measurements
cap height
stem height
base width
stem width
cap diameter
bracket width by depth
bracket thickness

INQUIRING MINDS WANTTO KNOW:
What roles do the different types of fungiplay in the forest?
How do fungi fit into the overall food web ofthe ecosystem?
What adaptations do the mushrooms haveto survive in their habitat conditions?
How do fungi affect the insect and wildlifespecies at the site?
Resources on fungal Ecology
Field Guides:All the Rain Promises… andMore by David Arora
Common Tree Diseases ofBritish Columbia by Allen,Morrison, & Wallis.
Mushrooms of NorthwestNorth America by HeleneSchalkwijk-Barendsen
A Field Guide to WesternMushrooms by AlexanderSmith.
Books:Mushrooms Demystified byDavid Arora
Web Sites:hhttttpp::////hheerrbbaarriiuumm..uussuu..eedduu//ffuunnggii//ffuunnffaaccttss// (Fun FactsAbout Fungi) by RobertFogel and Patricia Rogers.
Field 15

School________________________Site_________________________________Date____________Study Team_________________________________________________________________________Weather_____________________________________________________________________________
Field 16
Wolftree
fungal ecology Running List
Mushroom #
Substrate(live wood, deadwood, soil, etc.)
DescribeHabitat
EcologicalRole
(hypothesize)
Key Characteristics
❒❒ ddeeccoommppoosseerr❒❒ mmyyccoorrrrhhiizzaall❒❒ ppaarraassiittee
❒❒ ddeeccoommppoosseerr❒❒ mmyyccoorrrrhhiizzaall❒❒ ppaarraassiittee
❒❒ ddeeccoommppoosseerr❒❒ mmyyccoorrrrhhiizzaall❒❒ ppaarraassiittee
❒❒ ddeeccoommppoosseerr❒❒ mmyyccoorrrrhhiizzaall❒❒ ppaarraassiittee
❒❒ ddeeccoommppoosseerr❒❒ mmyyccoorrrrhhiizzaall❒❒ ppaarraassiittee
❒❒ ddeeccoommppoosseerr❒❒ mmyyccoorrrrhhiizzaall❒❒ ppaarraassiittee
❒❒ ddeeccoommppoosseerr❒❒ mmyyccoorrrrhhiizzaall❒❒ ppaarraassiittee
❒❒ ddeeccoommppoosseerr❒❒ mmyyccoorrrrhhiizzaall❒❒ ppaarraassiittee
❒❒ ddeeccoommppoosseerr❒❒ mmyyccoorrrrhhiizzaall❒❒ ppaarraassiittee
❒❒ ddeeccoommppoosseerr❒❒ mmyyccoorrrrhhiizzaall❒❒ ppaarraassiittee

field 17
WolftreeMushroom Data Sheet
Name______________________________________School_______________________________
Site________________________________________Date_________________________________
KEY IDENTIFICATION FEATURES
ccaapp ((sshhaappee,, ccoolloorr,, tteexxttuurree))
ggiillllss ((ccoolloorr,, ssppaacciinngg))::
sstteemm ((ccoolloorr,, sshhaappee,, tteexxttuurree))
Top View
SKETCHES (INCLUDE MEASUREMENTS)
GROWTH FORM: ❒❒ cclluusstteerrss ❒❒ ssiinnggllee
GGIILLLLSS AATTTTAACCHHEEDD TTOO SSTTEEMM??❒❒ yyeess ❒❒ nnoo
SSppoorree DDiissppeerrssaall SSttrraatteeggyy::❒❒ ppaassssiivvee wwiinndd❒❒ ppaassssiivvee wwaatteerr❒❒ ppaassssiivvee aanniimmaall❒❒ aaccttiivvee wwiinndd
EECCOOLLOOGGIICCAALL RROOLLEE::❒❒ ddeeccoommppoosseerr❒❒ mmyyccoorrrrhhiizzaall❒❒ ppaarraassiittee
NAME:
Side View
OTHER NOTES:

mushroom species
PARASITIC species
DDEECCOOMMPPOOSSEERR species
MMYYCCOORRRRHHIIZZAALL species
ppiiee cchhaarrtt
Percentages of Ecological Roles: table & chart
field 18
Wolftree
Fungal ecology calculations sheet
Total # collected
%
Graph Substrate Type
## uussiinngg lliivvee wwoooodd
## uussiinngg ddeeaadd wwoooodd
## uussiinngg ssooiill
## uussiinngg ootthheerr
%% ooff ttoottaall::
Spore Dispersal Technique: Divided Bar Graph
ssttrraatteeggyy:: ppaassssiivvee wwiinndd ppaassssiivvee wwaatteerr ppaassssiivvee aanniimmaall aaccttiivvee wwiinndd
ppeerrcceennttaaggee## ooff mmuusshhrroooommssppeecciieess

topographicmaps
Now when I was a little chap I had a passion formaps. I would look for hours at South America, or
Africa, or Australia, and lose myself in all the glories of exploration. At that time there weremany blank spaces on the earth, and when I saw
one that looked particularly inviting on a map(but they all look like that) I would put my finger
on it and say, "When I grow up I will go there.”
-- Author Joseph ConradHeart of Darkness (1902)
where in the world?
Maps give you the power to explore the world. Using specialized maps,called topographic maps, you can locate features of the land such aswaterfalls, and then know how to get there and what you will encounteralong the way.
Making observations. collecting data, and conducting research requiresan accurate record of your location. A topographic map, also called topomap, provides information on the existence, location of, and distancebetween cultural features on the ground, such as populated places androutes of travel and communication. It also shows physical features suchas variations in terrain, elevation, and extent of vegetation cover. Mapreading skills can also help your team find its way back to where it began,avoid dangerous cliffs and steep ravines, and find water. In an emergencysituation, the survival of a member of your team may depend on yourablility to communicate quickly and accurately determine where you areat.
TOPO 1

What is a Topo Map?
Quads, contours, elevation, true north, minutes, seconds.... Welcome tothe language of topo maps.
All maps are graphic representations of the Earth, or parts of it. A topomap, even though it lays flat (two-dimensional), is able to show theshape and elevation (three-dimensional) of the Earth’s surface.
Topo maps usually show both physical (natural) and cultural (human) features - from mountains, valleys, plains, lakes, rivers, and vegetation to roads, political boundaries, power lines, and major buildings.
The wide range of information provided by topo maps makes themextremely useful to professional and recreational map users alike. Topomaps are used for engineering, natural resource sciences, environmentalmanagement, public-works design, commercial and residential planning,and outdoor activities like backpacking, mountain biking and river rafting.
The top drawing and the countour lined topo map underneath
are representations of the same landscape.
TOPO 2
The Brunton Co.
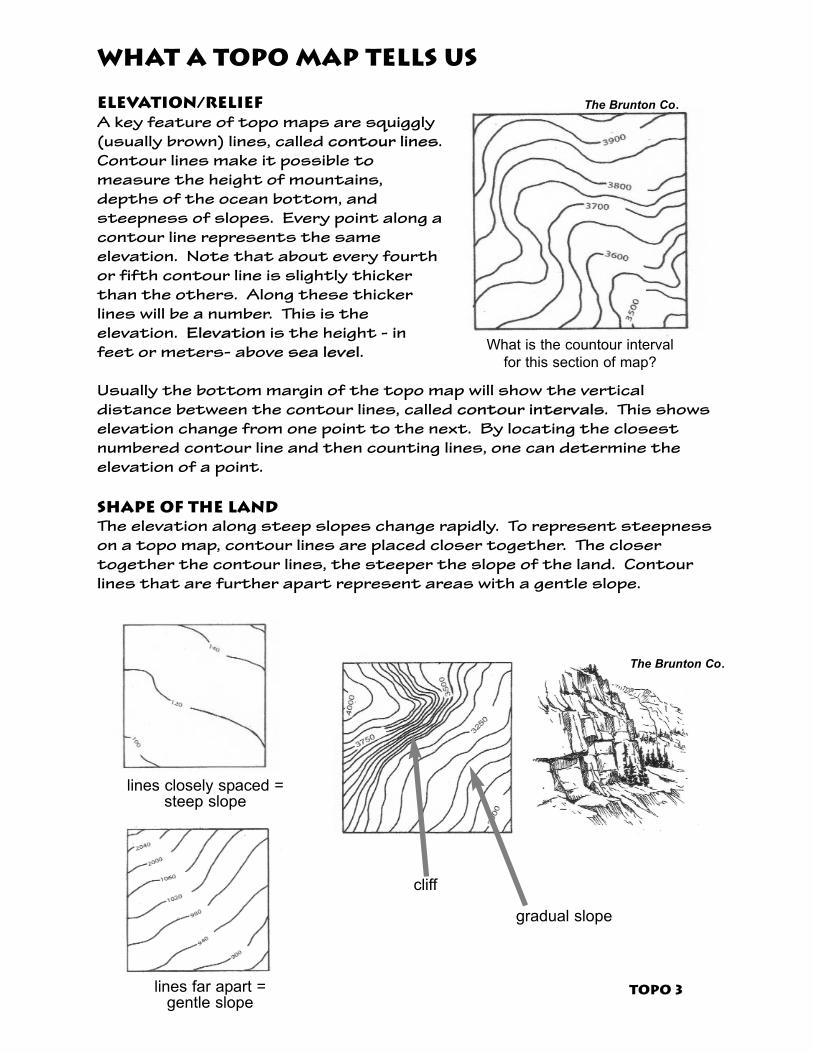
What a topo map tells us
ELEVATION/RELIEF A key feature of topo maps are squiggly(usually brown) lines, called contour lines.Contour lines make it possible to measure the height of mountains,depths of the ocean bottom, and steepness of slopes. Every point along a contour line represents the same elevation. Note that about every fourth or fifth contour line is slightly thickerthan the others. Along these thickerlines will be a number. This is the elevation. Elevation is the height - infeet or meters- above sea level.
Usually the bottom margin of the topo map will show the vertical distance between the contour lines, called contour intervals. This showselevation change from one point to the next. By locating the closestnumbered contour line and then counting lines, one can determine the elevation of a point.
SHAPE OF THE LANDThe elevation along steep slopes change rapidly. To represent steepnesson a topo map, contour lines are placed closer together. The closer together the contour lines, the steeper the slope of the land. Contourlines that are further apart represent areas with a gentle slope.
TOPO 3
lines closely spaced =steep slope
lines far apart = gentle slope
What is the countour interval
for this section of map?
cliff
The Brunton Co.
The Brunton Co.
gradual slope

DIRECTION OF A STREAM OR RIVERWhen contour lines cross a stream they form a “V.” The direction the “V”is pointing shows the water is moving upstream.
Peak or SUMMITThe summit of a mountain, hill or butte is the top. On a topo map it isexpressed as a closed circle or oval.
Streamflow
peak
The Brunton Co.
The Brunton Co.
stream
TOPO 4

SLOPE, STEEPNESS, OR GRADIENTTo find out how steep, on average, a trail will be, you must determine theelevation change, or rise, and distance of travel, or run, and then makesome simple calculations using the formula (Rise/Run) x 100.
So, if by using a ruler and the map’s scale, you determine your trail segment (run) is a distance of 730 feet and by using your contour linesyou determine your elevation change (rise) is 200 feet, then plugging thenumbers into the formula: (200/730) x 100 = 27.4%. So then your average grade or gradient is 27.4%.
PHYSICAL & CUTURAL FEATURES & Map SymbolsTopographic maps also show many cultural (human) and physical (natural) features, such as highways, airports, railroads, campgrounds, marsh-es, glacial advances, intermittent streams, and caves. For a comprehensiveoverview of topographic map symbols visit: http://erg.usgs.gov/isb/pubs/booklets/symbols/topomapsymbols.pdf
TOPO 5
From Geospatial Training & Analysis Cooperative

TOPO 6
Sample section of a USGS 7.5 minute topo (quad) map
1:24,000 scale
For complete information about USGS topo map symbols, colors, etc. visit:
http://erg.usgs.gov/isb/pubs/booklets/symbols/
peak
or summit
elevation
steep
slope
gentle
slope
stream
ridge
valley
elevationin feetabove
sea level
contour
lines
road
elements of a topo map

LOCATION
There are three primary grid systems used for determining one’s location on a topo map:Latitude/Longitude; Universal TransverseMercator, and Township, Range and Section.
LATITUDE AND LONGITUDEOn a topo map there are numbers running allaround the outside of the map. These numbersrepresent two grid systems that can be usedto find your exact location: latitude and longitude and Universal Transverse Mercator(UTM). The exact latitude and longitude isgiven at each corner of that map and at equally spaced intervals between the corners.
Latitude and longitude is the most common grid system used for navigation. It will allow you to pinpoint your location with a high degree of accuracy.Latitude is the angular distance measured north andsouth of the equator. The equator is 0 degrees.Longitude works similarly. It is the angular distance measured east and west of the PrimeMeridian. The prime meridian is 0 degrees longitude.
These two angles are measured in degrees ( ° ), minutes ( ' ), and seconds ( " ). For example, the latitude of Portland, Oregon is expressed as 45° 32'47" N, and the longitude as 122° 51' 57" W. This meansthat Portland is 45 degrees, 32 minutes and 47 seconds north of the equator, and 122 degrees, 51minutes and 47 seconds east of the prime meridian.
FYI: One degree = 70 miles60 minutes = one degree60 seconds = one minuteMost USGS Topo Maps used in the field are 7.5-minute series. These numbers refer to the dimensions of the topo map. Thus, a 7.5-minuteseries map is 7.5 minutes of latitude by 7.5 minutes oflongitude.
UTMLatitude/Longitude
lines of latitude
lines of longitude
TOPO 7
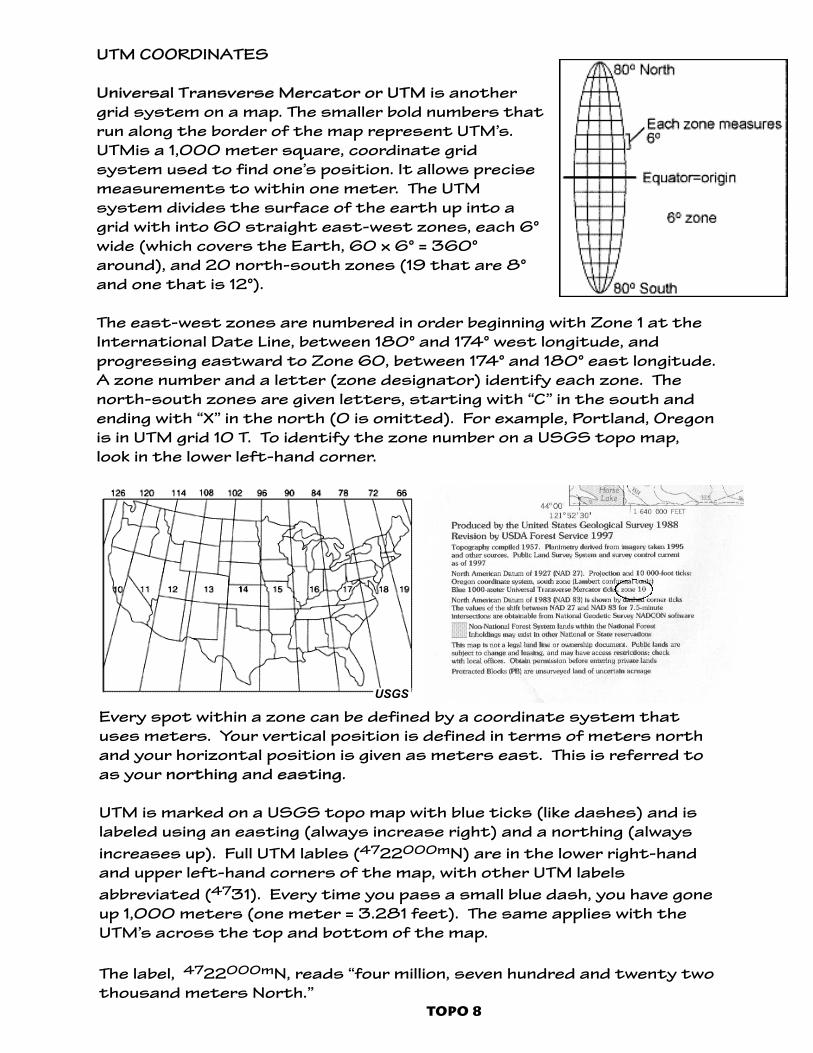
UTM COORDINATES
Universal Transverse Mercator or UTM is anothergrid system on a map. The smaller bold numbers thatrun along the border of the map represent UTM’s.UTMis a 1,000 meter square, coordinate grid system used to find one’s position. It allows precisemeasurements to within one meter. The UTM system divides the surface of the earth up into agrid with into 60 straight east-west zones, each 6°wide (which covers the Earth, 60 x 6° = 360°around), and 20 north-south zones (19 that are 8°and one that is 12°).
The east-west zones are numbered in order beginning with Zone 1 at theInternational Date Line, between 180° and 174° west longitude, and progressing eastward to Zone 60, between 174° and 180° east longitude.A zone number and a letter (zone designator) identify each zone. Thenorth-south zones are given letters, starting with “C” in the south andending with “X” in the north (0 is omitted). For example, Portland, Oregonis in UTM grid 10 T. To identify the zone number on a USGS topo map,look in the lower left-hand corner.
TOPO 8
USGS
Every spot within a zone can be defined by a coordinate system thatuses meters. Your vertical position is defined in terms of meters northand your horizontal position is given as meters east. This is referred toas your northing and easting.
UTM is marked on a USGS topo map with blue ticks (like dashes) and islabeled using an easting (always increase right) and a northing (alwaysincreases up). Full UTM lables (4722000mN) are in the lower right-handand upper left-hand corners of the map, with other UTM labels abbreviated (4731). Every time you pass a small blue dash, you have goneup 1,000 meters (one meter = 3.281 feet). The same applies with theUTM’s across the top and bottom of the map.
The label, 4722000mN, reads “four million, seven hundred and twenty twothousand meters North.”

TOWNSHIP, RANGE AND SECTION (TRS)Red vertical and horizontal lines frequently divide most or all of a topomap into squares that have red number in the center. These U.S. PublicLand Survey System lines were developed to divide land (as the countrywas expanding west of the Mississippi) into units that are one milesquare, called sections. 36 sections are grouped into a larger squarecalled a township, and the sections are numbered in a back-and-forthpattern beginning at the top right conrner.
DETERMININING TOWNSHIP.A township is 36 square miles. Township lines represent north-south sixmile intervals within the entire 36 square mile area. Township numbersare printed in the margins on the extreme right and left sides of maps.and centered between two lines that mark the township. To expresstownship, it would read something like: T 29 S, which means Township 29South.
DETERMINING RANGE.Similar to township lines, range lines are at six-mile intervals, but dividethe area east-west. Range numbers are printed in the margins at thetop and bottom of topo maps, and are also centered between two slight-ly darker vertical lines that mark the range. To express range, it wouldread something like: R 22 E, which means Range 22 East.
DETERMINING SECTION.A section is one square mile and there are 36 square miles in each township. On most maps, only the four corner section numbers (1, 6, 31,36) are printed within each township. The first row of section numbers(1-6) reads from right to left, the second row (7-12) reads from left toright, and so forth.
Accuracy to within one-quarter mile is usually sufficient. Since a section is onesquare mile, you simply need to divide it intofour equal quadrants (NE, SE, NW, SW) toget your location down to a quarter of amile. Then, identify which quadrant yourlocation is in. To express section, one itwould read something like: S 8 NW, whichmeans Section 8 Northwest corner.
Putting it all together: To express yourlocation, it would read something like: T29S,R22E, S8NW.
The TRS system is more descriptive thanlatitude and longitude and UTM systems,but relies less on absolute measurementsof location. It is useful in that it is a goodway to give a quick approximation of a location, but the main drawback is its lack of accuracy.
TOPO 9
From Geospatial Training & Analysis Cooperative

DISTANCE
Topo maps also allow you to determine how far it is from one place to another. Usually at the bottom of a topo map is a scale, which isexpressed in a ratio. A ratio is the relationship between two things. Inthis case, between the map and the real on-the-ground area the maprepresents. Often the topo maps used are 1:24,000 (the larger thescale the more detail can be shown). This means, that one unit on themap represents 24,000 of that unit on the ground. For example, onepinky fingernail length of the map equals 24,000 pinky fingernail lengthsat the actual location.
Also, usually at the bottom of a map is a bar scale (see below).
To find the distance between point A and point B (“as the crow flies”), simply use some sort of a measuring devise (often a compass has aruler), compare it to the bar scale and determine the distance.
To find the distance of a route that is not straight, use a piece of stringor flexible wire to trace the intended route. After tracing out your route,pull the string straight and measure it against the scale line in the maplegend.
TOPO 10
From Geospatial Training & Analysis Cooperative
Bibliography
United States Geological Survey web sites:http://erg.usgs.gov/isb/pubs/booklets/symbols/index.htmlhttp://geography.usgs.gov/
Kansas State University Computing and Information Sciences web site:http://www.cis.ksu.edu/~dha5446/topoweb/guide.html
Staying Found: The Complete Map and Compass Handbook by JuneFleming. Mountaineers Books. Seattle, WA. 2001.
How to Teach With Topographic Maps by Dana Van Burgh, Elizabeth N.Lyons, and Marcy Boyington. National Science Teachers Association.Arlington, VA. 1994.
Naturemapping Observers’ Guide by Sara Vickerman and Wendy Hudson.Defenders of Wildlife. Lake Oswego, OR. 1996
Idaho State University, Department of Geosciences, Geospatial Trainingand Analysis Cooperative web site:http://geology.isu.edu/geostac/Field_Exercise/topomaps/index.htm
Brunton Navigation Curriculum written and produced by The BruntonCompany, 2002. Riverton, WY 82501
TOPO 11

Reviewers
EEccoollooggiiccaall CCoonncceeppttssJim Martin, Portland State University Center for Science Education (retired)Charles Philpot, PhD., USDA - PNW Research Station (retired)
IInnvveerrtteebbrraattee EEccoollooggyyBruce Hostetler, Entomologist, Mt. Hood National ForestJohn Davis, Entomologist, U.S. Fish & WildlifeMace Vaughn, Entomologist, Xerces Society
WWiillddlliiffee EEccoollooggyySteve Lanigan, Biologist, Gifford Pinchot National ForestBetsy Howell, Retired Forest Service Wildlife Biologist/WriterDave Kennedy, Wildlife Biologist, David Evans & Associates
FFoorreesstt EEccoollooggyyJeff Reis, Inventory Coordinator, Mt. Hood National ForestShelley Butler, Silviculture Technician, Mt. Hood National ForestGlenda Goodwyne, Forester, Mt Hood National Forest
PPllaanntt EEccoollooggyyChuck Bolsinger, BotanistSue Allen, NaturalistMarty Stein, Forest Botanist, Mt. Hood National ForestTerry Fennell, Bureau of Land Management
LLiicchheenn EEccoollooggyyChiska Derr, Regional Lichenologist, Giffford Pinchot National ForestLinda Chestnut, Botanist
AAqquuaattiicc IInnvveerrtteebbrraatteessDonna Allard, Fisheries Biologist, U.S. Fish & WildlifeIan Waite, Aquatic Entomologist, U.S. Geological SurveyScott Hoffman Black, Entomologist, Xerces Society
WWaatteerr CChheemmiissttrryyBert Seierstad, Lab Manager, City of Portland Water BureauJanet Senior, City of Portland Water Bureau
SSttrreeaammffllooww EEccoollooggyyDon Holmes, Water Conservation Specialist, City of Portland Water Bureau
“In all things of nature there is something of the marvelous.”
--Aristotle