ecological site reviewer help document
TRANSCRIPT

The Ecological Site Reviewer (ESR) ArcGIS Online web-application was designed to provide access to viewing maps and attributes for basic environmental properties, ecological characteristics, and background reference information for sites throughout Montana.
Using the ESR the viewer can: • Identify and review environmental characteristics of sites prior to conducting field work • Locate representative sites for field data collection• Identify optimum navigation to selected sites• Save and print maps, charts, and tables of selected sites and associated attributes.• Provide input on data layers with the edit tool
The Ecological Site Reviewer was developed by the Montana NRCS and GIS programmers at the Montana State Library
Ecological Site Reviewer
Help Document
http://nris.msl.mt.gov http://msl.mt.gov https://www.nrcs.usda.gov/wps/portal/nrcs/mt/home
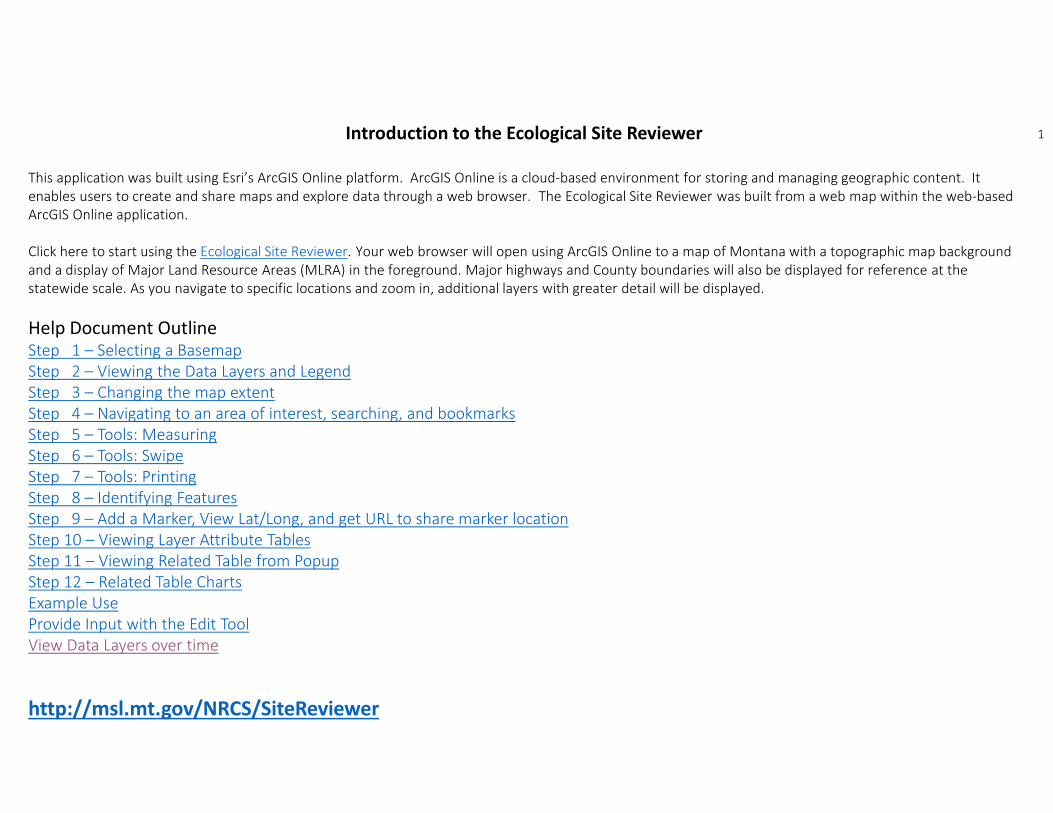
Introduction to the Ecological Site Reviewer
This application was built using Esri’s ArcGIS Online platform. ArcGIS Online is a cloud-based environment for storing and managing geographic content. It enables users to create and share maps and explore data through a web browser. The Ecological Site Reviewer was built from a web map within the web-based ArcGIS Online application.
Click here to start using the Ecological Site Reviewer. Your web browser will open using ArcGIS Online to a map of Montana with a topographic map background and a display of Major Land Resource Areas (MLRA) in the foreground. Major highways and County boundaries will also be displayed for reference at the statewide scale. As you navigate to specific locations and zoom in, additional layers with greater detail will be displayed.
Help Document OutlineStep 1 – Selecting a BasemapStep 2 – Viewing the Data Layers and LegendStep 3 – Changing the map extentStep 4 – Navigating to an area of interest, searching, and bookmarksStep 5 – Tools: MeasuringStep 6 – Tools: SwipeStep 7 – Tools: PrintingStep 8 – Identifying FeaturesStep 9 – Add a Marker, View Lat/Long, and get URL to share marker locationStep 10 – Viewing Layer Attribute TablesStep 11 – Viewing Related Table from PopupStep 12 – Related Table ChartsExample UseProvide Input with the Edit ToolView Data Layers over time
http://msl.mt.gov/NRCS/SiteReviewer
1
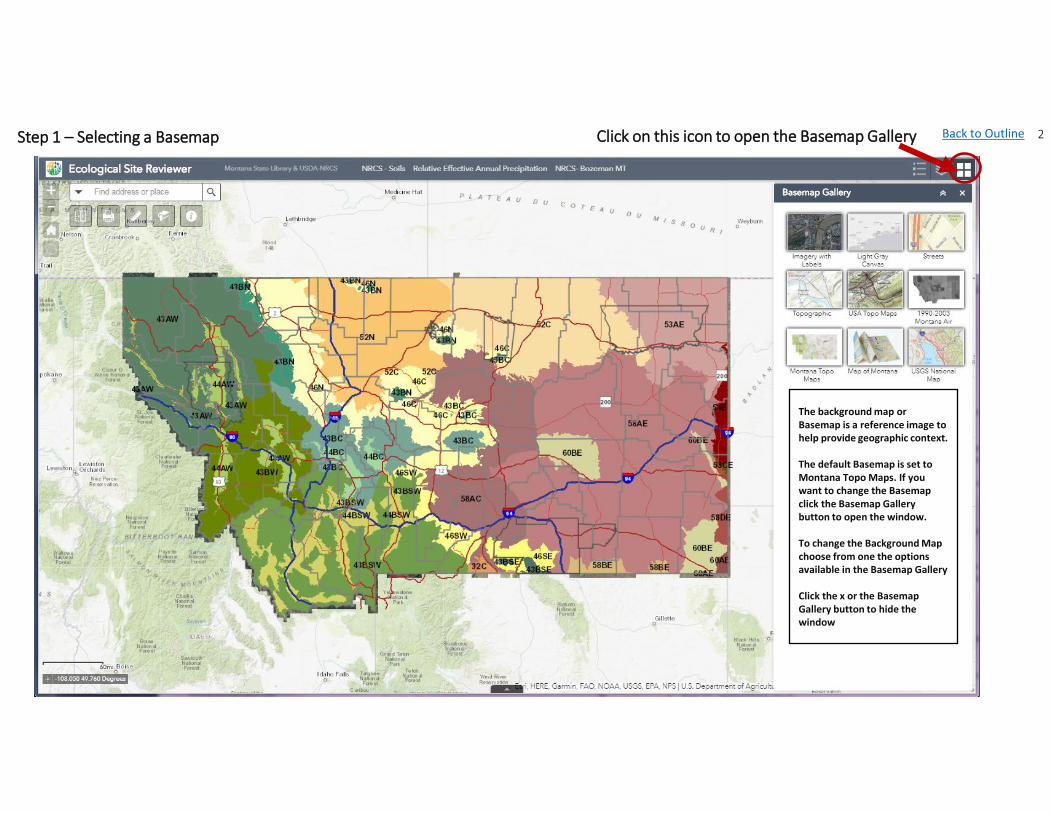
Step 1 – Selecting a Basemap
The background map or Basemap is a reference image to help provide geographic context.
The default Basemap is set to Montana Topo Maps. If you want to change the Basemapclick the Basemap Gallery button to open the window.
To change the Background Map choose from one the options available in the Basemap Gallery
Click the x or the BasemapGallery button to hide the window
2 Click on this icon to open the Basemap Gallery Back to Outline

Step 2 – Viewing the Data Layers and Legend
Turn on the Legend to see how each visible layer is symbolized to represent the features on the map.
Turn on or off the data layers within the Layer List by checking the box to the left of the layer name.
Some layers are only visible when you zoom in, and are grayed out in the Layer List if they are not visible at the current extent/scale of your map.
Layers will display in the order shown in the Layer List and may need to be turned off or on to be shown.
3 Legend Layer List
Back to Outline
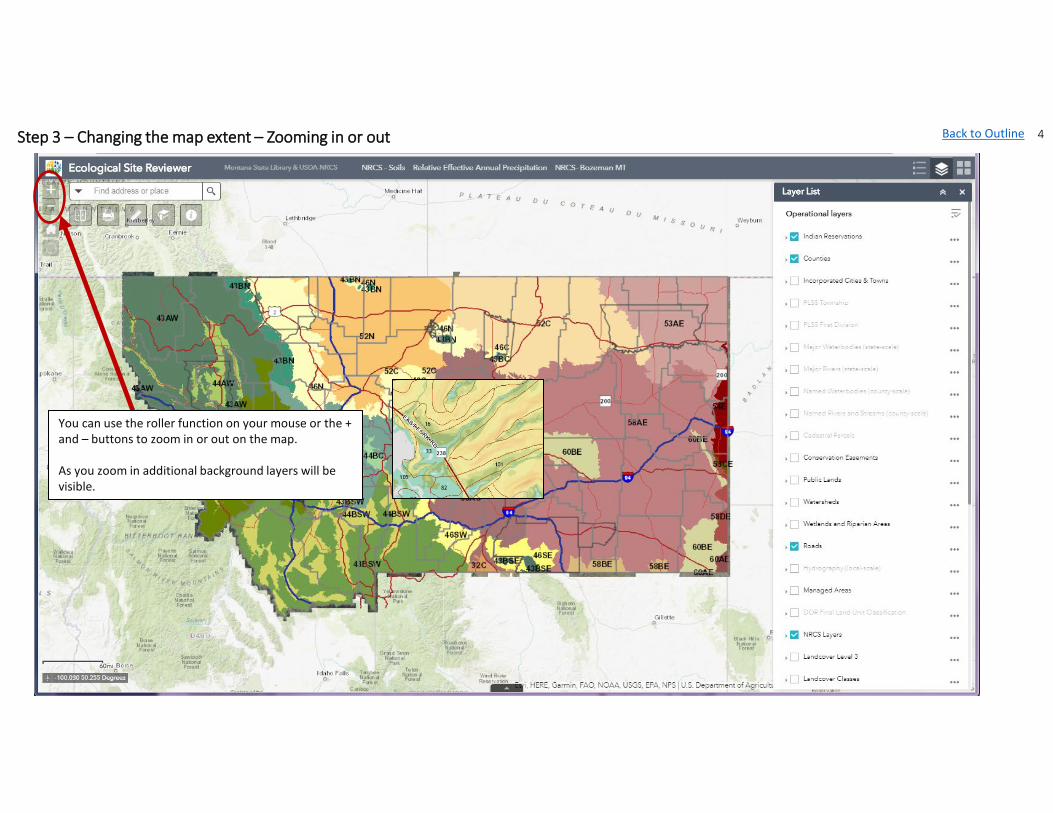
Step 3 – Changing the map extent – Zooming in or out 4
You can use the roller function on your mouse or the + and – buttons to zoom in or out on the map.
As you zoom in additional background layers will be visible.
Back to Outline

Step 4 – Navigating to an area of interest, searching, and bookmarks
Choose the Background Map from the above options available
in the Basemap Gallery
Click the Basemap Gallery button to open the window.
Click the x or the BasemapGallery button to hide the
window
Click the Down Arrow To choose a Search Option
Lat/Long coordinates –Click crosshair icon to set coordinates in one position
Type in the Search Box,Then Select from the list of possible matches.
Do not press the Enter Key or the Search Icon, as this will return the first match.
After Reloading the Map you can go back to your last Map Extent
Add and Navigate to Bookmarks
5
Once you have navigated to the desired location and scale of detail you can use the Bookmark tool to save the location and easily return to it later.
You can navigate to an area of interest by zooming in or using the search tool.
Back to Outline
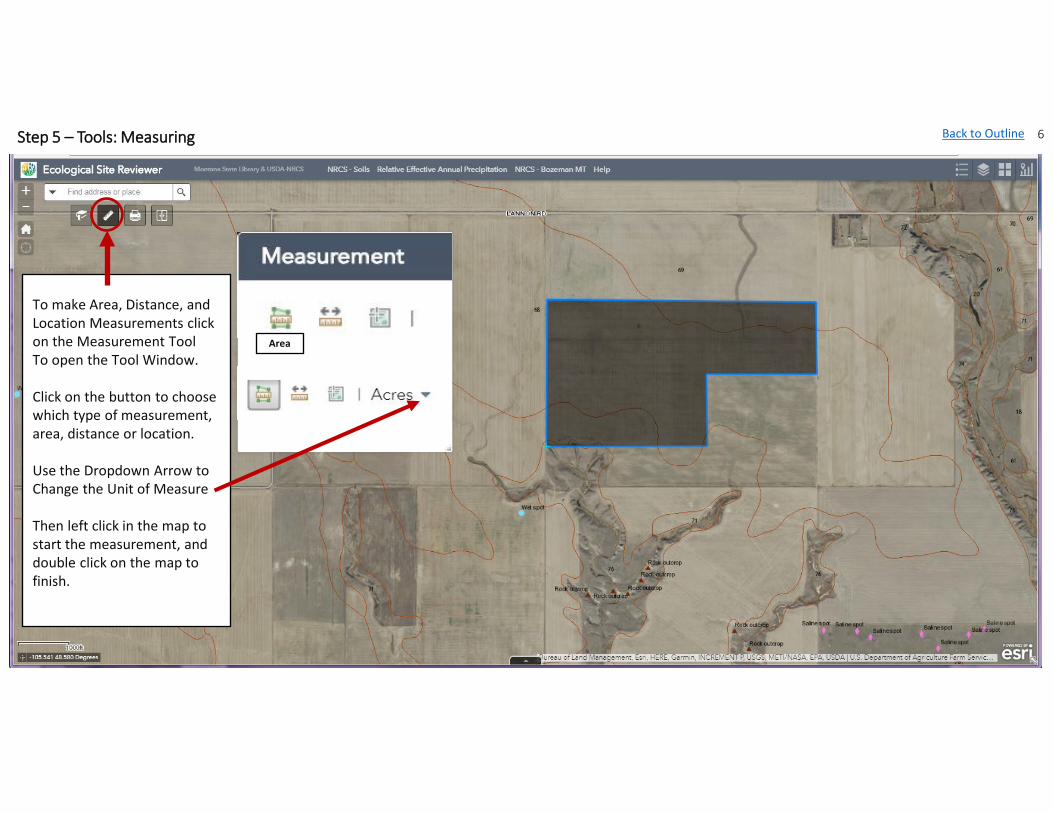
Step 5 – Tools: Measuring 6
To make Area, Distance, and Location Measurements click on the Measurement ToolTo open the Tool Window.
Click on the button to choose which type of measurement, area, distance or location.
Use the Dropdown Arrow to Change the Unit of Measure
Then left click in the map to start the measurement, and double click on the map to finish.
Area
Back to Outline
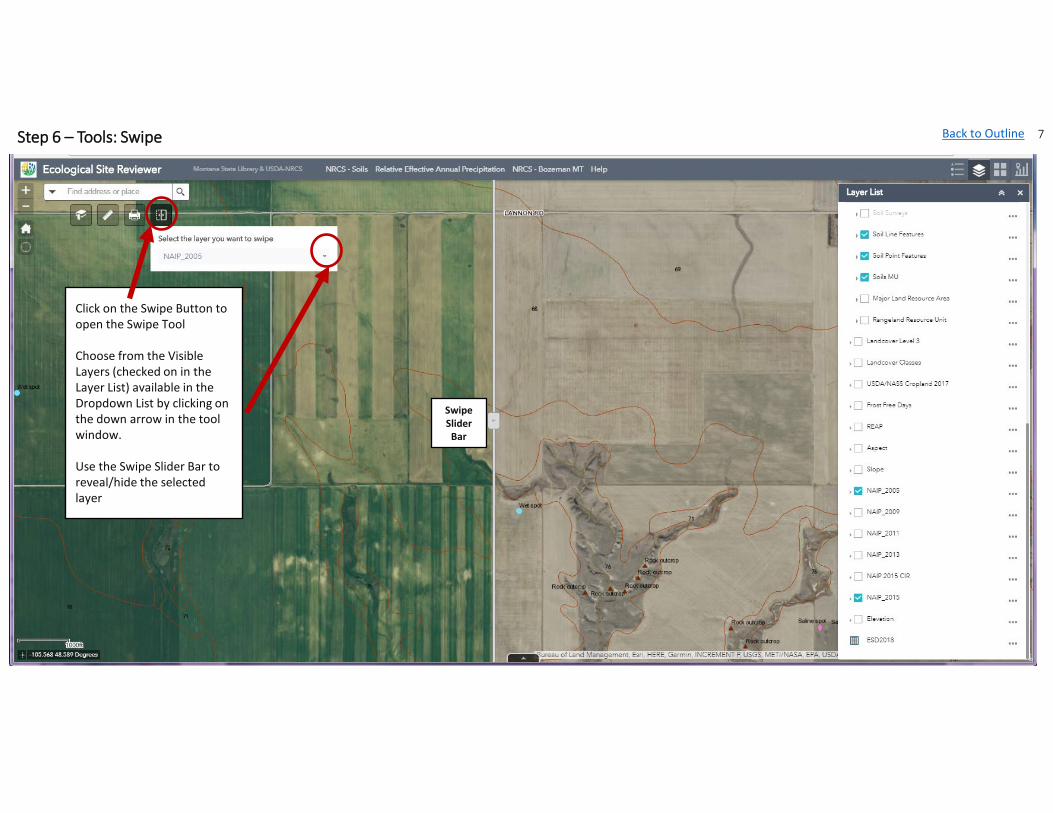
Step 6 – Tools: Swipe 7
SwipeSlider
Bar
Click on the Swipe Button to open the Swipe Tool
Choose from the Visible Layers (checked on in the Layer List) available in the Dropdown List by clicking on the down arrow in the tool window.
Use the Swipe Slider Bar to reveal/hide the selected layer
Back to Outline
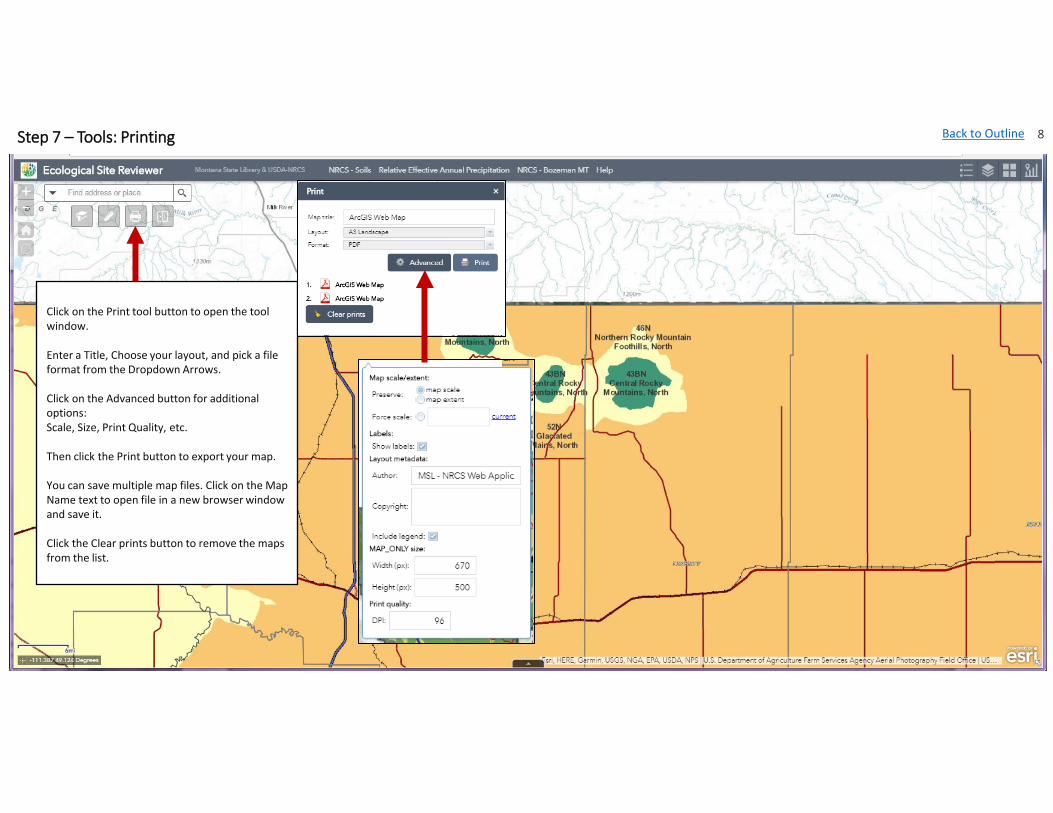
Step 7 – Tools: Printing 8
Click on the Print tool button to open the tool window.
Enter a Title, Choose your layout, and pick a file format from the Dropdown Arrows.
Click on the Advanced button for additional options:Scale, Size, Print Quality, etc.
Then click the Print button to export your map.
You can save multiple map files. Click on the Map Name text to open file in a new browser window and save it.
Click the Clear prints button to remove the maps from the list.
Back to Outline

Step 8 – Identifying Features
Show/HideMap Overview
9
Once you have navigated to an area at the level of detail you are interested in, click within the map to reveal the Popup Window that displays selected attributes of the Data Layers.
Only layers that are checked on in the Layer List and visible in the Legend will have a popup window open when you click in the map. Turn on all the layers you wish to view attributes for in the Popup Window.
The top left of the popup window will show how many layers have been opened (3 in this example). If there are several layers visible then click through the left and right arrows on the popup window to view the popup windows for other visible layers.
Back to Outline

Step 9 – Add a Marker, View Lat/Long, and get URL to share marker location 10
First, click on the map to open the popup window
Click on … and Choose:
Then click on the newly created Blue Marker to View the Lat/Long and URL to the Map Location in the Popup. The URL can then be sent to a colleague to show them the exact location you are looking at.
Back to Outline

Step 10 – Viewing Layer Attribute Tables 11
Turn on and off Column Headings by checking on/off the boxes
Click on the Column Nameto Sort the table
To open the Attribute Table(s) for existing Layers click on the drop down arrow at the bottom of the map screen.
Scroll through available attribute tables or Click Dropdown arrow to choose from the list
Attribute Table Options:Export to CSV and turn on/off Column Headings
Click on Filter by map extent to only show items in table that are visible in the map
Left Click on the empty gray box next to a record to Select it. Selected records will be highlighted in the table and on the map in cyan. You can use the ‘Zoom to’ option to focus on the selected polygon.
Back to Outline

Step 11 – Viewing Related Tables from Popup 12
Click on …To Reveal More Options
Click on …To Reveal More Options
Click on …To Reveal More Options
Related Tables:In the Ecological Site Reviewer the soils map units have been related to a table containing additional ecological site attributes. The ESD2019 table has a one-to-many relationship with the Soils MU data layer that can be explored through the popups and the attribute table.
Back to Outline
ESD2019
ESD2019
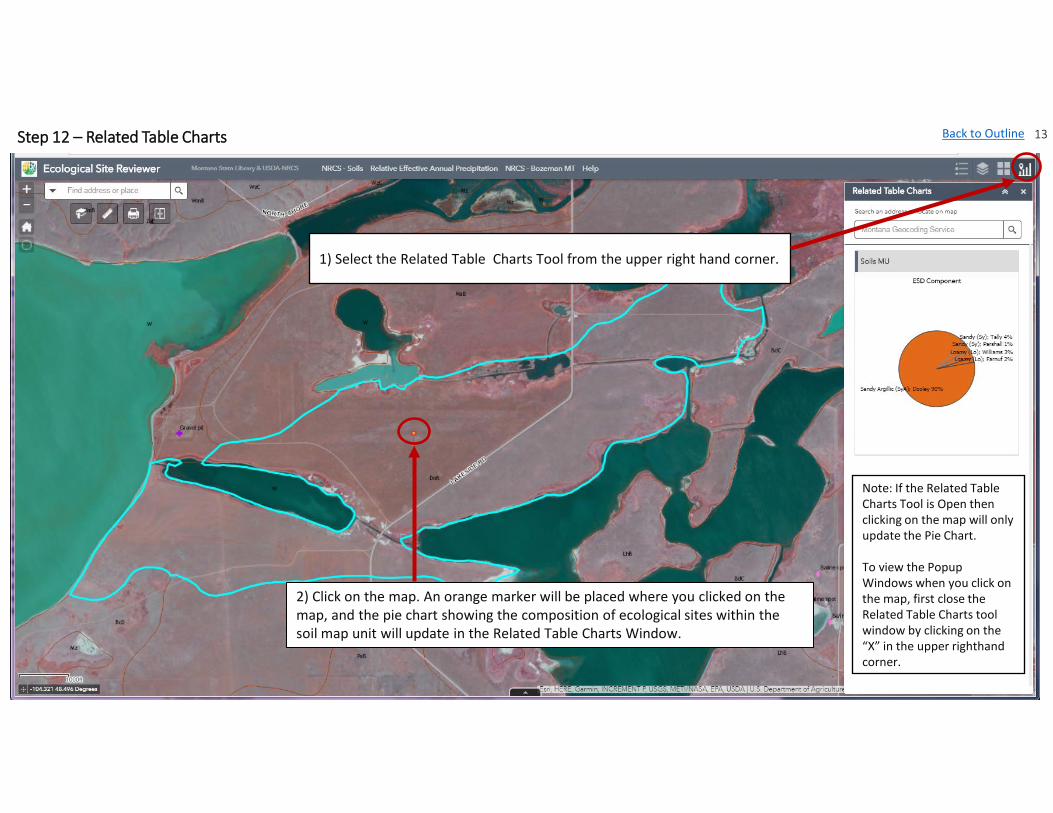
Step 12 – Related Table Charts 13
Note: If the Related Table Charts Tool is Open then clicking on the map will only update the Pie Chart.
To view the Popup Windows when you click on the map, first close the Related Table Charts tool window by clicking on the “X” in the upper righthand corner.
1) Select the Related Table Charts Tool from the upper right hand corner.
2) Click on the map. An orange marker will be placed where you clicked on the map, and the pie chart showing the composition of ecological sites within the soil map unit will update in the Related Table Charts Window.
Back to Outline

Ecological Site Reviewer – Example Use
Scenario - I am headed to the field tomorrow in Township 2N Range 9E and need to know the characteristics of my study area, including slope, aspect, elevation, relative effective annual precipitation, soil type, and number of frost free days.
• Step 1 – Open the Ecological Site Reviewer (ESR)
• Step 2 – Click the Layer List button and turn on the layers of interest and turn off the layers not needed
• Step 3 – Zoom and pan or search to find the study area. Type “2N 9E” in the Search Box and wait for the list of possible matches. Under PLSS Township, choose “2N 9E” and the map will zoom to that township.
• Step 4 - Click on the map where you are interested in doing field work. The popup will return the values of the layers turned on in Step 2.
Back to Outline 14

Provide Input with the Edit ToolThe Edit Tool allows users to markup where a revision to a layer may be needed. For example, a user may be doing field work in an area and determine that a soil map unit should be modified or that the ecological site or MLRA assignment should be changed. The user can draw a polygon and add a comment describing the modification needed. Others using the application will see the suggestion and agency partners can begin collaborating to make the change happen.
Back to Outline 15
1. Click the Edit Tool
2. Click New Feature
3. Choose the shape you’d like to draw, such as arrow, polygon, freehand, or circle
4. Follow the onscreen directions displayed next to the cursor to draw your edit suggestion
5. Fill out the form that pops up. Optionally, include an attachment. Save is at the bottom of the form (scroll down)

View Layers Over TimeThere are several layers in the Site Reviewer that are time-enabled. These Layers have a date range in their name, for example, USDA/NASS Cropland (2007 – 2020). Turn on the layer you are interested in looking at. Then, click on the Time Tool. A Time Slider will appear at the bottom of the map. You can move the Time Slider or advance it with the left and right arrows. You can see which year you viewing in the Time Slider. You can click on the map to bring up the popup for the layer for additional information.
Back to Outline 16
2) Select Time Tool from the upper right hand corner
1) Select Layers that are Time-enabled
3) Move the Time Slider to view the Time-enabled layers over the various years