ecological screening values for surface water, …/67531/metadc679519/m2/1/high... · ecological...
TRANSCRIPT
.WSRC-TR-98-00110
Ecological Screening Values for Surface Water, Sediment, andSoil
by
G. P. Friday
Westinghouse Savannah River CompanySavannah River SiteAiken, South Carolina 29808
DOE Contract No. DE-AC09-96SR18500
This paper was prepared in connection with work done under the above contract number with the U. S.Department of Energy. By acceptance of this paper, the publisher and/or recipient acknowledges the U. S.Government’s right to retain a nonexclusive, royalty-free license in and to any copyright covering this paper,along with the right to reproduce and to authorize others to reproduce all or part of the copyrighted paper.

DISCLAIMER
‘1%.isreport was prepared as an account of work sponsored by an agency of the United StatesGovernment. Neither the United States Government nor any agency thereof, nor any of theiremployees, makes any warranty, express or implied, or assumes any legal liability orresponsibility for the accuracy, completeness, or usefulness of any information, apparatus,produc~ or process discloseL or represents that its use would not inikinge privately owned rights.Reference herein to any specific commercial produc~ process, or service by trade name,trademark, manufacturer, or otherwise does not necessarily constitute or imply its endorsement,recommendation, or favoring by the United States Government or any agency thereof. Theviews and opinions of authors expressed herein do not necessarily state or reflect those of theUnited States Government or any agency thereof.
This report has been reproduced directly from the best available copy.
Available to DOE and DOE contractors from the Office of Scientific and Technical Information,P.O. Box 62, Oak Ridge, TN 37831; prices available ffom (615) 576-8401.
Available to the public from the National Technical Information Service, U.S. Department ofCommerce; 5285 Port Royal Road, Springfield, VA 22161.
...
Ecological Screening Values WSRC-TR-98-00110
c: - “ “’-” ‘1
~
-“--- ,, ..- . . . . . ,.,1.-
..
Su~ace WatecSediment,andSoil Page ii
DISCLAIMER
Portions of this document may be illegiblein electronic image products. Images areproduced from the best available originaldocument.

1
c.# 1
Ecological Screening Values WSRC-TR-98-OO11O
TABLE OF CONTENTS
Section E!z&TAELE OF CONTENTS . . . . . . . . . . . . . . . . . . . . . . . . . . . . . . . . . . . . . . . . . . . . . ...111
...
LIST OF T~LES . . . . . . . . . . . . . . . . . . . . . . . . . . . . . . . . . . . . . . . . . . . . . . . . . . . ..ivLIST OF FIGU~ . . . . . . . . . . . . . . . . . . . . . . . . . . . . . . . . . . . . . . . . . . . . . . . . . . ..ivACRONYMS . . . . . . . . . . . . . . . . . . . . . . . . . . . . . . . . . . . . . . . . . . . . . . . . . . . . . ..: . . .vEXECUTIVE S~Y . . . . . . . . . . . . . . . . . . . . . . . . . . . . . . . . . . . . . . . . . . . . ..viINTRODUCTION. . . . . . . . . . . . . . . . . . . . . . . . . . . . . . . . . . . . . . . . . . . . . . . . . . . . . .7SURFACEWATER . . . . . . . . . . . . . . . . . . . . . . . . . . . . . . . . . . . . . . . . . . . . . . . . . ...7
National AmbientWaterQuality Criteria . . . . . . . . . . . . . . . . . . . . . . . . . . . . . . ...7
EPA Region IV Screening Values . . . . . . . . . . . . . . . . . . . . . . . . . . . . . . . . . . . . ...8EcotoxThresholds (ETs) . . . . . . . . . . . . . . . . . . . . . . . . . . . . . . . . . . . . . . . . . ...-.8 ‘Oak Ridge National Laboratory (ORNL) . . . . . . . . . . . . . . . . . . . . . . . . . . . . . . ...9Canadian Guidelines . . . . . . . . . . . . . . . . . . . . . . . . . . . . . . . . . . . ..’ . . . . . . . . . ...9
SEDMNT . . . . . . . . . . . . . . . . . . . . . . . . . . . . . . . . . . . . . . . . . . . . . . . . . . . . . . . . ..lOEPARegionIV . . . . . . . . . . . . . . . . . . . . . . . . . . . . . . . . . . . . . . . . . . . . . . . . . . . .10Ecotox Thesholds @Ts) . . . . . . . . . . . . . . . . . . . . . . . . . . . . . . . . . . . . ..- . . . ...10Oak Ridge National Laboratory (ORNL) . . . . . . . . . . . . . . . . . . . . . . . . . . . . . . . .10Canadian Guidelines . . . . . . . . . . . . . . . . . . . . . . . . . . . . . . . . . . . . . . . . . . . . . ...11Dutch Sediment QualityStandards . . . . . . . . . . . . . . . . . . . . . . . . . . . . . . . . . . ...11
SOIL . . . . . . . . . . . . . . . . . . . . . . . . . . . . . . . . . . . . . . . . . . . . . . . . . . . . . . . . . . . . . ...11EPARegionIV . . . . . . . . . . . . . . . . . . . . . . . . . . . . . . . . . . . . . . . . . . . . . . . . . . . .11U.S. FishandWildlifeService . . . . . . . . . . . . . . . . . . . . . . . . . . . . . . . . . . . . . ...11Oak Ridge National Laboratory (ORNL) . . . . . . . . . . . . . . . . . . . . . . . . . . . . . . . .12Canadian Council of Ministers of the Environment (CCME) . . . . . . . . . . . . . . ...12Dutch Soil Quality Standards . . . . . . . . . . . . . . . . . . . . . . . . . . . . . . . . . . . . . . . . .13
RECOMMENDED SCREENING VALUES . . . . . . . . . . . . . . . . . . . . . . . . . . . . . ...14Surface Water . . . . . . . . . . . . . . . . . . . . . . . . . . . . . . . . . . . . . . . . . . . . . . . . . . . . .14
Sediment . . . . . . . . . . . . . . . . . . . . . . . . . . . . . . . . . . . . . . . . . . . . . . . . . . . . . . . . .15Soil . . . . . . . . . . . . . . . . . . . . . . . . . . . . . . . . . . . . . . . . . . . . . . . . . . . . . . . . . . . ...15Protocol forEcologicalScreening,Values . . . . . . . . . . . . . . . . . . . . . . . . . . . . . ...17
AcmomEDGmms . . . . . . . . . . . . . . . . . . . . . . . . . . . . . . . . . . . . . . . . . . . . . ..l7REFERENCES . . . . . . . . . . . . . . . . . . . . . . . . . . . . . . . . . . . . . . . . . . . . . . . . . . . . .’. .17GLOSSARY . . . . . . . . . . . . . . . . . . . . . . . . . . . . . . . . . . . . . . . . . . . . . . . . . . . . . . . ..2l
. .
Su~aceWateGSediment, andSoi[ Page iii

.“,
Ecological Screening Values WSRC-TR-98-OO11O ‘ ‘ “
LIST OF TABLES
Table Page
1 Comprehensive Lkting of Ecological Screening Values (@L)for Surface Water. ..................................................................................... ......23
2 ComprehensiveLMng ofEcologicalScreening Values forSediment. .....=...36
3 Comprehensive Listing of Ecological Screening Values (m@kg) for Soil~:....43
4 Ecological Screening Values (~g/L) for Surface Water. ..................................53
5 Ecological Screening Values for Sediment ......................................................60
6 Ecological Screening Values (m#kg) for Soil.................................................64
. .
LIST OF FIGURES
Figure @&
1 Distribution (Yo) of ESV’s for surface water by source . ..................................152 Distribution (%) of ESV’S for sediment by source. ........................................16
3 Distribution (%) of ESV’S for soil by source . ................................................ 16 ~~
Su@ace Watec Sediment, and Soil Page iv

f.
@ ~
Ecological Screening Values WSRC-TR-98-OO11O
AWQCARARCCMECERCLACLPCvDOEEC50EPAER-LESVETFACRFAVLC50LOECLOAELMACTMHSPEMPcNAWQCNOAANOECNPERNSTPORNLOSWERPCBPQLRCIUlSQBSQGTECTELUSFWS
ACRONYMS
Ambient water quality criteriaApplicable or relevant and appropriate requirementsCanadian Council of Ministers of the EnvironmentComprehensive Environmental Response, Compensation, and Liability Act
Contract laboratory program ~.Chronic value
..
U.S. Department of EnergyMedkm effective concentrationU.S. Environmental Protection AgencyEffects range-lowEcological screening valueEcotox thresholdFinal acute-chronic ratioFinal acute valueMedian lethal concentrationLowest observed effect concentrationLowest observed adverse effect levelMaximum acceptable toxicant concentrationDutch Ministry of Health, Spatial Planning, and EnvironmentMaximum permissible concentrationNational arnbientwater quality criteriaNational Oceanic and Atmospheric AdministrationNo observed effect concentrationNo potential effects rangeNational status and trends programOak Ridge National LaboratoryEPA Office of Solid Waste and Emergency ResponsePolychlorinated biphenylPractical quantification limitResource Conservation and Recovery ActSediment quality benchmarkSoil quality guidelineThreshold effects concentrationThreshold effect levelU.S. Fish and Wildlife Service
.
Surjace Watec Sediment, and Soil Page v

Ecological Screening Values, ,,
WSRC-TR-98-OO11O
EXECUTIVE SUMMARY
The decision making process associated with the environmental remedlation program at SRSis often risk-based. This approach, which includes both ecological and human health risk as-sessment, incorporates screening protocols to identify constituents that pose adverse effects.The use of benchmarks or screening values are essential to this process and in identi@ing con-
stituents of potential concern. This report presents a comprehensive listing of ecologicalscreening values (ESV’s) for surface water, sediment, and soil. The sources of these non-radio-logical ESV’S include the U.S. Environmental Protection Agency (EPA), U.S. Fish and Wild-life Service (USFWS), Environment Canada, Canadian Council of Ministers of theEnvironment (CCME), Oak Ridge National Laboratory (ORNL), the Ministry of Health, Spa-tial Planning, and Environment of the Netherlands, and the scientific literature. The basis forhow these ESV’S are derived is also discussed. The report concludes with a listing of recom-mended ESV’S and describes the rationale used to propose a value from multiple sources. Theprotocol for applying ESV’S in conducting ecological risk assessments is also presented. Itshould be noted that the ecological screening values presented in this report should be used forscreening purposes only and are inappropriate for setting remedial action cleanup levels.
Surjace Wate<Sediment, and Soil Page vi

.8
6
,.*
Ecological Screening Values WSRC-TR-98-00110
INTRODUCTION
One of the principal components of the environmental remediation program at the SavannahRiver Site (SRS) is the assessment of ecological risk. Required by CERCLA, RCRA, and DOEorders, ecological risk assessment can be used to identi~ environmental hazards and evaluateremedial action alternatives. An initial task of the ecological risk assessment is to identify con-stituents that potentially or adversely affect the environment. Typically, this is accomplishedby comparing concentrations in surface water, sediment, or soil with regulatory or technicallydefensible screening values. This process can eliminate many constituents from further consid-eration in the risk assessment, but it also identifies those that require additional evaluation.
This document provides a comprehensive listing of ecological screening values (ESV’S) forsurface water, sediment, and soil. Sources of these benchmarks were the U.S. EnvironmentalProtection Agency (EPA), U.S. Fish and Wildlife Service (USFWS), Oak Ridge National Lab-oratory (ORNL), the Canadian Council of Ministers of the Environment (CCME), the DutchMinistry of the Environment, and the scientific literature. It should be noted that ecologicalscreening values are continuously revised by the various issuing agencies. The references sec-tion of this report provides the citations of each source and, where applicable, the intemet ad-dress where they can be obtained electronically. Because no radiological screening values have
been issued for ecological risk assessment, the values presented here are for nonradiologicalcontaminants. Included is a general description of how the screening values were derived anda listing of recommended ecological screening values that can be used for environmental riskassessment at the SRS agd other locations. These values should be used for screening purposesonly and do not represent remedial action cleanup levels. Their use at locations other than SRSshould take into account environmental variables such as water quality, soil texture, flora andfauna, and other ecological attributes specific to the ecosystem potentially at risk.
SURFACE WATER
The methods used to derive ecological screening values are generally based on toxicity testing(Suter and Tsao 1996).The simplest screening benchmarks are toxicity test endpoints. Toxicitytests are conventionally categorized as acute - (48-96 hours in duration, use juvenile or adultorganisms; endpoints are LC50 or EC50) or chronic (include all or most of the lifecycle of thetest organisms; endpoint is the chronic value). Test endpoints can be calculated two ways: (1)a level of effect is estimated by fitting a function (e.g., probit or logit) to the concentration-re-sponse data to derive a model; then by regression analysis, a concentration can be estimatedthat causes an effect (e.g., LC50) and (2) hypothesis testing can be used to determine if testedconcentrations are significantly (i.e., statistically) different from a control. The lowest concen-
tration causing such an effect is the Lowest Observed Effect Concentration (LOEC). The high-est concentration for which there were no such effects is called the No Observed EffectConcentration (NOEC). The geometric mean of the LOEC and NOEC is termed the ChronicValue (CV) and was formerly called the Maximum Acceptable Toxicant Concentration(MATC).
National Ambient Water Quality CriteriaThe only values consistently used to screen aqueous contaminants in the United States are the
Surjface Watec Sediment, and Soil Page 7

s ●)
Ecological Screening Values WSRC-TR-98-00110
U.S. National Ambient Water Quality Criteria for the protection of aquatic life (NAWQC).NAWQC are regulatory values that are intended to protect most aquatic species most of thetime with reasonable confidence (Stephan et al. 1985). Suter and Tsao (1996) state that somechronic NAWQC are based on protection of humans or other piscivorous organisms rather thanprotection of aquatic organisms. NAWQC are available for 113 chemicals (Table 1).
NAWQC are applicable or relevant and appropriate requirements (A1’LMls).If N~WQC areexceeded during the screening process, the constituent is identified as constituent of potentialconcern (COPC). NAWQC must be based on results from at least eight acute toxicity tests fromeight different families and three chronic tests.
Acute NAWQC values are defined as one-half of the Final Acute Value (FAV). The FAV isthe 5thpercentile of the distribution of 48-96 hr LC50 values or equivalent median effective
concentration (EC50) value for the specific chemical. The acute NAWQC values are intendedto correspond to concentrations that would cause less than 50910mortality in 5% of exposedpopulations in a relatively brief exposure. Chronic NAWQC values are calculated by dividingthe FAV by the Final Acute-Chronic Ratio (FACR). The FACR is the geometric mean of quo-tients of at least three LC5~CV ratios from tests of different families of aquatic organisms(Stephan et al. 1985).]
EPA Region IV Screening ValuesEPA Region IV surface water screening values were derived by the Region IV Water Manage-ment Division (Table 1). These values were obtained from EPA Water Quality Criteria docu-ments and represent the chronic ambient water quality criteria values for the protection ofaquatic life. The ambient surface water quality criteria are intended to protect 95% of the spe-cies, 95% of the time. If there was insul%cient information available to derive a criterion, thelowest reported effect level was used with the application of a safety factor of ten to protect fora more sensitive species. A safety factor of ten was also used to derive a chronic value if onlyacute information was available.
Region IV acute screening values are the same as NAWQC; if no NAWQC value is available,the Region IV screening value is derived by taking the lowest acute LC50 or EC50and dividingby 10. Similarly, the Region IV chronic screening values are the same as NAWQC; if noNAWQC value is available, the chronic screening value is derived by taking the lowest chronicvalue and dividing by 10. If no chronic value exists, the acute value was divided by 10. Valuesfor metals assume a hardness factor of 50 mg/L CaC03. The screening value for pH ranges be-tween 6.5 and 9.0 (EPA 1995).
Ecotox Thresholds (ETs)The EPA Office of Solid Waste and Emergency Response (OSWER) has developed media-specific benchmark values for those chemicals commonly found in surface water, sediment and osoil samples at Superfund sites (values for soil are still being developed). The values (Table 1),which are referred to as Ecotox Thresholds (ETs), are defined as media-specific contaminantconcentrations above which there is sufficient concern regarding adverse ecological effects towarrant further site investigation (EPA 1996). ETs are designed to provide Superfund site man-agers with a tool to efficiently identify contaminants that may pose a threat to ecological recep-
Surjlace Wate~ Sediment, and Soil Page 8

ts -e
Ecological Screening Values WSRC-TR-98-OO11O
tors and focus further site activities on those contaminants and the media in which they arefound. ETs are meant to be used for screening purposes only; they are not regulatory criteria,site-specific cleanup standards, or remediation goals. For those chemicals with the potential tobioaccumulate to toxic levels (e.g., methyl mercury, polychlorinated biphenyls (PCBS), DDT,dioxins, and lead) in upper trophic wildlife, these benchmarks may not be low enough at somesites.
The preferred surface water ETs are the chronic NAWQC values. Threshold va.lu~sfor metalsare expressed as dissolved, rather than total; concentrations. Values for metals assume a waterhardness of 100 mg/L CaC03. If chronic NAWQC values are unavailable, EPA-derived finalchronic values (FCVS) are used. The maximum concentration of each chemical at a site is com-pared to the medium-specific ET to evaluate whether further risk assessment for the chemicalis warranted. Because non-residue based NAWQC have been developed for a limited numberof contaminants, ETs are also calculated using the Great Lakes Water Qualily Initiative meth-ods (40 CFR 122 et al.). These Tier II values were developed.so that.aquatic benchmarks couldbe established with fewer data than are required for the NAWQC. Approximately half of the
Ecotox Tier II values were taken from Suter and Mabry (1994). These values have been revisedand are discussed in the next section.
The ET software, which is available on the internet, calculates site-specific ETs.by adjustingfor pH and hardness in surface water and total organic carbon in sediment. The software canalso compare the site-specific ETs to the concentrations detected at the site.
Oak Ridge National Laboratory (ORNL)ORNL(Suter and Tsao 1996, Suter 1996) of ORNL compiled a list of three conventional aquat-ic benchmarks based on regulatory criteria or standard test endpoints. These conventionalbenchmarks included the NAWQC described above, Tier II values (secondary acute and sec-ondary chronic values), and lowest chronic values for five categories of organisms (fish, daph-nids, non-daphnid invertebrates, aquatic plants, and “all organisms”). They are calculated inaccordance with the EPA’s Proposed Water Quality Guidance for the Great Lakes System(EPA 1993). The secondary acute and secondary chronic values are equivalent to the finalacute value (FAV) and final chronic value (FCV), respectively. These values are based on few-er data than what is required to calculate NAWQC values (i.e., fewer families of test organ-
. isms). These values are expected to be higher than NAWQC in no more than 20% of cases.
The lowest chronic values compiled by Suter and Tsao (1996) are either the lowest values re-ported in the literature for a given organism, or the estimated lowest chronic value extrapolatedfrom 96-hour LC50’S. Chronic values are also used to calculate the chronic NAWQC, but thelowest chronic value may be lower than the chronic NAWQC. Additional information on
ORNL’S screening values is described by Sample et al. (1998).
Canadian GuidelinesThese threshold values take into consideration the protection of aquatic life; the basis for thesevalues is determined by the CCME water quality guidelines task group (Environment Canada1995a). In 1987, this task group published Canadian Water Quality Guidelines. These guide-lines have been distributed by the United Nations Environment Program and the World Health
Su$ace Wate<Sediment, and Soil Page 9

,Ecological Screening Values WSRC-TR-98-00110
Organization and are currently used in 45 countries.
Originally, the guidelines dealt with substances found in freshwater only. Subsequently, theguidelines have expanded to include marine water, sediment and residues in plant and animaltissue. The task group plans to update the entire 800-plus pages of the guidelines and make itavailable electronically in 1999.
SEDIMENT
Sediment is the fine, inundated or semi-saturated soil that exists on the bottom of lakes, rivers,streams, and wetlands. Recently, protecting sediment quality has been viewed as a logical andnecessary extension of water quality protection (Adams et al. 1992, cited by Jones et al. 1997).Sediment quality benchmarks (SQBS) have been derived using analytical chemistry, toxicity
test results, and field survey data (Jones et al. 1997). Accordingly, it is recommended that mul-tiple benchmarks be used to evaluate sediment quality.
EPA Region IVEPA Region IV’s sediment screening values (Table 2) were derived from statistical interpreta-tion of effects databases obtained from the literature as reported in publications from the Stateof Florida (MacDonald 1994), the National Oceanic and Atmospheric Administration (NOAA)(Long and Morgan 1990), and Long et al. ( 1995). The selected effect level is the lower of theeffects range-low (ER-L) (Long et al. 1995) and threshold effect level (TEL) (MacDonald etal. 1996). The ER-L value is the tenth percentile of the distribution of various toxic effectsthresholds for various organisms in sediments (Will and Suter 1995). The ER-L for antimonywas taken from Long and Morgan (1990). These values are generally based on observations ofdirect toxicity, and are based predominantly on marine environments. When the Contract Lab-oratory Program’s (CLP) practical quantification limit (PQL) is above the effect level thescreening value defaults to the PQL. For those contaminants whose screening values are basedon the PQL, data reported below the required quantification limit (e.g., J-flagged data) shouldbe compared to the “effects level” number.
Ecotox Thresholds (ETs)Proposed sediment quality criteria (SQC) have been published by the EPA Office of Water foracenaphthene, dieldrin, endrin, fluoranthene, and phenanthrene (Table 2). These values werederived using the equilibrium partitioning method. When SQCSare unavailable, sediment qual-ity benchmarks (SQBS) are used. SQBS are derived in the same manner as the SQCSexcept thata Tier II secondary chronic value is substituted for the AWQC or FCV in the calculation. Ef-fects Range-Low (ER-L) values (Long et al. 1995) are used when a SQC or SQB is unavailable.OSWER notes that there is relatively low correlation between the incidence of effects and theER-L’s for mercury, nickel, total PCBS, and DDT (Long et al. 1995) and that the ET’s for thesefour chemicals should be used cautiously.
Oak Ridge National Laboratory (ORNL)Jones et al. (1997a) of ORNL compiled ecological screening values for sediment in a 1997 re-vision of earlier works. These included benchmarks developed for NOAA and the Florida De-
Su~ace Wate~ Sediment, and Soil Page 10

. . .. . . . . . .
“,8
Ecological Screening Values WSRC-TR-98-00110
partment of Environmental Protection for inorganic and organic chemicals.. Also included werescreening values for non-ionic organic chemicals which were derived by equilibrium partitio-ning.Other screening values contained in the ORNL document (Jones et al. 1997) were taken
from the Ontario Ministry of the Environment, EPA Region IV, and Ecotox Threshold Values,With the exception of lowest chronic values for fish, daphnids, and non-daphnid invertebrates,the ORNL screening values (Jones et al. 1997) are either identical to those presented in this re-port or they were derived from less recent reports. Thus, the ORNL screening values for sedi-ment are not included herein. The ORNL report does, however, include useful information onanalytical chemistry approaches for deriving benchmarks.
Canadian GuidelinesSediment quality guidelines (Environment Canada 1995) were developed following the meth-ods that are described in a formal protocol (CCME 1995). The guideline derivation methodsrely on the spiked-sediment toxicity test approach and the National Status and Trends Program(NSTP) approach (Long and Morgan 1990; Long 1992; Long and MacDonald 1992; Long etal. 1995; MacDonald 1994), with modifications. Information is also required to assess the rel-ative importance of sediment characteristics (e.g., total organic carbon, grain size, acid volatil-es sulfides) in modifying the bioavailability of chemicals, as well as the predictability of theserelationships under field situations. In addition, the potential for adverse effects on highertrophic levels resulting from the bioaccumulation of persistent toxic substances is addressedthrough the use of additional methods (e.g., involving the evaluation of bioaccumulation fac-tors and tissue residue guidelines for the protection of wildlife consumers of aquatic life).
Dutch SedimentQualityStandardsThe Dutch Ministry standards (MHSPE 1994) for sediment (Table 2) are the same as those forsoil (Table 3). Because the chemistry and structure of sediment and soil can differ, sedimentbenchmarks based on the Ministry should be used with caution. The derivation of the soil (i.e.,sediment) quality standards is discussed in the ensuing section.
SOIL
EPA Region IVTerrestrial assessments are one of the least developed aspects of ecological risk assessment.Screening values for soils have not been issued by EPA. Site-specific soil screening values maybe submitted based on information concerning potential effects for contaminants whose modeof toxicity is through direct exposure (e.g., soil invertebrates such as earthworms). For thosecontaminants which biomagnify, screening values maybe back-calculated from acceptable tis-sue levels in prey items through two trophic transfers from the abiotic medium. Screening val-ues should be based on contaminant levels associated with ecological effects, instead of areaor regional background levels.
U.S. Fish and Wildlife ServiceOne of the earliest compilations of soil screening values was presented by Beyer (1990) of theUSFWS. He listed over 200 contaminants from Japan, Netherlands, Canada, United States, and
Su~ace Wate~ Sediment, and Soil Page 11
t ,1
Ecological Screening Values WSRC-TR-98-00110
the former Soviet Union. Screening levels from the Netherlands, which are sanctioned by EPARegion IV, were taken from the interim Dutch Soil Cleanup Act (Richardson 1987) values is-sued in the 1980s. Three categories were identified by the Dutch: (1) category A refers to back-ground concentrations in soil or detection limits, (2) category B refers to moderate soilcontamination that requires additional study, and (3) category C refers to threshold values thatrequire immediate cleanup. USFWS screening values are presented in Table 3.
.=
Oak Ridge National Laboratory (ORNL)ORNL identified soil screening values specific to DOE sites for soil invertebrates and micro-bial processes (Efroymson et al. 1997a), and terrestrial plants (Efroymson et al. 1997b). Thesoil benchmarks for invertebrates (Table 3) were derived using NOAA’s effects range-low(Long and Morgan 1990) approach supported by information from field and laboratory studies,bibliographic data bases, and the published literature. Assumptions, uncertainties, and howbenchmarks were calculated are detailed in Efoymson et al. (1997a). LOEC’S were rank or-dered and a value was selected that most closely approximated the 10th percentile of the distri-bution. If less than ten values were available, the lowest NOEC was used. If ten or more valueswere available, the 10th percentile was used. Interpolation and the authors expert judgement
were used to derive some benchmarks (Efoymson et al. 1997 a,b). Because both natural soilsand nutrienthineral solutions have been used in toxicity testing, Efoymson et al. (1997b) pre-sents screening benchmarks for terrestrial plants for both soil and soil solution. Values for plantbenchmarks were derived in the same way that was used for invertebrates and microbial pro-cesses (Efoymson et al. 1997b).
Canadian Council of Ministers of the Environment (CCME)The Canadian protocol for deriving environmental soil quality guidelines (SQGS) takes intoconsideration levels of ecological protection, endpoints, availability of soil toxicity data recep-tor arrays, and exposure pathways for four types of land use (CCME 1996). In 1997, the CCMEissued soil quality guidelines for 20 constituents (CCME 1997). The guidelines (Table 3) werederived specifically for the protection of ecological receptors in the environment or for the pro-tection of human health associated with agricultural, residential/parkland, commercial, and in-dustrial land use types (CCME 1997). The land use most closely associated with ecologicalresources was agricultural. Although the primary activity for this land use type is growingcrops or livestock, it also includes agricultural lands which provide habitat for resident andtransitory wildlife as well as native flora (CCME 1997).
The 1997 soil quality guidelines were issued on a constituent-by-constituent basis after a com-prehensive review of the physical/chemical characteristics, background levels in Canadiansoils, toxicity and environmental fate, and behavior of each constituent were derived using tox-icological data to determine the threshold level for key receptors. The derivation process forSQG’S considers adverse effects from dkect soil contact and from the ingestion of soil andfood. Four approaches were used to evaluate contact with soil: (1) weight of evidence, (2)LOEC method, (3) median effects method, and (4) comparison with nutrient and energy cy-cling.
The weight-of-evidence method, which is a modification of Long and Morgan (1990), esti-mates no adverse effects. For agricultural land use, the 25th percentile of the effects and no ef-
Surface Wate~ Sediment, and Soil Page 12

, ,
Ecological Screening Values WSRC-TR-98-OOI1O
fects data distribution was chosen as the “no potential effects range” (NPER). An uncertaintyfactor was then applied to the NPER to give the “threshold effects concentration” (TEC). Whenthe data were inadequate to perform a weight-of-evidence method, the TEC was derived by ex-trapolating from the lowest available LOEC divided by an uncertainty factor. Thus, the TECwill lie somewhere below the lowest reported effect concentration. When LOEC values are un-available, the TEC is derived using the median effects method. Here, the TEC is obtained byextrapolating from the lowest available EC50 or LC50 datum using an uncertainty-factor rang-ing from five to ten. Thus, the TEC is estimated in the region of predominantly “noeffects inthe data distribution.
Once the TEC is calculated, it is compared to nutrient and energy cycling data for selected mi-crobial processes. If the microbiaI vrdue is less than the TEC, microbiaI nutrient and energy cy-cling processes may experience adverse effects at the TEC level. In this case, the geometricmean of the microbial and TEC values is selected as the SQG for soil contact. If the TEC is lessthan the microbial value, the TEC becomes the SQG.
The procedure for deriving SQGS for ingestion of soil and food by grazing livestock and wild-
life is only used for agricultural land use (CCME 1997). This process is restricted to a herbiv-orous food chain, and considers the bioaccumulation of chemicals in plant tissue. Several stepsare required for the derivation of a SQG. First, species considered to be most at risk from in-gesting soil and food are identified and a daily threshold effects dose is identiiled based on aminimum of three studies (e.g., two mammal, one avian). Second, the daily threshold effectsdose is calculated by dividing the lowest LOAEL by an uncertainty factor. Next, informationis gathered includlng body weight, rate of soil ingestion, and rate of food ingestion for the mostsensitive species as well as information on bioavialability and bioconcentration factor specificto the contaminant. This information is used to calculate the SQG in accordance with CCME(1996). Finally, the lower of the two values (soil contact versus ingestion) is used as the finalSQG for agricultural (e.g. ecological) use.
Dutch Soil Quality StandardsDuring the 1980s, the Dutch government issued three categories of soil quality values (i.e., A,B, and C). In 1994, the ABC benchmarks were replaced: (1) “A” values became “target val-ues:’ (2) “B” values were replaced by the sum of the target value and intervention value dividedby two, and (3) “C” values became “intervention values” (MHSPE 1994). The target values in-dicate the soil quality required for sustainability or, expressed in terms of remedial policy, the
soil quality required for the full restoration of the soil’s functionality for human, animal, andplant life. Target values were based on standards for drinking water and surface waters. Valuesfor heavy metals, arsenic and fluoride were derived from the analysis of field data from rela-tively pollution-free rural areas and aquatic sediments regarded as uncontaminated. The targetvalues for soil were based on the target values for surface waters when scientifically possible.
Intervention values, which apply to both terrestrial soil and to soil from the beds of rivers,lakes, etc. (i.e., sediments), indicate that the concentration levels of the contaminants in the soilabove which the functionality of the soil for human, plant, and animal life is seriously impairedor threatened. Concentrations in excess of the intervention values correspond to-serious con-tamination. These values are based on ecotoxicological effects that are quantified in terms of
Su~ace WateGSediment, and Soil Page 13

, ,,Ecological Screening Values WSRC-TR-98-OO11O
the concentrations in the soil at which 50% of the species actually (or potentially) occurringmay undergo adverse effects.
In 1997, the Dutch Ministry issued maximum permissible concentrations (MPC’S) for 18 met-als (Cromrnentuijn et al. 1997) using three methods. When NOEC’S were available for at leastfour taxons, statistical extrapolation was used. When only LC50 or a few NOEC’S were avail-able, a modification of the EPA method was used. When no laboratory data were.available,equilibrium partitioning was used to derive a benchmark value. The Dutch values are based onecotoxicological effects that are quantified in terms of the concentrations at which 50$Z0of thespecies and 50% of the microbial processes in the ecosystem are threatened or adversely affect-
ed.
RECOMMENDED SCREENING VALUES
A listing of the recommended ecological screening values for the SRS remediation program arepresented in Tables 4-6. These values are presented chronologically for surface water, sedi-ment, and soil. Sources for each screening value are identified to the right of the constituent ofpotential concern. The rationale used to select a screening value was based on a several factors.Regulatory benchmarks that were applicable or relevant and appropriate requirements(ARAR’s) were ranked first in importance. ARAR’s, which are requirements issued underfed-eral or state law, are enforceable and have been used consistently in SRS risk assessments com-mensurate with EPA Region IV guidance. In the absence of regulatory benchmarks, the lowestor most conservative screening values were selected using the most recently published infor-mation. At first glance some of the recommended screening values may appear contradictory.For example, the recommended sediment ESV for 1,2,4-trichlorobenzene is 9,200 ~gkgwhereas it is 10 pglkg for total trichlorobenzene. This is because the former value was pub-lished by EPA (1996) and the latter by MHSPE (1994). In these situations, the investigatormust take into consideration what chemical constituent (e.g., specific compound vs. categoryof compound) is of interest, what receptor species have been identified, and the objective of thestudy. It should be noted that the goal of this report is to provide investigators with a compre-hensive listing of ecological screening values. No attempt is made to endorse a source or toevaluate the derivation process. Ultimately, the investigator must determine which values aremost appropriate for their objectives and study.
Surface WaterThe chronic NAWQC values (EPA 1995) were ranked first in importance as ecological screen-ing values for surface water. These are applicable or relevant and appropriate requirements,they are consistently used in the risk assessment process, and have regulatory precedent. Of the201 constituents listed in Table 4,56 percent were based on NAWQC. If NAWQC values werenot available, EPA Ecotox Threshold (EPA 1996) values (i.e., final chronic values) were used.It should be noted that many Tier II values from Ecotox Thresholds (EPA 1996) were based oncalculations by Suter and Mabry (1994) of ORNL. For these values, the secondary chronic TierII value (Suter and Tsao 1996) was used because it was more conservative and based on morerecent data. This application resulted in a markedly larger number of ORNL values comparedto Ecotox values. If a screening value was not available from any of the three sourcesidentifiedpreviously, the lowest chronic value or Canadian (Environment Canada 1998) benchmark was
SurjtaceWateCSediment, and Soil Page 14

9 .1
Ecological Screening Values WSRC-TR-98-OOII0
used. For some constituents, only a single source was available. The number of recommendedscreening values by source was as follows: (1) NAWQCIEPA Region IV- 112, (2) EcotoxThresholds -2, (3) ORNL values -46, and (5) Canadian water guidelines -41. The NAWQCand secondary chronic values represented 56 and 24 per cent, respectively, of the recommend-ed screening benchmarks for surface water (Figure 1). The Canadian values comprised 20 percent of the benchmarks.
.=
20%
0
NAWQC
ORNL 56%’o
23%’.
ECX)TOXl%
F@re 1.Distribution(%)ofESV’Sforsurfacewaterbysource.
SedimentThe recommended ecological screening values for sediment are presented in Table 5. As wasthe case with surface water, sediment screening values that were applicable or relevant and ap-propriate requirements from EPA Region IV (EPA 1995) ranked first in importance. TheARAR’s comprised 35% of the 115 constituents (Figure 2). For the remaining non-AMR con-stituents,,the lowest or most conservative value was used (Table 2). When the Dutch Ministryintervention value was the only available screening value, this number was divided by 10 toobtain the final recommended value. Listed in order of decreasing frequency, sources of soil
screening values were as follows: (1) Dutch Ministry (MHSPE 1994) - 42%, (2) EPA RegionIV (EPA 1995) - 35%, (3) Ecotox Thresholds (EPA 1996) - 21%, and (4) Environment Canada(1995) - 2%.
SoilThe EPA has not issued ecological screening values for soil. However, work has been initiatedby an EPA task group and it is anticipated that screening values will be issued sometime in1999. Existing ecological soil screening values are limited to those benchmarks issued by theUSFWS (Beyer 1990), ORNL (Efroymson et aI. 1997a,b), the Dutch (MHSPE 1994, Crom-mentuijn et al. 1997), and Canada (CCME 1997). The U.S. Fish and Wildlife Service (Beyer1990) numbers are taken from the Dutch Ministry numbers issued in the 1980’s (MHSPE1994). The 132 recommended soil screening values (Table 6) represent the lowest or most con-servative value with three exceptions: (1) when a screening value was available from both theUSFWS (Beyer 1990) and Crommentuijn et al. (1997), the latter was used, (2) when target val-
Surface WateCSediment, and Soil Page 15

,Ecologica[ Screening Values WSRC-TR-98-OOI1O
ues (MHSPE 1994) and MPC’S were available, the latter was used, and (3) if only an interven-tion value was available, it was divided by a factor of 10 to derive the recommended ESV. Theuse of maximum permissible concentrations was restricted to metals, and are recommended be-cause they are based on more recent data. Including the USFWS, Dutch values constituted 6070of the recommended values. ORNL benchmarks comprised 38% whereas the Canadian values.comprised 270 (Figure 3).
KX)TOX 2%
42?’.
Figure2. Distribution(%)ofESV’Sforsedimentbysource.
USFWS
2’%0 381%0
Figure3. Dk~ibution(%)ofESV’Sforsoilby source.
Su~ace Wale<Sediment, and Soil Page 16
a .,
Ecological Screening Values WSRC-TR-98-OO11O
Protocol for Using Ecological Screening ValuesEcological screening values can be usedtQ identi~ constituents of potential concern. ESV’S donot represent remediation goals or cleanup levels, but should be used as part of the ecological
risk assessment initial screening process. Prior to the application of ecological screening valuesto environmental data, data quality objectives should be established tid defined. Verificationand validation of data should also be performed when practicable as well as developing a pre-liminary conceptual model.The protocol for using ecological screening values to identi~ con-stituents of potential concern consists of four steps.
.
Step 1- Partition the data into the appropriate medium (e.g., surface water, sediment, soil).Units of measurement should be included.
Step 2- Determine the maximum concentration of each constituent.Step 3- Compare the maximum concentration of the constituent with the ecological screen-
ing values presented in Table 4 (surface water), Table 5 (sediment), or Table 6(soil).
Step 4 -If the maximum value does not equal or exceed the ecological screening value, theconstituent is eliminated from further consideration. If the concen~ation of theconstituent exceeds the ecological screening value, the constituent is retained forfurther examination. If there is no screening value available for a constituent, it isalso retained for fimther study and should be addressed in the uncertainty sectionof the ecological risk assessment.
ACKNOWLEDGMENTS
The author gratefully acknowledges the technical comments and suggestions that were re-ceived. Listed alphabetically, special thanks are extended to Jim Bowers, John Gladden, LindaGeorge, Blake Hart, Laura Haselow, Doug Martinson, Charles Murphy, Winona Specht, andLynn Wellman.
REFERENCES
40 CFR 9, 122, 123, 131, and 132. Tuesday, 23 March 1995. Final Water Quality Guidance forthe Great Lakes System, Final Rule.
Adarns, W.J., R.A. Kimerle, and J.W. Barnett. 1992. Sediment Quality and Aquatic Life As-sessments. Environ. Sci. Technol. 26(10): 1865-1875.
Beyer, W.N. 1990. Evaluating Soil Contamination. United States Fish and Wildlife Service,Biological Report 90(2).
Canadian Council of Ministers of the Environment (CCME). March 1997. Recommended Ca-nadian Soil Quality Guidelines. Canadian Council of Ministers of the Environment (CCME),Winnipeg, Manitoba.
Canadian Council of Ministers of the Environment (CCME). March 1996. A Protocol for theDerivation of Environmental and Human Health Soil Quality Guidelines. CCME-EPC-101E,Winnipeg, Manitoba.
Surface Wate~Sediment,and Soil Page 17

a.,,
Ecological ScreeningValues WSRC-TR-98-OO11O
Canadian Council of Ministers of the Environment (CCME). 1995. Protocol for the Derivationof Canadian Sediment Quality Guidelines for the Protection of Aquatic Life. Report CCMEEPC-98E. Prepared by the Task Group on Water Quality Guidelines, Winnipeg, Manitoba. 38PP.
Crommentuijn, T., D.F. Kalf, M.D. Polder, R. Posthumus, and E.J. van de Plassg.he. 1997.Maximum Permissible Concentrations and Negligible Concentrations for Pesticides. RIVMReport No. 601501002.
Efroymson, R.A., M.E. Will, and G.W. Suter. 1997a. Toxicological Benchmarks for ScreeningContaminants of Potential Concern for Effects on Soil and Litter Invertebrates and Het-erotrophic Process: 1997 Revision. Oak Ridge National Laboratory, Oak Ridge, TN. ES/ER/TM- 126/R2 (http://www.hsrd. ornl.gov/ecorisk/reports.ht@.
Efroymson, R.A., M.E. Will, G.W. Suter, and A.C. Wooten. 1997b. Toxicological Benchmarksfor Contaminants of Potential Concern for Effects on Terrestrial Plants: 1997 Retiision. OakRidge National Laboratory, Oak Ridge, TN, ES/ER/TM-85/R3 (http://www.hsrd. ornl.gov/ecoriskheports. html).
Environment Canada. 1998. “Summary of Canadian Water Quality Guidelines for the Protec-tion of Aquatic Life”. Interim draft guidelines transmitted on 20 April 1998 to G.P. Friday fromRobert Kent, Head, Water Quality Guidelines and Assessments Section, Guidelines and Stan-
dards Division, Environment Canada.
Environment Canada. 1995a. CCME Canadian Water Guidelines-December 1995, Environ-ment Canada, Ottawa, Ontario
Environment Canada. September 1995b. Interim Sediment Quality Guidelines, Soil and Sedi-ment Quality Section Guidelines Division, Ecosystem Conservation Directorate, Evaluationand Interpretation Branch, Ottawa, Ontario
Environmental Protection Agency. January 1996. Ecotox Thresholds, ECO Update, Office ofSolid Waste and Emergency Response, Intermittent Bulletin Vol. 3, No. 2, Publication 9345.0-12FSI, EPA 540/F-95-038 PB95-963324 (http://www.epa.gov/superfund/oerr/rl9/ecotox)
Environmental Protection Agency. November 1995. Ecological Screening Values. In: Supple-mental Guidance to RAGS: Region 4 Bulletins-Ecological Risk Assessment, Bull. No.2, At-lanta, Georgia. (http://www.epa. gov/region4/wastepgs/ofiecser/otsguid.htm)
Environmental Protection Agency. 1993. Water Quality Guidance for the Great Lakes Systemand Correction; Proposed rules Federal Register 58 (72): 20802-21047.
Environmental Protection Agency. 1985. Ambient Water Quality Criteria for Ammonia. Cri-teria and Standards Division, Office of Water Regulations and Standards, EPA 440/5-85-001,Washington, D.C.
Sutjkace WateGSediment, and Soil Page 18

. . . . ..
. .,
Ecological Screening Values WSRC-TR-98-OOI1O
Environmental Protection Agency. 1980. Water quality criteria documents; availability. Fed-eral Register 45:79318-79379.
Jones, D.S., G.W. Suter, and R.N. Hull. 1997. Toxicological Benchmarks for Screening Poten-tial Contaminants of Concern for Effects on Sediment-Associated Biota: 1997 Revision, ES/ER.ITM-95/R4, Oak Ridge, TN.
..-.
Long, E.R. 1992. Ranges in Chemical Concentrations in Sediments Associated with Adverse
Biological Effects. Mar. Pollut, Bull. 24(1):38-45.
Long, E.R. and D.D. MacDonald. 1992. National Status and Trends Prograin Approach. In:Sediment Classification Methods Compendium. Environmental Protection Agency EPA 823-R-92-006.
Long,,E.R. and L.G. Morgan. 1990. The Potential for Biological Effects of Sediment-SorbedContaminants Tested in the National Status and Trends Program. NOAA Technic+alMemoran-dum NOS OMA 52.
Long, E.R., D.D. MacDonald, S.L. Smith, and F.D. Calder. 1995. Incidence of Adverse Bio-logical Effects within Ranges of Chemical Concentrations in Marine and Estuarine Sediments.Environmental Management 19(1):81-97.
MacDonald, D.D. 1994. Approach to the Assessment of Sediment Quality in Florida CoastalWaters. Prepared for the Florida Department of Environmental Protection. MacDonald Envi-ronmental Sciences, Ltd., Ladysrnith, British Columbia. Vol. 1, 123 pp.
MacDonald, D.D., R. S. Carr, F.D. Calder, E.R. Long, and C.G. Ingersoll. 1996. Developmentand Evaluation of Sediment Quality Guidelines for Florida Coastal Waters. Ecotoxicology 5,253-278.
MHSPE (Ministry of Housing, Spatial Planning, and Environment). 9 May 1994. InterventionValues and Target Values - Soil Quality Standards. Directorate-General for EnvironmentalProtection, Department of Soil Protection, The Hague, The Netherlands.
Richardson, G.M. 1987. Inventory of cleanup criteria and methods to select criteria. Unpub-lished report, Committee on Industrial site Decommissioning, Industrial Programs Branch, En-vironment Canada, Ottawa, Ontario.
Sample, B.E., G.W. Suter, R.A. Efroymson, and D.S. Jones. 1998. A Guide to the ORNL Ec-otoxicological Screening Benchmarks: Background, Development, and Application. ORNLES/ER/TM-13615.Oak Ridge, TN. (http://www.hsrd. oml.gov/ecorisk/reports/html)
Sample, B.E., D.M. Opresko, and G.W. Suter. June 1996. Toxicological Benchmarks for Wild-life: 1996 Revision, ORNL ES/ER/TM-86/R3.Oak Ridge, TN. (http://www.hsrd. oml.gov/ecorisk/reports/html)
Stephan, C.E., D.I. Mount, D.J. Hanson, J.H. Gentile, G.A. Chapman, and W.A. Brungs. 1985.
Surface WateL Sediment, and Soil Page 19

Ecological Screening Values WSRC-TR-98-OO11O
Guidelines for Deriving Numeric National Water Quality Criteria for the Protection of AquaticOrganisms and Their Uses. U.S. Environmental Protection Agency, PB85-227049, Duluth,Minnesota.
Suter, G.W. 1996. Toxicological Benchmarks for Screening Contaminants of Potential Con-cern for Effects on Freshwater Biota. Environmental Toxicology and Chemistry Vol. 15 (7):1232-1241. ..
Suter, G.W. and C.L. Tsao. June 1996. Toxicological Benchmarks for Screening PotentialContaminants of Concern for Effects on Aquatic Biota: 1994 Revision, ORNL EnvironmentalSciences Division, Oak Ridge, TN. ES/ER/TM-96/R2. (http://www.hsrd.ornl. gov/ecorisk/re-portdhtm.1)
Suter, G.W. and J.B. Mabrey. 1994. Toxicological Benchmarks for Screening Potential Con-taminants of Concern for Effects on Aquatic Biota 1994 Revision. Oak Ridge National Labo-ratory, Oak Ridge, TN. ES/ER/TM-96/Rl.
Will, M.E. and G.W. Suter. 1995. Toxicological Benchmarks for Screening Potential Contam-inants of Concern for Effects on Soil and Litter Invertebrates and Heterotrophic Process, OakRidge National Laboratory, Oak Ridge, TN. 155pp, ES/ER/TM-126/Rl
,, . .,
Su@ace Wate6 Sediment, and Soil Page 20

Ecological Screening Values WSRC-TR-98-OOII0
GLOSSARY
acute toxicity-causes death or extreme physiological disorders to organisms immediately or
shortly following exposure to the contaminant
ARARs (Applicable or relevant and appropriate requirements) - Federal and State. standards,requirements, criteria, or limitations that affect RCRA/CERCLA remedial actions
assessment endpoint - an explicit expression of the environmental value that is to be protected.An example of an assessment endpoint would be “the protection of piscivorous birds.” Themeasurement endpoint could be eggshell thinning (DDT).
bioaccumulation - refers to the uptake of a chemical by an organism through all routes of ex-posure, including ingestion, inhalation, and cutaneous absorption. Bioaccumulation is a gener-al term that encompasses two additional concepts, bioconcentration and biomagnification.
bioaccumulation factor (BAF) - the bioaccumulation factor is similar to the BCF but it includesexternal and internal (i.e., ingestion) exposure. It is calculated by “adjusting” the BCF using afood chain multiplier for the organism of concern. Bioaccumulation values obtained from theliterature can be used to estimate contaminant accumulation and food-chain transfer.
biocoricentration - the process by which a compound is absorbed from water through gills orepithelia tissues and is concentrated in the body; refers to the uptake of a chemical by an aquaticorganism from water alone.
bioconcentration factor (BCF) - is the ratio of the concentration of a contaminant in the organ-isms to the concentration in the immediate environment (soil, water, sediment); the measureof a chemical’s tendency to bioconcentrate. The BCF is calculated by dividing the concentra-tion of the chemical in the exposed organism’s tissues by the concentration of the chemical inthe exposure medium.
biomagnification - the increase in chemical concentration in organism tissues through succes-sively higher trophic levels resulting from chemical transfer in food; higher concentration inthe consumer than in the contaminated source
chronic toxicity-involves long-term effects of small doses of a contaminant and their cumula-tive effects over time. These effects may lead to death of the organism or disruption of suchvital functions as reproduction
chronic value - the geometric mean of the LOEC and NOEC (formerly termed the maximumacceptable toxicant concentration (MATC))
EC50-median effective concentration; the concentration at which 50% of the organisms exhibita certain physiological or behavioral response (e.g., non-lethal) in a specified period of time(usually 96 hours); is an analog of the LC50 where the endpoint is other than mortality; note:
EC50 is time dependent.
Surface Wate<Sediment, and Soil Page 21

., ,.Ecological Screening Values wSRC-TR-98-OOII0
ED50-median effective dose; the dose at which 50% of the organisms exhibit a certain physio-logical or behavioral response (e.g., non-lethal) in a specified period of time (usually 96 hours);based on the analysis of nominal (i.e., dead or alive) data. ED50 is time dependent.
endpoint-a characteristic of an ecological component that may be affected by exposure to astressor .*
LC50-median lethal concentration; is calculated from population percentage mortalities pro-duced by different concentrations after specified time periods; the environmental concentrationat which 50% of the organisms die in a specified period of exposure time (usually 96 hours);LC50 is time dependent.
LD50-median lethal dose; the administered dose at which 50% of the experimental organismsdie in a specified period of exposure time (usually 96 hours); based on the analysis of nominal(i.e., dead or alive) data; note: LD50 is time dependent.
lethal toxicity-causes death directly through disruption of key physiological functio~ can becaused by acute or chronic toxicity
measurement endpoint - a measurable ecological characteristic that is related to the valuedcharacteristic chosen as the assessment endpoint. Measurement endpoints are often expressedas the statistical or arithmetic summaries of the observations that make up the measurement.
LOEC - lowest observed effect concentration; the lowest concentration that is statistically dif-ferent from the control and that causes an effect
NOEC -no observed effect concentration; the highest concentration for which there are no sucheffects
NOEL (no observed effects level) or NOAEL (no observed adverse effects level) - these mea-sures, which are not time-dependent, describe the threshold below which predefine effects arenot observed. When this threshold has not been determined, the lowest observed effects level(LOEL) or lowest observed adverse effects level (LOAEL) describe the lowest recorded dos-age at which effects were observed. A NOAEL is preferred to a LOAEL, which is preferred toan LD50 or an EC50. Both the NOAEL and LOAEL are estimated by hypothesis testing.
CLP PQL -Contract Laboratory Program Practical Quantitation Limit (PQL). The PQL is anal-ogous to the limit of quantitation (LOQ). It is an interlaboratory concept and is numerically es-timated at 5 to 10 times the method detection limit (MDL).
risk-the chance that a hazard or threat will occu~ risk= exposure X potency
stressor-any physical, chemical, or biological entity that can induce an adverse effect
sublethal toxicity-entails symptoms other than death or severe disorder, but may have long-term effects on a population; can be caused by acute or chronic toxicity
Su#ace Wate<Sediment, and Soil Page 22

.
.
.
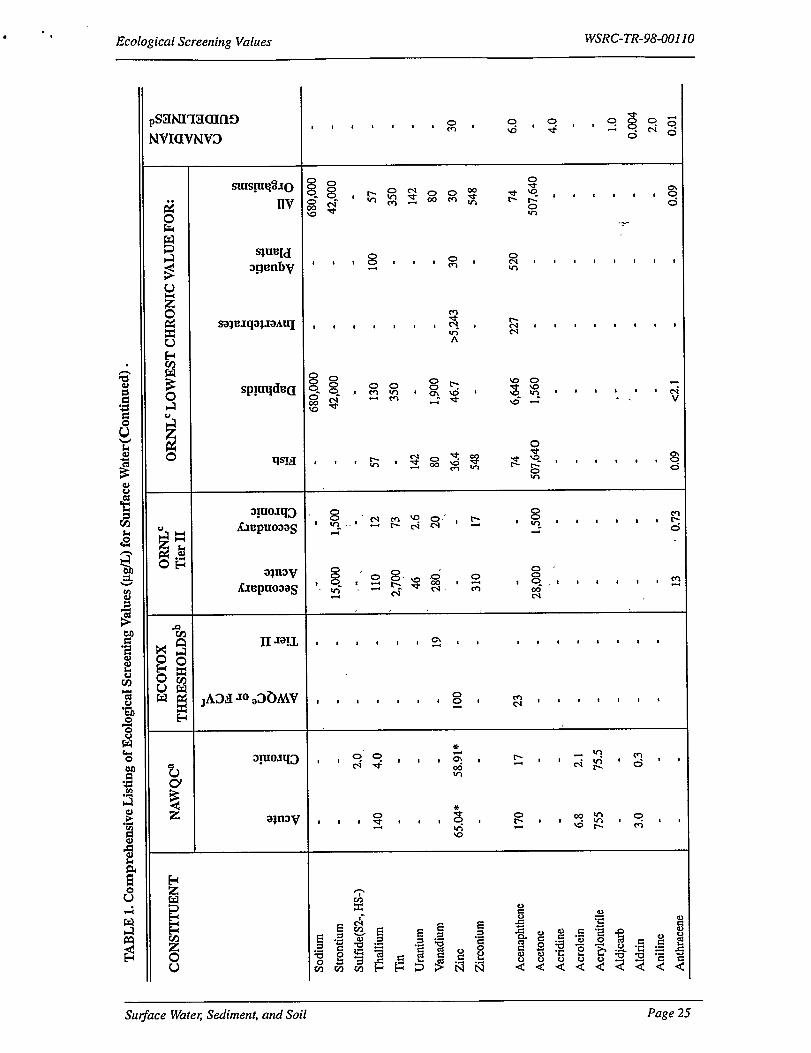
TABLE1. ComprehensiveListingofEcologicalScreeningValues(p#L) for SurfaceWater.
NAWQCaECOTOX
ThresholdsCONSTITUENT ORNLC
Tier II ORNLCLOWESTCHRONICVALUEFOR:
3,288
1.7
1,600
1,900
630
5,400
‘ 460
2,400
610
460
1,7
610
914
48
.
5.3
8,830
0.15
116,000
.
<44
5.0h-looi
1370i-2200k
5.0
.
.
0.017
0.00352.0-20.0
8.91.0
2.0-4.0’
Aluminum ~
Ammonia
Antimony
Arsenic
ArsenicIII
ArsenicV
Barium
Beryllium
Boron
Cadmium
Calcium
Chloride
Chlorine(TRC)
Chloropyrifos
Chromium(total)
ChromiumIII
ChromiumVI
Cobalt
Copper
750 “ 87g
1,300 160
360 190
-
16 0.53
. 750
1.79* 0.66*
. .
860,000 230,000
19 11
0.083 0.041
984.32* 117.32*16* 11*
.
9,22* 6.54*
. .
180 30
2,962
892
914
450
5.3
8,830
0.15
116,000
2,320
48
.
100,000
2.0
190
.
8.1
3.9
5.1
66
110
35
30
3.1
4.0
0.66
1.6
.
57
.
1.71.0
. . .
. . . . .
-
180
10
69 .<44 397!~
73.2 6.1 2.0 2.0
290 5,1 5.1
3.8 0.23 6.07 1.0 0.23
3.0 1,500 23
11

,=.,Ecological Screening Values WSRC-TR-98-O0110
PsmwmamNVI(lVNVS
suxs!ue~lolIV
saJ??.Iqa$.IaAuI
qs!lJ
,
,
t
,
,
0
,
,
I
,
.
com
~
,-7-
,
t
,,
,
,
I
I
,,, ,,, v-t
0,,, ,,, w,N
0
,
,
,
o wbllttl~W ./ o
8,,w-
,0, ,
0 ~ 0,,, ,, ,,tm, 0, *,, ,,, ,
0 m
y 81n m .,, 0n“ao-ti “’,4’ wlml~t
0’
,,
23o’0
,8
Su@ace Wate~ Sediment, and Soil Page 24
Ecological Screening Values WSRC-TR-98-OO11O
%
s3NIT3aInfl
IVICWNVO
. .
g
sLusp@Io
IIV
lpd
t
*
,
I
,
0m
G
0k-lWI
,
,
0WIm
,
0co
,
,
00a)
0
*
,
,
,
t
,
,
,t
=-
,,
,1
,,-.
,,
,
m00
I
,
.
G
s0
a,11111 -:, ‘,,111 $s
o181:11 801 m,, ,,, , ,N
II
81
0,’ 0,,,ead-
t-q0“
0,,(.-i
Surjace Watefi Sediment, and Soil Page 25

.,Ecological Screening Values WSRC-TR-98-O0110
*
psmIImKm19NVKIVNV3
saJ121qaJJaAuI
3yxo.lq~.hepuo>as
aymvLxepuo3aS
o m-01001, ,, s,, , 0,c-l
,00 0 vi
,
mOJV)
0
1
,
‘
1
,
I
,
I
,
m,-0!
t ,
1
,
1
I
%
1
,
1
I
-3%“5 -+,,, -, CN, ,m.
0c-l .
,,, co,, 0 1 , ,,,
0
mW“”
0Vllltlm
t, 0,m
Surface Watec Sediment, and Soil Page 26

# .Ecological Screening Values WSRC-TR-98-00110
s3NIT3aIn9
1VI(IVNV3
t)gz
Suxsym?iho
Iw
3yIoJq~X.mpuo3aS
a%mvLxepuo3aS
m1 ,18111 11 0., ,
,,
11
11
la
,,
, m 0,Idlll 1$1(-+-)1 ,11 II
,# 611111 8s 881 ,18 !1
Surface WateCSediment, and Soil Page 27
0.. ,
Ecological Screening Values WSRC-TR-98-OO11O
psmmmna
NVI(IVNV3
Stusyxtxho
w
0coUY
*“
,
,
,
1
,
,
8
I
t
,
1
,
,
,
,
1
t
1
,
‘
t
1
I
s
, 1
,
.*
,
,
,
t
,
,
.
,
1
3yIoJq~Ln3puo3aS
%00
t-0
—
0)w’
0mlco
,,, ,, 3,, ,0 ,, ,,, ,, ,
0
A“” “
Surj2aceWate<Sediment, and Soil Page 28

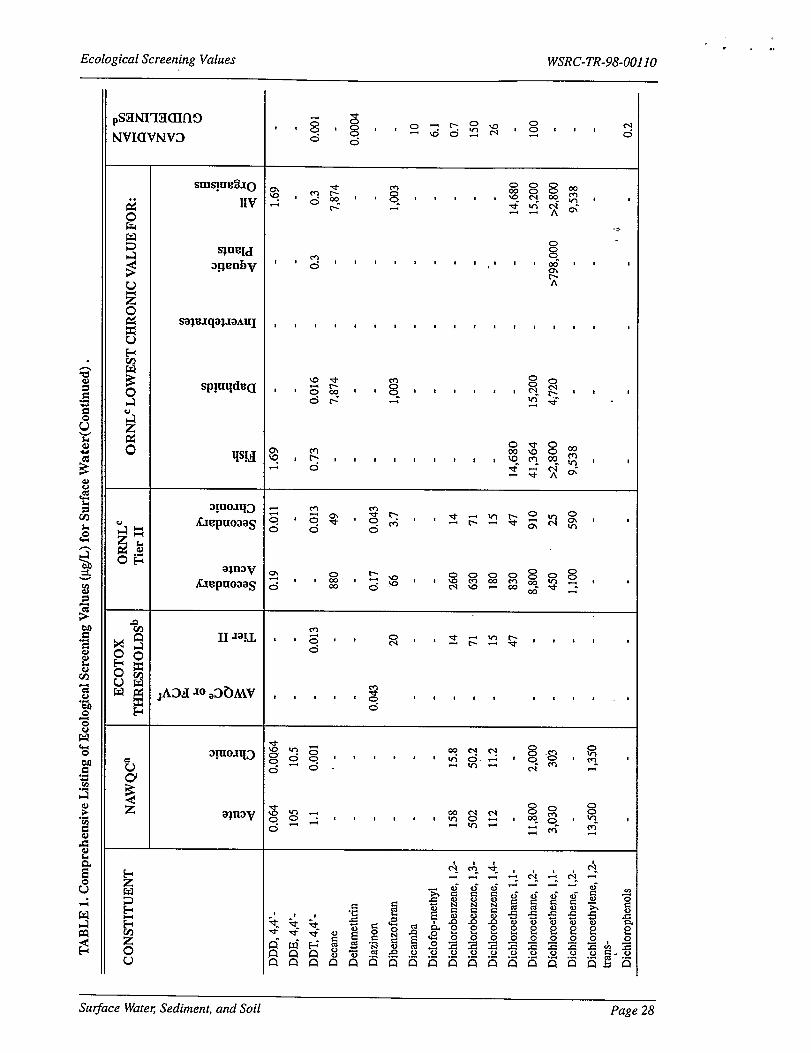
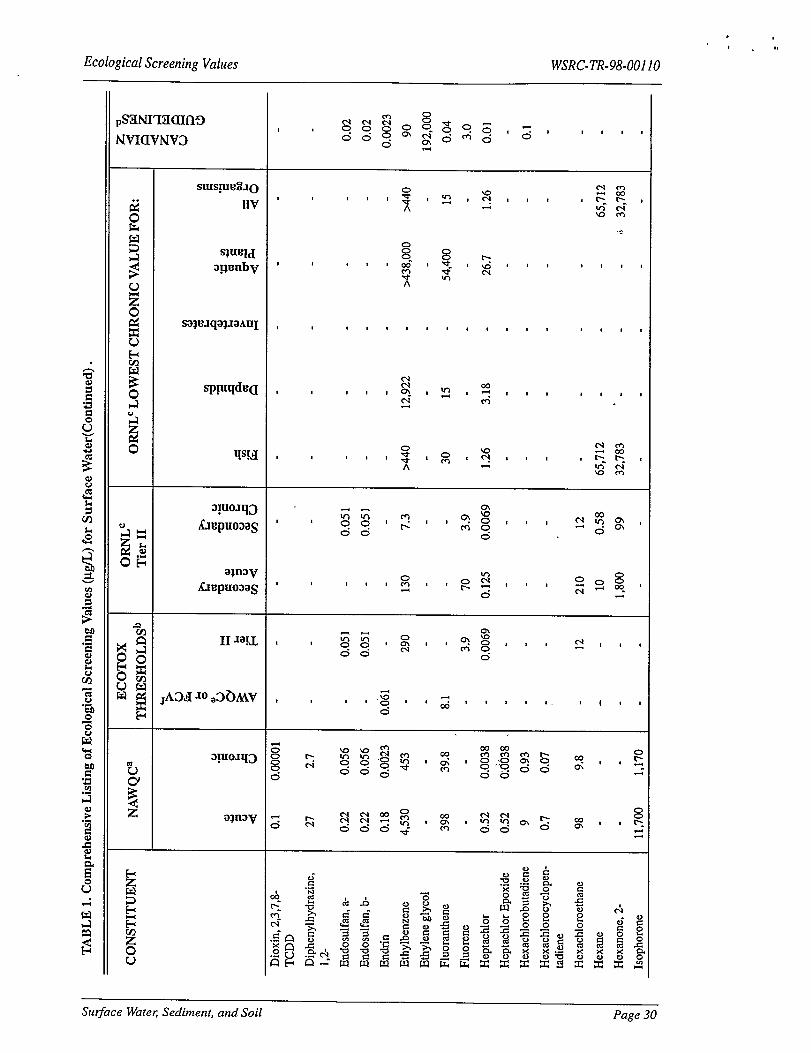
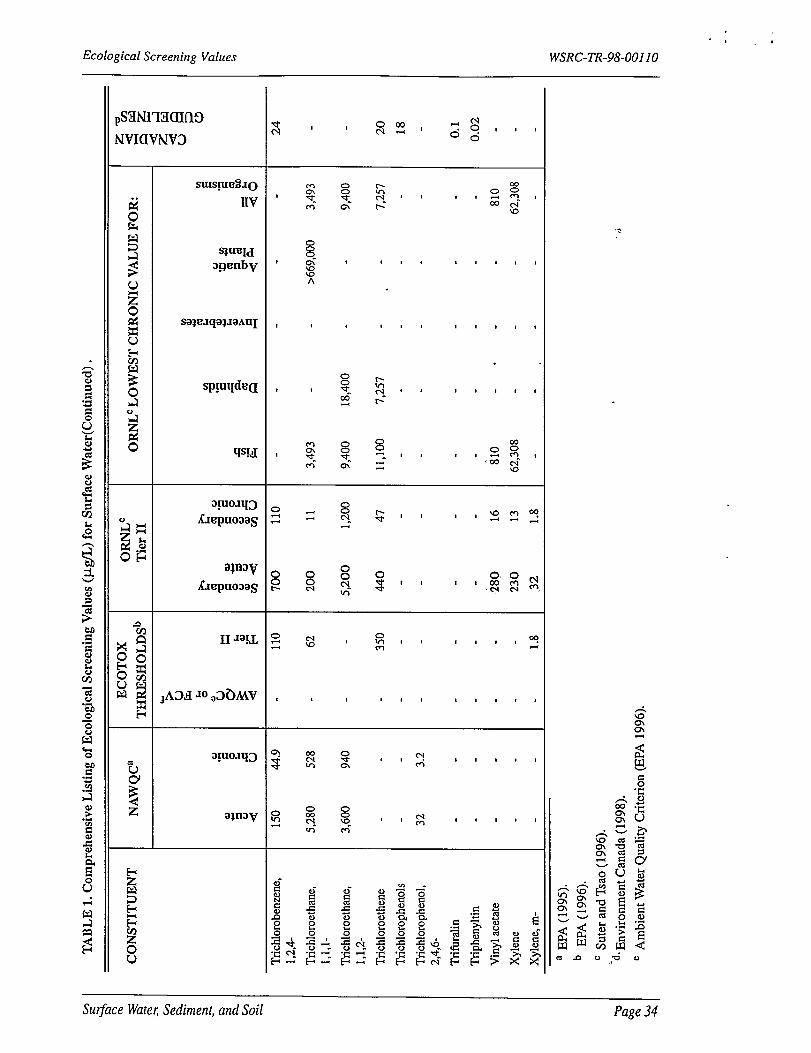
TABLE 1. Comprehensive Listing of Ecological Screening Values (p#’L) for Surface Water(Continued).
ECOTOX
rHRESHOLDSbORNLCTier II
CONSTITUENT NAWQC’ ORNLCLOWEST CHRONIC VALUE FOR:
Dichlorophenol,2,4-
Dichloropropane,1,2-
D~chloropropene,1,3-
Dichloropropylene,1,3-(cis andtrans) “.
Dieldrin
Diethylphthalate
Di(2-ethylhexyl)phthalate
Dimethoate
Dimethylphtha!ate
Dimethylphenol,2,4-
Dinitrophenol,2,4-
Dinitrophenol,2-Mcthyl-4,6-
Dinitrotoluene,2,4-
Di-n-butyIphthalate
Di-n-octylphthalate
Dinoseb
202
5,250.
606
2,5
5,210
3,300
212
62
23
3,100
94
.
.
36:5
525
.,
24.4
0.0019
521:
330,~
21,2
6,2
2.3
310
9.4
.
...
0.062.
-
-’
-
.
.
.
.
.
.
.
. . -
244
85,600
.
,; 697
708
.
-
.
.
-
0.004-
16
6.2.
-
19.
0.05
. .
0.99 0.055 244 805
.
4,950
. .
1,800 210.
.
.
220 85,600.
. .
.
.
33
-
717
3,822
697
708 .
.
.
-.
.
.
190 35. .
. .
.,..,
Ecological Screening Values WSRC-TR-98-00110
psmmKma
NVICIVNV3
Suquao
[wt ,
#
, , ,
I , ,
t ,
,
0
0
t
,
I
,
1
t
,
t
#
,
*
1
t
1
t
t
,
,
*
,
,
,
sa~t?Jqa&IaAuI
aw0,, , 0400
1 t s0
t , 0,, m,,
-- mt mu-l
001 ~ll~v, ,-, ,,CN
00 (-00
o
.
Surjace Wate~ Sediment, andSoi[ Page 30

.... ”
Ecological Screening Values WSR~-TR-98-00110
psmIT13am9
NVICIVNV3
quoqjAn2puo3aS
aymvhepuo3aS
quo.q)
a~mv
,, q co, , , OCQO 00C=”a *- -6’ AW”
r’
,
,
,
,
,
,
1
,
1
1
,
,
,
,
t
t
t
1
t
00w-c-t-
,
,
,
I
,
t
,
,
,
,
,
I
1.
1.
1
_
,
,
I
,
,
1
,
8
t
‘,, ,,, ,, **, ,, ,,, ,
.qo
Su~ace Wate6 Sediment, and Soil Page 31

Ecological Screening Values WSRC-TR-98-OO11O
psmmmuna
NVICIVNV3
SUxsyxlao
lW
sa$RIqaJJaAuI
3yIolq~X.u3puo3aS
a~mvX..u3puo3aS
WIw
om-,s=’
,,
00-f1=
Z**
,
,
I
t
,
t
8
,
g~.,,%m’= 0
t
t
, ,
,
,
,
, ,
,
,
,
=.
,
,
t
,
cn~t,, ,,, ,,, , ‘+ -4-,,,,,,,
00
,,, ,,, ,,, ,,,, m, ?,, ,,a
-azo
mo“
UYVIN
~
o-
,,
,,
Surj$aceWate<Sediment, andSoil Page 32

.
.
TABLE 1. Comprehensive Listing of Ecological Screening Values (p@) for Surface Water(Continued).
ORNLCTier II
ECOTOX
ThresholdsCONSTITUENT
o NAWQCa ORNLCLOWEST CHRONIC VALUE FOR:
Pyrene .
.
.
-
250
932
528
.
1,750
0.73
.
-
.
.
.
.
50
240
84
175,
0,0002.
0.026.
.
.
.
2,400
750
1,269
d --
0.02
3.0
10
1.6
1.8
110
1.0
2.0
0,008
0.24‘
0.008
8.0
.
.
Quinoline
Simazine
Tebuthiuron
. .Tetrachlorobenzene,1,2,3,4-
Tetrachlorobenzene,1,2,4,5-
Tetrachloroethane,1,1,2,2-
420 2,100 610 2,400 9,900 136,000
Tetrachloroethene 120
240
130
0,011
320
830 98
4,400 240.
120 9.8
840 750
25,229-
‘.
>816,000
-
.
.
Tetrachloromethane .
Tetrachlorophenols
245,000Toluene 1,269Toxaphcnc
Trialiate “ .
2,300 320
Tributykin
Trichlorobenzene,1,2,3-
., .Ecological Screening Values WSRC-TR-98-OOI1O
stns!ue%o
I[v
sayeJqaJJaAuI
3yIoJq~
Kmpuo3aS
3ylo.llf~
ap3V
* Ow #(’i?4” m-l’ ~:t,l
t
,
,
,
,
,
,
,
.
, ,
,
,
t * ,,, ,,, ,,
,
t
Not,, ,,
m
(- 4,,,,,m
Suqiace Wate(Sedimentjand Soil Page 34
.
f Final Chronic Value (EPA 1996).
g pH 6.5-9.0.
h pH < 6.5; [Ca+2] <4 mg/L; DOC c 2.0 mg/L.
i pH 2 6.5; [Ca+2] <4 mg/L; DOC e 2.0 mg/L.
j pH 8.0; 10° C.
k pH 6.5; 10° C.
1 2 pg/L at CaC03 O-120mg/L; 3 pg/L at CaC03 120-180 mglQ 4 pg/L at CaC03 >180 mg/L.
m 1 pgLLatCaC030-60 mgiL; 2 pg/L at CaC03 60-120 mg/L; 4 I.Ig/Lat CaC03 120-180 mg/L; 7 pg/L at CaC03 >180 mg/L.
n 25 pg/L at CaC03 0-60 mg/U 65 pg~ at CaC03 60-120 mg/L; 110 pg/L at CaC03 120-180 mg/L; 150 pg/L at CaC03 >180 mg/L.
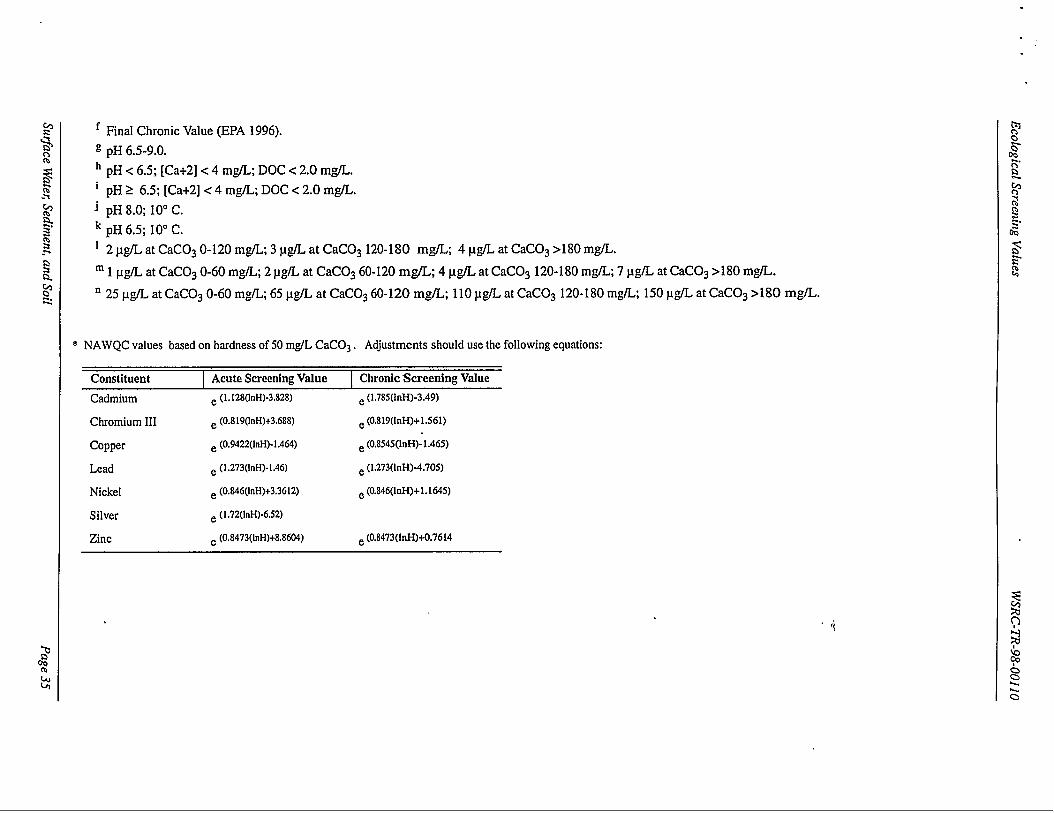
I * NAWQCvalues basedon hardnessof 50 mg/LCaC03. Adjustmentsshould use the followingequations:
I Constituent I Acute ScreeningValue I ChronicScreening Value
I Cadmium e (1.128(lnH)-3.828) ~ (l,785(lnH)-3.49)
I ChromiumIII e (0.819(lnH)+3.688) ~ (0,819(1nH)+I.561)
Copper e (0.9422(lnH)-l.464) e (0.8545(InH)-L465)
Lead e (1.273(lnH)-l.46) e (1.273(lnH)-4.705)
Nickel e (0.846(lnH)+3.3612) e (0.846(lnH)+l.1645)
Silver e (l,72(lnH)-6.52)
Zinc e (0.8473(lnH)+8.8604) e (0.8473(lnH)+0.7614

,.,Ecological screening Values WSRC-TR-98-00110
laAaqspaJJ3
aIqeqold
anp3ASu!uaams
.
wo
oz’
v),co
t
,
t
1
,,, ,, ,,, ,, ,,, ,
1,, ,[, ,,, ,,, ,,
0 s,,c-N&
o
0
Su~ace Wate<Sediment, and Soil Page 36

,.9”Ecological Screening Values WSRC-TR-98-OO11O
.
m“E.2Al
isW
anluA @xaa33S
.,, ,,
0,,, , t,, ,, 0 .;
G“~.
/,, ,,.,
00.,1 Ill mm.. mm,.
.,,. 00,,, ,1 ,,t mm, ,, mm
~.
g. .;:g C&1 I
$0 mm
..’, ,,,Cqcq
11 d-co’em
I
—
Surface Wate~ Sediment, and Soil Page 37

Ecological Screening Values wSRC-TR-98-OOII0,
.
,,, ,, ,,, ,, l$ilttt’
11, ,
1,, ,
0)co’”
qW’”
q,co
d-qtm !-4
1118, , ,,, ,,, ,,, ,8 w4
,,, ,, ,,, ,, ,,, ,, ,,’
,,, ,
,,, , y,11
,,, ,, m-0’”
1 ,
-a -n -!+6 6.Q-nw-m%+cannn n-nnnr2nnn
Su~ace Wate~ Sediment, and Soil Page 38

TABLE 2. Comprehensive LMing of Ecological Screening Values for Sediment(Continued).
CONSTITUENT
DDT (total)
DDT/DDE/DDD (total)
Diazinon
Dibenzo(a,h)anthracene
Dibenzofuran
Dichlorobenzene, 1,2-
Dichlorobenzene, 1,3-
Dichlorobenzene, 1,4-
Dichlorobenzene (total)
Dichloroethane, 1,2-
Dichloromethane
Dichlorophenols (total)
Dieldrin
Diethyl phthalate
Di-n-butyl phthalate
Endosulfan, mixed isomers
Endosulfan, alpha
Endosulfan, beta
Endrin
EPA REGION N
1.58 3.3
6.22 330
.
. -,
. .
0.02 b3.3.?. .
-
0.02 3.3
3.3
330
.
3.3
3.3
- .
1.9
2,000
340
1,700
350
.
-
52 -
630
11,000
5.4
2,9
14
20 -
ENVIRONMENT
CANADAC
.
6.22 135
.
2.85 6.67
. .
.
.
2.67 62.4
DUTCH MINISTRY
Standards
2,5 4,000
.
10
4,000
- 20,000
3.q
0.5’.
1.0
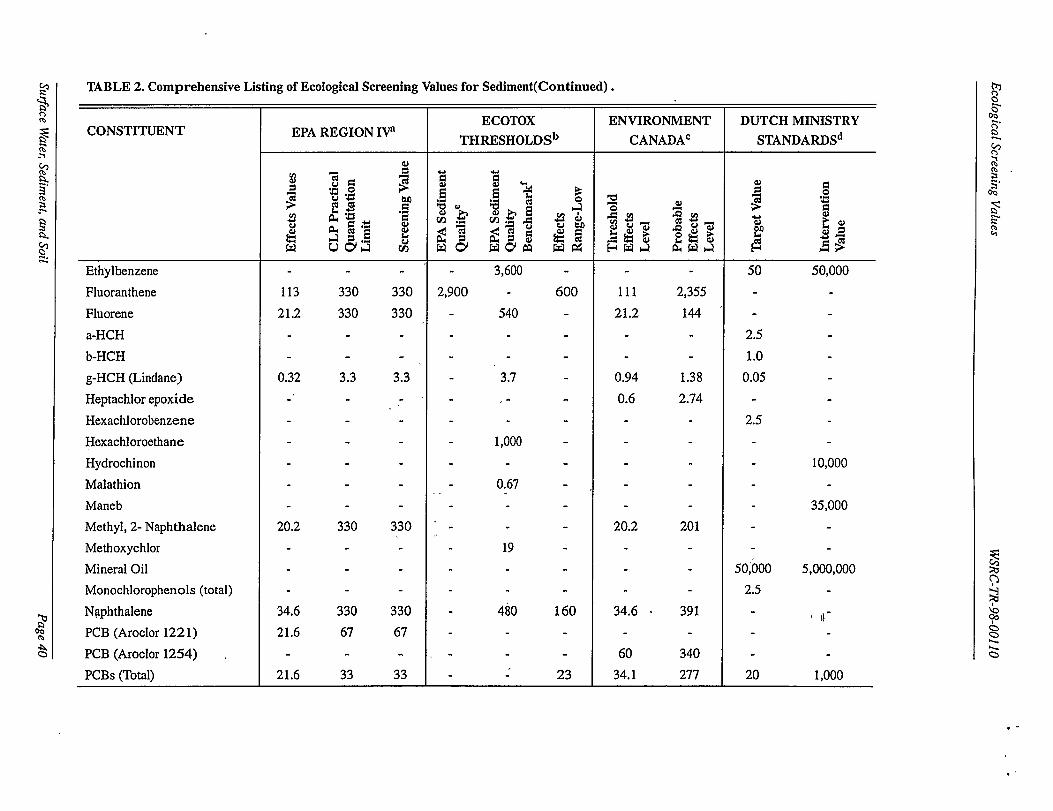
TABLE 2. Comprehensive Listing of Ecological Screening Values for Sediment(Continued).
ENVIRONMENT
CANADAC
DUTCH MINISTRY
StandardsCONSTITUENT EPA REGION ~
Ethylbenzene
Fluoranthene
Fluorene
a-HCH
b-HCH
g-HCH (Lindane)
Heptachlor epoxide
Hexachlorobenzene
Hexachloroethane
Hydrochinon
Malathion
Maneb
Methyl, 2- Naphthalene
Methoxychlor
Mineral Oil
Monochlorophenols (total)
Npphthalene
PCB (Aroclor 1221)
PCB (Aroclor 1254)
PCBS (Total)
.
2,900
3,600
600
50 50,000. . -
111 2,355
21.2 144
0.94 1.38
0.6 2.74
20.2 201
34.6 . 391
60 340
34.1 277
113
21.2
330
330
330
330 540
.
.
2.5
1.0
0.050.32 3.3 3.3 3.7
. ,. .
2.5
1,000 .
10,000
0,67“,
.
35,000
20.2 330 330 .
19
.
50;000
2.5
5,000,000.
34.6
21.6
330
67
330
67
480 160
. . .
1,00021.6 33 33 23 20
.-
. .

..4.+ ___ _- .—a.. - -.-..,. ~=b ,.. =.-,-=.-. - -- . ..-. .—.. . . ,. ~-. . ___ ._.
,..’
Ecological Screening Values WSRC-TR-98-00110
(-i
II
II
wq,
.,0)/
G’I
mI 111 -,,,:,:, :
m
Ill m,, ,,, ,, ,m
o111 111111 11
%
:.g. ,
II ,, ,18 11111 IIcc:
11
4!
11
100mmmm
tlt la.
‘,11”11 I
:’ 1818
Sutface WateCSediment, and Soil Page 41

zogC4
anIeA %yxaams
sanleA s.pa~x
00
t,
t,
,,, ,, ,,, ,,
,,8, , t,, ,, ,,,
,, t,, ,,, ,, ,,,
Ecological Screening Values WSRC-TR-98-OOI1O ‘ : ‘
8,141, ,,, ,,, ,
1,,,1, ,,, ,,, ,
,,, ,, ,,, ,, ,,,
Sutface Wate~ Sediment, and Soil Page 42

-,.,
6“.
Ecologica[ Screening Values WSRC-TR-98-OO11O
,
1
:
t
t
1
L
1
, .=
1:
qood-
00mm
1 0e!
0
m
00
00
0UT
00vl~
000m“
0’01m
Su~ace WateL Sediment, and Soil Page 43
.
Ecological Screening Values WSRC-TR-98-OOI1O
s
omc=
o-3
wm m
m
,
1
,
I
, ,
,
I
,
1
,
t
1
,
,
I
o ,
I.
o 00141, ,, ,,, ,,, ,~o 8
-IN
~&?3~OJO@d 1!0s
fuIspnaIo-oJ3gJq
m.o
0m
-0
om
om
1
t, ow-l
,
I
t
go008,J- %-
jX.U.loMq3Je3111 1,,
Ezl.-G
5
Su~ace Watec Sediment, and Soil Page 44

. . + . .. . ,.... ... . .. .. . .. .. ... .. . . . .. ..
L
.\ .● .
Ecological Screening Values WSRC-TR-98-OOI1O
pU.IoAqpe3
It, ,, t
1
1
,
1
1
,
01
!-l
,,, ,,
“lnln~lnI O.O=O
0000
,
I
i
?,, ,,, , , 0> m.*, oo,> m’--4mu
r
,
I
#
1
#
I
,
,
1
t
,
, 0co’
1 :,
t 8 s.
I 1,
1 11
,,,
18,
1
1
1
1
t
1
Surface Watec Sediment, and Soil Page 45

Ecological Screening Values WSRC-TR-98-OO11O
El
1
1
*
I
1
1
#
o
t
I
,
,
I
*
80
1
,
,
I
,
,
1
,
No00
1
t
,
,
1
“1
so0
0m“’’’” ‘z’’’”
o01
,
1
t t
1
1
I
I
a I
1
1
10
-3’
Ill
.0 0I
m“
1
1
t
o qos I Ow’’”” “’”
040, ZG, ,,, ,, ,,, ,,0 00
CA
—Sug2ace Watec Sediment, and Soil Page 46

Ecological Screening Values WSRC-TR-98-OOI1O
t)
111118 Ill # I 1
Ill
,1,
0
t
,,
18
,1
11
0=1-
1 =1 1
0A , I I
I
I
1
—
11y ,q, ,,, ,, ,
o’ 0
,
1
1
t
1
1
,
1
1,
:
1
1
#
I
1
1
I
1
1
t
I
t
1
t 1 t 1
I , 1E30..
1 1 8 8
*
#
1
4. .+ --- .+Oyw.1 00’
.+0000. 0 0’0
Surjace Watec Sediment, and Soil Page 47

.. .. . .
Ecological Screening Values WSRC-TR-98-00110
‘%‘sJv
1
,
,
1
,
1
1
8
t
I
om
t
,
I
1
I
,
1 1
8
t
I
o*
1
#
o$s4
1
I
1
I
1
1
I
t
,
,
I
‘1
1
t
1
,
—
,,, ,, ,,, ,, ,,, ,, ,,
oa
I
om
,
I
I
,
8
0d-
,,,
000.”
,
1
1
I
I
0m
I
I
1
I
1
1
1
1
00F
I
0
t
1
,,
00O*,4”
00d-m
,
I
00
,, ~g, ,t, ,, ,,, ,,, ,
,, 00@t i’’”” “’’’”
mmt, 00, ,,, ,, ,,, ,,, ,
00
CA
xi--m
4--
Su~ace Wate~ Sediment, and Soil Page 48

—.
$
. 0 ,, .
Ecological Screening Values WSRC-TR-98-00110
t
o
1 1
t 1
1
I
Go
1 It
00d-:
1 ,
1
I
1
1
,
,
i
8
1
1
,,
0“-c
Go’0
1 1.
00
t I
.
11, l,,CQ
co’’’’’” ‘
11,
14oW’ o
H“” I
,
0(w
fulsymao-om~,
1
, l,,
0 0m-”
t,,
40 1 g, om“
00, ,,, ,, ,,, ,,l-d I
001 11, ,,, ,,, ,,,.s
w+t :0’’’’” “’”?
Su@ace Watec Sediment, andSoil Page 49

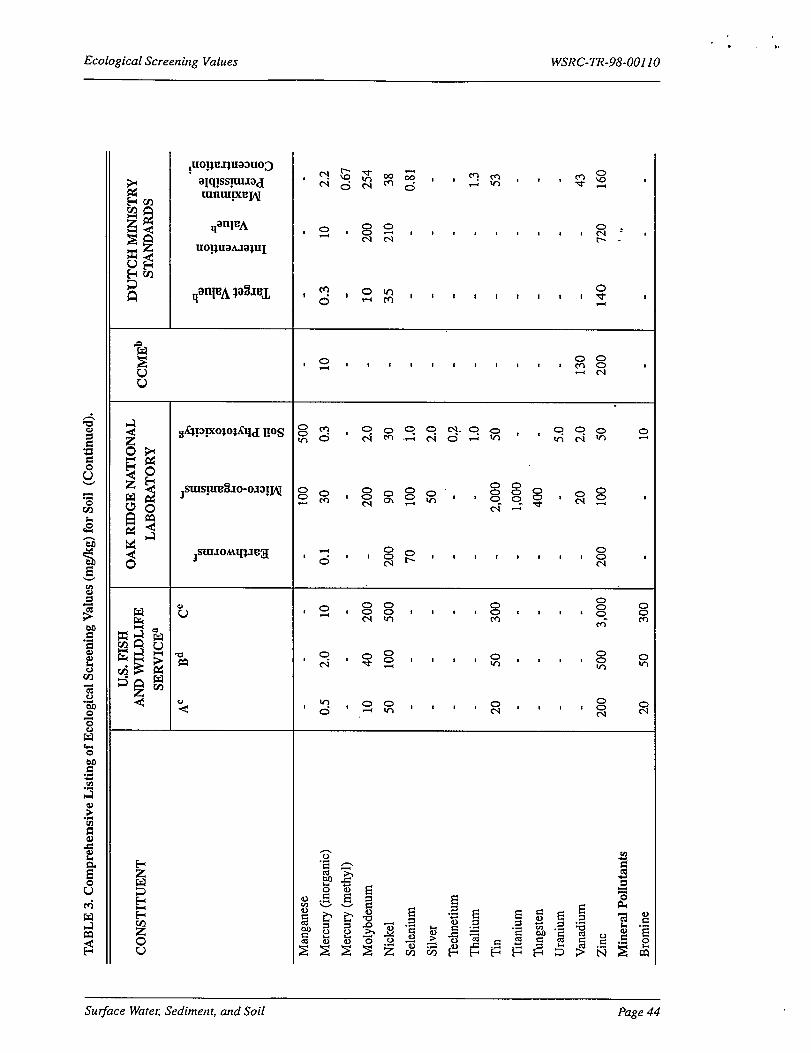
TABLE 3.Comprehensive Listing of Ecological Screening Values (mgkg) for Soil (Continued).
U.S.FISHAND WILDLIFE
SERVICE”
OAK RIDGE NATIONAL
LABORATORY
DUTCH MINISTRYSTANDARDSCCMEbCONSTITUENT
Ac Bd cc
Pesticides
Aldrin
Atrazine
Carbaryl
Carbofuran
DDT/DDE/DDD
Dieldrin
Endrin
a-HCH
b-HCH
g-HCH (Lindane)
Maneb
Organochlorinated (each)
Organoehlorinated (total)
Total Pesticides
‘OtherPollutants
Acrylonitrile
Catechol
0.0025
0.00005
.
0.0025
0.0005
0.001
0.0025
0.001
o.ooi105
-.
-
.
6.0 -
5.0 -
2.0 -
4.0 -
,-
35 -
i ,’
20 -
.
.
.
.
-
-
. .
.
. ..
0.1
0.1
0.1
0.5
1,0
2.0
5.0
10
20
1,000 -
--,,
..
:

.. —-: .-, , ,-- . . . .
,
Ecological Screening Values WSRC-TR-98-00110
I 1
0.-
*
t
00
, I
I
I
1
I
1
1
t
1
1
0
1
I
I
1
1
1
8
,
0.M
.
0
I
1 00
,1 %“’’’” “’’”
og
,
1
1
,
I
1
t
I
i t 1
,
1
I
,
,.
1
I
t 1
,
t
I
s
1
I
I
1
t 1~snI.IoMq3.m3 1
01 z“’,%’ z 118: 0, 00$
m m-sw“
Suflace Watec Sediment, atul Soil Page 51

tb il. ,
Ecological Screening Values WSRC-TR-98-00110
Su$ace Wate~ Sediment, and Soil Page 52

Ecological Screening Values WSRC-TR-98-OO11O
TABLE 4.Ecological Screening Values (1.@L)for Surface Water.
TargetTarget
CONSTITUENTAnalyte List
Compound Screening Value SourceList
Aluminum
Ammonia
Antimony
Arsenic III
Arsenic V
Arsenic
Barium
Beryllium
Boron
Cadmium
Calcium
Chromium III
Chromium VI
Cobalt
Copper
Cyanide
Iron’, ,
Lead
Lithium
Magnesium
Manganese
Mercury (inorganic)
Mercury(methyl)Molybdenum
NickelPotassiumSelenium
Silver
SodiumStrontium
Sulfide(S2-,HS-)Thallium
Tin
UraniumVanadium
87 :- .-.-
1,000
160
190
3.1
5.0
4.0
0.53
750 “
0.66*
116,000
117.32*11*
23
6.54* ~
5.2
1,000
1.32*
14
82,000
120
0.012
0.0028
370
87.71*
53,000
5.0
0.012
680,000
1,500
2.0
4.0
73
2.6
20
Llj
[6]
[1]
[1]
[3]
[5]
[3]
[1]
[1]
[1]
[4]
[1]
[1]
[3]
[1] ,
[1]
[1]
[1]
;[3]
[4]
[3]
[1]
[3]
[3]
[1]’
[4]
[1]
[1]
[4]
[3]
[1]
il]
[3]
[3]
[3]
Su~ace Watec Sediment, and Soil Page 53


t. #, J, . . .
Ecological Screening Values WSRC-TR-98-OOI1O
TABLE 4. Ecological Screening Values (@L) for Surface Water (Continued).
CONSTITUENTTarget
Target
Analyte LiitCompound Screening Value Source
List
Carbon tetrachloride
Chlordane
Chloride
Chlorine(Total Residu,d)’
Chlorobenzene
Chloroethylvinyl, 2- Ether
Chloroform
Chlorophenol, 2: . ~ ‘~~‘
Chlorophenol, 3-Methy14-
Chloiopyrifos . ‘
Chlorothalonil
Cyazinine - ‘ ‘
DDD, 4,4’-
JIDE, 4,4’-
DDT, 4;4’-
Decane ,/’ ,
Deltamethrin
Demeton ‘ ,,
Diazinon ‘Dibenzofuran ‘ “Dicamba
Dichlorobenzene,122-‘ ,.
Dichlorobenzene,1,3-Dichlorobenienei l#- ‘
Dichloroethane, 1,1-
IXchloroethane, 1;2- ‘“
Dichloroethene, 1,1-
Dichloroethene, 1,2- ~ .
Dichloroethylene, l,2-trans-
Dichlorophenols “’
Dichlorophenol, 2,4-
Dichloropropane, 1,2-’
Dichloropropene, 1,3-
Dichloropropylene, 1,3- (cisand trans)
Diclofop-methyl ‘
Dieldrin
352
0.0043
230,000
11
195
3,540
289
43,8
0.3
0.041
,,,, “d ‘“”
I/
0.2
2.0
0.0064
10.5
0.001
49
0.0004
0.1
0.0433.710
15.8
50.2-1.1.2
47,., . .2,000
303
590
1,3500.2
36.5525
0.055
24.4
6.1
0.0019
[1]
[1]. [1]
[1]
[1]
‘ “ [1]
[1]
. . ‘ [1]
[1]
“ [1]
[5]
[5]
[1]
[1]
[1]
~ [3]
[5] ‘
[1]
[3]
[3]
[5]
~ [1]
[1],: ’.. ‘[1]
[3],., ,
~~].
[1]
[3]
[1]
[5]
[1]
“ ‘[l]
[3]
[1]
[5]
[1]
Surface WateqSediment,and Soil Page55
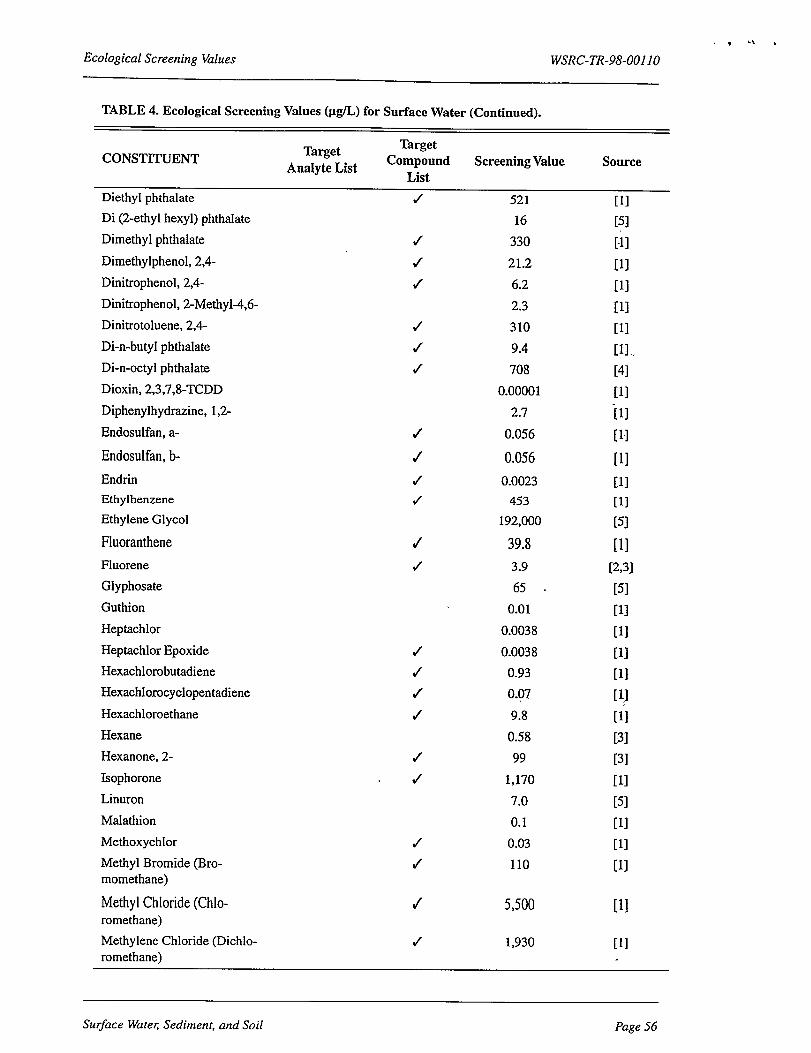
Ecological Screening Values WSRC-TR-98-00110
TABLE 4.Ecological Screening Values (@L) for Surface Water (Continued).
CONSTITUENT TargetAnalyte List
TargetCompound
ListScreening Value Source
Diethyl phthalate J
Di (2-ethyl hexyl) phthalate
Dimethyl phthalate
Dimethylphenol, 2,4-
Dinitrophenol, 2,4-
Dinitrophenol, 2-MethyI-4,6-
Dinitrotoluene, 2,4-
Di-n-butyl phthalate
Di-n-octyl phthalate
Dioxin, 2,3,7,8-TCDD
Diphenylhydrazine, 1,2-
Endosulfan, a-
Endosulfan, b-
Endrin
Ethylbenzene
Ethylene Glycol
Fluoranthene
Fluorene
Glyphosate
Guthion
Heptachlor
Heptachlor Epoxide
Hexachlorobutadiene
Hexachlorocyclopentadiene
Hexachloroethane
Hexane
Hexanone, 2-
Isophorone
Llnuron
Malathion
Methoxychlor
Methyl Bromide (Bro-momethane)
Methyl Chloride (Chlo-romethane)
Methylene Chloride (Dichlo-romethane)
521
16
330
21.2
6.2
2.3
310
9.4
708
0.00001
2.7
0.056
0.056
0.0023
453
192,000
39.8
3.9
65 .
0.01
0.0038
0.0038
0.93
0.07
9.8
0.58
99
1,170
7.0
0.1
0.03
110
5,500
1,930
[1][5]
[-1]
[1]
[1]
[1]
[1]
[11..[4]
[1]
~1]
[1]
[1]
[1]
[1]
[5]
[1]
[2,3]
[5]
[1]
[1]
[1]
[1]
[q
[1]
[3]
[3]
[1]
[5]
[1]
[1]
[11
[1]
[1]
Su#ace Wate<Sediment, and Soil Page 56

0;
●#t. . * .
Ecological Screening Values WSRC-TR-98-00110
TABLE 4. Ecological Screening Valum (p@) for Surface Water (Continued).
CONSTITUENTTarget
Target
Analyte ListCompound Screening Value Source
List
Methylnaphthalene, 1- 2.1 [3]
Methyl, 4-, 2-pentanone
Methylphenol, 2-
Metolachlor
Metribuzin
Mirex
Monochlorobenzene
Monochlorophenols
N-Nhrosodiphenylamine
Naphthalene
Nitrite
Nitrobenzene <
Nitrophenol, 2-
Nkophenol, 4-
Octanone, 2-
Oil & Grease
PAH’s
Parathion
PCB-1016
PCB-1221
PCB-1232
PCB-1242
PCB-1248
PCB-1254 “, ,.
PCB-1260PCBStotal “
Pentachlorobenzene
PentachlorophenolPentanol,1-Phenanthrene
Phenol, Picloram
PropyleneGlycolPropanol,2-
PyreneQuinolineSimazine
170
13
7.8
1.0
0.001
1.3
7.0
58.5
62
60
270
3,500
82.8
8.3
0.01
0.02
0.013
0.014
0.014
0.014
0.014
0.014
0.0140.0140.14
50
131100.4
256
29192,000
7.5
0.02
3.010
[3]
[3]
[5]
[5]
[1]
[5]
[5]
[1]
[1]’
[5]
[1]’
[1]
[1]
[3]
[1]
[5] ‘
[1]
[1]
[1]
[1]
‘[l]
[1]
‘ ~[1] ‘
[1]
[3]’
[1]
[1]
[3]
[5]
[1]
[5][5]
[3]
[5]
[5]
[5]
Surjace Watec Sediment, and Soil Page 57

Ecological Screening Values WSRC-TR-98-00110
TABLE 4.Ecological Screening VrdUe.S(@L) for surface water (Continued).
CONSTITUENT TargetTarget
Analyte List Compound Screening Value SourceList
Tebuthiuron 1.6 [5]
Tetrachlorobenzene,1,2,3,4- 1.8 [5]Tetrachlorobenzene,1,2,4,5- 50 cl]
Tetrachloroethane,1,1,2,2- t 240 [1]
Tetrachloroethene I 84 [1]
Tetrachloromethane 240 [2,3]
Tetrachlorophenols 1.0 [5-J
Toluene ! 175 [1]
Toxaphene 0.0002 [1]
Trialate 0.24 [5]
Tribromomethane 320 [2,3]
Tributyltin 0.026 , [1]
Trichlorobenzene,1,2,3- 8.0 [5]
Trichlorobenzene,1,2,4- 44.9 [1]
Trichloroethane,1,1,1- 528 u]Trichloroethane,1,1,2- 940 [1]
Ttichloroethene 47 [3] ‘
Trichlorophenols 18 [5]
Trichlorophenol,2,4,6- d 3.2 [1]
Trifuralin 0.1 [5]
Triphenyltin 0.02 [5.]
VinylAcetate J 16 [3]
Xylene J 13 [3]
Xylene,m- J 1.8 [2,4]
*Hardnessbased on 50 mg/LCaC03. Adjustmentsshoulduse the followingequations:
Constituent ] Acute Screening Value ] Chronic Screening Value
Cadmium ~ (1.12g(lnH)-3.S28) e (1.785(lnH)-3.49)
ChromiumIII e (0.819(1nH)+3.688) e (0.819(lnH)+l.561)
Copper e (0.9422(1nH)-1.464) e (0.8545(lnH)-1.465)
Lead ~ (1.273(lnH)-1:46) ~ (1.273(InH)4.705)
Nickel ~ (0.846(lnH)+3.3612) e (0.846(InH)+l.1645)
Silver e (1.72(lnH)-6.52)
Zinc e (0.8473(1nH)+8.8604) e (0.8473(lnH)+0.7614
Surface Ware<Sediment, and Soil Page 58

.,4
.,. OP
Ecological Screening Values WSRC-TR-98-OOI1O
Source:[l’JChronic Ambient Water Quality Criteria (EPA 1995).[2]Ecotox Threshold (Tier II) Value (EPA 1996).[3]Tier 11Secondary Chronic Value (Suter and Tsao 1996).[4]Lowest Chronic Value (Suter and Tsao 1996).[5]Canadian Water Guidelines (Environment Canada 1998).[6]Ammonia is pH and temperature dependent. The proposed value was taken from the 4-day average chron-ic concentration in water having a temperatureof300 C and a pH of 8.0 when salmonids and other sensitivecoldwater species absent (EPA 1985).
Su~ace WatecSediment,and Soil Page59

. .. ,
Ecological Screening Values WSRC-TR-98-OO11O
TABLE 5.Ecological Screening Values for Sediment.
CONSTITUENTTarget
TargetCompound
ScreeningAnalyte List Value
SourceList
Metals (mgkg)
Antimony
Arsenic
Arsenic 111
Barium
Cadmium
Chromium
Cobalt
Copper
Lead
Mercury
Molybdenum
Nickel
Silver
Zinc
Inorganic Compounds (m@g)
Cyanide (he)
Cyanide compIex(pH@
Cyanide comp1ex(p%5)
Thiocyanates (total)
“Organks (p#kg)
Acenaphthene
Acenaphthylene
Aldrin
Anthracene
Atrazine
Benzene
Benzo(a)anthracene
Benzo(a)pyrene
Biphenyl
Bis(2-ethylhexyl)phthalate
Bromophenyl phenyl ether, 4-
ButylbenzyI phthalate
Carbaryl
Carbofuran
12
7.24
8.2
200
1.0
52.3
20
18.7
30.2
0.13
10
15.9
2.0
124
1.05.0
5.02.-J*
330
330
2.5
3300.0550
330
3301,100
182
1,300
11,000
500*
200$
“ii]
[1]
[2]
[4]
[1]
[1]
[4]
.[1]
[1]
[1]
[4]
[1]
[1]
[1]
[4]
[4]
[4]
[4]
[1]
[1]
[4]
[1]
[4]
[4]
[1]
[1]
[2]
[1]
[2]
[2]
[4]
(4]
Sutface Watec Sediment, and Soil Page 60

,. ,.
,. ””-
Ecological Screening Values WSRC-TR-98-OOI1O
TABLE 5. Ecological Screening VaIues for Sediment.
TargetTarget
CONSTITUENT CompoundScreening
Analyte Liit Value SourceLiit
— 2,000*Catechol
‘Chlordane
Chlorobenzene
Chloronaphthalene
Chlorophenols (total)
Chrjsene
Cresols (total)
Cyclohexanon
DDD, p,p’-
DDD
DDE, p,p’-
DDE
DDT, p,p’ -
DDT
DDT (total)
DDT/DDE/DDD (total)
Diazinon
Dibenzo(a,h)anthracene
Dibenzofuran
Dichlorobenzene, 1,2-
Dichlorobenzene, 1,3-
Dichlorobenzene, 1,4-
Dichlorobenzene (total)
Dichloroethane, t2-
Dichloromethane (Methylene Chloride)
Dichlorophenols (total)
Dieldrin
Diethyl phthalate ‘
Di-n-butyl phthalate
Endosulfan, rnlx~.isomers
Endosulfan, alpha
Endosulfan, beta ‘
Endrin
Ethylbenzene
Fluoranthene
Fluorene
a-HCH
1.7
820
1,~*
1,000*
3305~*
100
3.3
3.3
3.3 -
3.3
3.3
3.3
3.3
2.5
1.9
330
2,000
340
1,700
350
104(-)()*
2,000*
3.0
3.3
630
11,000
5.4
2.9
14
3.3
50
330
[4]
[1]
[2]
[4]
[4]
[1]
[4]
[4]
[1]
[1]
[1]
[1]
[1]
[1]
[1]
[4]
[2]
[1]
[2]
[2]
[2]
[2]
[4]
[4]
[4]
[4]
[1]
[2]
[2]
[2]
[2]
[2]
[1]
[4]
[1]
330 - [1]
2.5 [4]
Surjace Wate<Sediment, and Soil Page 61

+*9.
Ecological Screening Values WSRC-TR-98-OOI1O
TABLE 5.Ecological Screening Values for Sediment.
CONSTITUENT TargetTarget
CompoundScreening
Analyte List ValueSource
List
b-HCH
g-HCH (Lindane) JHeptachlor Epoxide /
Hexachlorobenzene J
Hexachloroethane J
Hydrochinon
Malathion
Maneb
Methylnaphthalene, 2- l/
Methoxychlor d
Mineral Oil
Monochlorophenols (total)
Naphthalene
PCB (Aroclor 1221)
PCB (Aroclor 1254)
PCBS (Totzd)
Pentachlorobenzene
Pentachlorophenol
Phenanthrene
Phenol
PoIycycIic Aromatic Hydrocarbons
Low Molecular Weight
High Molecular Weight
Total PAHs
Pyrene J
Pyridine
Resorcinol
Styrene J
Tetrachlorobenzenes (total)
Tetrachloroethane, 1,1,2,2- J
Tetrachloroethene /
Tetrachloromethane
Tetrachlorophenols (total)
Tetrahydrofuran
Tetrahydrothiophene
Toluene J
Toxaphene J
1.0
3.3
0.6
2.5
1,000
1,000*
0.67
3,500*
330
19
50,000
2.5
330
67
60
33
2.5
2.0
330
50
330
655
1,684
330
100
1,000*
100
10
940
10
1.0
1.0
100
100
50
28
[$1,[11@],[4]
[2]
[4]
[2]
[4]
[1]
[2]
i4]
[4]
‘[l]
[1]
.[31’.
[1]
[41, ‘[4]
, [1]‘
[4]
. .[1]
, ‘[l]
[1]
“[l]
[4]
.[4]
[4]
[41[2]
,,[41,[4][4]
[4]
[4]L4][2]
Surface Wate<Sediment, and Soil Page 62

,/...~..,
Ecological Screening Values WSRC-TR-98-00110
TABLE 5. Ecological Screening Values for Sediment.
CONSTITUENTTarget
TargetCompound
Screening
Analyte List ValueSource
List
Tribromomethane 650 [2]
Trichloroberqerie; 1,2,4-, ~ 9,200 [2],.Trichlorobenzene (total) 10 [4]
Trichlo$oethaqe, 1,1,1-, ~ ‘ / , 170 [2] .
Trichloroe~ene” 1.0 [4]
Trichloromekihe ~~ 1.0 [4].
Trichlorophenols (total) J 1.0 [4]
Vinyl’Chloride , d 10* [4]
Xylene J 50 [4]
Xylene, m- / 25 [2]
* Value representsthe intervention value (MHSPE 1994) divided by a factor of 10.
Source:[l]EPA (1995).[2]EPA (1996).[3]Environment Canada (1995b).[4]Ministry of Housing, Spatial Planning and Environment (1994).
SurfaceWate~Sediment,andSoil Page63

. Jr.
Ecological Screening Values WSRC-TR-98-OO11O
TABLE 6.Recommended Ecological Screening Values (mgkg) for Soil.
CONSTITUENTTarget Target
AnaIyte CompoundScreening
ValueSource
List List
Inorganic
Aluminum
Antirncmy
Arsenic
Barium
Beryllium
Boron
Cadmium
Chromium
Cobalt
Copper
Iron
Lanathum
Lead
Lithium
Manganese
Mercury (inorganic)
Mercury (methyl)
Molybdenum
Nickel
Selenium
Silver
Technetium
Thallium
Tin
Titanium
llmgsten
Uranium
Vanadium
Zinc
Mheral Pollutants
Bromine
Cyanide, free (total)
Cyanide, comlex (total)
Thiocyanates
50
3.5
10
165
1.1
0.5
1.6
.0.4
20
40
200
50
50
2.0
100
0.10.672.030
0.812.0
0.21.0
53
1,000400
5.0
2.050
10
0.9
5.0
20
[2]
[5]
[2]
[5]
[5]
[2]
[5]
[2,3]
[1, 2,4]
[5]
[2]
[2]
[1, 2]
[2]
[2]
[2]
[5]
[2]
[2]
[5]
[2]
[2]
[2]
[5]
[2]
[2J
[2]
[2]
[2]
[2]
[3]
[1]
[4]
Sug2ace Wate~ Sediment, and Soil Page 64

,..
●✎✌ .!- .
Ecological Screening Values WSRC-TR-98-00110
TABLE 6. Recommended Ecological Screening Values (mgkg) for Soil (Continued).
CONSTITUENTTarget Target
Analyte CompoundScreening
Value SourceList List
Fluorene
Iodine
Sulfur ‘ ‘
Monocyclic Aromatic Hydrocarbons
Benzene
Biphenyl
Ethylbenzene
ToIuene
Trichloroethylene
Xylene
Total MAWS
Phenolic Compounds .
Phenol
Chlorophenol, 3-
Chlorophenols (each)
Chlorophenols”tiokd)
Dichlorophenol, 3,4-
Dichlorophenols (total) ~
Dinitrophenol;2,4-
Monochlorophenols (total) ‘
Nitrophenol, 4-
Pentachlorophenol
Tetrachlorophenol,2,3,4,5-
Tetrachlorophenols(total)
Trichlorophenol,2,4,5-
Trichlorophenol;2,4,6- ‘‘
Trichlorophenols (to&l)
Polycyclic Aromatic Hydrocarbons
Acenapthene d
Anthracene d
Benzo(a)pyrene J
Chloronaphthalene J
Fluoranthene d
Naphthalene d
Phenanthrene J
Pyrene /,
Total PAH’s 1.0 [1,4]
30
4.0
2.0
0.05
60
0.05
0.05
0.001
0.05
0.1 “
0.05
7.0
0.01
0.01
20
0.003
20
0.0025’
7.0
0.002
20
0.001
4.0
m’0.001
20
0.10.1
1.0
0.1
0.1
0.1
[2]
[2]
[1]
[4]
[2]
[1,4]
[1,41
[4]
[1,4]
[1]
[4]
[2]
[1]
[1]
[2]
[4]
[2]
[4]
[2]
[4]
[2]
[4]
[2]
[2]
[4]
[2]
[.1]
[1]
[4]
[1]
[1]
[1]
0.1 - [1]
Suflace Wate<Sediment, and Soil Page 65

.+-“- m..
Ecological Screening Values WSRC-TR-98-OO11O
TABLE 6.Recommended Ecologiml Screening Vak.S (m@kg) for Soil (Continued).
CONSTITUENTTarget Target
Analyte CompoundScreening
ValueSource
List List
Chlorinated Hydrocarbons
Aliphatic chlorinated hydrocarbons (each)
Aliphatic chlorinated hydrocarbons (total)
Carbon tetrachloride
Chlorinated hydrocarbons (total)
Chloroacetamide
Chloroaniline, 3-
Chlorobenzene (each)
Chlorobenzene (total)
Cis- 1,4-dichIoro-2-butene
Dichloroaniline, 2,4-
Dichloroaniline, 3,4-
Dichlorobenzene
Dichloroethane, 1,2-
Dlchloromethane
Dichloropropane, 1,2-
Hexachlorobenzene
Hexachlorocyclopentadiene
Nitrobenzene
Nitrosodiphenylamine, N-
Pentachloroaniline
Pentachlorobenzene
PCBS (total)
Polycyclic chlorinated hydrocarbons (total)
Tetrachloroaniline, 2,3,5,6-
Tetrachlorobenzene
Tetrachloroethene
Tetrachloromethane
Trans- 1,4-dichloro-2-butene
Trichloroaniline, 2,4,5-
Trichlorobenzene J
Trichloromethane (chloroform)
Vinyl chloride /
Pesticides
Aldrin /
Atrazine
DDT/DDE/DDD (total) /
0.1
0.1
1,000
0.1
2.0
20
0.05
0.05
1,000
100
20
0.01
0.4
2.0
700
0.0025
10
40
20
100
0.0025
0.02
0.1
20
0.01
0.01
0.001
1,000
20
0.01
0.001
0.01
0.0025
0.00005
0.0025
[1]
[’l]
[2]
[11[2]
[2]
[1]
cl]”
[2]
“[21,[2][4]
[4]
[4][2][4] ~
[2]
[2][2][2]
[4][4]
[1]
‘ [2]
[4][4]
[4]
[2][2]
[4][4][4]
[4][4]
~ [4]
Su~ace Wate<Sediment, and Soil Page 66
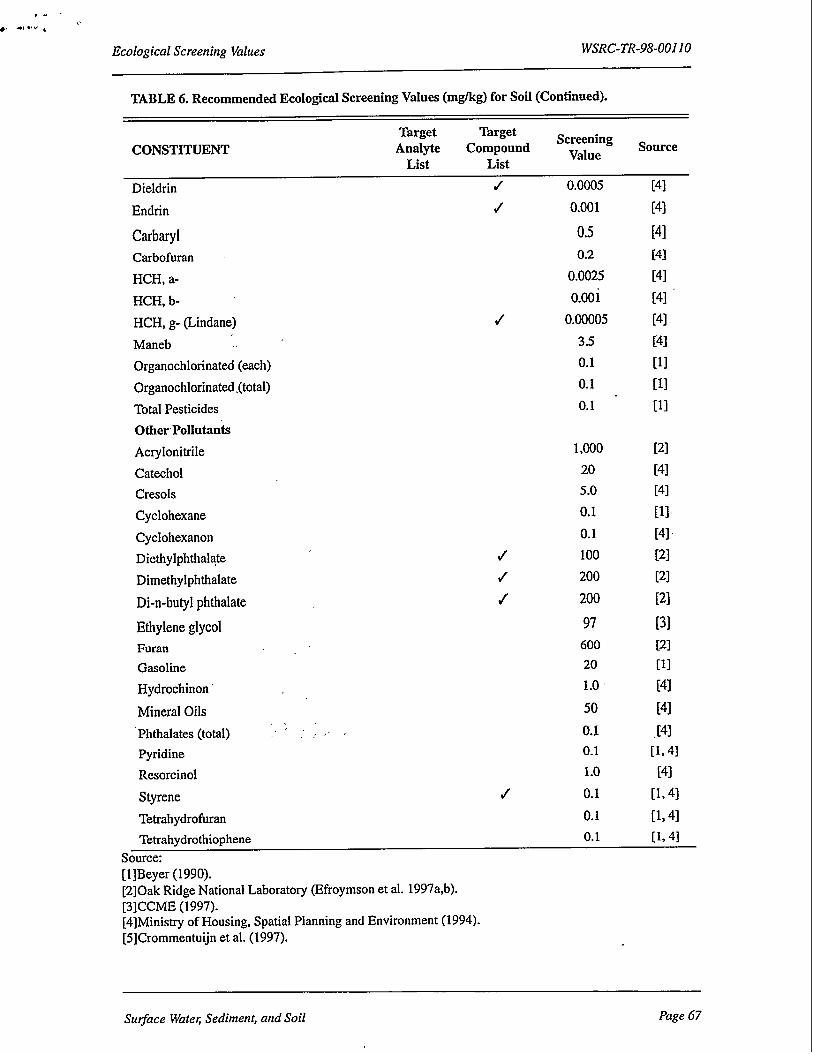
Ecological Screening Values WSRC-TR-98-OO11O
TABLE 6. Recommended Ecological Screening Values (mgkg) for Soil (Continued).
CONSTITUENTTarget Target
Analyte CompoundScreening
ValueSource
List List
Dieldrin J 0.0005
Endrin
CarbarylCarbofuran
HCH, a-
HCH, b- ‘
HCH, g- (Lhdane)
Maneb ~~
Organochlonnated (each)
Organochlorinated.(total)
Total Pesticides
OtherPollutank
Acrylonitrile
Catechol
Cresols
Cyclohexane
Cyclohexanon
Diethylphthalate
Dimethylphthalate
Di-n-butyl phthrtlate
EthyleneglycolFuranGasolineHydrochinon’
Mineral Oils
‘Phthalates (total) ~‘ :
Pyridine
Resorcinol
d 0.001
0.5
0.2
0.0025
0.001
0.00005
3.5
0.1
0.1
0.1 “
Styrene
Tetrahydrofuran
Tetrahydrotilophene
Source[l] Beyer (1990).[2]Oak Ridge National Laboratory (Efroymson et al. 1997a,b).[3]CCME (1997).[4]Ministry of Housing, Spatial Planning and Environment (1994).[5]Crommentuijn et al. (1997).
1,000
20
5.0
0.1
0.1
100
200
200
97600
20
1.0
50
0.1
0.1
1.0
d 0.1
0.1
0.1
[4]
[4]
[4]
[4]
[4]
[4]
[4]
[4]
[1]
[1]
[1]
[2]
[4]
[4]
[1].
[4] ~
[2]
[2]
[2]
[3]
[23
[1]
[4]
[4]
,[4]
[1, 4]
[4]
[1, 4]
[1, 4]
[1, 4]
Surface Water Sediment, and Soil Page 67