ecological pyramids and the transfer of energy in ecosystems which animals are at each level? what...
TRANSCRIPT

ECOLOGICAL PYRAMIDSand the Transfer of Energy in
Ecosystems
Which animals are at each level? What type of ecological niche do they each belong to?

Ecological Pyramids:
graphs which illustrate the trophic levels in a community.

Most ecological pyramids are large at the base and narrow at
the top. This is because every time that an organism is eaten by the next trophic level, some of the energy is lost as
heat. More Energy
Less Energy


3 TYPES OF PYRAMIDS:
1. Pyramid of Biomass2. Pyramid of Energy3. Pyramid of Numbers
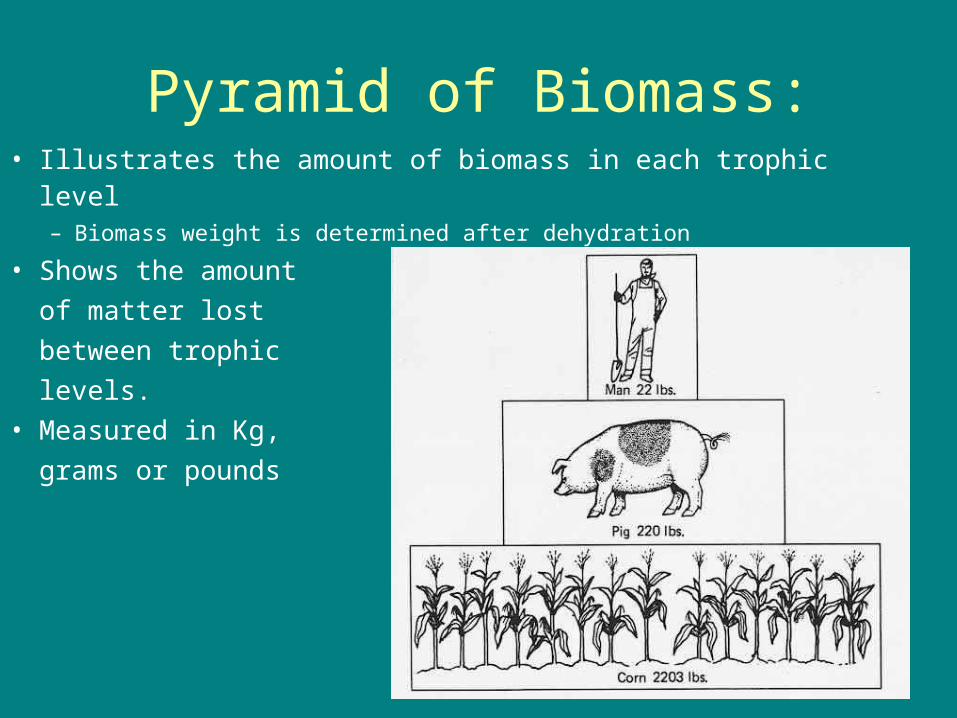
Pyramid of Biomass:• Illustrates the amount of biomass in each trophic level
– Biomass weight is determined after dehydration
• Shows the amount
of matter lost
between trophic
levels.• Measured in Kg,
grams or pounds
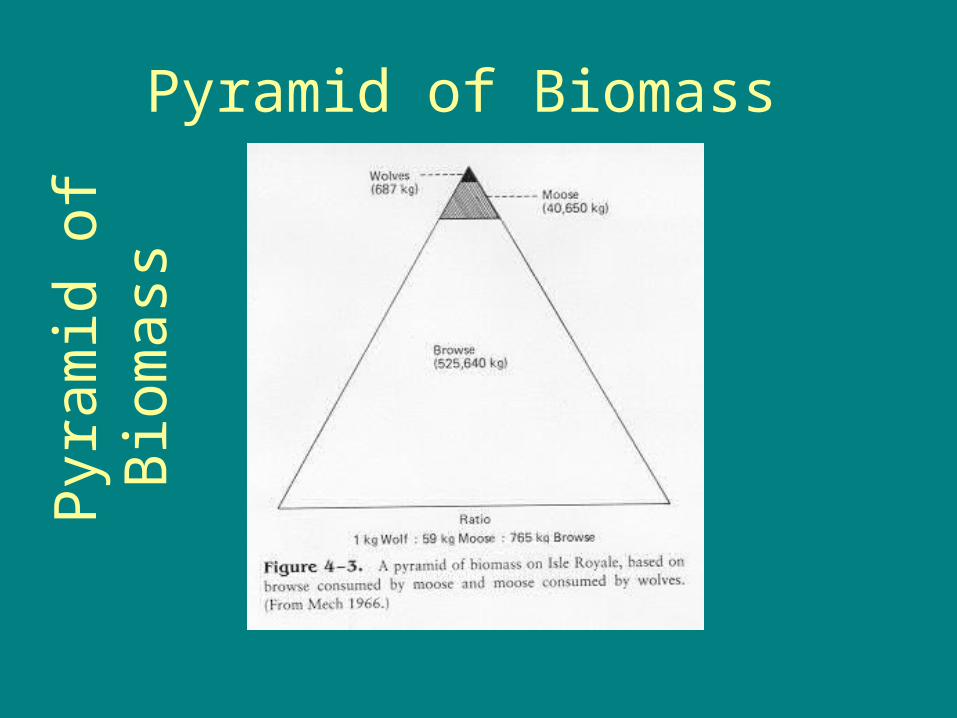
Pyramid of Biomass P
yram
id o
f Bio
mas
s

Pyramid of Biomass One problem:
They can make a trophic level look like it has more energy than it really does.
For example:
A bird has a beak, feathers and a skeleton that would count as biomass even though it does not contribute to the overall flow of energy into the next trophic level.
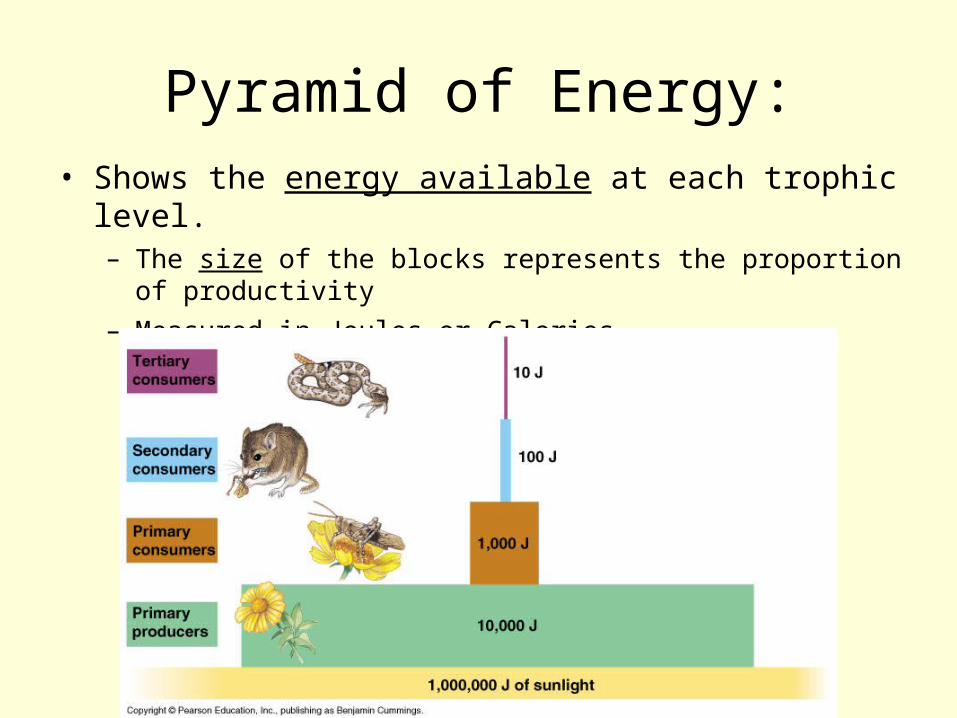
Pyramid of Energy:• Shows the energy available at each trophic level.
– The size of the blocks represents the proportion of productivity
– Measured in Joules or Calories
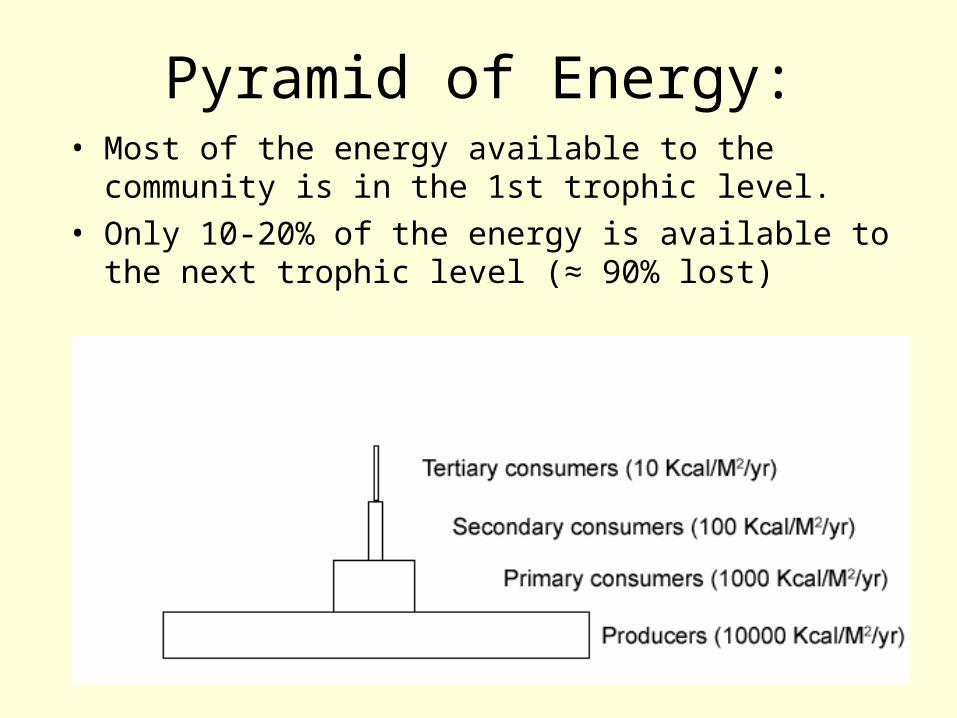
Pyramid of Energy:• Most of the energy available to the community is
in the 1st trophic level.• Only 10-20% of the energy is available to the
next trophic level (≈ 90% lost)

Pyramid of Numbers:• Illustration of the number of organisms at
each level
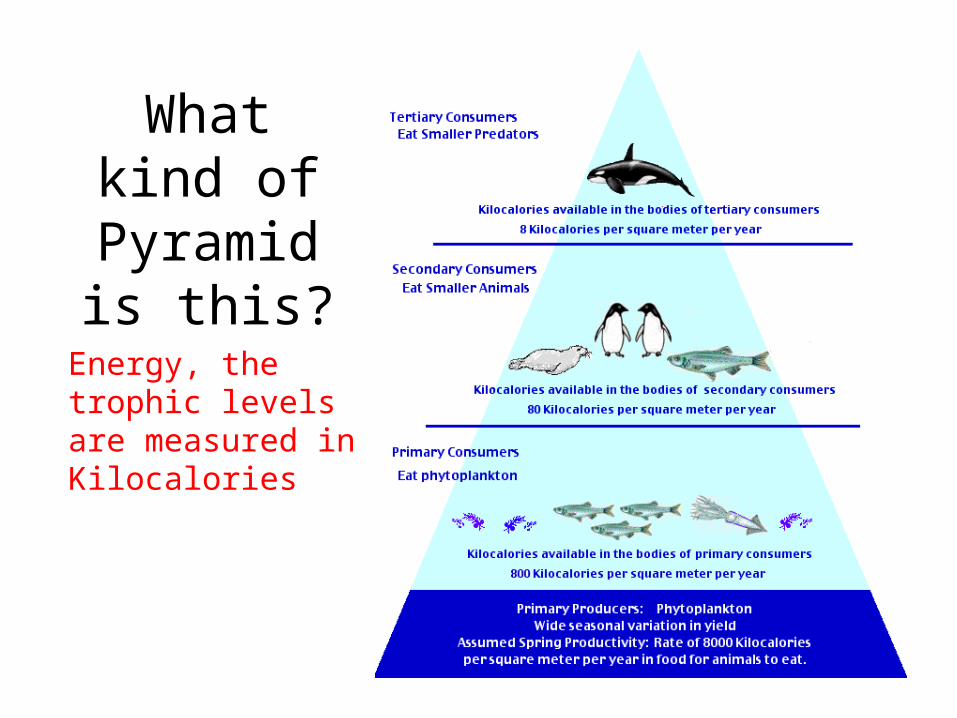
What kind of Pyramid
is this?
Energy, the trophic levels are measured in Kilocalories
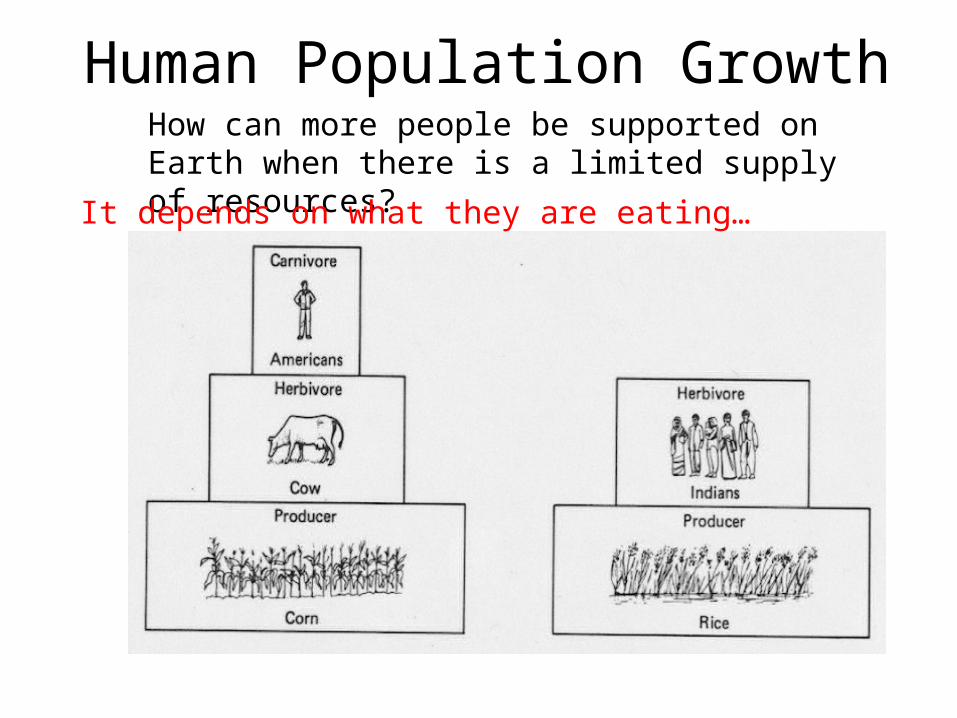
How can more people be supported on Earth when there is a limited supply of resources?
Human Population Growth
It depends on what they are eating…

Human Population Growth
• It requires 10 times as many crops to feed animals being bred for meat consumption as it would to feed the same amount of people on a vegetarian diet!!
• The US could feed 800 million people with the grain that livestock eat.
US population: 303 million

So Remember!
Ecological (Trophic) Pyramids show:
Energy transfer and more importantly energy loss in an ecosystem.
Why there are more herbivores than carnivores in an ecosystem.
Why there are more plants than everything else combined (they support all other populations).
16
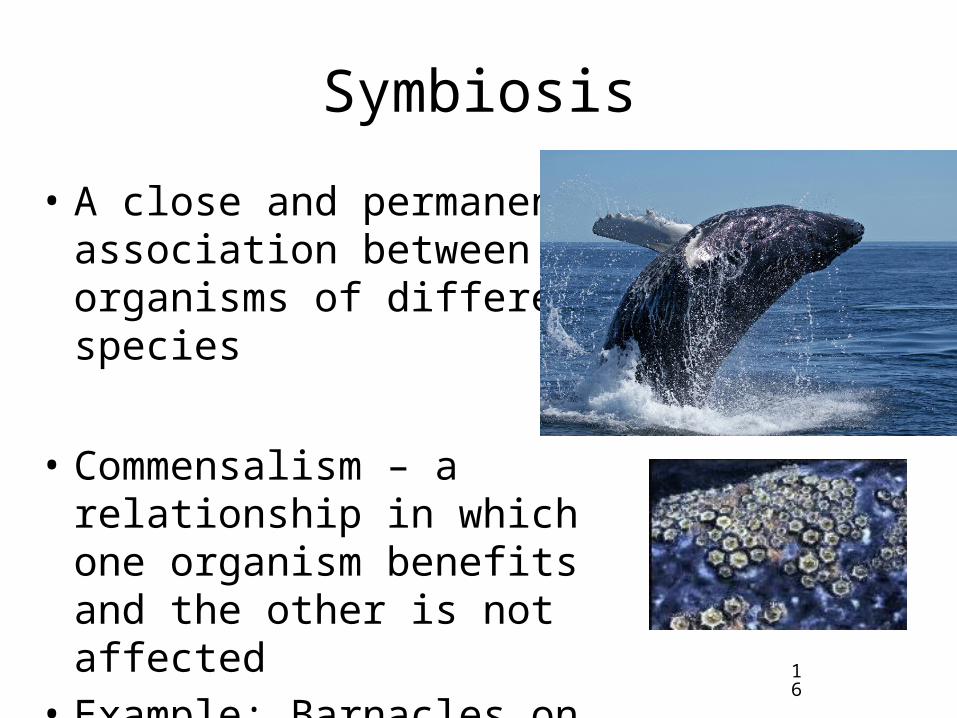
Symbiosis
• A close and permanent association between organisms of different species
• Commensalism – a relationship in which one organism benefits and the other is not affected
• Example: Barnacles on a whale
17
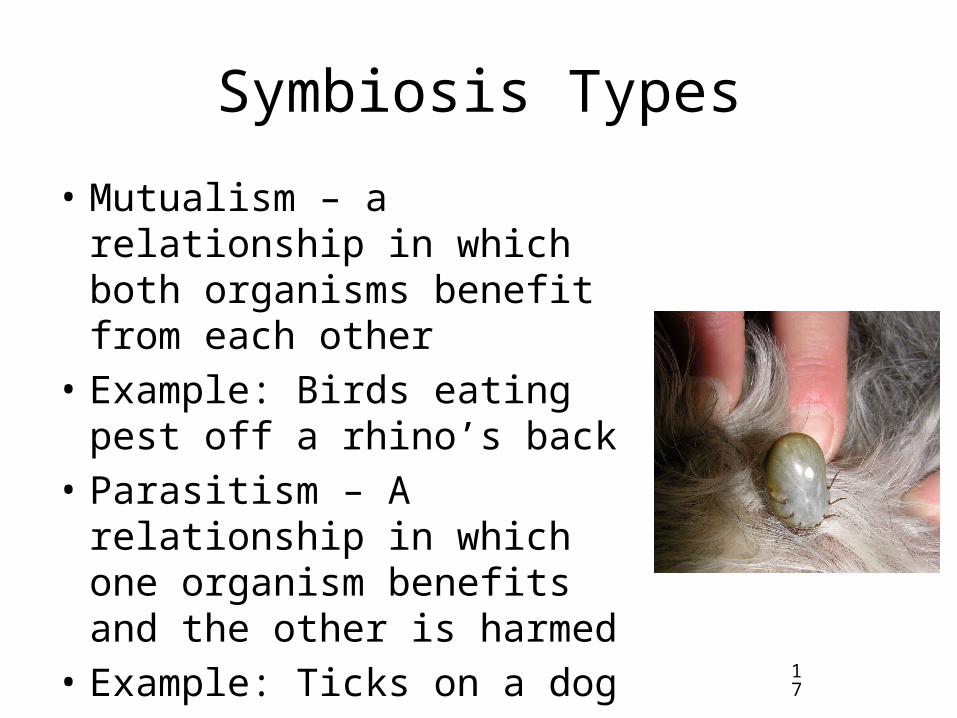
Symbiosis Types
• Mutualism – a relationship in which both organisms benefit from each other
• Example: Birds eating pest off a rhino’s back
• Parasitism – A relationship in which one organism benefits and the other is harmed
• Example: Ticks on a dog

18
Symbiosis Types• Competition - a relationship
where both organisms compete for the same energy source
• Example: a rabbit and a deer competing for grass, plants competing for light
• Predation - a relationship where one organism preys upon another
• Example: a wolf hunting a rabbit

The End or is it just the beginning…