ecological condition of the estuaries of oregon and …...the washington department of ecology...
TRANSCRIPT


EPA 910-R-06-001 Alaska
United States Region 10 Idaho Environmental Protection 1200 Sixth Avenue Oregon Agency Seattle, WA 98101 Washington
Office of Environmental Assessment March 2006
Ecological Condition of the Estuaries of Oregon and Washington

(blank page)

EPA Region 10 Office of Environmental Assessment March 2006
i
Ecological Condition of the Estuaries of Oregon and Washington an Environmental Monitoring and Assessment Program (EMAP) Report
Authors: Gretchen Hayslip1, Lorraine Edmond1, Valerie Partridge2, Walt Nelson3, Henry Lee3, Faith Cole3, Janet Lamberson3 , and Larry Caton4
March 2006 1 U.S. Environmental Protection Agency, Region 10, Seattle, Washington 2 Washington State Department of Ecology, Environmental Assessment Program, Olympia, Washington 3 U.S. Environmental Protection Agency, Office of Research and Development, Western Ecology Division, Newport, Oregon 4 Oregon Department of Environmental Quality, Portland, Oregon U.S. Environmental Protection Agency, Region 10 Office of Environmental Assessment 1200 Sixth Avenue Seattle, Washington 98101 Publication Number: EPA 910-R-06-001 Suggested Citation: Hayslip, G., L. Edmond, V. Partridge, W. Nelson, H. Lee, F. Cole, J. Lamberson , and L. Caton. 2006. Ecological Condition of the Estuaries of Oregon and Washington. EPA 910-R-06-001. U.S. Environmental Protection Agency, Office of Environmental Assessment, Region 10, Seattle, Washington.
EPA Region 10 Office of Environmental Assessment March 2006
ii
(blank page)

EPA Region 10 Office of Environmental Assessment March 2006
iii
Acknowledgments Western Coastal EMAP relies on the cooperation of federal, state and local agencies. Special recognition for their efforts is due the following participants: Washington Department of Ecology Casey Cliche Christina Ricci Margaret Dutch Kathy Welch Ken Dzinbal Oregon Department of Environmental Quality Mark Bautista Greg McMurray Greg Coffeen Greg Pettit Curtis Cude Chris Redmond Paula D’Alfonso Crystal Sigmon RaeAnn Haynes Daniel Sigmon Dan Hickman Scott Sloane Bob McCoy National Oceanic and Atmospheric Administration National Marine Fisheries Service, Northwest Fisheries Science Center Bernie Anulacion Leslie Kubin Jon Buzitis Dan Lomax Tracy Collier Mark Myers Alison Geiselbrecht Paul Olson Andy Hall Sean Sol Larry Hufnagle U.S. Environmental Protection Agency Region 10 Dave Terpening Doc Thompson Office of Research and Development Tony Olsen Steve Hale John Macauley Indus Corporation Patrick Clinton

EPA Region 10 Office of Environmental Assessment March 2006
iv
(blank page)

EPA Region 10 Office of Environmental Assessment March 2006
v
Table of Contents I. INTRODUCTION.............................................................................................................................1 A. Background............................................................................................................................1 B. Objectives..............................................................................................................................2 II. METHODS........................................................................................................................................3 A. Design ...................................................................................................................................3 B. Indicators...............................................................................................................................5 1. Field Methods............................................................................................................7 2. Laboratory Methods..................................................................................................9 3. Data Analysis Methods.............................................................................................9 III. RESULTS........................................................................................................................................11 A. Water Physical/Chemical Parameters..................................................................................11 1. Water Clarity............................................................................................................11 2. Dissolved Oxygen....................................................................................................11 3. Nutrients...................................................................................................................12 4. TSS...........................................................................................................................13 B. Sediment Characteristics......................................................................................................14 1. Silt-Clay Content......................................................................................................14 2. Total Organic Carbon...............................................................................................15 3. Metals.......................................................................................................................15 4. Polynuclear aromatic hydrocarbons (PAH) ............................................................16
5. PCBs (Polychlorinated Biphenyls) .........................................................................16 6. Pesticides..................................................................................................................17
C. Toxicity................................................................................................................................18 1. Acute sediment toxicity tests....................................................................................18
D. Chemicals in Fish Tissue......................................................................................................19 1. Metals.......................................................................................................................19 2. Pesticides..................................................................................................................21 E. Benthic Invertebrates...........................................................................................................22 1. Benthic abundance...................................................................................................22 2. Benthic species richness/diversity............................................................................22 F. Fish ......................................................................................................................................24 G. Non-indigenous species.......................................................................................................26 IV. CONCLUSIONS..............................................................................................................................27 A. Water Physical/Chemical Indicators....................................................................................27 B. Sediment Characteristics......................................................................................................28 C. Chemicals in Fish Tissue.....................................................................................................29 D. Non-Indigenous Species (NIS) ...........................................................................................29 E. Summary..............................................................................................................................29 V. REFERENCES................................................................................................................................31
EPA Region 10 Office of Environmental Assessment March 2006
vi
VI. APPENDICES..................................................................................................................................34 Appendix 1. Site location information..........................................................................................34 Appendix 2. Chemicals measured in sediments and fish tissues..................................................40 Appendix 3. Summary statistics for water chemistry and habitat indicators…............................41 Appendix 4. Summary statistics for sediment characteristics.......................................................42 Appendix 5. Summary statistics for contaminants in fish tissue..................................................44 Appendix 6. Benthic invertebrate species from 1999-2000.........................................................46 Appendix 7. Fish species from 1999-2000...................................................................................69

EPA Region 10 Office of Environmental Assessment March 2006
vii
List of Figures Figure 1. Example Cumulative Distribution Function (CDF).............................................................10 Figure 2. CDF of Water Clarity...........................................................................................................11 Figure 3. CDF of Secchi Depth...........................................................................................................11 Figure 4. CDF of Bottom Dissolved Oxygen......................................................................................11 Figure 5. CDF of Surface Dissolved Oxygen......................................................................................12 Figure 6. CDF of Total Dissolved Inorganic Nitrogen........................................................................12 Figure 7. CDF of Soluble Phosphorus.................................................................................................12 Figure 8. CDF of Mean Chlorophyll a................................................................................................13 Figure 9. CDF of N:P Ratio.................................................................................................................13 Figure 10. CDF of Total Suspended Solids...........................................................................................13 Figure 11. CDF of Percent Silt-Clay.....................................................................................................14 Figure 12. CDF of Total Organic Carbon.............................................................................................15 Figure 13. CDF of Total PAHs.............................................................................................................16 Figure 14. % of Estuarine Area with Pesticides Detected in the Sediments.........................................17 Figure 15. CDF of Total DDT...............................................................................................................18 Figure 16. CDF of Toxicity Testing......................................................................................................18 Figure 17. CDF of Inorganic Arsenic in Fish Tissue............................................................................19 Figure 18. CDF of Mercury in Fish Tissue...........................................................................................20 Figure 19. CDF of Zinc in Fish Tissue.................................................................................................20 Figure 20. CDF of DDT in Fish Tissue.................................................................................................21 Figure 21. CDF of Number of Benthic Organisms per 0.1 m2 (Abundance).......................................22 Figure 22. CDF of Number of Benthic Species....................................................................................22 Figure 23. Most Common Benthic Invertebrates.................................................................................23 Figure 24. Fish Species Found at all Sites............................................................................................24 Figure 25. Most Commonly Found Fish at Marine, Freshwater and Intermediate Sites......................25 Figure 26. Extent of NIS Invasion in the Estuaries of Oregon and Washington..................................26 Figure 27. Summary of Sediment Contamination.................................................................................28 Figure 28. Summary of Chemicals in Fish Tissue................................................................................29 Figure 29. Overall Condition of the Estuarine Area of Oregon and Washington for Selected Indicators..............................................................................................................................30 List of Tables Table 1. Selected Coastal EMAP Indicators........................................................................................6 Table 2. Station Total Depth and CTD Sampling Depths ...................................................................7 Table 3. Station Depth and Discrete Water Sampling Depths.............................................................7 Table 4. Selected Metals in Sediments of the Estuaries of Oregon and Washington........................15 Table 5. Selected Contaminants in Fish Tissue in the Estuaries of Oregon and Washington...........19 Table 6. Criteria for Assessing Nutrients...........................................................................................28 List of Maps Map 1. Coastal EMAP Sampling Locations, 1999-2000.................................................................4 Map 2. Sites that Exceed the Toxic Screening Criteria (TSC) for Mercury....................................20 Map 3. Sites that Exceed the Toxic Screening Criteria (TSC) for Zinc..........................................21 Map 4. Sites that Exceed the Toxic Screening Criteria (TSC) for DDT.........................................21

EPA Region 10 Office of Environmental Assessment March 2006
viii
(blank page)

EPA Region 10 Office of Environmental Assessment March 2006
1
Photo: Harold W. Streeter, NOAA/NMFS vessel used by Washington Department of Ecology in 2000. I. INTRODUCTION Estuaries are bodies of water that receive freshwater and sediment from rivers and saltwater from the oceans. They are transition zones between the fresh water of a river and the salty environment of the sea. This interaction produces a unique environment that supports wildlife and fisheries and contributes substantially to the ecology and economy of coastal areas. Recent studies have shown that growth of the human population is concentrated in the coastal areas (Culliton, 1990). This population growth in the coastal areas of the west is a principal driver for many stresses to the ecosystem such as habitat loss, pollution, and nutrient enhancement. These stressors can affect the sustainability of coastal ecological resources (Copping and Bryant, 1993). Increased globalization of the economy is a major influence in the introduction of exotic species into port and harbors. Major environmental policy decisions at local, state and federal levels will determine the future for estuarine conditions of the western U.S. Information on the ecological condition of estuaries is essential to these policy decisions.
The overall quality of estuaries in Oregon and Washington is described in this report using data collected as part of the Western Environmental Monitoring and Assessment Program (EMAP). In EPA Region 10, Western EMAP is a cooperative effort between the Environmental Protection Agency (EPA) Office of Research and Development (ORD), EPA Region 10, the Washington Department of Ecology (Ecology), the Oregon Department of Environmental Quality (ODEQ), the National Oceanographic and Atmospheric Administration (NOAA) and others. Much of this report is based on work by ODEQ (Sigmon, 2004), Ecology (Wilson and Partridge, 2005) and EPA ORD (Nelson, 2005 and U.S. EPA, 2004). A. Background
EMAP (Environmental Monitoring and Assessment Program) was initiated by EPA's Office of Research and Development (ORD) to estimate the current status and trends in the condition of nation's ecological resources. EMAP also examines associations between these indicators and natural and human caused stressors. This information will assist the EPA and States/Tribes as the Clean Water Act (CWA) directs them to develop programs that evaluate, restore and maintain the chemical, physical and biological integrity of the Nation's waters. The data collected during this survey can also be used to examine the relationships between environmental stressors and the condition of ecological resources The coastal component of Western EMAP applies EMAP’s monitoring and assessment tools to create an integrated and comprehensive coastal monitoring program along the west coast. Water column measurements are combined with information about sediment characteristics and chemistry, benthic organisms, and fish to describe the current estuarine condition. Sampling began during the summer of 1999, with small estuaries of Oregon and Washington.
EPA Region 10 Office of Environmental Assessment March 2006
2
In 2000, sampling continued with the larger estuaries of Oregon and Washington (Puget Sound and the Columbia River estuary). The boundary for the Columbia River estuary was head of tidal influence, so there were some freshwater components of this sampling effort. This report provides a summary of the data from 1999-2000 sampling for the small and large estuarine systems of the states of Washington and Oregon.
B. Objectives
The overall objectives of this project are: • to describe the current ecological
condition of estuaries in Washington and Oregon based on a range of indicators of environmental quality using a statistically based survey design;
• to establish a baseline for evaluating how the conditions of the estuarine resources change in the future;
• to develop and validate improved methods for use in future coastal monitoring and assessment efforts in the western coastal states;
• to transfer the technical approaches and methods for designing, conducting and analyzing data from statistically based environmental assessments to the states and others;
• to work with the states and others to build a strong program of water monitoring which will lead to better management and protection of western estuaries.
EPA Region 10 Office of Environmental Assessment March 2006
3
II. METHODS The Washington Department of Ecology (Ecology), and the Oregon Department of Environmental Quality (ODEQ) conducted all field sampling for this project in 1999-2000 with assistance from EPA Region 10 and the National Marine Fisheries Service (NMFS).
The goal of EMAP is to develop ecological monitoring and assessment methods that advance the science of measuring environmental resources to determine if they are in an acceptable or unacceptable condition. Two major features of EMAP are:
• the probability-based selection of sample sites and
• the use of ecological indicators.
A. Design - How to Select Estuarine Sites to Sample Environmental monitoring and assessments are typically based on subjectively selected sampling sites. EMAP provides an alternative method of sample site selection for large scale monitoring. Peterson (1998; 1999) compared subjectively selected localized lake data with EMAP probability-based sample selection and showed the results for the same area to be substantially different. The primary reason for these differences was lack of regional sample representativeness of subjectively selected sites. Coastal studies have been plagued by the same problem. A more objective approach is needed to assess overall estuarine quality on a regional scale. In addition, it is generally impossible to completely census an extensive resource, such as the set of all estuaries on the west coast. A more practical approach to evaluating resource condition is to sample selected portions of the resource using probability-based sampling.
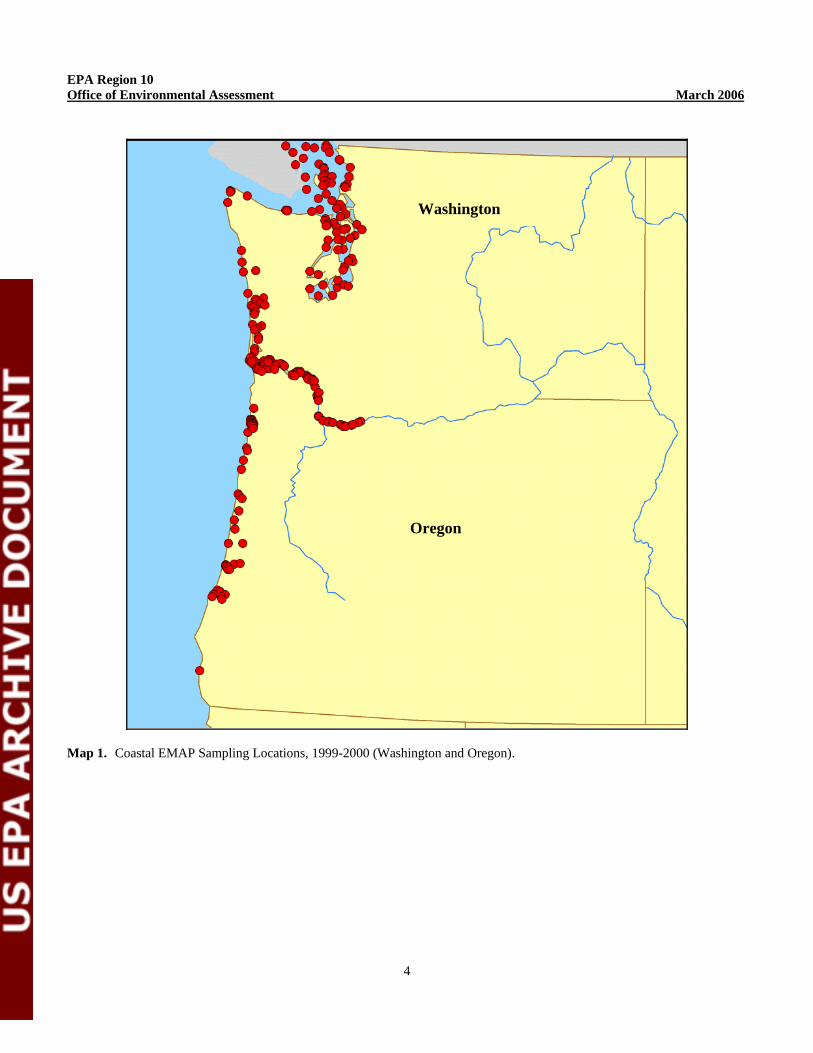
Designing a probability-based survey begins with creating a list of all units of the target population from which to select the sample and selecting a random sample of units (places to collect data) from this list. The list or map that identifies every unit within the population of interest is termed the sampling frame. Studies based on random samples of the resource rather than on a complete census are termed sample or probability-based surveys. Probability-based surveys offer the advantages of being affordable, and of allowing extrapolations to be made of the overall condition of the resource based on the random samples collected. These methodologies are widely used in national programs such as forest inventories, consumer price index, labor surveys, and such activities as voter opinion surveys. A probability-based survey design provides the approach to selecting samples in such a way that they provide valid estimates for the entire resource of interest, in this case the estuaries of Oregon and Washington. Therefore, the results in this document will be reported in terms of the percent of estuarine area of Oregon and Washington. The sampling frame for the EMAP Western Coastal Program was developed from USGS 1:100,000 scale digital line graphs and stored as a GIS data layer in ARC/INFO program. Additional details are described in Diaz-Ramos (1996), Stevens (1997), and Stevens and Olsen (1999). The assessment of condition of small estuaries conducted in 1999 was the first phase of a two- year comprehensive assessment of all estuaries of the states of Washington and Oregon. The complete assessment requires the integrated analysis of data collected from the small estuarine systems in 1999 and the larger estuarine systems in 2000 (Map 1). The intent of the design is to be able to combine data from all stations for analysis. The West Coast sampling
EPA Region 10 Office of Environmental Assessment March 2006
4
Oregon
Washington
Map 1. Coastal EMAP Sampling Locations, 1999-2000 (Washington and Oregon).

EPA Region 10 Office of Environmental Assessment March 2006
5
frame was constructed as a GIS coverage that included the total area of the estuarine resource of interest. The estuarine area of Oregon and Washington represented by this report is 8670 square kilometers (or 3348 square miles). For the state of Washington, the 1999 design included only small estuaries along the coastline outside of the Puget Sound system, and consisted of a total of 50 sites (Appendix 1). Tributary estuaries of the Columbia River located within Washington state were included in the 1999 sampling effort, while the main channel area was not sampled until 2000 (as part of the 2000 Oregon design). The Washington 2000 sampling design included only the large “estuary” of Puget Sound and its tributaries. Site selection for this estuary used a combined approach in order to allow collaboration with a survey previously conducted by National Oceanographic and Atmospheric Administration (NOAA) under the NOAA National Status and Trends Program. The overall design combined the existing NOAA probability based monitoring design with the EMAP Western Coastal study design. The EMAP grid was extended to include Canadian waters at the north end of Puget Sound, and then was overlaid on the existing NOAA monitoring sites. There were 41 stations selected based on the NOAA sampling stations, in addition to 30 new EMAP stations, of which 10 were associated with the San Juan Islands (Appendix 1). The Oregon 1999 design included only small estuaries of the state and consisted of 50 sites (Appendix 1). Tributary estuaries of the Columbia River located within Oregon were included in the 1999 sampling effort, while the main channel area was not sampled until 2000. An intensive sampling effort was designed for Tillamook Bay, where 30 sites were selected (Appendix 1).
The Oregon 2000 design included only the main channel area of the Columbia River. The Columbia River system was split into two subpopulations: the lower, saline portion and the upper, more freshwater portion, with a total of 20 and 30 sites, respectively (Appendix 1). All sites from both states and for both years were combined for analysis in this report to represent the entire 8670 square kilometers of estuaries in Oregon and Washington. Of these, 710 square kilometers are in Oregon and 7960 square kilometers are in Washington.
B. Indicators - What to Assess at Each Selected Site
The objective of the Clean Water Act is to restore and maintain the chemical, physical and biological integrity of the Nation's waters. Therefore, in order to assess the nation’s waters, it is important to measure chemical (including sediment chemistry and fish tissue contaminants), physical (such as water clarity, and silt-clay content) and biological condition (fish and invertebrate communities, and toxicity testing). Coastal EMAP uses ecological indicators to quantify these conditions. Indicators are measurable characteristics of the environment, both abiotic and biotic, that can provide information on ecological resources. There is a great deal of information collected as part of Coastal EMAP. Table 1 shows the selected core EMAP coastal indicators. For a list of the chemical analytes for sediment and tissue samples, see Appendix 2. In the following section, we will give an overview of the methods for those indicators that we describe in the results and discussion sections of this report. Additional detailed information on field and laboratory methods is available in U.S. EPA, 2001.

EPA Region 10 Office of Environmental Assessment March 2006
6
Indicator Rationale Water Column Indicators Water Clarity Clear waters are valued by society and contribute to the maintenance of healthy and productive
ecosystems. Light penetration into estuarine waters is important for submerged aquatic vegetation which serves as food and habitat for the resident biota.
Dissolved oxygen
Dissolved oxygen (DO) in the water column is necessary for all estuarine life. Low levels of oxygen (hypoxia) or lack of oxygen (anoxia) often accompany the onset of severe bacterial degradation, sometimes resulting in the presence of algal scums and noxious odors. In severe cases, low DO can lead to the death of large numbers of organisms.
Dissolved nutrients (Nitrogen and Phosphorus)
Dissolved inorganic nitrogen and dissolved inorganic phosphorous are necessary and natural nutrients required for the growth of phytoplankton. However, excessive dissolved nutrients can result in large, undesirable phytoplankton blooms.
Total Suspended Solids
Total suspended solids (TSS) refers to the matter that is suspended in water. TSS can be a useful indicator of the effects of runoff from construction, agricultural practices, logging activity, discharges, and other sources.
Sediment Indicators Silt-Clay Content
The percentage of particles present in bottom sediments that are silt and clay is an important factor determining the composition of the biological community. It is an important factor in the adsorption of contaminants to sediment particles and therefore for the exposure of organisms to contaminants.
Sediment contaminants
A wide variety of metals and organic substances are discharged into estuaries from urban, agricultural, and industrial sources in the watershed. The contaminants adsorb onto suspended particles that settle to the bottom, disrupt the benthic community and can concentrate in the tissue of fish and other organisms.
Sediment toxicity testing
A standard direct test of toxicity is to measure the survival of amphipods (commonly found, shrimp-like benthic crustaceans) exposed to sediments for 10 days under laboratory conditions.
Biological Indicators Benthic organisms
The organisms that inhabit the bottom substrates of estuaries are collectively called benthic macroinvertebrates or benthos. These organisms are an important food source for bottom-feeding fish, shrimp, ducks, and marsh birds. Benthic organisms are sensitive indicators of human-caused disturbance and serve as reliable indicators of estuarine environmental quality. We also examine which species are Non-Indigenous species (NIS).
Fish-tissue contaminants
Chemical contaminants may enter an organism in several ways: uptake from water, sediment, or previously contaminated organisms. Once these contaminants enter an organism, they tend to build up. When fish consume contaminated organisms, they may “inherit” the levels of contaminants in the organisms they consume. This same “inheritance” of contaminants occurs when other biota (such as birds) consume fish with contaminated tissues. The technical term for this is bioaccumulation.
Table 1. Selected Coastal EMAP Indicators

EPA Region 10 Office of Environmental Assessment March 2006
7
1. Field Methods Detailed descriptions of the field methods are available in the “Environmental Monitoring and Assessment Program (EMAP): National Coastal Assessment Quality Assurance Project Plan 2001-2004" (U.S. EPA, 2001). The discussion below is a very brief summary of the methods used for the indicators that will be evaluated in this report.
Photo: Example of water sampler
Water Column Water depth, salinity, conductivity, temperature, pH and DO data were collected using an electronic instrument called a Conductivity Temperature Depth recorder (CTD), that takes measurements from the surface to the bottom of the water column. Photosythetically available radiation (PAR) was measured with LiCor® PAR sensors. The CTD and underwater PAR sensor were mounted for water column profiling. Water quality indicators were recorded with the CTD at discrete depth intervals, depending on the total station depth (Table 2).
Total Depth (m) Sample Depth Increment < 1.5 Mid-depth < 2 Every 0.5m > 2 and < 10 0.5m,
Every 1m, 0.5 off bottom
> 10 0.5m, Every 1m up to 10m, Every 5m to 0.5m off bottom
Table 2. Station Total Depth and CTD Sampling Depths Near-bottom measurements were taken after a three minute delay in the event that the sediment surface had been disturbed. Data were recorded for descending and ascending profiles. Secchi depth was recorded as the water depth at which a standard 20cm diameter black-and-white Secchi disc could be seen during ascent. Discrete water samples were collected with bottles at one to three depths, which corresponded with the CTD and PAR measurement depths (Table 3). Water grab samples were analyzed for dissolved nutrients [forms of Nitrogen (Nitrate, Nitrite, Ammonium), and Phosphorus], Total Suspended Solids and Chlorophyll a.
Total Depth (m) Discrete Sample depth < 1.5 Mid-depth > 1.5 to < 2 0.5m
0.5m off bottom > 2 0.5m
Mid-depth 0.5m off bottom
Table 3. Station Depth and Discrete Water Sampling Depths Sediment Sediment samples were collected with a 0.1-m2
Van Veen grab sampler. All sediment sampling gear was decontaminated and rinsed with site water prior to sample collection. Acceptable grabs were > 7 cm penetration, not canted, not overflowing, not washed out, and had an undisturbed sediment surface. Water overlying the sediment grab, if present, was siphoned off without disturbing the surface. The top 2-3 cm of sediment were removed with a stainless steel spoon and transferred to a decontaminated container. Sediments from a minimum of three grabs were composited to collect approximately
EPA Region 10 Office of Environmental Assessment March 2006
8
6 liters of sediment. Most sites required from 6 to 9 grabs. Once adequate sediment was collected, it was homogenized and transferred to clean jars, stored on wet ice and later refrigerated or frozen until analysis. Benthic Invertebrates Sediment samples to enumerate the benthic infauna were collected using a 0.1-m2 Van Veen grab sampler. After collection, infauna were sieved through nested 1.0-mm and 0.5-mm mesh sieves using site water supplied by an adjustable flow hose. Material caught on the screens was fixed with 10% phosphate-buffered formalin. Samples were re-screened and preserved with 70% ethanol within two weeks of field collection. The 0.5 mm fraction was archived, and the 1.0 mm fraction was shipped for sorting and taxonomic identification. Fish TrawlsBottom trawls were conducted using a 16-foot otter trawl with a 1.25-inch mesh net. Trawls were intended to retrieve demersal fishes (fish living on or near the bottom) and benthic invertebrates. Trawling was performed after water quality and sediment sampling were completed. Fish were obtained by hook and line techniques at sites where trawling was not feasible due to safety and/or logistical concerns. The catch was brought on board, put alive into wells containing fresh site water and immediately sorted and identified. Information was recorded on species, fish length and number of organisms. All fish not retained for tissue chemistry or to study their diseased tissue (histopathology) or were returned to the estuary.
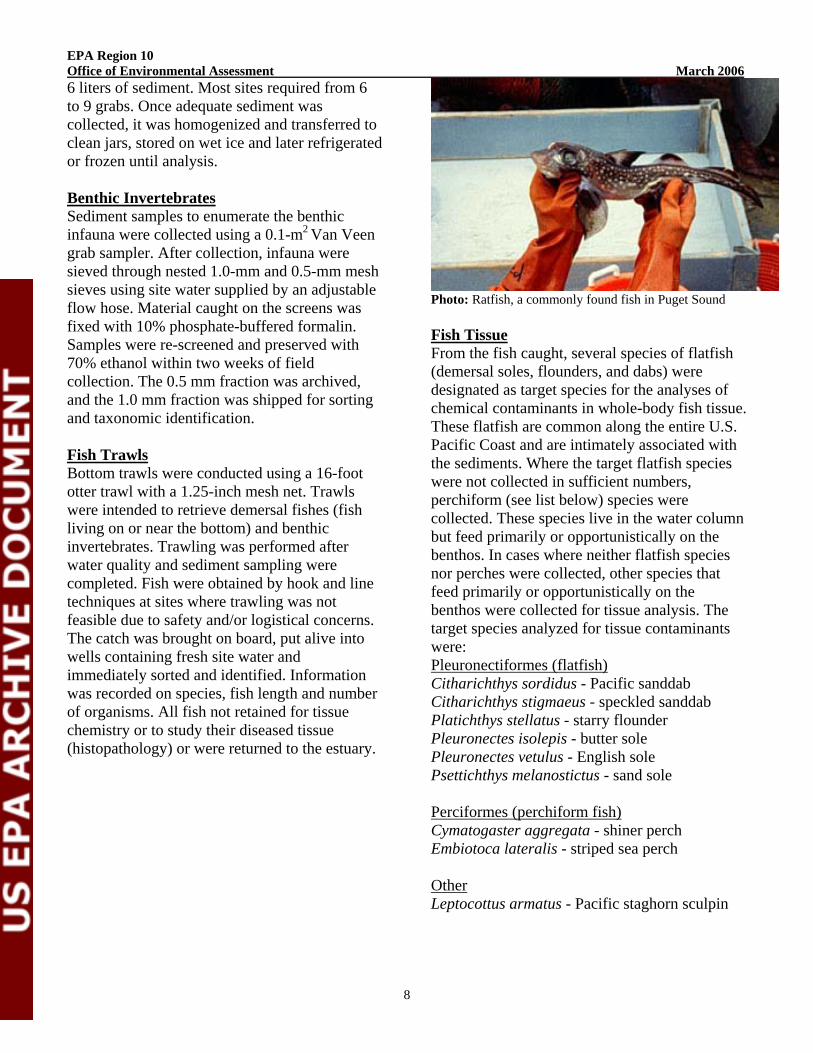
Photo: Ratfish, a commonly found fish in Puget Sound
Fish Tissue From the fish caught, several species of flatfish (demersal soles, flounders, and dabs) were designated as target species for the analyses of chemical contaminants in whole-body fish tissue. These flatfish are common along the entire U.S. Pacific Coast and are intimately associated with the sediments. Where the target flatfish species were not collected in sufficient numbers, perchiform (see list below) species were collected. These species live in the water column but feed primarily or opportunistically on the benthos. In cases where neither flatfish species nor perches were collected, other species that feed primarily or opportunistically on the benthos were collected for tissue analysis. The target species analyzed for tissue contaminants were: Pleuronectiformes (flatfish) Citharichthys sordidus - Pacific sanddab Citharichthys stigmaeus - speckled sanddab Platichthys stellatus - starry flounder Pleuronectes isolepis - butter sole Pleuronectes vetulus - English sole Psettichthys melanostictus - sand sole Perciformes (perchiform fish) Cymatogaster aggregata - shiner perch Embiotoca lateralis - striped sea perch Other Leptocottus armatus - Pacific staghorn sculpin

EPA Region 10 Office of Environmental Assessment March 2006
9
Target species were used for whole-body tissue contaminant analyses. Individuals of a single species (ideally 5-10 fish) were combined for a single composite sample. Approximately 200-300 grams of tissue (wet weight) is needed to complete all analysis, but a minimum of 50 grams of tissue is required for mercury analysis. 2. Laboratory Methods The detailed quality assurance/quality control (QA/QC) program and laboratory methods for the Western Coastal EMAP program are outlined in “Environmental Monitoring and Assessment Program (EMAP): National Coastal Assessment Quality Assurance Project Plan 2001-2004" (U.S. EPA, 2001). The methods are described briefly below. Water Discrete water samples were analyzed by the state environmental labs (Oregon DEQ and Ecology/University of Washington). Sediment Chemistry Sediment samples for chemical analysis were taken from the same sediment composite used for the sediment toxicity tests. Approximately 250-300 ml of sediment was collected from each station for analysis of the organic pollutants and another 250-300 ml for analysis of the total organic carbon (TOC) and metals (Appendix 2). The analytical methods are those used in the NOAA NS&T Program (Lauenstein, 1993) or documented in the EMAP-E Laboratory Methods Manual (U.S. EPA, 1994a). Fish Tissue Organic and metal contaminants were measured in the whole-body tissues of the species of fish listed above (Section II.B.1). Chemical residues in fish tissue (Appendix 5) were determined for each of the composited tissue samples. Quality control procedures for the tissue analysis were similar to those described above for sediments and followed the procedures detailed in U.S. EPA (1994a and 2001), including the use of certified reference materials, spikes, duplicates, and blanks.
Sediment Physical Parameters Sediment silt-clay and TOC were analyzed by the State labs (Oregon and Washington). Grain size analysis was by dry and wet sieving. Sediment digestion for TOC analysis was by acidification and combustion.
Amphipod Sediment Toxicity Tests The 10-day, solid-phase toxicity test with the marine amphipod Ampelisca abdita was used to evaluate potential toxicity of sediments from all sites. Mortality, and emergence from the sediment during exposure were the exposure criteria used. All bioassay tests were performed within 28 days of field collection using the benthic amphipod Ampelisca abdita. Amphipod toxicity tests were performed with the species Hyalella azteca, for the 30 freshwater sites in the Columbia in 2000. Procedures followed the general guidelines provided in ASTM Protocol E-1367-92 (ASTM 1993) and the EMAP-E Laboratory Methods Manual (U.S. EPA, 1994a). Benthic Invertebrates Benthic infauna data were processed according to protocols described in the EMAP lab method manual (U.S. EPA, 1994a). Both indigenous and exotic organisms were identified to the lowest practical taxonomic level (species where possible).
3. Data Analysis Methods In this report, the primary method for evaluating indicators for sites selected using the EMAP probability design is the cumulative distribution function (CDF). A CDF is a graph that shows the distribution of indicator or parameter data accumulated over the entire “population” of concern. The “population” in this report is generally the total area of the estuaries of Oregon and Washington. The EMAP statistical designs allows for extrapolation from data collected at specific sites to the entire “population”, in this case the estuaries of Oregon and Washington. For example, if an indicator value above 3 is considered “impaired,” then Figure 1 (CDF) shows that approximately 60 percent of the area

EPA Region 10 Office of Environmental Assessment March 2006
10
of the estuaries of Oregon and Washington exceed that threshold (and the other 40% of the estuary area is below 3). The EMAP design also allows for the calculation of confidence intervals for CDFs. For example, we could say that 60% of the area of the estuaries of Oregon and Washington exceed some threshold, plus or minus 8%. However, for ease of reading the CDFs, we did not include the confidence intervals for the graphs in this document. The CDF below is just an introductory example. The 50% line marked on all of the CDFs in this report, including the one below, is just a marker and not an ecologically important criterion.
0
50
100
0 10 20 30 40Example Indicator
Perc
ent E
stua
rine
Are
a
Figure 1. Example Cumulative Distribution Function (CDF).

EPA Region 10 Office of Environmental Assessment March 2006
11
III. RESULTS In this section of the report we will describe the overall condition of the estuaries of Oregon and Washington based on analysis of data collected from over 200 randomly selected sites (Map 1) using the EMAP protocols (described in Section II). We are able to present only a portion of the indicators that were generated from the field data due to the large volume of information that was collected. Additional indicators are summarized in the Appendices. A. Water Physical/Chemical Parameters 1. Water Clarity
Light transmissivity The extent of light transmittance or attenuation at a given water depth is a function of the amount of ambient light and water clarity, with the latter affected by the amount of dissolved and particulate constituents in the water. Light transmissivity, the percent of light transmitted at 1m, in the estuaries of Oregon and Washington ranged from 0 to 87.6 percent (mean 17.7 percent) across the 224 stations where light transmissivity was measured (Figure 2).
0
50
100
0 20 40 60 80 100Light Transmission at 1 m (%)
Perc
ent E
stua
rine
Are
a
Figure 2. CDF of Water Clarity.
Secchi Depth Secchi depth in the estuaries of Oregon and Washington ranged from 0.1 meters to 12.5
meters (mean 2.9 meters) across the 238 stations where Secchi depth was measured (Figure 3).
0
50
100
0 5 10 15Secchi Depth (m)
Perc
ent E
stua
rine
Are
a
Figure 3. CDF of Secchi Depth.
2. Dissolved Oxygen Dissolved oxygen is necessary for all estuarine life. Dissolved oxygen (DO) concentrations in the bottom water for the estuaries of Washington and Oregon ranged from 0.12 mg/L to 11.5 mg/L (mean 7.355), across the 242 stations of the total estuarine where bottom dissolved oxygen concentrations were measured (Figure 4).
0
50
100
0 5 10 15Bottom Dissolved Oxygen (mg/l)
Perc
ent E
stua
rine
Are
a
Figure 4. CDF of Bottom Dissolved Oxygen. Surface dissolved oxygen (DO) concentrations in the estuaries of Oregon and Washington ranged from 3.4 mg/L to 11.5 mg/L (mean 8.2 mg/l) across the 242 stations where surface dissolved oxygen concentrations were measured (Figure 5).

EPA Region 10 Office of Environmental Assessment March 2006
12
0
50
100
0 5 10 15Surface Dissolved Oxygen (mg/l)
Perc
ent E
stua
rine
Are
a
Figure 5. CDF of Surface Dissolved Oxygen.
3. Nutrients Nutrients are chemical substances used by organisms for maintenance and growth, that are critical for survival. Plants require a number of nutrients. Of these, nitrogen and phosphorus are of particular concern in estuaries for two reasons: they are two of the most important nutrients essential for the growth of aquatic plants, and the amount of these nutrients being delivered to estuaries is increased by many human activities. Eutrophication is a condition in which high nutrient concentrations stimulate excessive algal blooms, which then deplete oxygen as they decompose. Estuaries with insufficient mixing may become hypoxic (low in oxygen) and under the worst conditions, the bottom waters of an estuary turn anoxic (without oxygen). Nutrient concentrations were measured at the surface, middle and bottom of the water column at 243 stations. The following graphs represent the mean of the three depths at each station. The relationship between nitrogen and phosphorus (N:P ratio) can provide insights into which of these nutrients is limiting. Total dissolved inorganic nitrogen concentrations ranged from 0 to 2045 ug/L for the sites sampled. The three depths showed a similar distribution, but bottom and midwater samples generally had higher total nitrogen concentrations than did the surface samples.
About half of the estuary area had less than 238 ug/L total dissolved inorganic nitrogen (Figure 6) for the mean of the three depths at each station.
0
50
100
0 100 200 300 400Total Dissolved Inorganic Nitrogen (ug/l)
Perc
ent E
stua
rine
Are
a
Figure 6. CDF of Total Dissolved Inorganic Nitrogen. Soluble phosphorus concentrations ranged from 0 to 106.5 ug/L (Figure 7). About half of the estuarine area had soluble phosphorus concentrations less than 51.3 ug/L for the mean of the three depths at each station.
0
50
100
0 50 100 150Soluble Phosphorous (ug/l)
Perc
ent E
stua
rine
Are
a
Figure 7. CDF of Soluble Phosphorus. Phytoplankton are microscopic plants common to estuarine waters. Phytoplankton are primary producers of organic carbon and form the base of the estuary food chain. One procedure for determining the abundance of phytoplankton is to measure the amount of the photosynthetic pigment chlorophyll a that is present in water samples. Chlorophyll is a pigment common to all

EPA Region 10 Office of Environmental Assessment March 2006
13
photosynthetic algae, and its amount in the water is in relation to the algal concentration. Chlorophyll a concentrations ranged from 0 to 31.1 ug/L (Figure 8). About one-half of the estuary area had less than 3.1 ug/L for the mean of the three depths at each station.
0
50
100
0 10 20 30Mean Chlorophyll a (ug/l)
Perc
ent E
stua
rine
Are
a
40
Figure 8. CDF of Mean Chlorophyll a. Molar nitrogen to phosphorus ratios (N:P) ranged from 0.16 to 179 (Figure 9) for the mean of the three depths at each station. Essentially all of the estuary area had N:P < 16, which may indicate that production of phytoplankton at these sites is nitrogen limited.
0
50
100
0 50 100 150 200N:P Ratio
Perc
ent E
stua
rine
Are
a
Figure 9. CDF of N:P Ratio. 4. TSS Suspended materials include soil particles (clay and silt), algae, plankton, and other substances. Total suspended solids (TSS) refer to the matter
that is suspended in water. The solids in water have different attributes and sizes. Total suspended solids often increase sharply during and immediately following rainfall, especially in developed watersheds, which typically have relatively high proportions of impervious surfaces such as rooftops, parking lots, and roads. The flow of stormwater runoff from impervious surfaces rapidly increases stream velocity, which increases the erosion rates of streambanks and channels (U.S. EPA, 1993b). Some of the physical effects of above normal suspended materials include:
• clogged fish gills, inhibiting the exchange of oxygen and carbon dioxide,
• reduced resistance to disease in fish, • reduced growth rates, • altered egg and larval development, • fouled animal filter-feeding systems, and, • hindered ability of aquatic predators from
spotting and tracking down their prey. Higher concentrations of suspended solids can also serve as carriers of toxins, which readily cling to suspended particles. Total Suspended Solids in the estuaries of Oregon and Washington ranged from 0 mg/L to 230 mg/L (mean 10.3 mg/L) across the 244 stations where TSS was measured (Figure 10).
0
50
100
0 100 200 300Mean Total Suspended Solids (mg/l)
Perc
ent E
stua
rine
Are
a
Figure 10. CDF of Total Suspended Solids.
EPA Region 10 Office of Environmental Assessment March 2006
14
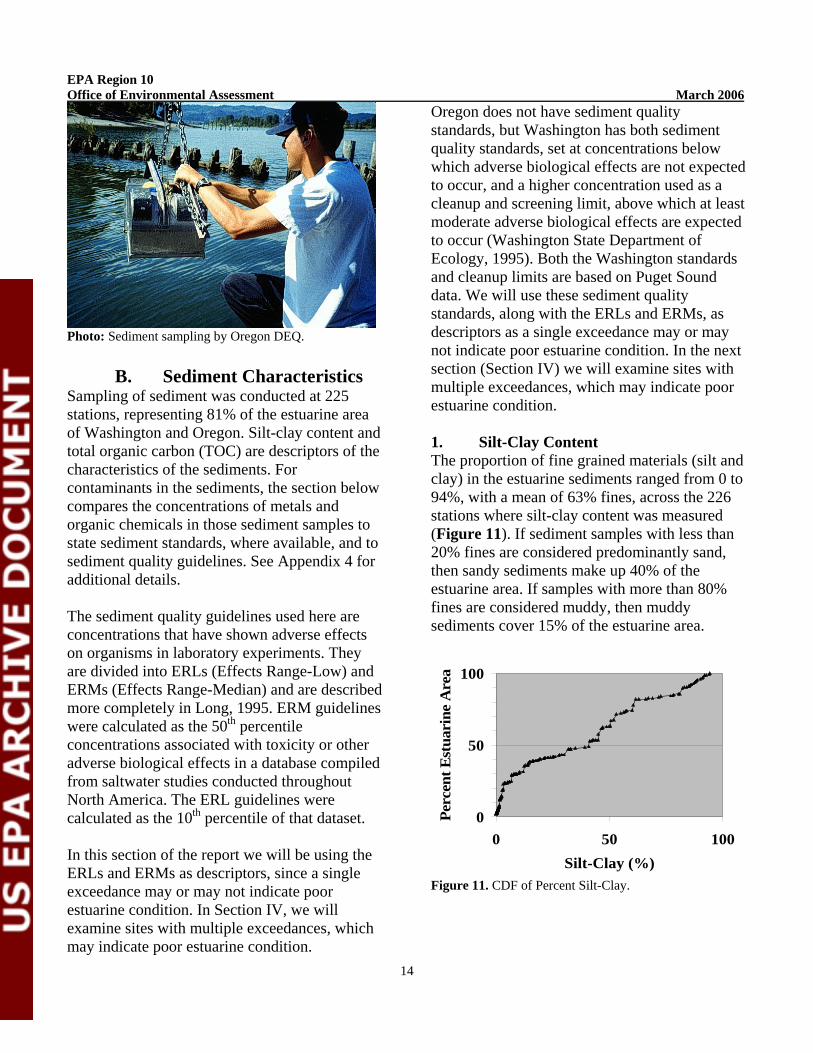
Photo: Sediment sampling by Oregon DEQ. B. Sediment Characteristics Sampling of sediment was conducted at 225 stations, representing 81% of the estuarine area of Washington and Oregon. Silt-clay content and total organic carbon (TOC) are descriptors of the characteristics of the sediments. For contaminants in the sediments, the section below compares the concentrations of metals and organic chemicals in those sediment samples to state sediment standards, where available, and to sediment quality guidelines. See Appendix 4 for additional details. The sediment quality guidelines used here are concentrations that have shown adverse effects on organisms in laboratory experiments. They are divided into ERLs (Effects Range-Low) and ERMs (Effects Range-Median) and are described more completely in Long, 1995. ERM guidelines were calculated as the 50th percentile concentrations associated with toxicity or other adverse biological effects in a database compiled from saltwater studies conducted throughout North America. The ERL guidelines were calculated as the 10th percentile of that dataset. In this section of the report we will be using the ERLs and ERMs as descriptors, since a single exceedance may or may not indicate poor estuarine condition. In Section IV, we will examine sites with multiple exceedances, which may indicate poor estuarine condition.
Oregon does not have sediment quality standards, but Washington has both sediment quality standards, set at concentrations below which adverse biological effects are not expected to occur, and a higher concentration used as a cleanup and screening limit, above which at least moderate adverse biological effects are expected to occur (Washington State Department of Ecology, 1995). Both the Washington standards and cleanup limits are based on Puget Sound data. We will use these sediment quality standards, along with the ERLs and ERMs, as descriptors as a single exceedance may or may not indicate poor estuarine condition. In the next section (Section IV) we will examine sites with multiple exceedances, which may indicate poor estuarine condition. 1. Silt-Clay Content The proportion of fine grained materials (silt and clay) in the estuarine sediments ranged from 0 to 94%, with a mean of 63% fines, across the 226 stations where silt-clay content was measured (Figure 11). If sediment samples with less than 20% fines are considered predominantly sand, then sandy sediments make up 40% of the estuarine area. If samples with more than 80% fines are considered muddy, then muddy sediments cover 15% of the estuarine area.
0
50
100
0 50 100Silt-Clay (%)
Perc
ent E
stua
rine
Are
a
Figure 11. CDF of Percent Silt-Clay.
EPA Region 10 Office of Environmental Assessment March 2006
15
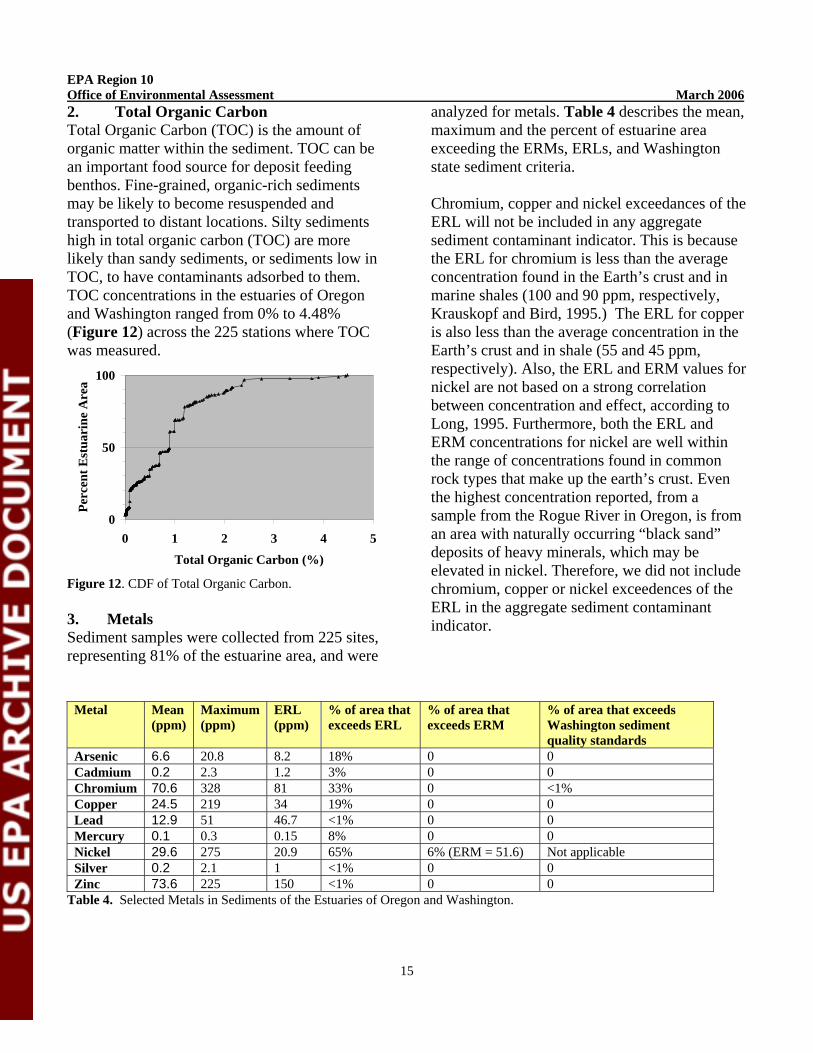
2. Total Organic Carbon Total Organic Carbon (TOC) is the amount of organic matter within the sediment. TOC can be an important food source for deposit feeding benthos. Fine-grained, organic-rich sediments may be likely to become resuspended and transported to distant locations. Silty sediments high in total organic carbon (TOC) are more likely than sandy sediments, or sediments low in TOC, to have contaminants adsorbed to them. TOC concentrations in the estuaries of Oregon and Washington ranged from 0% to 4.48% (Figure 12) across the 225 stations where TOC was measured.
0
50
100
0 1 2 3 4 5Total Organic Carbon (%)
Perc
ent E
stua
rine
Are
a
Figure 12. CDF of Total Organic Carbon. 3. Metals Sediment samples were collected from 225 sites, representing 81% of the estuarine area, and were
analyzed for metals. Table 4 describes the mean, maximum and the percent of estuarine area exceeding the ERMs, ERLs, and Washington state sediment criteria. Chromium, copper and nickel exceedances of the ERL will not be included in any aggregate sediment contaminant indicator. This is because the ERL for chromium is less than the average concentration found in the Earth’s crust and in marine shales (100 and 90 ppm, respectively, Krauskopf and Bird, 1995.) The ERL for copper is also less than the average concentration in the Earth’s crust and in shale (55 and 45 ppm, respectively). Also, the ERL and ERM values for nickel are not based on a strong correlation between concentration and effect, according to Long, 1995. Furthermore, both the ERL and ERM concentrations for nickel are well within the range of concentrations found in common rock types that make up the earth’s crust. Even the highest concentration reported, from a sample from the Rogue River in Oregon, is from an area with naturally occurring “black sand” deposits of heavy minerals, which may be elevated in nickel. Therefore, we did not include chromium, copper or nickel exceedences of the ERL in the aggregate sediment contaminant indicator.
Metal Mean (ppm)
Maximum (ppm)
ERL (ppm)
% of area that exceeds ERL
% of area that exceeds ERM
% of area that exceeds Washington sediment quality standards
Arsenic 6.6 20.8 8.2 18% 0 0 Cadmium 0.2 2.3 1.2 3% 0 0 Chromium 70.6 328 81 33% 0 <1% Copper 24.5 219 34 19% 0 0 Lead 12.9 51 46.7 <1% 0 0 Mercury 0.1 0.3 0.15 8% 0 0 Nickel 29.6 275 20.9 65% 6% (ERM = 51.6) Not applicable Silver 0.2 2.1 1 <1% 0 0 Zinc 73.6 225 150 <1% 0 0
Table 4. Selected Metals in Sediments of the Estuaries of Oregon and Washington.

EPA Region 10 Office of Environmental Assessment March 2006
16
4. Polynuclear aromatic hydrocarbons (PAH) Polynuclear aromatic hydrocarbons (PAHs) are petroleum- or coal combustion by-products often associated with elevated levels of tumors in fish. The PAHs of low molecular weight are relatively easy to degrade, whereas those with higher molecular weights are resistant to decomposition. The low molecular weight PAHs are acutely toxic to aquatic organisms, whereas the high molecular weight PAHs are not. However, several high molecular weight PAHs are known to be carcinogenic. Total PAH Total PAHs ranged in concentration from below detection to 59,878 ppb (ng/g dry weight), and were detected in 86% of the estuarine area (Figure 13). The ERL of 4022 ppb was exceeded in 3% of the area, and the ERM of 44792 ppb was not exceeded. There are no State of Washington sediment standards for total PAH.
0
50
100
0 20000 40000 60000Total PAHs (ppb)
Perc
ent E
stua
rine
are
a
Figure 13. CDF of Total PAHs. Low molecular weight PAH Low molecular weight PAHs were detected in 83% of estuarine area at concentrations ranging from <1 ppb to 8636 ppb. The ERL of 5520 ppb was exceeded in 5% of the area, and the ERM of 3160 ppb was exceeded in <1% of the area. The State of Washington sediment standards are 370 and 780 ppm, normalized to the total organic carbon content. As a rule of thumb, samples with less than 0.5% TOC are not used in this
comparison. One sample, representing well under 1% of the estuarine area, exceeded the sediment quality standard, and none exceeded the cleanup/ screening concentration. High molecular weight PAH Concentrations of high molecular weight PAHs were detected in 84% of the estuarine area at concentrations ranging from <1 ppb to 8613 ppb. The ERL of 1700 ppb was exceeded in 3% of the area, and the ERM of 9600 ppb was not exceeded. The State of Washington sediment standards are 960 and 5300 ppm, normalized to the total organic carbon content. No samples exceeded either the Washington sediment quality standard or the cleanup/screening concentration. 5. PCBs (Polychlorinated Biphenyls) Polychlorinated biphenyls (PCBs) are a group of toxic, persistent chemicals formerly used in electrical transformers and capacitors. They often accumulate in sediments, fish, and wildlife, and are detrimental to the health of these organisms. The sediment quality guidelines and standards for PCBs are based on a different analytical method than that used to analyze the EMAP sediments* so the “total PCB” concentrations using the two methods will not yield the same result. This is also true of PAHs, because the LPAH and HPAH totals for the Washington state standards, for EMAP, and for ERL/ERM benchmarks are based on slightly different lists of compounds. The EMAP totals are of the 21 PCB congeners measured, so the concentrations are biased low. The comparison is useful to highlight areas that are impacted by PCBs, but it is important to keep in mind that if identical methodology was used, additional sites might show exceedances of the Washington sediment quality guidelines and standards. EMAP total* PCB concentrations ranged from below detection to 934 ppb. PCBs were detected in 14% of the estuarine area. The ERL of 22.7 ppb was exceeded in 3% of the area, according to the EMAP total PCBs. The ERM of 180 ppb was exceeded in one sample, representing <1%

EPA Region 10 Office of Environmental Assessment March 2006 of the area, according to the EMAP total PCBs. The station with the highest concentration is located in the Duwamish River in an area of known PCB contamination that is undergoing investigation as a Superfund site.
Normalization to total organic carbon content is done because toxicity often depends on the porewater concentration and samples with higher concentrations of contaminants in the organic fraction may be more bioavailable to organisms. It is important to note, however, that the relationship this conclusion is based on is not strong at low concentrations of TOC, and at TOC content of less than 0.5%, the relationship may not be reliable. The highest TOC content in the Oregon stations exceeding the ERL was 0.67%, and all the rest were below 0.5%. The low-TOC Oregon stations represent very small areas, however, so whether or not stations with less than 0.5% carbon are excluded, less than 1% of the estuarine area in both states combined exceeds the Washington sediment quality standard. 6. Pesticides None of the pesticides analyzed (Appendix 2) have state sediment quality standards, and only
*The EMAP PCB analyte list includes the most common congeners, which are not necessarily the most toxic. Because the EMAP total PCB concentration is a sum of only the 21 congeners that were measured, it is important to remember that it is biased low. There are approximately 114 PCB congeners that are found in commercial mixtures (Frame et al, 1996) although some are found only rarely. In addition, quality assurance review following EMAP PCB analysis indicated low precision for the results at the individual congener level due to interferences. However, the review also concluded that it was acceptable to use the EMAP total PCBs as general indicators of sediment contamination.
17
Washington has a sediment quality standard, which normalizes total PCBs to the total organic carbon content in the sample. The sediment quality standard or “no effects level” is set at 12 mg total PCB/kg organic carbon. An additional standard of 65 mg total PCB/kg organic carbon is considered the “minor adverse effects level” and is used as “an upper regulatory level for source control and cleanup decision making.” When all Washington and Oregon data were normalized to the organic carbon content, none of the stations exceeded the higher adverse effects level standard, but 1% of the area (12 stations) exceeded Washington’s sediment quality standard for total PCBs. Aside from the Duwamish station, all the other stations that exceeded this standard were in Oregon. The Oregon stations had low to very low total organic carbon, which can result in a high normalized concentration, even with a low total PCB concentration.
DDT and DDE have sediment quality guidelines. Approximately 83% of the area had no detected pesticides, 17% of the area had 1-3 detected, and 2% of the area had 3-5 pesticides detected (Figure 14).
% of Estuarine Area with Pesticides Detected in the Sediments
83%
12%
3%
2%
Zero Detects1 Detect2 Detects> 3 Detects
Figure 14. % of Estuarine Area with Pesticides Detected in the Sediments.

EPA Region 10 Office of Environmental Assessment March 2006
18
DDT
0
50
100
0 50 100 150Percent Survival of Toxicity Test Organisms
Perc
ent E
stua
rine
Are
aTotal DDT was detected in 10% of the estuarine area, with concentrations ranging from below detection to 12 ppb (Figure 15). The ERL of 1.58 ppb was exceeded in 4% of the area, but the ERM was not exceeded.
0
50
100
0 2 4 6 8 10 1
Total DDT (ppb)
Perc
ent E
stua
rine
Are
a
2
Figure 15. CDF of Total DDT. The DDT breakdown product 4,4’-DDE was detected in 10% of the estuarine area with concentrations ranging from below detection to 6.7 ppb. The ERL of 2.2 ppb was exceeded in 2% of the area, but the ERM was not exceeded. C. Toxicity 1. Acute sediment toxicity tests Toxicity testing uses biological organisms, in this case either the marine amphipod Ampelisca abdita or the freshwater amphipod Hyallela azteca, to determine toxicity. Toxicity is a measure of the degree to which a chemical or mixture of chemicals in the sediments will harm living things. Fifty percent of the estuarine area had over 90% survival rate of the test organisms (Ampelisca abdita or Hyallela azteca) when they were exposed to sediments in the laboratory (i.e., 50% of the area had less than 10% mortality of test organisms in the lab) (Figure 16).
Figure 16. CDF of Toxicity Testing.

EPA Region 10 Office of Environmental Assessment March 2006
19
D. Chemicals in Fish Tissue
Tissue Parameter
Toxic Tissue Screening Concentration (TSC) in ppb (from Dyer et al, 2000 unless noted)
Mean (ppb)
Minimum (ppb)
Maximum (ppb)
% of area exceeding TSC
METALS Inorganic Arsenic
1600 56 0 595 0%
Cadmium 83 1 6 0 200 4%Lead 59 1 132 0 967 78%Mercury 60 29 0 256 2%Selenium 560 234 0 2,390 12%Silver 37 5 0 280 2.3%Zinc 20,000 13,569 0 39,060 6.5%PESTICIDES DDT 54 2 14 0 494 4.8%Table 5. Selected Contaminants in Fish Tissue in the Estuaries of Oregon and Washington (n/a = no toxicity threshold exists).
1 TSC is from Shephard, 2006. in press. 2 EMAP data are reported as total DDT; DDE is reported separately. TSCs are for 4,4’-DDD, 4,4’-DDE, 4,4’-DDT. Because all the TSCs are the same concentration, the comparison was made with that number.
Chemicals were measured in fish tissues in the estuaries of Oregon and Washington. The values in Table 5 were used to indicate if the levels found in tissue indicate levels that may be harmful to the fish. The Toxic Tissue Screening Concentration (TSC) is a product of U.S. EPA's water quality criterion (WQC) and bioconcentration factor (BCF) per respective chemical (TSC=WQC*BCF). The BCF are from the U.S. EPA (1986). For chemicals not listed in the EPA document, BCFs were calculated based on Dyer, 2000, unless otherwise noted. 1. Metals Inorganic Arsenic Fish tissue was analyzed for total arsenic (inorganic and organic). Since TSC is available only for inorganic arsenic, an estimate of the percentage of the total arsenic that is inorganic arsenic in fish tissue (2%) was made based on other studies of marine fish species. Inorganic arsenic was detected in fish tissue in 85% of the estuarine area, with concentrations ranging from below detection to 595 ppb (Figure 17). The TSC of 1600 ppb not exceeded.
0
50
100
0 0.2 0.4 0.6 0.8Inorganic Arsenic in Fish Tissue (ug/g wet
weight)
Perc
ent E
stua
rine
Are
a
Figure 17. CDF of Inorganic Arsenic in Fish Tissue. Cadmium Cadmium was detected in fish tissue in 9% of the estuarine area, with concentrations ranging from below detection to 200 ppb. The TSC of 83 ppb was exceeded in 4% of the area. Lead Lead was detected in fish tissue in 81% of the estuarine area, with concentrations ranging from below detection to 967 ppb. The TSC of 59 ppb was exceeded in 78% of the area.
EPA Region 10 Office of Environmental Assessment March 2006
20
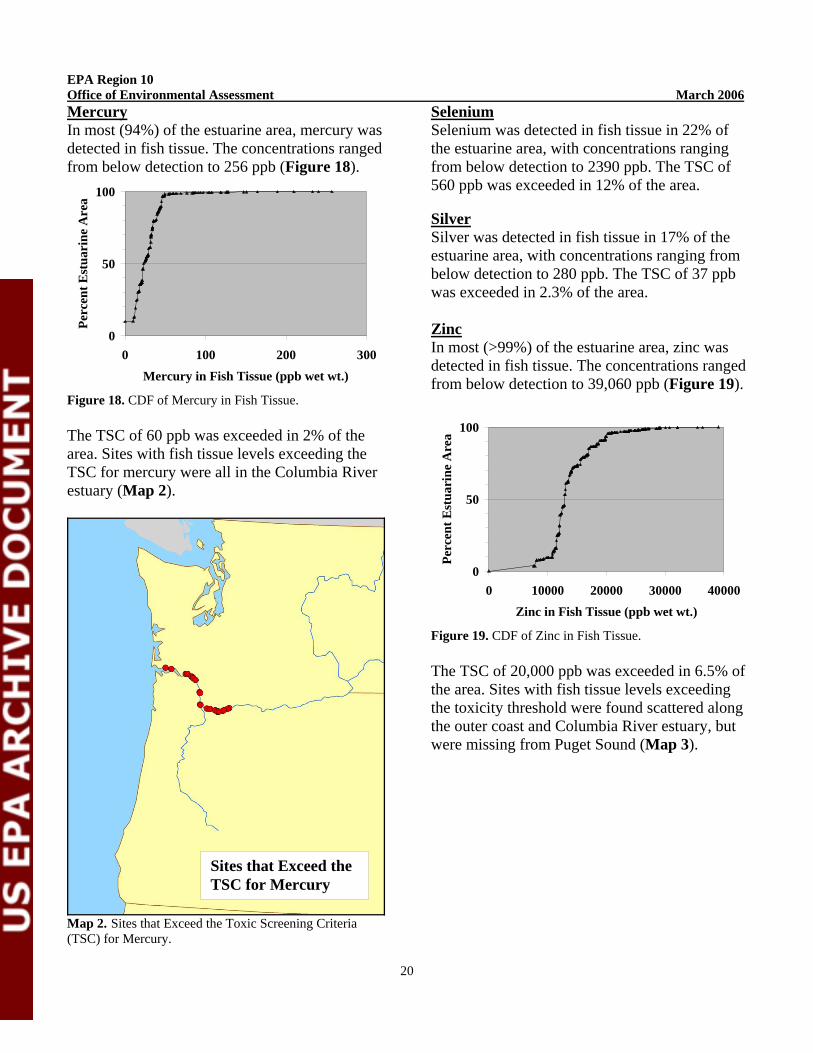
Mercury In most (94%) of the estuarine area, mercury was detected in fish tissue. The concentrations ranged from below detection to 256 ppb (Figure 18).
0
50
100
0 100 200 300Mercury in Fish Tissue (ppb wet wt.)
Perc
ent E
stua
rine
Are
a
Figure 18. CDF of Mercury in Fish Tissue. The TSC of 60 ppb was exceeded in 2% of the area. Sites with fish tissue levels exceeding the TSC for mercury were all in the Columbia River estuary (Map 2).
Map 2. Sites that Exceed the Toxic Screening Criteria (TSC) for Mercury.
Selenium Selenium was detected in fish tissue in 22% of the estuarine area, with concentrations ranging from below detection to 2390 ppb. The TSC of 560 ppb was exceeded in 12% of the area. Silver Silver was detected in fish tissue in 17% of the estuarine area, with concentrations ranging from below detection to 280 ppb. The TSC of 37 ppb was exceeded in 2.3% of the area. Zinc In most (>99%) of the estuarine area, zinc was detected in fish tissue. The concentrations ranged from below detection to 39,060 ppb (Figure 19).
0
50
100
0 10000 20000 30000 40000Zinc in Fish Tissue (ppb wet wt.)
Perc
ent E
stua
rine
Are
a
Figure 19. CDF of Zinc in Fish Tissue. The TSC of 20,000 ppb was exceeded in 6.5% of the area. Sites with fish tissue levels exceeding the toxicity threshold were found scattered along the outer coast and Columbia River estuary, but were missing from Puget Sound (Map 3).
Sites that Exceed the TSC for Mercury

EPA Region 10 Office of Environmental Assessment March 2006
21
Map 3. Sites that Exceed the Toxic Screening Criteria (TSC) for Zinc. 2. Pesticides DDT In most (97%) of the estuarine area, DDT was found in the fish tissue analyzed. The concentrations ranged from below detection to 493 ppb (Figure 20).
0
50
100
0 200 400 600Total DDT in Fish Tissue (ppb wet wt)
Perc
ent E
stua
rine
Are
a
Figure 20. CDF of DDT in Fish Tissue.
The TSC of 54 ppb was exceeded in 4.8% of the area. Sites with fish tissue levels exceeding the TSC for DDT were mostly in the Columbia River estuary (Map 4). These results confirm the findings of the Bi-State report (Tetra Tech, 1993) which concluded that DDT was distributed in fish tissue samples collected throughout the lower Columbia River.
Sites that Exceed the TSC for Zinc
Sites that Exceed the TSC for DDT
Map 4. Sites that Exceed the Toxic Screening Criteria (TSC) for DDT.

EPA Region 10 Office of Environmental Assessment March 2006
22
E. Benthic Invertebrates Benthic invertebrates were sampled at 223 sites, representing 6988 square kilometers or 81% of the estuarine area of Oregon and Washington. Benthic invertebrate abundance and diversity are good indicators of environmental health. See Appendix 6 for additional information on the benthic invertebrate community. 1. Benthic abundance Benthic invertebrate abundance is the number of organisms per unit area. It ranged from 0 to over 8000 organisms per 0.1m2 (Figure 21).
0
50
100
0 2000 4000 6000 8000 10000Number of Benthic Organisms per 0.1 m2
Perc
ent E
stua
rine
Are
a
Figure 21. CDF of Number of Benthic Organisms per 0.1 m2 (Abundance). 2. Benthic species richness/diversity There were 982 species found overall in 1999-2000 (Figure 22). Of these, 338 were found at only 1 site, while an additional 172 were found at two sites. Seventy-two species were found at 20 or more sites.
0
50
100
0 50 100 150 200 250Number of Benthic Species
Perc
ent E
stua
rine
Are
a
Figure 22. CDF of Number of Benthic Species.
The salinity of the waters sampled was quite varied. Since benthic invertebrates have varying tolerances to salinity, we divided the sites into three groups using the bottom salinity measurements:
• Marine, with > 25 psu (practical salinity units),
• Freshwater, with < 5psu, and • Intermediate, with > 5 and < 25 psu.
Ninety-one percent of the estuarine area with benthos sampled fell into the marine category (121 sites). Six percent of the area was freshwater, and 3% was of intermediate salinity. The Columbia River estuary sites were all either freshwater or intermediate. Additional freshwater and intermediate sites were found along the outer coast of Oregon and Washington in smaller estuaries. All sites in Puget Sound fell into the marine category. It should be noted that while some of the some of species may have been found at very few sites, they can be extremely abundant locally. At the marine sites, 912 species were found. Of these, 313 were found at only 1 site, and an additional 164 were found at two sites. Thirty eight species were found at 20 or more sites out of the total 121 marine sites. Of the 912 species, 842 species (92%) were found only at marine sites. At the freshwater sites, 83 species were found. Of these, 42 were found at only 1 site, and an additional 11 were found at two sites. Four species were found at 20 or more sites of the 64 freshwater sites. Of the 83 species, 44 species (53%) were found only at freshwater sites. At the intermediate sites, 93 species were found. Of these, 42 were found at only 1 site, and an additional 18 were found at two sites. Only one species was found at 20 or more sites of the 35 intermediate sites. Of the 93 species, 10 species (9%) were found only at intermediate sites.

EPA Region 10 Office of Environmental Assessment March 2006
23
There were an additional 12 species found at both the freshwater and intermediate sites that were not found at the marine sites at all. Figure 23 shows the most common species for each of the three salinity categories: marine, freshwater and intermediate. Even the most common freshwater species (Corbicula fluminea) or
intermediate species (Americorophium salmonis) are rare compared to many marine species. This is because the freshwater/intermediate sites represent only a small portion of the total estuarine area sampled.
0
10
20
30
40
50
60
70
80
Axinop
sida s
errica
ta
Med
iomast
us sp
Rochefo
rtia t
umida
Oligoc
haeta
Americo
rophium sp
Eohau
storiu
s estu
arius
Americo
rophium sa
lmon
is
Neanthes
limnico
la
Corbicu
la flu
minea
Species
% E
stua
rine
Are
a
Marine Freshwater Intermediate
Figure 23. Most Common Benthic Invertebrates (for each of the three salinity categories: marine, freshwater and intermediate).

EPA Region 10 Office of Environmental Assessment March 2006
24
F. Fish Fish sampling was conducted at 226 sites, representing 7666 square kilometers (88% of the estuarine area of Oregon and Washington). At 27 sites, there were no fish captured. English sole (Pleuronectes vetulus) was the most commonly occurring species; it was found in nearly 70% of the estuarine area. Figure 24 shows the fish species most commonly occurring. Twenty seven fish species were found at only one site. It should be noted that while some of the species may have been found at very few sites, they can be extremely abundant locally. An additional 34 species were found at 5 or fewer sites. Only 10 species were found at 25 or more sites. Appendix 7 lists all of the fish species found.
Due to the varying tolerances of fish to salinity, we divided the sites into three groups (the same as for the benthic invertebrates) using the bottom salinity measurements:
• Marine, with > 25 psu, • Freshwater, with < 5psu, and • Intermediate, with > 5 and < 25 psu.
Ninety percent of the estuarine area sampled for fish sites was in the marine category, 3% of the area was intermediate, and 7% was freshwater. The Columbia River estuary sites were all either freshwater or intermediate. Additional freshwater and intermediate sites were found along the outer coast of Oregon and Washington in smaller estuaries. All sites in Puget Sound fell into the marine category.
0
10
20
30
40
50
60
70
80
Pacific
stag
horn
sculp
in
Rex so
le
Pacific
Cod
Long
nose
Ska
te
Alaska
(wall
eye)
pollo
ck
Flathe
ad so
le
Pacific
hake
Shiner
perch
Pacific
herrin
g
Plainfi
n mids
hipman
Dover
Sole
Rock s
ole
Starry
floun
der
Slende
r sole
Pacific
sand
dab
Spiny D
ogfis
h
Spotte
d ratf
ish
Pacific
tomco
d
Englis
h sole
% E
stua
rine
area
Figure 24. Fish Species Found at all Sites (showing the most commonly occurring species).

EPA Region 10 Office of Environmental Assessment March 2006
25
Of the 93 fish species found overall in 1999-2000, 81 were found in the marine sites, 18 in freshwater sites and 17 in the intermediate sites (Figure 25). See Appendix 7 for additional details. Marine sites had bottom salinities of greater than 25 psu and surface salinities between 13.0 psu and 33.0 psu. Of the 81 species found at these marine sites, 66 species were found only at marine sites. Freshwater sites had bottom salinities of less than 5 psu and surface salinities between 0.01 psu and 3.4 psu. Of the 18 species found at freshwater sites, 10 of these species were found only at freshwater sites. Unique freshwater species included Cutthroat trout, Crappies, Northern Pikeminnow, Peamouth, Three-spine stickleback, and Sand roller. The overall most
commonly found species in 1999-2000 study, English sole, was not found at any of the freshwater sites. Intermediate sites had bottom salinities between 5 psu and 25 psu and surface salinities from 2.7 psu to 24.9 psu. No species found at the intermediate sites were unique to those sites. Figure 25 shows the most common species for each of the three salinity categories: marine, freshwater and intermediate. Even the most common species found at freshwater locations (Starry flounder) or at intermediate salinity locations (Pacific staghorn sculpin) are rare, based on percent area of occurrence compared to those species that were dominant at marine locations. This is because the freshwater/ intermediate sites represent only a small portion of the total estuarine area sampled.
0
10
20
30
40
50
60
70
80
English
Sole
Pacific
Tomco
d
Spotted
Ratf
ish
Spiny Dog
fish
Pacific
Sanddab
Starry
Flounder
America
n Shad
Pacific
Staghor
n Sculpin
Saddleb
ack G
unnel
Three-sp
ine Stic
klebac
k
Species
% E
stua
rine
Are
a
Marine Freshwater Intermediate
Figure 25. Most Commonly Found Fish at Marine, Freshwater and Intermediate Sites.

EPA Region 10 Office of Environmental Assessment March 2006
26
G. Non-indigenous species Invasive species are considered one of the most important environmental stressors to coastal ecosystems and represent a threat to both local and regional economies and the fundamental ecological integrity of aquatic ecosystems throughout the U.S. (Lee and Thompson, 2003). While some of these non-indigenous species (NIS) have been purposefully introduced, such as the Japanese oyster for aquaculture, others have quietly hitch-hiked in to become invasive species, such as the Zebra mussel and European green crab. Coastal waters are particularly vulnerable to foreign-species invasions because human activities and practices associated with shipping and transportation, such as ship ballast water exchange and the aquaculture of non-indigenous species, are major and effective transport mechanisms. The United Nations recently stated that invasive species are second only to habitat loss as the greatest threat to decreasing global biodiversity. Species were classified based on the “Pacific Coast Ecosystem Information System” (PCEIS), a joint project between EPA and the USGS to develop a spatial database of the marine/estuarine native and nonindigenous species (NIS) in Oregon, Washington, and California. The primary classifications and groupings for invertebrates (not fish) used are: Native: Indigenous to the Northeast Pacific. Nonindigenous species (NIS): Species not native to the Northeast Pacific. Cryptogenic: Species of unknown origin so they can not be classified as native or NIS. These species should not be considered “de facto” NIS. The relative abundance of nonindigenous species (NIS) were calculated for all sites with salinity >5 psu using the following metric:
Abundance Invasion Metric (AIM) = (Abundance of NIS)/(Abundance of NIS & Abundance of Natives) * 100
The cut-points of 0-10%, 10-50% and >50% were suggested as “background,” “moderately invaded,” and “highly invaded” for AIM. The current analysis does not include the cryptogenic species, which are both widespread and abundant in many sites. Oregon and Washington show low levels of invasion, with approximately 37% of the area containing no NIS and approximately 90% of the area showing “background” levels (0-10%) of invasion. Less than 4% of the area was classified as highly invaded (Figure 26).
Figure 26. Extent of NIS Invasion in the Estuaries of Oregon and Washington Puget Sound is much less invaded than the coastal estuaries or the Columbia River. In particular, the deeper (≥30 m) samples from Puget Sound were less invaded. Of the 26 deeper samples in Puget Sound, 10 contained no NIS, with an average AIM of 4.9%. The coastal estuaries and the Columbia River were much more invaded than Puget Sound, with about 75% – 80% of the area invaded to some extent (i.e., NIS >0) and 12% - 25% highly invaded.
Extent of NIS invasion
0-10%>10% and <50%>50%

EPA Region 10 Office of Environmental Assessment March 2006
27
IV. CONCLUSIONS
Photo: English Sole, a target fish species.
Most historic assessments of estuary quality have focused on describing the chemical quality of estuaries and, occasionally, impacts to sport fisheries. However, the goal of the Clean Water Act is to maintain and restore the physical, chemical and biological integrity of the nation’s waters. In this assessment we try to address this issue by incorporating direct measurements of physical, chemical and biological condition of estuaries. To assess whether or not a specific metric indicates good or poor condition, a benchmark, standard or target is needed for comparison. Not all parameters or indicators have benchmarks developed. Therefore, we will only interpret those indicators that have benchmarks or targets developed that are relevant to the estuaries of Oregon and Washington. A. Water Physical/Chemical Indicators
Dissolved Oxygen Dissolved Oxygen (DO) concentrations below approximately 2 mg/L are thought to be stressful
to many estuarine organisms (Diaz and Rosenberg, 1995; U.S. EPA, 2000a). These low levels most often occur in bottom waters and affect the organisms that live in the sediments. Low levels of oxygen (hypoxia) or lack of oxygen (anoxia) often accompany the onset of severe bacterial degradation, sometimes resulting in the presence of algal scums and noxious odors. However, in some estuaries, low levels of oxygen occur periodically or may be a part of the natural ecology. Therefore, although it is easy to show a snapshot of the conditions of the nation’s estuaries concerning oxygen concentrations, it is difficult to interpret whether this snapshot is representative of all summertime periods or the result of natural physical processes. Dissolved oxygen was rated good, fair, or poor using the following criteria:
Good: > 5 mg/L Fair: 2–5 mg/L Poor: < 2 mg/L
Less than two percent of estuarine area was in poor condition, having a bottom DO concentration below 2 mg/L. The sites with low
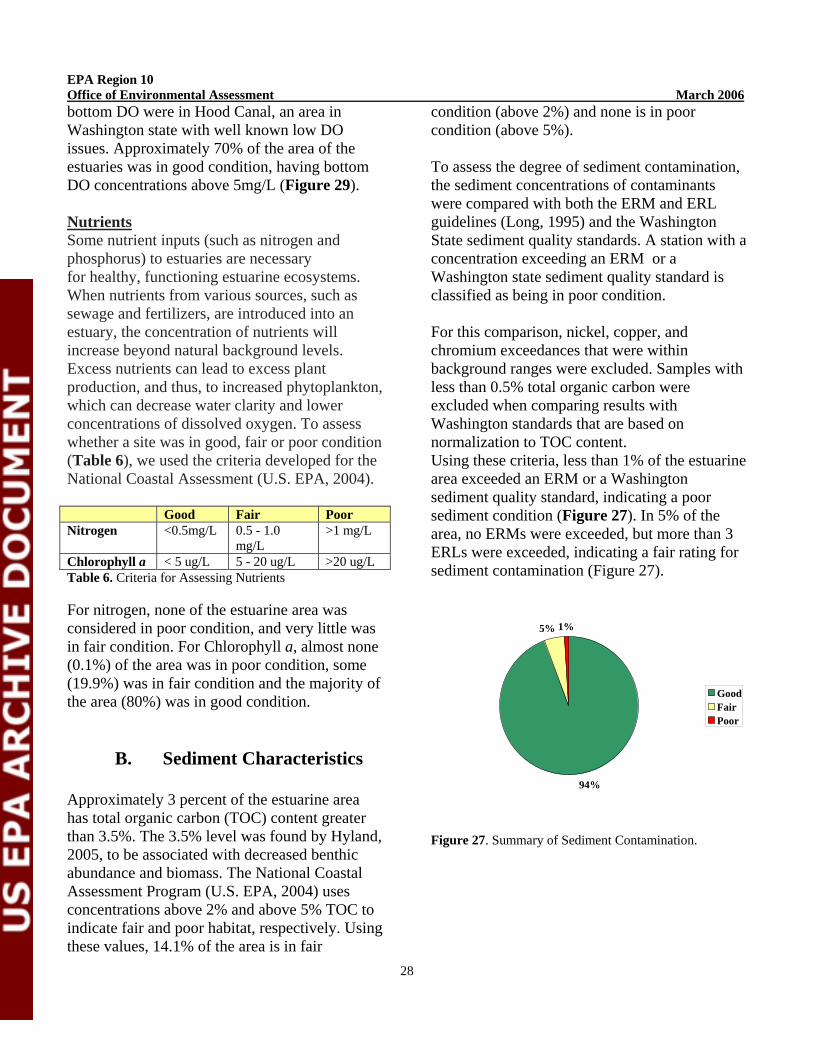
EPA Region 10 Office of Environmental Assessment March 2006
28
bottom DO were in Hood Canal, an area in Washington state with well known low DO issues. Approximately 70% of the area of the estuaries was in good condition, having bottom DO concentrations above 5mg/L (Figure 29). Nutrients Some nutrient inputs (such as nitrogen and phosphorus) to estuaries are necessary for healthy, functioning estuarine ecosystems. When nutrients from various sources, such as sewage and fertilizers, are introduced into an estuary, the concentration of nutrients will increase beyond natural background levels. Excess nutrients can lead to excess plant production, and thus, to increased phytoplankton, which can decrease water clarity and lower concentrations of dissolved oxygen. To assess whether a site was in good, fair or poor condition (Table 6), we used the criteria developed for the National Coastal Assessment (U.S. EPA, 2004). Good Fair Poor Nitrogen <0.5mg/L 0.5 - 1.0
mg/L >1 mg/L
Chlorophyll a < 5 ug/L 5 - 20 ug/L >20 ug/L Table 6. Criteria for Assessing Nutrients For nitrogen, none of the estuarine area was considered in poor condition, and very little was in fair condition. For Chlorophyll a, almost none (0.1%) of the area was in poor condition, some (19.9%) was in fair condition and the majority of the area (80%) was in good condition.
B. Sediment Characteristics
Approximately 3 percent of the estuarine area has total organic carbon (TOC) content greater than 3.5%. The 3.5% level was found by Hyland, 2005, to be associated with decreased benthic abundance and biomass. The National Coastal Assessment Program (U.S. EPA, 2004) uses concentrations above 2% and above 5% TOC to indicate fair and poor habitat, respectively. Using these values, 14.1% of the area is in fair
condition (above 2%) and none is in poor condition (above 5%). To assess the degree of sediment contamination, the sediment concentrations of contaminants were compared with both the ERM and ERL guidelines (Long, 1995) and the Washington State sediment quality standards. A station with a concentration exceeding an ERM or a Washington state sediment quality standard is classified as being in poor condition. For this comparison, nickel, copper, and chromium exceedances that were within background ranges were excluded. Samples with less than 0.5% total organic carbon were excluded when comparing results with Washington standards that are based on normalization to TOC content. Using these criteria, less than 1% of the estuarine area exceeded an ERM or a Washington sediment quality standard, indicating a poor sediment condition (Figure 27). In 5% of the area, no ERMs were exceeded, but more than 3 ERLs were exceeded, indicating a fair rating for sediment contamination (Figure 27).
Figure 27. Summary of Sediment Contamination.
94%
5% 1%
GoodFairPoor

EPA Region 10 Office of Environmental Assessment March 2006
29
C. Chemicals in Fish Tissue
The Toxic tissue Screening Criteria (TSC) are tissue residue levels that, when exceeded, may be harmful to fish. We evaluated the TSC for arsenic, cadmium, DDT, lead, mercury, selenium and zinc. In the estuaries of Oregon and Washington, 3.3% of the estuarine area had 4 of these chemicals in tissues exceeding the TSC (at the same site, which indicates a likely poor condition), 11.1% had 3 chemicals above the TSC, 38.9% had 2 and 46.7% have one or zero above the TSC, indicating good conditions (Figure 28).
4 chemicals above TSC3 above TSC2 above TSC1 or zero above TSC
Figure 28. Summary of Chemicals in Fish Tissue. D. Non-Indigenous Species (NIS) When looking at NIS species, we will be assessing only those species whose origin is known with reasonable certainty. The estuaries of Oregon and Washington show low levels of invasion, with less than 4% of the area classified as highly invaded (> 50% AIM) or poor condition. The coastal estuaries and the Columbia River were much more invaded than Puget Sound, with about 75% – 80% of the area invaded to some extent (i.e., NIS >0) and 12% - 25% highly
invaded. However, due to the large size of Puget Sound, the overall estimates for Oregon and Washington essentially reflect this low extent of invasion in Puget Sound (the average AIM is 4.9%).
Photo: Corbicula fluminea, an NIS species. Photo credit: Noel M. Burkhead, U.S. Geological Survey
E. Summary
This project was designed to evaluate the overall condition of estuaries in Washington and Oregon. In this assessment we used direct measurements of the biota themselves as indicators of ecological condition. Information on the biota is supplemented by indicators of stress, which are measurements of other estuarine characteristics or factors that might influence or affect ecological condition, especially water chemistry and sediment characteristics. Very little (0-2%) of the estuarine area of Oregon and Washington (Figure 29) is in “poor” condition using bottom dissolved oxygen, chlorophyll a and nitrogen as water chemistry indicators. Sediment indicators (total organic carbon and sediment contaminants) also showed very little (<1% - 3%) of the estuarine area of Oregon and Washington (Figure 29) in “poor” condition. A slightly higher percentage (3.4% - 4%) of the estuarine area of Oregon and Washington were in “poor” condition for

EPA Region 10 Office of Environmental Assessment March 2006
30
biological indicators (NIS and chemicals in fish tissue). In conclusion, overall, very little of the estuarine area of Oregon and Washington (0-4%) is in “poor” condition for any indicator that we examined (Figure 29). However, there were some geographic areas where the results that indicate concerns. All of the sites with low bottom DO were in Hood Canal, an area in Washington state with well known low DO issues. In contrast, sites with fish
tissue levels exceeding the TSC for mercury were all in the Columbia River estuary. Also, sites with fish tissue levels exceeding the TSC for DDT were mostly in the Columbia River estuary. Finally, the coastal estuaries and the Columbia River were much more invaded by NIS species than Puget Sound, with 12% - 25% of the area in the highly invaded category.
0% 20% 40% 60% 80% 100%
Nitrogen
Chlorophyll a
Dissolved Oxygen(bottom)
Total OrganicCarbon
SedimentContamination
Chemicals in FishTissue
NIS
% Estuarine Area
GoodFairPoor
Figure 29. Overall Condition of Estuarine Area in Oregon and Washington for Selected Indicators.

EPA Region 10 Office of Environmental Assessment March 2006
31
V. REFERENCES American Society for Testing and Materials (ASTM). 1993. Guide for conducting 10-day static sediment toxicity tests with marine and estuarine amphipods. ASTM Standard Methods Volume 11.04, Method Number E-1367-92. ASTM, Philadelphia, PA. Copping, A. and B.C. Bryant. 1993. Pacific Northwest Regional Marine Research Program, Vol. 1. Research Plan, 1992-1996. Office of Marine Environmental and Resource Programs, University of Washington, Seattle. Culliton, T.J., M.A. Warren, T.R. Goodspeed, D.G. Remeer, C.M. Blackwell, and J.J. McDonough, III. 1990. 50 Years of Population Change along the Nation’s Coasts, 1960-2010. NOAA, Office of Oceanography and Marine Assessment, National Ocean Service, Coastal Trends Series, Rockville, MD. 41 pp.
Diaz, R. J. and R. Rosenberg. 1995. Marine benthic hypoxia: A review of its ecological effects and the behavioral responses of benthic macrofauna. Oceanogr. Mar. Biol. Ann. Rev. 33: 245-303.
Diaz-Ramos, S., D.L. Stevens, Jr., and A.R. Olsen. 1996. EMAP Statistics Methods Manual. EPA/620/R-96/002. Corvallis, OR: U.S. Environmental Protection Agency, Office of Research and Development, National Health and Environmental Effects Research Laboratory. Dyer, S.C., C.E. White-Hull, and B.K. Shephard. 2000. Assessments of Chemical Mixtures via Toxicity Reference Values Overpredict Hazard to Ohio Fish Communities. Environ. Sci. Technol. 2000(34):251-2524. Frame, G.M., J.W. Cochran, and S.S. Bowadt. 1996. Complete PCB congener distribution for 17 Aroclor mixtures determined by 3 HRGC systems optimized for comprehensive, quantitative, congener-specific analysis. J. High Resolut. Chromatogr. 19:657-668. Hyland, J.L., L. Balthis, I. Karakassis, P. Magni, A.N. Petrov, J.P. Shine, O. Vestergaard, and R.M. Warwick. 2005. Organic carbon content of sediments as an indicator of stress in the marine benthos. Mar. Ecol. Progr. Ser. Hyland, J., I. Karakassis, P. Magni, A. Petrov, and J. Shine. 2000. Summary Report: Results of initial planning meeting of the United Nations Educational, Scientific and Cultural Organization (UNESCO) Benthic Indicator Group. 70pp. Krauskopf, K.B., and D.K. Bird. 1995. Introduction to Geochemistry. New York: McGraw-Hill, Appendix IV, Average Abundance of Elements in the Earth’s Crust, Continental Crust, in Three Common Rocks, and in Seawater. Lauenstein, G.G. and A.Y. Cantillo, eds. 1993. Sampling and analytical methods of the NS&T Program National Benthic Surveillance and Mussel Watch projects. Comprehensive descriptions of elemental analytical methods. National Oceanic and Atmospheric Administration Tech. Memorandum 71.

EPA Region 10 Office of Environmental Assessment March 2006
32
Lee II, H. and B. Thompson, 2003. How Invaded Is Invaded? U.S. EPA. Proceedings of the Third International Conference on Marine Bioinvasions, La Jolla, California, March 16-19, 2003, p. 80. Long, E.R., D. MacDonald, S. Smith, and F. Calder. 1995. Incidence of Adverse Biological Effects Within Ranges of Chemical Concentrations in Marine and Estuarine Sediments. Environmental Management 19(1):81-97. Nelson, W.G., H. Lee II, J.O. Lamberson, V. Engle, L. Harwell, and L.M. Smith. 2004. Condition of estuaries of western United States for 1999: A statistical summary. Office of Research and Development, National Health and Environmental Effects Research Laboratory. EPA/620/R-04/200. Peterson, S.A., D.P. Larsen, S.G. Paulsen, and N.S. Urquhart. 1998. Regional lake trophic patterns in the northeastern United States: three approaches. Environmental Management 22:789-801. Peterson, S.A., N.S. Urquhart, and E.B. Welch. 1999. Sample representativeness: a must for reliable regional lake condition estimates. Environmental Science and Technology 33:1559-1565. Sigmon, C.L.T., L. Caton, G. Coffeen, and S. Miller. 2004. Draft – Coastal Environmental Monitoring and Assessment Program. The Condition of Oregon Estuaries in 1999, A Statistical Summary. Oregon Department of Environmental Quality, Laboratory. Portland, Oregon. DEQ04-LAB-0046-TR. Stevens, D.L., Jr. 1997. Variable density grid-based sampling designs for continuous spatial populations. Environmetrics 8:167-195. Stevens, D. L., Jr., and A.R. Olsen. 1999. Spatially restricted surveys over time for aquatic resources. J. of Agricultural, Biological and Environmental Statistics 4:415-428. Tetra Tech. 1993. Reconnaissance survey of the lower Columbia River. Task 7 conclusions and recommendations. Prepared for Lower Columbia River Bi-State Committee. Tetra Tech, Inc., Redmond, WA. 270 pp. + appendix (TC 8526-07). U.S. EPA. 1986. Superfund Public Health Evaluation Manual. EPA/540/1-86/060. Office of Emergency and Remedial Response. Washington, D.C. U.S. EPA. 1993a. Environmental Monitoring and Assessment Program (EMAP): Laboratory method manual – estuaries, United States Environmental Protection Agency, Office of Research and Development. Environmental Monitoring and System Laboratory, Cincinnati, OH. EPA/600/4-91/324. U.S. EPA. 1993b. Volunteer estuary monitoring: A methods manual. US Environmental Protection Agency Report EPA 842-B-93-004. Washington, D.C.: Office of Water. 176 pp. U.S. EPA. 1994a. Environmental Monitoring and Assessment Program (EMAP): Laboratory method manual – estuaries, Volume 1: Biological and physical analysis. United States Environmental Protection Agency, Office of Research and Development. Environmental Monitoring and System Laboratory, Cincinnati, OH. EPA/600/4-91/024.
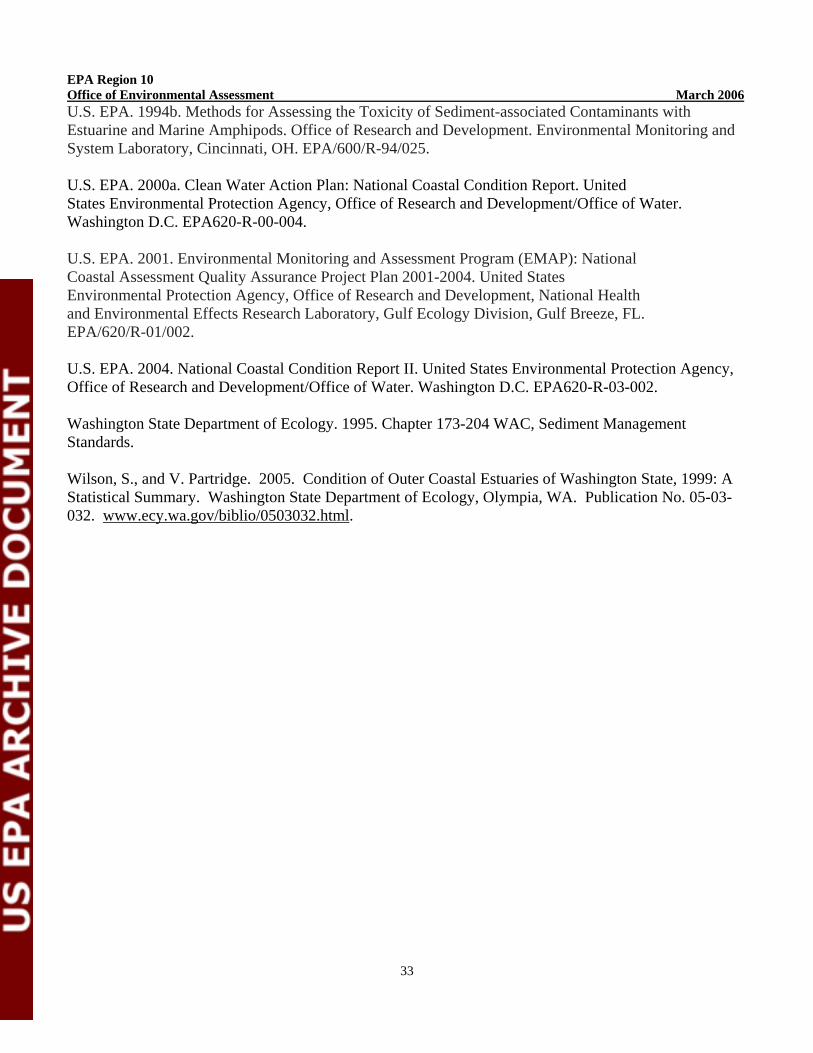
EPA Region 10 Office of Environmental Assessment March 2006
33
U.S. EPA. 1994b. Methods for Assessing the Toxicity of Sediment-associated Contaminants with Estuarine and Marine Amphipods. Office of Research and Development. Environmental Monitoring and System Laboratory, Cincinnati, OH. EPA/600/R-94/025. U.S. EPA. 2000a. Clean Water Action Plan: National Coastal Condition Report. United States Environmental Protection Agency, Office of Research and Development/Office of Water. Washington D.C. EPA620-R-00-004. U.S. EPA. 2001. Environmental Monitoring and Assessment Program (EMAP): National Coastal Assessment Quality Assurance Project Plan 2001-2004. United States Environmental Protection Agency, Office of Research and Development, National Health and Environmental Effects Research Laboratory, Gulf Ecology Division, Gulf Breeze, FL. EPA/620/R-01/002. U.S. EPA. 2004. National Coastal Condition Report II. United States Environmental Protection Agency, Office of Research and Development/Office of Water. Washington D.C. EPA620-R-03-002. Washington State Department of Ecology. 1995. Chapter 173-204 WAC, Sediment Management Standards. Wilson, S., and V. Partridge. 2005. Condition of Outer Coastal Estuaries of Washington State, 1999: A Statistical Summary. Washington State Department of Ecology, Olympia, WA. Publication No. 05-03-032. www.ecy.wa.gov/biblio/0503032.html.

EPA Region 10 Office of Environmental Assessment March 2006
34
VI. APPENDICES Appendix 1. Site location information (Note that some sites sampled by Washington Department of Ecology were in Canadian Waters). STATE YEAR ESTUARY NAME EMAP
Station ID LATITUDE LONGITUDE
OREGON 2000 COLUMBIA RIVER, RIVER MILE 51.4 OR00-0001 46.18642 -123.181 OREGON 2000 COLUMBIA RIVERRIVER MILE 49.2 OR00-0002 46.16893 -123.216 OREGON 2000 COLUMBIA RIVERRIVER MILE 53.2 OR00-0003 46.18787 -123.141 OREGON 2000 COLUMBIA RIVER, RIVER MILE 45.9 OR00-0004 46.14234 -123.275 OREGON 2000 COLUMBIA RIVER, RIVER MILE 59.2 OR00-0005 46.14628 -123.036 OREGON 2000 COLUMBIA RIVER, RIVER MILE 61.5 OR00-0006 46.12905 -122.999 OREGON 2000 COLUMBIA RIVER, RIVER MILE 62.9 OR00-0007 46.1142 -122.978 OREGON 2000 COLUMBIA RIVER OR00-0008 46.10204 -122.915 OREGON 2000 COLUMBIA RIVER, RIVER MILE 66.2 OR00-0009 46.0889 -122.923 OREGON 2000 COLUMBIA RIVER, RIVER MILE 69 OR00-0010 46.05742 -122.887 OREGON 2000 COLUMBIA RIVER, RIVER MILE 72.5 OR00-0011 46.01564 -122.858 OREGON 2000 COLUMBIA RIVER, RIVER MILE 80.2 OR00-0012 45.91205 -122.81 OREGON 2000 COLUMBIA RIVER, RIVER MILE 82.8 OR00-0013 45.87721 -122.793 OREGON 2000 COLUMBIA RIVER, RIVER MILE 83.6 OR00-0014 45.86531 -122.788 OREGON 2000 COLUMBIA RIVER, RIVER MILE 85.1 OR00-0015 45.84555 -122.786 OREGON 2000 COLUMBIA RIVER, RIVER MILE 99 OR00-0016 45.6517 -122.763 OREGON 2000 COLUMBIA RIVER, RIVER MILE 99.7 OR00-0017 45.64532 -122.751 OREGON 2000 COLUMBIA RIVER OR00-0018 45.60626 -122.675 OREGON 2000 COLUMBIA RIVER, RIVER MILE 109.4 OR00-0019 45.59698 -122.569 OREGON 2000 COLUMBIA RIVER OR00-0020 45.59403 -122.582 OREGON 2000 COLUMBIA RIVER, RIVER MILE 112.6 OR00-0021 45.5839 -122.502 OREGON 2000 COLUMBIA RIVER, RIVER MILE 119.9 OR00-0022 45.56827 -122.366 OREGON 2000 COLUMBIA RIVER, RIVER MILE 119.9 OR00-0023 45.56863 -122.363 OREGON 2000 COLUMBIA RIVER, RIVER MILE 138.8 OR00-0024 45.62269 -122.018 OREGON 2000 COLUMBIA RIVER, RIVER MILE 136.6 OR00-0025 45.605 -122.053 OREGON 2000 COLUMBIA RIVER OR00-0026 45.55558 -122.3 OREGON 2000 COLUMBIA RIVER, RIVER MILE130.8 OR00-0027 45.5745 -122.165 OREGON 2000 COLUMBIA RIVER, RIVER MILE 123.1 OR00-0028 45.54575 -122.315 OREGON 2000 COLUMBIA RIVER, RIVER MILE 125.3 OR00-0029 45.55037 -122.271 OREGON 2000 COLUMBIA RIVER, RIVER MILE 131.6 OR00-0030 45.58123 -122.149 OREGON 2000 COLUMBIA RIVER OR00-0031 46.27134 -124.045 OREGON 2000 COLUMBIA RIVER OR00-0032 46.2592 -124.021 OREGON 2000 COLUMBIA RIVER, RIVER MILE 3.8 OR00-0033 46.22675 -123.978 OREGON 2000 COLUMBIA RIVER OR00-0034 46.24636 -123.865 OREGON 2000 COLUMBIA RIVER OR00-0035 46.28297 -123.793 OREGON 2000 COLUMBIA RIVER OR00-0036 46.23201 -123.939 OREGON 2000 COLUMBIA RIVER OR00-0037 46.242 -123.859 OREGON 2000 COLUMBIA RIVER OR00-0038 46.23394 -123.88 OREGON 2000 COLUMBIA RIVER OR00-0039 46.23854 -123.79 OREGON 2000 COLUMBIA RIVER OR00-0040 46.26919 -123.713 OREGON 2000 COLUMBIA RIVER OR00-0041 46.20529 -123.882

EPA Region 10 Office of Environmental Assessment March 2006
35
STATE YEAR ESTUARY NAME EMAP Station ID
LATITUDE LONGITUDE
OREGON 2000 COLUMBIA RIVER OR00-0042 46.22234 -123.797 OREGON 2000 COLUMBIA RIVER OR00-0043 46.24003 -123.732 OREGON 2000 COLUMBIA RIVER, RIVER MILE 21.4 OR00-0044 46.26385 -123.658 OREGON 2000 COLUMBIA RIVER, RIVER MILE 25.7 OR00-0045 46.25365 -123.562 OREGON 2000 COLUMBIA RIVER, RIVER MILE 14.5 OR00-0046 46.21268 -123.781 OREGON 2000 COLUMBIA RIVER OR00-0047 46.22227 -123.665 OREGON 2000 COLUMBIA RIVER, RIVER MILE 28.8 OR00-0048 46.2683 -123.502 OREGON 2000 COLUMBIA RIVER, RIVER MILE 32.5 OR00-0049 46.24906 -123.44 OREGON 2000 COLUMBIA RIVER, RIVER MILE 33.5 OR00-0050 46.23561 -123.427 OREGON 1999 YOUNGS BAY, RIVER MILE 8.3 OR99-0001 46.113 -123.547 OREGON 1999 CATHLAMET BAY OR99-0002 46.12633 -123.434 OREGON 1999 YOUNGS BAY OR99-0003 46.10801 -123.519 OREGON 1999 CATHLAMET BAY OR99-0004 46.13026 -123.403 OREGON 1999 YOUNGS BAY OR99-0005 46.10038 -123.536 OREGON 1999 CATHLAMET BAY OR99-0006 46.12473 -123.413 OREGON 1999 YOUNGS BAY OR99-0007 46.1014 -123.523 OREGON 1999 MARSH ISLAND CREEK OR99-0008 46.13569 -123.353 OREGON 1999 CATHLAMET BAY OR99-0009 46.11381 -123.447 OREGON 1999 CATHLAMET BAY OR99-0010 46.11322 -123.448 OREGON 1999 CATHLAMET BAY OR99-0011 46.11171 -123.409 OREGON 1999 YOUNGS RIVER OR99-0012 46.08924 -123.49 OREGON 1999 KNAPPA SLOUGH OR99-0013 46.11229 -123.355 OREGON 1999 BRADBURY SLOUGH OR99-0014 46.10196 -123.086 OREGON 1999 WALLACE SLOUGH OR99-0015 46.0805 -123.163 OREGON 1999 CLATSKANIE RIVER OR99-0016 46.07717 -123.136 OREGON 1999 RINEARSON SLOUGH OR99-0017 46.07408 -123.021 OREGON 1999 NEHALEM RIVER OR99-0018 45.41459 -123.54 OREGON 1999 NETARTS BAY OR99-0019 45.23627 -123.572 OREGON 1999 NESTUCCA RIVER OR99-0020 45.118 -123.577 OREGON 1999 LITTLE NESTUCCA RIVER OR99-0021 45.09967 -123.566 OREGON 1999 SALMON RIVER OR99-0022 45.024 -123.597 OREGON 1999 SILETZ BAY OR99-0023 44.55499 -124.011 OREGON 1999 YAQUINA BAY OR99-0024 44.37293 -124.021 OREGON 1999 YAQUINA RIVER OR99-0025 44.35913 -124.009 OREGON 1999 YAQUINA RIVER OR99-0026 44.34432 -123.578 OREGON 1999 ALSEA RIVER OR99-0027 44.2485 -123.599 OREGON 1999 YACHATS RIVER OR99-0028 44.1829 -124.069 OREGON 1999 ROCK CREEK OR99-0029 44.1125 -124.022 OREGON 1999 SIUSLAW RIVER OR99-0030 44.00688 -124.076 OREGON 1999 SIUSLAW RIVER OR99-0031 44.01321 -123.529 OREGON 1999 UMPQUA RIVER OR99-0032 44.44395 -124.082 OREGON 1999 SMITH RIVER OR99-0033 43.4574 -124.003 OREGON 1999 UMPQUA RIVER OR99-0034 43.43516 -124.087 OREGON 1999 SMITH RIVER OR99-0035 44.46317 -123.542 OREGON 1999 UMPQUA RIVER OR99-0036 43.43332 -124.074

EPA Region 10 Office of Environmental Assessment March 2006
36
STATE YEAR ESTUARY NAME EMAP Station ID
LATITUDE LONGITUDE
OREGON 1999 SCHOLFIELD CREEK OR99-0037 43.41587 -124.06 OREGON 1999 UMPQUA RIVER OR99-0038 43.41531 -124.039 OREGON 1999 COOS BAY OR99-0039 43.25364 -124.147 OREGON 1999 COOS BAY OR99-0040 43.24828 -124.124 OREGON 1999 COOS BAY OR99-0041 43.24386 -124.131 OREGON 1999 COOS BAY OR99-0042 43.23183 -124.175 OREGON 1999 COOS BAY OR99-0043 43.24243 -124.119 OREGON 1999 COOS BAY OR99-0044 43.22076 -124.182 OREGON 1999 SOUTH SLOUGH OR99-0045 43.20486 -124.192 OREGON 1999 COOS RIVER OR99-0046 43.22203 -124.089 OREGON 1999 COOS RIVER OR99-0047 43.22624 -124.065 OREGON 1999 CATCHING SLOUGH OR99-0048 43.20993 -124.101 OREGON 1999 CATCHING SLOUGH OR99-0049 43.19278 -124.092 OREGON 1999 ROGUE RIVER OR99-0050 42.25353 -124.251 OREGON 1999 TILLAMOOK BAY OR99-0051 45.33106 -123.557 OREGON 1999 TILLAMOOK BAY OR99-0052 45.32825 -123.561 OREGON 1999 TILLAMOOK BAY OR99-0053 45.33083 -123.547 OREGON 1999 TILLAMOOK BAY OR99-0054 45.32038 -123.561 OREGON 1999 TILLAMOOK BAY OR99-0055 45.32322 -123.554 OREGON 1999 TILLAMOOK BAY OR99-0056 45.32166 -123.559 OREGON 1999 TILLAMOOK BAY OR99-0057 45.32279 -123.543 OREGON 1999 TILLAMOOK BAY OR99-0058 45.31667 -123.558 OREGON 1999 TILLAMOOK BAY OR99-0059 45.31864 -123.547 OREGON 1999 TILLAMOOK BAY OR99-0060 45.31424 -123.557 OREGON 1999 TILLAMOOK BAY OR99-0061 45.31049 -123.561 OREGON 1999 TILLAMOOK BAY OR99-0062 45.31424 -123.547 OREGON 1999 TILLAMOOK BAY OR99-0063 45.30644 -123.553 OREGON 1999 TILLAMOOK BAY OR99-0064 45.31033 -123.535 OREGON 1999 TILLAMOOK BAY OR99-0065 45.30551 -123.56 OREGON 1999 TILLAMOOK BAY OR99-0066 45.30887 -123.541 OREGON 1999 TILLAMOOK BAY OR99-0067 45.30181 -123.56 OREGON 1999 TILLAMOOK BAY OR99-0068 45.30534 -123.547 OREGON 1999 TILLAMOOK BAY OR99-0069 45.30684 -123.535 OREGON 1999 TILLAMOOK BAY OR99-0070 45.29868 -123.532 OREGON 1999 TILLAMOOK BAY OR99-0071 45.30365 -123.537 OREGON 1999 TILLAMOOK BAY OR99-0072 45.29853 -123.545 OREGON 1999 TILLAMOOK BAY OR99-0073 45.29827 -123.535 OREGON 1999 TILLAMOOK BAY OR99-0074 45.29454 -123.537 OREGON 1999 TILLAMOOK BAY OR99-0075 45.3003 -123.521 OREGON 1999 TILLAMOOK BAY OR99-0076 45.29727 -123.536 OREGON 1999 TILLAMOOK BAY OR99-0077 45.29464 -123.54 OREGON 1999 TILLAMOOK BAY OR99-0078 45.28834 -123.54 OREGON 1999 TILLAMOOK BAY OR99-0079 45.281 -123.531 OREGON 1999 TILLAMOOK RIVER OR99-0080 45.26483 -123.526

EPA Region 10 Office of Environmental Assessment March 2006
37
STATE YEAR ESTUARY NAME EMAP Station ID
LATITUDE LONGITUDE
WASHINGTON 2000 BOUNDARY BAY, WEST WA00-0001 48.98417 -122.993 WASHINGTON 2000 BOUNDARY BAY, SOUTH WA00-0002 48.95498 -122.951 WASHINGTON 2000 CHERRY POINT WA00-0003 48.81575 -122.719 WASHINGTON 2000 BELLINGHAM BAY WA00-0004 48.73828 -122.515 WASHINGTON 2000 SAMISH BAY/ BELLINGHAM WA00-0005 48.62525 -122.526 WASHINGTON 2000 PADILLA BAY, INNER WA00-0006 48.53133 -122.551 WASHINGTON 2000 FIDALGO BAY, INNER WA00-0007 48.49933 -122.6 WASHINGTON 2000 FIDALGO BAY, INNER WA00-0008 48.48667 -122.586 WASHINGTON 2000 SARATOGA PASSAGE, NORTH WA00-0009 48.24275 -122.622 WASHINGTON 2000 OAK HARBOR WA00-0010 48.27445 -122.652 WASHINGTON 2000 PENN COVE WA00-0011 48.2247 -122.711 WASHINGTON 2000 SARATOGA PASSAGE, MIDDLE WA00-0012 48.15833 -122.539 WASHINGTON 2000 POSSESSION SOUND WA00-0013 48.03952 -122.318 WASHINGTON 2000 EVERETT HARBOR, MIDDLE WA00-0014 47.98223 -122.223 WASHINGTON 2000 PORT TOWNSEND BAY, INNER WA00-0015 47.98157 -122.503 WASHINGTON 2000 USELESS/OAK BAY WA00-0016 48.04018 -122.743 WASHINGTON 2000 USELESS/OAK BAY WA00-0017 48.1204 -122.622 WASHINGTON 2000 POSSESSION SOUND WA00-0018 47.9075 -122.338 WASHINGTON 2000 PORT MADISON WA00-0019 47.72597 -122.531 WASHINGTON 2000 LIBERTY BAY, OUTER WA00-0020 47.71493 -122.63 WASHINGTON 2000 ELLIOT BAY, NORTHEAST WA00-0021 47.6239 -122.374 WASHINGTON 2000 DUAMISH RIVER - EAST WATERWAY WA00-0022 47.58417 -122.344 WASHINGTON 2000 PORT LUDLOW WA00-0023 47.99372 -122.678 WASHINGTON 2000 HOOD CANAL (NORTH) WA00-0024 47.8363 -122.579 WASHINGTON 2000 PORT GAMBLE BAY WA00-0025 47.92443 -122.68 WASHINGTON 2000 DABOB BAY WA00-0026 47.82138 -122.819 WASHINGTON 2000 DABOB BAY WA00-0027 47.73425 -122.844 WASHINGTON 2000 HOOD CANAL (CENTRAL) WA00-0028 47.42163 -123.11 WASHINGTON 2000 HOOD CANAL (SOUTH) WA00-0029 47.8415 -122.646 WASHINGTON 2000 HOOD CANAL (SOUTH) WA00-0030 47.39667 -122.956 WASHINGTON 2000 PORT OF SHELTON WA00-0031 47.20893 -123.081 WASHINGTON 2000 BUDD INLET WA00-0032 47.12948 -122.914 WASHINGTON 2000 PORT OF OLYMPIA WA00-0033 47.05633 -123.896 WASHINGTON 2000 CASE INLET WA00-0034 47.27117 -122.852 WASHINGTON 2000 EAST ANDERSON ISLAND WA00-0035 47.14957 -122.659 WASHINGTON 2000 HALE PASSAGE WA00-0036 47.25463 -122.598 WASHINGTON 2000 GIG HARBOR WA00-0037 47.33752 -122.584 WASHINGTON 2000 COLVOS PASSAGE WA00-0038 47.51067 -122.486 WASHINGTON 2000 COLVOS PASSAGE WA00-0039 47.47235 -122.507 WASHINGTON 2000 S.E. COMMENCEMENT BAY WA00-0040 47.2846 -122.472 WASHINGTON 2000 HYLEBOS WATERWAY WA00-0041 47.27855 -122.398 CANADA 2000 ROSARIO STRAIT WA00-0042 48.93723 -123.735 CANADA 2000 STRAIT OF GEORGIA WA00-0043 48.9524 -123.363 CANADA 2000 STUART CHANNEL (MIDDLE) WA00-0044 48.86519 -123.599 WASHINGTON 2000 STRAIT OF GEORGIA WA00-0045 48.93708 -123.201 WASHINGTON 2000 STRAIT OF GEORGIA WA00-0046 48.95555 -123.004 WASHINGTON 2000 STRAIT OF GEORGIA WA00-0047 48.90143 -122.925

EPA Region 10 Office of Environmental Assessment March 2006
38
STATE YEAR ESTUARY NAME EMAP Station ID
LATITUDE LONGITUDE
CANADA 2000 SWANSON CHANNEL WA00-0048 48.80498 -123.395 CANADA 2000 STUART CHANNEL (SOUTH) WA00-0049 48.71188 -123.528 WASHINGTON 2000 CHERRY POINT WA00-0050 48.82385 -122.73 CANADA 2000 BOUNDARY PASS WA00-0051 48.74782 -123.092 WASHINGTON 2000 PRESIDENT CHANNEL WA00-0052 48.71291 -123 WASHINGTON 2000 PRESIDENT CHANNEL WA00-0053 48.70131 -122.995 CANADA 2000 CORDOVA CHANNEL WA00-0054 48.57157 -123.335 WASHINGTON 2000 WEST SOUND WA00-0055 48.62548 -122.961 WASHINGTON 2000 DEER HARBOR WA00-0056 48.61167 -123 WASHINGTON 2000 SAN JUAN CHANNEL WA00-0057 48.58917 -123.019 WASHINGTON 2000 EAST SOUND WA00-0058 48.61069 -122.838 WASHINGTON 2000 SAN JUAN CHANNEL WA00-0059 48.54453 -122.98 WASHINGTON 2000 LOPEZ SOUND WA00-0060 48.52361 -122.847 WASHINGTON 2000 SAN JUAN CHANNEL WA00-0061 48.50041 -122.957 WASHINGTON 2000 GRIFFIN BAY WA00-0062 48.48797 -122.997 CANADA 2000 BAYNES CHANNEL WA00-0063 48.4262 -123.288 WASHINGTON 2000 MIDDLE CHANNEL WA00-0064 48.38886 -122.92 WASHINGTON 2000 STRAIT OF JUAN DE FUCA (EAST) WA00-0065 48.32328 -123.055 WASHINGTON 2000 STRAIT OF JUAN DE FUCA (EAST) WA00-0066 48.3159 -122.8 WASHINGTON 2000 STRAIT OF JUAN DE FUCA (EAST) WA00-0067 48.19263 -123.024 WASHINGTON 2000 ADMIRALTY BAY WA00-0068 48.11994 -122.623 WASHINGTON 2000 MUTINY BAY WA00-0069 47.96587 -122.554 WASHINGTON 2000 ADMIRALTY INLET (SOUTH) WA00-0070 47.86602 -122.419 WASHINGTON 2000 PUGET SOUND WA00-0071 47.59016 -122.428 WASHINGTON 1999 MAKAH BAY WA99-0001 48.19197 -124.408 WASHINGTON 1999 MAKAH BAY WA99-0002 48.18824 -124.402 WASHINGTON 1999 MAKAH BAY WA99-0003 48.183 -124.402 WASHINGTON 1999 HOKO RIVER WA99-0004 48.17287 -124.219 WASHINGTON 1999 OZETTE RIVER WA99-0005 48.10873 -124.425 WASHINGTON 1999 FRESHWATER BAY WA99-0006 48.08958 -123.38 WASHINGTON 1999 FRESHWATER BAY WA99-0007 48.08878 -123.361 WASHINGTON 1999 FRESHWATER BAY WA99-0008 48.08586 -123.37 WASHINGTON 1999 DUNGENESS BAY WA99-0009 48.09579 -123.089 WASHINGTON 1999 DISCOVERY BAY WA99-0010 48.04758 -122.54 WASHINGTON 1999 DISCOVERY BAY WA99-0011 48.03478 -122.543 WASHINGTON 1999 DISCOVERY BAY WA99-0012 48.01248 -122.516 WASHINGTON 1999 DISCOVERY BAY WA99-0013 48.00182 -122.506 WASHINGTON 1999 DISCOVERY BAY WA99-0014 47.59839 -122.524 WASHINGTON 1999 KALALOCH CREEK WA99-0015 47.36379 -124.224 WASHINGTON 1999 RAFT RIVER WA99-0016 47.27751 -124.203 WASHINGTON 1999 QUINAULT RIVER WA99-0017 47.20816 -124.179 WASHINGTON 1999 QUINAULT RIVER WA99-0018 -99.99 99.99 WASHINGTON 1999 CONNER CREEK WA99-0019 47.05356 -124.106 WASHINGTON 1999 GRAYS HARBOR WA99-0020 47.00251 -124.024 WASHINGTON 1999 GRASS CREEK WA99-0021 47.00318 -123.6 WASHINGTON 1999 GRAYS HARBOR WA99-0022 46.57931 -123.571 WASHINGTON 1999 GRAYS HARBOR WA99-0023 46.56396 -124.062

EPA Region 10 Office of Environmental Assessment March 2006
39
STATE YEAR ESTUARY NAME EMAP Station ID
LATITUDE LONGITUDE
WASHINGTON 1999 GRAYS HARBOR WA99-0024 46.56105 -124.017 WASHINGTON 1999 GRAYS HARBOR WA99-0025 46.57992 -123.515 WASHINGTON 1999 GRAYS HARBOR WA99-0026 46.55256 -124.04 WASHINGTON 1999 BEARDSLEE SLOUGH WA99-0027 46.52354 -124.02 WASHINGTON 1999 BEARDSLEE SLOUGH WA99-0028 46.52216 -124.013 WASHINGTON 1999 GRAYS HARBOR WA99-0029 46.50898 -124.019 WASHINGTON 1999 WILLAPA BAY WA99-0030 46.42902 -124.027 WASHINGTON 1999 WILLAPA BAY WA99-0031 46.42244 -123.532 WASHINGTON 1999 WILLAPA BAY WA99-0032 -99.99 99.99 WASHINGTON 1999 WILLAPA BAY WA99-0033 46.38973 -124.007 WASHINGTON 1999 WILLAPA BAY WA99-0034 46.34047 -123.565 WASHINGTON 1999 WILLAPA BAY WA99-0035 46.32311 -123.554 WASHINGTON 1999 WILLAPA BAY WA99-0036 46.25063 -123.251 WASHINGTON 1999 WILLAPA BAY WA99-0037 -99.99 99.99 WASHINGTON 1999 BAKER BAY WA99-0038 46.18577 -124.006 WASHINGTON 1999 BAKER BAY WA99-0039 46.18082 -124.016 WASHINGTON 1999 BAKER BAY WA99-0040 46.16402 -123.584 WASHINGTON 1999 GRAYS RIVER WA99-0041 -99.99 99.99 WASHINGTON 1999 BAKER BAY WA99-0042 46.15784 -123.599 WASHINGTON 1999 GRAYS BAY WA99-0043 46.181 -123.426 WASHINGTON 1999 GRAYS BAY WA99-0044 46.17998 -123.419 WASHINGTON 1999 GRAYS BAY WA99-0045 46.17716 -123.422 WASHINGTON 1999 GRAYS BAY WA99-0046 46.17232 -123.436 WASHINGTON 1999 GRAYS BAY WA99-0047 46.16495 -123.43 WASHINGTON 1999 COWLITZ RIVER WA99-0048 46.05688 -122.553 WASHINGTON 1999 CARROLLS CHANNEL WA99-0049 46.05073 -122.528 WASHINGTON 1999 MARTIN SLOUGH WA99-0050 45.56797 -122.472

EPA Region 10 Office of Environmental Assessment March 2006
40
Appendix 2. Chemicals measured in sediments and fish tissues. CHEMICAL CATECORY CHEMICALS Polynuclear Aromatic Hydrocarbons (PAHs)
Acenaphthene Anthracene Benz(a)anthracene Benzo(a)pyrene Biphenyl Chrysene Chrysene(C1-C4) Dibenz(a,h)anthracene Dibenzothiophene Dibenzothiophene(C1-C3) 2,6-dimethylnaphthalene Fluoranthene Fluorene Fluorene(C1-C3)
2-methylnaphthalene 1-methylnaphthalene 1-methylphenanthrene 2,6-dimethylnaphtalene Naphthalene Naphtalene(C1-C4) Phenanthene Pyrene Benzo(b)fluoranthene Acenaphthylene Benzo(k)fluoranthene Benzo(g,h,i)perylene Ideno(1,2,3-c,d)pyrene 2,3,5-trimethylnaphthalene
PCB Congeners PCB No. Compound Name
8 2,4'-dichlorobiphenyl 18 2,2',5-trichlorobiphenyl 28 2,4,4'-trichlorobiphenyl 44 2,2',3,5'-tetrachlorobiphenyl 52 2,2',5,5'-tetrachlorobiphenyl 66 2,3',4,4'-tetrachlorobiphenyl 101 2,2',4,5,5'-pentachlorobiphenyl 105 2,3,3',4,4'-pentachlorobiphenyl 110/77 2,3,3',4',6-pentachlorobiphenyl 3,3',4,4'-tetrachlorobiphenyl 118 2,3,4,4',5-pentachlorobiphenyl
PCB No. Compound Name 126 3,3,4,4',5-pentachlorobiphenyl 128 2,2',3,3',4,4'-hexachlorobiphenyl 138 2,2',3,4,4',5'-hexachlorobiphenyl 153 2,2',4,4',5,5'-hexachlorobiphenyl 170 2,2',3,3',4,4',5-heptachlorobiphenyl 180 2,2',3,4,4',5,5'-heptachlorobiphenyl 187 2,2',3,4',5,5',6-heptachlorobiphenyl 195 2,2',3,3',4,4',5,6-octachlorobiphenyl 206 2,2',3,3',4,4',5,5',6-nonachlorobiphenyl 209 2,2'3,3',4,4',5,5',6,6'-decachlorobiphenyl
DDT and its metabolites
2,4'-DDD 4,4'-DDD 2,4'-DDE
4,4'-DDE 2,4'-DDT 4,4'-DDT
Chlorinated pesticides other than DDT Aldrin
Alpha-Chlordane Dieldrin Endosulfan I Endosulfan II Endosulfan sulfate Endrin
Heptachlor Heptachlor epoxide Hexachlorobenzene Lindane (gamma-BHC) Mirex Toxaphene Trans-Nonachlor
Trace Elements
Aluminum Antimony (sediment only) Arsenic Cadmium Chromium Copper Iron Lead
Manganese (sediment only) Mercury Nickel Selenium Silver Tin Zinc
Other Measurements Total organic carbon (sediments)

EPA Region 10 Office of Environmental Assessment March 2006
41
Appendix 3. Summary statistics for water chemistry and habitat indicators. Total estuarine area is 8670 square kilometers. Indicator Units N Mean 95%
Confidence Median Minimum Range of
Detected Results
Variance Standard Deviation
Standard Error
Water Clarity – Light transmissivity at 1m
% 224 21.674 22.182 16.800 ND* 0.1 - 87.600
438.126 20.931 0.259
Secchi Depth m 238 3.093 3.153 2.000 0.100 0.1- 12.500
6.898 2.626 0.030
Dissolved Oxygen - Bottom
mg/l 242 7.747 7.787 8.000 0.100 0.1- 11.500
3.315 1.821 0.021
Dissolved Oxygen - Surface
mg/l 242 8.260 8.291 8.100 3.400 3.400-11.500
1.864 1.365 0.016
Chlorophyll a ug/l 244 4.667 4.760 3.600 ND* 0.2933 -31.110
17.441 4.176 0.047
Mean Orthophosphate Phosphorus
ug/l 244 30.510 30.957 24.625 ND* 0.53 - 106.537
403.694 20.092 0.228
Mean Total Dissolved Nitrogen
ug/l 244 135.515 137.696 118.510 3.230 3.230 -640.770
9615.794 98.060 1.113
Mean Nitrogen to Phosphorus Ratio
ratio 238 17.672 18.351 11.507 0.164 0.164 -178.455
929.692 30.491 0.347
Total Suspended Solids mg/l 244 7.437 7.631 6.000 ND* 0.5 - 230.000
76.322 8.736 0.099
*ND = not detected Summary statistics were calculated with non-detects set to zero.

EPA Region 10 Office of Environmental Assessment March 2006
42
Appendix 4. Summary statistics for sediment characteristics. Total estuarine area is 8670 square kilometers. Indicator Units N Mean 95%
Confidence Median Minimum Detection
Frequency** Range of Dectected Results
Variance Standard Deviation
Standard Error
Antimony ug/g dry wt 225 0.356 0.371 0.24 ND* 32% 0.14- 5.66
0.431 0.657 0.008
Aldrin ng/g dry wt 225 0.0104 0.013 ND* ND* 3.5% 0.45- 2.9
0.0155 0.125 0.002
Aluminum ug/g dry wt 225 68771.64 69258.92 75100 8750 100% 8750 -95900
4.31E+08 20758.28 248.571
Arsenic
ug/g dry wt
225
6.601
6.675
6.340
ND* 0.69 - >99% 20.800
10.016
3.1650.038
Cadmium
ug/g dry wt
225
0.191
0.200
0.068
ND* 0.012 - 2.310 44%
0.145
0.3800.005
Chlordane ng/g dry wt 225 0.019 0.0225 ND* ND* <1% 1.0 - 1.4 0.023 0.152 0.002
Chromium
ug/g dry wt
225
70.570
71.285
72.4
12.3
100 %
12.3 - 328.0
927.668
30.458 0.365
Copper
ug/g dry wt
225
24.431
25.029
17.6
2.060
100 %
2.06 - 219.0
650.970
25.514 0.306
DDE ng/g dry wt 225 0.159 0.176 ND* ND* 9.7% 0.27 - 6.7 0.487 0.698 0.008
DDT - Total ng/g dry wt 225 0.296 0.328 ND* ND* 11% 0.27 - 12 1.684 1.298 0.016
Dieldrin ng/g dry wt 225 0.005 0.007 ND* ND* <1% 1.5 - 1.8 0.007 0.085 0.001
Endosulfan Sulfate ng/g dry wt 225 0.0594 0.074 ND* ND* 6% 1.05 - 11.8 0.367 0.606 0.007
Endosulfan I ng/g dry wt 225 0.004 0.007 ND* ND* <1% 3.8 - 3.8 0.0145 0.120 0.001
Endosulfan II ng/g dry wt 225 0.002 0.003 ND* ND* <1% 1.75 - 1.75 0.003 0.051 0.001
Endrin ng/g dry wt 225 0.002 0.004 ND* ND* <1% 2.7 - 2.7 0.006 0.079 0.001
Heptachlor ng/g dry wt 223 0.050 0.058 ND* ND* 10% 0.6 - 3.7 0.114 0.337 0.004
Heptachlor Epoxide ng/g dry wt 225 0.008 0.013 ND* ND* 1.3% 1.3 - 6.7 0.048 0.219 0.003
Hexachlorobenzene ng/g dry wt 225 0.234 0.284 ND* ND* 5.7% 0.65 - 33.05
4.473 2.115 0.025
Iron ug/g dry wt 225 33701.05 33998.64 35700 6000 100% 6000 -126000
1.61E+08 12677.48 151.807
Lead
ug/g dry wt
225
12.858
13.034
11.6
1.470
100 %
1.47 - 51.3 56.212
7.497
0.090
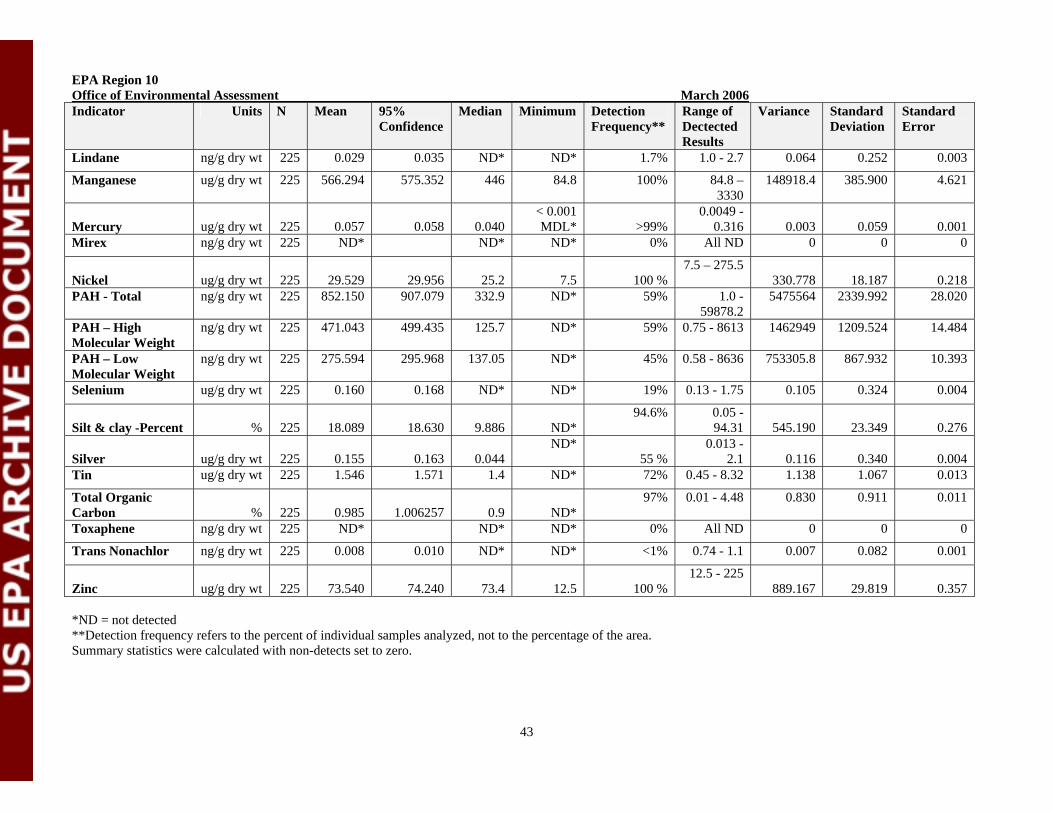
EPA Region 10 Office of Environmental Assessment March 2006
43
Indicator Units N Mean 95% Confidence
Median Minimum Detection Frequency**
Range of Dectected Results
Variance Standard Deviation
Standard Error
Lindane ng/g dry wt 225 0.029 0.035 ND* ND* 1.7% 1.0 - 2.7 0.064 0.252 0.003
Manganese ug/g dry wt 225 566.294 575.352 446 84.8 100% 84.8 – 3330
148918.4 385.900 4.621
Mercury
ug/g dry wt
225
0.057
0.058
0.040
< 0.001 MDL*
>99%
0.0049 - 0.316
0.003
0.059
0.001
Mirex ng/g dry wt 225 ND* ND* ND* 0% All ND 0 0 0
Nickel
ug/g dry wt
225
29.529
29.956
25.2
7.5
100 %
7.5 – 275.5 330.778
18.187
0.218
PAH - Total ng/g dry wt 225 852.150 907.079 332.9 ND* 59% 1.0 - 59878.2
5475564 2339.992 28.020
PAH – High Molecular Weight
ng/g dry wt 225 471.043 499.435 125.7 ND* 59% 0.75 - 8613 1462949 1209.524 14.484
PAH – Low Molecular Weight
ng/g dry wt 225 275.594 295.968 137.05 ND* 45% 0.58 - 8636 753305.8 867.932 10.393
Selenium ug/g dry wt 225 0.160 0.168 ND* ND* 19% 0.13 - 1.75 0.105 0.324 0.004
Silt & clay -Percent
%
225
18.089
18.630
9.886
ND*
94.6% 0.05 -94.31
545.190
23.349
0.276
Silver
ug/g dry wt
225
0.155
0.163
0.044
ND* 0.013 - 55 % 2.1
0.116
0.340
0.004
Tin ug/g dry wt 225 1.546 1.571 1.4 ND* 72% 0.45 - 8.32 1.138 1.067 0.013
Total Organic Carbon
%
225
0.985
1.006257
0.9
ND*
97% 0.01 - 4.48 0.830 0.911 0.011
Toxaphene ng/g dry wt 225 ND* ND* ND* 0% All ND 0 0 0
Trans Nonachlor ng/g dry wt 225 0.008 0.010 ND* ND* <1% 0.74 - 1.1 0.007 0.082 0.001
Zinc
ug/g dry wt
225
73.540
74.240
73.4
12.5
100 %
12.5 - 225 889.167
29.819
0.357
*ND = not detected **Detection frequency refers to the percent of individual samples analyzed, not to the percentage of the area. Summary statistics were calculated with non-detects set to zero.

EPA Region 10 Office of Environmental Assessment March 2006
44
Appendix 5. Summary statistics for contaminants in fish tissue. Total estuarine area is 8670 square kilometers. Tissue Parameter Units N Mean 95%
Confidence Median
Detection
Frequency** Range of Detected Results
Variance Standard Deviation
Standard Errror
Aldrin ng/g wet wt 188 0.003 0.005 ND* 3 1.6 - 2.398
0.005 0.074 0.001
Aluminum ug/g wet wt 179 108.894 110.848 91.7 98 0.5313 - 568.170
6502.980 80.641 0.996
Inorganic Arsenic ug/g wet wt 179 .0564 .0577 .0492 84 0.0905 - .595
.003 .0517 0.001
Cadmium ug/g wet wt 179 0.006 0.006 ND* 66 0.01001 - 0.2
0.001 0.023 0.000
Chlordane ng/g wet wt 188 0.073 0.081 ND* 9 0.125 - 4.855
0.100 0.317 0.004
Chromium ug/g wet wt 179 0.300 0.317 ND* 72 0.0671 - 5.313
0.461 0.679 0.008
Copper ug/g wet wt 179 0.308 0.331 ND* 97 0.2140 - 7.771
0.853 0.923 0.011
Dieldrin ng/g wet wt 188 0.066 0.080 ND* 53 0.48 - 14.787
0.369 0.607 0.007
Endosulfan I ng/g wet wt 188 0.024 0.029 ND* 3 2.025 - 5.168
0.059 0.242 0.003
Endosulfan II ng/g wet wt 188 0.126 0.160 ND* 8 0.9 - 40.223
1.988 1.410 0.017
Endosulfan Sulfate ng/g wet wt 188 0.056 0.073 ND* 19 2.633 - 21.4
0.497 0.705 0.009
Endrin ng/g wet wt 188 0.120 0.147 ND* 10 0.788 - 27.063
1.286 1.134 0.014
Heptachlor ng/g wet wt 188 0.018 0.025 ND* 9 0.985 - 9.8
0.079 0.282 0.003
Heptachlor epoxide ng/g wet wt 188 0.009 0.013 ND* 2 1.044 - 4.464
0.027 0.165 0.002
Hexachlorobenzene ng/g wet wt 188 0.290 0.361 ND* 33 0.43 - 32 8.554 2.925 0.036 Iron ug/g wet wt 179 100.112 102.754 81 100 5.2 -
1090 11903.146 109.102 1.348
Lead ug/g wet wt 179 0.132 0.135 0.099 49 0.09 - 0.967
0.018 0.136 0.002

EPA Region 10 Office of Environmental Assessment March 2006
45
Tissue Parameter Units N Mean 95% Confidence
Median
Detection Frequency**
Range of Detected Results
Variance Standard Deviation
Standard Errror
Lindane ng/g wet wt 188 0.000 0.001 ND* 0 0.25 - 1.62
0.000 0.020 0.000
Mercury ug/g wet wt 179 0.029 0.029 0.027 87 0.016 -0.257
0.000 0.021 0.000
Mirex ng/g wet wt 188 0.000 ND* 0 All ND 0.000 0.000 0.000 Nickel ug/g wet wt 179 0.068 0.080 ND* 30 0.3 -
13.169 0.239 0.488 0.006
PPDDE ng/g wet wt 188 9.509 10.224 3.6 78 0.34- 872.737405.444
29.542 0.365
Selenium ug/g wet wt 179 0.234 0.248 ND* 96 1 - 2.39
0.340 0.583 0.007
Silver ug/g wet wt 179 0.005 0.006 ND* 25 0.01 -0.28
0.001 0.024 0.000
Tin ug/g wet wt 156 5.918 6.065 5.37 45 0.13-56.5 35.869 5.989 0.075Total DDT ng/g wet wt 188 13.751 14.792 4.5 81 0.34 -
493.644 1843.961 42.941 0.531
Total EMAP PCBs ng/g wet wt 188 31.763 33.966 8.06 82 0.34- 769.7
8286.177 91.028 1.124
Toxaphene ng/g wet wt 188 0.000 ND* 0 All ND 0.000 0.000 0.000 Trans nonachlor ng/g wet wt 188 0.320 0.360 ND* 26 0.19 -
46.066 2.745 1.657 0.020
Zinc ug/g wet wt 179 13.661 13.554 12.9 100 7.59 -39.060
14.63 3.824 0.047
* ND = Not Detected **Detection frequency refers to the percent of individual samples analyzed, not to the percentage of the area. Summary statistics were calculated with non-detects set to zero.

EPA Region 10 Office of Environmental Assessment March 2006
46
Appendix 6. Benthic invertebrate species from 1999-2000. Species are identified as Native (N) or Non-Indigenous (NIS) species, or blank where it unknown. Freshwater sites have <5 psu bottom salinity, Intermediate sites have >5 psu and < 25 psu bottom salinity, and Marine sites have >25psu bottom salinity. Species Native (N)/Non-
Indigenous (NIS) # of total sites
Found at Freshwater sites
Found at Intermediate sites
Found at Marine Sites
Abarenicola pacifica N 1 Yes Abietinaria sp 7 Yes Acanthoptilum gracile 1 Yes Acarina 5 Yes Yes Yes Achelia alaskensis N 2 Yes Achelia echinata NIS 3 Yes Acila castrensis 26 Yes Acteocina culcitella 9 Yes Acteocina eximia 1 Yes Acteocina harpa 2 Yes Actiniaria 1 Yes Actiniidae 3 Yes Yes Adontorhina cyclia 11 Yes Aglaja ocelligera 2 Yes Aglaophenia sp 1 Yes Agraylea sp 2 Yes Alcyonidium sp 3 Yes Alia carinata N 3 Yes Alienacanthomysis macropsis 1 Yes Alvania compacta N 33 Yes Amaeana occidentalis N 1 Yes Amage anops 2 Yes Americhelidium millsi 3 Yes Americhelidium rectipalmum 1 Yes Americhelidium shoemakeri N 6 Yes Americhelidium variabilum 2 Yes Americorophium salmonis N 75 Yes Yes Yes Americorophium sp 20 Yes Yes Yes Americorophium spinicorne N 26 Yes Yes Yes Ampelisca agassizi 3 Yes Ampelisca brachycladus 1 Yes Ampelisca brevisimulata 4 Yes Ampelisca careyi N 16 Yes Ampelisca hancocki Cmplx 3 Yes Ampelisca lobata 3 Yes Ampelisca pugetica 9 Yes Ampelisca sp 11 Yes Ampharete acutifrons 10 Yes Ampharete cf crassiseta 8 Yes Ampharete finmarchica 13 Yes

EPA Region 10 Office of Environmental Assessment March 2006
47
Species Native (N)/Non-Indigenous (NIS)
# of total sites
Found at Freshwater sites
Found at Intermediate sites
Found at Marine Sites
Ampharete labrops N 7 Yes Ampharete sp 5 Yes Ampharetidae 6 Yes Amphicteis glabra 1 Yes Amphicteis mucronata 1 Yes Amphicteis scaphobranchiata 1 Yes Amphilochus neapolitanus Cmplx
1 Yes
Amphiodia occidentalis 1 Yes Amphiodia periercta 4 Yes Amphiodia sp 28 Yes Amphiodia urtica 12 Yes Amphipholis pugetana 3 Yes Amphipholis sp 4 Yes Amphipholis squamata 6 Yes Amphipoda 1 Yes Amphiporus sp 5 Yes Amphissa columbiana 5 Yes Amphitrite edwardsi 2 Yes Amphitrite robusta 2 Yes Amphiura sp 1 Yes Amphiuridae 18 Yes Ampithoe lacertosa 1 Yes Ampithoe sp 4 Yes Yes Ampithoe valida NIS 4 Yes Anchicolurus occidentalis N 1 Yes Anisogammarus pugettensis N 1 Yes Anobothrus gracilis 7 Yes Anonyx cf lilljeborgi 4 Yes Anonyx sp 1 Yes Anopla 2 Yes Anoplodactylus viridintestinalis 1 Yes Antropora tincta 1 Yes Aoroides columbiae 1 Yes Aoroides exilis 1 Yes Aoroides intermedius 3 Yes Aoroides sp 8 Yes Aoroides spinosa 4 Yes Aphelochaeta glandaria N 29 Yes Aphelochaeta monilaris N 19 Yes Aphelochaeta sp 15 Yes Yes Aphelochaeta tigrina 3 Yes Aphrodita japonica 1 Yes Aphrodita negligens 1 Yes Aphrodita sp 2 Yes

EPA Region 10 Office of Environmental Assessment March 2006
48
Species Native (N)/Non-Indigenous (NIS)
# of total sites
Found at Freshwater sites
Found at Intermediate sites
Found at Marine Sites
Apistobranchus ornatus 5 Yes Araphura breviaria 2 Yes Araphura cuspirostris 1 Yes Archaeomysis grebnitzkii N 18 Yes Yes Yes Archidistoma sp 1 Yes Arcteobia cf anticostiensis 2 Yes Argissa hamatipes 1 Yes Aricidea (Acmira) catherinae 2 Yes Aricidea (Acmira) lopezi 23 Yes Aricidea (Allia) ramosa 8 Yes Aricidea sp 3 Yes Armandia brevis N 26 Yes Yes Artacama coniferi 4 Yes Asabellides lineata 5 Yes Asabellides sibirica 3 Yes Ascidia sp 1 Yes Ascidiacea 1 Yes Asclerocheilus beringianus 1 Yes Astarte esquimalti 2 Yes Asteroidea 1 Yes Astyris gausapata N 25 Yes Atylus levidensus 1 Yes Autolytus sp 2 Yes Axinopsida serricata N 55 Yes Axiothella rubrocincta 5 Yes Balanomorpha 1 Yes Balanophyllia elegans 1 Yes Balanus crenatus N 3 Yes Balanus glandula 1 Yes Balanus sp 1 Yes Balcis sp 1 Yes Bankia setacea 1 Yes Barantolla nr americana N 17 Yes Yes Barentsia benedeni 2 Yes Barentsia parva 3 Yes Bathyleberis sp 6 Yes Bathymedon pumilus 2 Yes Bispira elegans 1 Yes Bittium sp 4 Yes Bivalvia 6 Yes Yes Bivalvia sp 1 3 Yes Boccardia pugettensis 5 Yes Boccardiella hamata 2 Yes

EPA Region 10 Office of Environmental Assessment March 2006
49
Species Native (N)/Non-Indigenous (NIS)
# of total sites
Found at Freshwater sites
Found at Intermediate sites
Found at Marine Sites
Boccardiella ligerica NIS 2 Yes Boltenia villosa 2 Yes Bonelliidae 1 Yes Bougainvilliidae 2 Yes Bowerbankia gracilis 8 Yes Brada sachalina 4 Yes Brada villosa 1 Yes Brisaster latifrons 2 Yes Bugula pacifica 1 Yes Bugula sp 1 Yes Byblis millsi 7 Yes Bylgides macrolepidus 2 Yes Caberea ellisi 2 Yes Caecidotea racovitzai NIS 3 Yes Caecum occidentale N 2 Yes Caecum sp 1 Yes Calanoida 11 Yes Caligidae 1 Yes Calliostoma ligatum 1 Yes Callipallene pacifica 1 Yes Calocarides sp 2 Yes Calocarides spinulicauda 1 Yes Calycella syringa 1 Yes Calyptraea fastigiata 4 Yes Campanulariidae 3 Yes Campylaspis hartae 1 Yes Cancer gracilis 4 Yes Cancer magister N 4 Yes Cancer oregonensis N 5 Yes Cancer productus 1 Yes Cancer sp 1 Yes Capitella capitata Cmplx 54 Yes Yes Capitellidae 2 Yes Caprella californica N 2 Yes Caprella drepanochir 2 Yes Caprella laeviuscula 9 Yes Caprella mendax 3 Yes Caprella pilidigitata 1 Yes Caprella sp 3 Yes Cardiomya pectinata 5 Yes Carinoma mutabilis N 10 Yes Carinomella lactea 1 Yes Caulibugula californica 1 Yes Caulibugula ciliata 2 Yes
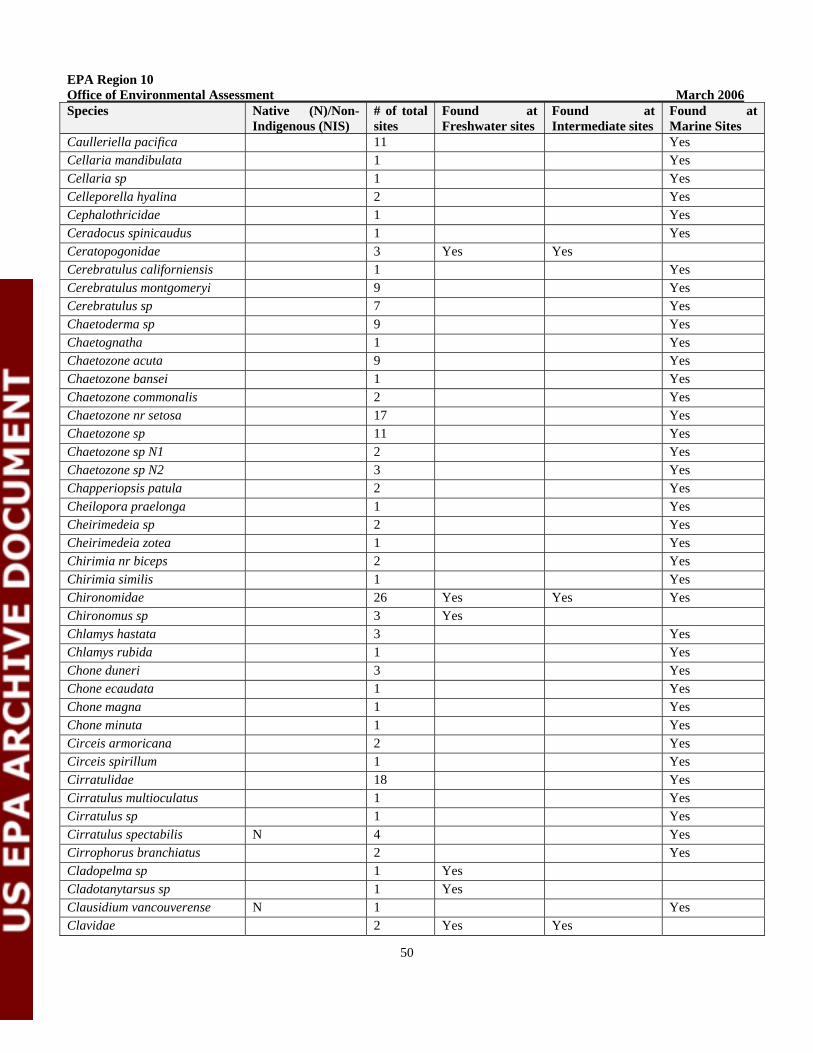
EPA Region 10 Office of Environmental Assessment March 2006
50
Species Native (N)/Non-Indigenous (NIS)
# of total sites
Found at Freshwater sites
Found at Intermediate sites
Found at Marine Sites
Caulleriella pacifica 11 Yes Cellaria mandibulata 1 Yes Cellaria sp 1 Yes Celleporella hyalina 2 Yes Cephalothricidae 1 Yes Ceradocus spinicaudus 1 Yes Ceratopogonidae 3 Yes Yes Cerebratulus californiensis 1 Yes Cerebratulus montgomeryi 9 Yes Cerebratulus sp 7 Yes Chaetoderma sp 9 Yes Chaetognatha 1 Yes Chaetozone acuta 9 Yes Chaetozone bansei 1 Yes Chaetozone commonalis 2 Yes Chaetozone nr setosa 17 Yes Chaetozone sp 11 Yes Chaetozone sp N1 2 Yes Chaetozone sp N2 3 Yes Chapperiopsis patula 2 Yes Cheilopora praelonga 1 Yes Cheirimedeia sp 2 Yes Cheirimedeia zotea 1 Yes Chirimia nr biceps 2 Yes Chirimia similis 1 Yes Chironomidae 26 Yes Yes Yes Chironomus sp 3 Yes Chlamys hastata 3 Yes Chlamys rubida 1 Yes Chone duneri 3 Yes Chone ecaudata 1 Yes Chone magna 1 Yes Chone minuta 1 Yes Circeis armoricana 2 Yes Circeis spirillum 1 Yes Cirratulidae 18 Yes Cirratulus multioculatus 1 Yes Cirratulus sp 1 Yes Cirratulus spectabilis N 4 Yes Cirrophorus branchiatus 2 Yes Cladopelma sp 1 Yes Cladotanytarsus sp 1 Yes Clausidium vancouverense N 1 Yes Clavidae 2 Yes Yes
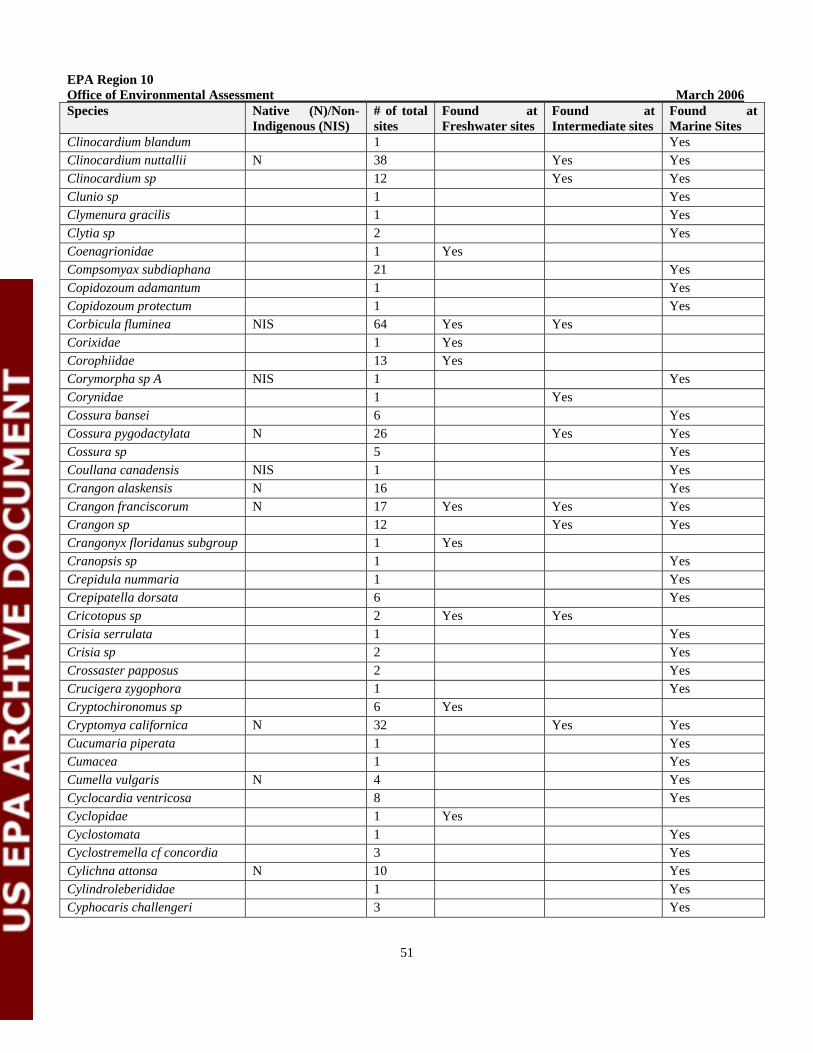
EPA Region 10 Office of Environmental Assessment March 2006
51
Species Native (N)/Non-Indigenous (NIS)
# of total sites
Found at Freshwater sites
Found at Intermediate sites
Found at Marine Sites
Clinocardium blandum 1 Yes Clinocardium nuttallii N 38 Yes Yes Clinocardium sp 12 Yes Yes Clunio sp 1 Yes Clymenura gracilis 1 Yes Clytia sp 2 Yes Coenagrionidae 1 Yes Compsomyax subdiaphana 21 Yes Copidozoum adamantum 1 Yes Copidozoum protectum 1 Yes Corbicula fluminea NIS 64 Yes Yes Corixidae 1 Yes Corophiidae 13 Yes Corymorpha sp A NIS 1 Yes Corynidae 1 Yes Cossura bansei 6 Yes Cossura pygodactylata N 26 Yes Yes Cossura sp 5 Yes Coullana canadensis NIS 1 Yes Crangon alaskensis N 16 Yes Crangon franciscorum N 17 Yes Yes Yes Crangon sp 12 Yes Yes Crangonyx floridanus subgroup 1 Yes Cranopsis sp 1 Yes Crepidula nummaria 1 Yes Crepipatella dorsata 6 Yes Cricotopus sp 2 Yes Yes Crisia serrulata 1 Yes Crisia sp 2 Yes Crossaster papposus 2 Yes Crucigera zygophora 1 Yes Cryptochironomus sp 6 Yes Cryptomya californica N 32 Yes Yes Cucumaria piperata 1 Yes Cumacea 1 Yes Cumella vulgaris N 4 Yes Cyclocardia ventricosa 8 Yes Cyclopidae 1 Yes Cyclostomata 1 Yes Cyclostremella cf concordia 3 Yes Cylichna attonsa N 10 Yes Cylindroleberididae 1 Yes Cyphocaris challengeri 3 Yes

EPA Region 10 Office of Environmental Assessment March 2006
52
Species Native (N)/Non-
Indigenous (NIS) # of total sites
Found at Freshwater sites
Found at Intermediate sites
Found at Marine Sites
Cytherideidae 1 Yes Decamastus gracilis N 8 Yes Deflexilodes enigmaticus 2 Yes Deflexilodes similis 2 Yes Delectopecten vancouverensis 1 Yes Demicryptochironomus sp 1 Yes Demonax rugosus 3 Yes Demonax sp 2 Yes Demospongiae 4 Yes Dendraster excentricus N 7 Yes Dendrobeania lichenoides 3 Yes Dendrochirotida 3 Yes Desdimelita desdichada 7 Yes Deutella californica 1 Yes Diaperoecia sp 2 Yes Diaphana californica 6 Yes Diastylis alaskensis 3 Yes Diastylis bidentata 3 Yes Diastylis pellucida 6 Yes Diastylis santamariensis N 10 Yes Diastylis sentosa 3 Yes Diastylis sp 1 Yes Diastylopsis dawsoni N 3 Yes Diastylopsis tenuis N 1 Yes Dichonemertes hartmanae 1 Yes Dicrotendipes sp 3 Yes Diopatra ornata 7 Yes Diopatra sp 3 Yes Dipolydora bidentata 3 Yes Dipolydora cardalia 9 Yes Dipolydora caulleryi NIS 8 Yes Dipolydora quadrilobata 1 Yes Dipolydora socialis 30 Yes Diptera 2 Yes Yes Discorsopagurus schmitti 1 Yes Disporella fimbriata 1 Yes Distaplia occidentalis 2 Yes Dolichopodidae 1 Yes Yes Doridacea 1 Yes Dorvillea (Schistomeringos) annulata
N 5 Yes
Drilonereis longa N 9 Yes Drilonereis sp 1 Yes Dubiraphia sp 1 Yes

EPA Region 10 Office of Environmental Assessment March 2006
53
Species Native (N)/Non-Indigenous (NIS)
# of total sites
Found at Freshwater sites
Found at Intermediate sites
Found at Marine Sites
Dulichia sp 2 Yes Dyopedos arcticus 2 Yes Dyopedos sp 2 Yes Echiurus echiurus alaskanus 2 Yes Ectinosoma sp 1 Yes Ectopleura sp 1 Yes Edwardsia sipunculoides N 4 Yes Edwardsia sp G 4 Yes Electra crustulenta arctica 1 Yes Ennucula tenuis 24 Yes Enopla 1 Yes Enteropneusta 2 Yes Eobrolgus chumashi N 7 Yes Eobrolgus sp 1 Yes Eochelidium sp 1 Yes Eogammarus confervicolus CMPLX
N 14 Yes Yes Yes
Eogammarus sp 3 Yes Yes Eohaustorius estuarius N 39 Yes Yes Yes Eohaustorius washingtonianus N 1 Yes Ephydridae 1 Yes Epoicocladius sp 1 Yes Eranno bicirrata 6 Yes Ericthonius brasiliensis 1 Yes Eteone columbiensis N 14 Yes Yes Yes Eteone fauchaldi N 3 Yes Yes Eteone lighti N 9 Yes Yes Eteone pacifica 1 Yes Eteone sp 22 Yes Yes Eteone spilotus 1 Yes Eualus subtilis 2 Yes Euchone incolor 7 Yes Euchone limnicola 1 Yes Euclymene sp 3 Yes Euclymeninae 25 Yes Euclymeninae sp A 9 Yes Eudistylia catharinae 3 Yes Eudistylia polymorpha 1 Yes Eudistylia sp 4 Yes Eudorella pacifica N 35 Yes Eudorellopsis integra 3 Yes Eudorellopsis longirostris 2 Yes Eugyra arenosa 1 Yes Eulalia californiensis 3 Yes Eulalia quadrioculata N 3 Yes

EPA Region 10 Office of Environmental Assessment March 2006
54
Species Native (N)/Non-Indigenous (NIS)
# of total sites
Found at Freshwater sites
Found at Intermediate sites
Found at Marine Sites
Eulalia sp N1 1 Yes Eumida longicornuta 9 Yes Eumida sp 2 Yes Eunoe sp 1 Yes Euphausia pacifica 1 Yes Euphausia sp 1 Yes Euphilomedes carcharodonta 25 Yes Euphilomedes producta 23 Yes Euphilomedes sp 1 Yes Euphysa ruthae N 4 Yes Euphysa sp A 1 Yes Eupolymnia heterobranchia 1 Yes Eurystomella bilabiata 1 Yes Eusarsiella zostericola NIS 2 Yes Eusirus columbianus 1 Yes Euspira pallida 1 Yes Eusyllis blomstrandi 2 Yes Eusyllis habei 6 Yes Eusyllis magnifica 1 Yes Euzonus mucronata N 2 Yes Exogone dwisula N 8 Yes Exogone lourei 17 Yes Exogone molesta 3 Yes Exogone sp 1 Yes Eyakia robusta 2 Yes Filicrisia sp 1 Yes Flabelligera affinis 1 Yes Flabellina sp 2 Yes Fluminicola virens N 2 Yes Foxiphalus similis 5 Yes Foxiphalus xiximeus 1 Yes Galatheidae 1 Yes Galathowenia oculata 25 Yes Gammaridea 2 Yes Gammaropsis ellisi 1 Yes Gammaropsis thompsoni 3 Yes Gastropoda 5 Yes Yes Gastropoda sp 3 1 Yes Gastropoda sp 4 3 Yes Gastropteron pacificum 5 Yes Gattyana cirrosa 5 Yes Gattyana treadwelli 4 Yes Geminosyllis ohma 2 Yes Glycera americana N 16 Yes

EPA Region 10 Office of Environmental Assessment March 2006
55
Species Native (N)/Non-Indigenous (NIS)
# of total sites
Found at Freshwater sites
Found at Intermediate sites
Found at Marine Sites
Glycera macrobranchia N 10 Yes Glycera nana 32 Yes Glycera sp 2 Yes Glycera tenuis N 1 Yes Glycinde armigera N 24 Yes Glycinde polygnatha N 59 Yes Yes Glycinde sp 11 Yes Gnathopleustes sp 1 Yes Gnorimosphaeroma oregonense
N 7 Yes Yes
Golfingia vulgaris 2 Yes Gomphidae 4 Yes Goniada brunnea 1 Yes Goniada maculata 3 Yes Grandidierella japonica NIS 25 Yes Yes Grandifoxus grandis 13 Yes Yes Yes Grantiidae 1 Yes Guernea reduncans 1 Yes Gyptis sp 1 Yes Halcampa decemtentaculata N 3 Yes Halcampa sp 1 Yes Halecium sp 1 Yes Haliophasma geminatum 5 Yes Halocynthia igaboja 1 Yes Haminaea vesicula 1 Yes Haplosyllis spongiphila 1 Yes Harmothoe extenuata 5 Yes Harmothoe imbricata 7 Yes Harmothoe multisetosa 3 Yes Harmothoinae 6 Yes Harpacticoida 2 Yes Harpacticus sp 1 Yes Harpiniopsis fulgens 4 Yes Hebella pocillum 1 Yes Helisoma sp 1 Yes Hemicyclops subadhaerens 1 Yes Hemilamprops californicus 1 Yes Hemipodia borealis N 2 Yes Heptacarpus kincaidi 1 Yes Hermissenda crassicornis N 1 Yes Hesperonoe complanata N 5 Yes Hesperonoe sp 1 Yes Heteromastus filiformis NIS 6 Yes Heteromastus filobranchus N 18 Yes Heteromastus sp 9 Yes Yes

EPA Region 10 Office of Environmental Assessment March 2006
56
Species Native (N)/Non-Indigenous (NIS)
# of total sites
Found at Freshwater sites
Found at Intermediate sites
Found at Marine Sites
Heteronemertea 1 Yes Heterophoxus affinis 19 Yes Heterophoxus conlanae 12 Yes Heterophoxus ellisi 5 Yes Heterophoxus oculatus group 1 Yes Heterophoxus sp 4 Yes Heteropodarke heteromorpha N 5 Yes Heteropora pacifica 1 Yes Hexagenia sp 5 Yes Hiatella arctica N 6 Yes Hippolytidae 4 Yes Hirudinea 6 Yes Hobsonia florida NIS 17 Yes Yes Yes Homalopoma luridum 1 Yes Hoplonemertea 9 Yes Yes Humilaria kennerlyi 2 Yes Huntemannia jadensis 2 Yes Hyalella azteca 1 Yes Hyas lyratus 1 Yes Hydrobiidae 10 Yes Hyperiidae 3 Yes Idanthyrsus saxicavus 2 Yes Idotea fewkesi N 2 Yes Idotea sp 1 Yes Imogine exiguus 2 Yes Inusitatomysis insolita 1 Yes Iphimedia rickettsi 1 Yes Ischnochiton trifidus 2 Yes Ischyrocerus sp 7 Yes Jaeropsis dubia 1 Yes Juga plicifera N 1 Yes Juga sp 2 Yes Yes Kellia suborbicularis 1 Yes Kurtzia arteaga 2 Yes Kurtziella crebricostata 3 Yes Kurtziella plumbea 1 Yes Lacuna sp 4 Yes Lacuna vincta 4 Yes Lafoea sp 2 Yes Lafoeidae 1 Yes Lagenicella neosocialis 1 Yes Lagenipora socialis 1 Yes Lamprops carinatus 1 Yes Lamprops quadriplicatus 15 Yes

EPA Region 10 Office of Environmental Assessment March 2006
57
Species Native (N)/Non-Indigenous (NIS)
# of total sites
Found at Freshwater sites
Found at Intermediate sites
Found at Marine Sites
Lanassa nordenskioeldi 1 Yes Lanassa venusta 13 Yes Laonice cirrata 17 Yes Laonice pugettensis 2 Yes Laonome kroeyeri 3 Yes Lasaeidae 1 Yes Laticorophium baconi 1 Yes Leitoscoloplos pugettensis N 40 Yes Lepidasthenia berkeleyae 4 Yes Lepidasthenia longicirrata 1 Yes Lepidepecreum garthi 1 Yes Lepidochitona dentiens 2 Yes Lepidochitona flectens 1 Yes Lepidonotus sp 1 Yes Lepidonotus spiculus 1 Yes Lepidonotus squamatus 3 Yes Leptasterias hexactis 1 Yes Leptochelia dubia 28 Yes Yes Leptochiton rugatus 2 Yes Leptoplanidae 1 Yes Leptosynapta sp 6 Yes Leucon sp 1 Yes Leucon subnasica 6 Yes Levinsenia gracilis 35 Yes Levinsenia oculata 6 Yes Limnoria lignorum 2 Yes Lineidae 32 Yes Yes Lineus sp 3 Yes Lirobittium sp 5 Yes Lirularia lirulata 6 Yes Littorina sp 1 Yes Longipedia sp 1 Yes Lophopanopeus bellus 5 Yes Lucinoma annulatum 12 Yes Lumbrineridae 15 Yes Lumbrineris californiensis 19 Yes Lumbrineris cruzensis N 13 Yes Lumbrineris latreilli 1 Yes Lumbrineris limicola 2 Yes Lumbrineris sp 9 Yes Lyonsia californica N 17 Yes Lysippe labiata 2 Yes

EPA Region 10 Office of Environmental Assessment March 2006
58
Species Native (N)/Non-Indigenous (NIS)
# of total sites
Found at Freshwater sites
Found at Intermediate sites
Found at Marine Sites
Macoma balthica N 29 Yes Yes Yes Macoma calcarea 5 Yes Macoma carlottensis 31 Yes Macoma elimata 20 Yes Macoma golikovi 16 Yes Macoma inquinata N 9 Yes Macoma moesta 1 Yes Macoma nasuta N 22 Yes Macoma secta N 1 Yes Macoma sp 48 Yes Yes Macoma yoldiformis 16 Yes Mactridae 1 Yes Mactromeris polynyma 2 Yes Magelona longicornis 21 Yes Magelona pitelkai N 5 Yes Yes Magelona sacculata N 10 Yes Magelona sp 3 Yes Majidae 2 Yes Majoxiphalus major N 2 Yes Maldane sarsi 11 Yes Maldanidae 5 Yes Malmgreniella bansei 5 Yes Malmgreniella liei 2 Yes Malmgreniella macginitiei N 2 Yes Malmgreniella nigralba N 5 Yes Malmgreniella sp 2 Yes Manayunkia aestuarina NIS 1 Yes Manayunkia speciosa NIS 4 Yes Mandibulophoxus gilesi N 1 Yes Mandibulophoxus mayi N 2 Yes Margarites pupillus 5 Yes Margarites sp 1 Yes Mayerella banksia 2 Yes Mediomastus ambiseta 5 Yes Mediomastus californiensis N 41 Yes Mediomastus sp 78 Yes Yes Yes Megalomma splendida 3 Yes Megamoera dentata 1 Yes Megayoldia thraciaeformis 1 Yes Melanochlamys diomedea N 6 Yes Melinna oculata N 4 Yes Melita nitida NIS 2 Yes Membranipora membranacea 2 Yes Membranipora sp 2 Yes

EPA Region 10 Office of Environmental Assessment March 2006
59
Species Native (N)/Non-Indigenous (NIS)
# of total sites
Found at Freshwater sites
Found at Intermediate sites
Found at Marine Sites
Mesochaetopterus taylori 4 Yes Metacaprella anomala 2 Yes Metacaprella kennerlyi 2 Yes Metaphoxus frequens 1 Yes Metopa dawsoni 1 Yes Metridium sp 1 Yes Microclymene caudata 7 Yes Microjassa sp 1 Yes Microphthalmus sczelkowii 2 Yes Micropodarke dubia 4 Yes Micropora coriacea 2 Yes Micrura alaskensis N 18 Yes Yes Micrura sp 23 Yes Modiolus rectus 1 Yes Modiolus sp 6 Yes Molgula pugetiensis 2 Yes Molpadia intermedia 4 Yes Monocorophium acherusicum NIS 15 Yes Yes Monocorophium californianum 1 Yes Monocorophium carlottensis 2 Yes Monocorophium cf uenoi NIS 1 Yes Monocorophium insidiosum NIS 1 Yes Monoporeia affinis N 6 Yes Yes Monostylifera 2 Yes Monticellina secunda 1 Yes Monticellina serratiseta 5 Yes Monticellina sp 3 Yes Monticellina sp N1 2 Yes Monticellina tesselata 1 Yes Mopalia sinuata 3 Yes Mopalia sp 1 Yes Munna sp 2 Yes Munnogonium tillerae N 2 Yes Musculus discors 2 Yes Mya arenaria NIS 29 Yes Yes Yes Myidae 1 Yes Myosoma spinosa 2 Yes Myriochele heeri 4 Yes Myriozoum tenue 2 Yes Mysidacea 1 Yes Mytilidae 17 Yes Yes Mytilus sp 1 Yes Myxicola infundibulum 1 Yes Myxilla incrustans 1 Yes

EPA Region 10 Office of Environmental Assessment March 2006
60
Species Native (N)/Non-Indigenous (NIS)
# of total sites
Found at Freshwater sites
Found at Intermediate sites
Found at Marine Sites
Nacellina 2 Yes Naineris quadricuspida 1 Yes Naineris uncinata N 7 Yes Narpus sp 1 Yes Nassarius mendicus N 9 Yes Natica clausa 1 Yes Neanthes limnicola N 47 Yes Yes Yes Neanthes sp 19 Yes Yes Yes Neanthes virens N 1 Yes Nebalia pugettensis Cmplx 5 Yes Nemertea 3 Yes Yes Nemocardium centifilosum 5 Yes Neomysis kadiakensis 2 Yes Neomysis mercedis N 4 Yes Yes Neosabellaria cementarium 4 Yes Neotrypaea californiensis N 12 Yes Yes Neotrypaea gigas 1 Yes Neotrypaea sp 2 Yes Nephasoma diaphanes 2 Yes Nephasoma sp 2 Yes Nephtys caeca 7 Yes Nephtys caecoides N 22 Yes Yes Nephtys californiensis N 5 Yes Yes Nephtys cornuta N 33 Yes Yes Nephtys ferruginea N 34 Yes Nephtys punctata 4 Yes Nephtys sp 5 Yes Yes Nereididae 3 Yes Nereis procera N 22 Yes Nereis sp 1 Yes Nereis zonata 1 Yes Nicomache lumbricalis 2 Yes Nicomache personata 3 Yes Ninoe gemmea 2 Yes Nippoleucon hinumensis NIS 14 Yes Yes Yes Nolella sp 1 Yes Nolella stipata 1 Yes Notomastus hemipodus 22 Yes Notomastus latericeus 6 Yes Notomastus sp 1 Yes Notoplana sp 2 Yes Notoproctus pacificus 1 Yes Nuculana minuta 16 Yes Nudibranchia 1 Yes

EPA Region 10 Office of Environmental Assessment March 2006
61
Species Native (N)/Non-Indigenous (NIS)
# of total sites
Found at Freshwater sites
Found at Intermediate sites
Found at Marine Sites
Nutricola lordi 32 Yes Nutricola tantilla N 4 Yes Obelia dichotoma 2 Yes Obelia longissima 1 Yes Obelia sp 2 Yes Odontosyllis phosphorea 5 Yes Odostomia sp 32 Yes Oenopota sp 3 Yes Oligochaeta 91 Yes Yes Yes Olivella baetica N 6 Yes Olivella biplicata 1 Yes Olivella pycna N 3 Yes Onuphidae 6 Yes Onuphis elegans 5 Yes Onuphis iridescens 13 Yes Onuphis sp 4 Yes Ophelia assimilis N 7 Yes Opheliidae 1 Yes Ophelina acuminata 16 Yes Ophiodermella incisa N 1 Yes Ophiodromus pugettensis 7 Yes Ophiura leptoctenia 1 Yes Ophiura luetkenii 2 Yes Ophiurida 7 Yes Ophiuridae 3 Yes Ophiuroidea 1 Yes Ophryotrocha sp 2 Yes Oplorhiza gracilis 1 Yes Orchomene obtusa 2 Yes Orchomene pacificus 5 Yes Orchomene pinguis 3 Yes Oregonia gracilis 8 Yes Ostracoda 2 Yes Owenia fusiformis 26 Yes Oweniidae 2 Yes Pachycerianthus fimbriatus 2 Yes Pachynus cf barnardi 2 Yes Pacifoculodes zernovi 2 Yes Paguridae 3 Yes Pagurus armatus 1 Yes Pagurus ochotensis 1 Yes Pagurus setosus 1 Yes Pagurus sp 7 Yes Palaeonemertea 3 Yes
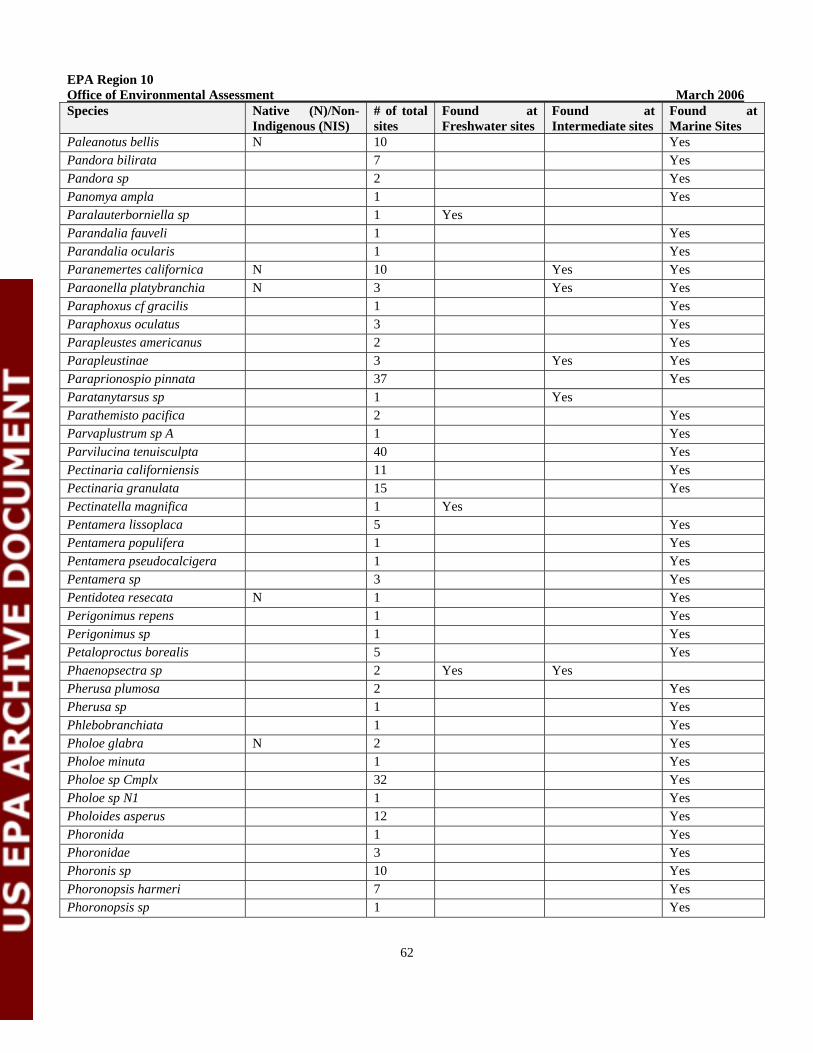
EPA Region 10 Office of Environmental Assessment March 2006
62
Species Native (N)/Non-Indigenous (NIS)
# of total sites
Found at Freshwater sites
Found at Intermediate sites
Found at Marine Sites
Paleanotus bellis N 10 Yes Pandora bilirata 7 Yes Pandora sp 2 Yes Panomya ampla 1 Yes Paralauterborniella sp 1 Yes Parandalia fauveli 1 Yes Parandalia ocularis 1 Yes Paranemertes californica N 10 Yes Yes Paraonella platybranchia N 3 Yes Yes Paraphoxus cf gracilis 1 Yes Paraphoxus oculatus 3 Yes Parapleustes americanus 2 Yes Parapleustinae 3 Yes Yes Paraprionospio pinnata 37 Yes Paratanytarsus sp 1 Yes Parathemisto pacifica 2 Yes Parvaplustrum sp A 1 Yes Parvilucina tenuisculpta 40 Yes Pectinaria californiensis 11 Yes Pectinaria granulata 15 Yes Pectinatella magnifica 1 Yes Pentamera lissoplaca 5 Yes Pentamera populifera 1 Yes Pentamera pseudocalcigera 1 Yes Pentamera sp 3 Yes Pentidotea resecata N 1 Yes Perigonimus repens 1 Yes Perigonimus sp 1 Yes Petaloproctus borealis 5 Yes Phaenopsectra sp 2 Yes Yes Pherusa plumosa 2 Yes Pherusa sp 1 Yes Phlebobranchiata 1 Yes Pholoe glabra N 2 Yes Pholoe minuta 1 Yes Pholoe sp Cmplx 32 Yes Pholoe sp N1 1 Yes Pholoides asperus 12 Yes Phoronida 1 Yes Phoronidae 3 Yes Phoronis sp 10 Yes Phoronopsis harmeri 7 Yes Phoronopsis sp 1 Yes

EPA Region 10 Office of Environmental Assessment March 2006
63
Species Native (N)/Non-Indigenous (NIS)
# of total sites
Found at Freshwater sites
Found at Intermediate sites
Found at Marine Sites
Photis bifurcata 1 Yes Photis brevipes N 13 Yes Photis parvidons 6 Yes Photis sp 14 Yes Phoxichilidium femoratum 2 Yes Phoxocephalidae 1 Yes Phyllaplysia taylori 1 Yes Phyllochaetopterus pottsi 2 Yes Phyllochaetopterus prolifica 11 Yes Phyllodoce citrina 1 Yes Phyllodoce cuspidata 3 Yes Phyllodoce groenlandica 4 Yes Phyllodoce hartmanae N 7 Yes Phyllodoce longipes N 3 Yes Phyllodoce mucosa 1 Yes Phyllodoce sp 7 Yes Phyllophoridae 1 Yes Phylo felix 5 Yes Physella sp 4 Yes Pilargis maculata 12 Yes Pinnixa occidentalis 5 Yes Pinnixa schmitti 30 Yes Pinnixa sp 19 Yes Pinnixa tubicola 1 Yes Pinnotheridae 14 Yes Pisaster sp 1 Yes Pista brevibranchiata 7 Yes Pista elongata 3 Yes Pista moorei N 2 Yes Pista sp 1 Yes Pista wui 8 Yes Platynereis bicanaliculata N 18 Yes Pleurogonium rubicundum 1 Yes Pleusymtes coquilla 2 Yes Plumularia corrugata 1 Yes Podarkeopsis glabrus N 20 Yes Podarkeopsis perkinsi 1 Yes Podoceridae 1 Yes Podocerus cristatus 1 Yes Podocopida 3 Yes Pododesmus macrochisma 2 Yes Poecilosclerida 2 Yes Polycirrus californicus N 9 Yes Polycirrus sp 15 Yes

EPA Region 10 Office of Environmental Assessment March 2006
64
Species Native (N)/Non-Indigenous (NIS)
# of total sites
Found at Freshwater sites
Found at Intermediate sites
Found at Marine Sites
Polycirrus sp I 7 Yes Polycirrus sp V 1 Yes Polydora cornuta NIS 16 Yes Yes Polydora limicola N 6 Yes Polydora sp 1 Yes Polydora websteri 1 Yes Polynoidae 2 Yes Polypedilum sp 1 Yes Polyplacophora 1 Yes Pontogeneia rostrata NIS 4 Yes Pontoporeia femorata 1 Yes Potamopyrgus antipodarum NIS 10 Yes Yes Praxillella gracilis 7 Yes Praxillella pacifica 13 Yes Praxillella sp 4 Yes Prionospio (Minuspio) lighti N 51 Yes Yes Prionospio (Minuspio) multibranchiata
N 9 Yes
Prionospio (Prionospio) jubata 7 Yes Prionospio (Prionospio) steenstrupi
44 Yes
Prionospio sp 3 Yes Proceraea cornuta 15 Yes Procladius sp 4 Yes Yes Yes Proclea graffi 3 Yes Protodorvillea gracilis N 5 Yes Protolaeospira eximia 1 Yes Protomedeia grandimana 10 Yes Protomedeia prudens N 11 Yes Protomedeia sp 11 Yes Protothaca staminea N 13 Yes Psammonyx longimerus N 1 Yes Pseudochironomus sp 2 Yes Yes Pseudochitinopoma occidentalis
2 Yes
Pseudodiaptomus forbesi NIS 2 Yes Pseudomma truncatum 1 Yes Pseudopolydora kempi NIS 26 Yes Yes Pseudopolydora paucibranchiata
NIS 6 Yes
Pseudopolydora sp 2 Yes Pseudopotamilla occelata 2 Yes Pseudopotamilla sp 1 Yes Ptilosarcus gurneyi 4 Yes Pulsellum salishorum 13 Yes

EPA Region 10 Office of Environmental Assessment March 2006
65
Species Native (N)/Non-Indigenous (NIS)
# of total sites
Found at Freshwater sites
Found at Intermediate sites
Found at Marine Sites
Puncturella cucullata 1 Yes Pygospio elegans 26 Yes Yes Yes Ramellogammarus oregonensis N 1 Yes Raricirrus maculatus 1 Yes Rhabdocoela 3 Yes Yes Rhabdus rectius 2 Yes Rhachotropis oculata 1 Yes Rhepoxynius abronius N 5 Yes Rhepoxynius barnardi 4 Yes Rhepoxynius boreovariatus 4 Yes Rhepoxynius daboius 2 Yes Rhepoxynius sp 1 Yes Rhepoxynius stenodes 5 Yes Yes Rhizocaulus verticillatus 1 Yes Rhodine bitorquata 8 Yes Rhynchospio glutaea N 11 Yes Rictaxis punctocaelatus 1 Yes Rochefortia compressa 1 Yes Rochefortia tumida N 53 Yes Rocinela belliceps 1 Yes Rocinela propodialis 2 Yes Rutiderma lomae 6 Yes Sabaco elongatus NIS 2 Yes Sabellidae 6 Yes Sabelliphilidae 1 Yes Saccocirridae 1 Yes Saccoglossus sp 2 Yes Saduria entomon 6 Yes Yes Sagitta sp 2 Yes Sagittidae 1 Yes Saxidomus giganteus N 8 Yes Scalibregma californicum 4 Yes Scalibregma inflatum 1 Yes Scaphander sp 1 Yes Scintillona bellerophon 2 Yes Scionella japonica 2 Yes Scleroplax granulata N 3 Yes Scolelepis nr yamaguchii 2 Yes Scolelepis sp 1 Yes Scolelepis squamata 7 Yes Scoletoma luti N 36 Yes Scoloplos acmeceps 4 Yes Scoloplos armiger alaskensis 4 Yes Scoloplos armiger armiger 16 Yes Yes Yes

EPA Region 10 Office of Environmental Assessment March 2006
66
Species Native (N)/Non-Indigenous (NIS)
# of total sites
Found at Freshwater sites
Found at Intermediate sites
Found at Marine Sites
Scoloplos sp 2 Yes Scyphozoa 1 Yes Selaginopsis triserialis 1 Yes Semele rubropicta 1 Yes Serpulidae 1 Yes Sialis sp 4 Yes Sigalion spinosus N 1 Yes Sigambra bassi 16 Yes Sige bifoliata 1 Yes Siliqua sp 14 Yes Yes Yes Sinelobus stanfordi NIS 1 Yes Sipuncula 1 Yes Skenea sp 2 Yes Smittina sp 1 Yes Solamen columbianum 7 Yes Solariella sp 3 Yes Solen sicarius N 5 Yes Solidobalanus hesperius 1 Yes Sphaeriidae 1 Yes Sphaerodoropsis sphaerulifer 10 Yes Sphaerosyllis californiensis N 10 Yes Sphaerosyllis ranunculus N 2 Yes Sphaerosyllis sp N1 3 Yes Spio butleri N 8 Yes Yes Spio cirrifera 6 Yes Spio filicornis 2 Yes Spiochaetopterus costarum N 25 Yes Yes Spionidae 3 Yes Spiophanes berkeleyorum N 29 Yes Spiophanes bombyx 15 Yes Spirontocaris arctuatus 1 Yes Spirontocaris ochotensis 2 Yes Spirontocaris prionota 1 Yes Spirontocaris sica 1 Yes Stenothoidae 1 Yes Stenothoides sp 2 Yes Sternaspis cf fossor 22 Yes Sthenelais berkeleyi 1 Yes Sthenelais tertiaglabra 1 Yes Stictochironomus sp 3 Yes Yes Stolidobranchiata 2 Yes Streblosoma bairdi 2 Yes Streblosoma sp B 1 Yes Streblospio benedicti NIS 12 Yes Yes

EPA Region 10 Office of Environmental Assessment March 2006
67
Species Native (N)/Non-Indigenous (NIS)
# of total sites
Found at Freshwater sites
Found at Intermediate sites
Found at Marine Sites
Styela coriacea 1 Yes Styela gibbsii 2 Yes Styela sp 1 Yes Stylatula sp A 3 Yes Syllidae 2 Yes Symplectoscyphus sp 1 Yes Synidotea consolidata 1 Yes Synidotea sp 1 Yes Tabanidae 1 Yes Tanytarsus sp 2 Yes Tecticeps pugettensis N 2 Yes Tellina bodegensis N 1 Yes Tellina carpenteri 1 Yes Tellina modesta N 17 Yes Tellina nuculoides N 6 Yes Tellina sp 4 Yes Tenonia priops 10 Yes Terebellidae 9 Yes Terebellides californica 12 Yes Terebellides horikoshii 3 Yes Terebellides kobei 1 Yes Terebellides reishi 3 Yes Terebellides sp 12 Yes Terebellides stroemi 6 Yes Terebratalia transversa 3 Yes Terebratulida 1 Yes Tetrastemma candidum 17 Yes Yes Yes Tetrastemma nigrifrons 3 Yes Tetrastemma sp 23 Yes Yes Tetrastemmatidae 5 Yes Tharyx parvus 12 Yes Tharyx sp N1 3 Yes Thelepus setosus 1 Yes Themiste pyroides 2 Yes Thracia challisiana 1 Yes Thracia trapezoides 2 Yes Thyasira flexuosa 11 Yes Thysanocardia nigra 12 Yes Travisia forbesii 2 Yes Travisia pupa 1 Yes Tresus sp 9 Yes Trichobranchus glacialis 1 Yes Trichoptera 2 Yes Trichotropis cancellata 2 Yes

EPA Region 10 Office of Environmental Assessment March 2006
68
Species Native (N)/Non-Indigenous (NIS)
# of total sites
Found at Freshwater sites
Found at Intermediate sites
Found at Marine Sites
Tritella pilimana 8 Yes Trochochaeta multisetosa 13 Yes Tubulanus cingulatus 2 Yes Tubulanus polymorphus 22 Yes Tubulanus sp 14 Yes Tubulariidae 1 Yes Tubulipora sp 3 Yes Turbonilla sp 20 Yes Typhloplanoidea 1 Yes Typosyllis alternata N 1 Yes Typosyllis armillaris 1 Yes Typosyllis caeca 8 Yes Typosyllis cornuta 5 Yes Typosyllis elongata 2 Yes Typosyllis heterochaeta 7 Yes Typosyllis sp 3 Yes Upogebia pugettensis N 1 Yes Velutina plicatilis 1 Yes Venerupis philippinarum NIS 1 Yes Virgularia agassizi 2 Yes Westwoodilla caecula 12 Yes Westwoodilla sp 4 Yes Yoldia hyperborea 10 Yes Yoldia seminuda 10 Yes Yoldia sp 13 Yes Zygonemertes virescens 7 Yes

EPA Region 10 Office of Environmental Assessment March 2006
69
Appendix 7. Fish species from 1999-2000.
SCIENTIFIC NAME COMMON NAME # of SITES % ESTUARINE AREA
SALINTY FOUND
Class Actinopterygii
Order Batrachoidiformes Family Batrachoididae
Porichthys notatus Plainfin midshipman 24 26 Marine
Order Clupeiformes Family Clupeidae
Clupeidae sp Herrings, shads, sardines, sardinellas, sprats, etc.
1 <1 Freshwater
Alosa sapidissima American Shad 7 1 Freshwater
Clupea pallasii Pacific herring 25 24 All
Family Engraulidae
Engraulis mordax Californian anchovy 2 1 Marine, Intermediate
Order Cypriniformes Family Cyprinidae
Mylocheilus caurinus Peamouth 2 <1 Freshwater
Ptychocheilus oregonensis Northern pikeminnow
2 <1 Freshwater
Order Gadiformes Family Gadidae
Gadus macrocephalus Pacific Cod 9 14 Marine
Microgadus proximus Pacific tomcod 44 46 Marine, Intermediate
Theragra chalcogramma Alaska (walleye) pollock
12 19 Marine
Family Merlucciidae
Merluccius productus Pacific hake 17 22 Marine
Order Gasterosteiformes Family Syngnathidae
Syngnathus leptorhynchus Bay pipefish 2 1 Marine, Intermediate
Family Gasterosteidae
Gasterosteus aculeatus Three-spine 15 1 Freshwater
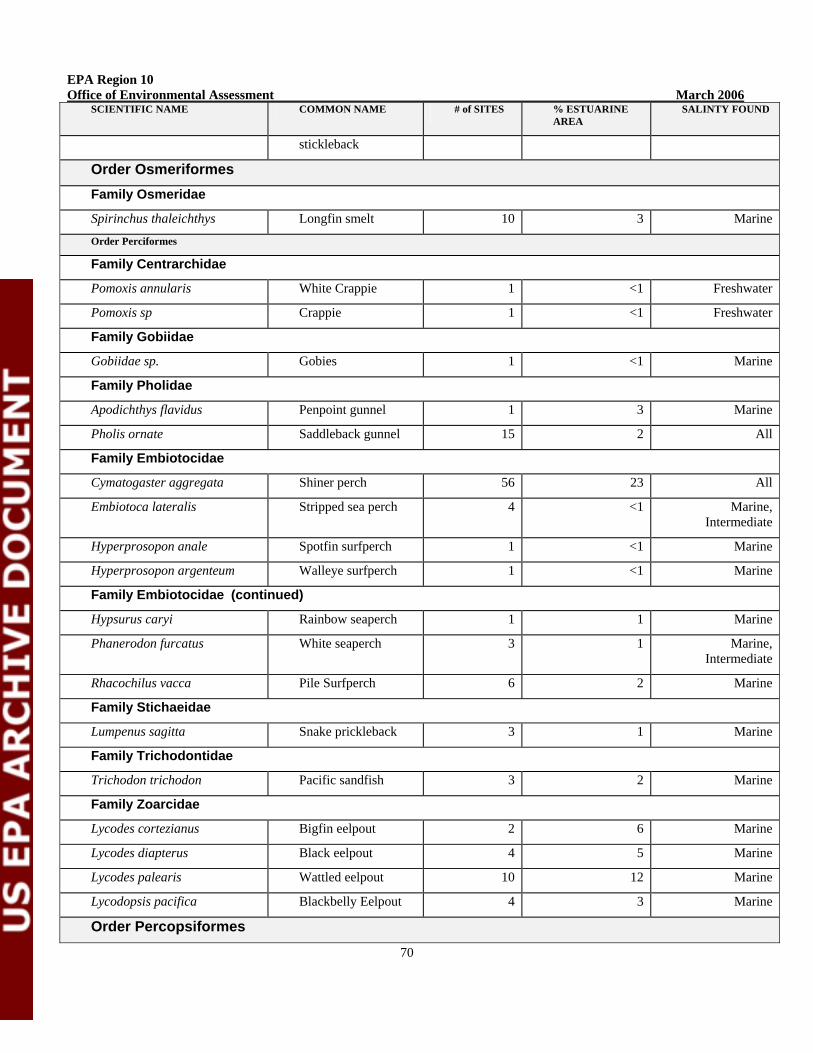
EPA Region 10 Office of Environmental Assessment March 2006
70
SCIENTIFIC NAME COMMON NAME # of SITES % ESTUARINE AREA
SALINTY FOUND
stickleback
Order Osmeriformes Family Osmeridae
Spirinchus thaleichthys Longfin smelt 10 3 Marine
Order Perciformes
Family Centrarchidae
Pomoxis annularis White Crappie 1 <1 Freshwater
Pomoxis sp Crappie 1 <1 Freshwater
Family Gobiidae
Gobiidae sp. Gobies 1 <1 Marine
Family Pholidae
Apodichthys flavidus Penpoint gunnel 1 3 Marine
Pholis ornate Saddleback gunnel 15 2 All
Family Embiotocidae
Cymatogaster aggregata Shiner perch 56 23 All
Embiotoca lateralis Stripped sea perch 4 <1 Marine, Intermediate
Hyperprosopon anale Spotfin surfperch 1 <1 Marine
Hyperprosopon argenteum Walleye surfperch 1 <1 Marine
Family Embiotocidae (continued)
Hypsurus caryi Rainbow seaperch 1 1 Marine
Phanerodon furcatus White seaperch 3 1 Marine, Intermediate
Rhacochilus vacca Pile Surfperch 6 2 Marine
Family Stichaeidae
Lumpenus sagitta Snake prickleback 3 1 Marine
Family Trichodontidae
Trichodon trichodon Pacific sandfish 3 2 Marine
Family Zoarcidae
Lycodes cortezianus Bigfin eelpout 2 6 Marine
Lycodes diapterus Black eelpout 4 5 Marine
Lycodes palearis Wattled eelpout 10 12 Marine
Lycodopsis pacifica Blackbelly Eelpout 4 3 Marine
Order Percopsiformes
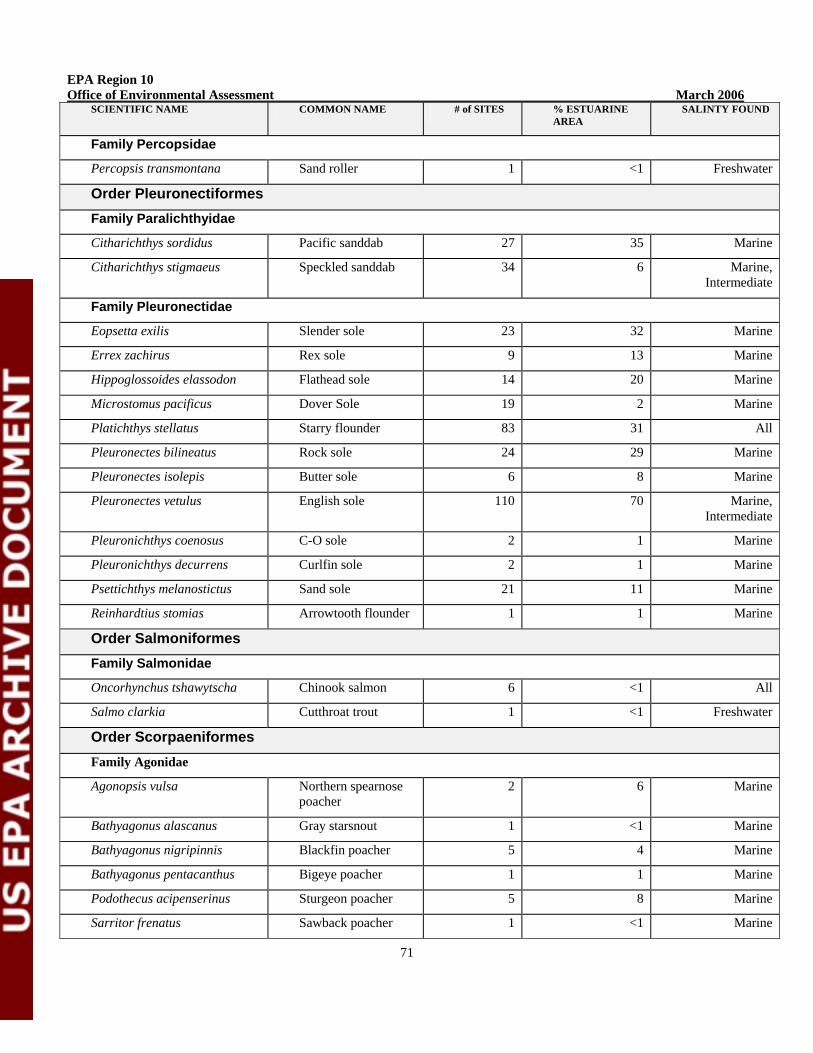
EPA Region 10 Office of Environmental Assessment March 2006
71
SCIENTIFIC NAME COMMON NAME # of SITES % ESTUARINE AREA
SALINTY FOUND
Family Percopsidae
Percopsis transmontana Sand roller 1 <1 Freshwater
Order Pleuronectiformes Family Paralichthyidae
Citharichthys sordidus Pacific sanddab 27 35 Marine
Citharichthys stigmaeus Speckled sanddab 34 6 Marine, Intermediate
Family Pleuronectidae
Eopsetta exilis Slender sole 23 32 Marine
Errex zachirus Rex sole 9 13 Marine
Hippoglossoides elassodon Flathead sole 14 20 Marine
Microstomus pacificus Dover Sole 19 2 Marine
Platichthys stellatus Starry flounder 83 31 All
Pleuronectes bilineatus Rock sole 24 29 Marine
Pleuronectes isolepis Butter sole 6 8 Marine
Pleuronectes vetulus English sole 110 70 Marine, Intermediate
Pleuronichthys coenosus C-O sole 2 1 Marine
Pleuronichthys decurrens Curlfin sole 2 1 Marine
Psettichthys melanostictus Sand sole 21 11 Marine
Reinhardtius stomias Arrowtooth flounder 1 1 Marine
Order Salmoniformes Family Salmonidae
Oncorhynchus tshawytscha Chinook salmon 6 <1 All
Salmo clarkia Cutthroat trout 1 <1 Freshwater
Order Scorpaeniformes Family Agonidae
Agonopsis vulsa Northern spearnose poacher
2 6 Marine
Bathyagonus alascanus Gray starsnout 1 <1 Marine
Bathyagonus nigripinnis Blackfin poacher 5 4 Marine
Bathyagonus pentacanthus Bigeye poacher 1 1 Marine
Podothecus acipenserinus Sturgeon poacher 5 8 Marine
Sarritor frenatus Sawback poacher 1 <1 Marine
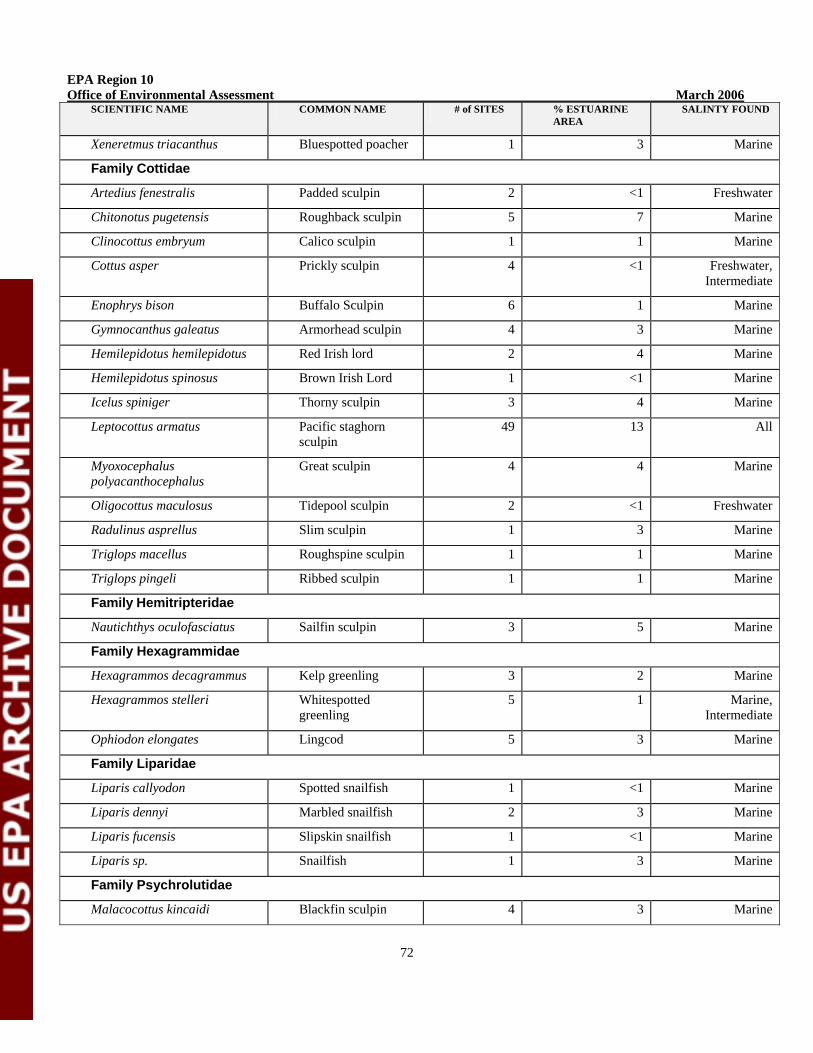
EPA Region 10 Office of Environmental Assessment March 2006
72
SCIENTIFIC NAME COMMON NAME # of SITES % ESTUARINE AREA
SALINTY FOUND
Xeneretmus triacanthus Bluespotted poacher 1 3 Marine
Family Cottidae
Artedius fenestralis Padded sculpin 2 <1 Freshwater
Chitonotus pugetensis Roughback sculpin 5 7 Marine
Clinocottus embryum Calico sculpin 1 1 Marine
Cottus asper Prickly sculpin 4 <1 Freshwater, Intermediate
Enophrys bison Buffalo Sculpin 6 1 Marine
Gymnocanthus galeatus Armorhead sculpin 4 3 Marine
Hemilepidotus hemilepidotus Red Irish lord 2 4 Marine
Hemilepidotus spinosus Brown Irish Lord 1 <1 Marine
Icelus spiniger Thorny sculpin 3 4 Marine
Leptocottus armatus Pacific staghorn sculpin
49 13 All
Myoxocephalus polyacanthocephalus
Great sculpin 4 4 Marine
Oligocottus maculosus Tidepool sculpin 2 <1 Freshwater
Radulinus asprellus Slim sculpin 1 3 Marine
Triglops macellus Roughspine sculpin 1 1 Marine
Triglops pingeli Ribbed sculpin 1 1 Marine
Family Hemitripteridae
Nautichthys oculofasciatus Sailfin sculpin 3 5 Marine
Family Hexagrammidae
Hexagrammos decagrammus Kelp greenling 3 2 Marine
Hexagrammos stelleri Whitespotted greenling
5 1 Marine, Intermediate
Ophiodon elongates Lingcod 5 3 Marine
Family Liparidae
Liparis callyodon Spotted snailfish 1 <1 Marine
Liparis dennyi Marbled snailfish 2 3 Marine
Liparis fucensis Slipskin snailfish 1 <1 Marine
Liparis sp. Snailfish 1 3 Marine
Family Psychrolutidae
Malacocottus kincaidi Blackfin sculpin 4 3 Marine

EPA Region 10 Office of Environmental Assessment March 2006
73
SCIENTIFIC NAME COMMON NAME # of SITES % ESTUARINE AREA
SALINTY FOUND
Family Scorpaenidae
Sebastes auriculatus Brown Rockfish 4 5 Marine
Sebastes dallii Calico Rockfish 1 <1 Marine
Sebastes diploproa Splitnose rockfish 2 1 Marine
Sebastes caurinus Copper Rockfish 3 7 Marine
Sebastes emphaeus Puget Sound rockfish 1 3 Marine
Sebastes maliger Quillback Rockfish 9 11 Marine
Sebastolobus alascanus Shortspine thornyhead
1 3 Marine
Class Chondrichthyes
Order Rajiformes Family Arhynchobatidae
Bathyraja interrupta Bering skate 1 3 Marine
Raja binoculata Big Skate 6 8 Marine
Raja rhina Longnose Skate 16 18 Marine
Order Carcharhiniformes Family Triakidae
Mustelus henlei Brown Smooth-hound Shark
4 5 Marine
Order Chimaeriformes Family Chimaeridae
Hydrolagus colliei Spotted ratfish 30 44 Marine
Order SqualiformesFamily Squalidae
Squalus acanthias Spiny Dogfish 31 43 Marine