ecological applications of wireless sensor...
TRANSCRIPT

Ecological Applicationsof Wireless SensorNetworks
Brian NeiswanderFaye WalkerProfessor Tom LittleMultimedia Communications Lab
Boston University Summer 2006 Photonics REU: Final Report

This Presentation
Project Goals Wireless Sensor Networks Motes
AttenuationCalibration
Field Tests Photosynthesis Future Work

Project Goals
Measure ecological data with wirelesssensor networks Software Hardware Data Collection
Show that wireless sensor networks arebetter than conventional methods forevaluating photosynthesis

Wireless Sensor Networks
Use small, self-contained sensors calledmotes
Data sent with radio, laser, infrared
Ad hoc network Each mote becomes aware of nearby motes
and form a network Self forming

Hop Scenarios

Collection and Analysis
MATLAB applications package Data collectors Calibrator Real-time and post analyzers Engineering unit converters

Our Motes
Bat barn animal studyLarge scale light collectionOur Uses:XXLow Power Mode
XAccelerationXPressure
XXHumidityXXTemperatureXXLight Intensity
Tmote SkyMica2

Light Sensor
Two 7-bit counts If ch0 or ch1 count > 1111111
Overflow Sensor saturates

Sensor Attenuation
Sensor filters 1000x wratten ~5x paper

Calibration
Heavy attenuation requires calibration
Difficult to calibrate for large range of light 12 hour test (sunrise to sunset)
Calibrate each mote against a veryaccurate control light sensor ADC mote

Calibration Solution
Voltmeter to measure control sensor
Log data by hand
Linear calibration equation for each moteMote 12
y = 404.1x + 3057
0
20000
40000
60000
80000
100000
120000
0 100 200 300
Mote Lux
Lic
or L
ux

Open Field Test
11 Mica2 motesRecord light intensityMulti-hop scheme
VideoMote layoutAnimated plots
Contour plot Surfaced plot

Video

Static Photosynthesis Models
Light intensity is only independent variable Input parameters dependent upon species
!
!"""
2
4)()(
max
2
maxmax PhPhPhP
#+#+=
max
max)(Ph
hPhP
+=!
!
Non-rectangular (Peri et al.):
Rectangular = 0 (Sullivan et al.):!
- light
- maximum photosynthetic rate at saturation
- initial slope of the light-response curve
- curvature indicator
maxP
!
!
h

Dynamic Photosynthesis Model
Dynamic equation varies with time
Accounts for increases and decreases in light Utilizes predicted steady-state values from
the previous models (Naumburg et al.)
!t
tttePPPhtP"
"" "+= )(),( 11

Conventional Methods
Conventional Photosynthesis Analysis

Our Method
WSN Photosynthesis Analysis
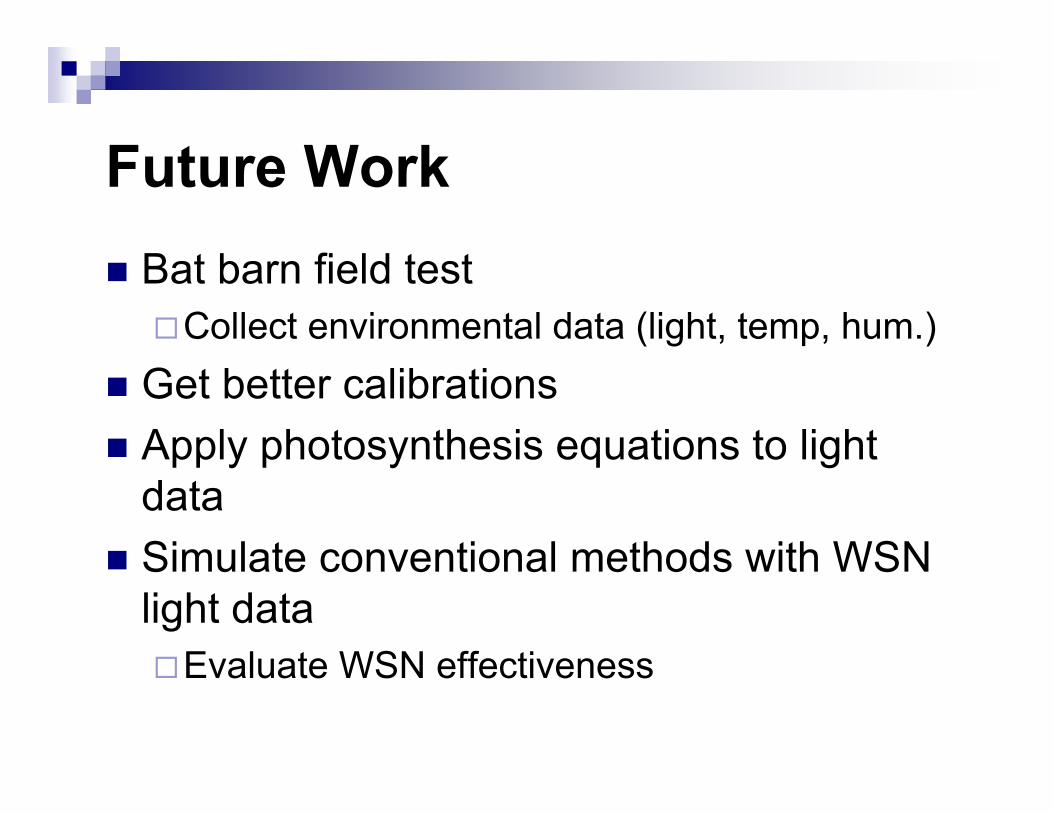
Future Work Bat barn field test
Collect environmental data (light, temp, hum.) Get better calibrations Apply photosynthesis equations to light
data Simulate conventional methods with WSN
light dataEvaluate WSN effectiveness

Summary
Wireless sensor networks collect data easily andefficiently at high resolutions Useful in ecological studies
Sensors must be adjusted to suit the testing environment Attenuation Calibration
Field tests don’t always go as planned Murphy’s law
Photosynthesis equations should be better behaved withWSN data

We would like to thank the NSF,Boston University, and Professor Tom Little
for this great research opportunity.
Any Questions?

References
Naumburg, Elk and Ellsworth, David 2000. “Photosynthetic sunfleckutilization potential of understory saplings growing under elevatedCO2 in FACE.” Oecologia 122: 163-174.
Peri, P.; Moot, D; and McNeail, D. “A canopy photosynthesis modelto predict the dry matter production of cocksfoot pastures undervarying temperature, nitrogen, and water regimes.” Grass andForage Science 58: 416-430.
Sullivan, N.; Bostad, P; and Vose, J. Estimates of netphotosynthetic parameters for twelve tree species in mature forestsof the southern Appalachians. Tree Physiology 16: 397-406.