ecological and health impacts - rainwater harvesting
TRANSCRIPT

Ecological and Health Impacts
Dr. J.S. PandeyScience Secretary
National Environmental Engineering Research
Institute (NEERI), NAGPUR – 440 020,
India


Air Pollution and Health Risks [ SURPRISINGLY !!! In 1997, approximately 107 million people in the United States lived in the counties that did not meet the air quality standards for at least one regulated pollutant]
Sources of air pollutants : Natural (Vegetation and Volcanoes) Agricultural (Methane and Pesticides) Commercial (Dry cleaning operations etc.) Industrial (Electric Power Plants and
Manufacturing Units) Transportation (Automobile Emissions) Residential (Home Gas, Oil Burners and Wood
Stoves)

Limitations of Earlier Studies This field is at a relatively early stage of development and hence, there
is an urgent need for developing affordable and accessible data and the relevant analytical tools.
Only very few studies have been undertaken in this area. So, there are no generally agreed criteria for assessing predictive accuracies of various models developed. Therefore, it is often difficult to judge the utility of existing systems.
Most research projects have had relatively limited resources and, therefore, not been tested in locations outside the original study area.
Most studies in this area focus solely on climatic factors and do not explicitly test other explanations for variations in disease rates through time.
Many studies are taken purely as research projects. Hence, they have limited utility in terms of public health planning and interventions.

Recommendations Developing and strengthening disease surveillance
systems to produce the high quality, long term data needed for model development and testing
Developing standard terminology and criteria for evaluating the accuracy of such models
Inclusion of non-climatic influences in the models Making the models relevant to particular response
decisions and to the particular needs of the policy makers
Cost-effectiveness analyses

NEERI’s Activities
je 0s pa~Dey
nIrI
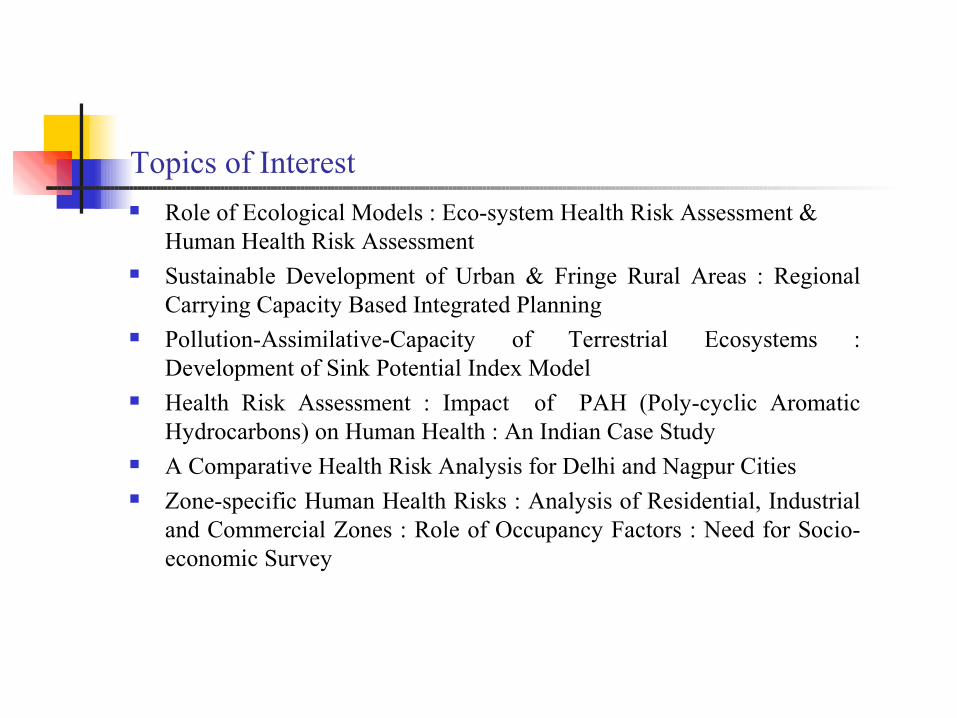
Topics of Interest Role of Ecological Models : Eco-system Health Risk Assessment &
Human Health Risk Assessment Sustainable Development of Urban & Fringe Rural Areas : Regional
Carrying Capacity Based Integrated Planning Pollution-Assimilative-Capacity of Terrestrial Ecosystems :
Development of Sink Potential Index Model Health Risk Assessment : Impact of PAH (Poly-cyclic Aromatic
Hydrocarbons) on Human Health : An Indian Case Study A Comparative Health Risk Analysis for Delhi and Nagpur Cities Zone-specific Human Health Risks : Analysis of Residential, Industrial
and Commercial Zones : Role of Occupancy Factors : Need for Socio-economic Survey

Topics to be covered…..contd.
Age-specific Health Risk Assessment : Role of Physiological Parameters
Ecosystem-Health-Risk Assessment : Speed Dependent Modeling of Ecosystem Exposure Risks from Transportation Sector (Major Air Polluter)
Development of a Scavenging Dependent Air Basin Ecological Risk Assessment (SABERA) - Model

Emissions
Air
Water
Soil
Plants
Animals
Human Receptor
Health Impacts[Environmental Distribution & Fate]
[Exposure RiskAssessment]
[Dose-Response Relationships]
Integrated Health Risk Assessment : Exposure Risk and Dose Response Relationships
je 0s pa~Dey
nIrI

Occupancy Factors
Occupancy Factors
-0.2
0
0.2
0.4
0.6
0.8
1
0 5 10 15 20 25 30
Time (hrs.)
Occ
upan
cy F
acto
rs
ResidentialCommercialIndustrial
Figure 1
je 0s pa~Dey
nIrI

PAH-Health-Exposure-Assessment[J.S. Pandey, S. Pimparkar and P. Khanna 1992 : J. Environmental Systems 21 (4) : 349-356]
Polycyclic aromatic hydrocarbons (PAH) happen to be one of the most toxic chemicals being continuously released into the environment.
They are mainly produced by combustion processes involving carbon-based substances such as fossil fuels and biomass, and have been reported to be present in significant concentrations in coal mining and coal processing areas.
05
1015202530354045
Rela
tive R
isks
Infants Children Adults
Industrial/Residential
Different Age Categories
Relative Health Risks
Benzo (a)anthraceneBenzo (a )PyrenePerylene
je 0s pa~Dey
nIrI

In line with pollutant/climate micro-environment concept, human exposures to PAH have been analyzed and estimated in terms of dose rates for residential and industrial micro environmental zones in Jharia region, which is in Jharkhand now.
The analysis is based on age-specific breathing rates, body weights, and occupancy factors for different zones.
0
5
10
15
20
25
30
35
40
45
Rel
ativ
e R
isks
(Ind
ustr
ial/R
esid
entia
l)
Benzo (a) anthracene Benzo (a ) Pyrene PerylenePollutant Types
Health Risk : Dose Rates
Industrial/Residential InfantsIndustrial/Residential Children Industrial/Residential Adults
je 0s pa~Dey
nIrI

Health Risk in Delhi and Nagpur : A Comparative Analysis [J.S. Pandey, S. Pimparkar and P. Khanna 1993 : International Journal of Environmental Health Research 3 : 161-170 ]
Comparative health risk assessment exercise has been carried out for two Indian cities : Delhi and Nagpur
Amongst the three pollutants studied, exposure risk due to SPM is maximum.
0
1
2
3
4
5
6
Rela
tive D
ose R
ate
s
SPM SO2 NO2Pollutants
Relative Health Risks
InfantsChildrenAdults
Residential Area
je 0s pa~Dey
nIrI

Comparison Between Delhi’s and Nagpur’s Commercial Zones
For infants and children the risks are higher.
The relative risks are 5 times for Delhi than Nagpur (in residential zone).
In commercial zone, this ratio increases to almost 30 times.
0
0.5
1
1.5
2
2.5
3
3.5
Rel
ativ
e D
ose
Rat
es
SPM SO2 NO2Commercial Zone
Relative Health Risks
InfantsChildrenAdults
je 0s pa~Dey
nIrI

Comparative Health Risk Assessment in the Industrial Zones of Delhi and Nagpur Cities [International Journal of Environmental Health Research 3 : 161-170 (1993)]
In the industrial zone of Delhi, the highest observed health risk is about 10 times that in Nagpur.
There is a need for conducting a more extensive characterization of exposure profiles and estimation of site-specific health risk so as to evolve site-specific environmental management plans.
0
2
4
6
8
10
12
Rela
tive
Dose
Rat
es
SPM SO2 NO2Industrial Zones
Relative Health Risks
InfantsChildrenAdults
je 0s pa~Dey
nIrI
This necessitates collection of more detailed information through personal monitoring and household surveys
Monitoring of ambient concentrations of various air pollutants as well as quantification of the dose inhaled becomes quite important, specially in view of the fact that in many countries, policy decisions for reducing pollutant-concentrations are mainly taken on the basis of their health impacts.
The dose when gets combined with the likely responses, indicates the ultimate health risk (HR).
Health Risks of NO2, SPM and SO2 In Delhi City (India) [J.S. Pandey, R. Kumar and S. Devotta 2005 : Atmospheric Environment 39 : 6868-6874]
je 0s pa~Dey
nIrI

Methodology For estimating the ultimate health risks, dose-rates have been integrated with the
Lowest Observed Adverse Effect Levels (LOAEL) values for SPM (19.7 μg/kg), NO2 (1.5 μg/kg) and SO2 (7.1 μg/kg).
LOAEL values for SPM and SO2 were taken from Cerna et al. (1998). While for estimating LOAEL-value for NO2, the following dose-response model was constructed.
Y = 103.6 X -0.1003 Where, Y = Response [in terms of % Endexpiratory Flow Rates] X = Dose-rates (μg/kg) for children The dose-value at which endexspiratory flow rate becomes lower than 100%
was taken as the LOAEL-value for NO2. HR has, subsequently, been defined and expressed as :
HR = [(dose-rates) /(pollutant-specific-LOAEL)] HR is dimensionless and quite useful for relative comparisons.
je 0s pa~Dey
nIrI

Comparative Analysis
For all age-categories health-risks due to SO2 (HR_SO2) are the lowest. And hence, HR_SO2 has been taken as the reference with respect to which HR-values due to SPM and NO2 have been compared.
Taking into account all the age-categories and their occupancy in different zones, average HR-values for NO2 and SPM turn out to be respectively 22.11 and 16.13 times more than that for SO2. The present study can be useful in generating public awareness as well as in averting and mitigating the health risks.
0
10
20
30
Relati
ve Ris
ksHighest Lowest Average
Relative Risks w.r.t. SO2
SPMNO2
je 0s pa~Dey
nIrI

Health Based Air Quality Standards US EPA has set National Ambient Air Quality Standards
(NAAQS) for six principal pollutants. These pollutants, referred to as criteria pollutants, include: carbon
monoxide (CO), lead (Pb), nitrogen dioxide (NO2), ozone (O3), particulate matter (PM10 and PM2.5), and sulfur dioxide (SO2).
Ozone is not emitted directly into the air; it is formed when sunlight reacts with emissions of nitrogen oxides [NOX] and volatile organic compounds [VOCs].
Currently, there are no health-based standards for other air pollutants such as carbon dioxide, mercury, and air toxics.
[web: http://www.epa.gov/airs/criteria.html ]
Criteria Air PollutantsA few air pollutants, called criteria air
pollutants, are common throughout the United States. These pollutants can injure health, harm the environment and cause property damage. The current criteria pollutants are:
Carbon Monoxide (CO) Lead (Pb) Nitrogen Dioxide (NO2) Ozone (O3) Particulate matter (PM) Sulfur Dioxide (SO2)
Fine Particles In 1997, US EPA added new annual and 24-
hour peak standards for fine particles called PM2.5.
In the same year, US EPA revised the ozone standard to 0.08 ppm averaged over 8 hours.
The change to an 8-hour averaging time is intended to protect sensitive people, like children and people who work or recreate outside for longer periods of time.

Primary and Secondary Standards For each pollutant, US EPA established a primary
standard to protect public health, and a secondary standard.
Secondary standards are meant to protect public welfare, such as preventing materials damage, preventing crop and vegetation damage, or assuring visibility.
Areas of the country where air pollution levels persistently exceed the NAAQS may be designated as non-attainment.

The 1997 StandardsThe federal Clean Air Act was signed into law in 1970, with
major amendments made in 1977 and 1990. The Act requires the U.S. Environmental Protection Agency (EPA) to:
Review public health standards for each pollutant for which a health standard has been set, every five years
Update the standards, if necessary, to "protect public health with an adequate margin of safety," based on the latest, best-available scientific evidence
Consider only public health, and not costs of compliance, when setting air quality standards -- and save cost considerations for the implementation phase of the standards process.

Water Quality Standards : Narrative Free Forms Narrative "free forms", are general water quality
criteria that apply to all surface waters. These criteria state that all waters shall be free from sludge, floating debris, oil and scum, color and odor producing materials, substances that are harmful to human, animal or aquatic life, and nutrients in concentrations that may cause algal blooms.
Much of Ohio EPA's present strategy regarding water quality based permitting is based upon the narrative free from, "no toxics in toxic amounts."

EPA : Strategy Ohio EPA developed its strategy based on
an evaluation of the potential for significant toxic impacts within the receiving waters.
Very important components of this evaluation are the biological survey program and the biological criteria used to judge aquatic life use attainment.

Numeric Criteria Numeric criteria are estimations of concentrations
of chemicals and degree of aquatic life toxicity allowable in a waterbody without adversely impacting its beneficial uses.
Numeric criteria consist of chemical criteria, whole effluent toxicity levels and biological criteria.

Chemical Criteria Aquatic life and human health water quality criteria for
individual chemicals are derived from laboratory studies of biological organisms' sensitivity to specific chemicals or combinations of chemicals. In these studies, organisms are exposed to known concentrations of a chemical under varying conditions.
For aquatic life water quality criteria, the organisms exposed are a variety of fish, benthic macroinvertebrates and zooplankton.
For human health water quality criteria, the organisms exposed are mammals, usually mice or rats.

Criteria for Agricultural Water Another class of chemical criteria are
those associated with the Agricultural Water Supply use designation.
These criteria protect against long term adverse effects on crops and livestock as a result of crop irrigation and livestock watering.

Whole Effluent Toxicity (WET) Whole Effluent Toxicity (WET) measures the harmful effects of
an effluent on living organisms. A bioassay or toxicity test measures the degree of response of an exposed test organism to a specific chemical or effluent.
WET can only be measured using living organisms, not by an instrument.
WET consists of acute and chronic toxicity tests. Acute toxicity tests measure the responses of organisms that occur
soon after exposure to a test substance. Chronic tests measure the long-term response to test substances. WET measures the accumulative effects of chemicals present in
an effluent that cannot be assessed using chemical-specific criteria.

Biological Criteria Biological criteria are based on aquatic community
characteristics that are measured both structurally and functionally.
The data collected in these assessments are used to characterize aquatic life impairment and to help diagnose the cause of this impairment.

Biological Criteria The principal biological evaluation tools used by Ohio
EPA are the Index of Biotic integrity (IBI), the Modified Index of Well-Being (MIWB) and the Invertebrate Community Index (ICI).
These three indices are based on species richness, trophic composition, diversity, presence of pollution-tolerant individuals or species, abundance of biomass, and the presence of diseased or abnormal organisms.
The IBI and the MIWB apply to fish; the ICI applies to macroinvertebrates. Ohio EPA uses the results of sampling reference sites to set minimum criteria index scores for use designations in water quality standards.

Public Participation Any interested individuals can have a role in the
process of developing water quality standards. Ohio EPA reviews and, as appropriate, revises
water quality standards at least once every three years.
When water quality standards revisions are proposed, the public is notified of these revisions.
A public hearing is held to gather input and comments.

0.00E+00
5.00E-03
1.00E-02
Infe
ctio
n R
isk
Different Scenarios
Annual Infection Risk (Secondary Treatment)
ST/SI/ET=15 ST/DI/ET=15 ST/SDI/ET=15
ST/SI/ET=15 1.00E-02ST/DI/ET=15 1.00E-04ST/SDI/ET=15 1.00E-05
1
ST -> Secondary Treatment SI -> Surface IrrigationDI -> Drip IrrigationSDI -> Sub-surface Drip IrrigationET -> Elapsed Time Between
je 0s pa~Dey
nIrI


A Scavenging Dependent Air Basin Ecological Risk Assessment (SABERA)-Model Applied to Acid Rain Impact Around Delhi City, India [ J.S. Pandey and V. Joseph 2001 : Journal of Environmental Systems 28 (3) : 17-26]
Many of even the most recently applied ecological risk assessment models have dealt with ecological risks only on the basis of single-species toxicity tests.
Moreover, they have seldom treated the integrated and the complete ecological unit for the risk assessment.
In other words, parameters which regulate many of those very important ecological interactions at land-water, air-land, and air-water interfaces.
A T M O S P H E R E W in d S p ee d /D ir ec tio n [6 ]
A e ro s o ls G a s e o u s P o llu ta n ts
W e t D e p o s it io n[1 1 ]
D ry D e p o s it io n[1 3 ]
Im p a c tio n w ith L a n d S c a v e n g in g V e rtic a l & L a te r a l
M ix in g sV eg e ta tiv e U p ta k e(S to m a ta l R e s is ta n c e )
[E co sy ste m - H ea lth - E x p o su r e - R isk ][9 ]
Im p a c ts W a te rs h e d[2 ]
A q u a tic E co sy s te m T e r re str ia l E c o sy s te m
E c o lo g ic a l R is k s E c o lo g ic a l R isk s - P e rtu rb a tio n s in - S to m a ta l A b e rra tio n s N itro g e n / P h o sp h o ru s - P e rtu rb a t io n s in P h o to sy n th e s is / S u lp h u r C y c lin g - F o re s t D e c lin e - P e rtu rb a tio n s in C h lo ro p h y ll D yn am ics [4 ]
je 0s pa~Dey
nIrI

SABERA-Model …..contd.
Therefore, a realistic ecological risk assessment model incorporating the essential interfacial ecological interactions has been developed for quantifying the impact of acid rain in air-basins.
The model has been applied for the air basin surrounding Delhi City in India.
Variations in four important parameters – leaf area index, precipitation intensity, plant-leaf stomatal density, and mixing height – as they are significantly different for different air-basins.
je 0s pa~Dey
nIrI

Thank You
je 0s pa~Dey
nIrI