echolocating bats can use acoustic landmarks for … bats can use acoustic... · corvids (kamil and...
TRANSCRIPT
4399
Animals depend heavily on spatial information from theenvironment to find food, mates, a roost or a nest. Local visualcues or landmarks are widely used by a variety of animalswhen they operate in familiar surroundings. For example,pigeons (Braithwaite and Guilford, 1991; Burt et al., 1997),arthropods (Tinbergen and Kruyt, 1938; Wehner et al., 1996),corvids (Kamil and Jones, 1997), electric fish (Cain andMalwal, 2002), rodents (Collet et al., 1986; Save et al., 1998)and other mammals (Cheng and Spetch, 1998) all use localvisual landmarks for orientation (Vander Wall, 1990;Devenport et al., 2000; Shettleworth, 2000).
Surprisingly, the exclusive use of acoustic landmarks hasnever before been reported for any species. Even in rats,animals that have well developed hearing, there are onlynegative findings for the use of acoustic landmarks alone forspatial orienting. For example, Rossier et al. (2000)demonstrated that the addition of acoustic cues improved theperformance of a rat using a visual landmark in a water maze,but a sound stimulus alone was not sufficient for the rat toorient properly. Indeed, there is no evidence for exclusive useof acoustic landmarks for spatial orientation, even amongauditory specialists like echolocating bats. This raises the
question of whether distal sensing of sound can serve as areliable reference for spatial orientation.
Microchiropteran bats use echolocation for spatialorientation, along with the detection and tracking of prey(Griffin, 1958). These animals probe the surroundings withhigh frequency sound pulses and listen for information aboutobjects carried by their reflected echoes. They can detectechoes from small objects at a distance up to 5·m (Kick, 1982).For object localization, bats compute the direction usinginteraural differences in the returning echoes and the distancefrom the time delay between sound emission and returningecho. The spatial resolution of the bat’s directional hearing iscomparable to many mammals, approximately 1° in thehorizontal plane (Masters et al., 1995; Simmons et al., 1983)and 3° in the vertical plane (Lawrence and Simmons, 1982).By contrast, the bat’s range resolution is highly specialized(reviewed in Moss and Schnitzler, 1995). The bat processesinformation about the environment from the direction anddistance information extracted from sonar echoes, computinga three-dimensional (3-D) acoustic representation which, inturn, can be used to establish acoustic spatial landmarks fororientation.
The Journal of Experimental Biology 208, 4399-4410Published by The Company of Biologists 2005doi:10.1242/jeb.01901
We investigated the echolocating bat’s use of anacoustic landmark for orientation in a complexenvironment with no visual information. Three bats of thespecies Eptesicus fuscus were trained to fly through a holein a mist net to receive a food reward on the other side. Inall experiments, the vocal behavior of the bats wasrecorded simultaneously using a high-speed videorecording system, allowing for a 3D reconstruction of theflight path. We ran three types of experiments, withdifferent spatial relations between the landmark and nethole. In the first experiment, the bat’s behavior wasstudied in test trials with the landmark placed 10·cm tothe left of the net opening; between test trials, the positionsof the net opening and landmark were moved, but thespatial relationship between the two remained fixed. Withthe landmark adjacent to the net opening, the bats quicklyfound the hole. In the second experiment, bats were testedin control trials in which the landmark was moved
independently of the hole, breaking the established spatialrelationship between the two. In control trials the batsrepeatedly crashed into the net next to the landmark, andinspected the area around it. In the final experiment, thelandmark was removed altogether from the set-up. Herethe bats spent more time per trial searching for the netopening with an increased number of inspections as wellas crashes into the net. However, over the course of a testday without the landmark, bats reduced the time spentper trial and focused inspections and crashes around thehole. The behavioral data show for the first time that theecholocating bat can learn to rely on an acoustic landmarkto guide spatial orientation.
Key words: bat, Eptesicus fuscus, echolocation, acoustic landmark,orientation.
Summary
Introduction
Echolocating bats can use acoustic landmarks for spatial orientation
Marianne Egebjerg Jensen1,2,*, Cynthia F. Moss1 and Annemarie Surlykke2
1Department of Psychology, University of Maryland, College Park, Maryland, USA and 2Institute of Biology,University of Southern Denmark, DK-5230 Odense, Denmark
*Author for correspondence at present address: Tønder Gymnasium and HF, DK-6270 Tønder, Denmark (e-mail: [email protected])
Accepted 27 September 2005
THE JOURNAL OF EXPERIMENTAL BIOLOGY
4400
Although bats have a high resolution echolocation systemthat allows them to operate in complete darkness, their visionis adequate to provide spatial information about landmarks inthe environment (Suthers, 1970; Neuweiler, 1999). The batretina responds best at low light levels and saturates at mediumlight levels (Hope and Bhatnagar, 1979). Visual acuity of batsis poor compared with diurnal mammals, but is comparablewith many other nocturnal mammals (Pettigrew et al., 1988).Visual acuity of the big brown bat is about 1° (Bell and Fenton,1986), similar to that of rodents.
Almost 30 years ago, Williams et al. (1966) reported thatphyllostomid bats can indeed use vision to reference landmarksas they navigate in familiar territory over several kilometers.This was demonstrated in homing experiments, in which batswere wearing either opaque masks that eliminated spatialvision or identical transparent masks, and were able to homeonly with the transparent masks that permitted the use ofvision.
Field observations also suggest that bats may use spatialmemory in favor of echolocation. For example, bats living inlarge numbers in caves appear to rely on spatial memory whenexiting at dusk. Under these conditions, bats produceecholocation pulses, but if a barricade is placed at the openingof a cave they crash into it (Griffin, 1958), which indicates thatthey may rely on spatial memory, not echoes to orient infamiliar environments.
That bats establish spatial memory of the environment isalso suggested by the results of laboratory studies. Forexample, Griffin (1958) required a bat to perform an S-shapedflight path between a roost site and a feeding site in a room.Once the bat had become familiar with the room, one of theobstacles, a large masonite plate, was moved so that theopening was now at the opposite site. The bat consistentlyproduced around 20 echolocation pulses per second whenflying and yet, when the plate was moved the bat crashed intoit at the previous position of the opening. In another study,bats of the species Megaderma lyra were trained to fly througha mesh with 70 squares, each 14·cm�14·cm, to access afeeding station. Both vision and echolocation were availableto the bat in this experiment, and the results showed that eachbat picked a preferred opening to fly through, and rememberedthe position of this opening with an accuracy of 2·cm(Neuweiler and Möhres, 1967). Also under conditions ofillumination that would permit the bat’s use of vision, studieshave also demonstrated egocentric navigation in Phyllostomusdiscolor (Höller, 1995; Höller and Schmidt, 1996), andallocentric navigation in Eptesicus fuscus (Mueller andMueller, 1979).
More recent field experiments (Helversen and Helversen,2003), and laboratory experiments in a naturalisticenvironment (Winter and Stich, 2005), demonstrated thatphyllostomid bats have a large capacity for spatial memory.Also, vespertilionid bats like Eptesicus nilssonii visit the samefeeding patches and return to the same roost, not only after anight’s hunt, but also year after year (Rydell, 1990). Thesestudies do not exclude the bat’s use of vision either, but they
show that bats establish a memory of the area in which theylive and forage, and such spatial representations can persist fora long time.
Although it has been demonstrated conclusively thatecholocating bats can use hearing to represent space with highresolution (Moss and Schnitzler, 1995) and that they can relyon 3-D acoustic information to orient in complex environments(Moss and Surlykke, 2001), the bat’s exclusive use ofecholocation to establish spatial landmarks has not beenpreviously demonstrated. A more complete study of the bat’suse of sensory information to build representations of space isimportant, not only for understanding the orientation behaviorof this animal in particular, but for learning more about spatialmemory systems in general.
To determine whether an animal can use acoustic landmarksfor spatial orientation, we conducted a series of experimentswith echolocating bats under conditions that precluded theiruse of vision. We examined details of dynamic changes insonar signal production and flight behavior when bats usedecholocation alone to navigate and seize prey in a complicatedenvironment, where it might improve its success if it made useof acoustic landmarks. Eptesicus fuscus was chosen as thestudy animal because its adaptive echolocation behavior iswell described both in the field and the laboratory. We usedthe bat’s adaptive response in sonar pulse design as anindicator of how it perceives its immediate surroundings, toreveal how it exploits landmarks and/or spatial memory whilenavigating in a complex, but familiar, environment and,importantly, in the absence of visual cues. Our results showthat echolocating bats can make use of acoustic landmarks toguide 3-D flight paths.
Materials and methodsAnimals
We initiated training of nine big brown bats Eptesicus fuscusBeauvois, of which three completed the tasks. These three batswere trained to perform in an obstacle avoidance and preycapture task in a large laboratory flight room. Two bats werecollected from the attics of private homes in Maryland, USA,whereas the third bat was collected from a winter colony inOntario, Canada. One male (M1) and one female (F1) were runin the summer and fall of 2002. The female (F1) and a differentmale (M2) were run in the spring 2003. M1 unfortunately diedover the winter. The bats were housed in a vivarium at theUniversity of Maryland under constant temperature (25°C) andhumidity (50%). The light:dark cycle of the vivarium was12·h:12·h with lights switched off at 08:00·h and turned on at20:00·h. This reversed light cycle enabled the experiments tobe conducted during daytime when the bats would otherwisebe inactive. The bats were fed on mealworms, which theycaught during experiments. Animals had access to freshwaterin their cages at all times, and vitamins were provided in thedrinking water every second day. Bats were weighed every daybefore the start of an experiment, and their mass wasmaintained between 12 and 15·g.
M. E. Jensen, C. F. Moss and A. Surlykke
THE JOURNAL OF EXPERIMENTAL BIOLOGY
4401Acoustic landmarks and orientation by bats
Experimental set-upDuring experiments the flight room was illuminated with
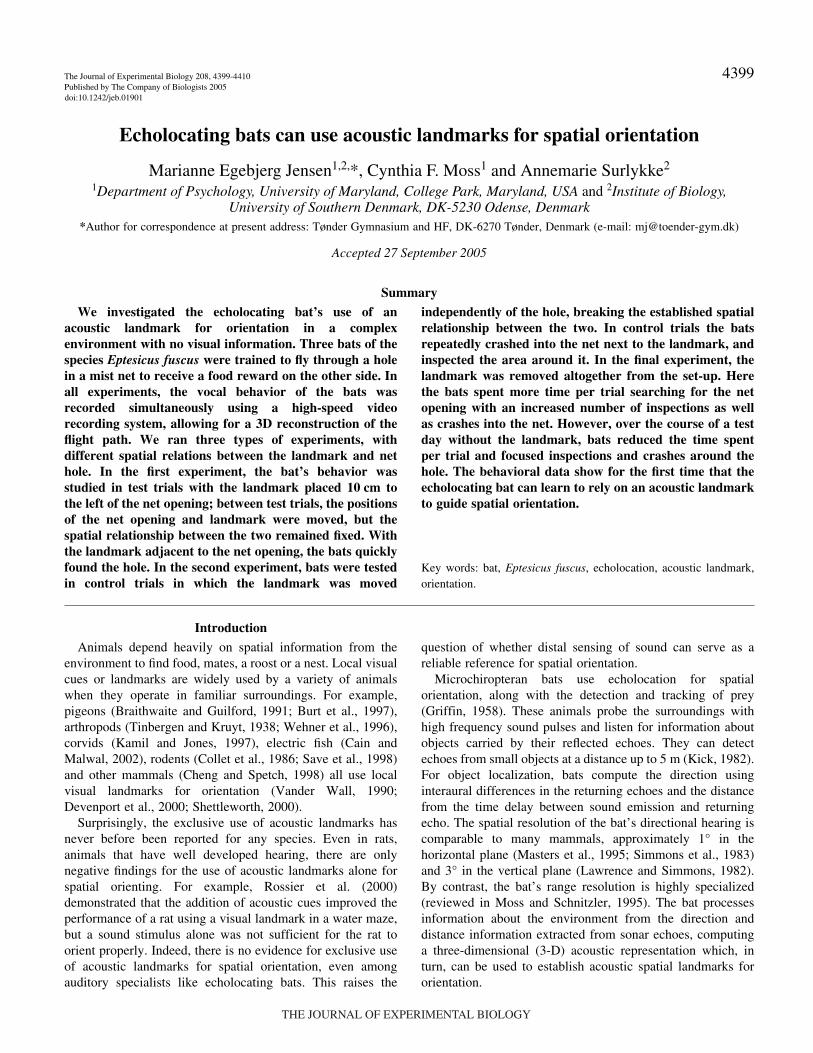
low level (less than 0.05·lux) long-wavelength light(>650·nm), precluding the bats from using vision to performthe task (Hope and Bhatnagar, 1979). Experiments wereconducted in a large flight room (6.5·m�7·m�3·m) lined withacoustic foam. The room was divided by a mist net (Avinet,Dryden, NY, USA; Fig.·1) made of 0.1·mm diameter threads,and the space between adjacent threads was 25·mm. The knotsthat tied the threads together in a diamond pattern were 0.4·mmthick. A hole with a diameter of 35·cm was cut in the net. Thebats were trained to fly through this hole to gain access to afood reward on the other side (Fig.·1). The position of the netopening was adjacent to a landmark in some experiments (seebelow). For practical reasons the net opening could only bemoved in the horizontal plane, and no vertical movement waspossible. The center of the hole was approximately 1.5·mabove the floor. The behavior of the bats was recorded on twogen-locked, high-speed video cameras (Kodak Motion Corder;240·frames·s–1) placed in two corners of the room. Using acalibration frame and commercial software (Motus 3.2,Centennial, CO, USA) this setup allowed us to reconstruct the3-D flight path of the bats. Simultaneous with the videorecordings, echolocation calls were picked up by twoultrasound microphones (Ultrasound Advice; 3.5·cm indiameter) on the floor one on each side of the net, as shown inFig.·1. The echolocation pulses were amplified (40·dB), bandpass filtered (10–100·kHz, ±3·dB, Stanford Research Systems,
Sunnyvale, CA, USA), and recorded onto two channels on aWavebook (IoTech, Cleveland, OH, USA) with sampling rateof 250·kHz for each channel. A manual end-trigger system wasconnected to both the video and sound recording systems.Upon triggering, the preceding 8·s from a buffer of the audioand video recordings were stored. This set-up allowed us tocorrelate the bat’s acoustic behavior with its flight behavior ineach trial.
Sound analysisThe echolocation sounds were analyzed using a custom
MatLab program (BatGadget, written by Aaron Shurger andmodified by Amaya Perez). Sound parameters analyzed weresignal duration, signal interval (measured from start of onesignal to the start of the next), start- and end-frequency of thefirst harmonic, and the bandwidth between these twomeasurements. Time parameters were measured from theoscillogram, whereas the frequency parameters were measuredfrom the spectrogram. Spectrograms were made of 256 pointsFast Fourier Transform (FFT), using a Hanning window and45% overlap between consecutive FFTs. Bats using frequencymodulated (FM) signals reduce signal duration as theyapproach an object, thus continually avoiding an overlapbetween outgoing cry and returning echo (Cahlander et al.,1964; Kalko and Schnitzler, 1989; Hartley, 1992). The time,or space, in which such an overlap would occur, has beenreferred to as the pulse–echo overlap zone (Kalko andSchnitzler, 1993) or the ‘inner window’ (Wilson and Moss,2004). It is assumed that this zone or inner window is anindicator of the shortest range at which a bat is searching forprey. We used the bats’ pulse duration to calculate the size ofthe inner window as (G) � signal duration � speed of sound(Kalko and Schnitzler, 1993), i.e. the minimum target distancein front of the bat where there is just no overlap betweenoutgoing pulse and returning target echo.
Video analysisFor each video frame, the positions of the bat, the landmark,
each microphone, the edge of the net hole (using eight evenlyspaced markings) and the mealworm were digitized. Eachobject was marked with a different color to identify it andmatch up the spatial coordinates of recordings in the twocameras. The coordinates were then exported to a database andcombined with the sound recordings to generate a 3-Danimation of the bat’s flight path in relation to the hole, thelandmark and the worm using a MatLab program (written byAaron Schurger and modified by Amaya Perez).
Echo measurementsWe measured the echoes from the net, the worm and the
landmark. Sounds were generated using a Tucker-Davis-Technologies System 2 (Alachua, FL, USA; hardware andsoftware), amplified, filtered (Stanford Research Systems) andbroadcast through a speaker [Tweeter LT800; frequencyresponse flat (±3·dB up to 100·kHz)] powered with Krone-HiteDC amplifier. Echoes were picked up with a GRAS S��
Landmark
Net
Hole in net
Microphone 1
Microphone 2
Mealworm
Camera 2Camera 1
Bat is releasedhere
Fig.·1. A schematic drawing of the experimental setup (not to scale).The net divided a large flight room in two, and the net position couldbe adjusted to change the location of the opening in the horizontalaxis. The center of the hole was approximately 1.5·m above the floor.Two high speed cameras were placed in corners of the room andrecorded the bat’s flight path. Two microphones placed 30·cm abovethe floor, one on each side of the net (both 50·cm from the net),recorded the bat’s echolocation pulses. A landmark (photo tripod) wasplaced on the left side of the hole, and a tethered mealworm was hungfrom the ceiling at various positions on the other side of the net. Thebat had to find its way through the net opening in order to get themealworm reward.
THE JOURNAL OF EXPERIMENTAL BIOLOGY
4402
microphone (40BF; Holte, Denmark) amplified 40·dB by aLarsen and Davis amplifier/power supply, filtered by aWaveTech filter (Karachi, Pakistan; band pass filtered10–100·kHz) and digitized on-line with a Wavebook (Iotech),using a sampling rate of 500·kHz. The emitted signal was 1·msin duration and consisted of a downward linear frequencymodulated (FM) sweep, from 90·kHz to 20·kHz, shaped by aHanning window function. The source level from the speakerwas 77·dB re SPL at 10·cm. The signal was repeated every0.05·s. The speaker and the microphone pointed towards thesame position on the target, but the microphone was placed10·cm closer to the target than the speaker to maximize thesignal-to-noise ratio (SNR). The speaker was placed 50·cmfrom the target. With a signal duration of 1·ms there was nooverlap between outgoing sound and incoming echo. Wemeasured the target strength of the net at two angles, 90° and45°, respectively, between the net and the sound beam. Targetstrengths of the landmark and the mealworm were onlymeasured from one angle. All target strength calculations arereferenced to 10·cm such that the target strength was measuredin dB as the echo level 10·cm from the target relative to theincoming sound level at the target. The target strength of thenet measured at an angle of 90° was –26·dB, whereas the targetstrength measured at an angle of 45° was –22·dB. The targetstrength of the tethered worm was –16·dB, and that of thelandmark was measured to –1·dB. All sound levels are givenin dB SPL re 0.0002·Pa·rms. The microphones were calibratedusing a Sound Level Calibrator (Brüel & Kjær 4231; Nærum,Denmark).
Behavioral experimentsSince the only source of light came from low level
(<0.05·lux), long wavelength (>650·nm) illumination, the batscould only obtain information about the room throughecholocation (Hope and Bhatnagar, 1979). The bats weretrained to fly through the hole in a mist net (see details above)and catch a tethered mealworm on the other side. After theinitial training a landmark, a photo tripod, was introduced andplaced 10·cm to the left of the hole, adjacent to it with the topof the tripod at level with the center of the hole. The bats werereleased from the same area (within 1·m3) in all trials. In thefirst 5–6 sessions, the setup was moved every fourth trial. Thelandmark was always at that same position relative to the hole,whereas the mealworm was moved to a new position betweeneach trial. We did this to show the bats that the landmarkprovided them with reliable information about the hole’sposition. We introduced control trials, in which only thelandmark was moved to a new position, whereas the holeremained in the same position. Only one control trial was runin each session. After 5–6 sessions with the setup being movedevery fourth trial, we started moving the setup between everytrial. Again one control trial was conducted in each session. Atthe end of each trial the bat was caught in a butterfly net andheld in that while the setup was moved and the video and soundrecordings were downloaded for off-line analyses. This breakbetween trials lasted for approximately 5·min. In control trials
when only the landmark was moved, we caught the bat andmade the same sounds as when we moved the net, and thebreak lasted as long as between test trials. Bats were tested 5–6days a week. Each test day is referred to as a session, with 5–11trials run for each bat in each session. We defined a trial as thetime from the release of the bat until it flew through the holeor the experimenter aborted the trial. An aborted trial occurredwhen the bat stopped attempts to fly through the hole, hung onthe wall producing few or no echolocation pulses, or repeatedlycrashed into the net in the same position. In control trials theexperimenter terminated a trial after the bat had crashed intothe net three times. From the time the bat was released until itpassed through the net opening it was free to fly around on therelease side, exploring the net, the landmark and the hole. Thebat’s behaviors were noted on data sheets, and the duration ofeach trial was determined. We also noted how often and wherethe bat crashed into the net, and how often it inspected the net,and the hole. In control trials it was further noted if the batsinspected the landmark. In test trials it was not possible toseparate inspections of the hole from inspections of thelandmark, since these were too closely spaced. The bat’sbehavior was classified as an inspection when it flew up closeto the net (or the hole and the landmark) and then away, or flewclose (within 50·cm of the net) and parallel to the net using anincreased repetition rate of echolocation pulses relative to therepetition rate used before closing in on the net. The start ofthe inspection was noted as the point where the bat came within50·cm of the net.
Finally, we conducted a series of experiments in which thelandmark was removed and the bats were required to find theopening in the net using echolocation and/or spatial memoryof the setup. The opening in the net was moved to a newposition at the start of the no-landmark sessions and remainedin that same position throughout the session. In this way wecould test if the bats developed a memory of such a setupwithin a short time of exposure (six trials per session) as someearlier anecdotal reports have suggested. The bats were stillcaught between trials and remained in the capture net whilevideo and audio data were downloaded.
ResultsDatabase
There was no significant difference in the behavior of thebats between sessions in which the setup was moved every trialand sessions in which the setup was moved every fourth trial(as indicated by the number of successful flights through thehole, number of crashes into the net, number of inspections,and time spent per trial; P<0.05). Thus, we pooled the data forthese two experiments. There were, however, some differencesin the details of the three bats’ behavior, and therefore the datafrom the three bats were analyzed separately. Table·1summarizes the number of sessions and trials analyzed for thedifferent setups for each bat. Behavioral data were noted forevery trial and in some trials the high quality video recordingswere analysed in detail, allowing for correlation between the
M. E. Jensen, C. F. Moss and A. Surlykke
THE JOURNAL OF EXPERIMENTAL BIOLOGY

4403Acoustic landmarks and orientation by bats
acoustic behavior and flight behavior (Table·1). In the courseof one trial the bat may show several behaviors, i.e.inspections, crashes into the net, and flying through the hole.Thus, in some trials the sound and video recordings weredivided into sections and analyzed accordingly, with eachsection containing a particular category of behavior.
General behaviorThe three bats had individual approaches to solving the task.
When the female F1 was released, she flew directly to the samespot on the wall from which she produced echolocation pulsesof long duration (around 6–8·ms). The time she spent on thewall was highly variable, lasting between a few seconds and
several minutes. When taking off, she reduced pulse durationto ca. 3·ms and either flew one or two rounds before going backto the wall, or made an attempt to go through the hole. If theattempt resulted in a crash into the net she returned to the samespot on the wall. The male M1 never landed on the wall, butflew continually through an entire trial. Upon release he usedecholocation pulses with durations around 3·ms. The signalduration was reduced as he approached the net. Most often M1went straight from the release site to the hole and attempted togo through it. If he crashed into the net, he flew one or tworounds in the room and then made a new attempt to go throughthe hole. The second male M2 also flew throughout an entiretrial and used the same range of pulse durations as M1.
Table·1. Number of sessions and trials analyzed
Behavioral data
Landmark present Video and sound analysis
Sessions Trials No landmark Number of trials
Bat Total LM at hole LM moved Sessions Trials LM present No LM
F1 38 235 23 7 40 44 13M2 17 114 12 9 52 35 15M1 32 214 31 – – 30 –
Bat M1 died before the experiment with no landmark (LM) was conducted.
–1
0
1
2
3
Freq
uenc
y (k
Hz)
Inspection start
Fly through
Crash into net
Fly through
Inspection
Crash
A
B
C
200 ms division
100
50
100
50
100
50
D
E
F
–1 0 1Distance (m)
2 3
–1
0
1
2
3
–1 0 1 2 3
–1
0
1
2
3
–1 0 1 2 3
Dis
tanc
e (m
)
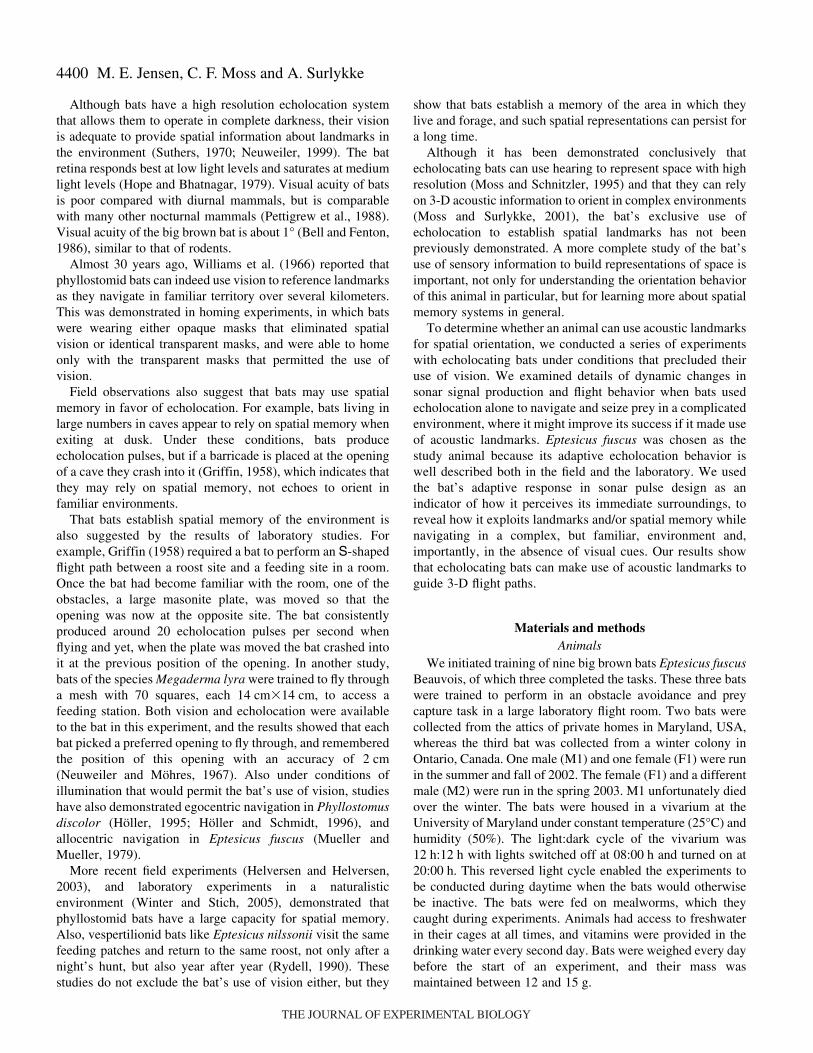
Fig.·2. Flight patterns for three different behaviors (A–C), along with the corresponding spectrograms of the sounds produced by the bats (D–F).(A,D) A bat flew through the hole. (B,E) A bat inspected the hole. (C,F) A bat crashed into the net next to the landmark, at the usual positionof the hole relative to the landmark. (A–C) The bats’ flight paths are displayed as viewed from above. The net is indicated by a diagonal lineand the opening is marked in pink. The pink triangle represents the landmark’s position along the net in the specific trial. Blue circles denotethe bat’s position at the time of vocalization and black arrows indicate flight direction. (D–F) In the spectrograms, some of the pulses areclustered together in sound groups with two or three pulses (bracketed). A vertical red line in the spectrogram shows the time the bat flewthrough the hole, crashed into the net or started an inspection.
THE JOURNAL OF EXPERIMENTAL BIOLOGY
4404
However, M2 flew a couple of rounds after release andinspected the hole and/or landmark more frequently than theother bats before he attempted to go through the hole. Thus,the individual behaviors of the three bats were different, but asthe results show, the relative changes in behavior andperformance with changes in the setup were similar for thethree animals.
Behavioral dataThree types of behaviors were possible in each trial: (1)
inspection of the net, (2) crashing into the net and (3) flyingthrough the hole. A bat might show all three in one trial, i.e.first crash into the net, then make an inspection of the net, andfinally fly through the opening. We would then record a countof one for finding the hole, but also counts for each crash andinspection. Examples of these behaviors are shown in Fig.·2.
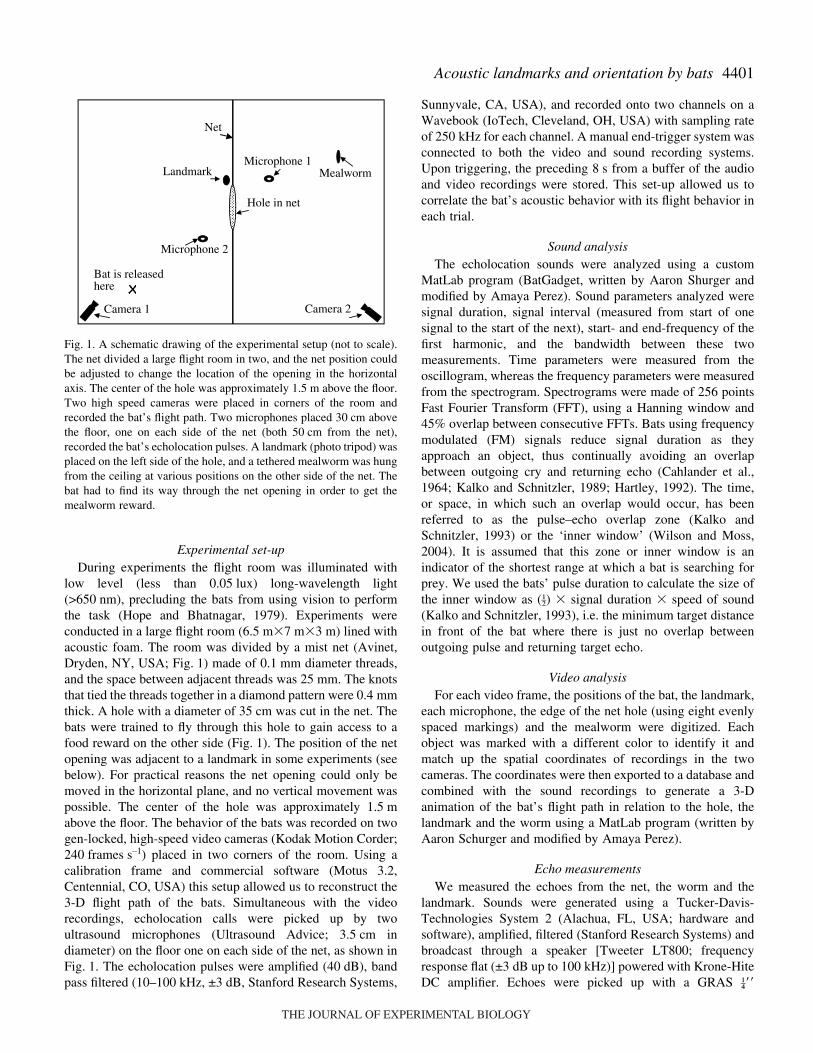
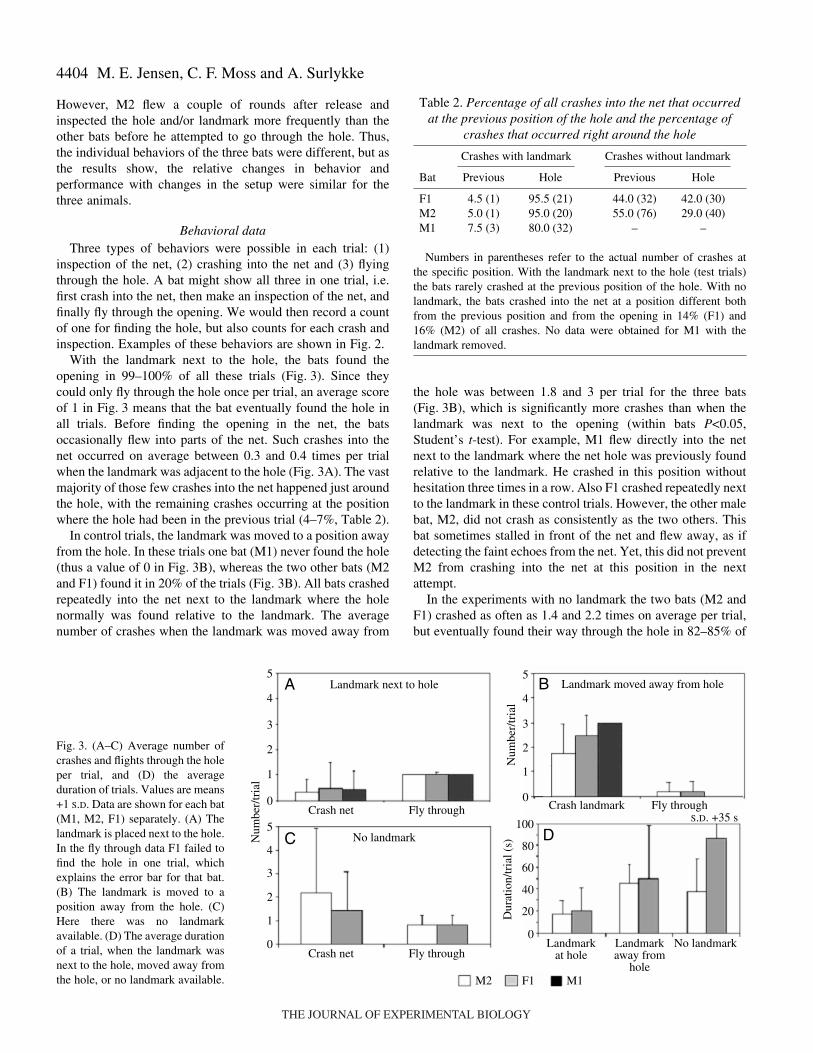
With the landmark next to the hole, the bats found theopening in 99–100% of all these trials (Fig.·3). Since theycould only fly through the hole once per trial, an average scoreof 1 in Fig.·3 means that the bat eventually found the hole inall trials. Before finding the opening in the net, the batsoccasionally flew into parts of the net. Such crashes into thenet occurred on average between 0.3 and 0.4 times per trialwhen the landmark was adjacent to the hole (Fig.·3A). The vastmajority of those few crashes into the net happened just aroundthe hole, with the remaining crashes occurring at the positionwhere the hole had been in the previous trial (4–7%, Table·2).
In control trials, the landmark was moved to a position awayfrom the hole. In these trials one bat (M1) never found the hole(thus a value of 0 in Fig.·3B), whereas the two other bats (M2and F1) found it in 20% of the trials (Fig.·3B). All bats crashedrepeatedly into the net next to the landmark where the holenormally was found relative to the landmark. The averagenumber of crashes when the landmark was moved away from
the hole was between 1.8 and 3 per trial for the three bats(Fig.·3B), which is significantly more crashes than when thelandmark was next to the opening (within bats P<0.05,Student’s t-test). For example, M1 flew directly into the netnext to the landmark where the net hole was previously foundrelative to the landmark. He crashed in this position withouthesitation three times in a row. Also F1 crashed repeatedly nextto the landmark in these control trials. However, the other malebat, M2, did not crash as consistently as the two others. Thisbat sometimes stalled in front of the net and flew away, as ifdetecting the faint echoes from the net. Yet, this did not preventM2 from crashing into the net at this position in the nextattempt.
In the experiments with no landmark the two bats (M2 andF1) crashed as often as 1.4 and 2.2 times on average per trial,but eventually found their way through the hole in 82–85% of
M. E. Jensen, C. F. Moss and A. Surlykke
0
1
2
3
4
5No landmarkC
Crash net Fly through
0
1
2
3
4
5Landmark next to holeA
Crash net Fly through
Num
ber/
tria
l
0
1
2
3
4
5Landmark moved away from holeB
Crash landmark Fly through
Num
ber/
tria
l
0
20
40
60
80
100S.D. +35 s
D
Landmarkat hole
No landmarkLandmarkaway from
hole
Dur
atio
n/tr
ial (
s)
M2 M1F1
Fig.·3. (A–C) Average number ofcrashes and flights through the holeper trial, and (D) the averageduration of trials. Values are means+1 S.D. Data are shown for each bat(M1, M2, F1) separately. (A) Thelandmark is placed next to the hole.In the fly through data F1 failed tofind the hole in one trial, whichexplains the error bar for that bat.(B) The landmark is moved to aposition away from the hole. (C)Here there was no landmarkavailable. (D) The average durationof a trial, when the landmark wasnext to the hole, moved away fromthe hole, or no landmark available.
Table·2. Percentage of all crashes into the net that occurredat the previous position of the hole and the percentage of
crashes that occurred right around the hole
Crashes with landmark Crashes without landmark
Bat Previous Hole Previous Hole
F1 4.5 (1) 95.5 (21) 44.0 (32) 42.0 (30)M2 5.0 (1) 95.0 (20) 55.0 (76) 29.0 (40)M1 7.5 (3) 80.0 (32) – –
Numbers in parentheses refer to the actual number of crashes atthe specific position. With the landmark next to the hole (test trials)the bats rarely crashed at the previous position of the hole. With nolandmark, the bats crashed into the net at a position different bothfrom the previous position and from the opening in 14% (F1) and16% (M2) of all crashes. No data were obtained for M1 with thelandmark removed.
THE JOURNAL OF EXPERIMENTAL BIOLOGY

4405Acoustic landmarks and orientation by bats
the trials (Fig.·3C). The bats did not crash at random into thenet. In fact, the majority of crashes were at the position wherethe opening had been on the previous session, and aconsiderable number of crashes occurred just around the hole(within 15·cm from the rim; numbers are listed in Table·2). BatM1 died before it could be tested in the no-landmark setup.
On average the bats took less than 20·s per trial when thelandmark was placed adjacent to the hole, whereas they spenton average 40·s or more when the landmark was moved awayfrom the hole or was absent (Fig.·3D). This is consistent withthe increased number of inspections and crashes when thelandmark was moved or absent (Figs·3 and 4).
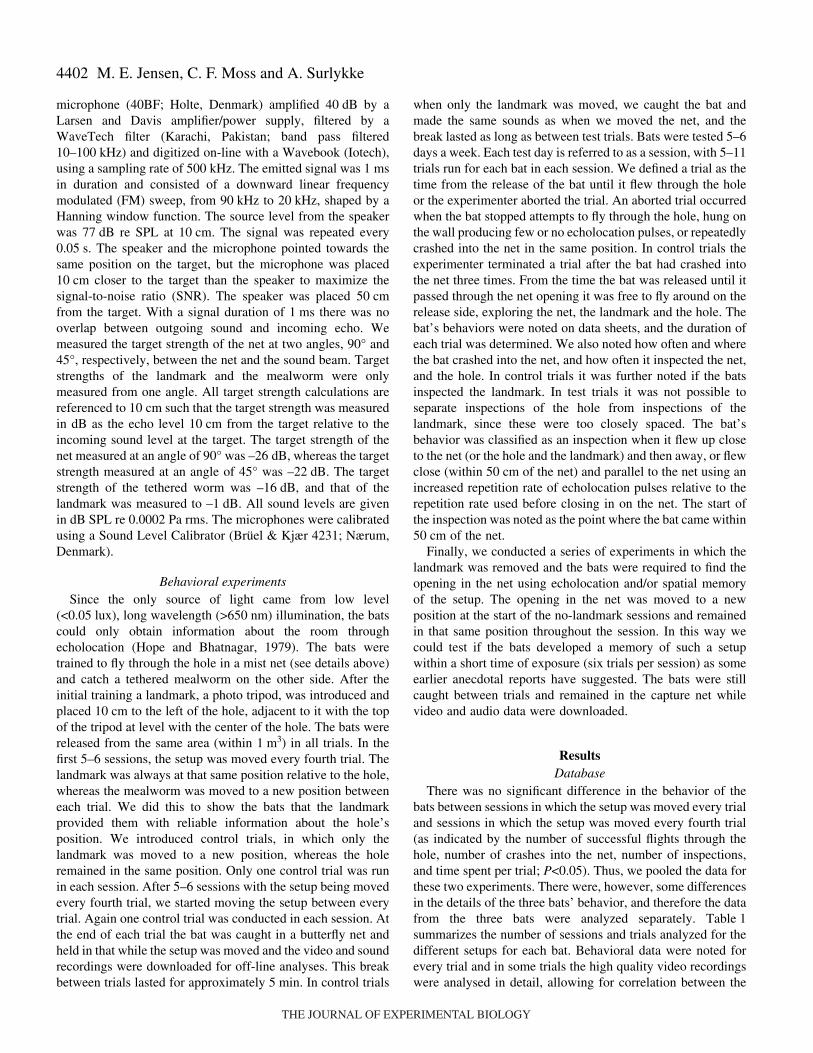
We classified flight behavior as inspections if either the batflew close to the net (within 50·cm of the net), parallel to thenet, or flew up to the net or the hole and stalled or made loopsin front of the net. All bats inspected the net more frequently incontrol trials and when there was no landmark, compared totrials in which the landmark was adjacent to the hole (Fig.·4).With the landmark placed adjacent to the opening (test trials),the bats inspected the net between 0.1 and 1.4 times per trial onaverage (Fig.·4A). This was also the case in control trials, butin addition to inspecting the net including the hole, the bats also
inspected the landmark, which was now between 1 and 3·mfrom the landmark position adjacent to the hole in test trials(Fig.·4B). When the landmark was removed the bats inspectedthe net between 1.5 and 2.5 times per trial on average (Fig.·4C).The average number of inspections differed between the threebats, with the male M2 making by far the most inspections inall situations [P<0.05, ANOVA and Tukey’s HSD test (multiplecomparison, honest significant difference test)].
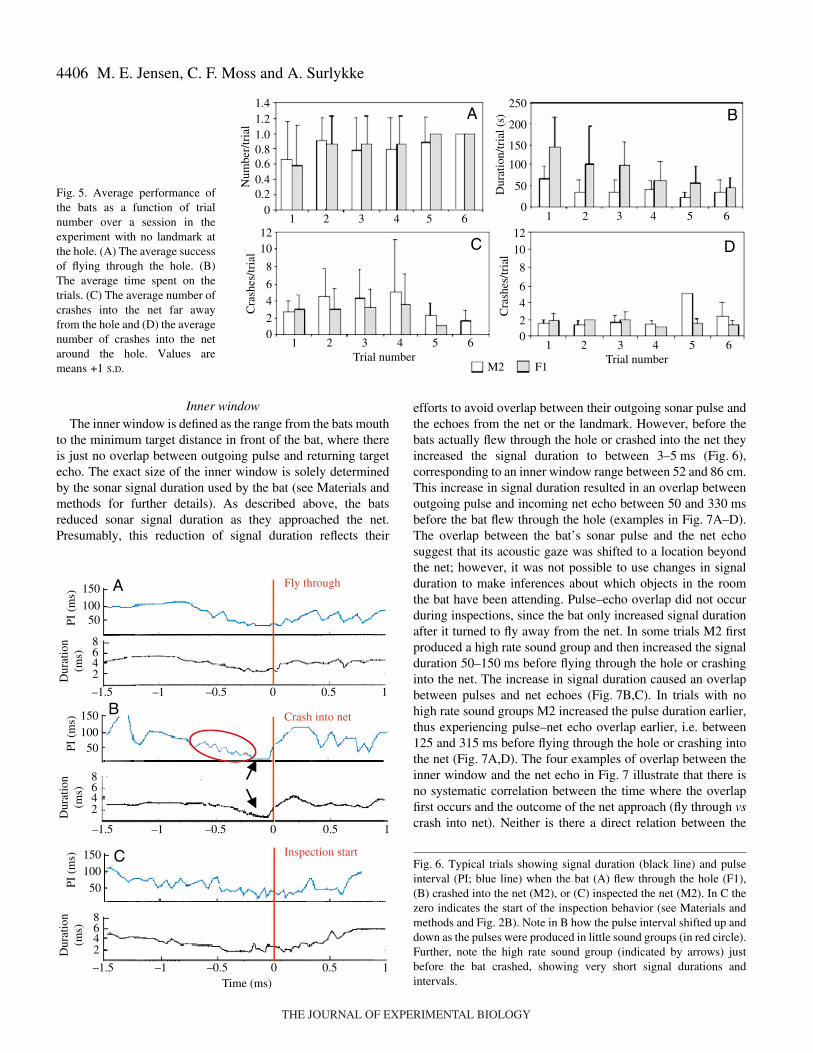
In the no landmark experiments, the hole remained in thesame position throughout the session, which made it possibleto investigate whether the bats improved their performanceover the course of a session. The average performanceimproved from trial to trial through the sessions and the batsspent less time seeking the net opening in the later trialscompared to the first ones across sessions (Fig.·5A,B). Thistrend is most clear for the bat F1 (Fig.·5B). The total numberof crashes and inspections per trial remain relativelyunchanged in the course of a session, but after parsing thecrashes into ‘crash into net’ and ‘crash into net near hole’, adifferent pattern appears (Fig.·5C,D). From trial to trial thenumber of crashes at the previous position of the holedecreased and by trial 5 or 6, both bats rarely crashed into theold hole position. After 5–6 trials F1 flew through the new holewithout much difficulty, whereas M2 also aimed at the newhole, but had some trouble determining the exact position, andhence crashed now and then.
Acoustic behaviorAll three bats showed similar acoustic behavior once they
were flying and approaching the net. They all reduced thesignal duration and pulse interval (PI) as they approached thenet, regardless of whether they flew through the hole, crashedinto the net, or flew up to inspect the net (Figs·2 and 6). Thereduction of the pulse duration was a relatively smoothtransition, whereas the PI pattern was more irregular, becauseoften the pulses were produced in sound groups, typicallyconsisting of 2–5 signals (Figs·2 and 6B). As the batapproached the net, the PI within a sound group was reducedfrom sound group to sound group. Also, the interval betweensound groups was reduced as the bat approached the net. Thiswas clearly seen for M1 and M2 whereas F1 rarely producedthese sound groups and thus had a smoother reduction in thePI as it approached the net (Fig.·6A). A distinct acousticbehavior was observed on several occasions, either when thebat flew up to the net, or before it flew through the hole orcrashed into the net. It consisted of a group of 5–25echolocation pulses in which the signal duration and PI werereduced to less than 1·ms and 10·ms, respectively (Fig.·6B). Itshows some resemblance to a feeding buzz (the terminal phaseof an insect pursuit), but also some distinct differences. Inorder to prevent confusion, we refer to this sound group as a‘high rate sound group’. High rate sound groups occurred in42% of the trials analyzed for M2, both before it flew throughthe hole or crashed into the net. Thus, it was not possible touse the bats’ acoustic behavior to predict the bats’ success inflying through the hole.
Fig.·4. Average number of inspections per trial when (A) the landmarkwas next to the hole, (B) the landmark was moved to another positionand (C) there was no landmark available. A and C show all inspectionsrecorded, whereas in B inspections are separated into inspections oflandmark and inspections of the rest of the net including the hole.Values are means +1 S.D.
0
1
2
3
4
5
6Landmark movedaway from holeB
Inspectionnet
0
1
2
3
4
5
6Landmark
next to holeA
Inspection of net
Inspectionlandmark
Insp
ectio
n/tr
ial
M2
M1
F1
0
1
2
3
4
5
6No landmarkC
Inspection of net
THE JOURNAL OF EXPERIMENTAL BIOLOGY
4406
Inner windowThe inner window is defined as the range from the bats mouth
to the minimum target distance in front of the bat, where thereis just no overlap between outgoing pulse and returning targetecho. The exact size of the inner window is solely determinedby the sonar signal duration used by the bat (see Materials andmethods for further details). As described above, the batsreduced sonar signal duration as they approached the net.Presumably, this reduction of signal duration reflects their
efforts to avoid overlap between their outgoing sonar pulse andthe echoes from the net or the landmark. However, before thebats actually flew through the hole or crashed into the net theyincreased the signal duration to between 3–5·ms (Fig.·6),corresponding to an inner window range between 52 and 86·cm.This increase in signal duration resulted in an overlap betweenoutgoing pulse and incoming net echo between 50 and 330·msbefore the bat flew through the hole (examples in Fig.·7A–D).The overlap between the bat’s sonar pulse and the net echosuggest that its acoustic gaze was shifted to a location beyondthe net; however, it was not possible to use changes in signalduration to make inferences about which objects in the roomthe bat have been attending. Pulse–echo overlap did not occurduring inspections, since the bat only increased signal durationafter it turned to fly away from the net. In some trials M2 firstproduced a high rate sound group and then increased the signalduration 50–150·ms before flying through the hole or crashinginto the net. The increase in signal duration caused an overlapbetween pulses and net echoes (Fig.·7B,C). In trials with nohigh rate sound groups M2 increased the pulse duration earlier,thus experiencing pulse–net echo overlap earlier, i.e. between125 and 315·ms before flying through the hole or crashing intothe net (Fig.·7A,D). The four examples of overlap between theinner window and the net echo in Fig.·7 illustrate that there isno systematic correlation between the time where the overlapfirst occurs and the outcome of the net approach (fly through vscrash into net). Neither is there a direct relation between the
M. E. Jensen, C. F. Moss and A. Surlykke
02
46
8
1012
M2 F1
C
1 2 3 4 5 6Trial number
Cra
shes
/tria
l
02
46
8
1012
D
1 2 3 4 5 6Trial number
Cra
shes
/tria
l
00.20.40.60.81.01.21.4
A
1 2 3 4 5 6
Num
ber/
tria
l
0
50
100
150
200
250B
1 2 3 4 5 6
Dur
atio
n/tr
ial (
s)
Fig.·5. Average performance ofthe bats as a function of trialnumber over a session in theexperiment with no landmark atthe hole. (A) The average successof flying through the hole. (B)The average time spent on thetrials. (C) The average number ofcrashes into the net far awayfrom the hole and (D) the averagenumber of crashes into the netaround the hole. Values aremeans +1 S.D.
2468
50
150100
Inspection start
Fly through
Crash into net
C
–1.5 –1 –0.5 0 0.5 1Time (ms)
Dur
atio
n(m
s)
2468
50
150100
B
–1.5 –1 –0.5 0 0.5 1
2468
50
150
100
A
–1.5 –1 –0.5 0 0.5 1
PI (
ms)
Dur
atio
n(m
s)PI
(m
s)D
urat
ion
(ms)
PI (
ms)
Fig.·6. Typical trials showing signal duration (black line) and pulseinterval (PI; blue line) when the bat (A) flew through the hole (F1),(B) crashed into the net (M2), or (C) inspected the net (M2). In C thezero indicates the start of the inspection behavior (see Materials andmethods and Fig.·2B). Note in B how the pulse interval shifted up anddown as the pulses were produced in little sound groups (in red circle).Further, note the high rate sound group (indicated by arrows) justbefore the bat crashed, showing very short signal durations andintervals.
THE JOURNAL OF EXPERIMENTAL BIOLOGY

4407Acoustic landmarks and orientation by bats
time of overlap and the presence/absence of the landmark(Fig.·7). F1 never produced high rate sound groups before itflew through the hole or crashed into the net. F1 toleratedpulse–net echo overlap between 100 and 330·ms prior to theseinteractions. This bat never used signal durations shorter than2·ms when flying through the hole, crashing into the net, or inmost inspections. Only in two inspections containing a high ratesound group did the bat’s signal duration become shorter than2·ms. In contrast to the acoustic behavior in response to the net,bats consistently adjusted the duration of their signals to avoidoverlap between pulses and landmark echoes
The acoustic behavior indicates that the bats crashed into thenet because they did not detect it. There were no obviousdifferences between the sonar behavior of a bat that crashedinto the net and one that flew successfully through the hole. Infact, it was not possible to infer from its echolocation patternif the bat had a successful fly-through or crashed into the net.
Discussion
The results of this study offer the first demonstration that ananimal can rely exclusively on acoustic landmarks to guidespatial orientation. Past research, including studies on animalswith well-developed hearing, such as rodents and echolocatingbats, have permitted the use of visual cues, sometimes incombination with acoustic cues, for spatial landmarkorientation (Hahn, 1908; Neuweiler and Möhres, 1967; Höller,1995; Rossier et al., 2000).
In the present study, an echolocating bat searched for anopening in a mist net, which allowed it access to a food reward.The bat performed this task under conditions that excluded itsuse of vision, and therefore only echoes from its sonarvocalizations provided spatial information about theenvironment. An echo-reflecting landmark provided the batwith a spatial reference to find the opening in the net. After thebat had learned that the landmark provided spatial informationabout the opening in the mist net, it successfully found its wayto the food reward. In experimental trials, the relative positionof the landmark and net opening was held constant, thoughthey were both moved inbetween trials. In control trials, thelandmark and net opening were moved independently.Although the sonar returns from the mist net can be detectedby the echolocating bat, the animals favored use of thelandmark over the net echoes to guide orientation behavior.The bat’s reliance on the acoustic landmark was indicated byrepeated crashes into the net in control trials, in which thespatial cue was invalid.
The bats produced echolocation calls continuously during alltrials, but since the animals crashed into the net adjacent to thelandmark in control trials, they either ignored or failed toperceive the echoes from the net. The echoes from thelandmark were 21–25·dB more intense than the net echoes.Listening for the intense echo from the landmark isundoubtedly an easier task than searching for opening of thenet that produced echoes with a target strength around – 22·dBand –26·dB at 10·cm, which is less than target strengths
0
1
3
2
CrashD
–1 –0.5 0 0.5 1
0
1
3
2
CrashC
–1 –0.5 0 0.5 1
Time (s)
Dis
tanc
e (m
)
0
1
3
2
Fly throughB
–1 –0.5 0 0.5 1
0
1
3
2
Fly throughA
–1 –0.5 0 0.5 1
Fig.·7. The inner window (i.e. duration of emittedpulse recalculated to distance; blue line), the bat’sdistances to the net (green line), the mealworm (blackline), and the landmark, if present (pink line). Time 0is when the bat interacts with the net (fly through orcrash). The red arrows indicate the point in time whereoverlap between the inner window and the net echostarts (blue and green lines cross and blue line is abovethe green line). (A,B) The bat flew through the holeand in (A) experienced an overlap 200·ms before itflew through the hole (see red arrow), but in (B)produced a high rate sound group and overlap betweenthe pulse and the net echo did not occur until 90·msbefore the bat flew through the hole (red arrow).(C,D) The bat crashed into the net. In (C) the batproduced a high rate sound group and the overlapoccurred around 50·ms before the bat crashed, whereasin (D) the bat did not produce this high rate soundgroup and experienced an overlap between pulse andnet echoes 190·ms before crashing into the net.
THE JOURNAL OF EXPERIMENTAL BIOLOGY
4408
measured from some of the smallest moths that bats feed on(around –17·dB at 10·cm, at 30·kHz; Surlykke et al., 1999).
When the landmark was removed altogether from the setup,the bats spent more time searching for the hole, and theycrashed into the net more frequently than when the landmarkwas present and positioned adjacent to the net opening. Overthe course of a test day when the landmark was absent, the batsspent less time searching for the net opening and found the netopening more consistently. Furthermore, in the first trials of asession the bats crashed most frequently into the net at theposition where the hole had been on the previous session, andin the later trials, when bats crashed into the net, they did soin regions adjacent to the opening. We therefore conjecture thatthe bats had adequate acoustic information to detect the net,but relied more on the strong echoes obtained from thelandmark when it was available to reference the position of thenet opening.
The bats’ crashes around the net opening in the final trialsof a session without the adjacent landmark suggest that theylearned the approximate position of the opening, likelyreferenced to other fixed objects in the room, such as themicrophones on the floor, but that the resolution of the spatialreference was too low for complete clearance through theopening in each attempt. Other studies of spatial memory indifferent bat species report higher memory resolution than wefound in the present study of E. fuscus (Höller, 1995;Neuweiler and Möhres, 1967). In fact, the bat, M. lyra,remembered the position of an opening with an accuracy of2·cm (Neuweiler and Möhres, 1967). One might therefore inferthat M. lyra shows much better resolution in spatial memorythan the bats in our study. However, in the study on M. lyrathe bats had several days (the exact number of days is notprovided by the authors) to learn the position of a preferredopening in the grid, whereas the bats in our study only had onesession (consisting of 6 trials) to learn the position of the netopening. Furthermore, the lights were on during the experimentwith M. lyra, and the authors argue that bats require visual cuesto obtain spatial memory of an area (Neuweiler and Möhres,1967). This argument is based on the observation that sightedbats found their roost with a higher success rate than blindedbats (Barbour et al., 1966; Williams et al., 1966).
It is indeed noteworthy that all prior studies of spatialmemory in bats have been conducted with illuminationpermitting the use of vision (Hahn, 1908; Neuweiler andMöhres, 1967; Höller, 1995). The reduced performanceaccuracy we find in the present study, compared to the studyon M. lyra, can be explained by a combination of speciesdifferences, lack of visual cues, or the difference in timeallowed for the bats to develop a high resolution spatialrepresentation of the environment, or perhaps all threepossibilities. It is likely that a combination of visual andauditory cues can improve the bats’ performance, as has beenshown for rats (Rossier et al., 2000), and this could possiblybe true for other animals as well. Importantly, the data reportedhere demonstrate that bats can develop spatial referencesthrough the auditory system alone.
In the present study, the bats produced echolocation soundsthroughout a trial and thus had the possibility of using sonarreturns to find the opening in the net, rather than using spatialmemory. The echo measurements of the net revealed that thesonar returns were weak, but also that their strength dependedon the angle of ensonification, such that a bat approaching thenet at a perpendicular angle received a weaker echo than a batapproaching it at a smaller angle. During inspections, the batsoften flew nearly parallel to the net, thus increasing the netecho strength. This may have helped them to detect the part ofthe net with the opening, even though the apparent size of theopening is reduced when the angle of approach diminished.Regardless of the angle of approach, the bats had difficultiesfinding the opening, suggesting that the contrast between thenet and the hole was poor, due to the faint echoes from the net.Therefore, the use of spatial landmarks would offer the animalan advantage in finding its way through the net opening.
Acoustic behaviorThere were no obvious differences between the patterns of
vocal production from a bat flying successfully through the netopening and those from a bat flying into the net. In bothsituations, the bats decreased signal duration and interval asthey approached the net, responding in both cases as if theywere approaching an object. This suggests a dissociationbetween processing and responding to echoes that wouldinform the bats of an imminent crash.
When the bats inspected the net, their acoustic behavior wasnot entirely predictable. The signal duration and intervaldecreased with approach to the net, but the reduction was notas pronounced as when they flew through the opening orcrashed into the net. All bats occasionally produced high ratesound groups during an inspection of the net, and this wasalways accompanied by sharp turns and/or loops in the flightpath. The high rate sound groups have been described in anumber of situations, for example a bat landing at a roost siteor inspecting an object (Faure and Barclay, 1994). Asmentioned above, these high rate sound groups resemble thefeeding buzz, but the pulse duration and pulse interval neverbecome as short as in a buzz that precedes insect capture. Inthe feeding buzz of E. fuscus, pulse duration and interval canbecome as short as 0.5·ms and 5.5·ms, respectively. A feedingbuzz in E. fuscus can also be divided into a buzz I and a buzzII phase (Surlykke and Moss, 2000; Griffin et al., 1960). In thehigh rate sound group the pulse duration drops below 1·ms, butthe pulse interval never falls below 10·ms, and this vocalbehavior pattern never develops into the buzz II phase, whichis characteristically produced before feeding. The high ratesound groups provide the bat with a higher rate of acousticsampling, and it may be that approach to a roosting perch, orin this case passage through an obstacle, requires increasedaccuracy in sonar localization.
The reduced sonar signal duration and interval is anexpected response from a bat approaching an object. However,at some point before flying through the hole, or crashing intothe net, the bats abruptly increased sonar signal duration, which
M. E. Jensen, C. F. Moss and A. Surlykke
THE JOURNAL OF EXPERIMENTAL BIOLOGY
4409Acoustic landmarks and orientation by bats
resulted in an overlap between the outgoing cry and the netecho. Since bats that use frequency modulated sonarvocalizations actively avoid pulse–echo overlap under mostconditions (Cahlander et al., 1964; Kalko and Schnitzler, 1989;Hartley, 1992), the abrupt increase in cry duration indicatesthat the bat shifted its acoustic gaze to a position further away,i.e. to the other side of the net. Exactly, how far out along therange axis the bat shifted its gaze is not possible to determinefrom the signal duration, which only indicates the shortestobject range to which the bat is responding. Indeed, the batmay be attending to echoes from objects at a distance thatextend beyond the inner window constrained by sonar signalduration. During inspections, the bats adjusted their sonarsignal duration consistently to avoid pulse–echo overlap, evenin situations when no high rate sound groups were produced.Therefore, during inspections, the bats’ acoustic gaze waspresumably at the net and the landmark, but not the other sideof the net.
In this study, we found that bats can rely on landmarksperceived through auditory cues alone. This, of course, does notrule out the bat’s use of visual cues in the development of aspatial representation of the natural environment. Bats often flyout at dusk, and during the commute between the roost and thehunting area, there will often be some level of light available,especially in regions with long dusks and light nights. In someparts of the world, dusk lasts for more than an hour, and it maynever get completely dark overnight, leaving the bat withreliable visual cues to orient. In areas where the nights can getvery dark, moonlight may provide the bats with sufficientillumination for using vision, along with echolocation tosuccessfully establish and reference spatial landmarks.
We want to thank Amaya Perez and Susan Sümers forassisting during experiments. Amaya Perez and Wei Xianwere most helpful in the analysis and processing of data andAnn Planeta assisted in digitizing some of the videorecordings. Kaushik Ghose and Tameeka Williams kindlyhelped conducting the echo measurements. We thank KaushikGhose, Amaya Perez and Nachum Ulanovsky for helpfulcomments on an earlier draft of this manuscript. Thesuggestions of two anonymous reviewers also greatlyimproved the manuscript. The study was supported by theDanish National Science Research Council (M.E.J.), TheNational Science Foundation, the University of MarylandCenter for Neuroscience (C.F.M.), and the Danish NationalResearch Foundation (A.S.). All experiments were approvedby the Institutional Animal Care and Use Committee at theUniversity of Maryland.
ReferencesBarbour, R. W., Davis, W. H. and Hassell, M. D. (1966). The need of vision
in homing by Myotis sodalis. J. Mammal. 47, 356-357.Bell, G. P. and Fenton, M. B. (1986). Visual acuity, sensitivity and
binocularity in a gleaning insectivorous bat, Macrotus californicus(Chiroptera: Phyllostomidae). Anim. Behav. 34, 409-414.
Braithwaite, V. A. and Guilford, T. G. (1991). Viewing familiar landscapesaffects pigeon homing. Proc. R. Soc. Lond. B 245, 183-186.
Burt, T., Holland, R. and Guilford, T. (1997). Further evidence for visuallandmark involvement in the pigeon’s familiar area map. Anim. Behav. 53,1203-1209.
Cahlander, D. A., McCue, J. J. G. and Webster, F. A. (1964). Thedetermination of distance by echolocating bats. Nature 201, 544-546.
Cain, P. and Melwal, S. (2002). Landmark use and development of navigationbehaviour in the weakly electric fish Gnathonemus petersii (Mormyridae:Teleostei). J. Exp. Biol. 205, 3915-3923.
Cheng, K., and Spetch, M. L. (1998). Mechanisms of landmark use inmammals and birds. In Spatial Representation in Animals (ed. S. D. Healy),pp. 1-17. Oxford University Press, Oxford.
Colleth, T. S., Cartwright, B. A. and Smith, B. A. (1986). Landmarklearning and visuo-spatial memories in gerbils. J. Comp. Physiol. 158, 835-851.
Devenport, J. A., Luna, L. D. and Devenport, L. D. (2000). Placement,retrieval, and memory of caches by Thirteen-lined ground squirrels.Ethology 106, 171-183.
Faure, P. A. and Barclay, R. M. R. (1994). Substrate gleaning versus aerialhawking plasticity in the foraging and echolocation behaviour of the longeared bat, Myotis evotis. J. Comp. Physiol. A 174, 651-660.
Griffin, D. R. (1958). Listening in the Dark. New Haven: Yale UniversityPress. (Reprinted by Cornell University Press, Ithaca, NY, 1986.)
Griffin, D. R., Webster, F. A. and Michael, C. R. (1960). The echolocationof flying insects. Anim. Behav. 8, 141-154.
Hahn, W. L. (1908). Some habits and sensory adaptations of cave-inhabitingbats. Biol. Bull. 15, 165-193.
Hartley, D. J. (1992). Stabilization of perceived echo amplitudes inecholocating bats. II. The acoustic behavior of the big brown bat, Eptesicusfuscus, when tracking moving prey. J. Acoust. Soc. Am. 91, 1133-1149.
Helversen, D. V. and Helversen, O. V. (2003). Object recognition byecholocation: a nectar-feeding bat exploiting the flowers of a rain forestvine. J. Comp. Physiol. A 189, 327-336.
Hope, G. M. and Bhatnagar, K. P. (1979). Electrical response of bat retinato spectral stimulation: Comparison of four microchiropteran species.Experientia 35, 1189-1191.
Höller, P. (1995). Orientation by the bat Phyllostomus discolor(Phyllostomidae) on the return flight to its resting place. Ethology 100, 72-83.
Höller, P. and Schmidt, U. (1996). The orientation behaviour of the lesserspearnosed bat, Phyllostomus discolor (Chiroptera) in a model roost.Concurrence of visual, echoacoustical and endogenous spatial information.J. Comp. Physiol. A 179, 245-254.
Kalko, E. K. V. and Schnitzler, H. U. (1989). The echolocation and huntingbehavior of Daubenton’s bat, Myotis daubentonii. Behav. Ecol. Sociobiol.24, 225-238.
Kalko, E. K. V. and Schnitzler, H. U. (1993). Plasticity in echolocationsignals of European Pipistrelle bats in search flight: implications for habitatuse and prey detection. Behav. Ecol. Sociobiol. 33, 415-428.
Kamil, A. C. and Jones, J. E. (1997). The seed storing Corvid Clark’snutcracker learns geometric relationships among landmarks. Nature 390,276-279.
Kick, S. (1982). Target detection by the echolocating bat, Eptesicus fuscus. J.Comp. Phys. 145, 431-435.
Lawrence, B. D. and Simmons, J. A. (1982). Echolocation in bats – theexternal ear and perception of the vertical positions of targets. Science 218,481-483.
Masters, M., Raver, K. A. S. and Kazial, K. A. (1995). Sonar signals of bigbrown bats, Eptesicus fuscus, contain information about individual identity,age and family affiliation. Anim. Behav. 50, 1243-1260.
Moss, C. F. and Schnitzler, H.-U. (1995). Behavioral studies of auditoryinformation processing. In Hearing by Bats, Vol. 5 (ed. A. N. Popper andR. R. Fay), pp. 87-145. Berlin: Springer-Verlag.
Moss, C. F. and Surlykke, A. (2001). Auditory scene analysis byecholocation in bats. J. Acoust. Soc. Am. 110, 2207-2226.
Mueller, H. C. and Mueller, N. S. (1979). Sensory basis for spatial memoryin bats. J. Mamm. 60, 198-201.
Neuweiler, G. (1999). Knowledge against Zukunftsangst. Nature 397, 224.Neuweiler, G. and Möhres, F. P. (1967). Die Rolle des Ortsgedänknisses bei
orientirung der GrossBlatt-Fledermaus, Megaderma lyra. Z. Vergl. Physiol.57, 147-171.
Pettigrew, J. D., Dreher, B., Hopkins, C. S., McCall, M. J. and Brown, M.(1988). Peak density and distribution of ganglion cells in the retinae ofmicrochiropteran bats: implications for visual acuity. Brain Behav. Evol. 32,39-56.
Rossier, J., Haeberli, C. and Schenk, F. (2000). Auditory cues support place
THE JOURNAL OF EXPERIMENTAL BIOLOGY
4410
navigation in rats when associated with a viual cues. Behav. Brain Res. 117,209-214.
Rydell, J. (1990). Behavioural variation in the echolocation pulses of thenorthern bat, Eptesicus nilssonii. Ethology 90, 103-113.
Save, E., Poucet, B. and Thinus-Blanc, C. (1998). Landmark use and thecognitive map in the rat. In Spatial Representation in Animals (ed. S. D.Healy), pp. 119-132. Oxford: Oxford University Press.
Shettleworth, S. J. (2003). Memory and hippocampal specialization in foodstoring birds: Challenges for research on comparative cognition. BrainBehav. Evol. 62, 108-116.
Simmons, J. A., Kick, S. A. and Lawrence, B. D. (1983). Acuity ofhorizontal angle discrimination by the echolocating bat, Eptesicus fuscus. J.Comp. Physiol. 153, 321-330.
Surlykke, A. and Moss, C. F. (2000). Echolocation behavior of big brownbats, Eptesicus fuscus, in the field and the laboratory. J. Acoust. Soc. Am.108, 2419-2429.
Surlykke, A., Filskov, M., Fullard, J. H. and Forrest, E. (1999). Auditoryrelationships to size in Noctuid moths: Bigger is better. Naturwissenshaften86, 238-241.
Suthers, R. A. (1970). A comment on the role of chorodial papillae in fruitbat retina. Vis. Res. 10, 921-923.
Tinbergen, N. and Kruyt, W. (1938). Über die orientierung des Bienenwolfes(Philanthus triangulum Fabr.). Z. Vergl. Physiol. 25, 292-334.
Vander Wall, S. B. (1990). Food Hoarding in Animals. Chicago: Universityof Chicago Press.
Wehner, R., Michel, B. and Antonsen, P. (1996). Visual navigation ininsects: Coupling of egocentric and geocentric information. J. Exp. Biol.199, 129-140.
Williams, T. C., Williams, J. M. and Griffin, D. R. (1966). The homingability of the neotropical bat, Phyllostomus hastatus, with evidence forvisual orientation. Anim. Behav. 14, 468-473.
Wilson, W. W. and Moss, C. F. (2004). Sensorimotor behavior of free-flyingFM bats during target capture. In Echolocation in Bats and Dolphins (ed.J. Thomas, C. F. Moss and M. Vater), pp. 22-27. Chicago: University ofChicago Press.
Winter, Y. and Stich, K. P. (2005). Foraging in a complex naturalisticenvironment: capacity of spatial working memory in flower bats. J. Exp.Biol. 208, 539-548.
M. E. Jensen, C. F. Moss and A. Surlykke
THE JOURNAL OF EXPERIMENTAL BIOLOGY