ece 303 and 353 _lab_manual
DESCRIPTION
mnualTRANSCRIPT
ECE 303 n 353 – UEL 3Laboratory Manual
DEPARTMENT OF ECE, LPU, PHAGWARA (PUNJAB), INDIA. 1
Draft copy for adoption:
LABORATORY MANUAL OF ECE 303 and 353
UEL 3 LAB
Prepared at Lovely Professional University
With
Participation &
Valuable contributions from
Er. Surrender kumar Er. Jyotika
Er. Saurab
Reviewed and corrected by.
Rajeev Kr Patial
Sr lect., off. HOL, ECE (B. Id. 12301)
OFF HOD ECE
(Dean Labs ) (Vice Chancellor) (Chancellor)
ECE 303 n 353 – UEL 3Laboratory Manual
DEPARTMENT OF ECE, LPU, PHAGWARA (PUNJAB), INDIA. 2
ECE303 and ECE353: UEL 3
1. Interfacing and control of stepper motor using 8085 microprocessor.
2. Generation of delay in binary counting using 8085 microprocessor.
3. To implement a moving 7-segment display with suitable delay using 8085 microprocessor.
4. To realize a real time clock using 8085 microprocessor.
5. To develop program for discrete convolution and correlation.
6. To develop a program for computing DFT and IDFT in MATLAB.
7. To develop a program for computing circular convolution.
8. To develop a program for computing inverse Z-transform.
9. To develop a program for designing FIR filter in MATLAB.
10. To develop a program for designing IIR filter in MATLAB.
11. *To design and implement on a breadboard a circuit to perform Amplitude Modulation.
12. *To design and implement on a breadboard a circuit to perform Frequency Modulation, Phase Modulation.
ECE 303 n 353 – UEL 3Laboratory Manual
DEPARTMENT OF ECE, LPU, PHAGWARA (PUNJAB), INDIA. 3
PROGRAM -1 AIM Interfacing and control of stepper motor using 8085 microprocessor.
Apparatus required stepper motor(12 volts)
SAMPLE PROGRAM Interface a Stepper Motor to the 8085 microprocessor system and
write an 8085 assembly language program to control the Stepper Motor.
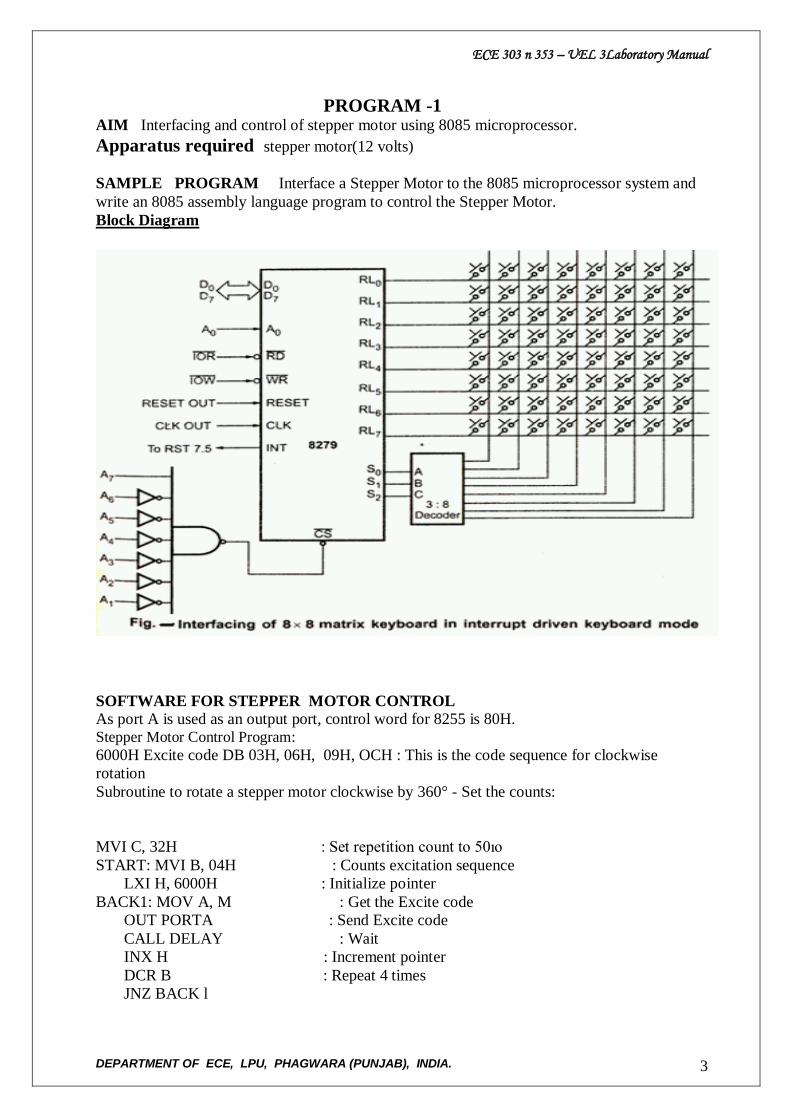
Block Diagram
SOFTWARE FOR STEPPER MOTOR CONTROL
As port A is used as an output port, control word for 8255 is 80H. Stepper Motor Control Program:
6000H Excite code DB 03H, 06H, 09H, OCH : This is the code sequence for clockwise
rotation
Subroutine to rotate a stepper motor clockwise by 360° - Set the counts:
MVI C, 32H : Set repetition count to 50ıο
START: MVI B, 04H : Counts excitation sequence
LXI H, 6000H : Initialize pointer
BACK1: MOV A, M : Get the Excite code
OUT PORTA : Send Excite code
CALL DELAY : Wait
INX H : Increment pointer
DCR B : Repeat 4 times
JNZ BACK l
ECE 303 n 353 – UEL 3Laboratory Manual
DEPARTMENT OF ECE, LPU, PHAGWARA (PUNJAB), INDIA. 4
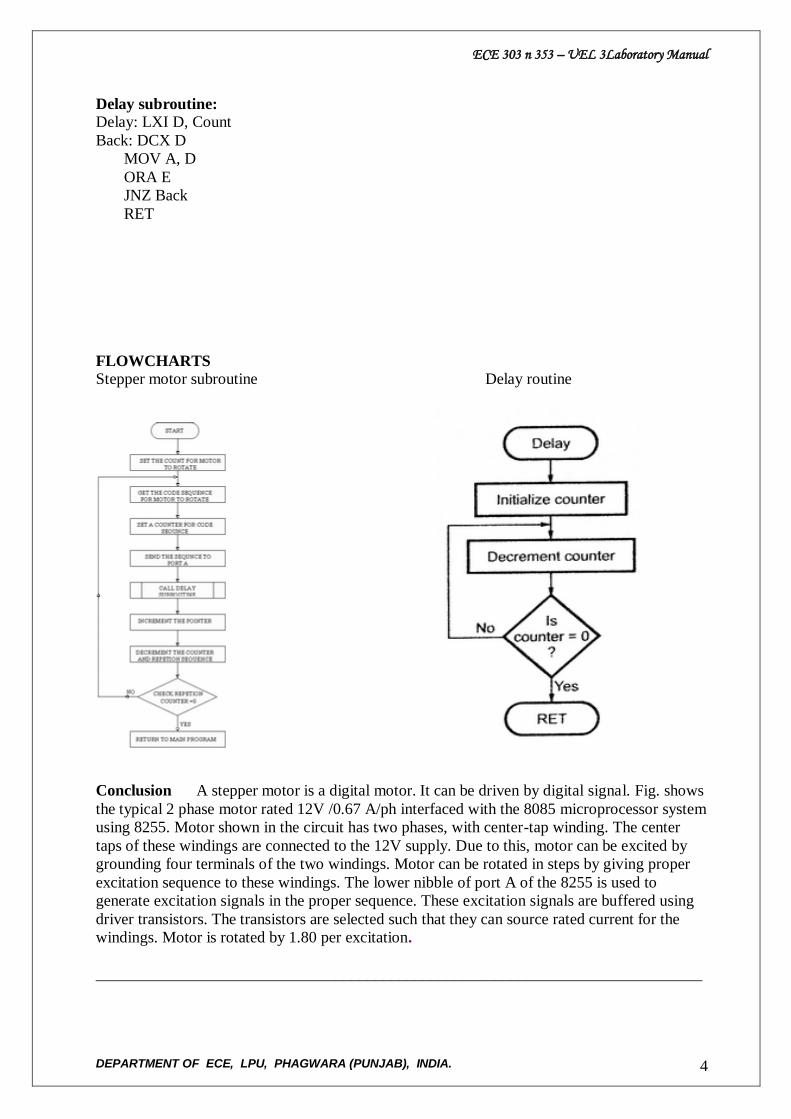
Delay subroutine:
Delay: LXI D, Count
Back: DCX D
MOV A, D
ORA E
JNZ Back
RET
FLOWCHARTS
Stepper motor subroutine Delay routine
Conclusion A stepper motor is a digital motor. It can be driven by digital signal. Fig. shows
the typical 2 phase motor rated 12V /0.67 A/ph interfaced with the 8085 microprocessor system
using 8255. Motor shown in the circuit has two phases, with center-tap winding. The center
taps of these windings are connected to the 12V supply. Due to this, motor can be excited by
grounding four terminals of the two windings. Motor can be rotated in steps by giving proper
excitation sequence to these windings. The lower nibble of port A of the 8255 is used to
generate excitation signals in the proper sequence. These excitation signals are buffered using
driver transistors. The transistors are selected such that they can source rated current for the
windings. Motor is rotated by 1.80 per excitation.
____________________________________________________________________________
ECE 303 n 353 – UEL 3Laboratory Manual
DEPARTMENT OF ECE, LPU, PHAGWARA (PUNJAB), INDIA. 5
PROGRAM - 2 AIM Generation of delay in binary counting using 8085 microprocessor .
SAMPLE PROGRAM Write a program for displaying binary up counter. Counter should
count numbers from 00 to FFH and it should increment after every 0.5 sec.
Source Program:
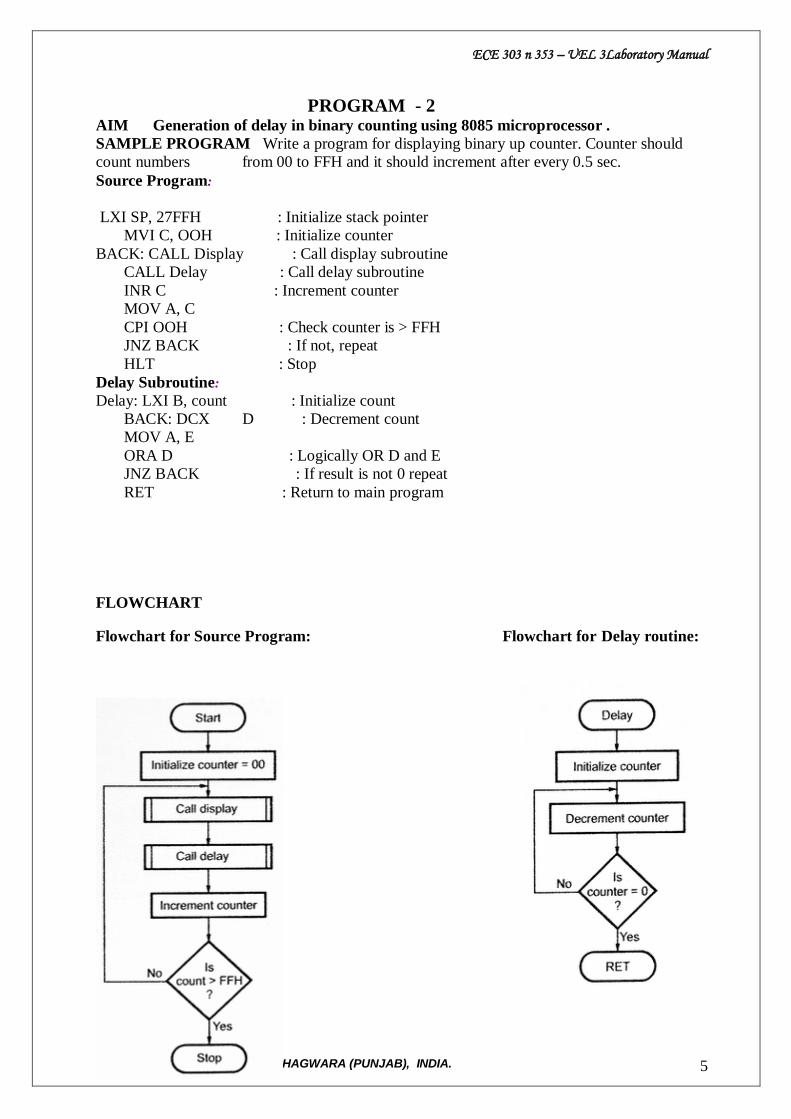
LXI SP, 27FFH : Initialize stack pointer
MVI C, OOH : Initialize counter
BACK: CALL Display : Call display subroutine
CALL Delay : Call delay subroutine
INR C : Increment counter
MOV A, C
CPI OOH : Check counter is > FFH
JNZ BACK : If not, repeat
HLT : Stop
Delay Subroutine:
Delay: LXI B, count : Initialize count
BACK: DCX D : Decrement count
MOV A, E
ORA D : Logically OR D and E
JNZ BACK : If result is not 0 repeat
RET : Return to main program
FLOWCHART
Flowchart for Source Program: Flowchart for Delay routine:
ECE 303 n 353 – UEL 3Laboratory Manual
DEPARTMENT OF ECE, LPU, PHAGWARA (PUNJAB), INDIA. 6
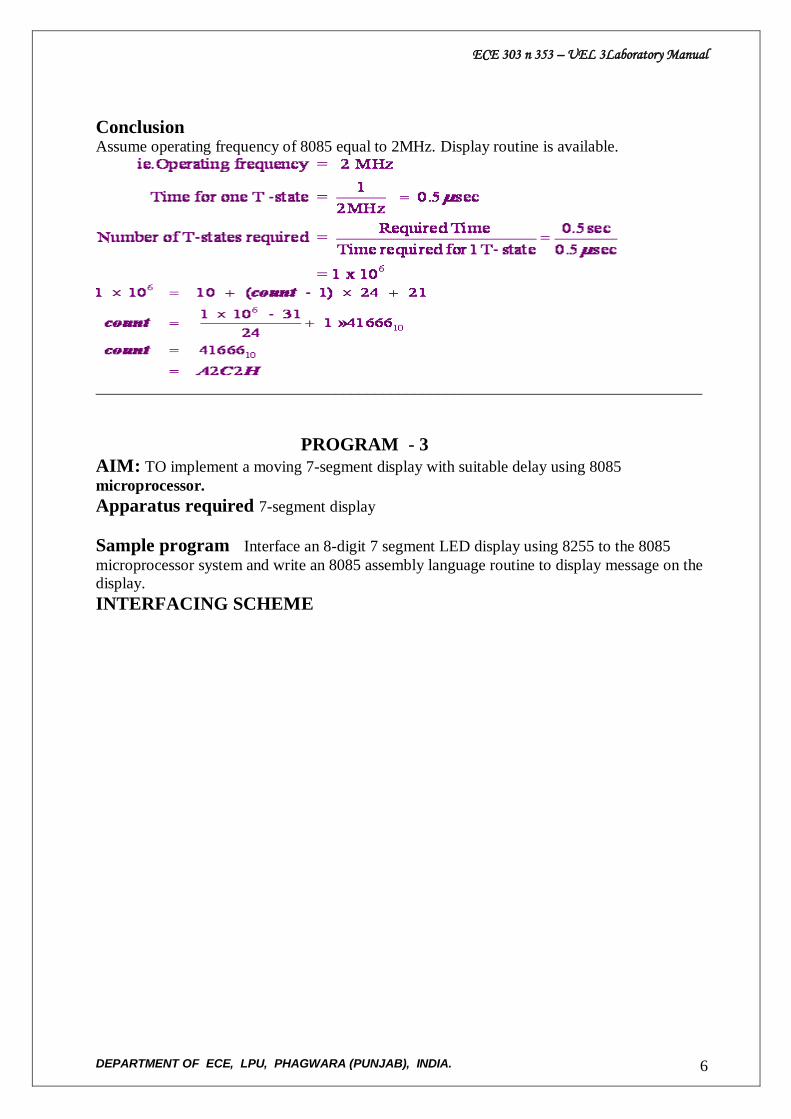
Conclusion Assume operating frequency of 8085 equal to 2MHz. Display routine is available.
____________________________________________________________________________
PROGRAM - 3
AIM: TO implement a moving 7-segment display with suitable delay using 8085
microprocessor.
Apparatus required 7-segment display
Sample program Interface an 8-digit 7 segment LED display using 8255 to the 8085
microprocessor system and write an 8085 assembly language routine to display message on the
display.
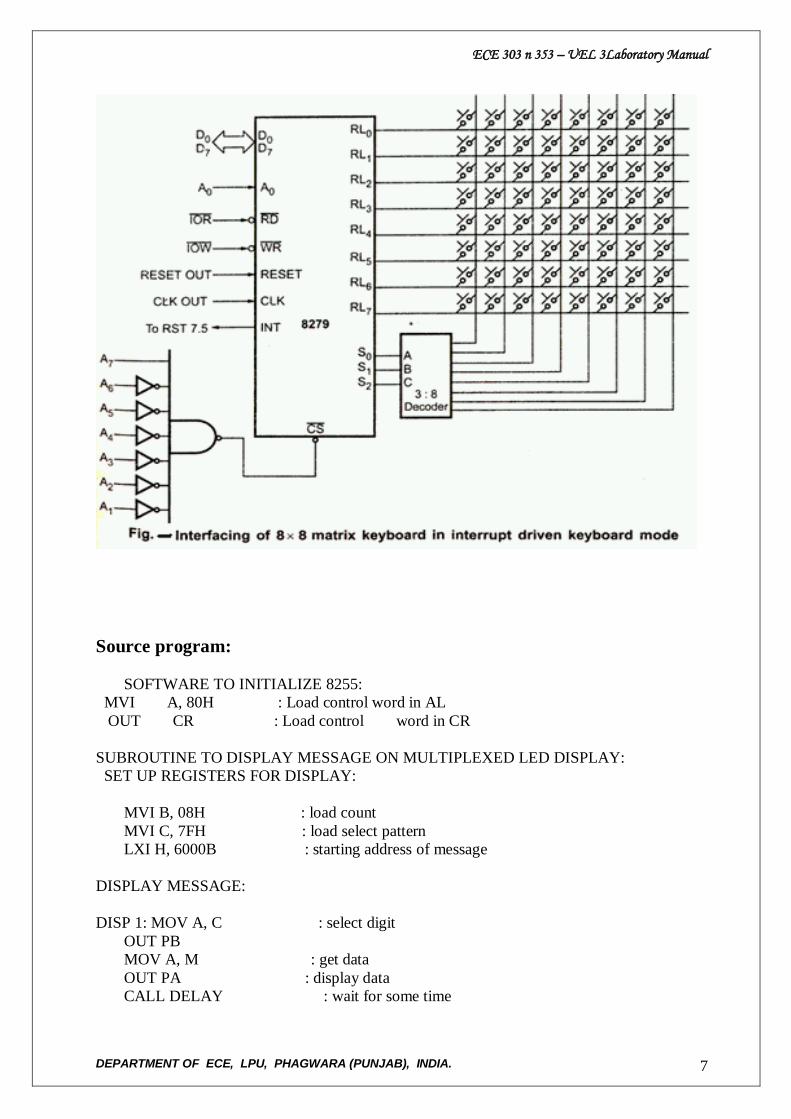
INTERFACING SCHEME
ECE 303 n 353 – UEL 3Laboratory Manual
DEPARTMENT OF ECE, LPU, PHAGWARA (PUNJAB), INDIA. 7
Source program:
SOFTWARE TO INITIALIZE 8255:
MVI A, 80H : Load control word in AL
OUT CR : Load control word in CR
SUBROUTINE TO DISPLAY MESSAGE ON MULTIPLEXED LED DISPLAY:
SET UP REGISTERS FOR DISPLAY:
MVI B, 08H : load count
MVI C, 7FH : load select pattern
LXI H, 6000B : starting address of message
DISPLAY MESSAGE:
DISP 1: MOV A, C : select digit
OUT PB
MOV A, M : get data
OUT PA : display data
CALL DELAY : wait for some time
ECE 303 n 353 – UEL 3Laboratory Manual
DEPARTMENT OF ECE, LPU, PHAGWARA (PUNJAB), INDIA. 8
DISP 1: MOV A, C
RRC
MOV C, A : adjust selection pattern
INX H
DCR B : Decrement count
JNZ DISP 1 : repeat 8 times
RET Note: This "display message subroutine" must be called continuously to display the 7-segment coded
message stored in the memory from address 6000H.
Delay subroutine:
Delay: LXI D, Count
Back: DCX D
MOV A, D
ORA E
JNZ Back
RET
CONCLUSION
Fig. shows the multiplexed eight 7-segment display connected in the 8085 system using 8255.
In this circuit port A and port B are used as simple latched output ports. Port A provides the
segment data inputs to the display and port B provides a means of selecting a display position
at a time for multiplexing the displays. A0-A7 lines are used to decode the addresses for 8255.
For this circuit different addresses are:
PA = 00H PB = 01H
PC = 02H CR = 03H.
The register values are chosen in Fig. such that the segment current is 80 mA. This current is
required to produce an average of 10 mA per segment as the displays are multiplexed. In this
type of display system, only one of the eight display position is 'ON' at any given instant. Only
one digit is selected at a time by giving low signal on the corresponding control line. Maximum
anode current is 560 mA (7-segments x 80 mA = 560 mA), but the average anode current is 70
mA.
____________________________________________________________________________
PROGRAM - 4 AIM : TO Realize real time clock using 8085 microprocessor .
Sample program WAP to realize real time clock. Display seconds in data field, minutes
and hours in address field.
ALGORITHM
STEP 1: Initialize the data for seconds in
acc...
STEP 2: Initialize the data for minutes in L
reg. STEP 3: Initialize the data for hours in H
reg
STEP 4: Display the data in the display
ECE 303 n 353 – UEL 3Laboratory Manual
DEPARTMENT OF ECE, LPU, PHAGWARA (PUNJAB), INDIA. 9
field
STEP 5: Call proper delay of one second.
STEP 6: Increment the second by 01 and
compare it with the value 60
suitably if it is equal increment the
minute by one and compare it with
the value 24 suitably, if not for all
the above increment the second
Value and repeat the steps 4-5.
STEP7: Termination
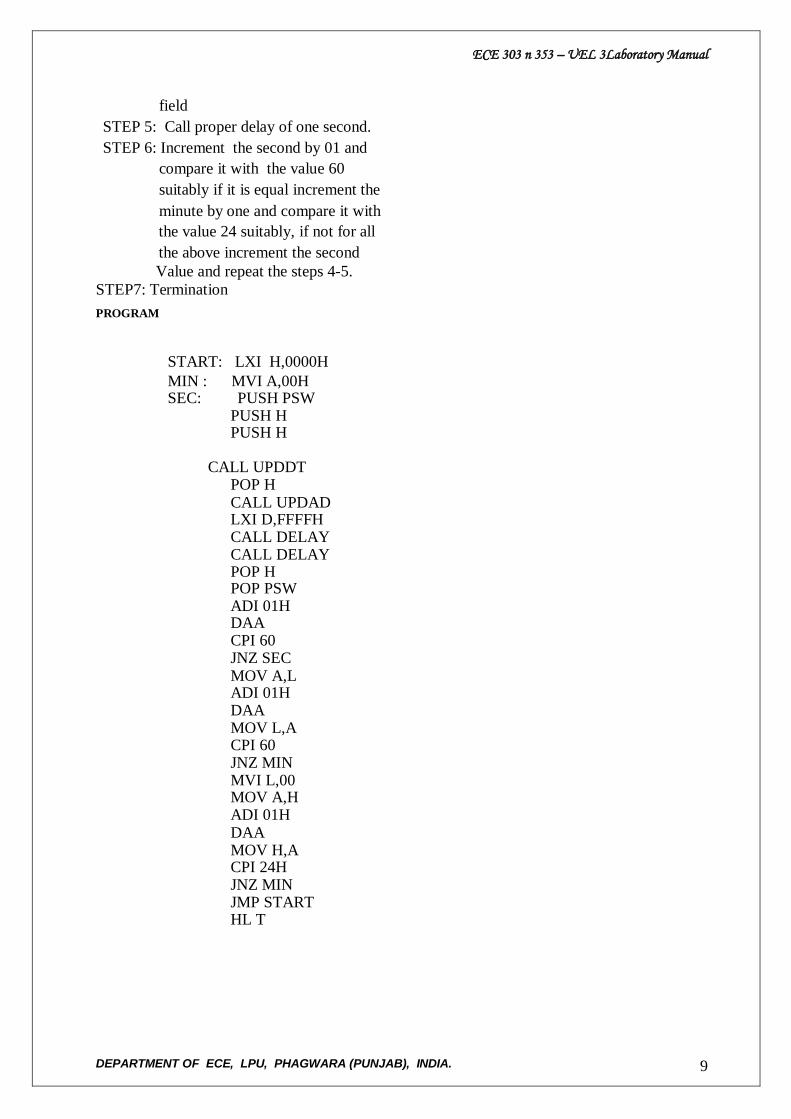
PROGRAM
START: LXI H,0000H
MIN : MVI A,00H SEC: PUSH PSW
PUSH H PUSH H
CALL UPDDT POP H CALL UPDAD LXI D,FFFFH CALL DELAY CALL DELAY POP H POP PSW ADI 01H DAA CPI 60 JNZ SEC MOV A,L ADI 01H DAA MOV L,A CPI 60 JNZ MIN MVI L,00 MOV A,H ADI 01H DAA MOV H,A CPI 24H JNZ MIN JMP START HL T
ECE 303 n 353 – UEL 3Laboratory Manual
DEPARTMENT OF ECE, LPU, PHAGWARA (PUNJAB), INDIA. 10
RESULT: AFTER EXECUTION
Address field Data field
Hours Min sec
0000 01
____________________________________________________________________________
Experiment No:-5
AIM: To develop program for discrete Convolution and Correlation
Software Required : MATLAB 7.5
ALGORITHM:
1. Enter the input Sequence ,x having length=4
2. Enter the Impulse Sequence, h having length=4
3. Performing the Convolution, store the value in y
4. Plotting the Input Sequence.
5. Plotting the Impulse Sequence.
6. Plotting the Output Sequence.
PROGRAM CODE:
% program for discrete Convolution
x=[1,1,1,2];
h=[1,1,2,1];
Nx=length(x);
Nh=length(h);
y=conv(x,h);
n=0:1:Nx-1;
subplot(2,2,1),stem(n,x);
xlabel('n'),ylabel('x(n)');
title('input sequence');
n=0:1:Nh-1;
subplot(2,2,2),stem(n,h);
xlabel('n'),ylabel('h(n)');
title('impulse sequence');
n=0:1:Nx+Nh-2
subplot(2,2,3),stem(n,y);
xlabel('n'),ylabel('y(n)');
title('output sequence(linear convolution)');
ECE 303 n 353 – UEL 3Laboratory Manual
DEPARTMENT OF ECE, LPU, PHAGWARA (PUNJAB), INDIA. 11
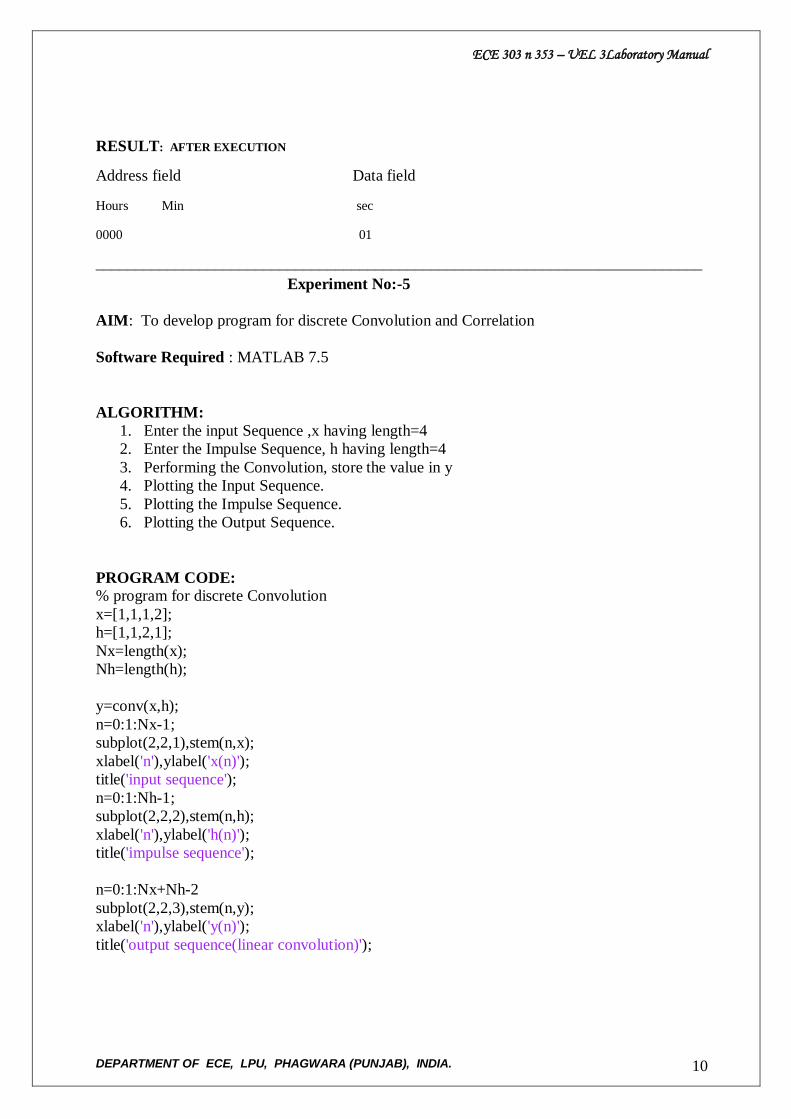
RESULT:
0 1 2 30
0.5
1
1.5
2
n
x(n
)
input sequence
0 1 2 30
0.5
1
1.5
2
nh(n
)
impulse sequence
0 2 4 60
2
4
6
n
y(n
)
output sequence(linear convolution)
__________________________________________________________
ALGORITHM:
1 Enter the input Sequence ,x having length=4
2 Enter the Impulse Sequence, y having length=4
3 Performing the Correlation, store the value in y
4 Plotting the Output Sequence ,store in z.
%program for discrete Correlation
X = [1 2 3 4];
Y = [2 3 4 5];
Z = xcorr(x,y);
stem(z);
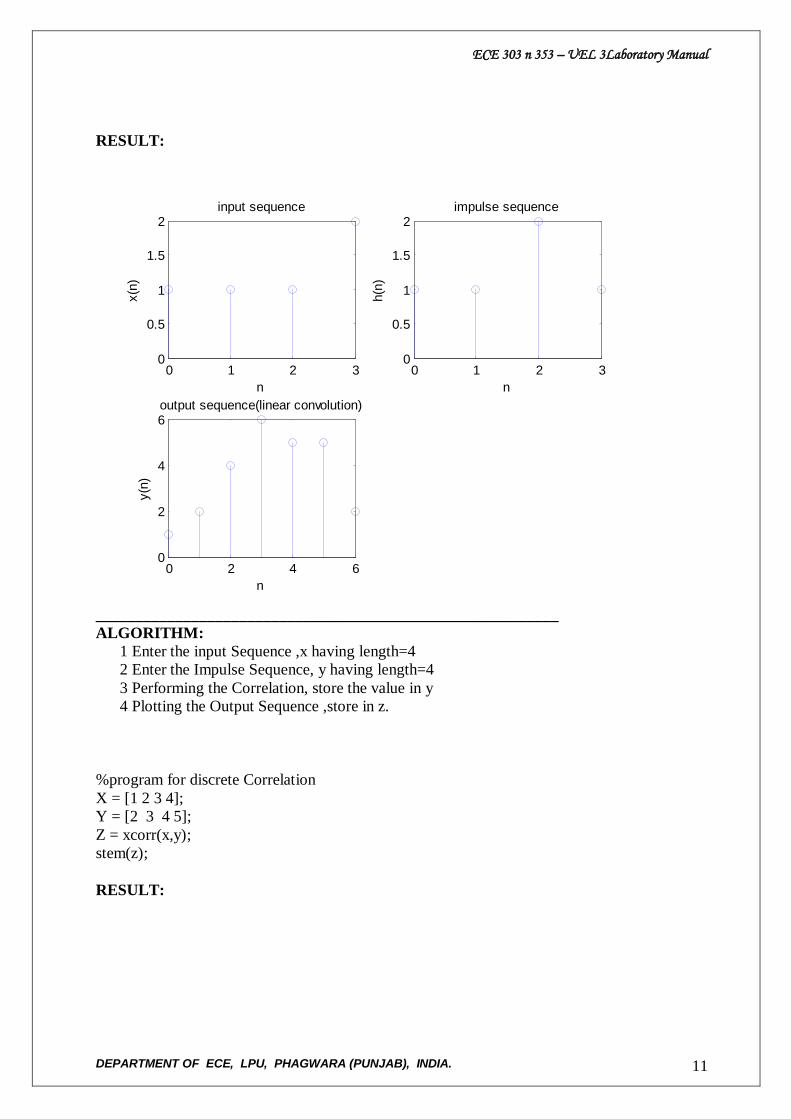
RESULT:
ECE 303 n 353 – UEL 3Laboratory Manual
DEPARTMENT OF ECE, LPU, PHAGWARA (PUNJAB), INDIA. 12
1 2 3 4 5 6 70
5
10
15
20
25
30
35
40
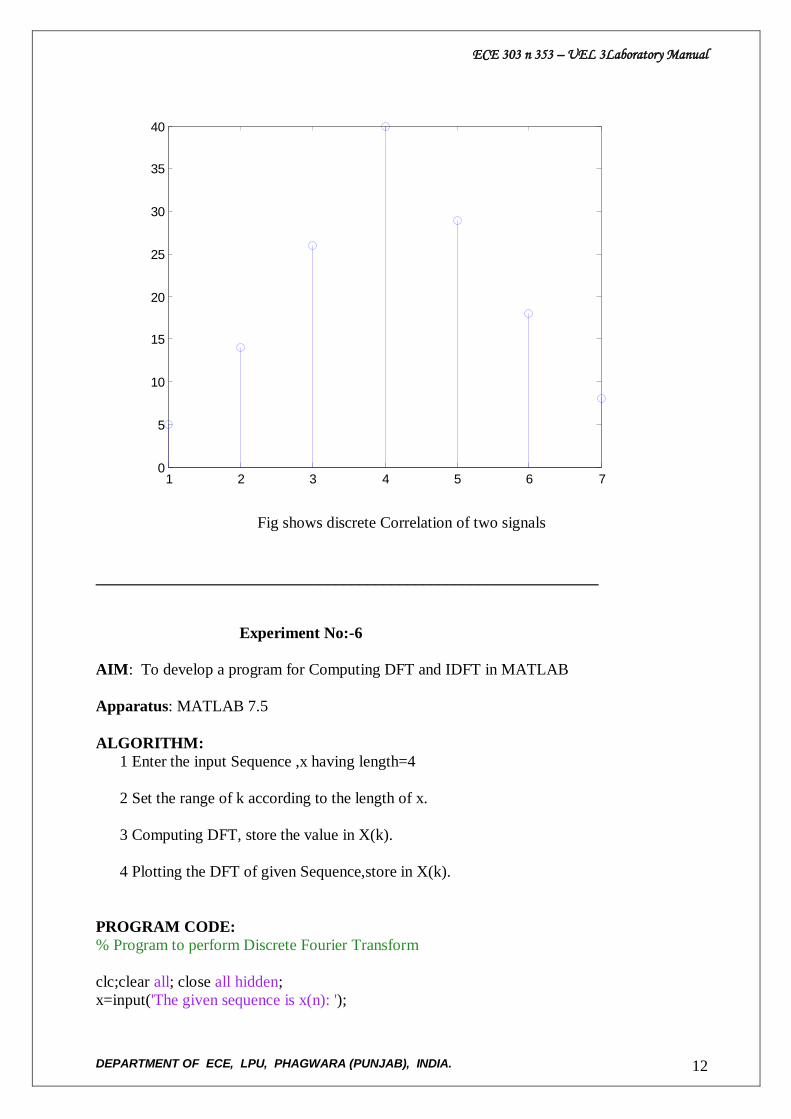
Fig shows discrete Correlation of two signals
_______________________________________________________________
Experiment No:-6
AIM: To develop a program for Computing DFT and IDFT in MATLAB
Apparatus: MATLAB 7.5
ALGORITHM:
1 Enter the input Sequence ,x having length=4
2 Set the range of k according to the length of x.
3 Computing DFT, store the value in X(k).
4 Plotting the DFT of given Sequence,store in X(k).
PROGRAM CODE:
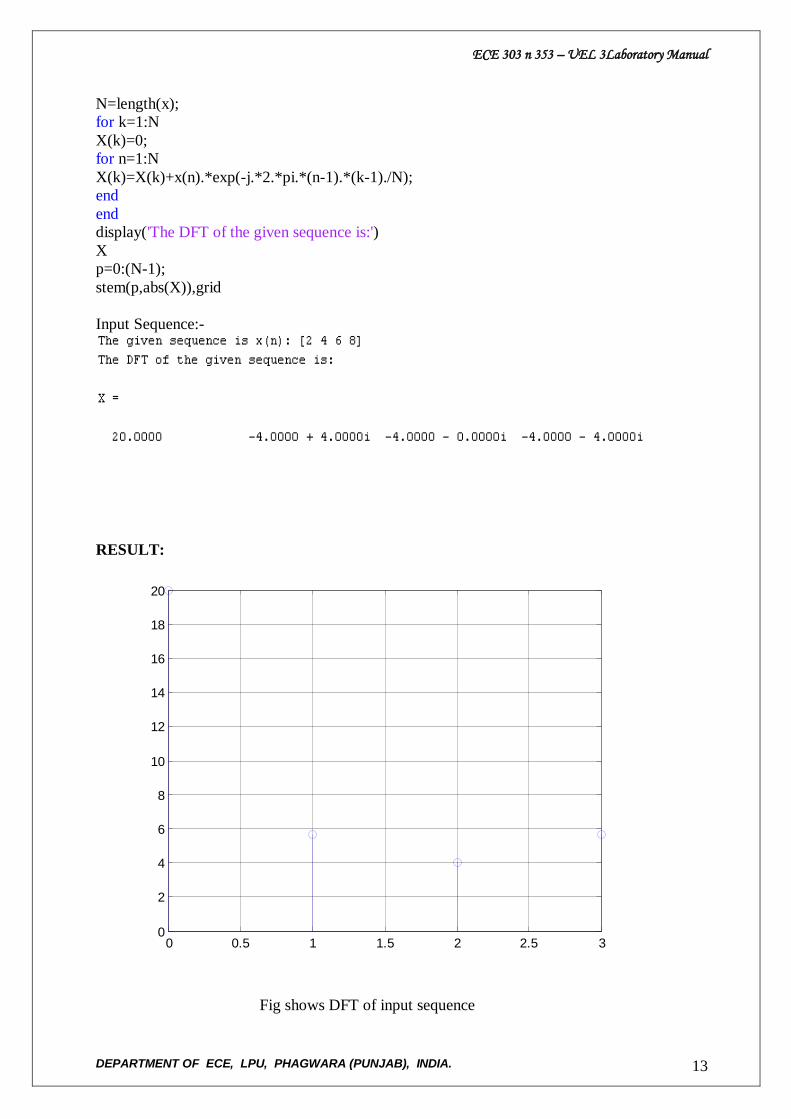
% Program to perform Discrete Fourier Transform
clc;clear all; close all hidden;
x=input('The given sequence is x(n): ');
ECE 303 n 353 – UEL 3Laboratory Manual
DEPARTMENT OF ECE, LPU, PHAGWARA (PUNJAB), INDIA. 13
N=length(x);
for k=1:N
X(k)=0;
for n=1:N
X(k)=X(k)+x(n).*exp(-j.*2.*pi.*(n-1).*(k-1)./N);
end
end
display('The DFT of the given sequence is:')
X
p=0:(N-1);
stem(p,abs(X)),grid
Input Sequence:-
RESULT:
0 0.5 1 1.5 2 2.5 30
2
4
6
8
10
12
14
16
18
20
Fig shows DFT of input sequence
ECE 303 n 353 – UEL 3Laboratory Manual
DEPARTMENT OF ECE, LPU, PHAGWARA (PUNJAB), INDIA. 14
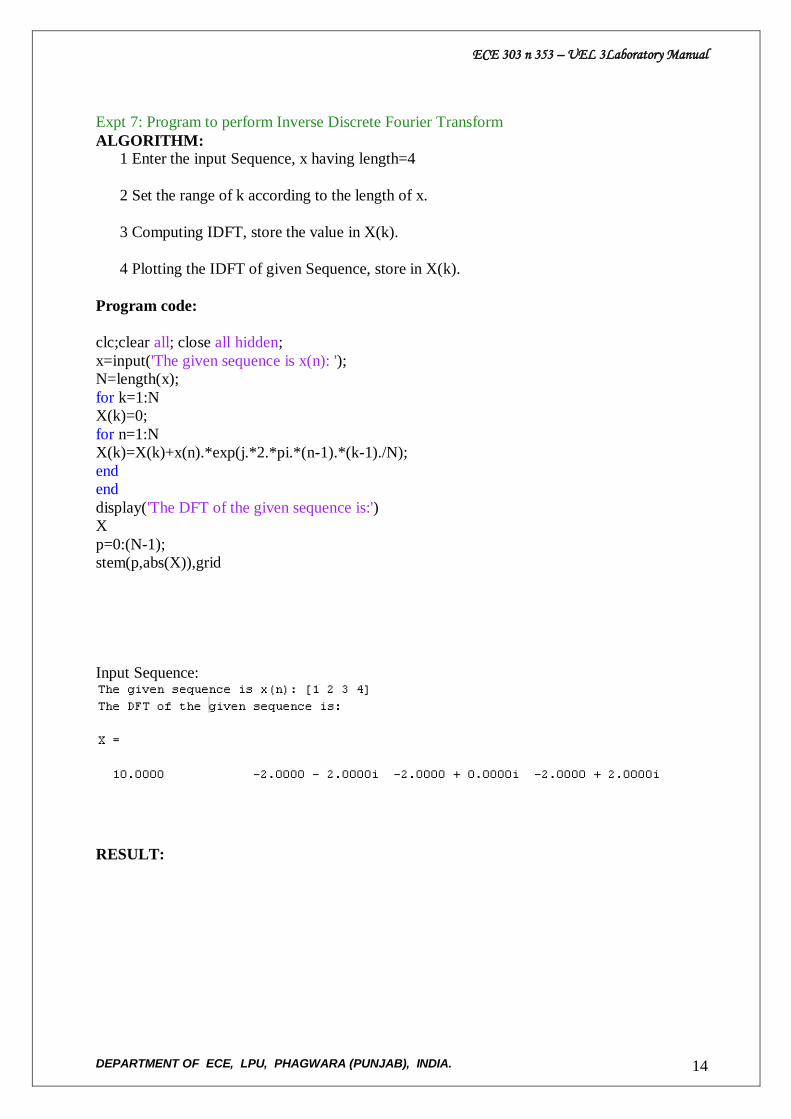
Expt 7: Program to perform Inverse Discrete Fourier Transform
ALGORITHM:
1 Enter the input Sequence, x having length=4
2 Set the range of k according to the length of x.
3 Computing IDFT, store the value in X(k).
4 Plotting the IDFT of given Sequence, store in X(k).
Program code:
clc;clear all; close all hidden;
x=input('The given sequence is x(n): ');
N=length(x);
for k=1:N
X(k)=0;
for n=1:N
X(k)=X(k)+x(n).*exp(j.*2.*pi.*(n-1).*(k-1)./N);
end
end
display('The DFT of the given sequence is:')
X
p=0:(N-1);
stem(p,abs(X)),grid
Input Sequence:
RESULT:
ECE 303 n 353 – UEL 3Laboratory Manual
DEPARTMENT OF ECE, LPU, PHAGWARA (PUNJAB), INDIA. 15
0 0.5 1 1.5 2 2.5 30
1
2
3
4
5
6
7
8
9
10
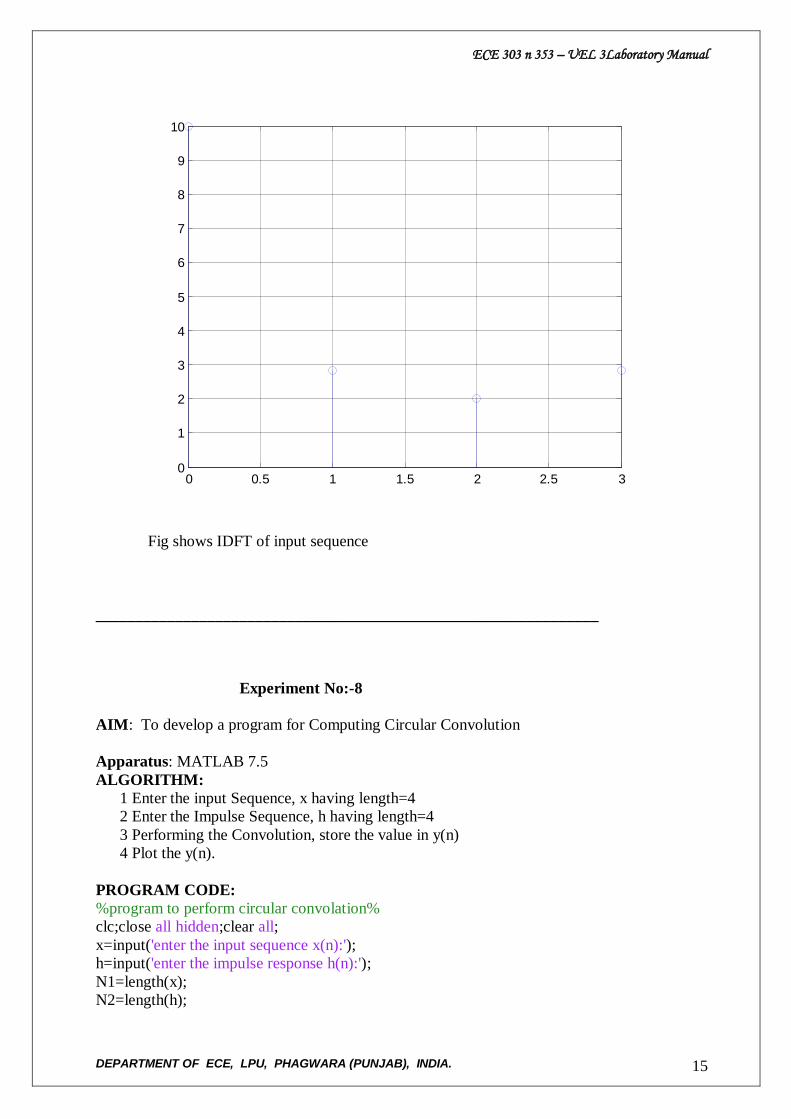
Fig shows IDFT of input sequence
_______________________________________________________________
Experiment No:-8
AIM: To develop a program for Computing Circular Convolution
Apparatus: MATLAB 7.5
ALGORITHM:
1 Enter the input Sequence, x having length=4
2 Enter the Impulse Sequence, h having length=4
3 Performing the Convolution, store the value in y(n)
4 Plot the y(n).
PROGRAM CODE:
%program to perform circular convolation%
clc;close all hidden;clear all;
x=input('enter the input sequence x(n):');
h=input('enter the impulse response h(n):');
N1=length(x);
N2=length(h);
ECE 303 n 353 – UEL 3Laboratory Manual
DEPARTMENT OF ECE, LPU, PHAGWARA (PUNJAB), INDIA. 16
N=max(N1,N2);
N3=N1-N2;
%loop for getting equal length seq
if(N3==0)
x=[x,zeros(1,N3)];
h=[h,zeros(1,N3)];
end
if(N1>N2)
h=[h,zeros(1,N3)];
end
if(N1<N2)
x=[x,zeros(1,-N3)];
end
%computation of circular convolved seq
for n=1:N,
y(n)=0;
for i=1:N,
j=n-i+1;
if(j==0)
j=N+j;
end
if(j<0)
j=N+j;
end
y(n)=y(n)+x(i).*h(j);
end
end
display('convoluted sum:');
y
p=0:(N-1);
stem(p,y),grid;
ECE 303 n 353 – UEL 3Laboratory Manual
DEPARTMENT OF ECE, LPU, PHAGWARA (PUNJAB), INDIA. 17
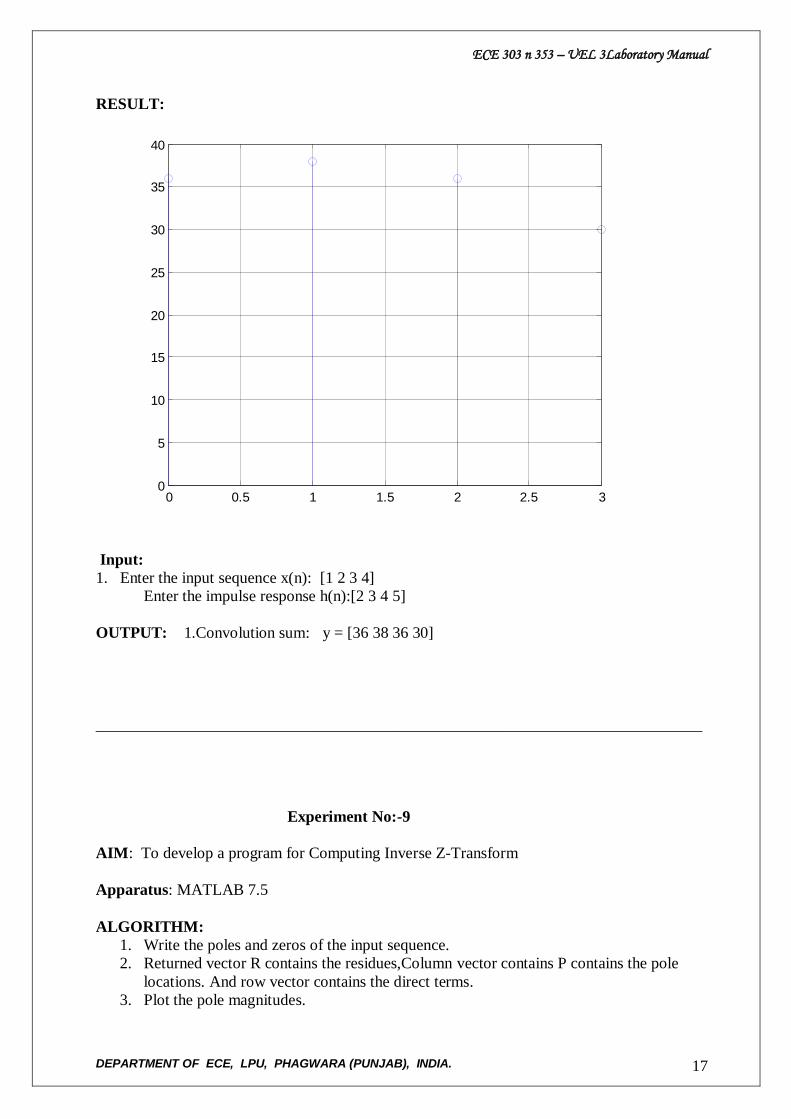
RESULT:
0 0.5 1 1.5 2 2.5 30
5
10
15
20
25
30
35
40
Input:
1. Enter the input sequence x(n): [1 2 3 4]
Enter the impulse response h(n):[2 3 4 5]
OUTPUT: 1.Convolution sum: y = [36 38 36 30]
____________________________________________________________________________
Experiment No:-9
AIM: To develop a program for Computing Inverse Z-Transform
Apparatus: MATLAB 7.5
ALGORITHM:
1. Write the poles and zeros of the input sequence.
2. Returned vector R contains the residues,Column vector contains P contains the pole
locations. And row vector contains the direct terms.
3. Plot the pole magnitudes.
ECE 303 n 353 – UEL 3Laboratory Manual
DEPARTMENT OF ECE, LPU, PHAGWARA (PUNJAB), INDIA. 18
4. Plot the pole angles in pi units.
5. Plot the frequency response of given z-transform of the given function.
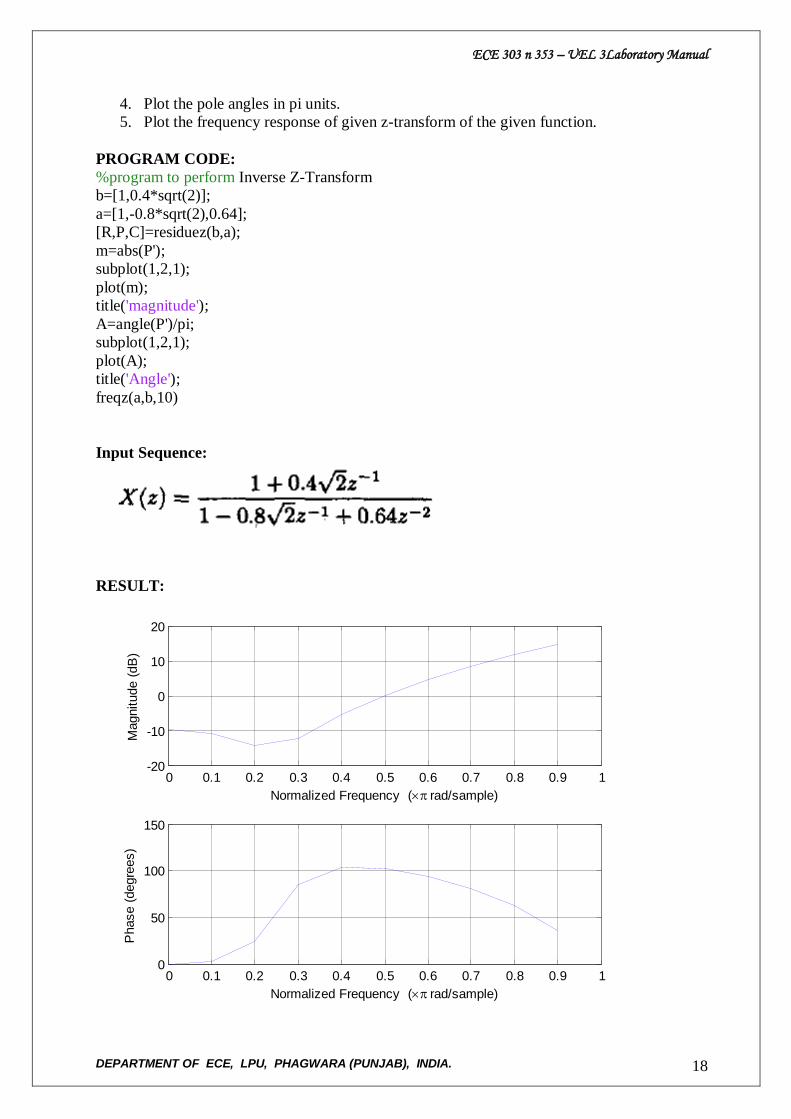
PROGRAM CODE:
%program to perform Inverse Z-Transform
b=[1,0.4*sqrt(2)];
a=[1,-0.8*sqrt(2),0.64];
[R,P,C]=residuez(b,a);
m=abs(P');
subplot(1,2,1);
plot(m);
title('magnitude');
A=angle(P')/pi;
subplot(1,2,1);
plot(A);
title('Angle');
freqz(a,b,10)
Input Sequence:
RESULT:
0 0.1 0.2 0.3 0.4 0.5 0.6 0.7 0.8 0.9 10
50
100
150
Normalized Frequency ( rad/sample)
Phase (
degre
es)
0 0.1 0.2 0.3 0.4 0.5 0.6 0.7 0.8 0.9 1-20
-10
0
10
20
Normalized Frequency ( rad/sample)
Magnitude (
dB
)
ECE 303 n 353 – UEL 3Laboratory Manual
DEPARTMENT OF ECE, LPU, PHAGWARA (PUNJAB), INDIA. 19
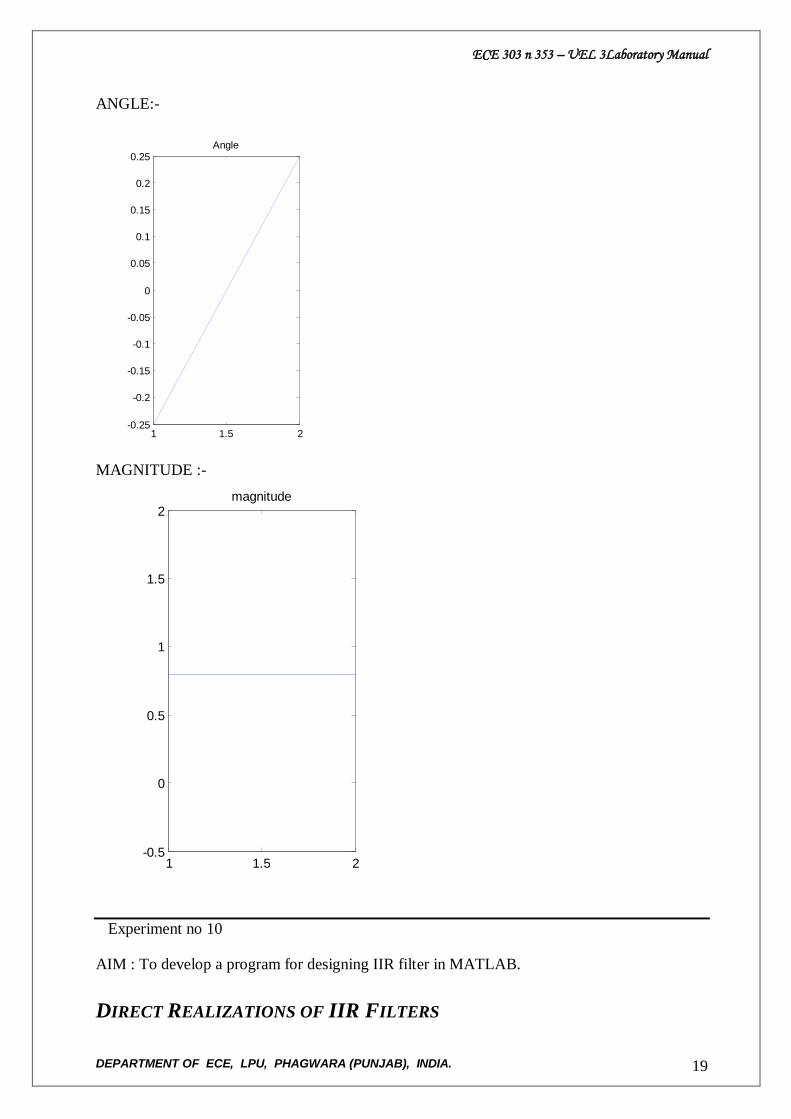
ANGLE:-
1 1.5 2-0.25
-0.2
-0.15
-0.1
-0.05
0
0.05
0.1
0.15
0.2
0.25Angle
MAGNITUDE :-
1 1.5 2-0.5
0
0.5
1
1.5
2magnitude
Experiment no 10
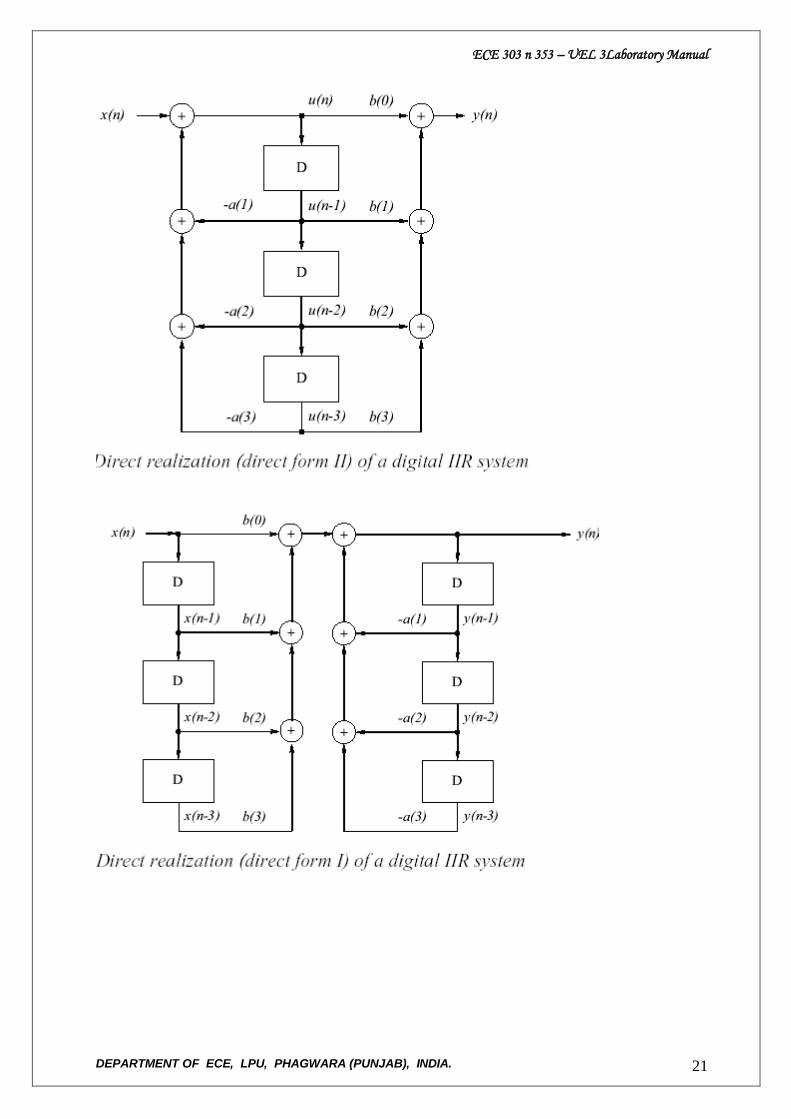
AIM : To develop a program for designing IIR filter in MATLAB.
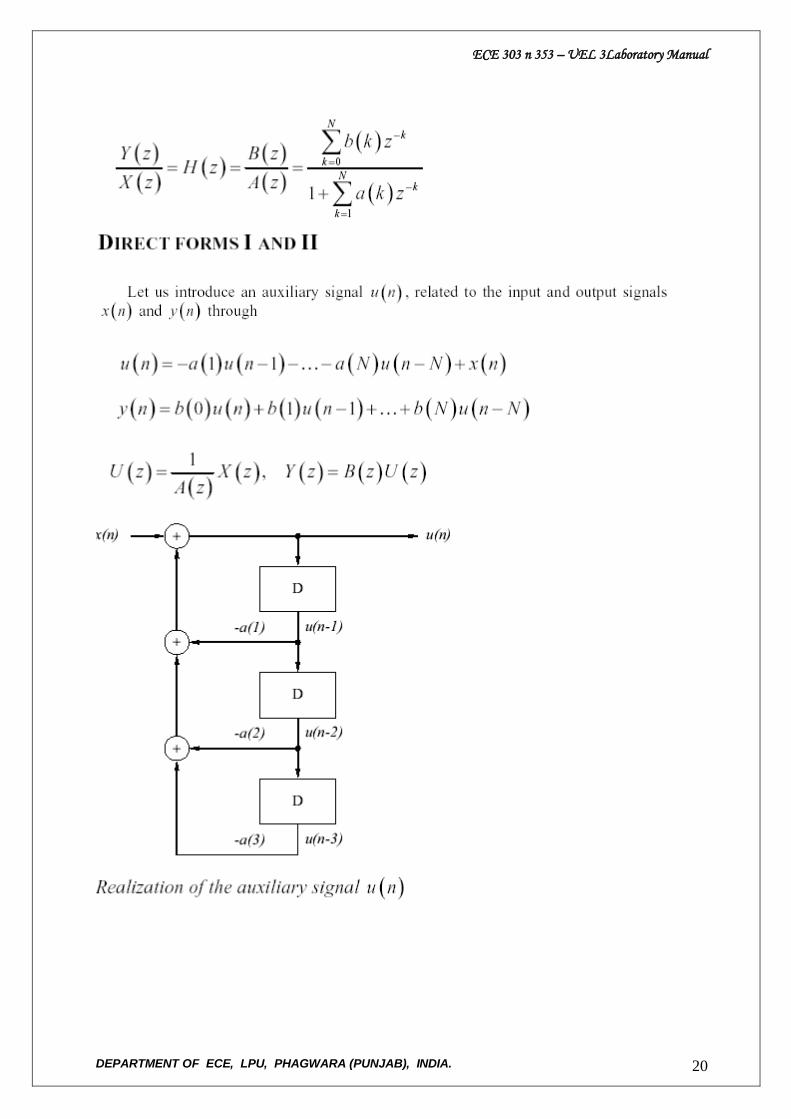
DIRECT REALIZATIONS OF IIR FILTERS
ECE 303 n 353 – UEL 3Laboratory Manual
DEPARTMENT OF ECE, LPU, PHAGWARA (PUNJAB), INDIA. 20
ECE 303 n 353 – UEL 3Laboratory Manual
DEPARTMENT OF ECE, LPU, PHAGWARA (PUNJAB), INDIA. 21
ECE 303 n 353 – UEL 3Laboratory Manual
DEPARTMENT OF ECE, LPU, PHAGWARA (PUNJAB), INDIA. 22
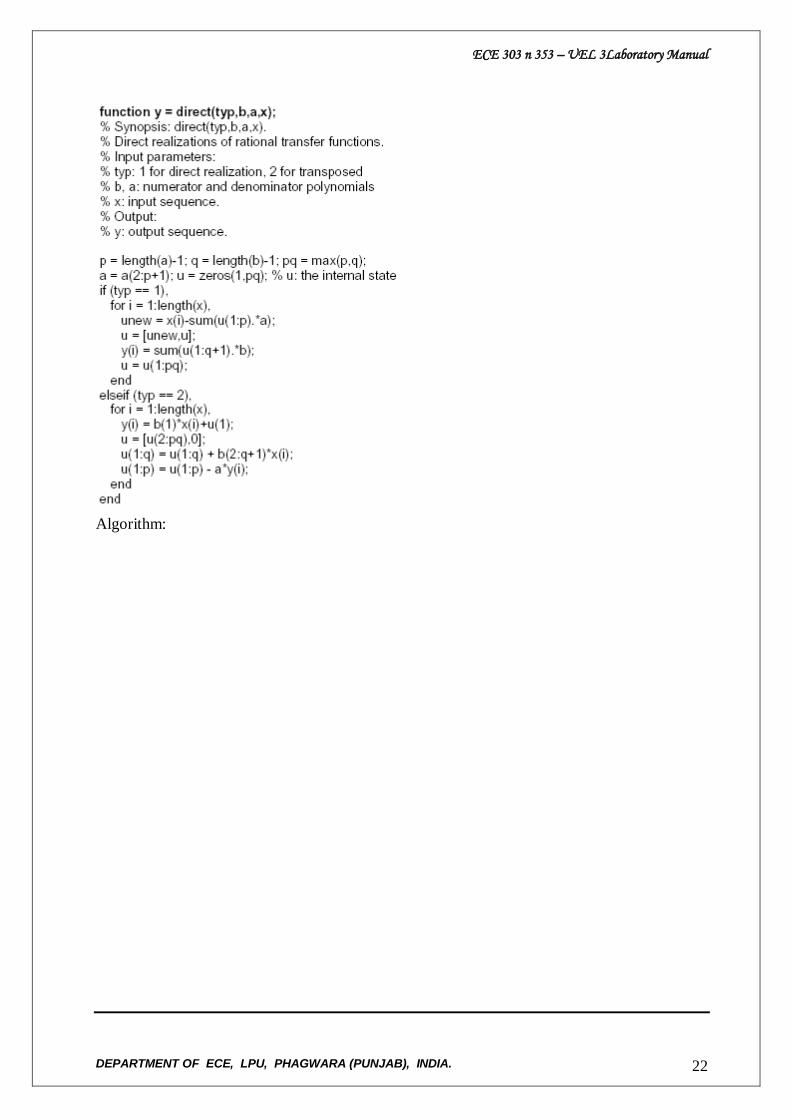
Algorithm:
ECE 303 n 353 – UEL 3Laboratory Manual
DEPARTMENT OF ECE, LPU, PHAGWARA (PUNJAB), INDIA. 23
Experiment no 11
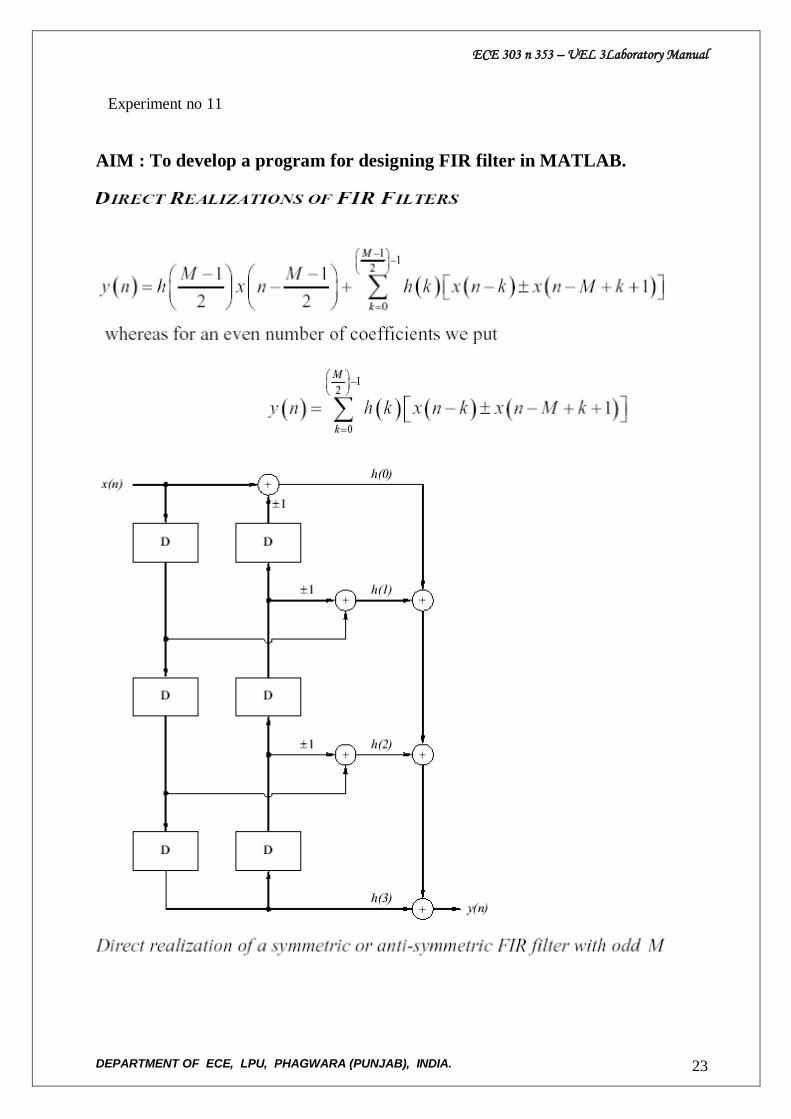
AIM : To develop a program for designing FIR filter in MATLAB.
ECE 303 n 353 – UEL 3Laboratory Manual
DEPARTMENT OF ECE, LPU, PHAGWARA (PUNJAB), INDIA. 24
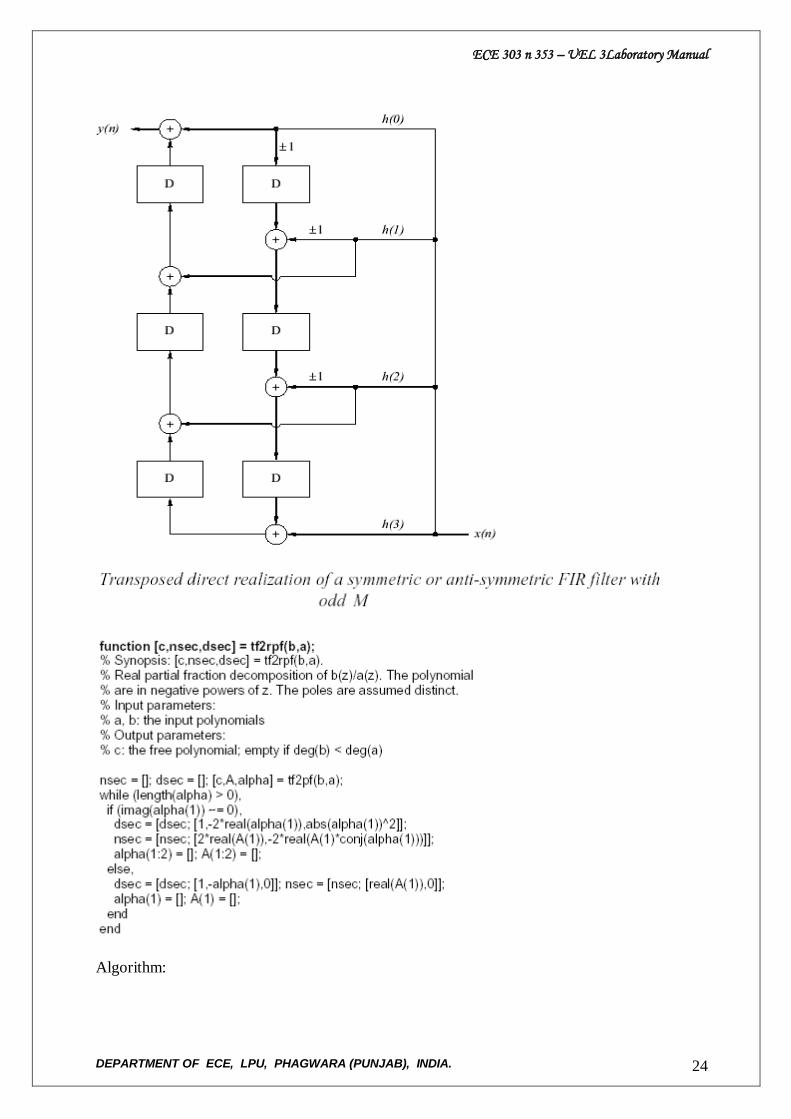
Algorithm:
ECE 303 n 353 – UEL 3Laboratory Manual
DEPARTMENT OF ECE, LPU, PHAGWARA (PUNJAB), INDIA. 25
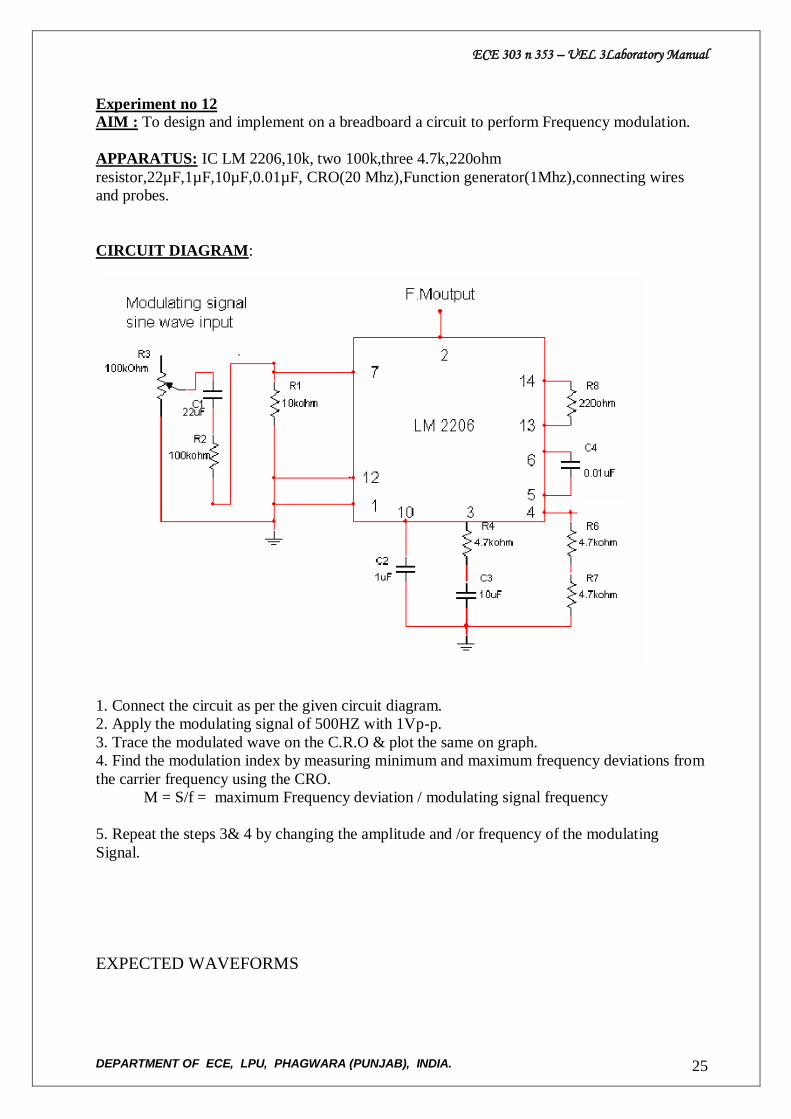
Experiment no 12
AIM : To design and implement on a breadboard a circuit to perform Frequency modulation.
APPARATUS: IC LM 2206,10k, two 100k,three 4.7k,220ohm
resistor,22µF,1µF,10µF,0.01µF, CRO(20 Mhz),Function generator(1Mhz),connecting wires
and probes.
CIRCUIT DIAGRAM:
1. Connect the circuit as per the given circuit diagram.
2. Apply the modulating signal of 500HZ with 1Vp-p.
3. Trace the modulated wave on the C.R.O & plot the same on graph.
4. Find the modulation index by measuring minimum and maximum frequency deviations from
the carrier frequency using the CRO.
M = S/f = maximum Frequency deviation / modulating signal frequency
5. Repeat the steps 3& 4 by changing the amplitude and /or frequency of the modulating
Signal.
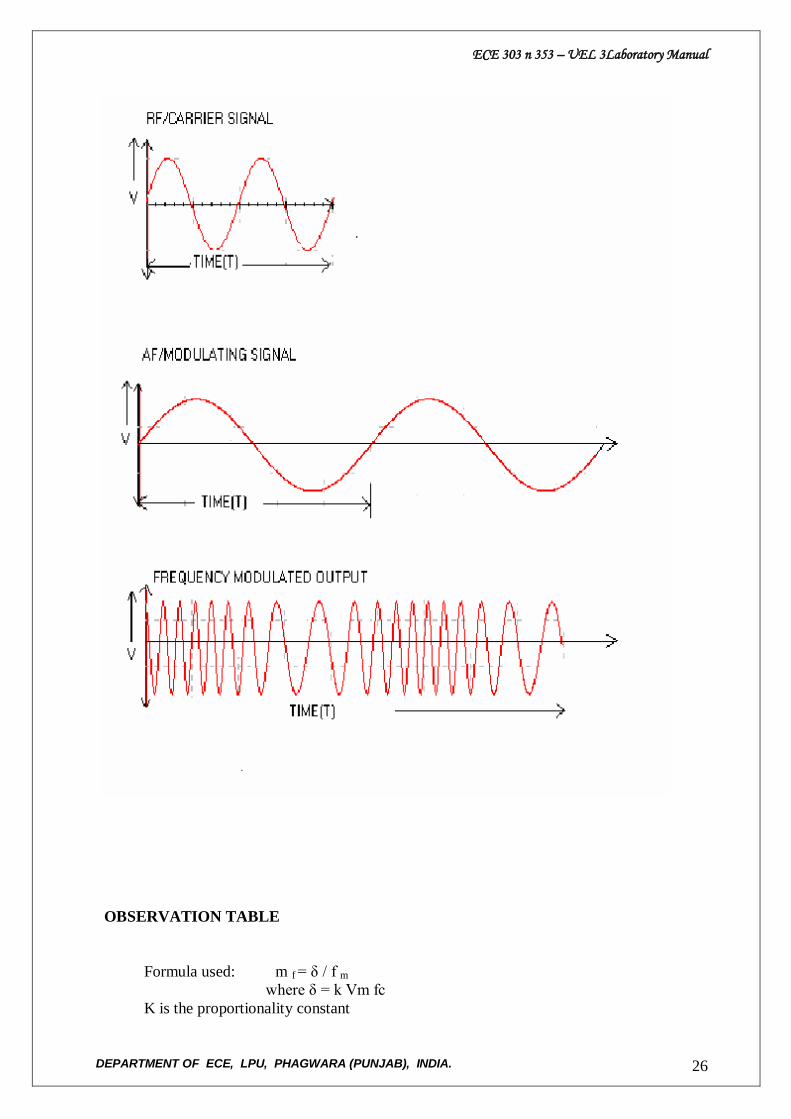
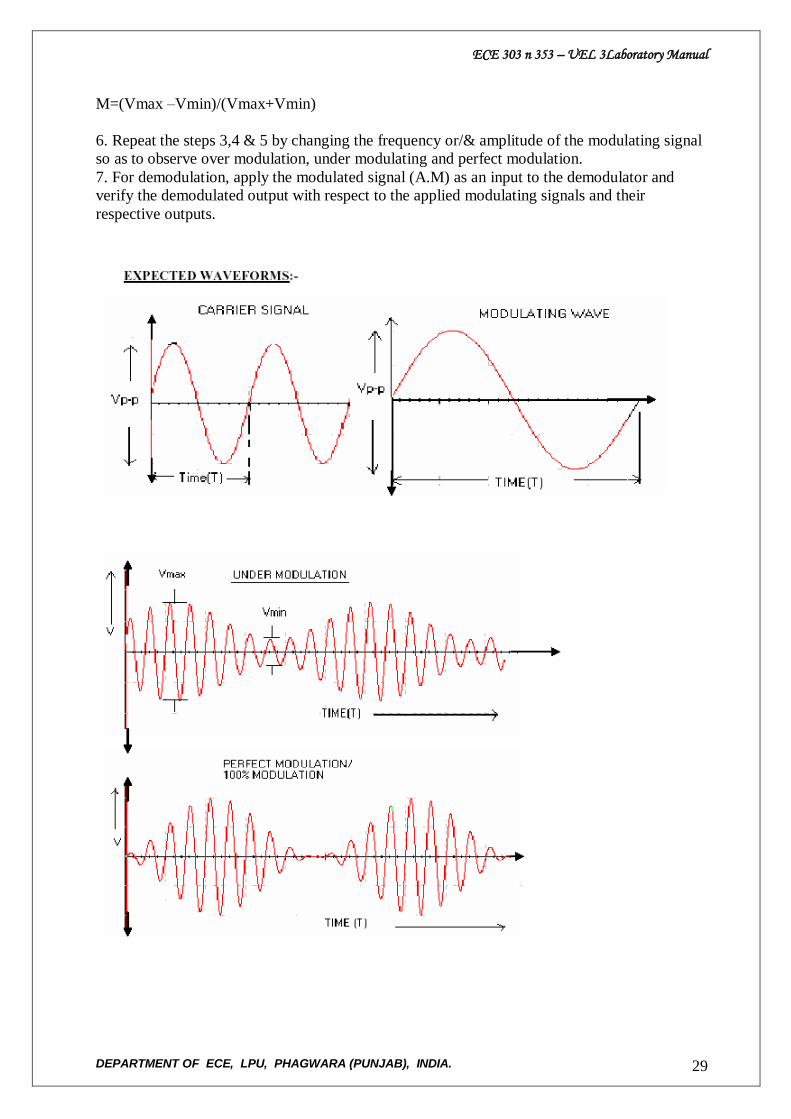
EXPECTED WAVEFORMS
ECE 303 n 353 – UEL 3Laboratory Manual
DEPARTMENT OF ECE, LPU, PHAGWARA (PUNJAB), INDIA. 26
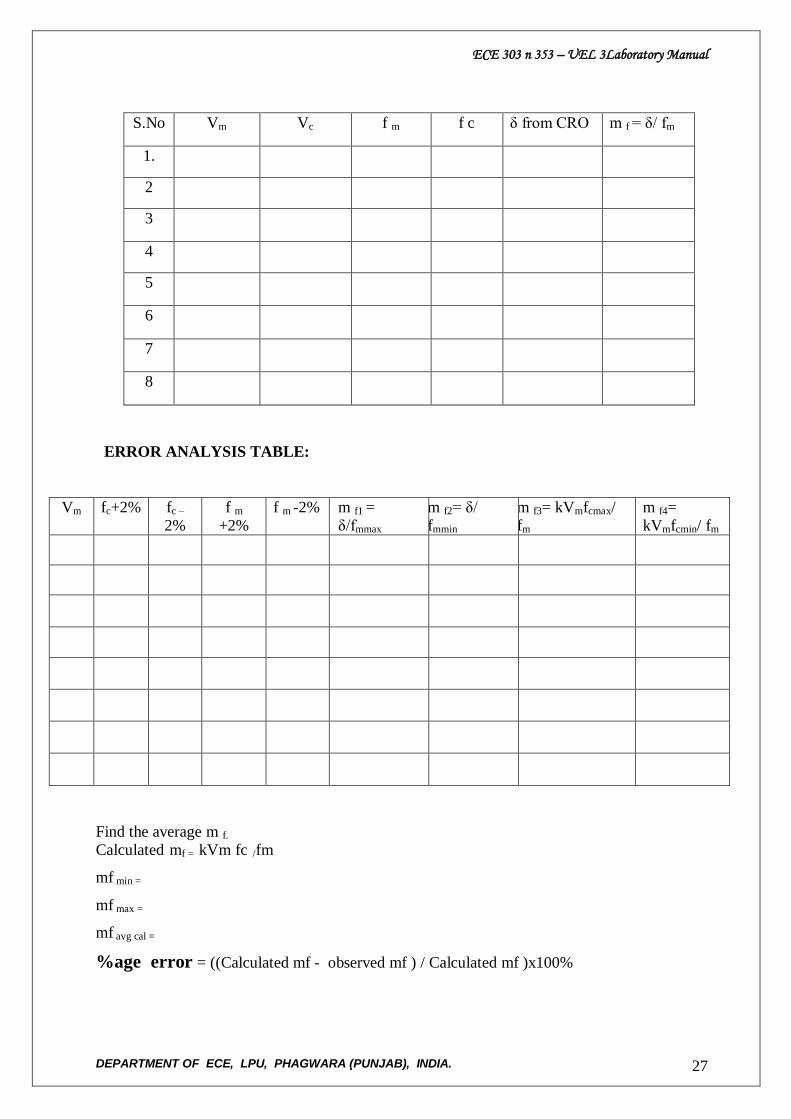
OBSERVATION TABLE
Formula used: m f = δ / f m
where δ = k Vm fc
K is the proportionality constant
ECE 303 n 353 – UEL 3Laboratory Manual
DEPARTMENT OF ECE, LPU, PHAGWARA (PUNJAB), INDIA. 27
S.No Vm Vc f m f c δ from CRO m f = δ/ fm
1.
2
3
4
5
6
7
8
ERROR ANALYSIS TABLE:
Vm fc+2% fc –
2%
f m
+2%
f m -2% m f1 =
δ/fmmax
m f2= δ/
fmmin
m f3= kVmfcmax/
fm
m f4=
kVmfcmin/ fm
Find the average m f.
Calculated mf = kVm fc /fm
mf min =
mf max =
mf avg cal =
%age error = ((Calculated mf - observed mf ) / Calculated mf )x100%
ECE 303 n 353 – UEL 3Laboratory Manual
DEPARTMENT OF ECE, LPU, PHAGWARA (PUNJAB), INDIA. 28
RESULT:
____________________________________________________________________________
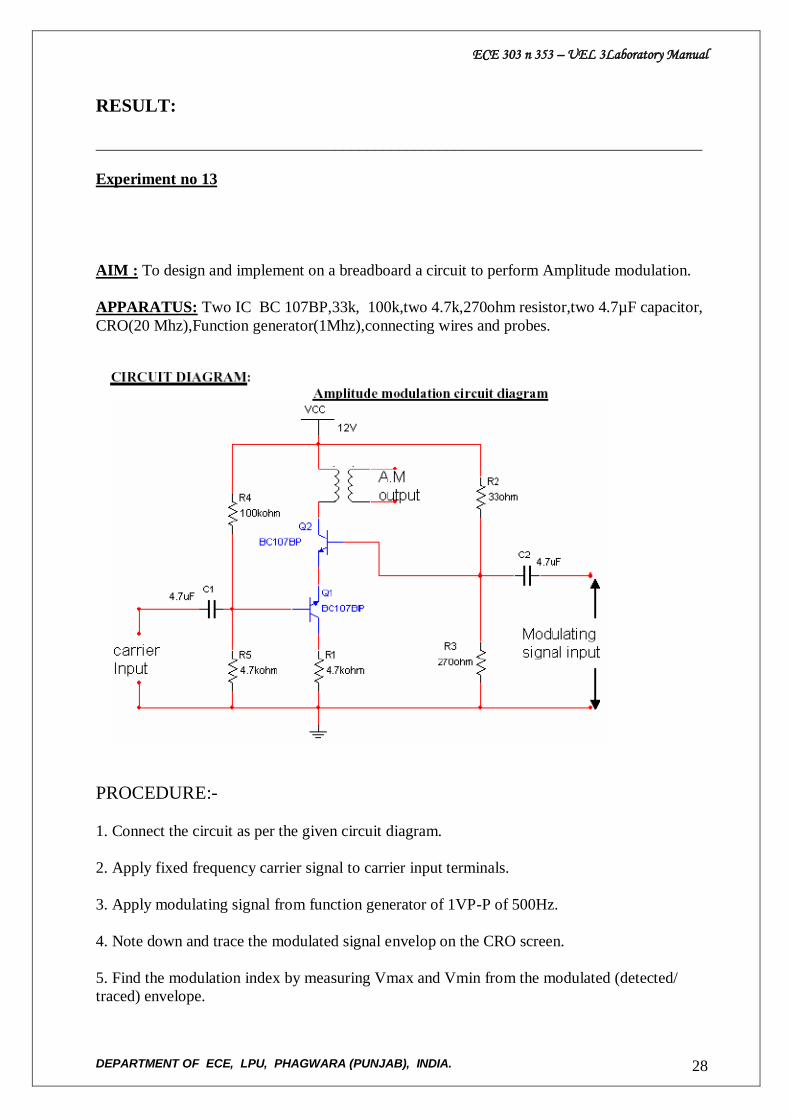
Experiment no 13
AIM : To design and implement on a breadboard a circuit to perform Amplitude modulation.
APPARATUS: Two IC BC 107BP,33k, 100k,two 4.7k,270ohm resistor,two 4.7µF capacitor,
CRO(20 Mhz),Function generator(1Mhz),connecting wires and probes.
PROCEDURE:-
1. Connect the circuit as per the given circuit diagram.
2. Apply fixed frequency carrier signal to carrier input terminals.
3. Apply modulating signal from function generator of 1VP-P of 500Hz.
4. Note down and trace the modulated signal envelop on the CRO screen.
5. Find the modulation index by measuring Vmax and Vmin from the modulated (detected/
traced) envelope.
ECE 303 n 353 – UEL 3Laboratory Manual
DEPARTMENT OF ECE, LPU, PHAGWARA (PUNJAB), INDIA. 29
M=(Vmax –Vmin)/(Vmax+Vmin)
6. Repeat the steps 3,4 & 5 by changing the frequency or/& amplitude of the modulating signal
so as to observe over modulation, under modulating and perfect modulation.
7. For demodulation, apply the modulated signal (A.M) as an input to the demodulator and
verify the demodulated output with respect to the applied modulating signals and their
respective outputs.
ECE 303 n 353 – UEL 3Laboratory Manual
DEPARTMENT OF ECE, LPU, PHAGWARA (PUNJAB), INDIA. 30
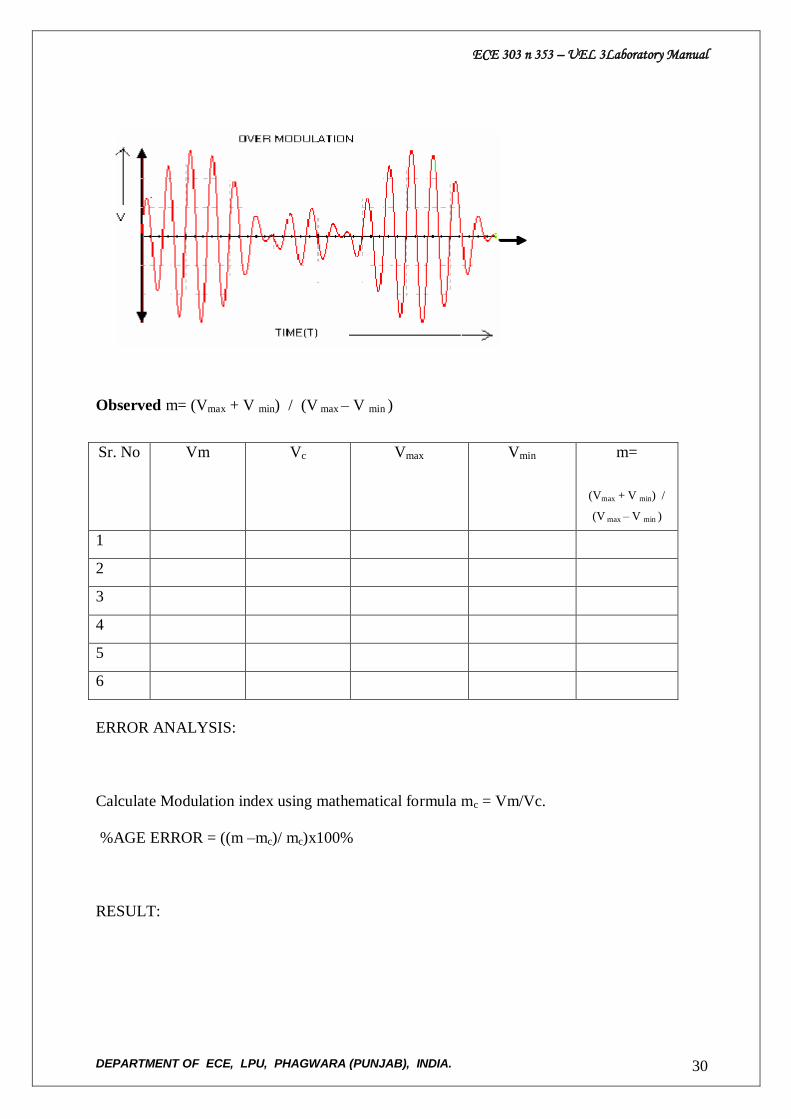
Observed m= (Vmax + V min) / (V max – V min )
Sr. No Vm Vc Vmax Vmin m=
(Vmax + V min) /
(V max – V min )
1
2
3
4
5
6
ERROR ANALYSIS:
Calculate Modulation index using mathematical formula mc = Vm/Vc.
%AGE ERROR = ((m –mc)/ mc)x100%
RESULT: