ecdc/efsa/ema first joint report on the integrated
TRANSCRIPT

30 January 2015 636088/2013
ECDC/EFSA/EMA first joint report on the integrated analysis of the consumption of antimicrobial agents and occurrence of antimicrobial resistance in bacteria from humans and food-producing animals1 Joint Interagency Antimicrobial Consumption and Resistance Analysis (JIACRA) Report
Abstract
The ECDC, the EFSA and the EMA have for the first time jointly explored associations between consumption of antimicrobials in humans and food-producing animals, and antimicrobial resistance in bacteria from humans and food-producing animals, using 2011 and 2012 data currently available from their relevant five EU monitoring networks. Combined data on antimicrobial consumption and corresponding resistance in animals and humans for EU MSs and reporting countries were analysed using logistic regression models for selected combinations of bacteria and antimicrobials. A summary indicator of the proportion of resistant bacteria in the main food-producing animal species was calculated for the analysis, as consumption data in food-producing animals were not available at the species level. Comparison of antimicrobial consumption data in animals and humans in 2012, both expressed in milligrams per kilogram of estimated biomass, revealed that overall antimicrobial consumption was higher in animals than in humans, although contrasting situations were observed between countries. The consumption of several antimicrobials extensively used in animal husbandry was higher in animals than in humans, while consumption of antimicrobials critically important for human medicine (such as fluoroquinolones and 3rd- and 4th-generation cephalosporins) was higher in humans. In both humans and animals, positive associations between consumption of antimicrobials and the corresponding resistance in bacteria were observed for most of the combinations investigated. In some cases, a positive association was also found between antimicrobial consumption in animals and resistance in bacteria from humans. While highlighting findings of concern, these results should be interpreted with caution owing to current data limitations and the complexity of the AMR phenomenon, which is influenced by several factors besides antimicrobial consumption. Recommendations to address current data limitations for analyses of this type were identified. In any case, responsible use of antimicrobials in both humans and animals should be promoted.
1 For citation purposes: ECDC (European Centre for Disease Prevention and Control), EFSA (European Food Safety Authority) and EMA (European Medicines Agency). ECDC/EFSA/EMA first joint report on the integrated analysis of the consumption of antimicrobial agents and occurrence of antimicrobial resistance in bacteria from humans and food-producing animals. Stockholm/Parma/London: ECDC/EFSA/EMA, 2015. EFSA Journal 2015;13(1):4006, 114 pp. doi:10.2903/j.efsa.2015.4006

Table of contents 1. Summary and recommendations ............................................................. 91.1. Summary ............................................................................................................ 9 1.2. Recommendations .............................................................................................. 10
2. Terms of reference and scope ................................................................ 11
3. Acknowledgements ............................................................................... 12
4. Description of the existing monitoring or surveillance systems ............. 134.1. Surveillance of antimicrobial consumption in humans .............................................. 14 4.1.1. Description of collected data ............................................................................. 14 4.1.2. Strength of the system ..................................................................................... 14 4.1.3. Impediments to comparing the data .................................................................. 15 4.1.4. On-going actions to improve the system ............................................................. 15 4.2. Surveillance of antimicrobial consumption in food-producing animals ........................ 16 4.2.1. Description of collected data ............................................................................. 16 4.2.2. Strength of the system ..................................................................................... 16 4.2.3. Impediments to comparing data ........................................................................ 16 4.2.4. On-going actions to improve the system ............................................................. 17 4.3. Surveillance of antimicrobial resistance in humans ................................................. 17 4.3.1. Surveillance of antimicrobial resistance in humans through FWD-Net ..................... 17 4.3.2. Surveillance of antimicrobial resistance in humans through EARS-Net .................... 19 4.4. Monitoring antimicrobial resistance in food-producing animals and food .................... 20 4.4.1. Description of collected data ............................................................................. 20 4.4.2. Strength of the system and impediments to comparing data ................................. 21 4.4.3. On-going actions to improve the system ............................................................. 21
5. Methodological considerations and included data .................................. 225.1. Consumption of antimicrobials by humans and food-producing animals ..................... 23 5.1.1. Numerator ...................................................................................................... 23 5.1.2. Denominator ................................................................................................... 23 5.2. Rationale for the analysis of consumption and resistance in bacteria from food-producing animals and humans .................................................................................. 24 5.3. Rationale for selecting particular combinations of organism and antimicrobial for detailed analysis ....................................................................................................... 24 5.4. Method for analysis of the relationship between antimicrobial consumption and resistance ................................................................................................................ 25 5.4.1. Consumption and resistance data from food-producing animals ............................. 25 5.4.2. Consumption and resistance data from humans ................................................... 26 5.4.3. Statistical methodology .................................................................................... 27
6. Consumption of antimicrobials in humans and food-producing animals 286.1. Total tonnes of active substance and estimated biomass ......................................... 28 6.2. Reporting consumption in humans by numbers of DDD per 1 000 inhabitants and per day and by milligrams per kilogram estimated biomass ................................................. 30 6.3. Population biomass-corrected consumption of antimicrobials in humans and food-producing animals ..................................................................................................... 30
ECDC/EFSA/EMA first joint report on the integrated analysis of the consumption of antimicrobial agents and occurrence of antimicrobial resistance in bacteria from humans and food-producing animals 636088/2013 Page 2/114

6.4. Comparison of overall consumption, expressed as milligrams per kilogram estimated biomass, by antimicrobial class ................................................................................... 33 6.5. Comparison of consumption, expressed as milligrams per kilogram estimated biomass, of 3rd- and 4th-generation cephalosporins by country ..................................................... 33 6.6. Comparison of consumption, expressed as milligrams per kilogram estimated biomass, of fluoroquinolones by country .................................................................................... 34 6.7. Discussion on comparison of consumption ............................................................. 35 6.7.1. Limitations ...................................................................................................... 35 6.7.2. Discussion on results ....................................................................................... 36
7. Antimicrobial consumption in food-producing animals and resistance inbacteria from food-producing animals ....................................................... 37 7.1. Comparison between consumption of antimicrobials for food-producing animals and resistance in food-producing animals ........................................................................... 37 7.2. Discussion of the comparison between consumption of antimicrobials in food-producing animals and resistance in bacteria from food-producing animals ..................................... 44 7.2.1. Limitations of data ........................................................................................... 44 7.2.2. Interpretation of results ................................................................................... 45
8. Antimicrobial consumption in humans and resistance in bacteria fromhumans ..................................................................................................... 50 8.1. Consumption of 3rd- and 4th-generation cephalosporins for humans and occurrence of resistance in E. coli and Salmonella spp. from humans .................................................. 50 8.2. Consumption of fluoroquinolones in humans and occurrence of fluoroquinolone resistance in E. coli, Salmonella spp. and Campylobacter spp. from humans .................... 51 8.3. Consumption of macrolides in humans and occurrence of erythromycin resistance in Campylobacter coli and Campylobacter jejuni from humans ........................................... 53 8.4. Tetracycline consumption in humans and occurrence of tetracycline resistance in Salmonella spp. and Campylobacter spp. from humans ................................................. 54
9. Antimicrobial consumption in food-producing animals and resistance inbacteria from humans ............................................................................... 58 9.1. Comparison between consumption of 3rd- and 4th-generation cephalosporins in food-producing animals and resistance in bacteria from humans ..................................... 58 9.2. Comparison between consumption of fluoroquinolones in food-producing animals and resistance in bacteria from humans ............................................................................. 60 9.3. Comparison between consumption of macrolides in food-producing animals and resistance in bacteria from humans ............................................................................. 61 9.4. Comparison between consumption of tetracyclines in food-producing animals and resistance in bacteria from humans ............................................................................. 61
10. Comparison between the occurrence of resistance in bacteriaoriginating from humans and from food-producing animals ...................... 63 10.1. Comparison between occurrence of cephalosporin resistance in bacteria originating from food-producing animals and the occurrence of resistance in humans ........................ 64 10.2. Comparison between occurrence of fluoroquinolone resistance in bacteria originating from food-producing animals and the occurrence of fluoroquinolone resistance in humans . 64 10.3. Data available from humans and food-producing animals for tetracycline and macrolide resistance ................................................................................................................ 65
11. Discussion ........................................................................................... 6511.1. Systems for surveillance antimicrobial consumption .............................................. 65
ECDC/EFSA/EMA first joint report on the integrated analysis of the consumption of antimicrobial agents and occurrence of antimicrobial resistance in bacteria from humans and food-producing animals 636088/2013 Page 3/114

11.2. Systems for monitoring of antimicrobial resistance ............................................... 66 11.3. Comparison of consumption of antimicrobials in humans and food-producing animals 67 11.4. Consumption of antimicrobials in humans and resistance in bacteria from humans ... 67 11.5. Consumption of antimicrobials in food-producing animals and resistance in bacteria from food-producing animals ...................................................................................... 68 11.6. Consumption of antimicrobials in food-producing animals and resistance in bacteria from humans ............................................................................................................ 68 11.7. Limitations of the study ..................................................................................... 69
12. Conclusions ......................................................................................... 71
1. Annex A ................................................................................................. 731.1. Legislation of medicinal products .......................................................................... 73 1.1.1. Regulation of human medicinal products ............................................................. 73 1.1.2. Regulation of veterinary medicinal products ........................................................ 74 1.2. How antimicrobials are used in humans and food-producing animals ......................... 75 1.2.1. General considerations ..................................................................................... 75 1.2.2. How antimicrobials are used in humans .............................................................. 75 1.2.3. How antimicrobials are used in food-producing animals ........................................ 79 1.2.4. Data on antimicrobial consumption in food-producing animals ............................... 81
2. Annex B ................................................................................................. 862.1. Comparison of how antimicrobials are used in food-producing animals and humans .... 86 2.2. Calculation of standard human body weight ........................................................... 87 2.2.1. Introduction .................................................................................................... 87 2.2.2. Existing data ................................................................................................... 87 2.2.3. Methodology ................................................................................................... 88
3. Annex C ................................................................................................. 893.1. On the complexity of the relation between antimicrobial consumption and resistance .. 89 3.1.1. Factors influencing the emergence and spread of resistance ................................. 89 3.1.2. Antimicrobial use and selection pressure ............................................................ 91 3.1.3. Pathways of dissemination of resistance ............................................................. 91 3.2. Measuring and monitoring of antimicrobial resistance in humans and food-producing animals ................................................................................................................... 93 3.3. Clonal spread of organisms exhibiting resistance to antimicrobials in the human population and in food-producing animals .................................................................... 96
4. Annex D ................................................................................................. 994.1. Comparison between antimicrobial consumption and resistance from animals in 2011 99 4.2. Comparison between antimicrobial consumption in humans and resistance in bacteria from humans .......................................................................................................... 104 4.3. Comparison between antimicrobial consumption in food-producing animals and resistance in bacteria from humans, 2011 .................................................................. 106
5. Annex E ............................................................................................... 1095.1. Abbreviations ................................................................................................... 109 5.2. References ...................................................................................................... 110
ECDC/EFSA/EMA first joint report on the integrated analysis of the consumption of antimicrobial agents and occurrence of antimicrobial resistance in bacteria from humans and food-producing animals 636088/2013 Page 4/114

List of figures
Figure 1. Available fields of data related to antimicrobial consumption and resistance in humans and food-producing animals in the reporting countries and the possible relationships investigated in this report .............................................................................................................................. 23
Figure 2. Scatter plot of consumption in humans reported as total DDD per 1 000 inhabitants and per day and total milligrams of active substance per kilogram estimated biomass for the 26 countries included (data for 2012) ..................................................................................................... 30
Figure 3. Comparison of biomass-corrected consumption of antimicrobials (milligrams per kilogram estimated biomass) in humans and food-producing animals by country in 26 EU/EEA countries in 2012,, .............................................................................................................................. 31
Figure 4. a–c. Comparison of consumption of selected antimicrobial classes for humans and food-producing animals in 26 EU/EEA countries in 2012 ......................................................... 32
Figure 5. Biomass-corrected consumption of 3rd- and 4th-generation cephalosporins for humans and food-producing animals by country in 26 EU/EEA countries in 2012,, ........................................ 34
Figure 6. Population-corrected consumption of fluoroquinolones for humans and food-producing animals by country in 26 EU/EEA countries in 2012,, .............................................................. 35
Figure 7. Logistic regression analysis curves with OR estimates and 95 % profile-likelihood confidence intervals (PL CIs) of the national consumption of tetracyclines in food-producing animals and the probability of “microbiological” resistance to tetracyclines in (a) indicator E. coli isolates (MIC > 8 mg/L) from cattle, domestic fowl and pigs, (b) Salmonella spp. isolates (MIC > 8 mg/L) from cattle, domestic fowl and pigs and (c) C. jejuni isolates (MIC > 2 mg/L) from cattle and domestic fowl for the year 20121—dots represent the countries included in the analysis. ............ 38
Figure 8. Logistic regression analysis curves with OR estimates and 95 % PL CIs of the national consumption of 3rd-generation cephalosporins in food-producing animals and the probability of “microbiological” resistance to cefotaxime in (a) indicator E. coli isolates (MIC > 0.25 mg/L) from cattle, domestic fowl and pigs and (b) Salmonella spp. isolates (MIC > 0.5 mg/L) from cattle, domestic fowl and pigs for the year 20121—dots represent the countries involved in the analysis 39
Figure 9. Logistic regression analysis curves with OR estimates and 95 % PL CIs of the national consumption of macrolides in food-producing animals and the probability of “microbiological” resistance to erythromycin in (a) C. coli isolates (MIC > 16 mg/L) from domestic fowl and pigs and (b) C. jejuni isolates (MIC > 4 mg/L) from cattle and domestic fowl for the year 20121—dots represent the countries involved in the analysis .................................................................... 40
Figure 10. Logistic regression analysis curves with OR estimates and 95 % PL CIs of the national consumption of (A) fluoroquinolones and (B) fluoroquinolones and other quinolones in food-producing animals and the probability of “microbiological” resistance to ciprofloxacin in (1) indicator E. coli isolates (MIC > 0.03 mg/L) from cattle, domestic fowl and pigs, (2) Salmonella spp. isolates (MIC > 0.06 mg/L) from cattle, domestic fowl and pigs and (3) C. jejuni isolates (MIC > 1 mg/L) from cattle and domestic fowl for the year 20121—dots represent the countries involved in the analysis ...................................................................................................... 41
Figure 11. Logistic regression curves with 95 % CIs of the domestic consumption and “corrected” consumption of tetracyclines and 3rd- and 4th-generation cephalosporins and the corresponding probability of “microbiological” resistance to tetracycline and cefotaxime in indicator E. coli from cattle, domestic fowl and pigs—dots represent the countries included in the analysis ................. 49
Figure 12. Logistic regression analysis curves with OR estimates and 95 % PL CIs of the national total (community and in hospitals) consumption of 3rd- and 4th-generation cephalosporins in humans and the probability of clinical resistance to 3rd-generation cephalosporins in E. coli isolates from human BSIs for the year 2012—dots represent the countries involved in the analysis. ............... 50
Figure 13. Logistic regression analysis curves with OR estimates and 95 % PL CIs of the national total (community and in hospitals) consumption of fluoroquinolones for humans and the probability of clinical resistance to fluoroquinolones in E. coli isolates from human BSIs for the year 2012—dots represent the countries involved in the analysis .................................................................... 52
Figure 14. Logistic regression analysis curves with OR estimates and 95 % PL CIs of the national consumption of tetracyclines in the community in humans and the probability of clinical resistance to tetracycline in S. Typhimurium from human infections for the year 2012—dots represent the countries involved in the analysis ........................................................................................ 55
ECDC/EFSA/EMA first joint report on the integrated analysis of the consumption of antimicrobial agents and occurrence of antimicrobial resistance in bacteria from humans and food-producing animals 636088/2013 Page 5/114

Figure 15. Logistic regression analysis curves with OR estimates and 95 % PL CIs of the national total (community and in hospitals) consumption of carbapenems for humans and the probability of clinical resistance to carbapenems in K. pneumoniae from human infections for the year 2012—dots represent the countries involved in the analysis ............................................................. 57
Figure 16. Logistic regression analysis curves with OR estimates and 95 % PL CIs of the national consumption of 3rd- and 4th-generation cephalosporins in food-producing animals and the probability of clinical resistance to 3rd- and 4th-generation cephalosporin in E. coli isolates from human BSIs for the year 2012—dots represent the countries involved in the analysis ................ 59
Figure 17. Logistic regression analysis curves with OR estimates and 95 % PL CIs of the national consumption of fluoroquinolones (a) or fluoroquinolones plus other quinolones (b) in food-producing animals and the probability of clinical resistance to fluoroquinolones in E. coli isolates from human BSIs for the year 2012—dots represent the countries involved in the analysis ......... 60
Figure 18. Logistic regression analysis curves with OR estimates and 95 % PL CIs of the national consumption of macrolides in food-producing animals and the probability of clinical resistance to erythromycin in C. jejuni isolates from human infections for the year 2012—dots represent the countries involved in the analysis ........................................................................................ 61
Figure 19. Logistic regression analysis curves with OR estimates and 95 % PL CIs of the national consumption of tetracyclines in food-producing animals and the probability of clinical resistance to tetracycline in (a) S. Typhimurium isolates from human infections and (b) Salmonella spp. isolates from human infections for the year 2012—dots represent the countries involved in the analysis .. 62
Figure 20. Logistic regression analysis curves with OR estimates and 95 % PL CIs of the national consumption of tetracyclines in food-producing animals and the probability of clinical resistance to tetracycline in C. jejuni isolates from human infections for the year 2012—dots represent the countries involved in the analysis ........................................................................................ 63
Figure 21. Distribution of consumption, in milligrams per PCU, of veterinary antimicrobial agents for food-producing animals (including horses), stratified into forms applicable for group treatment and for treatment of individual animals. Data consist of total consumption in the 26 EU/EEA countries for 2012 ........................................................................................................................... 80
Figure 22. Distribution of consumption, in milligrams per PCU, of 3rd- and 4th-generation cephalosporins, fluoroquinolones, macrolides and tetracyclines, stratified into forms applicable for group treatment and for treatment of individual animals. Based on data on consumption for food-producing animals (including horses) in 26 EU/EEA countries for 2012 (EMA/ESVAC, 2014) ........ 80
Figure 23. Exchange of resistance mechanisms and bacteria between different reservoirs .............. 93 Figure 24. Comparison of clinical breakpoints and epidemiological cut-off values (ECOFFs) used to
interpret MIC data reported for Salmonella spp. from humans, animals or food ......................... 94 Figure 25. Comparison of clinical breakpoints and ECOFFs used to interpret MIC data reported for
Campylobacter spp. from humans, animals or food ................................................................ 95 Figure 26. Logistic regression analysis curves with OR estimates and 95 % PL CIs of the national
consumption of tetracyclines in food-producing animals and the probability of “microbiological” resistance to tetracyclines in (a) indicator E. coli isolates (MIC > 8 mg/L) from cattle, domestic fowl and pigs, (b) Salmonella spp. isolates (MIC > 8 mg/L) from cattle, domestic fowl and pigs, (c) C. coli isolates (MIC > 2 mg/L) from domestic fowl and pigs and (d) C. jejuni isolates (MIC > 2 mg/L) from cattle and domestic fowl for the year 20111—dots represent the countries involved in the analysis ...................................................................................................... 99
Figure 27. Logistic regression analysis curves with OR estimates and 95 % PL CIs of the national consumption of 3rd-generation cephalosporins in food-producing animals and the probability of “microbiological” resistance to cefotaxime in (a) indicator E. coli isolates (MIC > 0.25 mg/L) from cattle, domestic fowl and pigs and (b) Salmonella spp. isolates (MIC > 0.5 mg/L) from cattle, domestic fowl and pigs for the year 20111—dots represent the countries involved in the analysis ...................................................................................................................................... 100
Figure 28. Logistic regression analysis curves with OR estimates and 95 % PL CIs of the national consumption of macrolides in food-producing animals and the probability of “microbiological” resistance to erythromycin in (a) C. coli isolates (MIC > 16 mg/L) from domestic fowl and pigs and (b) C. jejuni isolates (MIC > 4 mg/L) from cattle and domestic fowl for the year 20111—dots represent the countries involved in the analysis ................................................................... 101
Figure 29. Logistic regression analysis curves with OR estimates and 95 % PL CIs of the national consumption of (A) fluoroquinolones and (B) fluoroquinolones plus other quinolones in food-producing animals and the probability of “microbiological” resistance to ciprofloxacin in (1) indicator E. coli isolates (MIC > 0.03 mg/L) from cattle, domestic fowl and pigs, (2) Salmonella spp. isolates (MIC > 0.06 mg/L) from cattle, domestic fowl and pigs, (3) C. jejuni isolates (MIC > 1 mg/L) from cattle and domestic fowl and (4) C. coli isolates (MIC > 1 mg/L) from
ECDC/EFSA/EMA first joint report on the integrated analysis of the consumption of antimicrobial agents and occurrence of antimicrobial resistance in bacteria from humans and food-producing animals 636088/2013 Page 6/114

domestic fowl and pigs for the year 20111—dots represent the countries involved in the analysis ...................................................................................................................................... 102
Figure 30. Logistic regression analysis curves with OR estimates and 95 % PL CIs of the national community and hospital consumption of 3rd- and 4th-generation cephalosporins in humans and the probability of clinical resistance to 3rd-generation cephalosporins in E. coli isolates from human BSIs for the year 2012—dots represent the countries involved in the analysis .......................... 104
Figure 31. Logistic regression analysis curves with OR estimates and 95 % PL CIs of the national community and hospital consumption of fluoroquinolones in humans and the probability of clinical resistance to fluoroquinolones in E. coli isolates from human BSIs for the year 2012—dots represent the countries involved in the analysis ................................................................... 104
Figure 32. Logistic regression analysis curves with OR estimates and 95 % PL CIs of the national consumption of tetracyclines in the community in humans and the probability of clinical resistance to tetracycline in Salmonella spp. from human infections for the year 2012—dots represent the countries involved in the analysis ....................................................................................... 105
Figure 33. Logistic regression analysis curves with OR estimates and 95 % PL CIs of the national consumption of tetracyclines in the community in humans and the probability of clinical resistance to tetracycline in C. jejuni from human infections for the year 2012—dots represent the countries involved in the analysis ..................................................................................................... 105
Figure 34. Logistic regression analysis curves with OR estimates and 95 % PL CIs of the national consumption of 3rd- and 4th-generation cephalosporins in food-producing animals and the probability of clinical resistance to 3rd- and 4th-generation cephalosporins in E. coli isolates from human BSIs for the year 2011—dots represent the countries involved in the analysis ............... 106
Figure 35. Logistic regression analysis curves with OR estimates and 95 % PL CIs of the national consumption of (a) fluoroquinolones and (b) fluoroquinolones plus other quinolones in food-producing animals in 2011 and the probability of clinical resistance to fluoroquinolones in E. coli isolates from human BSIs for the year 2012—dots represent the countries involved in the analysis ...................................................................................................................................... 106
Figure 36. Logistic regression analysis curves with OR estimates and 95 % PL CIs of the national consumption of macrolides in food-producing animals in 2011 and the probability of clinical resistance to erythromycin in C. jejuni isolates from human infections for the year 2011—dots represent the countries involved in the analysis ................................................................... 107
Figure 37. Logistic regression analysis curves with OR estimates and 95 % PL CIs of the national consumption of tetracyclines in food-producing animals in 2011 and the probability of clinical resistance to tetracycline in (a) S. Typhimurium isolates from human infections and (b) Salmonella spp. isolates from human infections for the year 2012—dots represent the countries involved in the analysis ........................................................................................................................... 107
Figure 38. Logistic regression analysis curves with OR estimates and 95 % PL CIs of the national consumption of tetracyclines in food-producing animals in 2012 and the probability of clinical resistance to tetracycline in C. jejuni isolates from human infections for the year 2012—dots represent the countries involved in the analysis ................................................................... 108
ECDC/EFSA/EMA first joint report on the integrated analysis of the consumption of antimicrobial agents and occurrence of antimicrobial resistance in bacteria from humans and food-producing animals 636088/2013 Page 7/114

List of tables Table 1. Harmonised set of antimicrobial substances used for the monitoring of resistance in zoonotic
Salmonella spp. and Campylobacter spp. and indicator E. coli and enterococci isolates from food-producing animals and food over the period 2007–2013 ......................................................... 21
Table 2. Combinations of bacteria and (sub)classes of antimicrobials assessed for the relationship between antimicrobial consumption and resistance in animals ................................................. 26
Table 3. Combinations of bacteria and (sub)classes of antimicrobials assessed for the relationship between antimicrobial consumption and resistance in bacteria from humans ............................. 27
Table 4. Consumption of antimicrobials by humans and food-producing animals, in tonnes, the estimated biomass of the corresponding populations in 1 000 tonnes and consumption expressed as milligrams per kilogram biomass in 26 EU/EEA countries in 2012 ........................................ 29
Table 5. Consumption, in tonnes of active ingredient, of antimicrobials authorised for human medicine (presented according to the ATC classification), by country, 2012 ........................................... 77
Table 6. Consumption, in tonnes of active ingredient, of veterinary antimicrobials applicable mainly for food-producing animal species, including horses, by antimicrobial class (presented according to ATCvet hierarchical system, tablets not included), by country, 2012 ........................................ 81
Table 7. Estimated PCU (in 1 000 tonnes) of the population of food-producing animal species1 (including horses), by country, for 2012 ............................................................................... 83
Table 8. List of substances reported sold in ESVAC ..................................................................... 84 Table 9. The use of antimicrobials in humans and in food-producing animals ................................. 86 Table 10. Proposed standard body weights for children by EFSA .................................................. 87 Table 11. Factors contributing to the selection and dissemination of antimicrobial resistance .......... 89
ECDC/EFSA/EMA first joint report on the integrated analysis of the consumption of antimicrobial agents and occurrence of antimicrobial resistance in bacteria from humans and food-producing animals 636088/2013 Page 8/114

1. Summary and recommendations
1.1. Summary
This is the first integrated report by the European Centre for Disease Prevention and Control (ECDC), the European Food Safety Authority (EFSA) and the European Medicines Agency (EMA) analysing possible relationships between the consumption2 of antimicrobial agents and the occurrence of antimicrobial resistance in humans and food-producing animals3.
ECDC, EFSA and EMA are agencies of the European Commission (EC). This report was prepared following a mandate from the EC. Data included in this report are from the agencies’ surveillance networks, which receive information annually from the reporting countries. Further details on each network are provided in Chapter 4.
The report utilises data from 2011 and 2012, from five different surveillance networks, collecting information from the EU Member States (MSs), Iceland, Norway, Croatia and from Switzerland4. The datasets used have been established for purposes other than the current integrated analyses, and the analyses focused on certain combinations of antimicrobials and bacterial species (see section 5.3 for further details).
Antimicrobial consumption data from humans are normally reported as defined daily doses (DDD) per 1 000 inhabitants and per day. The corresponding data are currently reported for food-producing animals by weight of active substance per population correction unit (PCU) and per year. A fully comparable unit of measurement is not available. To make a comparison possible, data on consumption of antimicrobials for humans were converted to mass of active substance. When comparing the consumption of antimicrobials from humans and food-producing animals in 2012, the average consumption expressed in milligrams per kilogram of estimated biomass was 116.4 mg/kg in humans (range 56.7–175.8 mg/kg) and 144.0 mg/kg in animals (range 3.8–396.5 mg/kg). Consumption in food-producing animals was lower or much lower than in humans in 15 of 26 countries, in three countries it was similar, and in eight countries consumption in food-producing animals was higher or much higher than in humans.
Data on antimicrobial consumption in food-producing animals are not available by species in the European Surveillance of Veterinary Antimicrobial Consumption (ESVAC) reports. To analyse the relationship between consumption of antimicrobials and resistance in bacteria from food-producing animals, a summary indicator of resistance in the main three food-producing animals species was calculated on the basis of the weighted mean by PCU of the proportions of resistant bacteria in each of those animal species. Overall, a positive association was observed between antimicrobial consumption in food-producing animals and occurrence of resistance in bacteria from such animals for most of the combinations investigated. The strongest associations between consumption and resistance in food-producing animals were found for the antimicrobials studied in relation to indicator Escherichia coli. Positive associations were also noted for Salmonella spp. and Campylobacter spp.
A positive association was observed between the total consumption of 3rd- and 4th-generation cephalosporins in humans and the occurrence of resistance to 3rd-generation cephalosporins (the
2 In this report the term “consumption” has been preferred to similar terms such as “use”, “usage” or “sales”. 3 A number of different animal species may be treated with antimicrobials; this report considers primarily antimicrobial consumption and resistance in food-producing animals. 4 For this report data were provided from the EU Member States, Iceland, Norway, Croatia and depending on the network, Switzerland; these are referred as “countries” or “reporting countries”.
ECDC/EFSA/EMA first joint report on the integrated analysis of the consumption of antimicrobial agents and occurrence of antimicrobial resistance in bacteria from humans and food-producing animals 636088/2013 Page 9/114

cephalosporin used for the susceptibility testing) in E. coli from humans. A positive association was also observed between the total consumption of fluoroquinolones in humans and the occurrence of fluoroquinolone resistance in E. coli from humans. No association was found between the consumption of fluoroquinolones in humans and the occurrence of fluoroquinolone resistance in Salmonella spp., S. enterica subsp. enterica serovar Enteritidis and serovar Typhimurium from cases of human infection.
For both cephalosporins and fluoroquinolones, positive associations were found between occurrence of resistance in indicator E. coli originating from food-producing animals and the occurrence of resistance in E. coli from humans.
No associations were observed between the consumption of 3rd- and 4th-generation cephalosporins in food-producing animals and the occurrence of resistance to this sub-class in selected bacteria from humans. No associations were observed between the consumption of fluoroquinolones in food-producing animals and the occurrence of resistance in Salmonella spp. and Campylobacter spp. from cases of human infection.
Positive associations were noted for consumption of macrolides in food-producing animals and the occurrence of resistance in Campylobacter spp. from cases of human infection, and for consumption of tetracyclines and the occurrence of resistance in Salmonella spp. and Campylobacter spp.
In the reported analyses, associations between the consumption of selected combinations of antimicrobials and the occurrence of resistance in bacteria were observed for most of the combinations addressed in humans and animals. The epidemiology of resistance is complex, and several factors aside from the amount of antimicrobial consumption influence the level of resistance.
Differences between the systems for collection and reporting of data on antimicrobial consumption and resistance in bacteria from humans and food-producing animals, at the time of data collection (2011–2012), unavoidably hamper direct comparisons. Owing to the characteristics of these data, the interpretation criteria and differences in units of measurement, the results which indicate associations of potential concern should be interpreted with caution.
1.2. Recommendations
To improve the integrated analyses, more detailed and comprehensive data are required. Future developments of ESVAC with collection of data by species and reporting of these data by DDD for animals will make that possible. Additional information, such as antimicrobial consumption by animal species and collection of resistance data from all countries, from relevant animal species and food, at a detailed level, including production type, is required. Resistance patterns among indicator commensal E. coli derived from humans from the community would most likely be a good indicator of the relative exposure to resistant bacteria through food consumption and the direct effect of antimicrobial consumption in humans. Other factors that would have to be considered are resistance to other antimicrobials (co-resistance), travel by humans, import and trade of food, and trade of live animals both between and within countries.
The findings in ecological analyses5 such as those presented in this report should be considered as hypotheses for subsequent testing by focused research that in time could provide more definitive explanations for the observed associations.
5 Ecological analyses can be used to investigate in an exploratory manner the impact of risk-modifying factors on health/non-health outcomes based on populations defined either geographically or temporally. Both risk-modifying factors and outcomes are considered at the population level in each geographical or temporal unit and then compared and their potential association assessed using standard statistical methods. For example, consumption of antimicrobials and occurrence of resistance in a given population may be compared across a number of countries. Although ecological studies are particularly useful for generating hypotheses since they can use existing data sets, they are limited by the fact that
ECDC/EFSA/EMA first joint report on the integrated analysis of the consumption of antimicrobial agents and occurrence of antimicrobial resistance in bacteria from humans and food-producing animals 636088/2013 Page 10/114
Improvement of existing systems should enable better integrated analyses of consumption of antimicrobial agents and occurrence of antimicrobial resistance in bacteria from humans and food-producing animals in the future.
In particular, this refers to the following on-going actions aiming to: • refine existing surveillance systems by providing more detailed information on antimicrobial
consumption by age and gender in humans and by species and production types in animals;
• provide enhanced data on hospital consumption in more countries;
• provide more comprehensive data on foods—types, prevalence of bacteria and resistance;
• provide isolate-based data to enable analysis of the effects of co-selection.
Any improvement of data collection should be coordinated between the different surveillance networks, with the overarching aim of integrated analysis of the data.
Monitoring of antimicrobial resistance should also include: • animal pathogens;
• commensal flora from both healthy and diseased persons;
• information about the origin of the food and/or animals.
Finally, there is a need to promote responsible use of antimicrobials in both humans and animals.
2. Terms of reference and scope
In 2012, the European Commission (EC) requested the European Centre for Disease Prevention and Control (ECDC), the European Food Safety Authority (EFSA) and the European Medicines Agency (EMA) to produce a common analysis of the data from surveillance systems on the consumption of antimicrobials and on the impact of antimicrobial consumption on the occurrence of antimicrobial resistance in bacteria from humans, animals and food in the EU. The request from the EC indicated that the report should be produced with harmonised and transparent presentation of the data, and at regular intervals. EU agencies are distinct bodies from the EU institutions—separate legal entities set up to perform specific tasks under EU law.
The request was based on the Communication of 15 November 2011 from the Commission to the European Parliament and the Council—Action Plan against the rising threats from Antimicrobial Resistance (AMR) (European Commission, 2011) —which sets out key actions and undertakings of the Commission for a successful fight against AMR. Actions 9 and 10 are requests to “Strengthen surveillance systems on AMR and antimicrobial consumption in human medicine (action no 9) and in animal medicine (action no 10)”.
This first joint report on the integrated analysis of the relationship between available data on consumption of antimicrobial agents6 and the occurrence of antimicrobial resistance in humans and food-producing animals is the result of the request from the European Commission and was prepared by experts from the three above-mentioned agencies.
they cannot look at cause and effect in individuals and therefore establish causation, not matter how strong the associations discerned. It is important to take this into account when interpreting the results of such studies. 6 OIE definition “Antimicrobial agent”: “a naturally occurring, semi-synthetic or synthetic substance that exhibits antimicrobial activity (kill or inhibit the growth of micro-organisms) at concentrations attainable in vivo. Anthelmintics and substances classed as disinfectants or antiseptics are excluded from this definition” (http://www.oie.int/index.php?id=169&L=0&htmfile=glossaire.htm).
ECDC/EFSA/EMA first joint report on the integrated analysis of the consumption of antimicrobial agents and occurrence of antimicrobial resistance in bacteria from humans and food-producing animals 636088/2013 Page 11/114

The aim of the work behind this report is to analyse data available in reports from five different surveillance systems by an integrated analysis. The scope is limited to a comparison of consumption of antimicrobials in food-producing animals and humans and to the analysis of the prevalence of resistance to certain antimicrobials in selected bacteria: Campylobacter spp., Salmonella spp. and (indicator/pathogenic) E. coli; and fluoroquinolones, 3rd- and 4th-generation cephalosporins and tetracyclines, and also for Campylobacter spp. and macrolides. In addition, an analysis of the relationship between consumption of carbapenems in human medicine and resistance to carbapenems in bacteria from humans was performed.
The early stage of maturity of some of the systems for collecting and analysing data is acknowledged. As the work of each of the networks progresses towards a more detailed and accurate gathering and analyses of data, a more refined report can be produced. Owing to the complexity of the tasks and limited resources, it is envisaged that reports of this type will be produced not yearly, but on a multiyear basis.
ECDC provided data on antimicrobial consumption in humans as well as resistance monitoring data on isolates from cases of human infection. The EFSA provided data on monitoring of antimicrobial resistance in bacteria from food and food-producing animals. The EMA provided data on antimicrobial consumption in food-producing animals. All the data collected by the networks were originally provided by the reporting countries.
This report first presents consumption and resistance data, and then explores possible relationships between the data.
Numerous studies in human medicine have shown a correlation between consumption of antimicrobials and resistance in bacteria isolated from infections in humans (Bell et al., 2014; van de Sande-Bruinsma et al., 2008). These correlations are not addressed in this report as it focusses on zoonotic bacteria.
Representatives of the different surveillance/monitoring networks of the MSs in charge of providing the data and the European Union Reference Laboratory for Antimicrobial Resistance (EURL-AR) were consulted at the finalisation of the preparation of the joint report.
ECDC, EFSA and EMA have each established their own procedure for approval of the joint report according to their internal rules.
The ECDC approved the report on 26 January 2015, after consultation with the European Antimicrobial Resistance Surveillance Network (EARS-Net), the European Surveillance Antimicrobial Consumption Network (ESAC-Net) and the Food and Waterborne Diseases and Zoonoses Network (FWD-Net).
The European Food Safety Authority approved the report on 27 January 2015. The report was circulated for consultation with the Scientific Network for Zoonosis Monitoring Data. The report was presented to the 21-22 January 2015 BIOHAZ Panel meeting for information.
The European Medicines Agency approved the report on 16 January 2015. Before approval the report was circulated for consideration to the ESVAC network. The report was circulated at the 13-15 January 2015 CVMP plenary meeting for information.
3. Acknowledgements
The representatives of the MSs and other members of the different networks are thanked for providing data for the surveillance networks:
• ECDC: EARS-Net, ESAC-Net and FWD-Net;
ECDC/EFSA/EMA first joint report on the integrated analysis of the consumption of antimicrobial agents and occurrence of antimicrobial resistance in bacteria from humans and food-producing animals 636088/2013 Page 12/114

• EFSA: Scientific Network for Zoonosis Monitoring Data;
• EMA: ESVAC.
This joint report is based on data provided by the above-mentioned networks and on the major contributions of the following experts:
• ECDC: Yvonne Agersø, Ole Heuer, Liselotte Diaz Högberg, Arno Muller, Klaus Weist, ThereseWestrell and Dominique Monnet.
• EFSA: Pierre-Alexandre Belœil, Ernesto Liebana-Criado, Rob van Oosterom, Pascal Sanders,Christopher Teale and John Threlfall.
• EMA: Kari Grave, Christina Greko, Kristine Ignate, Zoltan Kunsagi, Gérard Moulin (Chair) andJordi Torren-Edo.
Correspondence:
• ECDC: [email protected]
• EFSA: [email protected]
• EMA: [email protected]
4. Description of the existing monitoring or surveillancesystems
The European Centre for Disease Prevention and Control (ECDC) has a mandate to gather and analyse data and information on emerging public health threats and developments for the purpose of protecting public health in the European Community according to Regulation 851/2004/EC (Official Journal of the European Union, 2004b). The collection of data related to antimicrobial resistance and antimicrobial consumption is included as part of the European Surveillance System (TESSy) through several networks. Data included in this report regarding the occurrence of resistance in humans were obtained from two surveillance networks—the European Antimicrobial Resistance Surveillance Network (EARS-Net) and the Food- and Waterborne Diseases and Zoonoses Network (FWD-Net)—whereas data regarding consumption of antimicrobials in humans were obtained from one surveillance network: the European Surveillance of Antimicrobial Consumption Network (ESAC-Net).
Based on Article 33 in Regulation (EC) 178/2002 (Official Journal of the European Communities, 2002), the European Food Safety Authority (EFSA) is responsible for examining data on zoonoses, antimicrobial resistance and food-borne outbreaks collected from the MSs in accordance with Directive 2003/99/EC (Official Journal of the European Union, 2003a) and for preparing the EU Summary Report from the results. Regarding antimicrobial resistance data a specific EU Summary Report on antimicrobial resistance is produced in collaboration with ECDC on a yearly basis. It includes data related to the occurrence of antimicrobial resistance both in isolates from animals and foodstuffs, collected in the framework of Directive 2003/99/EC (Official Journal of the European Union, 2003a), and in isolates from human cases, derived from the surveillance network FWD-Net coordinated by ECDC.
The European Medicines Agency (EMA) is a decentralised body of the European Union (EU), located in London. Its main responsibility is the protection and promotion of public and animal health, through the evaluation and supervision of medicines for human and veterinary use. The European Surveillance of Veterinary Antimicrobial Consumption (ESVAC) project was launched by the agency in September 2009, following a request from the European Commission (EC) to develop a harmonised approach to
ECDC/EFSA/EMA first joint report on the integrated analysis of the consumption of antimicrobial agents and occurrence of antimicrobial resistance in bacteria from humans and food-producing animals 636088/2013 Page 13/114

the collection and reporting of data on the consumption of antimicrobial agents in animals from the MSs. The ESVAC reports present data on the consumption of veterinary antimicrobial agents from EU/European Economic Area (EEA) countries, provided at package level according to a standardised protocol and template.
4.1. Surveillance of antimicrobial consumption in humans
4.1.1. Description of collected data
ESAC-Net is the continuation of the former ESAC project (managed by the University of Antwerp until June 2011) and is a Europe-wide network of national surveillance systems coordinated by ECDC providing independent reference data on antimicrobial consumption in EU MSs, Iceland and Norway. It collects and analyses antimicrobial consumption data from the community (primary care) and from hospitals.
Antimicrobials are grouped according to the anatomical therapeutic chemical (ATC) classification. The three major categories of antimicrobials considered in ESAC-Net are the antibacterials for systemic use (ATC group J01), antimycotics and antifungals (J02 and D01BA) and antivirals (J05). In addition, data on antimycobacterials (J04) and a few antimicrobials outside the ATC J-group are collected. Only antimicrobials that are “antibacterials for systemic use” (ATC J01) are included in the present report.
There are two options for reporting ESAC-Net data to ECDC:
• the preferred standard option, i.e. reporting of national antimicrobial consumption data at themedicinal product level, expressed as number of packages sold or reimbursed. For this option,a valid national registry of available antimicrobials is required (national registry data);
• a “light” version, i.e. when national registry data are not available, reporting of aggregatednumbers of DDD (defined daily doses) from national antimicrobial consumption data at the ATCsubstance level.
In addition, ESAC-Net encourages participants to report data by age group, gender and type of prescriber, as well as to report quarterly data rather than yearly data.
Most countries report data on sales, one-third of the countries report reimbursement data and a few report both sales and reimbursement data.
Data are uploaded into the TESSy database and used for reporting after a validation process and final approval by national ECDC contact points nominated by the reporting countries. The reporting countries can at any time upload or re-upload data to TESSy, e.g. for correction purposes.
ECDC ensures the annual analysis of the trends in overall antimicrobial consumption and in the different ATC groups, as well as comparisons between countries. Public access to information on antimicrobial consumption in Europe is provided through an ESAC-Net interactive database and an annual ECDC EU summary report on antimicrobial consumption.
4.1.2. Strength of the system
The ESAC-Net collects data from all 30 EU/EEA countries. For most of these countries, complete national consumption was reported. The standardised ESAC-Net reporting protocol, built upon the former ESAC project, is essential to ensure comparability with other multinational surveillance networks.
ECDC/EFSA/EMA first joint report on the integrated analysis of the consumption of antimicrobial agents and occurrence of antimicrobial resistance in bacteria from humans and food-producing animals 636088/2013 Page 14/114

The quality of antimicrobial consumption data also depends on the type of data available for a given sector. For most of the countries ESAC-Net can differentiate between antimicrobial consumption data from the community (primary care) and from hospitals.
Data provided through the standard option of the reporting protocol are very valuable. First, the level of detail of these data (complete registry of products) allows a better quality check of the provided consumption data. Second, it provides the opportunity to carry out fine-grained analyses (such as analyses on the availability of products or changes in the content of products; or studies on the number of packages consumed to estimate the number of prescriptions). Such analysis is not possible when data are reported via the “light version” by proving aggregated numbers of DDD consumed only for the ATC groups under surveillance.
4.1.3. Impediments to comparing the data
For ESAC-Net, countries provide sales or/and reimbursement data that each have limitations. The major limitation of reimbursement data is that they do not include antimicrobials dispensed without a prescription and non-reimbursed prescribed antimicrobials (for example the antimicrobials prescribed through private healthcare systems). For this reason, countries that report reimbursement data and where it is known that a substantial proportion of antimicrobials are dispensed without a prescription are indicated as such when ESAC-Net results are published.
Countries, from one year to another, might deliver different type of data or from different data sources, which could also introduce bias in the consumption rates reported. The number of countries that each year change data provider and/or types of data is small.
ESAC-Net reports consumption separately for the community and the hospital sector, but some countries that are not able to split data according to the healthcare sector reported totals from both sectors combined (total care). Because consumption in the community represents around 90 % of the total consumption (when expressed as DDD per 1 000 inhabitants and per day), ESAC-Net reports the total care consumption as community consumption for those countries not able to split the data. For these countries, the figures reported for the community are overestimated and the antimicrobials normally used in the hospitals will be reported in the community sector; thus, the pattern of consumption will be slightly different from that seen in countries providing separate data for community and hospitals.
Although all countries are able to report antimicrobial consumption for the community, one-third of them cannot report data for the hospital sector as there is no surveillance system in place to collect data from this sector.
Finally, ESAC-Net reports the hospital consumption using the whole population and not hospital activity indicators, which may not be completely comparable in terms of trends.
4.1.4. On-going actions to improve the system
To improve the reporting of hospital antimicrobial consumption, ESAC-Net is developing a hospital-based surveillance of antimicrobial consumption. This surveillance will enable countries not currently reporting data for the hospital sector to do so in the future. In addition, consumption data will be collected by type of hospital as well as by hospital activity indicator in order to relate consumption to actual hospital activity.
ESAC-Net intends to comply with ECDC’s long-term surveillance strategy for 2014–2020, which targets improved routine surveillance outputs. It includes reusable online content (the publicly available ESAC-
ECDC/EFSA/EMA first joint report on the integrated analysis of the consumption of antimicrobial agents and occurrence of antimicrobial resistance in bacteria from humans and food-producing animals 636088/2013 Page 15/114

Net interactive database), which could replace large parts of the lengthy surveillance reports. These reports will, in turn, be shorter and focus more on data interpretation relevant to public health.
4.2. Surveillance of antimicrobial consumption in food-producing animals7
4.2.1. Description of collected data
The ESVAC project annually collects harmonised data on sales of veterinary antimicrobial medicinal products at package level from most of the EU MSs and Iceland, Norway and Switzerland; these data are not stratified by animal species. These data are collected from various national sources (wholesalers, marketing authorisation holders (MAHs), feed mills and pharmacies) and presented by antimicrobial class or sub-class. In the analysis of data, products formulated as tablets, which are almost exclusively used for companion animals, are analysed separately. The remaining products are mainly used for food-producing animals and data on these products are used for the analyses presented in the current report.
Denmark collects prescription data and the Netherlands collects data by species at farm level. Automated data collection systems are being implemented in some other countries (e.g. Belgium, Finland, Germany and Norway). Other countries, such as France, Sweden and the United Kingdom have established a certain stratification of the sales data by animal species. Comparable consumption data by species and production type are not available.
In order to normalise the consumption data for the animal population that can be subjected to treatment with antimicrobial agents, a population correction unit (PCU) is used as a proxy for the size of the animal population at risk of being treated. The PCU is purely a technical unit of measurement, used only to estimate sales corrected by the animal population in individual countries; 1 PCU = 1 kg of different categories of livestock and slaughtered animals. The data sources used and the methodology for the calculation of PCU are comprehensively described in Appendix 2 to EMA's report “Trends in the sales of veterinary antimicrobial agents in nine European countries: 2005–2009” (EMA/ESVAC, 2011).
4.2.2. Strength of the system
The collection of data at package level and calculations to determine the mass of active substance are harmonised, resulting in standardised data from all participating countries. The ESVAC team and ESVAC network jointly discuss the analysis and potential improvements. Twenty-four EU MSs and two EEA countries delivered data at package level for 2012. This covers 95 % of the food-producing animal population in the EU/EEA countries.
4.2.3. Impediments to comparing data
The national consumption data for antimicrobial agents (nominator) cover all food-producing animal species, including horses. This means that the animal population “at risk” of being treated with antimicrobial agents (denominator) includes all food-producing species. The consumption of antimicrobial agents by the various animal species varies considerably. For example, the consumption of antimicrobial agents in extensively reared sheep and goats is generally relatively low, while consumption in intensively reared calves can be substantial. Therefore, the interpretation of these data should take into account the distribution of the PCU value between the species in the various countries.
7 See: http://www.ema.europa.eu/ema/index.jsp?curl=pages/regulation/document_listing/document_listing_000302.jsp&mid=WC0b01ac0580153a00&jsenabled=true
ECDC/EFSA/EMA first joint report on the integrated analysis of the consumption of antimicrobial agents and occurrence of antimicrobial resistance in bacteria from humans and food-producing animals 636088/2013 Page 16/114

It should also be emphasised again that the PCU only represents a technical unit of measurement and not a real value for the animal population that could potentially be treated by antimicrobial agents.
4.2.4. On-going actions to improve the system
The ESVAC project is developing a system to collect data on consumption of antimicrobial agents per animal species and to establish technical units of measurement for the reporting consumption of antimicrobial agents by species. Further information can be found on the EMA ESVAC website8.
4.3. Surveillance of antimicrobial resistance in humans
4.3.1. Surveillance of antimicrobial resistance in humans through FWD-Net
4.3.1.1. Description of collected data
FWD-Net was established at ECDC in 2007. It currently covers surveillance on 19 diseases that are acquired by humans through the consumption of food or water, or contact with animals: anthrax, botulism, brucellosis, campylobacteriosis, cholera, cryptosporidiosis, echinococcosis, giardiasis, hepatitis A, leptospirosis, listeriosis, salmonellosis, shigellosis, toxoplasmosis, trichinellosis, tularaemia, typhoid/paratyphoid fever, verocytotoxin-producing E. coli (VTEC)/Shiga toxin-producing E. coli (STEC) infection and yersiniosis. Antimicrobial resistance data are collected as part of the case-based datasets for salmonellosis and campylobacteriosis, and partly also for STEC/VTEC infections. The monitoring of antimicrobial resistance in human isolates in 2011–2012 was conducted by MSs in accordance with Decision No 2119/98/EC (Official Journal of the European Communities, 1998)9 setting up a network for the epidemiological surveillance and control of communicable diseases in the Community.
MSs are requested to annually provide antimicrobial resistance data as part of the general FWD data call and report their data to TESSy at ECDC. The antimicrobial resistance data consist of clinical antimicrobial susceptibility testing (AST) results interpreted with clinical breakpoints, with some exceptions, and originate from testing at local laboratories, hospitals or the National Public Health Reference Laboratories (NPHRLs).
The antimicrobial resistance data are primarily analysed for, and published in, the joint EFSA-ECDC EU Summary Report (EFSA/ECDC, 2014) on antimicrobial resistance in zoonotic and indicator bacteria obtained from humans, animals and food thereof.
4.3.1.2. Strength of the system
In 2012, antimicrobial resistance data were provided for 26% of all laboratory-confirmed non-typhoidal salmonellosis cases and 18 % of the laboratory-confirmed campylobacteriosis cases. Considering that over 90 000 salmonellosis cases and almost 220 000 campylobacteriosis cases were reported in 2012, this provides a good overview of the antimicrobial resistance situation at the EU level and a sizeable dataset for analysis. The number of countries reporting antimicrobial resistance data is also increasing over time, with 21 and 15 EU/EEA countries reporting data for Salmonella spp. and Campylobacter spp., respectively.
8 http://www.ema.europa.eu/ema/index.jsp?curl=pages/regulation/document_listing/document_listing_000302.jsp&mid=WC0b01ac0580153a00 9 As of 22 October 2013, Decision No 2119/98/EC was replaced by decision No 1082/2013/EU on serious cross-border threats to health.
ECDC/EFSA/EMA first joint report on the integrated analysis of the consumption of antimicrobial agents and occurrence of antimicrobial resistance in bacteria from humans and food-producing animals 636088/2013 Page 17/114
4.3.1.3. Impediments to comparing data
Several problematic issues have been identified when it comes to comparability of the antimicrobial resistance data collected in FWD-Net. The methods of measuring antimicrobial susceptibility and the origin of the data submitted vary markedly between countries. In several countries, the NPHRLs measure antimicrobial susceptibility in only a fraction of the isolates and the remaining isolates are tested by hospital or local laboratories, whose methods are not reported to the NPHRLs. The guidelines used for the interpretation of the measurements can also vary between and within countries for different antimicrobials, with both international and national guidelines sometimes being used. Direct comparisons between antimicrobial resistance data from humans and animal and food isolates are also hampered because of the use of different test methods, different interpretive criteria and fundamental differences in underlying testing populations. Results of antimicrobial susceptibility testing performed on isolates from infections in humans in a clinical setting are by default interpreted using clinical breakpoints for assessing treatment options. In contrast, animal bacterial isolates from monitoring programmes originate from healthy food-producing animals and, consequently, both animal and food isolates are generally interpreted based on epidemiological cut-off values (ECOFFs). Since the clinical breakpoint and the ECOFF differ for some critically important antimicrobials, direct comparison of resistance between the human isolates and animal/food isolates for these antimicrobials is not possible in respect of these antimicrobials.
4.3.1.4. On-going actions to improve the system
In order to increase the quality and comparability of antimicrobial resistance data collected from different EU/EEA countries, ECDC has launched a protocol for harmonised monitoring of antimicrobial resistance in human Salmonella spp. and Campylobacter spp. isolates. The protocol, which was published in 2014 (ECDC, 2014), is primarily targeted at NPHRLs to guide the susceptibility testing needed for EU-level surveillance and reporting to ECDC. It also provides guidance on how to improve the comparison of results with the results obtained from antimicrobial resistance monitoring performed in isolates from food-producing animals and food products. The protocol was developed by ECDC in close co-operation with FWD-Net and facilitates the implementation of the Commission action plan on antimicrobial resistance (EC, 2011). The protocol defines the priority panels of antimicrobials to be monitored to fulfil the agreed surveillance objectives. The panels for both Salmonella spp. and Campylobacter spp. isolates are, to the largest extent possible, in agreement with the panel of antimicrobials agreed to be tested in food and animal isolates. European Committee on Antimicrobial Susceptibility Testing (EUCAST) methods and interpretive criteria are recommended and the protocol also provides methods for detection and confirmation of two specific resistance phenotypes of particular concern in Salmonella spp., namely extended-spectrum beta-lactamase (ESBL) producers and carbapenemase producers. The reporting countries are encouraged to submit the results of susceptibility testing as “quantitative” values (minimum inhibitory concentration (MIC) in milligrams per litre or zone diameter in millimetres) to facilitate comparison of data over time, and to allow comparison with quantitative antimicrobial resistance data from food-producing animals and food isolates that takes account of ECOFFs for the relevant bacterial species.
ECDC/EFSA/EMA first joint report on the integrated analysis of the consumption of antimicrobial agents and occurrence of antimicrobial resistance in bacteria from humans and food-producing animals 636088/2013 Page 18/114

4.3.2. Surveillance of antimicrobial resistance in humans through EARS-Net
4.3.2.1. Description of collected data
Monitoring of antimicrobial resistance in human isolates in 2011–2012 was conducted by MSs in accordance with Decision No 2119/98/EC (Official Journal of the European Communities, 1998)10 setting up a network for the epidemiological surveillance and control of communicable diseases in the Community. For clinical isolates of bacteria from bloodstream infections (BSIs) and meningitides in humans, this is performed by the EARS-Net, which is the largest publicly funded system of surveillance of antimicrobial resistance in Europe. EARS-Net is based on a network of representatives from the countries reporting routine clinical AST data from national antimicrobial resistance surveillance initiatives. Data are annually reported to ECDC and originate from approximately 900 laboratories serving more than 1 300 hospitals in Europe. Data are reported by EU/EEA countries for the following eight pathogens/pathogenic species which are considered of public health importance: E. coli, Klebsiella pneumoniae, Pseudomonas aeruginosa, Acinetobacter spp., Streptococcus pneumoniae, Staphylococcus aureus, Enterococcus faecalis and Enterococcus faecium. Only invasive isolates (i.e. from blood and cerebrospinal fluid) are included in EARS-Net. The antimicrobial substance and pathogen combinations to be reported are defined in the EARS-Net reporting protocol. Data are reported as categorised AST results (susceptible, intermediate, resistant) on a single isolate basis. In addition, a number of countries provide quantitative results.
4.3.2.2. Strength of the system
EARS-Net collects data from all 30 EU/EEA countries. A major strength of the EARS-Net surveillance is the use of a clear case definition for invasive isolates. EARS-Net data are exclusively based on invasive isolates from blood or cerebrospinal fluid. This restriction prevents some of the inconsistencies that otherwise arise from national differences in clinical case definitions, different sampling frames or heterogeneous health care. All 28 EU MSs (and two other EEA countries) participate in EARS-Net. The majority of the participating countries have good national coverage, and many of the participating laboratories have reported data for several consecutive years, which enables accurate trend analyses.
4.3.2.3. Impediments to comparing data
Interpretation of the results of inter-country comparisons should be made with caution. A number of factors may introduce bias, resulting in over- as well as underestimation of resistance percentages. Some of the most important potential sources of bias are differences in the population coverage, sampling methods, laboratory routines and capacity. Moreover, case ascertainment of patients with BSIs is strongly linked to diagnostic habits and procedures, and the frequency by which blood cultures are taken. EARS-Net encourages the use of EUCAST clinical breakpoints; results based on other interpretive criteria used by the reporting countries are accepted for the analysis. Some countries report data from large national surveillance systems with a high national coverage, while other countries report data from a smaller subset of local laboratories and hospitals. In some countries, the population under surveillance is not constant and may change over the years.
10 As of 22 October 2013, Decision No 2119/98/EC was replaced by decision No 1082/2013/EU on serious cross-border threats to health.
ECDC/EFSA/EMA first joint report on the integrated analysis of the consumption of antimicrobial agents and occurrence of antimicrobial resistance in bacteria from humans and food-producing animals 636088/2013 Page 19/114
4.3.2.4. On-going actions to improve the system
The quality of the antimicrobial susceptibility tests and procedures used by the laboratories are continuously measured through their participation in an annual external quality assessment (EQA) exercise offered to the participating laboratories. The EQA exercise is an important element of the surveillance system aiming to maintain and develop the ability of the laboratories to correctly determine susceptibility of bacterial isolates, and thereby ascertain the comparability of data reported to ECDC. Another on-going action of major importance for the quality of the surveillance system is the gradual implementation of EUCAST guidelines in the countries: at present, only 64 % of the participating laboratories adhere to EUCAST guidelines. In addition, the EARS-Net reporting protocol is updated annually to reflect identified needs and continuously improve data quality.
4.4. Monitoring antimicrobial resistance in food-producing animals and food11
According to Directive 2003/99/EC (Official Journal of the European Union, 2003a) on the monitoring of zoonoses and zoonotic agents, reporting countries are obliged to monitor and report antimicrobial resistance in zoonotic Salmonella spp. and Campylobacter spp. isolates from food-producing animals and food. In addition, and until 2012, Commission Decision No 2007/407/EC (Official Journal of the European Union, 2007) provided some detailed requirements on the harmonised monitoring and reporting of antimicrobial resistance of salmonella isolates from various poultry populations and pigs, sampled under the corresponding national Salmonella control and surveillance programmes. EFSA provided specific non-binding guidelines for the monitoring and reporting of antimicrobial resistance in Salmonella spp. and Campylobacter spp. (EFSA, 2007) and in indicator E. coli and enterococci (EFSA, 2008).
4.4.1. Description of collected data
The monitoring of antimicrobial resistance in healthy food-producing animals and food covers both zoonotic agents, in the first instance Salmonella spp. and Campylobacter spp., and indicator organisms of the commensal flora, such as E. coli, Enterococcus faecium and Enterococcus faecalis. Monitoring of zoonotic resistance focuses on the animal populations to which the consumer is most likely exposed through food derived thereof, such as domestic fowl, pigs, turkeys and cattle. Antimicrobial substances included in the harmonised monitoring consist of a concise set of antimicrobials selected according to their relevance to human therapeutic use (e.g. critically important antimicrobials (CIAs) for human medicine) and/or of epidemiological relevance, as shown in Table 1. ECOFFs are used as interpretative criteria of resistance. ECOFFs separate the naive, susceptible wild-type bacterial populations from isolates that have developed reduced susceptibility to a given antimicrobial agent (Kahlmeter et al., 2003). The ECOFFs may differ from breakpoints used for clinical purposes, which are defined against a background of clinically relevant data, including therapeutic indication, clinical response data, dosing schedules, pharmacokinetics and pharmacodynamics. In the EU Summary Reports on resistance from 2004 to 2012, ECOFFs were applied to interpret MIC data in order to define resistant Salmonella spp., Campylobacter spp., indicator E. coli and indicator enterococcal isolates from food-producing animals and food. The occurrence of resistance is defined as the proportion of bacterial isolates tested for a given antimicrobial and found to present reduced susceptibility, i.e. to display “microbiological resistance”.
11 See: http://www.efsa.europa.eu/en/efsajournal/doc/2598.pdf
ECDC/EFSA/EMA first joint report on the integrated analysis of the consumption of antimicrobial agents and occurrence of antimicrobial resistance in bacteria from humans and food-producing animals 636088/2013 Page 20/114

Table 1. Harmonised set of antimicrobial substances used for the monitoring of resistance in zoonotic Salmonella spp. and Campylobacter spp. and indicator E. coli and enterococci isolates from food-producing animals and food over the period 2007–2013 (EFSA, 2007; 2008)
Salmonella spp. Campylobacter coli/C. jejuni Indicator E. coli Enterococcus spp.
Ampicillin Cefotaxime Chloramphenicol Ciprofloxacin Gentamicin Nalidixic acid Sulfonamides Tetracycline Trimethoprim
Erythromycin Ciprofloxacin Tetracycline Nalidixic acid Gentamicin
Ampicillin Cefotaxime Chloramphenicol Ciprofloxacin Gentamicin Nalidixic acid Sulfonamides Tetracycline Trimethoprim
Ampicillin Chloramphenicol Erythromycin Gentamicin Linezolid Quinupristin/dalfopristin Streptomycin Tetracycline Vancomycin
4.4.2. Strength of the system and impediments to comparing data
EFSA provides detailed specifications on minimum requirements for the harmonised monitoring of antimicrobial resistance in food-producing animals so that comparable data may be obtained across the EU MSs and other EEA countries. Guidelines have been recommended for the monitoring of antimicrobial resistance in Salmonella spp. and Campylobacter spp. (EFSA, 2007) and in indicator E. coli and enterococci (EFSA, 2008). Implementation of the recommendations by the reporting country, which typically deal with harmonisation of protocols on sampling strategies, the method of susceptibility testing, the antimicrobials to be tested and the criteria for categorising isolates as susceptible or resistant, has enabled the comparison of the occurrence of resistance between different countries.
The isolates subjected to susceptibility testing have typically been derived from active monitoring programmes in healthy animals and food, ensuring representativeness of resistance data, especially in the case of indicator bacteria and Campylobacter spp., whereas antimicrobial resistance data from susceptibility testing of Salmonella spp. have remained more dependent on the prevalence of the bacteria. Moreover, an EQA system, based on regular training and yearly proficiency test trials, is included in resistance monitoring programmes to detect any potential differences between the laboratories performing susceptibility tests relating to methods and interpretative criteria at both national and EU levels, coordinated by the National Reference Laboratories on antimicrobial resistance within each reporting country and the EU Reference Laboratory on antimicrobial resistance. These have contributed to enhance harmonisation of resistance monitoring in food-producing animals in the EU and comparability of resistance data reported.
The effects of consumption of antimicrobials in a given country and animal species, as well as trends in the occurrence of resistance, can be studied more easily in indicator organisms than in food-borne pathogens, such as Salmonella spp., because all food-producing animals generally carry these indicator bacteria. Until recently, monitoring of resistance in indicator E. coli and enterococci was performed on a voluntary basis and limited data were reported by a number of reporting countries to EFSA.
4.4.3. On-going actions to improve the system
The implementation of the EFSA specifications by the EU MSs and other EEA countries has led to more harmonised and comparable data on resistance; nevertheless, further enhancements are still required. In light of the experience accrued from the production of the EU Summary Reports on antimicrobial
ECDC/EFSA/EMA first joint report on the integrated analysis of the consumption of antimicrobial agents and occurrence of antimicrobial resistance in bacteria from humans and food-producing animals 636088/2013 Page 21/114

resistance, the latest scientific opinions issued by EFSA on the issue of resistance and efforts to increase the comparability between the findings from the food and animal sector with those gathered in the humans, EFSA issued considerations and proposals for the revision of existing legislation on monitoring of antimicrobial resistance in 2012.
Subsequently, in 2013, the EC adopted new legislative provisions to improve harmonisation of monitoring and reporting of resistance in food-producing animals and food thereof (Commission Implementing Decision 2013/652/EU (Official Journal of the European Union, 2013)). The new legislation provides for monitoring resistance in indicator commensal E. coli isolates on a mandatory basis. Randomised, representative sampling should no longer be stratified at the level of the different animal species (e.g. Gallus gallus, cattle, pigs) but should be performed at the level of the major food-producing animal populations which are domestically produced, such as broilers, laying hens, fattening pigs, fattening turkeys and veal calves, in order to obtain more informative and comparable results. An aim of such sampling is the collection of data that could be combined with data on consumption of antimicrobials. The harmonised panel of antimicrobials used, in particular for Salmonella spp. and E. coli, is broadened with the inclusion of substances, such as colistin and ceftazidime, that are either important for human health or can provide clearer insight into the mechanisms involved in resistance to extended-spectrum cephalosporins. As regards the laboratory methodologies, microdilution is the method to be used, with concentration ranges including both the EUCAST ECOFF and the EUCAST clinical breakpoint so that comparability with human data is possible. The specific monitoring of ESBL-, AmpC- and carbapenemase-producing Salmonella spp. and indicator commensal E. coli is foreseen. The collection and reporting of data is to be performed at the isolate level, in order to enable more in-depth analyses to be conducted, in particular on the occurrence of multidrug resistance. The Commission Implementing Decision No 2013/652/EU (Official Journal of the European Union, 2013) entered into force in 2014.
5. Methodological considerations and included data
The earlier chapters of this report have summarised the availability and characteristics of data at the European level on antimicrobial consumption and resistance to selected antimicrobials in both humans and food-producing animals and food derived thereof. Derived from these monitoring systems in place in the reporting countries, four fields of data are available, corresponding to data on antimicrobial consumption and resistance in both human and animal populations. These four fields of data and the potential relationships between them which were investigated in this report are illustrated in Figure 1.
The analytical approach followed in this report will primarily address the relationship between consumption and resistance within the animal and human populations (as illustrated by the vertical arrows in Figure 1). The approach will also consider potential additional links that could be established between equivalent data from the two populations—resistance in humans, resistance in animals, consumption in humans and consumption in animals—as illustrated by the horizontal arrows in Figure 1. In fact, any positive association between resistance data in humans and in animals might reflect the transfer of resistant bacteria between the human and animal populations and/or some similarities in the consumption of antimicrobials among human and animal populations. Assessing the existence of these horizontal links will provide relevant information for assessing a potential relationship between antimicrobial consumption in animals and resistance in humans (as illustrated by the diagonal arrow in Figure 1. The relationship between antimicrobial consumption in humans and antimicrobial resistance in food-producing animals was not analysed.
ECDC/EFSA/EMA first joint report on the integrated analysis of the consumption of antimicrobial agents and occurrence of antimicrobial resistance in bacteria from humans and food-producing animals 636088/2013 Page 22/114

Figure 1. Available fields of data related to antimicrobial consumption and resistance in humans and food-producing animals in the reporting countries and the possible relationships investigated in this report
Antimicrobial consumption in
humans
Antimicrobial consumption in
animals
Antimicrobial resistance in
humans
Antimicrobial resistance in
animals
5.1. Consumption of antimicrobials by humans and food-producing animals
5.1.1. Numerator
Data on the quantity of antimicrobials sold for systemic use in humans in 2012 (ATC group J01) are reported by ESAC-Net as numbers of DDD per 1 000 inhabitants per day (ESAC-Net 2012)12. To facilitate a comparison between consumption of antimicrobials for humans and for animals, these data were converted back into mass of active substance per antimicrobial class and country and expressed as tonnes (Table 5). In certain cases, e.g. for combinations such as sulfonamides-trimethoprim, approximations had to be calculated.
When available, data on hospital and community consumption were summed. For countries reporting only community consumption, this figure was used as a surrogate for total consumption.
Figures for consumption, in tonnes, of antimicrobials for food-producing animals (including horses) were taken from the fourth ESVAC report (2012 data; (EMA/ESVAC, 2014); see Table 6). Antimicrobials included were from the following ATCvet groups: QA07A, QG01A, QG01B, QG51A, QJ01, QJ51, QP51A.
5.1.2. Denominator
Data on the human populations covered by surveillance of community consumption of antimicrobials were taken from ESAC-Net. Data on average weights of different age groups (EFSA, 2012a) were used together with Eurostat data on the population in EU-27 in 2012 by one-year age classes to calculate a human EU population and age class weighted average body weight of 62.5 kg (see Annex B, section 2.2). This body weight was used to calculate the biomass of the population under ESAC-Net surveillance.
Data on the biomass of food-producing animals expressed as PCU in 2012 were taken from the fourth ESVAC report (2012 data; (EMA/ESVAC, 2014); see section 4.2.1 and Table 7).
In the following, the term “milligrams per kilogram estimated biomass” will be used as a synonym of “milligrams per human EU population- and age class-weighted biomass” and “milligrams per PCU”.
12 http://www.ecdc.europa.eu/en/publications/Publications/antimicrobial-consumption-europe-esac-net-2012.pdf
ECDC/EFSA/EMA first joint report on the integrated analysis of the consumption of antimicrobial agents and occurrence of antimicrobial resistance in bacteria from humans and food-producing animals 636088/2013 Page 23/114

5.2. Rationale for the analysis of consumption and resistance in bacteria from food-producing animals and humans
Data available on resistance in bacteria recovered from meat and reported by MSs were considered insufficient (i.e. there were too few reporting MSs) for a meaningful investigation of associations between the consumption of antimicrobials in animals and the occurrence of resistance in certain bacteria present on meat (broiler meat, pork and beef).
Bacteria from meat sampled at the point of retail may originate from the intestine or skin of the animals slaughtered, but there are other possible sources of contamination during the subsequent preparation and storage of meat which can also contribute to the bacterial flora at retail. These different potential sources include personnel, equipment and surfaces and provide one possible explanation for the differences in resistance which can be observed when comparing bacteria from animals and bacteria from meat derived from those animals. In particular, indirect selection for bacterial sub-populations, in the immediate environment and on equipment and surfaces of the production line, following exposure to antibacterial substances other than pharmaceuticals, could result in a decrease in susceptibility to antimicrobials (Zou et al., 2014).
A further important consideration is whether the meat sampled represents domestic production or meat which may have been imported; distinguishing between these sources is essential for a meaningful analysis of meat in relation to antimicrobial consumption in animals, because differences in exposure to antimicrobials may occur in different countries. Factors such as the cross-contamination of meat in, for example, cutting plants might also need to be taken into account, because some plants may handle both domestically produced and imported meats.
Thus, a simple analysis between consumption of antimicrobials and resistance in bacteria from meat could be misleading, if adjacent relevant information cannot be assessed. An analysis of associations between antimicrobial consumption in food-producing animals and the degree of resistance occurring in bacteria from meat has therefore not been performed.
5.3. Rationale for selecting particular combinations of organism and antimicrobial for detailed analysis
The limitations relating to the degree to which consumption can be linked to particular species or production types of animals, the occurrence of genetic linkage of antimicrobial resistance genes and the issue of cross-resistance between some or all antimicrobials within an antimicrobial class are all factors which increase the complexity of this type of analysis. The analysis presented here did not attempt to evaluate consumption and resistance for all available combinations of antimicrobials and bacterial organisms, but was done only for selected antimicrobial classes which are considered to be particularly important. Tetracyclines are also included as an example of a broad-spectrum antimicrobial class widely used in animals for a long period of time. Consequently, the analysis did not attempt to evaluate consumption and resistance for all available combinations of antimicrobials and bacterial organisms.
Bacteria and antimicrobial combinations considered of highest priority have been listed or mentioned in several publications, including those of the World Health Organization (WHO) (2007) and Codex Alimentarius (2011), the EC Action Plan on AMR (European Commission, 2011) and the Joint Opinion from the ECDC, EFSA and EMA on antimicrobial resistance focused on zoonotic infections (ECDC/EFSA/EMA/SCENIHR, 2009). Resistance to fluoroquinolones and 3rd- or 4th-generation cephalosporins in Salmonella spp. and E. coli is therefore included because these two antimicrobials constitute the first-line therapy for invasive Gram-negative bacterial infections in humans in many EU
ECDC/EFSA/EMA first joint report on the integrated analysis of the consumption of antimicrobial agents and occurrence of antimicrobial resistance in bacteria from humans and food-producing animals 636088/2013 Page 24/114

MSs. These two classes of antimicrobials have also been considered as two of the classes of antimicrobial agents most urgently requiring management of the risks from antimicrobial resistance. Similarly, macrolides, fluoroquinolones and, on occasions, tetracyclines are used to treat Campylobacter spp. infections in humans when treatment is considered necessary by the clinician (invasive infections with these organisms are rare). Salmonella spp. and Campylobacter spp. are recognised food-borne zoonoses and, although infections in humans may arise from imported food or relate to travel, it is considered important to investigate these combinations. Salmonella spp., in particular, can show extensive resistance, thus compromising treatment options in both humans and animals when treatment is considered necessary.
Resistance to carbapenems is emerging in humans in several bacterial species. Although this class of antimicrobials is not authorised for use in animals, carbapenem resistance in bacteria from animals has been reported in a few cases. Carbapenems are a good example of antimicrobials of major clinical significance the epidemiology of resistance to which seems as yet not to include a significant animal reservoir of resistant organisms (EFSA, 2013).
Tetracycline resistance has been included in the analysis of Campylobacter spp., Salmonella spp. and E. coli because antimicrobials from this class are widely used in animals, particularly in pigs. They also play a possible role in co-selection through the genetic linkage of resistance genes; there are also different patterns of use in humans and animals in the EU. This contrasts with 3rd- and 4th-generation cephalosporins and fluoroquinolones, which have more recently been introduced into veterinary medicine. In most of the reporting countries, resistance to tetracyclines is relatively common in many bacteria from animals, and this differs in many (but not all) cases from the situation for fluoroquinolones and 3rd- and 4th-generation cephalosporins.
On the human side, the consumption of cephalosporins, fluoroquinolones, macrolides and tetracyclines in the community, in hospitals and in total (both in the community and in hospitals) was compared with the occurrence of resistance in E. coli (3rd- and 4th-generation cephalosporins and fluoroquinolones), Salmonella spp. (cephalosporins, fluoroquinolones and tetracyclines) and Campylobacter spp. (fluoroquinolones, macrolides and tetracyclines) from infections in humans, and presented by drug class.
5.4. Method for analysis of the relationship between antimicrobial consumption and resistance
5.4.1. Consumption and resistance data from food-producing animals
Combinations of (sub-)classes of antimicrobials and bacteria of interest were selected and subsequently analysed for any relationship between antimicrobial consumption and resistance in animals (Table 2). Consumption data on the selected antimicrobial (sub-)classes for the years 2011 and 2012, expressed in milligrams per PCU, published elsewhere within the framework of the ESVAC project were used. Consumption data encompass all food-producing animal species, including horses and farmed fish.
Data on resistance to antimicrobial substances of interest in commensal indicator E. coli and zoonotic C. coli, C. jejuni and Salmonella spp. and S. Typhimurium reported by the MSs for the years 2011/2012, and published in the 2011/2012 EU Summary Report on antimicrobial resistance issued by EFSA/ECDC (EFSA/ECDC, 2013; EFSA/ECDC, 2014), were used for the purpose of the analysis. In this framework, resistance was defined as the proportion of isolates exhibiting reduced susceptibility out of the whole set of tested isolates from a given animal species in a country. ECOFFs (defining “microbiological” resistance) were used as interpretative criteria of reduced susceptibility. Data were
ECDC/EFSA/EMA first joint report on the integrated analysis of the consumption of antimicrobial agents and occurrence of antimicrobial resistance in bacteria from humans and food-producing animals 636088/2013 Page 25/114
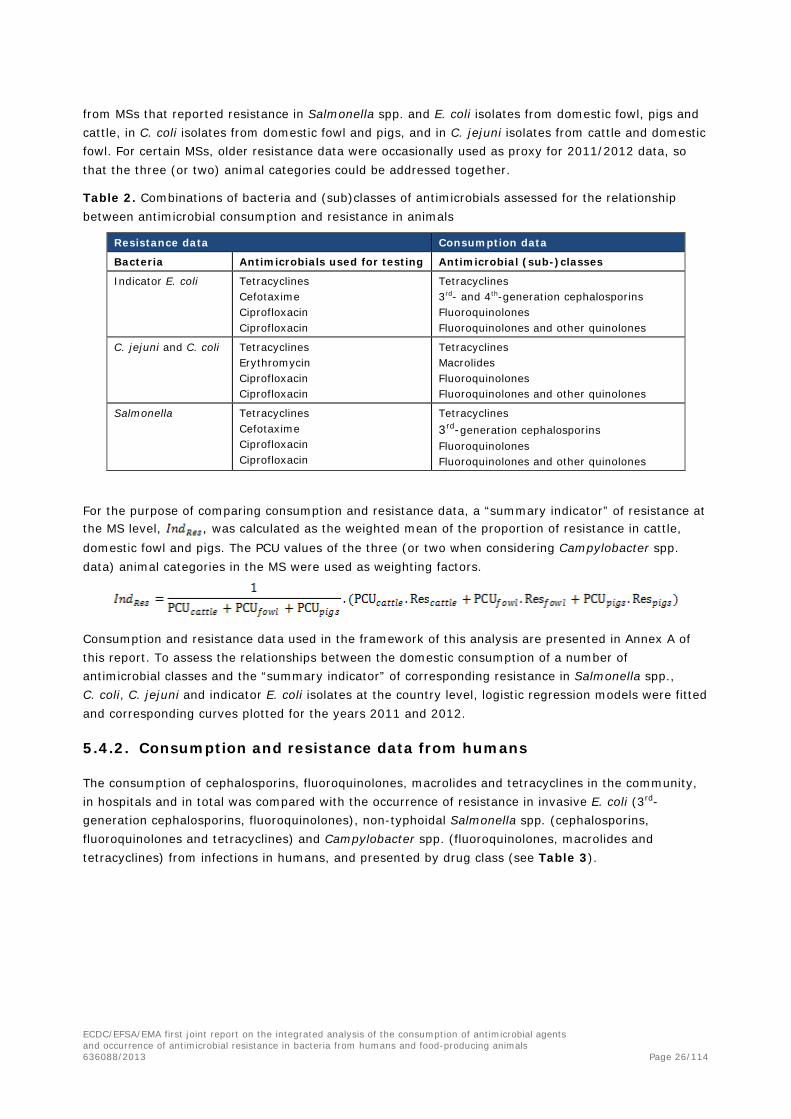
from MSs that reported resistance in Salmonella spp. and E. coli isolates from domestic fowl, pigs and cattle, in C. coli isolates from domestic fowl and pigs, and in C. jejuni isolates from cattle and domestic fowl. For certain MSs, older resistance data were occasionally used as proxy for 2011/2012 data, so that the three (or two) animal categories could be addressed together.
Table 2. Combinations of bacteria and (sub)classes of antimicrobials assessed for the relationship between antimicrobial consumption and resistance in animals
Resistance data Consumption data
Bacteria Antimicrobials used for testing Antimicrobial (sub-)classes
Indicator E. coli Tetracyclines Cefotaxime Ciprofloxacin Ciprofloxacin
Tetracyclines 3rd- and 4th-generation cephalosporins Fluoroquinolones Fluoroquinolones and other quinolones
C. jejuni and C. coli Tetracyclines Erythromycin Ciprofloxacin Ciprofloxacin
Tetracyclines Macrolides Fluoroquinolones Fluoroquinolones and other quinolones
Salmonella Tetracyclines Cefotaxime Ciprofloxacin Ciprofloxacin
Tetracyclines 3rd-generation cephalosporins Fluoroquinolones Fluoroquinolones and other quinolones
For the purpose of comparing consumption and resistance data, a “summary indicator” of resistance at the MS level, , was calculated as the weighted mean of the proportion of resistance in cattle, domestic fowl and pigs. The PCU values of the three (or two when considering Campylobacter spp. data) animal categories in the MS were used as weighting factors.
Consumption and resistance data used in the framework of this analysis are presented in Annex A of this report. To assess the relationships between the domestic consumption of a number of antimicrobial classes and the “summary indicator” of corresponding resistance in Salmonella spp., C. coli, C. jejuni and indicator E. coli isolates at the country level, logistic regression models were fitted and corresponding curves plotted for the years 2011 and 2012.
5.4.2. Consumption and resistance data from humans
The consumption of cephalosporins, fluoroquinolones, macrolides and tetracyclines in the community, in hospitals and in total was compared with the occurrence of resistance in invasive E. coli (3rd-generation cephalosporins, fluoroquinolones), non-typhoidal Salmonella spp. (cephalosporins, fluoroquinolones and tetracyclines) and Campylobacter spp. (fluoroquinolones, macrolides and tetracyclines) from infections in humans, and presented by drug class (see Table 3).
ECDC/EFSA/EMA first joint report on the integrated analysis of the consumption of antimicrobial agents and occurrence of antimicrobial resistance in bacteria from humans and food-producing animals 636088/2013 Page 26/114
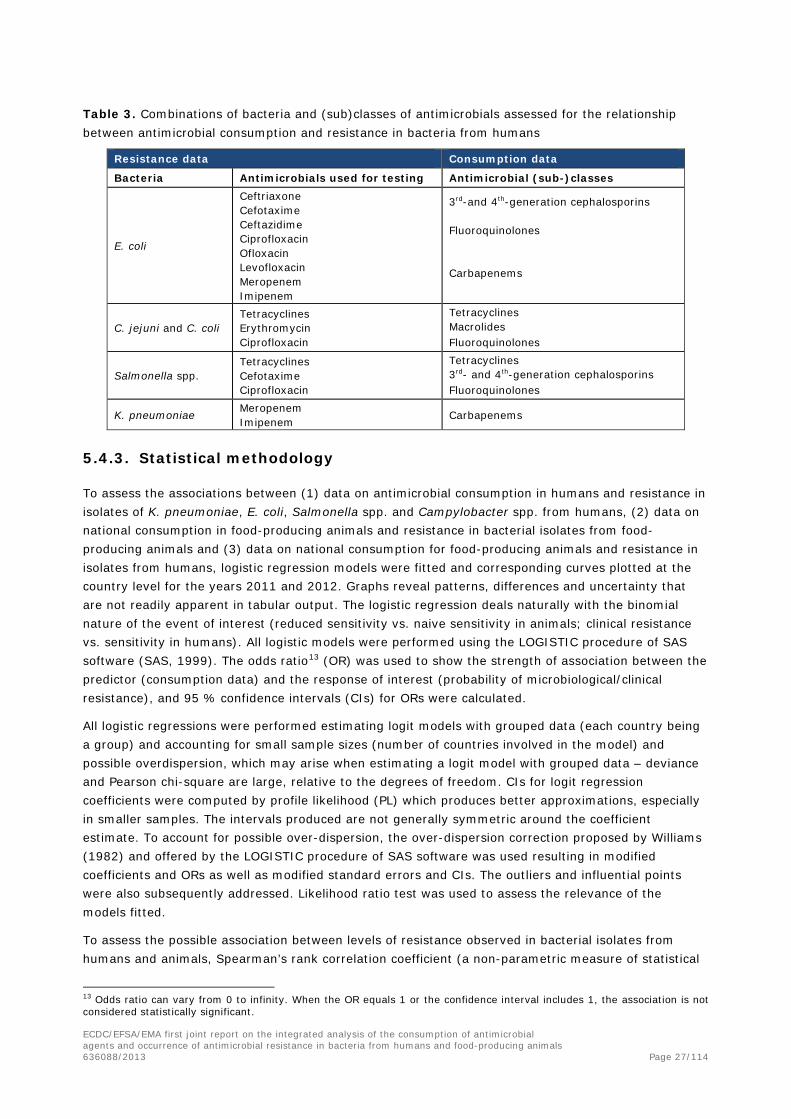
Table 3. Combinations of bacteria and (sub)classes of antimicrobials assessed for the relationship between antimicrobial consumption and resistance in bacteria from humans
Resistance data Consumption data
Bacteria Antimicrobials used for testing Antimicrobial (sub-)classes
E. coli
Ceftriaxone Cefotaxime Ceftazidime Ciprofloxacin Ofloxacin Levofloxacin Meropenem Imipenem
3rd-and 4th-generation cephalosporins
Fluoroquinolones
Carbapenems
C. jejuni and C. coli Tetracyclines Erythromycin Ciprofloxacin
Tetracyclines Macrolides Fluoroquinolones
Salmonella spp. Tetracyclines Cefotaxime Ciprofloxacin
Tetracyclines 3rd- and 4th-generation cephalosporins Fluoroquinolones
K. pneumoniae Meropenem Imipenem Carbapenems
5.4.3. Statistical methodology
To assess the associations between (1) data on antimicrobial consumption in humans and resistance in isolates of K. pneumoniae, E. coli, Salmonella spp. and Campylobacter spp. from humans, (2) data on national consumption in food-producing animals and resistance in bacterial isolates from food-producing animals and (3) data on national consumption for food-producing animals and resistance in isolates from humans, logistic regression models were fitted and corresponding curves plotted at the country level for the years 2011 and 2012. Graphs reveal patterns, differences and uncertainty that are not readily apparent in tabular output. The logistic regression deals naturally with the binomial nature of the event of interest (reduced sensitivity vs. naive sensitivity in animals; clinical resistance vs. sensitivity in humans). All logistic models were performed using the LOGISTIC procedure of SAS software (SAS, 1999). The odds ratio13 (OR) was used to show the strength of association between the predictor (consumption data) and the response of interest (probability of microbiological/clinical resistance), and 95 % confidence intervals (CIs) for ORs were calculated.
All logistic regressions were performed estimating logit models with grouped data (each country being a group) and accounting for small sample sizes (number of countries involved in the model) and possible overdispersion, which may arise when estimating a logit model with grouped data – deviance and Pearson chi-square are large, relative to the degrees of freedom. CIs for logit regression coefficients were computed by profile likelihood (PL) which produces better approximations, especially in smaller samples. The intervals produced are not generally symmetric around the coefficient estimate. To account for possible over-dispersion, the over-dispersion correction proposed by Williams (1982) and offered by the LOGISTIC procedure of SAS software was used resulting in modified coefficients and ORs as well as modified standard errors and CIs. The outliers and influential points were also subsequently addressed. Likelihood ratio test was used to assess the relevance of the models fitted.
To assess the possible association between levels of resistance observed in bacterial isolates from humans and animals, Spearman’s rank correlation coefficient (a non-parametric measure of statistical
13 Odds ratio can vary from 0 to infinity. When the OR equals 1 or the confidence interval includes 1, the association is not considered statistically significant.
ECDC/EFSA/EMA first joint report on the integrated analysis of the consumption of antimicrobial agents and occurrence of antimicrobial resistance in bacteria from humans and food-producing animals 636088/2013 Page 27/114

dependence between two variables) was used, accounting for the fact that levels of resistance were not normally distributed. The same approach was applied where comparing data on consumption of antimicrobials in animals and in humans.
During the preparation of the report, a publication from Chantziaras et al. (2014) was discussed with the main author and one of the co-authors. The publication evaluates associations between antimicrobial consumption and occurrence of resistance in commensal E. coli isolates from pigs, poultry and cattle, using data from publicly available national or international reports from seven European countries using a polynomial regression analysis and determination of Spearman’s rank correlation coefficient. Differences between the approaches taken were that the JIACRA report applied a weighting of resistance data according to PCU and a logistic regression analysis, as they were considered most appropriate for the dataset available for the JIACRA report.
6. Consumption of antimicrobials in humans andfood-producing animals
6.1. Total tonnes of active substance and estimated biomass
In 2012, 3 400 and 7 982 tonnes of active substance of antimicrobials were sold for use in humans and food-producing animals, respectively, in the 26 EU/EEA countries (Table 4). The estimated biomass, expressed as 1 000 tonnes, was 28 884 for humans and 55 421 for animals, respectively. The proportion of the total biomass (sum of the biomass of food-producing animals and humans) accounted for by the human population varied considerably between countries (from 13 to 59%). This variation underlines the need to correct for differences in population size when comparing consumption in humans and food-producing animals.
ECDC/EFSA/EMA first joint report on the integrated analysis of the consumption of antimicrobial agents and occurrence of antimicrobial resistance in bacteria from humans and food-producing animals 636088/2013 Page 28/114

Table 4. Consumption of antimicrobials by humans and food-producing animals, in tonnes, the estimated biomass of the corresponding populations in 1 000 tonnes and consumption expressed as milligrams per kilogram biomass14 in 26 EU/EEA countries in 201215
Country Consumption in hospitals included
Consumption in tonnes active substance Estimated biomass in 1 000 tonnes Consumption in mg/kg biomass
Humans Animals Total Humans16 Animals Total Humans Animals
Austria No 37.1 53.0 90.1 528 966 1 494 70.2 54.9 Belgium Yes 112.7 267.2 379.9 693 1 658 2 351 162.6 161.1 Bulgaria Yes 49.8 38.4 88.2 455 388 843 109.4 98.9 Cyprus Yes 7.8 45.0 52.8 54 113 167 144.4 396.5 Czech Republic No 55.2 53.7 108.9 657 673 1 330 84.1 79.8 Denmark Yes 47.5 107.0 154.5 349 2 424 2 773 136.2 44.1 Estonia Yes 5.9 7.3 13.2 84 131 215 70.1 56.0 Finland Yes 47.3 12.2 59.5 338 511 849 140.1 23.8 France Yes 719.2 761.5 1 480.7 4 092 7 618 11 710 175.8 99.1 Germany No 291.7 1 707.5 1 999.2 4 357 8 338 12 695 66.9 204.8 Hungary No 41.3 178.5 219.8 611 727 1 338 67.5 245.5 Iceland Yes 2.5 0.7 3.2 20 116 136 125.9 5.9 Ireland Yes 41.5 100.0 141.5 286 1 725 2 011 144.9 58.0 Italy Yes 621.6 1 534.3 2 155.9 3 712 4 500 8 212 167.5 341.0 Latvia Yes 11.3 6.7 18.0 128 162 290 88.8 44.1 Lithuania Yes 19.2 13.4 32.6 188 339 527 102.0 39.4 Luxembourg Yes 4.8 2.2 7.0 31 50 81 153.1 43.6 Netherlands Yes 54.5 245.7 300.2 963 3 279 4 242 56.7 74.9 Norway Yes 44.1 7.1 51.2 312 1 851 2 163 141.6 3.8 Poland No 238.5 516.4 754.9 2 408 3 908 6 316 99.0 132.2 Portugal Yes 83.0 156.5 239.5 624 996 1 620 133.1 157.1 Slovakia Yes 39.2 10.2 49.4 338 235 573 115.9 43.2 Slovenia Yes 13.9 6.8 20.7 129 183 312 108.3 37.0 Spain No 320.7 1 693.0 2 013.7 2 954 6 996 9 950 108.6 242.0 Sweden Yes 74.8 10.6 85.4 593 783 1 376 126.2 13.5 United Kingdom No 414.9 447.4 862.3 3 982 6 749 10 731 104.2 66.3 All 3 399.8 7 982.0 11 381.8 28 884 55 421 84 305 116.417 144.0
14 Calculated from the exact figures (not rounded as shown). 15 Many limitations hamper the comparison of consumption of antimicrobials for humans and animals. The estimates presented are crude and must be interpreted with caution. 16 Population covered by data in ESAC-Net. 17 Population-weighted mean.
ECDC/EFSA/EMA first joint report on the integrated analysis of the consumption of antimicrobial agents and occurrence of antimicrobial resistance in bacteria from humans and food-producing animals 636088/2013 Page 29/114

6.2. Reporting consumption in humans by numbers of DDD per 1 000 inhabitants and per day and by milligrams per kilogram estimated biomass
As mentioned earlier, in reports from ESAC-Net the consumption of antimicrobials in humans is reported by use of the indicator DDD per 1 000 inhabitants and per day, while in reports from ESVAC data are presented as milligrams per PCU. Therefore, to facilitate comparisons between the use of antimicrobials in the human and veterinary domains, data from ESAC-Net were converted into milligrams per kilogram estimated biomass. The two measures are not equivalent as the DDD takes differences in dosing into account, while milligrams per kilogram does not. For example, the DDD of phenoxymethylpenicillin is 2 g, while for doxycycline it is 0.1 g. DDD may also vary considerably within an antimicrobial class, for example in the macrolides (range 0.3-3 g). Thus, for example, a country where phenoxymethylpenicillin is preferred over doxycycline and some of the macrolides may well rank low in DDDs per 1 000 inhabitants and per day when compared with a country where the opposite preferences are the case, but much higher in milligrams per kilogram estimated biomass. A scatter plot of the two measures in the dataset is shown in Figure 2 (data from ESAC-Net and Table 4). A significant correlation between measures was observed. The three most notable outliers seen in the graph are all Scandinavian countries, where use of phenoxymethylpenicillin and methenamine is comparatively high. It is possible that this partly explains why these countries rank comparatively low when consumption is expressed as DDD per 1 000 inhabitants and per day and relatively higher when expressed as milligrams per kilogram estimated biomass.
Figure 2. Scatter plot of consumption in humans reported as total DDD per 1 000 inhabitants and per day and total milligrams of active substance per kilogram estimated biomass for the 26 countries included (data for 2012)
Note: Spearman’s rank correlation, rho = 0.87; p-value < 0.0001
6.3. Population biomass-corrected consumption of antimicrobials in humans and food-producing animals
A comparison of average consumption of antimicrobials for humans and food-producing animals, expressed as milligrams per kilogram estimated biomass, is shown in Figure 3 and Table 4. When comparing the consumption of antimicrobials in the human and food-producing animal domains in 2012, the average consumption expressed in milligrams per kilogram of estimated biomass was 116.4 mg/kg in humans (range 56.7–175.8 mg/kg) and 144.0 mg/kg in animals (range 3.8–396.5 mg/kg).
ECDC/EFSA/EMA first joint report on the integrated analysis of the consumption of antimicrobial agents and occurrence of antimicrobial resistance in bacteria from humans and food-producing animals 636088/2013 Page 30/114
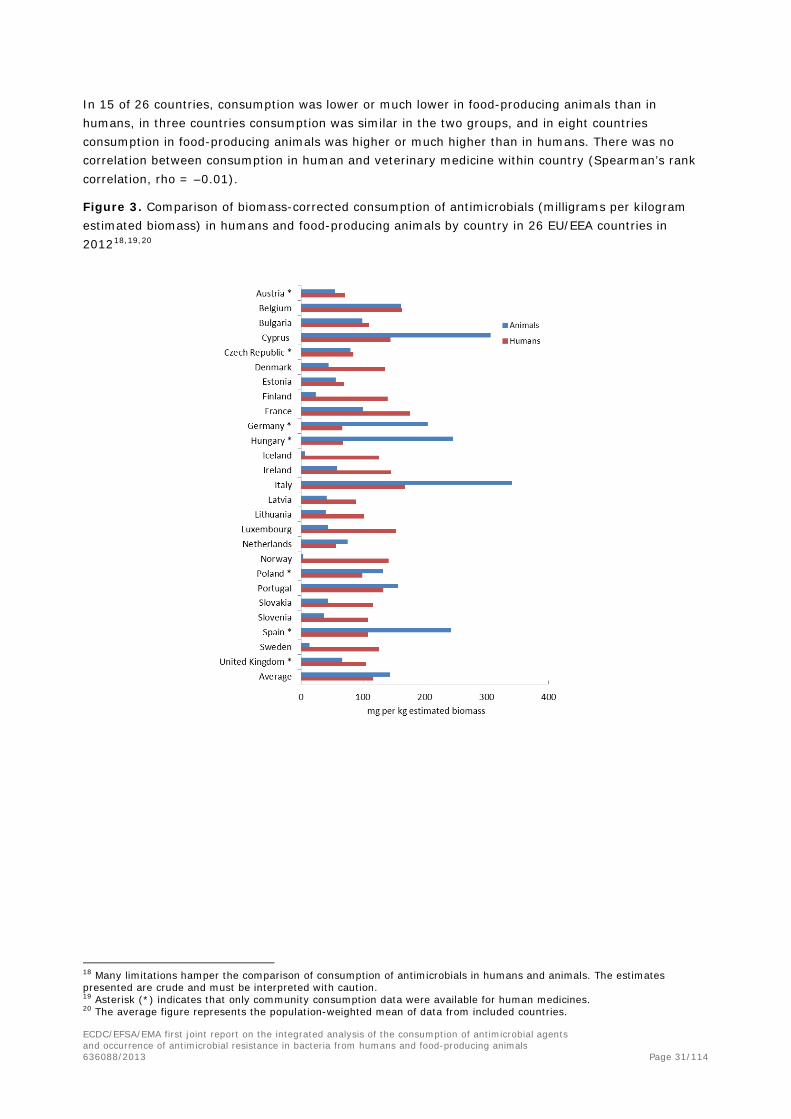
In 15 of 26 countries, consumption was lower or much lower in food-producing animals than in humans, in three countries consumption was similar in the two groups, and in eight countries consumption in food-producing animals was higher or much higher than in humans. There was no correlation between consumption in human and veterinary medicine within country (Spearman’s rank correlation, rho = –0.01).
Figure 3. Comparison of biomass-corrected consumption of antimicrobials (milligrams per kilogram estimated biomass) in humans and food-producing animals by country in 26 EU/EEA countries in 201218,19,20
18 Many limitations hamper the comparison of consumption of antimicrobials in humans and animals. The estimates presented are crude and must be interpreted with caution. 19 Asterisk (*) indicates that only community consumption data were available for human medicines. 20 The average figure represents the population-weighted mean of data from included countries.
ECDC/EFSA/EMA first joint report on the integrated analysis of the consumption of antimicrobial agents and occurrence of antimicrobial resistance in bacteria from humans and food-producing animals 636088/2013 Page 31/114

Figure 4. a–c. Comparison of consumption of selected antimicrobial classes for humans and food-producing animals in 26 EU/EEA countries in 2012
Note that the scale on the y-axis differs between the figures21,22
a.
b.
c.
21 Many limitations hamper the comparison of consumption of antimicrobials in humans and animals. The estimates presented are crude and must be interpreted with caution. 22 Classes not included for human medicine were glycopeptides, imidiazoles, nitrofurans, streptogramins, stereoid antimicrobials and other antimicrobials (ATC code J01XX). Substances not included for food-producing animals were bacitracin, paromycin and spectinomycin.
ECDC/EFSA/EMA first joint report on the integrated analysis of the consumption of antimicrobial agents and occurrence of antimicrobial resistance in bacteria from humans and food-producing animals 636088/2013 Page 32/114
6.4. Comparison of overall consumption, expressed as milligrams per kilogram estimated biomass, by antimicrobial class
Consumption of selected antimicrobial classes, aggregated for the 26 EU/EEA countries, is shown in Figure 4. Penicillins, macrolides and fluoroquinolones were the highest selling classes in human medicine, when expressed as milligrams per kilogram estimated biomass. For food-producing animals, tetracyclines, penicillins and sulfonamides were the highest selling classes. Monobactams and carbapenems are not approved for use in food-producing animals in EU/EEA countries and no such consumption was reported for food-producing animals. Likewise, pleuromutilins are not authorised for systemic use in humans and no such consumption was reported for humans. Population-corrected consumption of penicillins, cephalosporins (all generations) and fluoroquinolones for humans, expressed as milligrams per kilogram estimated biomass, was higher than consumption of these classes for food-producing animals. For the other classes included in the figures, the opposite was the case.
6.5. Comparison of consumption, expressed as milligrams per kilogram estimated biomass, of 3rd- and 4th-generation cephalosporins by country
Third- and 4th-generation cephalosporins are regarded by the WHO as CIAs of highest priority. The average consumption (population-weighted mean) of 3rd- and 4th-generation cephalosporins for humans and food-producing animals was 3.50 and 0.24 mg/kg estimated biomass, respectively. The corresponding ranges were 0.02–12.52 and < 0.01–0.68 mg/kg, respectively. In Figure 5 the biomass-corrected consumption for humans and food-producing animals is shown by country. Generally, in human medicine, 3rd- and 4th-generation cephalosporins are mostly used in hospitals. In a majority (16 of 20) of the countries from which data from both community and hospitals were reported, > 70 % of the consumption of 3rd- and 4th-generation cephalosporins expressed as milligrams per kilogram estimated biomass occurred in hospitals (range 30–98 %). Therefore, figures for countries where only data on community consumption are available are probably considerably underestimated in the case of 3rd- and 4th-generation cephalosporins. Nevertheless, consumption in food-producing animals was, with two exceptions, much lower than in human medicine. In both cases, this was observed in countries that did not report consumption for hospitals. It is likely that, if data on hospital consumption had been available in these countries, consumption for food-producing animals would have been lower than the total consumption for humans in these countries as well. There was no correlation within country between consumption of 3rd- and 4th-generation cephalosporins for humans and for food-producing animals (Spearman’s rank correlation, rho = 0.32).
ECDC/EFSA/EMA first joint report on the integrated analysis of the consumption of antimicrobial agents and occurrence of antimicrobial resistance in bacteria from humans and food-producing animals 636088/2013 Page 33/114

Figure 5. Biomass-corrected consumption of 3rd- and 4th-generation cephalosporins for humans and food-producing animals by country in 26 EU/EEA countries in 201223,24,25
6.6. Comparison of consumption, expressed as milligrams per kilogram estimated biomass, of fluoroquinolones by country
Fluoroquinolones are regarded by the WHO as CIAs of highest priority. The population-weighted mean consumption of fluoroquinolones in humans and food-producing animals was 7.04 and 2.47 mg/kg estimated biomass, respectively. The corresponding ranges were 2.24–16.03 and 0.01–10.98 mg/kg, respectively. Population-corrected consumption in humans and food-producing animals by country is shown in Figure 6.
In contrast to the 3rd- and 4th-generation cephalosporins, in human medicine fluoroquinolones are mostly used in the community. In the countries with complete datasets, consumption in hospitals ranged from 3 to 23 % of the total consumption expressed as milligrams per kilogram estimated biomass. Thus, underestimation of the consumption in humans is less of a problem for this class than for 3rd- and 4th-generation cephalosporins. Overall, in most countries the consumption of fluoroquinolones was lower in food-producing animals than in humans, but the difference was less striking than for the 3rd- and 4th-generation cephalosporins. Also, the variation between countries in the quantity of fluoroquinolones used by humans or animals was very wide. There was a significant correlation within country between consumption of fluoroquinolones in humans and food-producing animals (Spearman’s rank correlation, rho = 0.63, p-value = 0.0005).
23 Many limitations hamper the comparison of consumption of antimicrobials in humans and food-producing animals. The estimates presented are crude and must be interpreted with caution. 24 Asterisk (*) denotes that only community consumption data were available for human medicine. Figures for human sales in these countries probably represent a considerable underestimate. 25 The average figure represents the population weighted-mean of data from included countries.
ECDC/EFSA/EMA first joint report on the integrated analysis of the consumption of antimicrobial agents and occurrence of antimicrobial resistance in bacteria from humans and food-producing animals 636088/2013 Page 34/114

Figure 6. Population-corrected consumption of fluoroquinolones for humans and food-producing animals by country in 26 EU/EEA countries in 201226,27,28
6.7. Discussion on comparison of consumption
6.7.1. Limitations
About 10 % of the total consumption of antimicrobials, expressed as DDD per 1 000 inhabitants, is used in hospitals, but, when expressed as tonnes of active substance, the proportion of hospital consumption of the overall consumption in those 19 countries providing data from both the community and hospital sector (Table 4) varied between 13 and 28 %. This may give an indication of the magnitude of the underestimates in the six countries that provided only figures on community consumption in the comparisons presented in this report.
Data coverage in the monitoring of community consumption (human medicine) is not 100 % in all included countries. Countries with less than 95 % data coverage for community consumption were Germany (85 %) and the Netherlands (92 %). In those countries, the consumption expressed as tonnes, without correction for population or biomass, will be an underestimate.
The criteria for inclusion of antimicrobials were not identical in the human and animal surveillance systems, as data for animals are not limited to antimicrobials for systemic use (QJ01). In human medicine, antimicrobials are also found in ATC groups other than J01 (e.g. A07 and J04). Thus, nominator data for human medicine are an underestimate of the total consumption.
26 Many limitations hamper the comparison of consumption of antimicrobials in humans and food-producing animals. The estimates presented are crude and must be interpreted with caution. 27 Asterisk (*) denotes that only community consumption data were available for human medicine. 28 The average figure represents the population-weighted mean of data from included countries.
ECDC/EFSA/EMA first joint report on the integrated analysis of the consumption of antimicrobial agents and occurrence of antimicrobial resistance in bacteria from humans and food-producing animals 636088/2013 Page 35/114

The weights used to estimate human biomass are derived from different published surveys. It is uncertain how representative the weights used are for the EU human populations in 2012. For example, Swedish data indicate that elderly people have a lower average weight than younger adults29.
The denominator data for consumption of antimicrobials for animals are a sum of the biomass of different food-producing species. The consumption of antimicrobials varies considerably between the various animal species and production types. Differences between countries can partly be explained by differences in animal demographics. This must be taken into account when interpreting data. Information on the composition of the animal populations (expressed as PCU) can be found in the fourth ESVAC report (EMA/ESVAC, 2014); see also Table 7 in the present report.
For the estimation of biomass of the populations of live food-producing animals, standard weights at an age when animals are most likely to receive treatment are used, whereas the calculated human EU population- and age class-weighted biomass is based on an EU average weight. Thus, the calculations of the two denominators are not based on the same principle. Data on consumption of antimicrobials by age class are reported to ESAC-Net by only a few countries. In many countries, the consumption of antimicrobials is probably higher in children, adolescents and the elderly than in adults in general, but this could not be taken into consideration because of the lack of data. Consequently, the biomass estimated by use of the standard weight of 62.5 kg may be an overestimate and must be interpreted with caution.
Only datasets from countries with data available on consumption of antimicrobials for both humans and food-producing animals were included, which totalled 26 EU/EEA countries.
6.7.2. Discussion on results
When comparing the consumption of antimicrobials in the human and food-producing animal domains in 2012, the average consumption expressed in milligrams per kilogram of estimated biomass was 116.4 mg/kg in humans (range 56.7-175.8 mg/kg) and 144.0 mg/kg in animals (range 3.8-396.5 mg/kg). Consumption in food-producing animals was lower or much lower than in humans in 15 of 26 countries, in three countries it was similar, and in eight countries consumption in food-producing animals was higher or much higher than in humans, but the overall consumption of antimicrobials (population weighted mean) was higher for animals than for humans. This is because four of the countries where consumption of antimicrobials for animals was higher than for humans are also countries with large food-producing animal populations, thereby having a large impact on the average.
The consumption of 3rd- and 4th-generation cephalosporins was much lower for animals than for humans. This antimicrobial class is predominantly used in hospitals, and therefore the comparison may be misleading for countries not reporting such hospital consumption. This is less problematic for the consumption of fluoroquinolones, where community consumption dominates. In most countries, the consumption of fluoroquinolones was lower for animals than for humans, but there was more variation between countries than for cephalosporins. There was a significant but weak correlation (Spearman’s rank correlation, rho = 0.63) between within-country consumption of fluoroquinolones for humans and food-producing animals. This is probably explained by a cluster of countries with comparatively high consumption both for humans and for animals.
As mentioned, limitations hamper the comparison of consumption of antimicrobials for humans and food-producing animals. The estimates presented here are crude and must be interpreted with caution.
29 http://www.scb.se/sv_/Hitta-statistik/Statistik-efter-amne/Levnadsforhallanden/Levnadsforhallanden/Undersokningarna-av-levnadsforhallanden-ULFSILC/12202/12209/
ECDC/EFSA/EMA first joint report on the integrated analysis of the consumption of antimicrobial agents and occurrence of antimicrobial resistance in bacteria from humans and food-producing animals 636088/2013 Page 36/114
Still, they are based on the best existing data at this time. The main weakness is that the indicator used, i.e. milligrams per kilogram biomass, does not take into account differences in dosing between the antimicrobials and between human and animals. To improve this, an agreed and comparable unit of measurement is needed. Furthermore, for more meaningful discussions, data at an animal species level are needed. Nevertheless, the presented data illustrate that there are wide variations between countries both in the overall consumption figures and in the consumption of the 3rd- and 4th-generation cephalosporins and fluoroquinolones.
7. Antimicrobial consumption in food-producing animals andresistance in bacteria from food-producing animals
7.1. Comparison between consumption of antimicrobials for food-producing animals and resistance in food-producing animals
Significant positive associations between antimicrobial consumption and resistance in food-producing animals were generally observed for the combinations of bacteria/antimicrobial substances considered, the different relationships observed for the years 2012 and 2011 are illustrated graphically In Figure 7-Figure 10 in this section, and in Figure 26-Figure 29, in Annex D.
A high degree of variability in the consumption of, and resistance to, tetracyclines (Figure 7/Figure 26) was observed among the countries that addressed indicator E. coli, Salmonella spp., C. coli and C. jejuni in both years studied (12, 10, 5 and 9 countries respectively. For C. coli isolates, the low number of country points made the association less obvious. Overall, positive associations between national consumption of tetracyclines in animals and resistance to tetracycline in bacterial isolates from the animal species considered were observed, but were of only borderline statistical significance when considering data on Salmonella spp. in 2011 and on C. coli in 2012. Considering data on C. jejuni in 2011 and 2012, the removal of the outlier/influential points on the far right of the graphs did not modify the significance of the positive association.
Data on resistance to cefotaxime in indicator E. coli and isolates of Salmonella spp. from cattle, domestic fowl and pigs, available in 11 and 10 countries, respectively, were compared with data on consumption of 3rd- and 4th-generation cephalosporins in both years studied (Figure 8/Figure 27). Although some disparity in consumption of 3rd- and 4th-generation cephalosporins was recorded among the countries considered, cefotaxime resistance in both types of bacteria was typically reported at low levels. Nevertheless, logistic regression analyses showed positive associations between the quantity of 3rd- and 4th-generation cephalosporins consumed at country level and the risk of reduced susceptibility to cefotaxime, although observed at a borderline significance regarding isolates of Salmonella spp. in 2012.
A similar pattern, in which the relationship is characterised by variation in the quantity of macrolides used in food-producing animals in the reporting countries involved and low levels of corresponding resistance to erythromycin, was also observed, although to a lesser degree, considering data on C. jejuni isolates in nine countries in 2011 and 2012. In C. coli, higher levels of resistance to erythromycin were reported in the five countries included in the analysis in both years (Figure 9/Figure 28). In both Campylobacter spp., significant positive associations between consumption and resistance were observed. Removal of the influential points shown on the far right of the graphs for both C. coli and C. jejuni in 2012 altered the significance of the positive association; the association was therefore significantly affected by some countries.
Regarding the relationship between national consumption of fluoroquinolones and other quinolones and the risk of reduced susceptibility to ciprofloxacin, associations were assessed in indicator E. coli,
ECDC/EFSA/EMA first joint report on the integrated analysis of the consumption of antimicrobial agents and occurrence of antimicrobial resistance in bacteria from humans and food-producing animals 636088/2013 Page 37/114

Salmonella spp., C. coli and C. jejuni isolates through data reported by 8, 11, 5 and 9 countries, respectively (Figure 10/Figure 29). A third relationship pattern was typically observed for E. coli, C. jejuni, C. coli and Salmonella spp. with two distinct groups of MSs, with one group reporting low amounts of consumption and lower resistance and the other group reporting high amounts of consumption and higher resistance, the latter group playing an important role in the assessment of the relationship between use and resistance.
Figure 7. Logistic regression analysis curves with OR estimates and 95 % profile-likelihood confidence intervals (PL CIs) of the national consumption of tetracyclines in food-producing animals and the probability of “microbiological” resistance to tetracyclines in (a) indicator E. coli isolates (MIC > 8 mg/L) from cattle, domestic fowl and pigs, (b) Salmonella spp. isolates (MIC > 8 mg/L) from cattle, domestic fowl and pigs and (c) C. jejuni isolates (MIC > 2 mg/L) from cattle and domestic fowl for the year 20121—dots represent the countries included in the analysis.
a. indicator E. coli isolates b. Salmonella spp. isolates
Countries included: AT, BE, CH, DE, DK, ES, FI, FR, NL, NO, PL, SE
Countries included: BE, DE, DK, EE, ES, FI, IT, LV, NL, SE
p-value < 0.05; OR = 1.032; 95 % PL CI: [1.019, 1.047] p-value < 0.05; OR = 1.016; 95 % PL CI: [1.000, 1.034] Note: the association remains significantly positive after
ignoring the point displayed on the graph upper right corner: p-value < 0.05; OR = 1.033; 95 % PL CI: [1.014, 1.052]
c. C. jejuni isolates
Countries included: AT, CH, DE, DK, ES, FI, IT, NL, NO p-value < 0.05; OR = 1.026; 95 % PL CI: [1.006, 1.050]
Note: the association remains significantly positive after ignoring the point displayed on the middle right side of the graph: p-
value < 0.05; OR = 1.038; 95 % PL CI: [1.012, 1.073]
ECDC/EFSA/EMA first joint report on the integrated analysis of the consumption of antimicrobial agents and occurrence of antimicrobial resistance in bacteria from humans and food-producing animals 636088/2013 Page 38/114

1In the absence of 2012 resistance data, proxy data for years prior to 2012 may have been used.
Figure 8. Logistic regression analysis curves with OR estimates and 95 % PL CIs of the national consumption of 3rd-generation cephalosporins in food-producing animals and the probability of “microbiological” resistance to cefotaxime in (a) indicator E. coli isolates (MIC > 0.25 mg/L) from cattle, domestic fowl and pigs and (b) Salmonella spp. isolates (MIC > 0.5 mg/L) from cattle, domestic fowl and pigs for the year 20121—dots represent the countries involved in the analysis
a. indicator E. coli isolates
Countries included: AT, BE, CH, DE, DK, ES, FI, NL, NO, PL, SE
p-value < 0.05; OR0.1-unit increment = 1.429; 95 % PL CI: [1.079, 1.930]
b. Salmonella spp. isolates
Countries included: BE, DE, DK, EE, ES, FI, IE, IT, NL, SE p-value < 0.05; OR0.1-unit increment = 1.186; 95 % PL CI: [0.752, 1.967]
1In the absence of 2012 resistance data, proxy data for years prior to 2012 may have been used.
ECDC/EFSA/EMA first joint report on the integrated analysis of the consumption of antimicrobial agents and occurrence of antimicrobial resistance in bacteria from humans and food-producing animals 636088/2013 Page 39/114

Figure 9. Logistic regression analysis curves with OR estimates and 95 % PL CIs of the national consumption of macrolides in food-producing animals and the probability of “microbiological” resistance to erythromycin in (a) C. coli isolates (MIC > 16 mg/L) from domestic fowl and pigs and (b) C. jejuni isolates (MIC > 4 mg/L) from cattle and domestic fowl for the year 20121—dots represent the countries involved in the analysis
a. C. coli isolates
Countries included: CH, ES, FR, HU, NL p-value < 0.05; OR = 1.192; 95 % PL CI: [1.118, 1.278]
b. C. jejuni isolates
Countries included: AT, CH, DE, DK, ES, FI, IT, NL, NO p-value < 0.05; OR = 1.091; 95 % PL CI: [1.018, 1.176]
1In the absence of 2012 resistance data, proxy data for years prior to 2012 may have been used.
ECDC/EFSA/EMA first joint report on the integrated analysis of the consumption of antimicrobial agents and occurrence of antimicrobial resistance in bacteria from humans and food-producing animals 636088/2013 Page 40/114

Figure 10. Logistic regression analysis curves with OR estimates and 95 % PL CIs of the national consumption of (A) fluoroquinolones and (B) fluoroquinolones and other quinolones in food-producing animals and the probability of “microbiological” resistance to ciprofloxacin in (1) indicator E. coli isolates (MIC > 0.03 mg/L) from cattle, domestic fowl and pigs, (2) Salmonella spp. isolates (MIC > 0.06 mg/L) from cattle, domestic fowl and pigs and (3) C. jejuni isolates (MIC > 1 mg/L) from cattle and domestic fowl for the year 20121—dots represent the countries involved in the analysis
1) indicator E. coli isolates
a.
Countries included: AT, BE, CH, DE, DK, ES, FR, NL, PL p-value < 0.05; OR = 1.170; 95 % PL CI: [1.015, 1.344]
b.
Countries included: AT, BE, CH, DE, DK, ES, FR, NL, PL p-value < 0.05; OR = 1.195; 95 % PL CI: [1.052, 1.356]
Note: the association remains not significantly after ignoring the two points displayed on the right side of the graph: p-
value < 0.05; OR = 2.415; 95 % PL CI: [1.596, 3.652]
1In the absence of 2012 resistance data, proxy data for years prior to 2012 may have been used.
ECDC/EFSA/EMA first joint report on the integrated analysis of the consumption of antimicrobial agents and occurrence of antimicrobial resistance in bacteria from humans and food-producing animals 636088/2013 Page 41/114

2) Salmonella spp. isolates
a.
Countries included: BE, DE, DK, EE, ES, FI, IE, IT, LV, NL, SE OR = 1.198; 95 % PL CI: [0.896, 1.536] – not significant
Note: the association remains not significantly positive after ignoring the point displayed on the right side of the graph:
OR = 1.761; 95 % PL CI: [0.717, 4.173]
b.
Countries included: BE, DE, DK, EE, ES, FI, IE, IT, LV, NL, SE p-value < 0.05; OR = 1.162; 95 % PL CI: [0.970, 1.379]
Note: the association is significantly positive after ignoring the two points displayed on the right side of the graph:
p-value < 0.05; OR = 3.132; 95 % PL CI: [1.484, 6.912]
1In the absence of 2012 resistance data, proxy data for years prior to 2012 may have been used.
ECDC/EFSA/EMA first joint report on the integrated analysis of the consumption of antimicrobial agents and occurrence of antimicrobial resistance in bacteria from humans and food-producing animals 636088/2013 Page 42/114

3) C. jejuni isolates
a.
Countries included: AT, CH, DE, DK, ES, FI, IT, NL, NO p-value < 0.05; OR = 1.496; 95 % PL CI: [1.208, 1.971]
Note: the association remains significantly positive after ignoring the point displayed on the upper right corner of the graph: p-value < 0.05;
OR = 1.970; 95 % PL CI: [1.124, 3.617]
b.
Countries included: AT, CH, DE, DK, ES, FI, IT, NL, NO p-value < 0.05; OR = 1.236; 95 % PL CI: [1.056, 1.445]
1In the absence of 2012 resistance data, proxy data for years prior to 2012 may have been used.
ECDC/EFSA/EMA first joint report on the integrated analysis of the consumption of antimicrobial agents and occurrence of antimicrobial resistance in bacteria from humans and food-producing animals 636088/2013 Page 43/114

7.2. Discussion of the comparison between consumption of antimicrobials in food-producing animals and resistance in bacteria from food-producing animals
7.2.1. Limitations of data
This analysis aimed at investigating the potential relationships between data on antimicrobial consumption in food-producing animals and resistance to antimicrobials in food-producing animals, collected under the framework of the existing monitoring systems of consumption and resistance at the EU/EEA level. A summary indicator of resistance embracing the different animal species addressed by resistance monitoring was first constructed and then compared with data on the national consumption of antimicrobials in food-producing animal species at the country level. The number of substances sold, per animal species, could not be inferred from the national overall consumption data, usually because of variable consumption of a given substance among the various food-producing animal species addressed. Nevertheless, although consumption data referred to all food-producing animal species and “summary indicators” of resistance covered only three animal species in the case of E. coli and Salmonella spp. and two species regarding Campylobacter spp., the summary indicators of resistance still enabled the comparison with consumption data to be made, as these species are the most important ones in terms of population size, production and consumption of antimicrobial substances.
The calculation of the summary indicator of resistance, at the country level, incorporated resistance data from the three/two animal species according to the bacterium considered, and a number of countries were discarded from the analysis because of insufficient resistance data relating to one or two animal species. In order to maximise the number of countries involved in the analysis, proxy data on resistance, assessed in years prior to 2011/2012, were used to compute the summary indicators of resistance for the years 2011 and 2012. Nevertheless, the prerequisite of having available resistance data for the animal species meant that this approach resulted in a limited number of countries being included in the analysis. Inclusion of additional countries in the analysis, in particular those reporting intermediate amounts of consumption and levels of resistance, would have allowed better assessment of the relationships between consumption and resistance; a striking example concerns the assessment of the association between consumption of fluoroquinolones or fluoroquinolones plus other quinolones and the resistance to ciprofloxacin, which was driven by two groups of countries with very different profiles in terms of both consumption and resistance. The data available for the analysis did not include data from countries with intermediate situations, which hampers the validation of the assumed linearity between exposure and risk.
The limited number of countries involved in the analysis, and the particular situations in some of them (outliers) regarding amounts of consumption and levels of resistance, may partially explain the overdispersion phenomenon observed in these data. Overdispersion can also arise from dependence among the observations related to unobserved heterogeneity that operates at the level of groups rather than individuals. Isolates are grouped into naturally occurring clusters, in this case into countries. It seems reasonable to suppose that isolates originating from the same country (i.e. the same domestic production sectors) are not independent, as they are exposed to many common factors, such as clonal spread within sectors, biosecurity levels, management and husbandry practices and/or varying prescribing practices across countries, that may produce the same outcome (antimicrobial susceptibility status).
The weighting factor is based on the relative PCU of the animal species included in the analyses used as a relative indicator of the size of the animal reservoir of bacteria; it does not account for the prevalence of the bacterial species (Salmonella spp., Campylobacter spp.) in these animal species. While indicator E. coli and Campylobacter spp. isolates mainly derive from active monitoring
ECDC/EFSA/EMA first joint report on the integrated analysis of the consumption of antimicrobial agents and occurrence of antimicrobial resistance in bacteria from humans and food-producing animals 636088/2013 Page 44/114
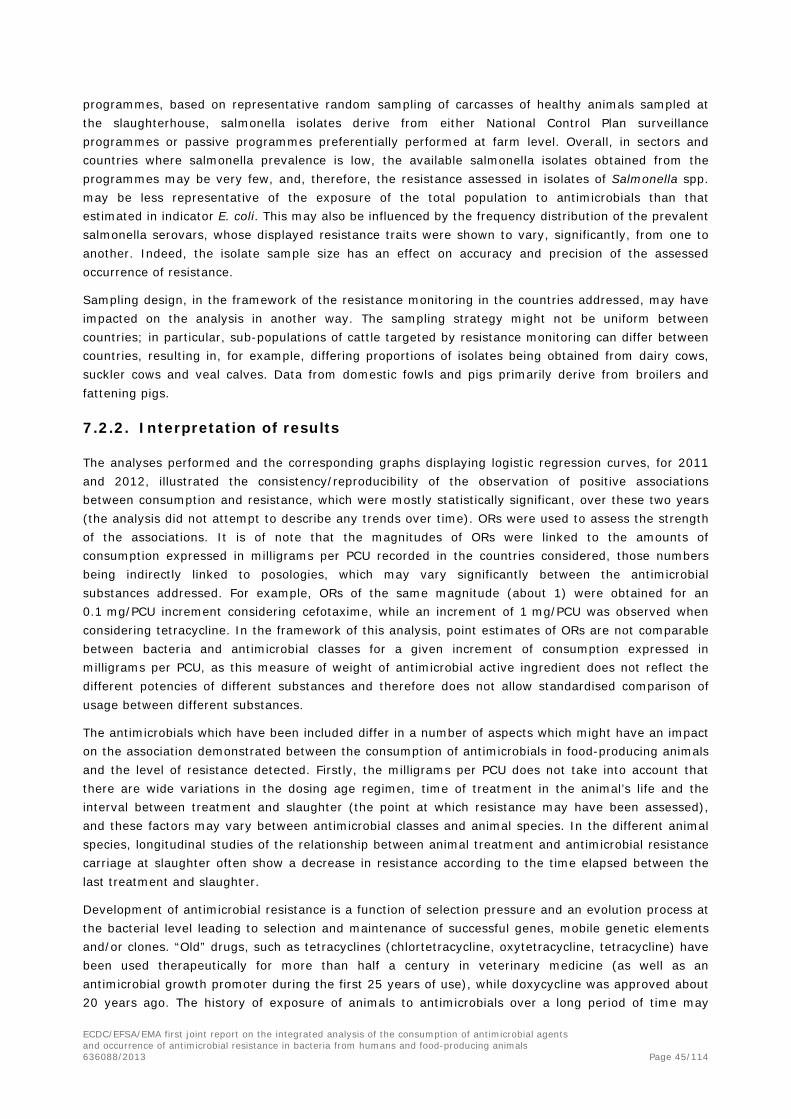
programmes, based on representative random sampling of carcasses of healthy animals sampled at the slaughterhouse, salmonella isolates derive from either National Control Plan surveillance programmes or passive programmes preferentially performed at farm level. Overall, in sectors and countries where salmonella prevalence is low, the available salmonella isolates obtained from the programmes may be very few, and, therefore, the resistance assessed in isolates of Salmonella spp. may be less representative of the exposure of the total population to antimicrobials than that estimated in indicator E. coli. This may also be influenced by the frequency distribution of the prevalent salmonella serovars, whose displayed resistance traits were shown to vary, significantly, from one to another. Indeed, the isolate sample size has an effect on accuracy and precision of the assessed occurrence of resistance.
Sampling design, in the framework of the resistance monitoring in the countries addressed, may have impacted on the analysis in another way. The sampling strategy might not be uniform between countries; in particular, sub-populations of cattle targeted by resistance monitoring can differ between countries, resulting in, for example, differing proportions of isolates being obtained from dairy cows, suckler cows and veal calves. Data from domestic fowls and pigs primarily derive from broilers and fattening pigs.
7.2.2. Interpretation of results
The analyses performed and the corresponding graphs displaying logistic regression curves, for 2011 and 2012, illustrated the consistency/reproducibility of the observation of positive associations between consumption and resistance, which were mostly statistically significant, over these two years (the analysis did not attempt to describe any trends over time). ORs were used to assess the strength of the associations. It is of note that the magnitudes of ORs were linked to the amounts of consumption expressed in milligrams per PCU recorded in the countries considered, those numbers being indirectly linked to posologies, which may vary significantly between the antimicrobial substances addressed. For example, ORs of the same magnitude (about 1) were obtained for an 0.1 mg/PCU increment considering cefotaxime, while an increment of 1 mg/PCU was observed when considering tetracycline. In the framework of this analysis, point estimates of ORs are not comparable between bacteria and antimicrobial classes for a given increment of consumption expressed in milligrams per PCU, as this measure of weight of antimicrobial active ingredient does not reflect the different potencies of different substances and therefore does not allow standardised comparison of usage between different substances.
The antimicrobials which have been included differ in a number of aspects which might have an impact on the association demonstrated between the consumption of antimicrobials in food-producing animals and the level of resistance detected. Firstly, the milligrams per PCU does not take into account that there are wide variations in the dosing age regimen, time of treatment in the animal’s life and the interval between treatment and slaughter (the point at which resistance may have been assessed), and these factors may vary between antimicrobial classes and animal species. In the different animal species, longitudinal studies of the relationship between animal treatment and antimicrobial resistance carriage at slaughter often show a decrease in resistance according to the time elapsed between the last treatment and slaughter.
Development of antimicrobial resistance is a function of selection pressure and an evolution process at the bacterial level leading to selection and maintenance of successful genes, mobile genetic elements and/or clones. “Old” drugs, such as tetracyclines (chlortetracycline, oxytetracycline, tetracycline) have been used therapeutically for more than half a century in veterinary medicine (as well as an antimicrobial growth promoter during the first 25 years of use), while doxycycline was approved about 20 years ago. The history of exposure of animals to antimicrobials over a long period of time may
ECDC/EFSA/EMA first joint report on the integrated analysis of the consumption of antimicrobial agents and occurrence of antimicrobial resistance in bacteria from humans and food-producing animals 636088/2013 Page 45/114

differ between the reporting countries, and prolonged exposure is likely to lead to the selection of different resistance genes and mobile genetic elements and their stable establishment in the different animal species. Consequently, the consumption of a given class of substances recorded in a country does not necessarily reflect the cumulative consumption of the class over time. This can be contrasted with the fluoroquinolones, which have been marketed in most countries for about 20 years, and consumption of which is generally much lower than consumption of tetracyclines in most of the reporting countries. Most fluoroquinolone resistance has been associated with selection of mutational resistance during treatment of E. coli and Campylobacter spp., although plasmid-mediated resistance is becoming more common, particularly in Salmonella spp. The route of administration of the different substances of this sub-class as well as the consumption of quinolones may vary significantly among animal species, as administration by oral route for group treatment is primarily used in poultry while individual injectable treatments are mainly employed in cattle and pigs. The process of selection of antimicrobial resistance through mutation differs between bacterial species, with rapid and stable selection of resistant mutants in Campylobacter spp. contrasting with several step mutations followed by fitness adaption in the Enterobacteriaceae.
The degree to which co-resistance to several compounds occurs will also have an effect on the observed associations, and co-resistance may also have been influenced by previous antimicrobial consumption over a number of years. Therefore, the different patterns of association detected may reflect quite different stages in the evolution of resistance; this analysis does not take into account consumption in the years preceding consumption only those years selected for investigation. In the case of mutational resistance, no external genetic material is required for resistance to develop within the bacterial population; resistant strains occur spontaneously in the bacterial population and are then selected by antimicrobial consumption. The competition between susceptible and resistant strains will lead to maintenance or disappearance of resistant mutants according to their fitness and adaptation process through compensatory mutations. This is not the case for 3rd-generation cephalosporin resistance, which usually develops not via mutation but through the selection of strains carrying mobile genetic elements coding for cephalosporin resistance, which can be transferred by conjugation (i.e. horizontally) to susceptible recipient strains. In such circumstances, the degree to which a bacterial population is “isolated” from the general population can influence the development of resistance.
The analysis assessed the relationship between amount of consumption of certain classes of antimicrobials and the corresponding resistance to a representative substance of the same class. The co-selection phenomenon was not taken into account in this report because isolate-based data were not available from sufficient MSs. Nevertheless, an attempt to illustrate the impact of the co-selection phenomenon on the assessment of the relationship between data on consumption and resistance is shown in Textbox 1. Analysis of multidrug resistance is complex and may involve other factors (for example resistance to quaternary ammonium disinfectants). Particular multidrug resistance patterns may be associated with the spread of certain bacterial clones and the degree to which such clones influence the overall resistance figures is a topic for investigation. It seems likely that refinements in data collection (for example phage typing of salmonella isolates) will be required before this aspect can be fully addressed in reports similar to this.
The comparison of point distribution on the graphs of the national consumption of 3rd-generation fluoroquinolones alone or added to other quinolones and risk of ciprofloxacin resistance in E. coli, C. coli or C. jejuni isolates illustrates the impact of use of other quinolones in certain countries. For the bacterial species, the graphs show shifts to the right of two points, corresponding to the contribution of quinolone consumption. From a microbiological point of view, these shifts are logical because of the cross-resistance between quinolones and fluoroquinolones, which are similarly detected by the use of ECOFFs for ciprofloxacin resistance. Quinolones select for the first mutation step leading to ciprofloxacin resistance in E. coli and subsequent steps increase resistance levels (a single mutation
ECDC/EFSA/EMA first joint report on the integrated analysis of the consumption of antimicrobial agents and occurrence of antimicrobial resistance in bacteria from humans and food-producing animals 636088/2013 Page 46/114

confers resistance to both quinolones and fluoroquinolones in Campylobacter spp.). A further factor to be considered in Salmonella spp. is the dissemination of plasmid-mediated resistance to quinolones mediated by qnr genes, which in turn may provide opportunities for co-selection of unrelated antimicrobials if transmitted on the same plasmid.
Some of the graphs display marked differences in the occurrence of resistance for a given level of consumption. This is clearly shown by the graph of ciprofloxacin resistance in C. coli, where three countries with approximately the same low level of consumption of ciprofloxacin show differences in the occurrence of resistance to this antimicrobial. There could be a number of explanations for this phenomenon, including differences in the consumption of fluoroquinolones in years prior to the year of analysis. Other possible explanations include movements of bacteria and animals between countries, dissemination of resistance down production pyramids and the effect of co-selection, as well as the high impact of one animal species in the calculations, which were performed to generate an average level of resistance. Conversely, some graphs show that some countries with a relatively high level of consumption have a lower level of resistance than countries with a more moderate consumption (3rd-generation cephalosporins and Salmonella spp.). In this example, the differences in the scale of the axes are noteworthy, because the relation between resistance and consumption at very low levels of resistance is likely to be influenced greatly by events such as the degree of containment achieved or, conversely, widespread dissemination which occurred from a single source as a result of animal movements (e.g. resistant bacteria spreading widely from a single farm or other premises). Therefore, where the level of resistance is very low, events unrelated to consumption might have a large proportional effect on the total level of resistance observed. Some features of these data may be explained by factors which relate to particular countries in which some production models rely on extensive movements across Europe between countries from breeding sites to sites used for fattening livestock. For tetracyclines and Campylobacter spp., the distribution of outliers and whether or not recent initiatives to markedly reduce the consumption of antimicrobials, including tetracyclines, has influenced their situation requires further investigation, including any changes observed when different years are analysed. Finally, in the graphs concerning Salmonella spp. and tetracyclines, co-selection and the spread of resistant clones (which often have genetic resistance “islands” linking resistance genes, among which tetracycline resistance genes are frequently represented) are likely to have markedly affected the occurrence of resistance and may assist in explaining the observed distribution.
ECDC/EFSA/EMA first joint report on the integrated analysis of the consumption of antimicrobial agents and occurrence of antimicrobial resistance in bacteria from humans and food-producing animals 636088/2013 Page 47/114

Textbox 1.
An attempt to study the impact of co-selection on the assessment of the relationship between antimicrobial consumption and resistance, using an example of resistance data in indicator E. coli in 2011
Based on a method derived from that proposed by Søgaard (1989) and reviewed by Monnet et al. (2001), an empiric attempt was made to account for the co-selection phenomenon when comparing data on consumption and resistance in animals. The assumption was that an observed occurrence of resistance was the result of simultaneous actions of several antimicrobials on a given bacterial population accounting for the multidrug-resistance traits of this population.
Various fractions of the consumption of these antimicrobials should be taken into account while modelling the relationship between consumption and resistance. For this purpose, the coupling fraction, cfBA, for an antimicrobial B (to explain resistance to antimicrobial A is defined as the percentage of isolates resistant to A that were also resistant to B. The fractions accounted for each animal population, broilers, pigs and cattle, by weighting them according to their PCU. The corrected antimicrobial A consumption, corrConsumptionA, was then calculated using the following formula, where ConsumptionA is the quantity of antimicrobial A sold expressed in milligrams per PCU, ConsumptionB is the consumption of antimicrobial B and cfBA is the coupling fraction for B to explain resistance to A, etc.:
corrConsumptionA = ConsumptionA + cfBA·ConsumptionB + cfCA·ConsumptionC + …
The percentage of isolates (resistant to A that were also resistant to B) were derived from the isolate-based data on indicator E. coli in cattle, domestic fowl and pigs reported by a limited number of four countries for the year 2011.
The attempt addresses data on resistance to tetracyclines and 3rd- and 4th-generation cephalosporins in indicator E. coli and the corresponding domestic consumption in four countries for the year 2011 (Figure 11). Overall, a higher degree of association may be observed. For 3rd- and 4th-generation cephalosporins, the use of “corrected” consumption data results in the association becoming significant. In addition, although the point estimates of the ORs remain of the same magnitude, the ranges of the CIs have been narrowed by “correction” performed on the consumption data. Although remaining low, the max-rescaled R-square increases while correcting consumption data on tetracyclines and 3rd- and 4th-generation cephalosporins or is unchanged while correcting for consumption data on fluoroquinolones.
A limitation of this approach is that consumption data expressed in milligrams per PCU are used as a proxy for data on consumption of antimicrobials. In addition, the limited number of resistance data reported at isolate level greatly limited the number of countries included in this analysis.
ECDC/EFSA/EMA first joint report on the integrated analysis of the consumption of antimicrobial agents and occurrence of antimicrobial resistance in bacteria from humans and food-producing animals 636088/2013 Page 48/114

Figure 11. Logistic regression curves with 95 % CIs of the domestic consumption and “corrected” consumption of tetracyclines and 3rd- and 4th-generation cephalosporins and the corresponding probability of “microbiological” resistance to tetracycline and cefotaxime in indicator E. coli from cattle, domestic fowl and pigs—dots represent the countries included in the analysis
a. Tetracyclines—indicator E. coli 2011
Consumption of tetracyclines “Corrected consumption” of tetracyclines
Countries included: AT, CH, DK, ES Countries included: AT, CH, DK, ES p-value < 0.0001; OR = 1.029; 95% PL CI: [1.018, 1.041] p-value < 0.0001; OR = 1.021; 95% PL CI: [1.017, 1.025]
b. Cephalosporins—indicator E. coli 2011
Consumption of cephalosporins “Corrected consumption" of cephalosporins
Countries included: AT, CH, DK, ES Countries included: AT, CH, DK, ES OR0.1-unit increment = 1.091; 95 % PL CI: [0.395, 3.990] p-value < 0.0001; OR0.1-unit increment = 1.027;
95 % PL CI: [1.002, 1.055]
ECDC/EFSA/EMA first joint report on the integrated analysis of the consumption of antimicrobial agents and occurrence of antimicrobial resistance in bacteria from humans and food-producing animals 636088/2013 Page 49/114

8. Antimicrobial consumption in humans and resistance inbacteria from humans
8.1. Consumption of 3rd- and 4th-generation cephalosporins for humans and occurrence of resistance in E. coli and Salmonella spp. from humans
Third- and 4th-generation cephalosporins (primarily 3rd generation) are used for the treatment of infections caused by both Gram-positive and Gram-negative bacteria, including infections caused by E. coli and Salmonella spp. Third- and 4th-generation cephalosporins are considered by WHO as CIAs which should be reserved for the treatment of severe infections in humans (3rd revision—WHO list of critically important antimicrobials (CIA) (WHO, 2012)), indicating that non-human use of these antimicrobials should be avoided when possible.
Data on occurrence of cephalosporin resistance in E. coli from BSIs were reported from 28 EU and two EEA countries in 2012.
In order to investigate possible correlations between the consumption of 3rd- and 4th-generation cephalosporins and the occurrence of resistance to 3rd-generation cephalosporins in E. coli, the consumption of such antimicrobials in the community, in hospitals and in total was plotted against the occurrence of 3rd-generation cephalosporin resistance in E. coli isolated from BSIs (Figure 12). Significant associations between resistance and consumption in the community, in hospitals and in total, were observed. For all countries included in the analysis, higher levels of consumption correlated with higher levels of percentages of 3rd-generation cephalosporin resistance. The majority of countries reported data. Therefore, the consumption of 3rd- and 4th-generation cephalosporins appears to be associated with 3rd-generation cephalosporin resistance in E. coli from humans. The occurrence of country outliers with a relatively high percentage of resistance despite a lower consumption suggests that factors other than the national antimicrobial consumption in humans may contribute.
Figure 12. Logistic regression analysis curves with OR estimates and 95 % PL CIs of the national total (community and in hospitals) consumption of 3rd- and 4th-generation cephalosporins in humans and the probability of clinical resistance to 3rd-generation cephalosporins in E. coli isolates from human BSIs for the year 2012—dots represent the countries involved in the analysis.
Countries included: BE, BG, CY, DK, EE, FI, FR, GR, HR, IE, IS, IT, LT, LU, LV, MT, NL, NO, PT, RO, SE, SI, SK
p-value < 0.005; OR = 1.909; 95 % PL CI: [1.222, 2.928]
ECDC/EFSA/EMA first joint report on the integrated analysis of the consumption of antimicrobial agents and occurrence of antimicrobial resistance in bacteria from humans and food-producing animals 636088/2013 Page 50/114
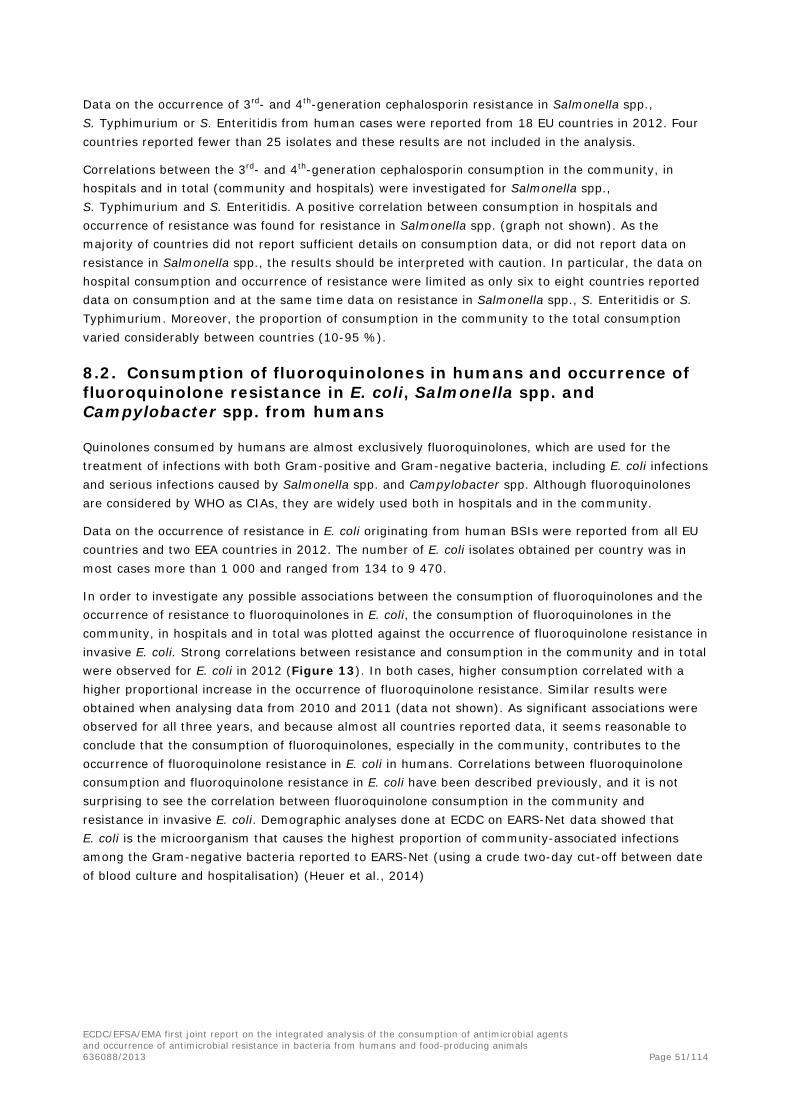
Data on the occurrence of 3rd- and 4th-generation cephalosporin resistance in Salmonella spp., S. Typhimurium or S. Enteritidis from human cases were reported from 18 EU countries in 2012. Four countries reported fewer than 25 isolates and these results are not included in the analysis.
Correlations between the 3rd- and 4th-generation cephalosporin consumption in the community, in hospitals and in total (community and hospitals) were investigated for Salmonella spp., S. Typhimurium and S. Enteritidis. A positive correlation between consumption in hospitals and occurrence of resistance was found for resistance in Salmonella spp. (graph not shown). As the majority of countries did not report sufficient details on consumption data, or did not report data on resistance in Salmonella spp., the results should be interpreted with caution. In particular, the data on hospital consumption and occurrence of resistance were limited as only six to eight countries reported data on consumption and at the same time data on resistance in Salmonella spp., S. Enteritidis or S. Typhimurium. Moreover, the proportion of consumption in the community to the total consumption varied considerably between countries (10-95 %).
8.2. Consumption of fluoroquinolones in humans and occurrence of fluoroquinolone resistance in E. coli, Salmonella spp. and Campylobacter spp. from humans
Quinolones consumed by humans are almost exclusively fluoroquinolones, which are used for the treatment of infections with both Gram-positive and Gram-negative bacteria, including E. coli infections and serious infections caused by Salmonella spp. and Campylobacter spp. Although fluoroquinolones are considered by WHO as CIAs, they are widely used both in hospitals and in the community.
Data on the occurrence of resistance in E. coli originating from human BSIs were reported from all EU countries and two EEA countries in 2012. The number of E. coli isolates obtained per country was in most cases more than 1 000 and ranged from 134 to 9 470.
In order to investigate any possible associations between the consumption of fluoroquinolones and the occurrence of resistance to fluoroquinolones in E. coli, the consumption of fluoroquinolones in the community, in hospitals and in total was plotted against the occurrence of fluoroquinolone resistance in invasive E. coli. Strong correlations between resistance and consumption in the community and in total were observed for E. coli in 2012 (Figure 13). In both cases, higher consumption correlated with a higher proportional increase in the occurrence of fluoroquinolone resistance. Similar results were obtained when analysing data from 2010 and 2011 (data not shown). As significant associations were observed for all three years, and because almost all countries reported data, it seems reasonable to conclude that the consumption of fluoroquinolones, especially in the community, contributes to the occurrence of fluoroquinolone resistance in E. coli in humans. Correlations between fluoroquinolone consumption and fluoroquinolone resistance in E. coli have been described previously, and it is not surprising to see the correlation between fluoroquinolone consumption in the community and resistance in invasive E. coli. Demographic analyses done at ECDC on EARS-Net data showed that E. coli is the microorganism that causes the highest proportion of community-associated infections among the Gram-negative bacteria reported to EARS-Net (using a crude two-day cut-off between date of blood culture and hospitalisation) (Heuer et al., 2014)
ECDC/EFSA/EMA first joint report on the integrated analysis of the consumption of antimicrobial agents and occurrence of antimicrobial resistance in bacteria from humans and food-producing animals 636088/2013 Page 51/114
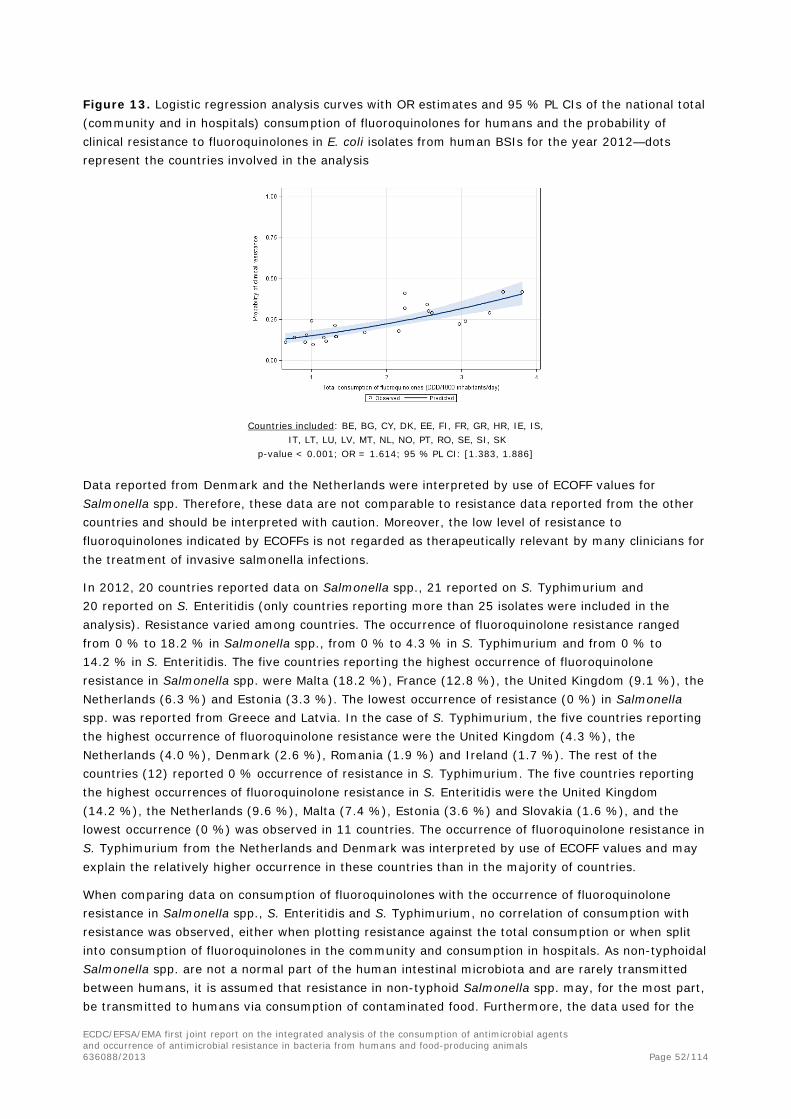
Figure 13. Logistic regression analysis curves with OR estimates and 95 % PL CIs of the national total (community and in hospitals) consumption of fluoroquinolones for humans and the probability of clinical resistance to fluoroquinolones in E. coli isolates from human BSIs for the year 2012—dots represent the countries involved in the analysis
Countries included: BE, BG, CY, DK, EE, FI, FR, GR, HR, IE, IS, IT, LT, LU, LV, MT, NL, NO, PT, RO, SE, SI, SK
p-value < 0.001; OR = 1.614; 95 % PL CI: [1.383, 1.886]
Data reported from Denmark and the Netherlands were interpreted by use of ECOFF values for Salmonella spp. Therefore, these data are not comparable to resistance data reported from the other countries and should be interpreted with caution. Moreover, the low level of resistance to fluoroquinolones indicated by ECOFFs is not regarded as therapeutically relevant by many clinicians for the treatment of invasive salmonella infections.
In 2012, 20 countries reported data on Salmonella spp., 21 reported on S. Typhimurium and 20 reported on S. Enteritidis (only countries reporting more than 25 isolates were included in the analysis). Resistance varied among countries. The occurrence of fluoroquinolone resistance ranged from 0 % to 18.2 % in Salmonella spp., from 0 % to 4.3 % in S. Typhimurium and from 0 % to 14.2 % in S. Enteritidis. The five countries reporting the highest occurrence of fluoroquinolone resistance in Salmonella spp. were Malta (18.2 %), France (12.8 %), the United Kingdom (9.1 %), the Netherlands (6.3 %) and Estonia (3.3 %). The lowest occurrence of resistance (0 %) in Salmonella spp. was reported from Greece and Latvia. In the case of S. Typhimurium, the five countries reporting the highest occurrence of fluoroquinolone resistance were the United Kingdom (4.3 %), the Netherlands (4.0 %), Denmark (2.6 %), Romania (1.9 %) and Ireland (1.7 %). The rest of the countries (12) reported 0 % occurrence of resistance in S. Typhimurium. The five countries reporting the highest occurrences of fluoroquinolone resistance in S. Enteritidis were the United Kingdom (14.2 %), the Netherlands (9.6 %), Malta (7.4 %), Estonia (3.6 %) and Slovakia (1.6 %), and the lowest occurrence (0 %) was observed in 11 countries. The occurrence of fluoroquinolone resistance in S. Typhimurium from the Netherlands and Denmark was interpreted by use of ECOFF values and may explain the relatively higher occurrence in these countries than in the majority of countries.
When comparing data on consumption of fluoroquinolones with the occurrence of fluoroquinolone resistance in Salmonella spp., S. Enteritidis and S. Typhimurium, no correlation of consumption with resistance was observed, either when plotting resistance against the total consumption or when split into consumption of fluoroquinolones in the community and consumption in hospitals. As non-typhoidal Salmonella spp. are not a normal part of the human intestinal microbiota and are rarely transmitted between humans, it is assumed that resistance in non-typhoid Salmonella spp. may, for the most part, be transmitted to humans via consumption of contaminated food. Furthermore, the data used for the
ECDC/EFSA/EMA first joint report on the integrated analysis of the consumption of antimicrobial agents and occurrence of antimicrobial resistance in bacteria from humans and food-producing animals 636088/2013 Page 52/114

analysis did not include data from patients reporting a history of recent travel to other countries. For this reason, no conclusions regarding the impact of travel can be drawn from this report.
In 2012, 14 countries reported data on the occurrence of fluoroquinolone resistance in Campylobacter coli and 15 reported data on the occurrence of resistance in C. jejuni (only countries reporting more than 25 isolates were included in the analysis). The occurrence of fluoroquinolone resistance varied between countries and was in general higher than in E. coli and Salmonella. For C. coli, occurrence of resistance varied from 42.0 % to 86.4 %. The highest occurrences were observed in Spain (86.4 %), Lithuania (84.0 %) and Slovenia (74.5 %) and the lowest occurrence of fluoroquinolone resistance (42.0 %) was observed in the United Kingdom. In C. jejuni, occurrence of resistance varied from 30.7 % to 91.9 %. The highest occurrences were observed in Lithuania (91.9 %), Spain (84.1 %) and Hungary (79.4 %) and the lowest occurrence of fluoroquinolone resistance (30.7 %) was observed in Slovakia.
When comparing data on consumption with occurrence of fluoroquinolone resistance, a positive correlation was seen for C. coli for fluoroquinolone consumption in the community but no other correlations with resistance were observed for Campylobacter spp. The data should be interpreted with caution as the majority of countries reported limited data. Campylobacter spp. are not a part of the normal human intestinal flora and are in general not transmitted between humans. Undercooked chicken and contaminated ready-to-eat food are the most common sources of campylobacteriosis in the EU. It is therefore assumed that occurrence of resistance in Campylobacter spp. from humans is influenced by resistance in Campylobacter spp. from food-producing animals. Other explanations could be that spread of certain clones has an influence, the occurrence of resistance has reached such a high level that it does not follow the consumption pattern or that Campylobacter spp. causing infection are from imported meat. As cases with a known history of travel were not included in the FWD-Net data used for the analysis, travel outside the reporting country will have little influence on the result.
8.3. Consumption of macrolides in humans and occurrence of erythromycin resistance in Campylobacter coli and Campylobacter jejuni from humans
Macrolides are used for the treatment of infections caused by Campylobacter spp. (gastroenteritis) and Gram-positive bacteria, including respiratory infections suspected to be caused by Mycoplasma pneumoniae. Macrolides are considered by WHO (2011) as CIAs with the highest priority for human medicine. Macrolides are used both in hospitals and in the community.
Data on occurrence of erythromycin resistance in C. coli and C. jejuni from human cases were reported from 14 and 16 countries in 2012, respectively (only countries reporting more than 25 isolates were included in the analysis).
In order to consider any correlation between the macrolide consumption and the occurrence of resistance to erythromycin in Campylobacter spp., the consumption of macrolides in the community, in hospitals and in total was plotted against the occurrence of erythromycin resistance in C. jejuni and C. coli. For C. coli, the number of countries reporting data on both resistance and consumption varied from six to nine. Positive correlations between resistance in C. coli and consumption in hospitals and in total were observed. Owing to the small number of countries included in the analysis, the results should be interpreted with caution. For C. jejuni, no correlations between resistance and consumption were observed. Campylobacter spp. are zoonotic bacteria originating from food-producing animals and antimicrobial consumption in the animals is expected to affect the resistance level. Furthermore, selection of erythromycin resistance in Campylobacter spp. may be due to consumption of macrolide antimicrobials in the human sector.
ECDC/EFSA/EMA first joint report on the integrated analysis of the consumption of antimicrobial agents and occurrence of antimicrobial resistance in bacteria from humans and food-producing animals 636088/2013 Page 53/114

8.4. Tetracycline consumption in humans and occurrence of tetracycline resistance in Salmonella spp. and Campylobacter spp. from humans
Tetracyclines are broad-spectrum antimicrobial agents used for treatment of infections caused by both Gram-negative and Gram-positive bacteria, including long-term treatment for acne caused by Propionibacterium acnes.
Data on the occurrence of tetracycline resistance in Salmonella spp., S. Typhimurium and S. Enteritidis from human cases were reported by 16 or 17 countries in 2012 (only countries reporting more than 25 isolates were included in the analysis).
In 2012, the number of isolates obtained varied between countries, from 72 to 6 168 for Salmonella spp., from 27 to 1 654 for S. Typhimurium and from 25 to 1 624 for S. Enteritidis.
In order to investigate a possible association between the consumption of tetracyclines and the occurrence of tetracycline resistance in Salmonella spp., the consumption of tetracyclines in the community, in hospitals and in total was plotted against the occurrence of tetracycline resistance in Salmonella spp. and S. Typhimurium. In all cases no correlations were observed. For S. Enteritidis sufficient data on tetracycline resistance and consumption in the community, in hospitals and in total were reported from 15, 10 and 11 countries, respectively. In general, it can be concluded that the occurrence of resistance to tetracyclines in humans can be high despite a low consumption, and the highest occurrence of tetracycline resistance is observed in S. Typhimurium, followed by Salmonella spp. and S. Enteritidis (see examples Figure 14). It is therefore likely that the high occurrence of resistance in Salmonella spp. is due to consumption of tetracyclines elsewhere, e.g. in food-producing animals, or to co-selection of multidrug-resistant (MDR) strains, although the spread of certain clones may be important, as may be imported meat and processed meat products, which may be contaminated with tetracycline-resistant salmonella organisms. Other sources of infection, for example infections caused by reptiles, should also be taken into consideration. For example an extensive reptile-associated outbreak of tetracycline-resistant S. Typhimurium in at least one EU country in the period under analysis was shown to have originated in a country outside the EU/EEA area and to have its reservoir in infant mice imported into the EU from the USA and fed to reptiles (corn snakes kept as pets) (Harker et al., 2011).
ECDC/EFSA/EMA first joint report on the integrated analysis of the consumption of antimicrobial agents and occurrence of antimicrobial resistance in bacteria from humans and food-producing animals 636088/2013 Page 54/114

Figure 14. Logistic regression analysis curves with OR estimates and 95 % PL CIs of the national consumption of tetracyclines in the community in humans and the probability of clinical resistance to tetracycline in S. Typhimurium from human infections for the year 2012—dots represent the countries involved in the analysis
Countries included: AT, DK, ES, FR, HU, IE, IT, LT, LU, NL, NO, RO, SI, SK, UK p-value = 0.96; OR = 1.006; 95% PL CI: [0.775, 1.308] – not significant
Data on the occurrence of tetracycline resistance in C. coli and C. jejuni from cases of human infections were reported from 10 countries in 2012 (only countries reporting more than 25 isolates were included in the analysis).
In 2012, the number of isolates obtained varied between countries from 42 to 102 for C. coli and from 56 to 1 241 for C. jejuni. Occurrence of resistance to tetracyclines varied in C. coli from 30.9 % to 79.5 % and in C. jejuni from 11.6 % to 72.0 %.
In order to consider correlation between the consumption of tetracyclines and the occurrence of resistance to tetracyclines in Campylobacter spp., the consumption of tetracyclines in the community, in hospitals and in total was plotted against the occurrence of tetracycline resistance in C. coli and C. jejuni. No correlation between resistance to tetracyclines and consumption of tetracyclines in the community, in hospitals or in total was observed. As the majority of countries reported limited consumption data or did not report data on tetracycline resistance in Campylobacter spp., it is appropriate to comment on C. jejuni only for the nine countries that reported data on resistance and consumption in the community. In these cases no correlation was observed.
ECDC/EFSA/EMA first joint report on the integrated analysis of the consumption of antimicrobial agents and occurrence of antimicrobial resistance in bacteria from humans and food-producing animals 636088/2013 Page 55/114

Textbox 2.
Carbapenem consumption and carbapenem-resistant Klebsiella pneumoniae and E. coli from humans and a view on carbapenemase-producing Enterobacteriaceae from food-producing animals in Europe
Carbapenems are used for treatment of infections caused by MDR Gram-negative bacteria, including the treatment of blood and urinary tract infections caused by MDR E. coli. Carbapenems are almost exclusively used in hospitals. The proportion of total hospital antimicrobial consumption accounted for by carbapenems varies between countries, from 0.61 to 9.84 % in 2012, with very small amounts also used in the community (0 to 0.27 % of the total community consumption 0 % to 0.59 % in 2012). Susceptibility testing has been performed in K. pneumoniae and E. coli by use of either meropenem or imipenem, and results interpreted by use of clinical breakpoints. The use of different antimicrobial agents or interpretive criteria may influence the result.
Consumption of carbapenems and occurrence of carbapenem-resistant K. pneumoniae
In 2012, all 27 EU and two EEA countries and Croatia reported data on consumption of carbapenems (seven countries reported only data on community consumption: Austria, the Czech Republic, Germany, Hungary, Poland, Spain and the United Kingdom). All 27 EU countries and Norway and Iceland reported data on occurrence of carbapenem-resistant K. pneumoniae. Overall, 16 282 K. pneumoniae isolates from BSIs were reported, of which 1 235 were resistant to carbapenem. For countries reporting data on consumption both in the community and in hospitals, the consumption varied from 0.013 to 0.16 DDDs per 1 000 inhabitants and per day. The highest percentages of carbapenem-resistant K. pneumoniae were reported from Greece (60.5 %), Italy (28.8 %), Romania (13.7 %) and Cyprus (9.2 %). No carbapenem-resistant K. pneumoniae was observed in eight of the reporting countries.
Figure 15 shows data from countries reporting consumption on carbapenems and data on carbapenem-resistant K. pneumoniae in 2012. Greece had the highest occurrence of carbapenem-resistant K. pneumoniae and was also among the countries with the highest consumption; Cyprus and Italy had moderate percentages of carbapenem-resistant K. pneumoniae and consumption. Portugal had a high consumption compared with the other countries, but the occurrence of carbapenem-resistant K. pneumoniae was still at a low level. Several countries with a moderate level of consumption have observed emergence of resistance. Austria, Hungary, Poland, Spain and the United Kingdom, which reported a low level of consumption, since 2011 have seen the emergence of carbapenem-resistant K. pneumoniae, but these countries did not report consumption in hospitals. Carbapenems are among CIAs as defined by WHO that should be reserved for treatment of severe infections in humans. Therefore, consumption is expected to be in hospitals and consumption in the above-mentioned countries reporting only community consumption data is probably underestimated. This may explain the occurrence of carbapenem-resistant K. pneumoniae in these countries. Another possibility is that the occurrence of carbapenem-resistant K. pneumoniae observed in these EU countries was associated with travel to countries outside the EU, where such strains are more common, rather than with the consumption of carbapenems in EU countries themselves. Indeed, in several EU countries, the emergence of carbapenem-resistant bacteria has been related to travel outside the country (Walsh, 2010).
Several countries did not observe any carbapenem-resistant K. pneumoniae and the consumption of carbapenems was low. Nevertheless a statistically significant increase in carbapenem-resistant K. pneumoniae with increase in the total consumption was observed for 2011 and 2012 (Figure 15). Even though this correlation was based on two-thirds to three-quarters of the countries, the possibility
ECDC/EFSA/EMA first joint report on the integrated analysis of the consumption of antimicrobial agents and occurrence of antimicrobial resistance in bacteria from humans and food-producing animals 636088/2013 Page 56/114

of consumption in some countries selecting for carbapenem-resistant K. pneumoniae cannot be excluded.
Large differences in the reported percentage of carbapenem-resistant K. pneumoniae exist, possibly because other factors, such as infection control practices and management, influence the clonal spread of carbapenemase-producing K. pneumoniae within hospitals. Carbapenem-resistant K. pneumoniae has now been reported through EARS-Net in almost three-quarters of the countries, and carbapenem-resistant E. coli has been reported in more than half of the countries. Carbapenem-resistant E. coli was observed in all countries in which carbapenem-resistant K. pneumoniae had been detected. The occurrence of carbapenem-resistant E. coli was less than 1 % in both years, except in Bulgaria and Greece in 2012, where the prevalence of carbapenem-resistant E. coli was 2.6 % and 1.4 %, respectively. In Salmonella spp., carbapenemase producers were not reported.
Figure 15. Logistic regression analysis curves with OR estimates and 95 % PL CIs of the national total (community and in hospitals) consumption of carbapenems for humans and the probability of clinical resistance to carbapenems in K. pneumoniae from human infections for the year 2012—dots represent the countries involved in the analysis
Countries included: BE, BG, CY, DK, EE, EL, FI, FR, HR, IE, IT, LT, LU, LV, MT, NL, NO, PT, RO, SE, SI, SK p-value = 0.002; OR0.1-unit increment = 14.229; 95 % PL CI: [2.606, 93.477]
Surveillance and detection of carbapenemase-producing Enterobacteriaceae in food-producing animals
Carbapenems are not approved for use in animals and K. pneumoniae is not considered a zoonotic bacterium. The prevalence of carbapenemase-producing bacteria in food-producing animals is not known, but recently carbapenem-resistant E. coli has been detected in livestock pigs and carbapenem-resistant Salmonella has been detected in both livestock pigs and poultry (EFSA, 2013; Fischer et al., 2012a; Fischer et al., 2012b) although the source of such organisms is not known. Carbapenemase-producing Acinetobacter spp. have also been reported from cattle in France and from horses in Belgium (Poirel, 2012; Smet et al., 2012). The occurrence and possible spread of carbapenemase-producing bacteria in food-producing animals is thus considered important for the assessment of potential zoonotic risks (EFSA, 2013) and has therefore been included in the latest report of harmonised monitoring of antimicrobial resistance by EFSA, where it is recommended that phenotypic testing for carbapenemase-producing in Salmonella spp. and E. coli is performed consistently (EFSA, 2012b). Based on this recommendation, monitoring of carbapenemase-producing bacteria in food-producing animals and meat thereof is part of the European monitoring programme for foodborne antimicrobial resistance and includes, in addition to mandatory susceptibility testing to carbapenems, a selective isolation procedure on voluntary basis (2013/652/EU (Official Journal of the European Union, 2013)).
ECDC/EFSA/EMA first joint report on the integrated analysis of the consumption of antimicrobial agents and occurrence of antimicrobial resistance in bacteria from humans and food-producing animals 636088/2013 Page 57/114

9. Antimicrobial consumption in food-producing animals andresistance in bacteria from humans
The majority of Salmonella spp. and Campylobacter spp. causing human infections in EU MSs are zoonotic in origin and most likely originate in food production animals. The most common salmonella serovars are Enteritidis and Typhimurium. S. Enteritidis is often found to be resistant to fluoroquinolones, while S. Typhimurium is often MDR. Other MDR serovars such as S. Infantis and S. Virchow have also been implicated in both sporadic cases and outbreaks, and S. Kentucky is increasing in importance in some MSs (Westrell et al., 2014). Other sources of contamination with antimicrobial-resistant salmonella strains (e.g. reptiles (Harker et al., 2011)) may also be a factor in some countries, and should also be taken into consideration (see section 8.4).
The common Campylobacter species causing infections are C. jejuni and C. coli, with C. jejuni by far the most predominant, while C. coli is normally more resistant to antimicrobials.
The relationship and interaction between those populations of E. coli in humans (E. coli causing BSIs) and in animals (commensal E. coli), for which susceptibility data are available and which have been analysed in this report, is not completely understood. The degree of interaction or common linkage between these populations of E. coli is clearly important in assessing if any observed associations between antimicrobial consumption in food-producing animals and resistance in humans are also supported by epidemiological observations, which might include the potential for spread of mobile genetic elements, such as plasmids. The resistance patterns observed in certain zoonotic or pathogenic bacteria from humans may therefore reflect use of antimicrobials in food animals, although comprehensive assessment requires consideration of additional information. Some prevalent strains of E. coli causing BSIs in humans are not linked to E. coli present in food-producing animals.
For this investigation, data on antimicrobial consumption in food-producing animals in combination with data on the occurrence of resistance in E. coli, Salmonella spp., particularly S. Enteritidis and S. Typhimurium, and Campylobacter spp. from humans have been analysed to investigate possible correlations between such consumption and resistance. This comparison is not straightforward as some of the bacterial species may predominantly originate from one particular type of animal (e.g. S. Enteritidis from poultry) whereas other serovars (e.g. S. Typhimurium) have a more ubiquitous host range. Moreover, only data on the total consumption in food-producing animal are available and analysis cannot be made at the level of animal species.
As zoonotic and other bacteria causing infections in humans may be transmitted to humans through various routes, it is probable that the consumption of antimicrobials in food-producing animals also affects resistance in humans. The proportion of bacteria resistant to a certain antimicrobial may also be influenced by resistance to other antimicrobials (co-resistance). Even non-antimicrobial substances, such as metals and disinfectants, may influence co-selection. Bacteria exhibiting resistance to more than one antimicrobial may select for certain clones. Moreover, travel, trade and imports of meat and other food items are factors which may influence the analyses, depending on the antimicrobial–bacterium combinations studied.
9.1. Comparison between consumption of 3rd- and 4th-generation cephalosporins in food-producing animals and resistance in bacteria from humans
In order to investigate a possible relationship between the consumption of 3rd- and 4th-generation cephalosporins in food-producing animals with data on resistance in bacteria causing infections in humans, the occurrence of resistance in E. coli and Salmonella spp. isolated from humans was
ECDC/EFSA/EMA first joint report on the integrated analysis of the consumption of antimicrobial agents and occurrence of antimicrobial resistance in bacteria from humans and food-producing animals 636088/2013 Page 58/114
compared with consumption of 3rd- and 4th-generation cephalosporins in food-producing animals (expressed in milligrams per PCU) in 2011 and 2012 (Figure 16).
Figure 16 shows cephalosporin resistance in E. coli from human BSIs plotted against the total consumption of 3rd- and 4th-generation cephalosporins in food-producing animals in 2011 and 2012. Despite accounting for overdispersion in data and although most countries reported data, no linear association was found. As positive correlations for total consumption by humans, consumption in the community and consumption in hospitals were found (Figure 12), this suggests that resistance observed in E. coli in humans is likely to have been primarily affected by consumption in human medicine, whereas the consumption of 3rd- and 4th-generation cephalosporins used in animals seems to exhibit a smaller effect.
Figure 16. Logistic regression analysis curves with OR estimates and 95 % PL CIs of the national consumption of 3rd- and 4th-generation cephalosporins in food-producing animals and the probability of clinical resistance to 3rd- and 4th-generation cephalosporin in E. coli isolates from human BSIs for the year 2012—dots represent the countries involved in the analysis
Countries included: AT, BE, BG, CY, CZ, DE, DK, EE, ES, FI, FR, HU, IE, IS, IT, LT, LU, LV, NL, NO, PL, PT, SE, SI, SK, UK OR = 1.122; 95 % PL CI: [0.962, 1.308] - not significant
In general, the occurrence of resistance to 3rd-and 4th-generation cephalosporins in isolates of Salmonella spp., S. Typhimurium and S. Enteritidis from humans was low (see section 8.1). A significant positive correlation between cephalosporin resistance in Salmonella spp. and S. Enteritidis from humans and consumption of 3rd- and 4th-generation cephalosporins in food-producing animals was observed in 2011 and 2012 (data not shown); the positive correlation observed in S. Typhimurium was not statistically significant.
Although S. Typhimurium and S. Enteritidis are, for the most part, food-borne zoonotic bacteria in EU countries, sources other than food derived from domestically produced animals, such as traded or imported food, may be the source of isolates of Salmonella spp. responsible for food-borne infections in humans. It is noteworthy that data on S. Enteritidis and S. Typhimurium may be limited and thereby give rise to some of the outlier observations. Other factors also exist, such as the spread of certain clones regardless of antimicrobial consumption.
ECDC/EFSA/EMA first joint report on the integrated analysis of the consumption of antimicrobial agents and occurrence of antimicrobial resistance in bacteria from humans and food-producing animals 636088/2013 Page 59/114

9.2. Comparison between consumption of fluoroquinolones in food-producing animals and resistance in bacteria from humans
In order to investigate possible relationships between the consumption of fluoroquinolones, or other quinolones, in food-producing animals and fluoroquinolone resistance in bacteria causing infection in humans, the occurrence of resistance in E. coli, Salmonella spp. and Campylobacter spp. from humans was compared with the total consumption in food-producing animals of fluoroquinolones and quinolones (milligrams per PCU) in 2011 and 2012, at the country level.
A positive association between fluoroquinolone resistance in E. coli from humans and the total consumption in animals (fluoroquinolones alone and fluoroquinolones plus other quinolones) was observed (Figure 17). This result should be interpreted with caution as only a fraction of E. coli from human BSIs may originate from domestically produced animals. Other sources could be the intake of meat produced outside the reporting country, travel or transmission of E. coli between humans. In the previous chapter a correlation between resistance in human bacteria and human consumption of antimicrobials in the community and in total was observed (see Chapter 8.2) which could explain the presence of outliers, i.e. countries with a high occurrence of resistance and a low consumption of quinolones in food-producing animals and or a high consumption of quinolones in food-producing animals and low occurrence of resistance.
Figure 17. Logistic regression analysis curves with OR estimates and 95 % PL CIs of the national consumption of fluoroquinolones (a) or fluoroquinolones plus other quinolones (b) in food-producing animals and the probability of clinical resistance to fluoroquinolones in E. coli isolates from human BSIs for the year 2012—dots represent the countries involved in the analysis
a. b.
Countries included: AT, BE, BG, CY, CZ, DE, DK, EE, ES, FI, FR, HU, IE, IS, IT, LT, LU, LV, NL, NO, PL, PT, SE, SI, SK, UK p-value < 0.05 OR = 1.090; 95 % PL CI: [1.030, 1.153]
Countries included: AT, BE, BG, CY, CZ, DE, DK, EE, ES, FI, FR, HU, IE, IS, IT, LT, LU, LV, NL, NO, PL, PT, SE, SI, SK, UK
p-value < 0.001; OR = 1.112; 95 % PL CI: [1.063, 1.162]
No associations were observed between the consumption of fluoroquinolones in food-producing animals and the occurrence of resistance in Salmonella spp. and Campylobacter spp. from cases of human infection (data not shown).
ECDC/EFSA/EMA first joint report on the integrated analysis of the consumption of antimicrobial agents and occurrence of antimicrobial resistance in bacteria from humans and food-producing animals 636088/2013 Page 60/114
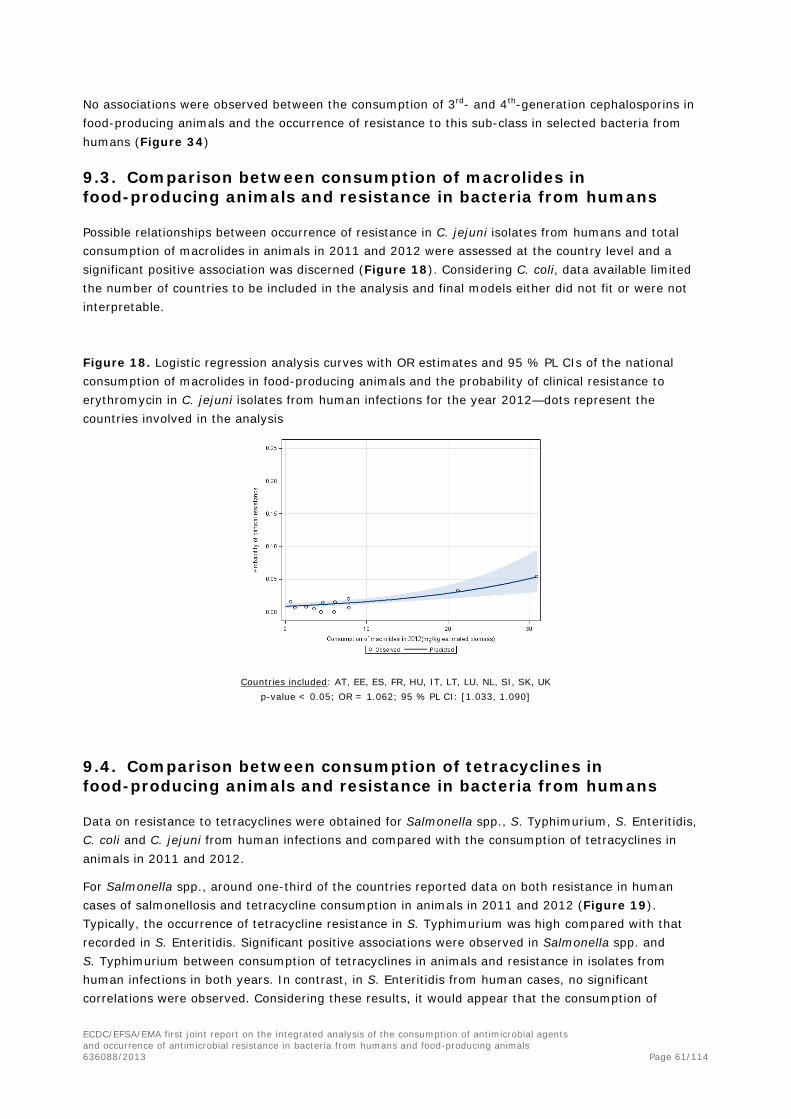
No associations were observed between the consumption of 3rd- and 4th-generation cephalosporins in food-producing animals and the occurrence of resistance to this sub-class in selected bacteria from humans (Figure 34)
9.3. Comparison between consumption of macrolides in food-producing animals and resistance in bacteria from humans
Possible relationships between occurrence of resistance in C. jejuni isolates from humans and total consumption of macrolides in animals in 2011 and 2012 were assessed at the country level and a significant positive association was discerned (Figure 18). Considering C. coli, data available limited the number of countries to be included in the analysis and final models either did not fit or were not interpretable.
Figure 18. Logistic regression analysis curves with OR estimates and 95 % PL CIs of the national consumption of macrolides in food-producing animals and the probability of clinical resistance to erythromycin in C. jejuni isolates from human infections for the year 2012—dots represent the countries involved in the analysis
Countries included: AT, EE, ES, FR, HU, IT, LT, LU, NL, SI, SK, UK p-value < 0.05; OR = 1.062; 95 % PL CI: [1.033, 1.090]
9.4. Comparison between consumption of tetracyclines in food-producing animals and resistance in bacteria from humans
Data on resistance to tetracyclines were obtained for Salmonella spp., S. Typhimurium, S. Enteritidis, C. coli and C. jejuni from human infections and compared with the consumption of tetracyclines in animals in 2011 and 2012.
For Salmonella spp., around one-third of the countries reported data on both resistance in human cases of salmonellosis and tetracycline consumption in animals in 2011 and 2012 (Figure 19). Typically, the occurrence of tetracycline resistance in S. Typhimurium was high compared with that recorded in S. Enteritidis. Significant positive associations were observed in Salmonella spp. and S. Typhimurium between consumption of tetracyclines in animals and resistance in isolates from human infections in both years. In contrast, in S. Enteritidis from human cases, no significant correlations were observed. Considering these results, it would appear that the consumption of
ECDC/EFSA/EMA first joint report on the integrated analysis of the consumption of antimicrobial agents and occurrence of antimicrobial resistance in bacteria from humans and food-producing animals 636088/2013 Page 61/114

tetracyclines in food-producing animals in the reporting countries, and particularly in pigs and cattle, may have selected for tetracycline resistance in isolates of S. Typhimurium involved in human infections, although the potential impact of other sources (e.g. reptiles) should also be taken into consideration. Animal consumption data were not available at animal species level, but S. Typhimurium is frequently observed in pigs and pork and tetracyclines are frequently used in pig production, and also used in calves in some countries. In contrast, tetracyclines are probably used to a lesser extent in poultry, the main reservoir of strains of S. Enteritidis causing infections in the reporting countries.
For Campylobacter spp., data available were even more limited than for Salmonella spp. Eight or nine countries reported sufficient data for C. jejuni and four or five countries for C. coli. Nevertheless, even though data were limited, significant positive associations between data on consumption in food-producing animals and resistance in C. jejuni (Figure 20) (2011 and 2012 data) and C. coli (only for 2011, data not shown) from human cases of infection were observed.
Figure 19. Logistic regression analysis curves with OR estimates and 95 % PL CIs of the national consumption of tetracyclines in food-producing animals and the probability of clinical resistance to tetracycline in (a) S. Typhimurium isolates from human infections and (b) Salmonella spp. isolates from human infections for the year 2012—dots represent the countries involved in the analysis
a. S. Typhimurium b. Salmonella spp.
Countries included: AT, DK, ES, FR, HU, IE, IT, LT, LU, NL, NO, SI, SK, UK
p-value < 0.05 OR = 1.009; 95 % PL CI: [1.002, 1.017]
Countries included: AT, EE, ES, FR, HU, IE, IT, LT, LU, NL, NO, SI, SK, UK
p-value < 0.001; OR = 1.015; 95 % PL CI: [1.008, 1.022]
ECDC/EFSA/EMA first joint report on the integrated analysis of the consumption of antimicrobial agents and occurrence of antimicrobial resistance in bacteria from humans and food-producing animals 636088/2013 Page 62/114

Figure 20. Logistic regression analysis curves with OR estimates and 95 % PL CIs of the national consumption of tetracyclines in food-producing animals and the probability of clinical resistance to tetracycline in C. jejuni isolates from human infections for the year 2012—dots represent the countries involved in the analysis
Countries included: AT, EE, ES, IT, LU, NL, SI, SK, UK
p-value < 0.001; OR = 1.019; 95 % PL CI: [1.009, 1.030]
10. Comparison between the occurrence of resistance inbacteria originating from humans and from food-producing animals
In order for a bacterium with an animal reservoir to cause infection in humans via ingestion of meat, the bacterium needs to survive the meat production chain and also to be infectious to humans. Some Salmonella serovars are present in animals at high levels but rarely cause infections in humans, whereas others frequently cause infections in humans. S. Typhimurium and S. Enteritidis are commonly isolated from cases of gastroenteritis and are therefore relevant when considering resistance in bacterial pathogens causing human disease that may originate from food-producing animals. In the case of Campylobacter spp., both C. coli and C. jejuni are zoonotic, but infections caused by C. jejuni are most common in humans. The animal species with the largest proportion of C. coli is pigs, although the occurrence of C. coli is normally markedly reduced post harvest. In the case of E. coli, some types which infect humans, particularly pathogenic VTEC types, such as E. coli O157:H7, have their primary reservoir in food-producing animals. Moreover, several studies recognise that a proportion of E. coli involved in human infections may originate from food-producing animals, including resistant isolates (Lazarus et al., 2014; Manges and Johnson, 2012). The proportion of E. coli infections in humans, other than VTEC, with a zoonotic origin is unknown, and further studies are needed to quantify the transfer of such organisms from food-producing animals to humans. Most analyses on drug-resistant E. coli from cases of infection in humans have been performed on isolates from BSIs. Such isolates probably possess a variety of virulence genes and virulence mechanisms not found in commensal E. coli from food-producing animals.
When comparing resistance data from different sources, it is important that data are obtained using harmonised methods. Importantly, the interpretation criteria used for antimicrobial susceptibility testing should ideally be either clinical breakpoints or ECOFFs for all data included. In the present
ECDC/EFSA/EMA first joint report on the integrated analysis of the consumption of antimicrobial agents and occurrence of antimicrobial resistance in bacteria from humans and food-producing animals 636088/2013 Page 63/114

comparison of fluoroquinolone resistance, this was not always possible. Therefore, human data interpreted by use of clinical breakpoints were included and compared with data from animals interpreted by use of ECOFFs. Nevertheless, analysis can still be made regarding possible associations between resistance in humans and resistance in animals. Bias in these data may be caused by use of different test substances as data on animal isolates are obtained by use of ciprofloxacin and human data are obtained by use of other fluoroquinolone compounds.
For the comparison of resistance in humans and animals, data available were limited. For this study, it was decided to include data from humans if 25 or more isolates were reported and from animals if 10 or more isolates were included. It was also decided to perform an analysis in cases where five or more countries reported data from both food-producing animals and humans.
In general, the number of countries reporting data of the selected species from both human infection and from animals is limited and constitutes a limitation in the integrated analysis.
10.1. Comparison between occurrence of cephalosporin resistance in bacteria originating from food-producing animals and the occurrence of resistance in humans
Data on the occurrence of cephalosporin-resistant E. coli from BSIs were analysed and compared with the occurrence of cephalosporin resistance in E. coli from cattle (six countries), pigs (six countries) and poultry (nine countries). A significant positive correlation (Spearman’s rank correlation coefficient) was discerned when compared with resistance in poultry (p-value = 0.0261) and resistance in the three animal species considered together (p-value = 0.0153) (summary indicator of resistance), while no significant association was observed for cattle and pigs.
For S. Typhimurium, only three or four countries reported data from both cases of human infection and at least one animal species; these data were therefore considered too limited and no analyses were performed. For S. Enteritidis, seven countries reported data on resistance in isolates from cases of human infection and resistance in isolates from poultry. As resistance to 3rd- and 4th-generation cephalosporins was not observed in S. Enteritidis, no analysis was performed. It is difficult to draw conclusions based on the few countries reporting data on S. Enteritidis.
10.2. Comparison between occurrence of fluoroquinolone resistance in bacteria originating from food-producing animals and the occurrence of fluoroquinolone resistance in humans
The number of countries reporting data on both fluoroquinolone resistance in humans and food-producing animals was very limited. For E. coli, a comparison of resistance in humans and resistance in cattle, pigs, poultry and the summary indicator of resistance considering an average between animal species was performed and a significant correlation (Spearman’s rank correlation coefficient) was observed when compared with resistance in pigs (p-value = 0.0016), poultry (p-value = 0.0199) and the average of all animal species (p-value = 0.0065).
For Salmonella spp., very limited data were also reported. For S. Typhimurium, only three or four countries reported data = from cases of human infection and at least one of the animal species included in the analysis. For S. Enteritidis, eight countries reported data from human infection and poultry but, because of very low prevalence of resistance in food-producing animals in S. Enteritidis, available data did not permit meaningful analyses.
ECDC/EFSA/EMA first joint report on the integrated analysis of the consumption of antimicrobial agents and occurrence of antimicrobial resistance in bacteria from humans and food-producing animals 636088/2013 Page 64/114

For C. coli, only three and four countries reported data from human infections and data from pigs and poultry, respectively. Therefore, no analysis could be performed. For C. jejuni, five countries reported data on resistance from both human infections and in poultry.
10.3. Data available from humans and food-producing animals for tetracycline and macrolide resistance
Very limited data were reported on macrolide resistance in both humans and food-producing animals (between two and five countries in each category). Therefore, no analysis could be performed. For tetracycline resistance, very limited data were reported. In E. coli from blood infections, resistance to tetracyclines was not tested. For S. Typhimurium, only two or three countries reported data on tetracycline resistance in humans and tetracycline resistance in cattle, pigs or poultry. The same was observed for C. jejuni and C. coli. Considering S. Enteritidis from human infections and poultry six countries reported data. Therefore, no analysis was performed.
11. Discussion
This report is the product of the first concerted effort by ECDC, EFSA and EMA to investigate possible relationships, at the EU/EEA level and in Switzerland, between the consumption of the antimicrobial agents and occurrence of antimicrobial resistance in the human and food-producing animal domain. It constitutes an attempt to provide an integrated ecological study between available data on consumption of antimicrobial agents and occurrence of antimicrobial resistance in bacteria from humans and food-producing animals, provided by the EU-wide surveillance/monitoring programmes. The report investigated the occurrence of resistance in a selection of pathogenic and non-pathogenic bacteria in 2011 and 2012 in the human and the animal domain in relation to the consumption of antimicrobials in these domains, and also using data generated to investigate possible links between the consumption of antimicrobials in food-producing animals domain and the occurrence of resistance in humans.
The report also acknowledges the complexity of addressing potential relationships between consumption and resistance in both domains, taking into account factors influencing emergence and spread of resistance, antimicrobial consumption and consumption patterns, pathways and dissemination of resistance, measuring and monitoring resistance, measuring the consumption of antimicrobials and regulatory activities, both voluntary and legislative, in the relevant sectors. How antimicrobials are used in both sectors is also reviewed in an annex to the report (Annex B), highlighting both similarities and differences in their mode of use, particularly in relation to preventive medication in the animal domain, which is not common in the human domain.
11.1. Systems for surveillance antimicrobial consumption
In the human domain, consumption of antimicrobials is monitored through ESAC-Net. Most countries report data on consumption, one-third of the countries report reimbursement data and a few report both sales and reimbursement data. For animals, consumption data are collected through the ESVAC project, which collects annually harmonised data on consumption of veterinary medical products (VMPs) at package level from most of the EU/EEA countries; these data are not broken down by animal species. Data are collected from a variety of national sources and presented by antimicrobial class or sub-class. In order to standardise the consumption data for the animal population that can be subjected to treatment with antimicrobial agents, a PCU is used as a proxy for the size of the whole animal population at risk of being treated. There is no indicator for the normalisation of consumption data for animals that is directly comparable to the indicators used for consumption by humans.
ECDC/EFSA/EMA first joint report on the integrated analysis of the consumption of antimicrobial agents and occurrence of antimicrobial resistance in bacteria from humans and food-producing animals 636088/2013 Page 65/114

11.2. Systems for monitoring of antimicrobial resistance
In surveillance of resistance, there are considerable differences between the human and animal domains. In the human domain, collection of data is carried out through FWD-Net, and through the EARS-Net. FWD-Net collects resistance data on 19 pathogens, predominantly those transmitted through food and water, e.g. Campylobacter spp., Salmonella spp. and VTEC/STEC. Participating countries report their data to TESSy at ECDC. The resistance data on Campylobacter spp. and Salmonella spp. from humans are published in the joint EFSA/ECDC EU Summary Report on antimicrobial resistance in zoonotic and indicator bacteria obtained from humans, food-producing animals and food. In contrast, EARS-Net is based on a network of representatives from the MSs collecting routine clinical AST data from national resistance surveillance initiatives. Data are reported for eight pathogens which are considered of public health importance (e.g. E. coli, K. pneumoniae, S. aureus). These data, which originate from approximately 900 laboratories serving more than 1 300 hospitals in Europe, are annually reported to ECDC. All EU MSs provide data, and there are considerable differences in the numbers of isolates reported by individual countries. For some bacteria, the interpretive criteria used to assess AST results may differ slightly between the reporting countries. The obligation for the countries to report on antimicrobial resistance in humans is laid down in Commission Decision No 2119/98/EC (Official Journal of the European Communities, 1998)30. The extent of the reporting is not specified and the extensive acquisition of data by the surveillance networks is therefore largely based on voluntary reporting.
In the animal domain, countries are obliged to monitor and report antimicrobial resistance in zoonotic Salmonella spp. and Campylobacter spp. isolates from healthy individuals of the main food-producing animal species and meat thereof. In addition, there are detailed requirements on the harmonised monitoring and reporting of antimicrobial resistance of Salmonella spp. isolates from various poultry populations and pigs, sampled under the corresponding national control and surveillance programmes of Salmonella spp. on a statistically calculated basis. Nevertheless, reported data on isolates from foods were considered insufficient in this framework for meaningful analyses. Thus, food-related data are very limited and as yet conclusions cannot be drawn with confidence from the information submitted by MSs.
Antimicrobial substances included in the harmonised monitoring consist of a concise set of antimicrobials selected according to their relevance to human therapeutic use. In both sectors, the levels of resistance are, in theory, measured using ECOFFs according to EUCAST guidelines, but such measuring is more rigidly applied in the animal sector, whereas in the human sector approximately 60 % of the participating laboratories adhere to EUCAST guidelines. For most antimicrobials surveyed, the ECOFFs approximate to clinical levels but for some, particularly for Salmonella spp., this is not the case for the monitoring of resistance to fluoroquinolones, where the ECOFF is considerably below what is regarded as a therapeutic level. For this reason, some human laboratories report occurrence of resistance interpreted with clinically relevant criteria (either EUCAST or CLSI clinical breakpoints), whereas others report occurrence interpreted with microbiologically relevant ECOFF criteria. Reporting to EFSA of resistance in animal isolates is almost universally interpreted with ECOFFs. These discrepancies make correlation studies difficult, and results, although indicative of correlations in some instances, have to be interpreted with caution.
A further difference between the two domains is that the E. coli isolates from cases of human infection are, for the most part, disease-related isolates and as such may well have been exposed to antimicrobials following treatment of the patients from whom they have been isolated. In contrast, E. coli isolates from animals are indicator commensal organisms which, until recently, have been
30 As of 22 October 2013, Decision No 2119/98/EC was replaced by decision No 1082/2013/EU on serious cross-border threats to health
ECDC/EFSA/EMA first joint report on the integrated analysis of the consumption of antimicrobial agents and occurrence of antimicrobial resistance in bacteria from humans and food-producing animals 636088/2013 Page 66/114

collected on a voluntary basis from a limited number of MSs. Such isolates have most probably not been implicated in disease in their hosts, and therefore may not have been exposed to antimicrobials. Indicator commensal E. coli derived from humans from the community would most likely be a good indicator of the relative exposure to resistant bacteria through food consumption and the direct effect of antimicrobial consumption in humans.
11.3. Comparison of consumption of antimicrobials in humans and food-producing animals
In 15 of 26 countries, consumption of antimicrobials was lower or much lower in food-producing animals than in humans, in three countries consumption was similar in the two groups, and in eight countries consumption in food-producing animals was higher or much higher than in humans. The overall consumption of antimicrobials was lower for humans than for animals. This difference is explained by the influence on the average of a limited number of countries with large animal populations. Moreover, antimicrobial substances requiring relatively high dosing, such as tetracyclines, are mainly used in animals. Only a few quantitative comparisons of consumption of antimicrobials between the human and animal domains have been published previously (DANMAP, 2013; Moulin et al., 2008; Swedres-Svarm, 2013; Wierup et al., 1987). With the exception of Danmap (2013), an approach similar to the one in the present study was used. The unit of measurement, milligrams per kilogram estimated biomass, has certain limitations, and the results should be interpreted with caution. In countries such as Denmark, where data on consumption of antimicrobials for food-producing animals are available by species, the use of DDD per 1 000 individuals per day, for both the human domain and for a particular animal species, are possibly allowing for a better comparison. Future developments of ESVAC with collection of data by species and reporting these data by DDD for animals will make that possible.
The WHO has prioritised 3rd- and 4th-generation cephalosporins and fluoroquinolones, considering them to be among the critically important antimicrobials in human medicine. The consumption of 3rd- and 4th-generation cephalosporins is higher in the human domain than in the animal domain. As these antimicrobials are mainly used in hospitals (e.g. in intensive care units), it is important that their use in both sectors is limited to situations where other antimicrobials are not expected to be effective. For fluoroquinolones, there was more variation between countries in the quantity used in both domains, but in most countries reported consumption was higher in the human sector than for animals. The variation could be explained by differences in the general occurrence of resistance to other antimicrobials but could also be related to other factors, such as number of products on the market, price, availability of diagnostic services and prescribing habits. The Committee for Medicinal Products for Veterinary Use (CVMP) has recommended that, in veterinary medicine, 3rd- and 4th-generation cephalosporins and fluoroquinolones should be reserved for conditions where other antimicrobials are not expected to be effective, and some countries have introduced legislation to support that.
11.4. Consumption of antimicrobials in humans and resistance in bacteria from humans
A positive association was observed between the total consumption of 3rd- and 4th-generation cephalosporins in humans and the occurrence of cephalosporin resistance in E. coli from humans. An association was also observed when data were split into hospital and community consumption. Therefore, the analyses support the hypothesis of selection for 3rd- and 4th-generation cephalosporin resistance in E. coli from humans by consumption of this sub-class. Since country outliers with a relatively high occurrence of resistance despite a low consumption were observed, factors other than the national consumption in humans may be important.
ECDC/EFSA/EMA first joint report on the integrated analysis of the consumption of antimicrobial agents and occurrence of antimicrobial resistance in bacteria from humans and food-producing animals 636088/2013 Page 67/114

For fluoroquinolones, strong associations between the total consumption in humans and the occurrence of fluoroquinolone resistance in E. coli from humans were observed. An association was also observed when analysing community consumption alone. As links were seen for both years studied, and because almost all countries reported data, it seems reasonable to conclude that the consumption of fluoroquinolones, especially in the community, promotes selection of fluoroquinolone resistance in E. coli in humans. Associations between fluoroquinolone consumption and fluoroquinolone resistance in E. coli have been described previously, and the correlation between fluoroquinolone consumption in the community and resistance in invasive E. coli is not unexpected.
When comparing data on consumption of fluoroquinolones with the occurrence of fluoroquinolone resistance in Salmonella spp., S. Enteritidis and S. Typhimurium, no correlation of consumption of this antimicrobial class with resistance was observed in isolates from humans, either when plotting resistance against the total consumption or when splitting consumption of fluoroquinolones into consumption in the community and consumption in the hospital sector. For Campylobacter spp., the only association observed was for the community consumption of fluoroquinolones and resistance to fluoroquinolones in C. coli. No other association was observed between any of the antimicrobials included in the analysis and the occurrence of the resistance in Campylobacter spp. in humans. Comparison of the occurrence of resistance in Salmonella spp. and Campylobacter spp. from humans and the consumption of fluoroquinolones in humans was, to a large extent, hampered by, for example, low numbers of human isolates.
11.5. Consumption of antimicrobials in food-producing animals and resistance in bacteria from food-producing animals
Overall, a positive association between consumption of the selected antimicrobial classes/sub-classes and occurrence of resistance in bacteria from food-producing animals was observed. The strongest associations between consumption and resistance were detected for the antimicrobials studied in relation to indicator E. coli. Positive associations were discerned, but these were generally less marked in Salmonella spp. and Campylobacter spp. than in indicator commensal E. coli.
These differences in the strength of association probably reflect both the degree to which each organism is representative of the entire bacterial population within the animal populations sampled and differences in the epidemiology of each organism (for example, clonal spread only partly related or unrelated to antimicrobial consumption in Salmonella spp., particularly S. Typhimurium and S. Enteritidis). For Salmonella spp. and Campylobacter spp., the prevalence of the bacteria has an impact on the accuracy with which levels of resistance are assessed. Where a particular part of an animal production sector is affected with Salmonella spp./Campylobacter spp., then, ideally, only consumption in that sector should be addressed in the analysis, but such surveillance data are not available.
11.6. Consumption of antimicrobials in food-producing animals and resistance in bacteria from humans
As part of the analyses for this report, the hypothesis that consumption of antimicrobials in food-producing animals may contribute to the occurrence of resistance in humans was addressed using available data on consumption of antimicrobials in food-producing animals and occurrence of resistance in humans. Comparisons in humans were also analysed as antimicrobial consumption in human medicine is presumably the most important driver of resistance in humans. Such analyses are mainly relevant for bacteria with a possible zoonotic aspect (Salmonella spp., Campylobacter spp. and E. coli).
The results show that the occurrence of resistance in E. coli causing BSIs in humans could be correlated with consumption of antimicrobials in food-producing animals and in humans. For use of
ECDC/EFSA/EMA first joint report on the integrated analysis of the consumption of antimicrobial agents and occurrence of antimicrobial resistance in bacteria from humans and food-producing animals 636088/2013 Page 68/114

cephalosporins in humans (in hospitals and in total), a positive association between consumption and resistance was observed. A positive association between consumption in food-producing animals and resistance was also observed. Moreover, resistance in the isolates from humans correlated positively with resistance in isolates from some animal species and vice versa. For fluoroquinolones, similar positive correlations were observed except that resistance correlated with the consumption in the community and not with consumption in hospitals. These differences may be related to differences in the relative extent to which cephalosporins and fluoroquinolones are used in hospitals and in the community in different countries.
11.7. Limitations of the study
In order to compare consumption of antimicrobials in humans and food-producing animals, it was necessary to convert data for human medicine to milligrams per kilogram estimated biomass. There are many limitations with this measure, and they hamper the comparison. Notably, the overall numerator does not take the differences in dose of different antimicrobials into account. In some countries, data for human medicine do not cover hospital consumption or the whole population. Further, the denominator used for consumption of antimicrobials in human medicine may be an overestimate as data on human weights are uncertain, and as age “at risk” for treatment was not taken into account. Taken together, data on consumption of antimicrobials for human medicine, expressed as milligrams per kilogram estimated biomass, is likely to be an underestimate. A further limitation is that the denominator used for consumption of antimicrobials in animals is a sum of the mass of different animal species and does not account for differences in the relative composition of the national animal populations summed, although antimicrobial use may differ markedly between the various animal populations (i.e. production sectors) of a given animal species. When examining these data, it is important that all these limitations are kept in mind.
A further significant limitation is that consumption data for the different food-producing animal species are not available, which hampers more precise identification of correlations between consumption by animal species and resistance. Other sources of contamination with antimicrobial-resistant Salmonella spp. strains (e.g. companion animals or plant produce) may be a factor in some MSs, and should also be taken into consideration. Another related limitation is that consumption and resistance data are not available for all countries and also that there are differences in the reporting of resistance by different countries, although a number of countries and related available data have not been included in the analysis, as the “summary indicator” of resistance required resistance data on the three animal species addressed. By construction, this indicator is partly associated with the structure of animal production in the reporting countries, which could be different to food consumption by humans.
The lack of data on the occurrence of resistance in isolates from food of animal origin has also been highlighted. Besides transmission of antimicrobial resistance via the environment and contact with animals carrying resistant bacteria, transmission is also possible by foodstuffs, especially food of animal origin. To date, the precise attribution of the different transmission routes of the various foodborne pathogens to the total burden of disease in humans is not known because of shortage in data. The same goes for the attribution of different transmission routes and pathogens to food-borne antimicrobial resistance. Within the farm-to-fork concept, the relation between resistance in foodstuffs and humans could be unravelled by using sufficient and harmonised data on the prevalence of resistant bacteria in the different foodstuffs and the consumption patterns. Such data are scarce and reported by only a few countries. In this report, the impact of food-borne antimicrobial resistance could therefore not be specified and quantified. Instead, we provided a comparison of data on antimicrobial resistance in food-producing animals and in humans.
ECDC/EFSA/EMA first joint report on the integrated analysis of the consumption of antimicrobial agents and occurrence of antimicrobial resistance in bacteria from humans and food-producing animals 636088/2013 Page 69/114

There are also differences in the interpretation of resistance (clinical break-points, ECOFFs) to some antimicrobials (e.g. fluoroquinolones), both within countries for isolates from humans and between animal and human isolates, with the isolates from animals interpreted with ECOFFs. This aspect is further addressed in the Annex C.
An individual bacterial isolate may be resistant to several different antimicrobials simultaneously. Many different patterns of multidrug resistance can occur in individual bacteria within a bacterial population. Use of one antimicrobial can thus select for bacteria which are resistant not only to that antimicrobial but also to other antimicrobials (co-selection). In addition, some resistance mechanisms confer resistance to a number of different antimicrobials, which may be from different classes (cross-resistance). When investigating the association between antimicrobial use and antimicrobial resistance, the phenomena of co-selection and cross-resistance are therefore additional factors which may influence observed associations. This analysis has concentrated on investigating the associations between consumption of an antimicrobial or antimicrobial class and resistance to that antimicrobial or class; future refinement of the analysis could take account of these other additional factors. EU surveillance programmes are increasingly collecting the more detailed information which would be required for such analysis, in particular isolate-based data, providing information on the relative frequency of different MDR patterns.
Another limitation relates to biases inherent in the ecological analyses, such as those conducted in the framework of this report. The report utilises data collected at national level over a limited period of time on antimicrobial consumption in humans and food-producing animals and on antimicrobial resistance in bacteria isolated from diseased people and bacteria isolated from healthy food-producing animals. As this ecological study is based on population data at the national level, the significant correlations observed must be considered in the light of the complexity of the relationship between consumption and resistance (see Annex C, section 3.1). This kind of study investigates only the possible link between global antimicrobial consumption (proxy for exposure) in humans/animal populations and the occurrence of resistance in bacteria isolated from the different populations (outcome). Since both exposure and outcome are ascertained simultaneously, the temporal sequence of exposure and outcome cannot be clearly assured. Such studies are susceptible to other internal validity limitations, such as information biases related to their retrospective and national nature and confounding factors.
National human and animal exposures were compared. In humans, isolates are obtained from clinical cases which can be associated with recent antimicrobial exposure. Isolates from healthy animals come from different animal species, with large variation in conditions of life and antimicrobial exposure. Data on occurrence of the antimicrobial resistance are obtained from phenotypic methods according to different methods of interpretation. The same phenotype of antimicrobial susceptibility can result from the expression of different resistance genes and the spread of mobile genetic elements which may harbour these genes. Results are expressed and analysed at bacterial species level (or at serovar level for Salmonella) but without information about their epidemiology in the different animal species (clones). The phenotypic expression of resistance to the same antimicrobial in isolates from humans and food animals is not necessarily indicative of correlation in terms of identity of the organism and the resistance mechanisms therein.
In summary, the findings of these ecological analyses should be considered as hypotheses for subsequent testing by targeted research (e.g. at farm/hospital level) that in turn can provide better explanations for the associations observed by ecological studies. In that sense, ecological studies should be complemented with more targeted studies, as they may address effects of a number of factors, such as those referred to in Annex C, section 3.1. For example, trade-related and sociological factors such as the movement of animals and people between countries and the importation of
ECDC/EFSA/EMA first joint report on the integrated analysis of the consumption of antimicrobial agents and occurrence of antimicrobial resistance in bacteria from humans and food-producing animals 636088/2013 Page 70/114

contaminated food from countries outside the reporting countries have also not been taken into account. The results of this ecolological analysis should be read in the light of other reports demonstrating a relationship between antimicrobial resistance and individual exposure to antimicrobials (pharmacology), group exposure to antimicrobials (observational, including cross-sectional, cohort and time series studies) and interventional studies (quasi-experimental, randomised controlled clinical trials).
The results and conclusions in this report are based on thorough scientific interpretation of available antimicrobial resistance and consumption data from the human and animal domains in the reporting countries. Owing to the limitations and conditions mentioned above, the results of these ecological analyses should be interpreted with caution.
12. Conclusions
This first report analyses data provided by MSs and other EEA countries during the period 2011–2012 and is the first integrated report by ECDC, EFSA and EMA analysing possible relationships between the consumption of antimicrobial agents and occurrence of antimicrobial resistance in the human and food-producing animal sectors.
The report is the product of an on-going collaboration between the three EU agencies, including harmonisation of approaches, expertise and previous joint publications on related subjects.
The analyses have been made possible by the fact that, in the reporting countries, data are available on consumption of and resistance to antimicrobials in humans and for food-producing animals. This provides a unique opportunity to perform ecological studies (integrated analysis). Furthermore, the surveillance systems have improved considerably since their implementation. In both domains, the surveillance systems are increasingly harmonised, more detailed data are being collected, and more countries are participating, which should facilitate similar analyses in the future.
Ideally, for the present type of analyses, there should be an acceptable degree of harmonisation of materials and methods, interpretation criteria (resistance) and units of measurement (antimicrobial consumption). In the present datasets, sample selection and methodologies for susceptibility testing are not fully standardised across the sectors, and neither are the interpretation criteria. This is also true for data on consumption of antimicrobials, where the units of measurement differ.
The analyses showed that, in 15 of 26 countries, average antimicrobial consumption was lower or much lower in food-producing animals than in humans, in three countries consumption was similar in the two groups, and in eight countries consumption in food-producing animals was higher or much higher than in humans. In most countries, the consumption of fluoroquinolones was higher in the human sector than in the animal sector. In all countries, consumption of 3rd- and 4th-generation cephalosporins was much higher in humans than in food-producing animals.
Overall, associations were observed between antimicrobial consumption and resistance prevalence for the selected bacterium–antimicrobial combinations which were analysed, in animals, in humans, and from animals to humans. For Salmonella spp., this was less clear, underlining the fact that resistance epidemiology is complex and influenced by many factors aside from use of a particular class of antimicrobials, for example co-selection and clonal spread. Such factors could not be taken into account in the analyses.
It is expected that improvement of existing systems will enable better-integrated analyses of consumption of antimicrobial agents and occurrence of antimicrobial resistance in bacteria from humans and food-producing animals in the future.
ECDC/EFSA/EMA first joint report on the integrated analysis of the consumption of antimicrobial agents and occurrence of antimicrobial resistance in bacteria from humans and food-producing animals 636088/2013 Page 71/114

In particular, this refers to the following on-going actions aiming to:
• refine existing surveillance systems by providing more detailed information on antimicrobialconsumption by age and gender in humans and by species and production types in animals;
• provide enhanced data on hospital consumption in more countries;
• provide more comprehensive data on foods—types, prevalence of bacteria and resistance;
• provide isolate-based data to enable analysis of the effects of co-selection.
It is important that any improvement of data collection is coordinated between the different surveillance networks, aiming at integrated analysis of the data.
With the aim of having fully integrated surveillance systems in the EU, monitoring of antimicrobial resistance should also include:
• animal pathogens;
• commensal flora from both healthy and diseased persons;
• information about the origin of the food and/or animals.
The results of ecological studies which demonstrate associations should be complemented by other epidemiological and molecular studies to investigate possible epidemiological and causal pathways underpinning the associations observed. When correlation has been identified in terms of phenotypic resistance, in-depth identification and molecular characterisation of isolates from humans and food-producing animals, including the resistance mechanisms therein, are desirable.
Finally, there is a need to promote responsible use of antimicrobials in both humans and animals.
ECDC/EFSA/EMA first joint report on the integrated analysis of the consumption of antimicrobial agents and occurrence of antimicrobial resistance in bacteria from humans and food-producing animals 636088/2013 Page 72/114

1. Annex A
1.1. Legislation of medicinal products
The European system offers different routes for obtaining a marketing authorisation for a medicinal product. Under the centralised procedure, companies submit an application to the EMA. The EMA’s Committee for Medicinal Products for Human Use (CHMP) or Committee for Medicinal Products for Veterinary Use (CVMP) carries out a scientific assessment of the application and gives a recommendation on whether or not to grant a marketing authorisation. Once granted by the European Commission, the centralised marketing authorisation is valid in all EU MSs31. This allows the MAH to market the medicine and make it available to patients and healthcare professionals throughout the EU on the basis of a single marketing authorisation. The use of the centralised procedure is compulsory for certain medicines, and most innovative medicines, including newly developed antimicrobials, have to go through this procedure. The majority of medicines do not fall within the scope of the centralised procedure but are authorised by national competent authorities (NCAs) in the MS. When a company wants to authorise a medicine in several MSs, it can use one of the following procedures: the decentralised procedure, whereby companies can apply for simultaneous authorisation of a medicine in more than one EU MS if it has not yet been authorised in any EU country and it does not fall within the mandatory scope of the centralised procedure; or the mutual-recognition procedure, whereby companies that have a medicine authorised in one or more EU MS can apply for this authorisation to be recognised in other EU countries. This process allows MSs to rely on each other’s scientific assessments. Data requirements for obtaining a marketing authorisation in the EU are the same, irrespective of the authorisation route for a medicine.
1.1.1. Regulation of human medicinal products
To guarantee the protection of public health and to ensure the availability of high-quality, safe and efficacious medicines for European citizens, all medicines must be authorised before they can be placed on the market in the EU. The requirements and procedures for the marketing authorisation for medicinal products for human use, as well as the rules for the constant supervision of products after they have been authorised, are primarily laid down in Directive 2001/83/EC (Official Journal of the European Communities, 2001a) and in Regulation (EC) No 726/2004 (Official Journal of the European Union, 2004c). Further details on the regulatory system can be found on the EC website32 as well as on the EMA website33.
New legislation governing the development and authorisation of medicines for use in children aged 0-17 years was introduced in the EU in December 2006. This piece of legislation—Regulation (EC) No 1901/2006 as amended (Official Journal of the European Union, 2006)—was introduced to ensure the availability of high-quality information about medicines used by children.
The European Parliament adopted a non-legislative resolution on antimicrobial resistance which emphasised the need for a more prudent use of antimicrobials and the development of new medicinal products in the light of emerging MDR organisms. In response to the European Parliament resolution, the EC issued in 2011 an EU-wide plan to combat antimicrobial resistance34. The action plan contains actions to promote, in a staged approach, unprecedented collaborative research and development efforts to bring new antimicrobials to patients by public–private collaboration in a longer term
31 Norway, Iceland and Liechtenstein have, through the European Economic Area agreement, adopted the complete Community acquis on medicinal products, and consequently are parties to the centralised procedure. Switzerland’s legislation is not addressed in this text. 32 http://ec.europa.eu/health/human-use/index_en.htm 33 http://www.ema.europa.eu 34 http://ec.europa.eu/dgs/health_consumer/docs/communication_amr_2011_748_en.pdf
ECDC/EFSA/EMA first joint report on the integrated analysis of the consumption of antimicrobial agents and occurrence of antimicrobial resistance in bacteria from humans and food-producing animals 636088/2013 Page 73/114

perspective and enabling fast-track procedures for the marketing authorisation of new antimicrobials. The action plan also highlights the requirements of strengthen the surveillance systems on resistance and antimicrobial consumption in human and veterinary medicine.
Antimicrobials for human use have to be used in accordance with the Summary of Product Characteristics (SPC) of the marketing authorisation. In certain cases (e.g. treatment of neonates), the vast majority of treatment of infections by antimicrobials is not in accordance with the SPC, mainly because the SPC is based on studies with adults and therefore does not include an indication for treatment of children. Such use outside the terms of the SPC would be a so-called "off-label" use of medicinal products which is not regulated by EU legislation. It is the marketing authorisation which defines the approved indications, and any departure from those terms will remain, in most MSs, the responsibility of the prescribing physician.
1.1.2. Regulation of veterinary medicinal products
The regulation of marketing authorisations for veterinary medicinal products is harmonised in the EU/EEA by Regulation (EC) No 726/2004 (Official Journal of the European Union, 2004c) and Directive 2001/82/EC (Official Journal of the European Communities, 2001b), as amended. As indicated above, there are several routes for obtaining a marketing authorisation. Although it is currently not obligatory, most new antimicrobials are authorised by the Commission, leading to the same approved conditions of use all over EU/EEA.
Pharmacologically active substances that may be used in food-producing animals have to be listed in Table 1 of the Annex to Commission Regulation (EU) No 37/2010 (Official Journal of the European Union, 2009). The table details, among others, the food-producing animal species for which maximum residue limits (MRLs) are established. Table 2 of that annex contains substances that are prohibited from being used in any food-producing species; some of these substances are included in Table 8 in the present report, because they are used in companion animals for which no MRLs are required.
All medicinal products for animals are authorised following a risk assessment procedure during which the quality, safety for animals and safety for consumers (where relevant), impact on the environment and efficacy are assessed. This assessment includes the assessment of the risk of antimicrobial resistance from the use of those products on animals. The market for veterinary medicinal products is much smaller than that of medicinal products for humans. The global market for human pharmaceuticals is worth 40 times more than its veterinary equivalent35. As a result, authorised medicinal products might not be available for the treatment of diseases in animals in certain countries. Legal provisions allow, by exception, the use of medicines not in accordance with the SPC, by Directive 2001/82/EC (Official Journal of the European Communities, 2001b), as amended. Article 1(16) of this Directive defines “off-label” use as follows: “The use of a veterinary medicinal product that is not in accordance with the summary of the product characteristics (SPC), including the misuse and serious abuse of the product”. Veterinarians can apply the so-called “cascade” which is a set of structured steps that indicate the medicines that can be used off-label in a certain situation (Articles 10 and 11 of EU Directive 2004/28/EC (Official Journal of the European Union, 2004a)).
Veterinary antimicrobials are in practice “prescription only”; this status makes it compulsory that a veterinarian prescribes a veterinary antimicrobial before the use of an antimicrobial.
35 IFAH-Europe (2008) Facts and Figures about the European Animal Health Industry. Available online: http://www.ifaheurope.org/ifah-media/publications.html?year=2014
ECDC/EFSA/EMA first joint report on the integrated analysis of the consumption of antimicrobial agents and occurrence of antimicrobial resistance in bacteria from humans and food-producing animals 636088/2013 Page 74/114

1.2. How antimicrobials are used in humans and food-producing animals
1.2.1. General considerations
The efficacy of an antimicrobial treatment is a function of both its antibacterial activity and the immune response of the individual (human or animal) treated. During such clinical recovery, return to a normal physiological state results from a pattern of the immune response, the bacterial lesion at infection site, the major organ burden, the local inflammatory response and the recovery capacity. Clinical cure is not always associated with bacteriological cure, as clinical recovery may result in the healthy carriage of the pathogen or the expression of a chronic disease. Conversely, bacteriological cure may not systematically mean clinical recovery, in particular whenever tissue lesion, acute inflammatory response and high major organ burden leads to major tissue lesions or even to death.
1.2.2. How antimicrobials are used in humans
In the reporting countries, antimicrobials for systemic use are legally available on prescription only (see section 1.1.1. of this annex), although existing data on the actual practice in the EU/EEA countries suggest that a small number of antimicrobials are sold without prescription (Safrany and Monnet, 2012).
Antimicrobials can be given for different reasons. The two major reasons are:
• Treatment. The patient receiving the antimicrobial shows clinical signs of an infectious disease. Ifthe pathogen is not identified using microbiological techniques or rapid test diagnostics, then thetreatment is considered empirical. Usually antimicrobials with a broader spectrum are selected soas to cover the assumed infectious agents while accounting for their local antimicrobialsusceptibilities. If the pathogen has been identified, the empirical treatment should be replaced bya antimicrobial therapy specifically targeted at the identified pathogen.
• Prophylaxis. The patient receiving the antimicrobial does not show any sign of infection.Prophylaxis is used to prevent the patient who is or will be at risk from developing an infectiousdisease. Examples are patients with a severe chronic disease, such as cystic fibrosis orimmunosuppression, who in certain circumstances are given medical prophylaxis to prevent themdeveloping an infection. Surgical prophylaxis is administered prior to the start of surgicalinterventions in patients with specific individual risks or undergoing types of operations associatedwith a high risk of postoperative surgical site infections. Another type of application of antimicrobialprophylaxis is the deployment of infectious agents during clusters or outbreaks of severeinfections; individuals with proven or probable close contacts to infected patients can receiveantimicrobials.
Use of antimicrobials also differs depending on the type of healthcare sector. Most of the use happens in the “primary care sector”, i.e. in the community. On average, around 10 % of the total use occurs in the hospital sector. In addition, the patterns of consumption in terms of choice of substances and dose differ between healthcare sectors.
In the community, the range of diseases treated with antimicrobials is rather limited, with the majority of the cases being non-complicated respiratory or urinary tract infections. For these reasons, antimicrobials should be used only when indicated and, when prescribing antimicrobials, narrow-spectrum drugs should be used, preferably following national guidelines. In the community, almost all the antimicrobials prescribed are for oral use (parenteral use represents less than 1 %), mostly for ease of use by the patients themselves.
ECDC/EFSA/EMA first joint report on the integrated analysis of the consumption of antimicrobial agents and occurrence of antimicrobial resistance in bacteria from humans and food-producing animals 636088/2013 Page 75/114

In the hospital sector, infections are often much more severe and the variety of infections is greater than in the community. Moreover, microorganisms found in hospitals are also often more resistant to antimicrobials than those responsible for infections in the community. In the hospital sector, the treatment of infections is more complex because of the large range of type of infections, pathogens and patient case-mix. Therefore, compared with the community, specific antimicrobial prescribing practices, such as prescribing of broader spectrum antimicrobials, higher doses and longer treatments, are required in hospitals although antimicrobial stewardship tends to limit their harmful impact in terms of resistance. Even if the total number of antimicrobials used in hospitals is much lower than that used in the community, the density of consumption in one place causes a huge selection pressure on the microorganisms present in the hospitals, leading to the emergence and spread of MDR pathogens.
Another point to note is the blurring of the borders separating the community and hospital sectors in terms of antimicrobial consumption. For instance, the situation in nursing homes, which are considered primary care or community settings, tends to be more similar to what is found in hospital (relatively high density of prescribing, more resistant pathogens, frail people in one place). On the other hand, patients discharged early from hospital and continuing their antimicrobial course at home, or receiving outpatient care (such as outpatient parenteral antimicrobial therapy), are examples of hospital sector-related antimicrobial use which is moving into the community.
Antimicrobial consumption can be reported by different indicators. Historically, the weight of active substances or the price was used. Both indicators have many limitations, the former when comparing active substances with different doses and the latter when comparing the use of drugs over time, as values of currency may change. Used in Scandinavian countries for decades, the defined daily dose (DDD) was developed by the WHO Collaborating Centre for Drug statistics Methodology to overcome the limitations of the previous indicators. When the surveillance of antimicrobial consumption in EU/EEA countries started in 2001, the indicator chosen for reporting consumption of antimicrobials in humans was numbers of DDDs per 1 000 inhabitants and per day. As this indicator has also its own limitations, more recently a new indicator of antimicrobial use had been developed and used. In Europe, no national figures on the number of prescriptions are readily available, but the number of packages or boxes of antimicrobials sold or reimbursed is available. Under the assumption that for each prescription one package or box is delivered to the patient, this indicator has also been used as a proxy indicator for the number of prescriptions. In the USA, days of therapy has recently been introduced as a new indicator to report antimicrobial use in US hospitals.
ECDC/EFSA/EMA first joint report on the integrated analysis of the consumption of antimicrobial agents and occurrence of antimicrobial resistance in bacteria from humans and food-producing animals 636088/2013 Page 76/114
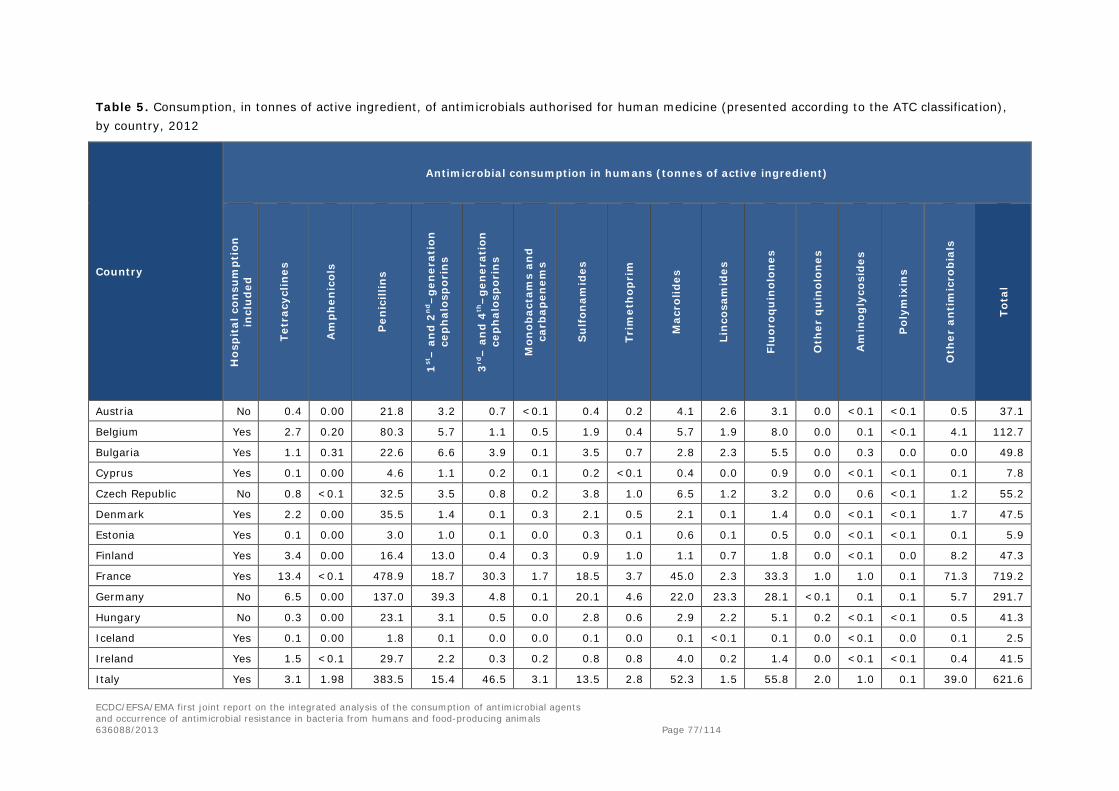
Table 5. Consumption, in tonnes of active ingredient, of antimicrobials authorised for human medicine (presented according to the ATC classification), by country, 2012
Country
Antimicrobial consumption in humans (tonnes of active ingredient)
Hos
pit
al c
onsu
mpt
ion
in
clu
ded
Tetr
acyc
lines
Am
phen
icol
s
Pen
icill
ins
1st–
an
d 2
nd–
gen
erat
ion
ce
ph
alos
por
ins
3rd
– a
nd
4th
–ge
ner
atio
n
cep
hal
osp
orin
s
Mon
obac
tam
s an
d ca
rbap
enem
s
Su
lfon
amid
es
Trim
eth
opri
m
Mac
rolid
es
Lin
cosa
mid
es
Flu
oroq
uin
olon
es
Oth
er q
uin
olon
es
Am
inog
lyco
side
s
Pol
ymix
ins
Oth
er a
nti
mic
rob
ials
Tota
l
Austria No 0.4 0.00 21.8 3.2 0.7 <0.1 0.4 0.2 4.1 2.6 3.1 0.0 <0.1 <0.1 0.5 37.1
Belgium Yes 2.7 0.20 80.3 5.7 1.1 0.5 1.9 0.4 5.7 1.9 8.0 0.0 0.1 <0.1 4.1 112.7
Bulgaria Yes 1.1 0.31 22.6 6.6 3.9 0.1 3.5 0.7 2.8 2.3 5.5 0.0 0.3 0.0 0.0 49.8
Cyprus Yes 0.1 0.00 4.6 1.1 0.2 0.1 0.2 <0.1 0.4 0.0 0.9 0.0 <0.1 <0.1 0.1 7.8
Czech Republic No 0.8 <0.1 32.5 3.5 0.8 0.2 3.8 1.0 6.5 1.2 3.2 0.0 0.6 <0.1 1.2 55.2
Denmark Yes 2.2 0.00 35.5 1.4 0.1 0.3 2.1 0.5 2.1 0.1 1.4 0.0 <0.1 <0.1 1.7 47.5
Estonia Yes 0.1 0.00 3.0 1.0 0.1 0.0 0.3 0.1 0.6 0.1 0.5 0.0 <0.1 <0.1 0.1 5.9
Finland Yes 3.4 0.00 16.4 13.0 0.4 0.3 0.9 1.0 1.1 0.7 1.8 0.0 <0.1 0.0 8.2 47.3
France Yes 13.4 <0.1 478.9 18.7 30.3 1.7 18.5 3.7 45.0 2.3 33.3 1.0 1.0 0.1 71.3 719.2
Germany No 6.5 0.00 137.0 39.3 4.8 0.1 20.1 4.6 22.0 23.3 28.1 <0.1 0.1 0.1 5.7 291.7
Hungary No 0.3 0.00 23.1 3.1 0.5 0.0 2.8 0.6 2.9 2.2 5.1 0.2 <0.1 <0.1 0.5 41.3
Iceland Yes 0.1 0.00 1.8 0.1 0.0 0.0 0.1 0.0 0.1 <0.1 0.1 0.0 <0.1 0.0 0.1 2.5
Ireland Yes 1.5 <0.1 29.7 2.2 0.3 0.2 0.8 0.8 4.0 0.2 1.4 0.0 <0.1 <0.1 0.4 41.5
Italy Yes 3.1 1.98 383.5 15.4 46.5 3.1 13.5 2.8 52.3 1.5 55.8 2.0 1.0 0.1 39.0 621.6
ECDC/EFSA/EMA first joint report on the integrated analysis of the consumption of antimicrobial agents and occurrence of antimicrobial resistance in bacteria from humans and food-producing animals 636088/2013 Page 77/114
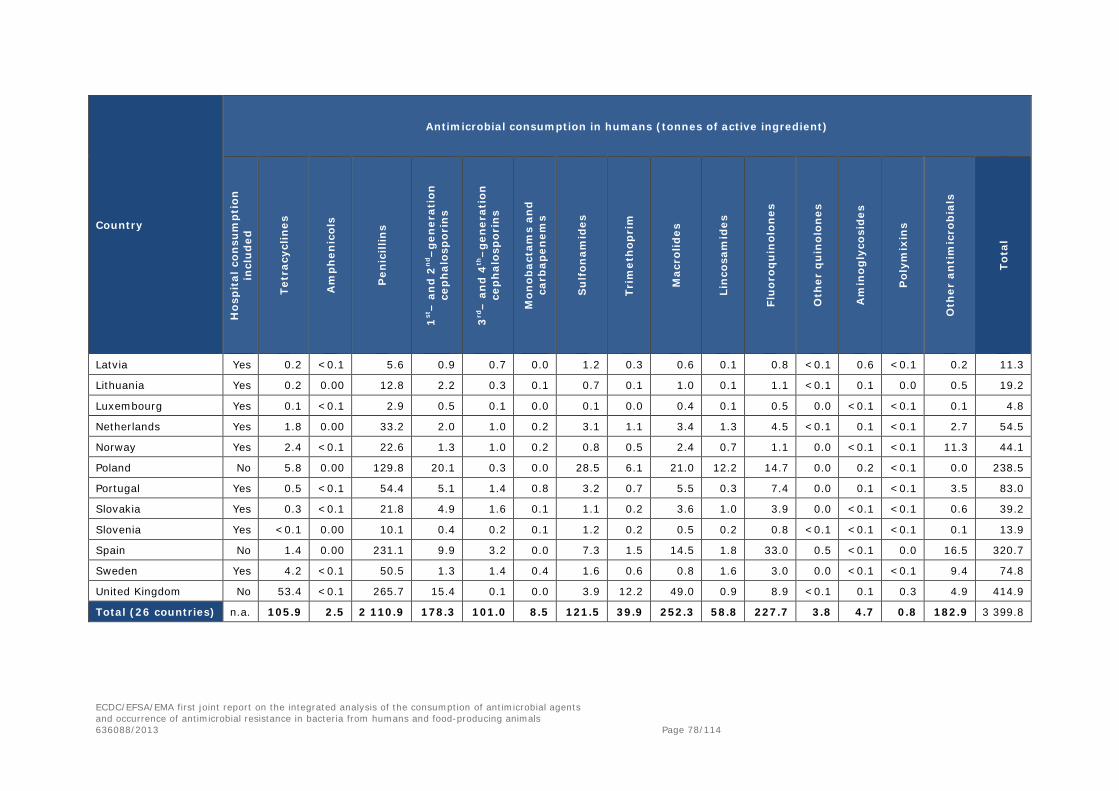
Country
Antimicrobial consumption in humans (tonnes of active ingredient)
Hos
pit
al c
onsu
mpt
ion
in
clu
ded
Tetr
acyc
lines
Am
phen
icol
s
Pen
icill
ins
1st–
an
d 2
nd–
gen
erat
ion
ce
ph
alos
por
ins
3rd
– a
nd
4th
–ge
ner
atio
n
cep
hal
osp
orin
s
Mon
obac
tam
s an
d ca
rbap
enem
s
Su
lfon
amid
es
Trim
eth
opri
m
Mac
rolid
es
Lin
cosa
mid
es
Flu
oroq
uin
olon
es
Oth
er q
uin
olon
es
Am
inog
lyco
side
s
Pol
ymix
ins
Oth
er a
nti
mic
rob
ials
Tota
l
Latvia Yes 0.2 <0.1 5.6 0.9 0.7 0.0 1.2 0.3 0.6 0.1 0.8 <0.1 0.6 <0.1 0.2 11.3
Lithuania Yes 0.2 0.00 12.8 2.2 0.3 0.1 0.7 0.1 1.0 0.1 1.1 <0.1 0.1 0.0 0.5 19.2
Luxembourg Yes 0.1 <0.1 2.9 0.5 0.1 0.0 0.1 0.0 0.4 0.1 0.5 0.0 <0.1 <0.1 0.1 4.8
Netherlands Yes 1.8 0.00 33.2 2.0 1.0 0.2 3.1 1.1 3.4 1.3 4.5 <0.1 0.1 <0.1 2.7 54.5
Norway Yes 2.4 <0.1 22.6 1.3 1.0 0.2 0.8 0.5 2.4 0.7 1.1 0.0 <0.1 <0.1 11.3 44.1
Poland No 5.8 0.00 129.8 20.1 0.3 0.0 28.5 6.1 21.0 12.2 14.7 0.0 0.2 <0.1 0.0 238.5
Portugal Yes 0.5 <0.1 54.4 5.1 1.4 0.8 3.2 0.7 5.5 0.3 7.4 0.0 0.1 <0.1 3.5 83.0
Slovakia Yes 0.3 <0.1 21.8 4.9 1.6 0.1 1.1 0.2 3.6 1.0 3.9 0.0 <0.1 <0.1 0.6 39.2
Slovenia Yes <0.1 0.00 10.1 0.4 0.2 0.1 1.2 0.2 0.5 0.2 0.8 <0.1 <0.1 <0.1 0.1 13.9
Spain No 1.4 0.00 231.1 9.9 3.2 0.0 7.3 1.5 14.5 1.8 33.0 0.5 <0.1 0.0 16.5 320.7
Sweden Yes 4.2 <0.1 50.5 1.3 1.4 0.4 1.6 0.6 0.8 1.6 3.0 0.0 <0.1 <0.1 9.4 74.8
United Kingdom No 53.4 <0.1 265.7 15.4 0.1 0.0 3.9 12.2 49.0 0.9 8.9 <0.1 0.1 0.3 4.9 414.9
Total (26 countries) n.a. 105.9 2.5 2 110.9 178.3 101.0 8.5 121.5 39.9 252.3 58.8 227.7 3.8 4.7 0.8 182.9 3 399.8
ECDC/EFSA/EMA first joint report on the integrated analysis of the consumption of antimicrobial agents and occurrence of antimicrobial resistance in bacteria from humans and food-producing animals 636088/2013 Page 78/114
1.2.3. How antimicrobials are used in food-producing animals
There are three reasons for administering antimicrobials to the animals:
• Treatment. This refers to the treatment of an individual animal, or a group of animals, showingclinical signs of an infectious disease.
• Metaphylaxis. This refers to the administration of the product at the same time to a group ofclinically healthy (but presumably infected) in-contact animals, to prevent them fromdeveloping clinical signs, and to prevent further spread of the disease. The presence of thedisease in the group/flock must be established before the product is used. A metaphylaxisclaim will always have to be combined with a treatment claim.
• Prevention. This refers to the administration of an antimicrobial veterinary medicinal product toan individual healthy animal to prevent infection. Such a claim will be considered only in thosesituations where the risk of infection is very high and the consequences are severe. Preventionclaims are not expected to be common and will be carefully scrutinised to ensure that theintended use complies with responsible use principles. The need for prevention must be fullyjustified for each target species and indication.
In some parts of the world, antimicrobial agents are used as “growth promoters” at low doses in animal feeding-stuff without a therapeutic purpose but to improve productivity. On 1 January 2006, the authorisations of all antimicrobial agents for use as growth promoters were withdrawn in the EU by Regulation (EC) No 1831/2003 (Official Journal of the European Union, 2003b).
Antimicrobial agents may be administered via the food or water to groups of farm animals or the whole herd. This is typically done in poultry production, in which individual treatment is difficult because of the large number of animals in each flock (except for some specific cases, e.g. breeders). Group medication is also common in pigs and intensively reared calves. In adult cattle, but also in adult pigs, individual treatments, e.g. with injectables, is common practice. Companion animals are almost exclusively treated individually.
According to the EU agri-environmental indicator, in 2010 almost two-thirds of livestock in the EU was on holdings of 100 or more livestock animals, this proportion having decreased slightly between 2005 and 2010. Almost half of the EU livestock is cattle, the majority of which are to be found on holdings with 100 or more head of cattle; pigs are also mostly found on holdings with 100 or more head. Data from FAO indicate that the number of live animals in Europe (41 countries) in 2012 was as follows: cattle and buffaloes, 121 896 932; pigs, 183 940 345; poultry birds, 2 314 442 750; goats, 16 557 060; horses, 5 783 491; rabbits and hares, 119 695 000; and sheep, 128 618 357 (source: FAO Statistical Databases (FAOSTAT)36).
Official figures for companion animals are often not available, but it is estimated that about 25 % of European households own at least one cat or one dog (The European Pet Food Industry (FEDIAF) Facts & Figures, 201237)
Pharmaceutical forms applicable for group treatment (premix, oral powder and oral solution) are the biggest-selling veterinary antimicrobial veterinary medicinal products, accounting for 91 % of consumption (Figure 21); products for individual treatment includes injection, bolus, oral paste and intramammary and intrauterine preparations (EMA/ESVAC, 2014).
36 http://faostat3.fao.org/faostat-gateway/go/to/download/Q/QA/E 37 http://www.fediaf.org/facts-figures/
ECDC/EFSA/EMA first joint report on the integrated analysis of the consumption of antimicrobial agents and occurrence of antimicrobial resistance in bacteria from humans and food-producing animals 636088/2013 Page 79/114

Figure 21. Distribution of consumption, in milligrams per PCU, of veterinary antimicrobial agents for food-producing animals (including horses), stratified into forms applicable for group treatment and for treatment of individual animals. Data consist of total consumption in the 26 EU/EEA countries for 201238
In the case of most antimicrobial classes, consumption by animals is typically of pharmaceutical forms applicable for group treatment. The exceptions are 3rd- and 4th-generation cephalosporins, which are used solely for individual treatment (injectable and intramammary preparations) (Figure 22) (EMA/ESVAC, 2014).
Figure 22. Distribution of consumption, in milligrams per PCU, of 3rd- and 4th-generation cephalosporins, fluoroquinolones, macrolides and tetracyclines, stratified into forms applicable for group treatment and for treatment of individual animals. Based on data on consumption for food-producing animals (including horses) in 26 EU/EEA countries for 2012 (EMA/ESVAC, 2014)
38 http://www.ema.europa.eu/docs/en_GB/document_library/Report/2014/10/WC500175671.pdf
ECDC/EFSA/EMA first joint report on the integrated analysis of the consumption of antimicrobial agents and occurrence of antimicrobial resistance in bacteria from humans and food-producing animals 636088/2013 Page 80/114

1.2.4. Data on antimicrobial consumption in food-producing animals
Table 6. Consumption, in tonnes of active ingredient, of veterinary antimicrobials applicable mainly for food-producing animal species, including horses, by antimicrobial class (presented according to ATCvet hierarchical system, tablets not included), by country, 2012
Country
Antimicrobial consumption in food-producing animals (tonnes of active ingredient) Te
trac
yclin
es
Am
phen
icol
s
Pen
icill
ins
1st-a
nd
2n
d-g
en.
cep
hal
osp
orin
s
3rd
-an
d 4
th-g
en.
cep
hal
osp
orin
s
Su
lfon
amid
es
Trim
eth
opri
m
Mac
rolid
es
Lin
cosa
mid
es
Flu
oroq
uin
olon
es
Oth
er q
uin
olon
es
Am
inog
lyco
side
s
Pol
ymyx
ins
Ple
uro
mu
tilin
s
Oth
er1
Tota
l
Austria 29.9 0.3 7.9 0.1 0.3 5.7 0.8 4.4 0.3 0.5 1.3 0.7 0.4 0.4 53.0 Belgium 60.0 1.4 76.5 0.1 0.8 71.7 14.4 12.3 5.2 1.4 2.7 1.6 9.6 2.4 6.7 267.2 Bulgaria 17.3 0.5 4.3 0.02 0.01 1.0 0.1 6.5 1.2 2.4 0.1 1.6 1.5 1.0 1.0 38.4 Cyprus 14.2 0.1 7.4 0.004 0.1 8.7 1.7 2.4 5.6 0.1 0.3 0.6 0.9 2.5 0.4 45.0 Czech Republic 20.0 0.4 12.3 0.2 0.2 8.6 0.8 3.8 0.3 1.2 0.05 1.7 0.6 3.2 0.4 53.7 Denmark 32.5 0.8 27.4 0.1 0.1 11.1 2.2 12.4 2.5 0.02 2.1 3.6 0.6 9.3 2.4 107.0 Estonia 1.8 0.02 2.6 0.1 0.1 0.1 0.02 0.5 0.1 0.1 0.6 0.6 0.6 0.2 7.3 Finland 1.8 0.1 6.4 0.04 0.01 2.5 0.5 0.6 0.1 0.1 0.03 0.1 12.2 France 323.0 4.7 80.9 1.6 2.3 141.4 21.2 57.9 4.4 4.6 5.3 54.8 50.1 5.7 3.6 761.5 Germany 599.3 5.4 564.5 0.5 3.7 161.6 26.2 133.0 16.4 10.0 31.4 123.6 22.3 9.6 1 707.5 Hungary 99.5 2.0 32.6 0.2 0.2 4.9 1.1 4.3 4.5 8.0 0.2 1.9 5.7 12.8 0.6 178.5 Iceland 0.04 0.3 < 0.001 0.04 0.01 < 0.001 0.02 0.2 0.003 0.7 Ireland 37.2 2.0 21.7 0.6 0.2 19.7 1.5 6.7 0.4 1.0 8.4 0.2 0.01 0.5 100.0 Italy 478.2 16.9 358.1 1.1 1.8 174.0 22.8 139.0 59.6 11.4 30.2 22.0 135.3 51.5 32.3 1 534.3 Latvia 2.5 0.005 1.6 0.03 0.1 0.2 0.05 0.3 0.02 0.3 0.001 0.7 0.4 0.4 0.1 6.7 Lithuania 2.4 0.2 4.9 0.3 0.02 0.9 0.2 1.5 0.1 0.2 0.1 1.5 0.4 0.2 0.4 13.4 Luxembourg 0.8 0.05 0.4 0.02 0.03 0.4 0.1 0.1 0.04 0.03 0.001 0.04 0.1 0.02 0.1 2.2 Netherlands 96.6 3.0 54.7 0.2 0.1 41.0 7.8 25.5 0.9 0.8 2.3 6.0 3.2 2.2 1.5 245.7 Norway 0.2 0.2 2.8 0.001 1.5 0.3 0.003 0.02 1.4 0.6 0.1 0.004 7.1 Poland 211.1 7.1 129.4 0.9 0.5 44.6 3.2 22.8 5.3 32.2 0.5 35.6 15.6 4.3 3.3 516.4
ECDC/EFSA/EMA first joint report on the integrated analysis of the consumption of antimicrobial agents and occurrence of antimicrobial resistance in bacteria from humans and food-producing animals 636088/2013 Page 81/114
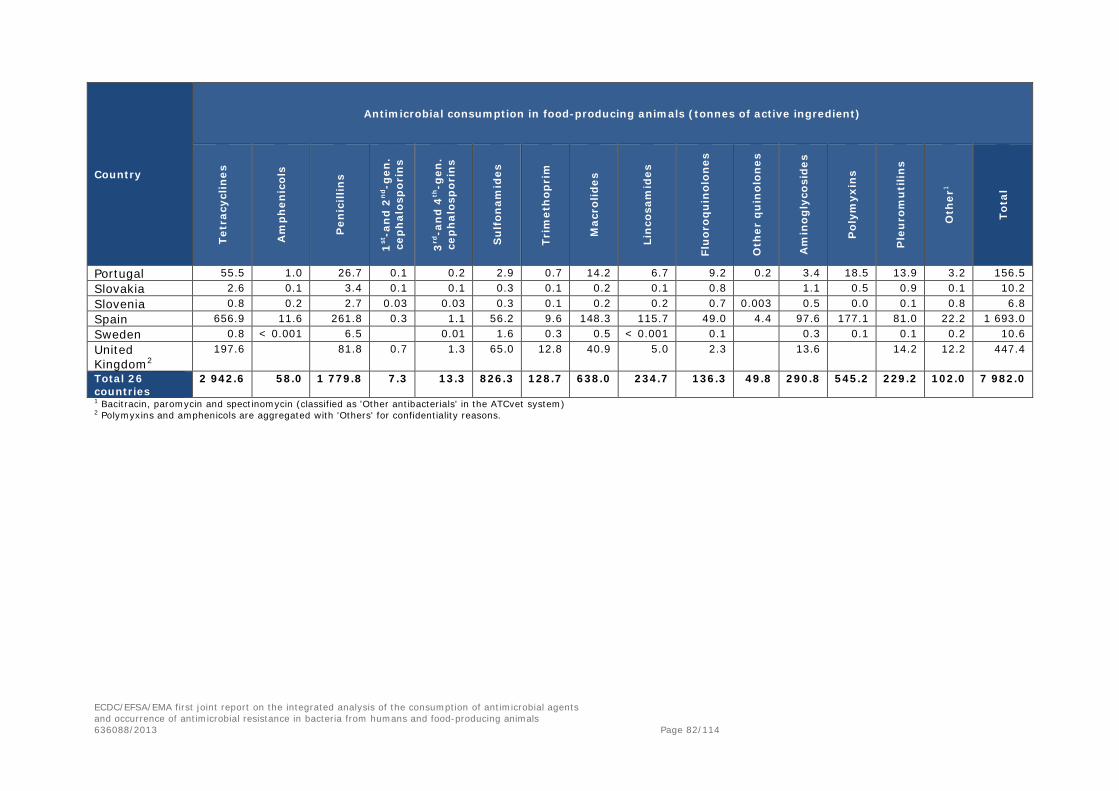
Country
Antimicrobial consumption in food-producing animals (tonnes of active ingredient)
Tetr
acyc
lines
Am
phen
icol
s
Pen
icill
ins
1st-a
nd
2n
d-g
en.
cep
hal
osp
orin
s
3rd
-an
d 4
th-g
en.
cep
hal
osp
orin
s
Su
lfon
amid
es
Trim
eth
opri
m
Mac
rolid
es
Lin
cosa
mid
es
Flu
oroq
uin
olon
es
Oth
er q
uin
olon
es
Am
inog
lyco
side
s
Pol
ymyx
ins
Ple
uro
mu
tilin
s
Oth
er1
Tota
l
Portugal 55.5 1.0 26.7 0.1 0.2 2.9 0.7 14.2 6.7 9.2 0.2 3.4 18.5 13.9 3.2 156.5 Slovakia 2.6 0.1 3.4 0.1 0.1 0.3 0.1 0.2 0.1 0.8 1.1 0.5 0.9 0.1 10.2 Slovenia 0.8 0.2 2.7 0.03 0.03 0.3 0.1 0.2 0.2 0.7 0.003 0.5 0.0 0.1 0.8 6.8 Spain 656.9 11.6 261.8 0.3 1.1 56.2 9.6 148.3 115.7 49.0 4.4 97.6 177.1 81.0 22.2 1 693.0 Sweden 0.8 < 0.001 6.5 0.01 1.6 0.3 0.5 < 0.001 0.1 0.3 0.1 0.1 0.2 10.6 United Kingdom2
197.6 81.8 0.7 1.3 65.0 12.8 40.9 5.0 2.3 13.6 14.2 12.2 447.4
Total 26 countries
2 942.6 58.0 1 779.8 7.3 13.3 826.3 128.7 638.0 234.7 136.3 49.8 290.8 545.2 229.2 102.0 7 982.0
1 Bacitracin, paromycin and spectinomycin (classified as 'Other antibacterials' in the ATCvet system) 2 Polymyxins and amphenicols are aggregated with 'Others' for confidentiality reasons.
ECDC/EFSA/EMA first joint report on the integrated analysis of the consumption of antimicrobial agents and occurrence of antimicrobial resistance in bacteria from humans and food-producing animals 636088/2013 Page 82/114

Table 7. Estimated PCU (in 1 000 tonnes) of the population of food-producing animal species1 (including horses), by country, for 2012
Country Estimated number of population correction units (PCUs) (in 1 000 tonnes)
Cattle Pigs Poultry Sheep/goats Fish Rabbits Horses Total
Austria 435 384 81 35 30 966 Belgium 461 916 167 16 0.6 4 94 1 658 Bulgaria 134 62 45 99 0.01 48 388 Cyprus 16 51 13 32 0.2 2 113 Czech Republic 284 198 112 17 21 10 32 673 Denmark 410 1 808 105 2 34 66 2 424 Estonia 61 43 17 6 0.4 4 131 Finland 222 171 65 11 12.7 30 511 France 3 465 1 855 1 146 665 234 52 200 7 618 Germany 3 129 3 957 903 144 20 185 8 338 Hungary 144 277 180 96 0.01 31 727 Iceland 19 6 5 47 7 31 116 Ireland 1 007 267 83 304 36 28 1 725 Italy 1 746 991 715 611 195 33 210 4 500 Latvia 109 33 15 0.3 5 162 Lithuania 206 75 45 6 7 339 Luxembourg 37 11 0.03 0.03 2 50 Netherlands 991 1 475 496 99 46 3 169 3 279 Norway 221 127 66 101 1 321 14 1 851 Poland 1 542 1 345 901 18 102 3 908 Portugal 237 343 199 177 9 8 22 996 Slovakia 99 49 51 33 2 235 Slovenia 100 26 35 12 1 0.04 10 183 Spain 881 3 321 728 1 459 274 75 258 6 996 Sweden2 304 202 81 51 145 783 United Kingdom 1 709 733 1 040 2 700 172 395 6 749 Total 26 countries 17 970 18 724 7 295 6 742 2 384 184 2 121 55 421
1 For animal categories included, see Annex 3. 2 Farmed fish not included.
ECDC/EFSA/EMA first joint report on the integrated analysis of the consumption of antimicrobial agents and occurrence of antimicrobial resistance in bacteria from humans and food-producing animals 636088/2013 Page 83/114
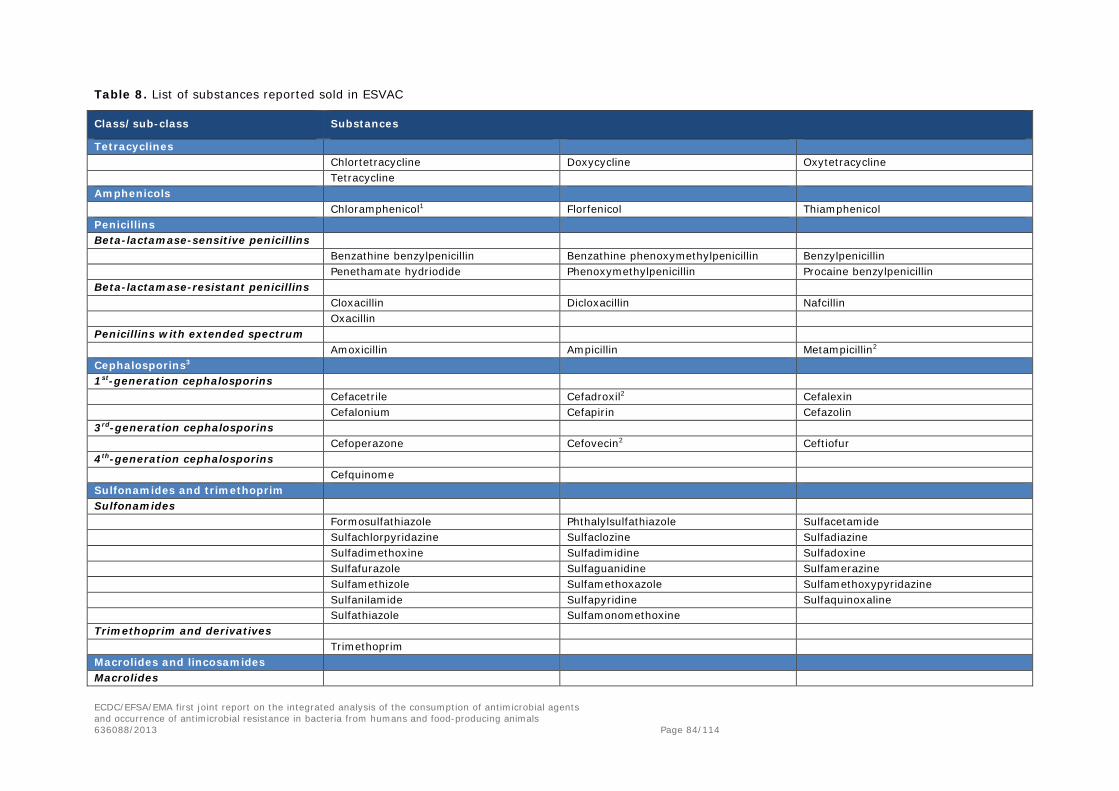
Table 8. List of substances reported sold in ESVAC
Class/sub-class Substances
Tetracyclines Chlortetracycline Doxycycline Oxytetracycline Tetracycline
Amphenicols Chloramphenicol1 Florfenicol Thiamphenicol
Penicillins Beta-lactamase-sensitive penicillins
Benzathine benzylpenicillin Benzathine phenoxymethylpenicillin Benzylpenicillin Penethamate hydriodide Phenoxymethylpenicillin Procaine benzylpenicillin
Beta-lactamase-resistant penicillins Cloxacillin Dicloxacillin Nafcillin Oxacillin
Penicillins with extended spectrum Amoxicillin Ampicillin Metampicillin2
Cephalosporins3 1st-generation cephalosporins
Cefacetrile Cefadroxil2 Cefalexin Cefalonium Cefapirin Cefazolin
3rd-generation cephalosporins Cefoperazone Cefovecin2 Ceftiofur
4th-generation cephalosporins Cefquinome
Sulfonamides and trimethoprim Sulfonamides
Formosulfathiazole Phthalylsulfathiazole Sulfacetamide Sulfachlorpyridazine Sulfaclozine Sulfadiazine Sulfadimethoxine Sulfadimidine Sulfadoxine Sulfafurazole Sulfaguanidine Sulfamerazine Sulfamethizole Sulfamethoxazole Sulfamethoxypyridazine Sulfanilamide Sulfapyridine Sulfaquinoxaline Sulfathiazole Sulfamonomethoxine
Trimethoprim and derivatives Trimethoprim
Macrolides and lincosamides Macrolides
ECDC/EFSA/EMA first joint report on the integrated analysis of the consumption of antimicrobial agents and occurrence of antimicrobial resistance in bacteria from humans and food-producing animals 636088/2013 Page 84/114
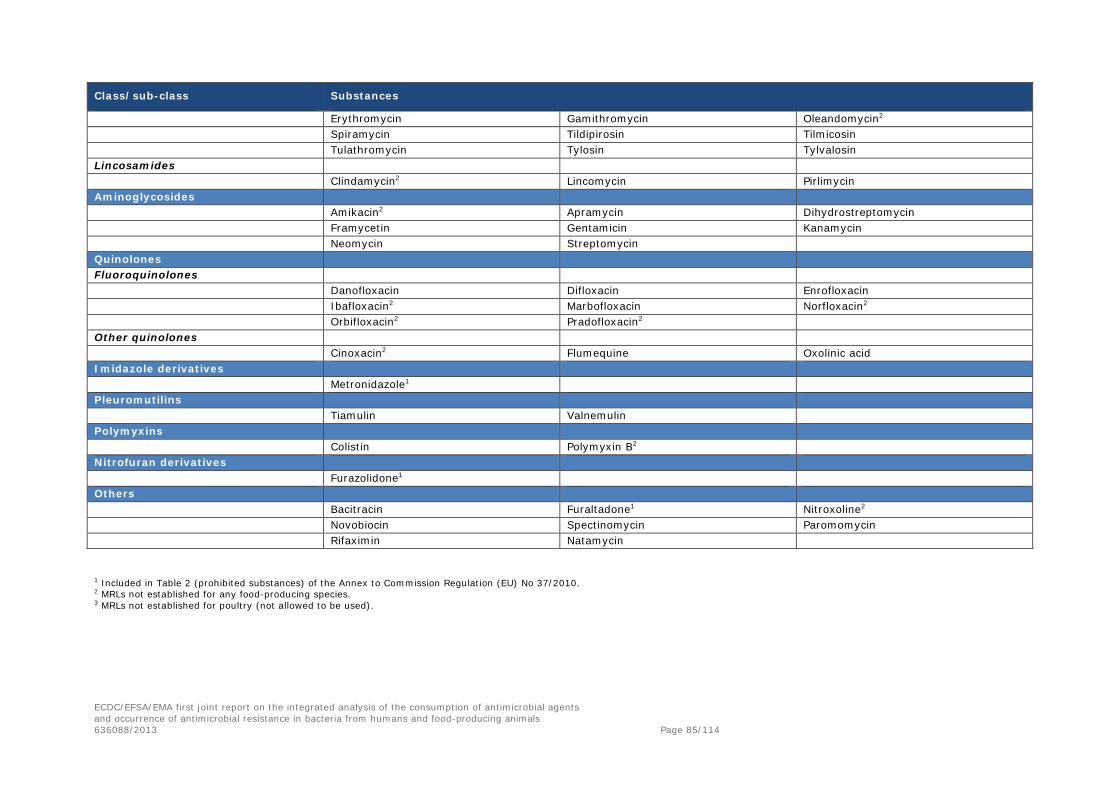
Class/sub-class Substances
Erythromycin Gamithromycin Oleandomycin2 Spiramycin Tildipirosin Tilmicosin Tulathromycin Tylosin Tylvalosin
Lincosamides Clindamycin2 Lincomycin Pirlimycin
Aminoglycosides Amikacin2 Apramycin Dihydrostreptomycin Framycetin Gentamicin Kanamycin Neomycin Streptomycin
Quinolones Fluoroquinolones
Danofloxacin Difloxacin Enrofloxacin Ibafloxacin2 Marbofloxacin Norfloxacin2 Orbifloxacin2 Pradofloxacin2
Other quinolones Cinoxacin2 Flumequine Oxolinic acid
Imidazole derivatives Metronidazole1
Pleuromutilins Tiamulin Valnemulin
Polymyxins Colistin Polymyxin B2
Nitrofuran derivatives Furazolidone1
Others Bacitracin Furaltadone1 Nitroxoline2 Novobiocin Spectinomycin Paromomycin Rifaximin Natamycin
1 Included in Table 2 (prohibited substances) of the Annex to Commission Regulation (EU) No 37/2010. 2 MRLs not established for any food-producing species. 3 MRLs not established for poultry (not allowed to be used).
ECDC/EFSA/EMA first joint report on the integrated analysis of the consumption of antimicrobial agents and occurrence of antimicrobial resistance in bacteria from humans and food-producing animals 636088/2013 Page 85/114

2. Annex B
2.1. Comparison of how antimicrobials are used in food-producing animals and humans
Table 9 summarises some of the differences in how antimicrobials are used in humans and in food-producing animals.
Table 9. The use of antimicrobials in humans and in food-producing animals
Humans Food-producing animals and products thereof Comments
Patient characteristics
Species One Many –
Number of individuals 507 416 607 (EU-28 countries, year 201439)
1 898 767 540 (EU-28 countries, year 201340)
Ratio humans/animals: about 1 to 4
Biomass (kg) 31 713 537 938 (number of individuals in the EU-28 countries in 2014 multiplied by 62.5 kg/person)
Meat: 45 073 838 750 Eggs: 6 689 713 000 Milk: 155 919 234 300 Honey: 191 119 000 (EU-28 countries, 201241) Fish: 2 588 521 149 (EU-28 countries, 201242) Total: 210 462 426 199
Ratio human biomass/animal meat43: 41 %/59 %
Individual weight Variable Very variable Animals can be treated with doses of 50 g (one-day-old chicks) up to 1 000 kg
Lifespan Long Short in most cases Food animals are consumed by humans as food
Conditions for treatment
Individual treatment Yes Yes Companion animals, horses, dairy cows, adult cattle, adult pigs
Group treatment Exceptional Yes Group treatment on farms
Route of administration Oral (e.g. tablets, syrup), injectables and others
Oral (in feed or drinking water), injectables and others
Medicines for animals are focussed into efficient administration for group treatment
Adapted from http://agriculture.gouv.fr/IMG/pdf/12_MOULIN_DGAL_14nov_GMF_cle8bfb48.pdf
39 Eurostat: http://epp.eurostat.ec.europa.eu/tgm/table.do?tab=table&init=1&plugin=1&language=en&pcode=tps00001 40 FAOSTAT live animals. Heads of cattle, buffaloes, sheep, goats, pigs, horses, assess, mules, chickens, ducks, geese, guinea fowls, turkeys, rabbits, hares, pigeons and other birds. No fish or bees included. http://faostat3.fao.org/download/Q/QA/E 41 FAOSTAT livestock primary. Kilograms of indigenous cattle, buffalo, sheep, goat, pigs, horse, mule, ass, chicken and other poultry. Fish production not included. http://faostat3.fao.org/download/Q/QL/E 42 FAOSTAT aquaculture. Fish, crustaceans, molluscs and others. 43 The ratio excludes eggs, milk, honey and fish. http://data.fao.org/dataset?entryId=033ae7cf-b322-4dc5-8dfe-140140c56008&tab=about
ECDC/EFSA/EMA first joint report on the integrated analysis of the consumption of antimicrobial agents and occurrence of antimicrobial resistance in bacteria from humans and food-producing animals 636088/2013 Page 86/114

2.2. Calculation of standard human body weight
2.2.1. Introduction
The authors reached the consensus that mg/kg of body weight is an acceptable unit of measurement to compare antimicrobial consumption in the food-producing animal and human sectors. For food-producing animals, the PCU was used for the calculations. For the human sector, a standardised body weight taking into account the distribution of the population (children, adult, the elderly, men, women) was used. Data on international human body weights are scarce. For instance, in relation to antimicrobial consumption, the definition of the DDD mentions that it is based an adult of 70 kg. In addition, although there are many publications on body mass index and obesity, they do not provide data on body weight. For this reason, the authors made the decision to estimate a standard human body weight from published EU data.
2.2.2. Existing data
In its scientific opinion entitled “Guidance on selected default values to be used by the EFSA Scientific Committee, Scientific Panels and Units in the absence of actual measured data” (EFSA, 2012a), EFSA proposed standard body weights for adults and children. These standard body weights were defined based on a review of EFSA publications and surveys. For adults, the standard body weight was defined as 70 kg. For children, different body weights, depending on age, were proposed (Table 10).
Eurostat publishes data on the EU population by age and gender for all MSs and for the whole EU. These data are available in the EUROSTAT table entitled “demo_pjan”.
Table 10. Proposed standard body weights for children by EFSA
Age (years) Mean (kg)
Infants (0–3 months) 4.8
Infants (3–6 months) 6.7
Infants (6–12 months) 8.8
Toddlers (1–3 years) 11.9
Other children (3–10 years) 23.1
Adolescents (10–14 years) 43.4
Adolescents (14–18 years) 61.3
ECDC/EFSA/EMA first joint report on the integrated analysis of the consumption of antimicrobial agents and occurrence of antimicrobial resistance in bacteria from humans and food-producing animals 636088/2013 Page 87/114

2.2.3. Methodology
To compare antimicrobial consumption between humans and food-producing animals, the following methods, based on data provided by EFSA and EUROSTAT were applied to define a standard human body weight:
1. An average body weight for children below one year of age was calculated as Eurostat providespopulation data only by year.
2. An average body weight for children aged 1–18 years (including toddlers, other children andadolescents as defined in Table 10) was calculated,
3. A standard body weight for humans was calculated using the proposed adult body weight andthe calculated average child body weight.
The EUROSTAT population for the EU-27 in 2012 was used as reference data for the population.
Average body weight for children below one year of age
The average weight for children below one year of age was calculated by taking a weighted mean of the proposed body weights of the three categories and using the number of months of each age category as weight.
Average body weight for children
The average body weight for children was obtained by calculating a weighted mean of the calculated average body weight for children below one year of age and the proposed body weights for the categories of children above one year of age and using the number of children in each category extracted from Eurostat as weight for the mean.
To estimate a standard body weight for children from 0 to 18 years of age, the weighted mean of the EFSA proposed body weight by class of children from 1 to 18 years of age and of the aforementioned calculated body weight for children below one year was computed. The Eurostat population figures were used to weight the different classes of children. The standard body weight for children was estimated as 34.6 kg.
Standard human body weight
The standard human body weight was calculated by applying the weighted mean of the average child body weight (34.6 kg) to the population below 20 years of age and the proposed 70 kg for the population older or equal to 20 years of age and using the corresponding population figures extracted from Eurostat as weight for the mean.
Based on this methodology, the calculated standard human body weight was 62.5 kg.
ECDC/EFSA/EMA first joint report on the integrated analysis of the consumption of antimicrobial agents and occurrence of antimicrobial resistance in bacteria from humans and food-producing animals 636088/2013 Page 88/114

3. Annex C
3.1. On the complexity of the relation between antimicrobial consumption and resistance
3.1.1. Factors influencing the emergence and spread of resistance
Fundamental to the spread of bacteria resistant to an antimicrobial or antimicrobials is the process of selection, whereby a single resistant bacterium in a population is provided with the opportunity to become more prevalent as a result of the killing or suppression of the previously dominant sensitive population. Such opportunities are afforded by selection following the application of an antimicrobial or antimicrobials to which the organism exhibits reduced susceptibility or clinical resistance. The single resistant organism then survives to reproduce, often in an exponential progression, until a new equilibrium is reached, thereby becoming the principal organism in the bacterial population (Baquero, 2011).
Several genetic, bacterial and environmental factors interact in the selection and dissemination of antimicrobial resistance in bacteria at different levels. For antimicrobials used for therapy, the principal genetic and bacterial factors are the resistance determinants, the genetic environment of the resistance determinants within the bacterial cell and the bacterial strain. These factors, and their interactions in the development and subsequent transmission of resistance within and between clones, strains or even species, are summarised in Table 11, and described in more detail below.
Table 11. Factors contributing to the selection and dissemination of antimicrobial resistance
Genetic/bacterial factors Description Process of
resistance transmission Further considerations
Resistance determinants
• Size• Mechanism of resistance
(mutation or genelocated on mobilegenetic element)
• Functions encoded• Copy number
• Vertical spread• Horizontal spread
• Cross-resistance
Genetic environment
• Chromosome• Mobile genetic elements
• Reproduction• Conjugation• Transformation• Transduction
• Co-resistance• Fitness in cell
Bacterial species
• Expressed resistancephenotype
• Spread of bacterialpopulation
• Carriage by host (foodanimal, human being)
• Antimicrobialsusceptibility
• Growth rate• Associated virulence
characteristics• Host factors (e.g. farm,
hospital)
3.1.1.1. Resistance determinants
Bacterial cells can harbour numerous genes or mutations, which may be located on the chromosome, on mobile genetic elements, or on both. Some specific bacterial species are naturally resistant because of the absence or inaccessibility of target structures for antimicrobial action. In other bacterial species, the core genome may contain genes encoding resistance to an antimicrobial. When such resistance is a
ECDC/EFSA/EMA first joint report on the integrated analysis of the consumption of antimicrobial agents and occurrence of antimicrobial resistance in bacteria from humans and food-producing animals 636088/2013 Page 89/114
species property, it is defined as “natural” or “intrinsic” resistance. Chromosomally located genes encoding resistance defined as “intrinsic” represent about 3 % of the bacterial genome (Fajardo et al., 2008). In contrast, “acquired resistance” results from the acquisition of mutations or resistance genes located on mobile genetic elements. These processes are variable and are dependent on the bacterial species as well as numerous external factors such as those listed above.
3.1.1.2. Genetic environment
In bacterial cells, genes or mutations encoding resistance to antimicrobials may be present on the chromosome or on mobile genetic elements such as integrons, transposons, resistance islands, integrative/conjugative elements and plasmids, or on both. The spatial organisation of such resistance determinants and their regulation is fundamental for the multiplication and transmission of antimicrobial resistance genes within and between bacterial species and their expansion through clonal spread, or by horizontal transfer of mobile genetic elements. Plasmids or other mobile genetic elements may be directly transmitted between bacteria by conjugation. In addition, part of bacterial genome, released by cell lysis, can be partially acquired by competent cell by transformation and can also be transferred by transduction when bacterial cells are infected by bacteriophages.
3.1.1.3. Bacterial species, clones, cross-resistance and co-resistance
A major consideration in the acquisition of antimicrobial resistance is the inherently clonal nature of bacterial populations. This is a consequence of their asexual reproduction, acting in combination with a diversity of events, such as the repeated use of the same drugs at the same location (e.g. farms), as is the case for exposure to antimicrobials. In theory, a clone is a bacterial population derived from a unique bacterial cell. Organisms within that clone should be genetically identical and should respond in similar ways to antimicrobial selection pressure. In a bacterial species, numerous different clones may be present and their development will be dependent of their survival capacities in different environments. Such clones can harbour and disseminate different plasmids or mobile genetic elements, which are considered to be major vehicles for the dissemination of resistance within and between bacterial species. Furthermore, mutations causing resistance to certain antimicrobials might occur and be clonally spread because of further vertical transmission in the reproductive process, and be selected when environmental pressure occurs.
Numerous genes and mutations are involved in encoding antimicrobial resistance mechanisms which may affect several substances of a specific antimicrobial class. The situation in which a single antimicrobial resistance mechanism is associated with resistance to several antimicrobials in the same class and/or other classes is defined as “cross-resistance”. This can be caused by a single mechanism affecting single targets that influence the effects of different antimicrobials or because of unspecific efflux mechanisms.
Alternatively, the simultaneous presence of different antimicrobial genes giving rise to resistance to several different classes is defined as “co-resistance”. Antimicrobial treatment with one compound of any one of these antimicrobial classes may select this type of MDR clone and co-select resistance for the different antimicrobial families.
3.1.1.4. Clonal spread of resistance
Clonal spread of antimicrobial resistance strains in food animals and in the community has been demonstrated in in Salmonella spp., extended-spectrum beta-lactamase (ESBL)-producing E. coli, staphylococci (e.g. methicillin-resistant Staphylococcus aureus (MRSA)) and vancomycin-resistant enterococci (VRE), and to a lesser extent in Campylobacter spp. Although antimicrobial consumption is
ECDC/EFSA/EMA first joint report on the integrated analysis of the consumption of antimicrobial agents and occurrence of antimicrobial resistance in bacteria from humans and food-producing animals 636088/2013 Page 90/114

undoubtedly an important risk factor in the clonal spread of, for example, VRE in poultry, such spread can take place without any obvious direct antimicrobial involvement. Thus, clonal spread of both pathogens and non-pathogens in human and animal hosts, both within countries and across country boundaries, can profoundly affect conclusions about antimicrobial consumption and resistance development, as in many cases resistance which is spread by this means cannot be directly linked to antimicrobial consumption.
3.1.1.5. Other factors
Other factors influencing the emergence and spread of resistance are related to the microbiota (any exposure of a bacterial population to antimicrobials results in a selective pressure on the microbiota in favour of resistant strains), the host (e.g. animal species, disease status, age, immunity to infection), the bacterial population and the environment. Environmental factors are in general related to the modes of transmission of the drug-resistant bacterial strain and the genes. Animals can be exposed to antimicrobial-resistant bacteria present in their environment (e.g. litter, farm equipment), through contaminated feed, water, or the farm environment. Transmission also can be related to their parents (sows to piglets, cows to calves) or their origin (poultry breeding flocks via hatcheries). All of these routes are influenced by other factors such as:
• managerial practices on the farm;
• hygiene (cleaning, disinfection, use of biocides), biosecurity measures, management of slurry, farmorganisation, all of which influence transmission of bacteria between animals and environment;
• soil/water contamination by a low level of antimicrobials and heavy metals, which may also be asource of selective pressure on bacteria in an animal environment.
3.1.2. Antimicrobial use and selection pressure
Studies of the relationship between antimicrobial treatment and risk of selection of resistance in both humans and animals show the inter-relation among drug concentration, duration of exposure and bacterial load. If the pathogen bacterial load is low (e.g. when a treatment is administered at the beginning of infection), treatment duration can be short provided the dose is efficient, which limits the exposure of intestinal microbiota and the risk of selection. If treatment starts late in the course of infection, a higher dose and a longer duration may be needed, which results in greater exposure of the microbiota, thereby increasing the risk of selection of resistance. Moreover, in the animal production sector, antimicrobial treatment may be administered to individuals or groups of animals according to herd management. When treatments are targeted at an individual or a limited number of sick animals, the quantities of antimicrobials consumed will be lower than when large groups of animals with different levels of infection are treated simultaneously. The same quantity of drug can be related to a sub-dosing in group treatments for a longer period or a correct treatment for a group. Thus, information about the daily dose, duration of treatment, number of animal treated, as well as consumption data, may be important in assessing the likelihood of resistance development. This complementary information is not available in the ecological analyses performed in the framework of this report.
3.1.3. Pathways of dissemination of resistance
The main events contributing to the acquisition by animals or humans of antimicrobial-resistant bacteria are the intake of contaminated feed, food or water and contact with surface material or other material, such as faeces, which has become contaminated with antimicrobial-resistant bacteria.
ECDC/EFSA/EMA first joint report on the integrated analysis of the consumption of antimicrobial agents and occurrence of antimicrobial resistance in bacteria from humans and food-producing animals 636088/2013 Page 91/114

Bacterial cells containing resistance genes or mutations can be disseminated by different pathways in different ecosystems. As components of animal slurry, they can reach the soil and water environment through deposit of manure as fertiliser on arable land, and then can be mobilised by rain and water flow to reach the watershed and rivers. As components of human sewage, they can be transferred by flow to waste water treatment plants and then, if they survive water treatment (filtration, disinfection), or if resistance genes are transferable to bacterial species adapted to a water environment, reach rivers and potable water. Moreover, access to slurry or sewage by wildlife animals, such as birds, pets, mice, rats and insects, may contribute to the local, regional and/or global dissemination of resistance (e.g. wild migrating birds). Resistant bacteria can be also transferred from soil or water to plants and can contaminate feed and food produced during cultivation and the processing of plants.
Bacterial contamination of carcasses/meat by the gastro-intestinal flora of food-producing animals may primarily occur during the slaughter process. Contamination of milk can also contribute to human exposure to resistant bacteria. Such contamination may take place as a result of failure in the pasteurisation process or when milk is consumed in the raw, untreated state, by direct contamination from the milk-producing animal or by contamination in bulk milk tanks before distribution to the consumer (EFSA, 2015). A further route by which resistant bacteria may reach the consumer is by consumption of uncooked or lightly cooked eggs which contain resistant organisms. Surface contamination of eggs with resistant bacteria is also a potential route for the transmission of such bacteria, particularly in some countries outside the EU (Threlfall et al., 2014). Resistant bacteria can also reach consumers through the consumption of food of non-animal origin which may have been contaminated with drug-resistant bacteria during cultivation/processing. The number of resistant bacteria reaching the consumer by these routes is extremely difficult to quantify, and is dependent on the country of origin of the product and the hygiene systems within such countries.
Occupational exposure of farm workers and veterinarians has been also reported, as has exposure of owners of companion animals and family members. Such exposure is particularly relevant in the case of livestock-associated MRSA. Exposure of people by contact with food or animals that are contaminated with resistant bacteria could be another route for transfer. As some bacteria can survive in biofilms or in dust, they can be present on different materials and vehicles, or in animals and plants, food or feed, and then move from one environment to another by travel and transportation (Figure 23).
ECDC/EFSA/EMA first joint report on the integrated analysis of the consumption of antimicrobial agents and occurrence of antimicrobial resistance in bacteria from humans and food-producing animals 636088/2013 Page 92/114

Figure 23. Exchange of resistance mechanisms and bacteria between different reservoirs
3.2. Measuring and monitoring of antimicrobial resistance in humans and food-producing animals
3.2.1.1. Measurement of resistance
In the first instance, the measurement of antimicrobial resistance is dependent on the definitions used, such as threshold values used to categorise bacteria as resistant or susceptible, or the study of a specific mechanism that confers resistance (e.g. enzymatic degradation of an antimicrobial by ESBL-producing enzymes). Indeed, in the EU, for some antimicrobials, the epidemiological cut-off (ECOFF) distinguishing wild-type susceptible strains from non-wild-type ones differs from the clinical breakpoint used for diagnosis and prognostic of treatment outcomes (see EUCAST). The conclusion of a study can differ according to the cut-off used.
A second consideration is whether the organism is resistant to a single antimicrobial or to more than one antimicrobial. Bacteria may exhibit co-resistance to different families of antimicrobials because of the presence of multiple resistance genes on genetic elements. In such cases, relationships between antimicrobial consumption will not be necessarily be synonymous.
ECDC/EFSA/EMA first joint report on the integrated analysis of the consumption of antimicrobial agents and occurrence of antimicrobial resistance in bacteria from humans and food-producing animals 636088/2013 Page 93/114

Figure 24. Comparison of clinical breakpoints and epidemiological cut-off values (ECOFFs) used to interpret MIC data reported for Salmonella spp. from humans, animals or food
Note: CLSI (M100-S22 2012), EUCAST clinical breakpoints (2011), EUCAST ECOFFS (as in EFSA, 2007). Empty fields mean that no breakpoint is available.
Adapted from EFSA/ECDC report (EFSA/ECDC, 2014)
A third consideration is the choice of specimens to be included. In human medicine, the four options for the choice of specimen are (1) surveillance cultures that detect colonisation (usually performed for research or infection control purposes), (2) any clinical cultures taken during routine care of the patient (which, if positive, do not necessarily indicate infection), (3) microbiologically and clinically documented infections (i.e. a positive culture plus signs and symptoms of infection) and (4) site-specific cultures (e.g. blood cultures) (Wener et al., 2010). The last three options are more commonly available, but the risk factors identified by using these samples may be more appropriate for developing infections rather than those for the harbouring of resistant bacteria. Only the first option, the use of surveillance cultures, will identify asymptomatic carriers. For veterinary medicine, data about antimicrobial resistance have, for the most part, been derived from zoonotic or indicator bacteria isolated from asymptomatic carrier animals.
Antimicrobial resistance can be measured in several ways. The most common method is to measure the proportion of resistant isolates among all isolates at the diagnostic laboratory. For example, a hospital’s “antibiogram” may note that 20 % of all enterococci detected in its laboratory are resistant to vancomycin.
A major drawback when using this method is that an increase in the proportion of organisms that are resistant may not necessarily reflect an increase in the absolute number of clinical cases caused by resistant organisms. A decrease in the total number of isolates because of a reduction in the number of susceptible ones with a same number of resistant isolates leads, mathematically, to an increase in the drug-resistant proportion of a population.
From a public health point of view, the consequences of antimicrobial use, it is most important to know the burden of resistance. The best way to measure the burden of resistance is by using a “rate”. Several “rates” have been proposed for reporting resistance in medical settings: it could be the number of resistant isolates, observed by unit of time or by hospital bed per unit time or by occupied
ECDC/EFSA/EMA first joint report on the integrated analysis of the consumption of antimicrobial agents and occurrence of antimicrobial resistance in bacteria from humans and food-producing animals 636088/2013 Page 94/114

bed per unit time, or per hospital admission per unit time. These rates are more or less difficult to collect (Schwaber et al., 2004) and require precise definition of the population monitored. They can be obtained for a defined medical setting.
Laboratory-based surveillance can be valuable to inform treatment guidelines and to provide information on trends and alerts to emerging resistance problems. This type of surveillance does not provide the information needed to measure the impact of resistance, including the consequences of antimicrobial resistance for patients as a result of failure of treatment that results in prolonged illness and excessive mortality, or how much of the population or which patient groups are affected. For this purpose, targeted surveillance based on defined populations and epidemiological samples would be necessary to provide the information need to estimate the impact of antimicrobial resistance (WHO, 2014).
Figure 25. Comparison of clinical breakpoints and ECOFFs used to interpret MIC data reported for Campylobacter spp. from humans, animals or food
Note: CLSI (2010), EUCAST clinical breakpoints (2012), Committé Antibiogramme–Société Française de Microbiologie (CA-SFM) (2010), EUCAST. Empty fields mean that no breakpoint is available.
Adapted from EFSA/ECDC report (EFSA/ECDC, 2014).
3.2.1.2. Monitoring of resistance
The emergence and spread of antimicrobial resistance constitutes a significant public health problem. Owing to rising levels of resistance in a number of bacterial species (including zoonotic bacteria) causing infections in humans, the available treatment options for patients suffering from bacterial infections are becoming more and more limited.
In order to guide prevention and control efforts aimed at limiting the emergence and spread of antimicrobial resistance in humans, baseline data on the occurrence of resistance in humans and adjacent reservoirs are needed. Monitoring of antimicrobial resistance in animals and humans may provide important information on occurrence and development of resistance and may even allow early detection of resistant strains of public health importance. Data from resistance monitoring are needed to inform clinical therapy decisions, to guide policy recommendations, to provide data for risk assessments and to assess the impact of intervention strategies.
ECDC/EFSA/EMA first joint report on the integrated analysis of the consumption of antimicrobial agents and occurrence of antimicrobial resistance in bacteria from humans and food-producing animals 636088/2013 Page 95/114

Appropriate strategies for monitoring of antimicrobial resistance should reflect pre-identified scientific or public health objectives. Ideally, resistance monitoring systems should include relevant indicators and pathogens of public health importance and monitor resistance to antimicrobials of importance for therapeutic use in humans.
For monitoring purposes, data collection can be based on results of routine microbiological diagnostics and antimicrobial susceptibility testing results. In cases where specific organisms of major public health importance are identified (e.g. MRSA, VRE), targeted surveys may provide more timely and adequate data to inform decision making at local or national level.
3.3. Clonal spread of organisms exhibiting resistance to antimicrobials in the human population and in food-producing animals
A fourth consideration is the effect of clonal spread of organisms exhibiting resistance to antimicrobials. By definition, a clone is a group of highly similar cells that share a common ancestry, meaning that they are derived from the same ancestor. On this basis, isolates of bacterial species that are indistinguishable in genotype are considered to be a clone, with the implication that they are descended from the same recent ancestor. Clones are difficult to define with precision since bacteria are not truly asexual, and recombinational replacements result in diversification of the ancestral genotype of a clone, to produce a cluster of increasingly diverse but related genotypes (Spratt, 2004).
Clonal spread of bacteria conferring resistance to antimicrobials occurs in both food production animals and humans, and in both pathogens and non-pathogens, and is not necessarily directly linked to the use of antimicrobials in a particular host or country. The implications of clonal spread in assessing the prevalence of resistance are considerable, and pose difficulties for comparative studies of resistance in human and animal populations in relation to antimicrobial consumption. For example, the clonal spread of a MDR strain of Salmonella spp. through a food animal population can be quite different from that of a strain of, for example, MRSA CC398 in the community or in a hospital environment.
In the first instance a MDR salmonella organism may become established in a food animal population without the involvement of antimicrobials and, although antimicrobial use can contribute to its persistence and dissemination, such use may not be responsible alone for its appearance. An example of this is provided by the appearance and subsequent epizootic spread, in the late 1980s/1990s, of a clone of S. Typhimurium definitive phage type (DT) 104 exhibiting chromosomally-mediated resistance to five unrelated antimicrobials (Threlfall, 2000). Retrospective studies have suggested that the MDR epidemic clone of DT 104 was simultaneously introduced into bovine animals in the United Kingdom and into North America from countries in South-East Asia, and that antimicrobial consumption in affected countries in the northern hemisphere was not a major factor in its epizootic spread. Following its dissemination via the food chain, the strain was responsible for many thousands of infections in humans in affected countries, but, as with food-producing animals, antimicrobial consumption in the human population was not a major contributory factor. More recent examples include the on-going multi-country spread of a MDR “clonal complex” of a monophasic variant of S. Typhimurium exhibiting chromosomally mediated resistance to four unrelated antimicrobials, which has spread extensively in pigs in several European countries, and has also caused many human infections (EFSA, 2010; Hopkins et al., 2010; Lucarelli et al., 2010). Although antimicrobial use in pigs in different EU countries may have contributed to the appearance of this clonal complex, such use does not seem to be related to its subsequent spread. Similarly, a clone of a strain of S. Kentucky ST 198 exhibiting high-level resistance to ciprofloxacin and associated with poultry has recently reported to be spreading epidemically, with infections reported in several EU countries and the USA (Le Hello et al., 2011). In contrast to such clusters of epidemiologically related healthy carriage in food-producing animals, clonal outbreaks of
ECDC/EFSA/EMA first joint report on the integrated analysis of the consumption of antimicrobial agents and occurrence of antimicrobial resistance in bacteria from humans and food-producing animals 636088/2013 Page 96/114

MDR Salmonella in hospitals are rare in developed countries. Although such events have been reported, predominantly in high-dependency units (Anderson et al., 1977; McCartney et al., 1993) outbreaks of non-typhoidal salmonella infections are more common in developing countries in South-east Asia, the Indian sub-continent (Anderson et al., 1977) and sub-Saharan Africa (Gordon, 2011). In such outbreaks, the strains are generally MDR, but there is no evidence that antimicrobial consumption in food-producing animals plays a role in either their formation or dissemination, and antimicrobial consumption in the human population appears to have been key factor in their diffusion.
In contrast to Salmonella, outbreaks in the human population caused by the clonal spread of drug-resistant Campylobacter spp. strains are uncommon, and hospital outbreaks are rare. A number of Campylobacter genotypes, as defined by clonal complex and including both C. jejuni and C. coli, are associated with farm animals, including those from poultry, bovine, ovine and porcine sources. Although human campylobacteriosis is very widespread, point source clonal outbreaks, and particularly hospital outbreaks, that can be identified and controlled by public health action are rare. Where they do occur, such outbreaks are often associated with poor food preparation at particular institutions, unpasteurised milk or milk pasteurisation failures or contaminated water. Nevertheless, antimicrobial resistance is increasing among campylobacter infections and is common among isolates from other sources, specifically retail poultry meat. In a recent UK-wide survey to investigate the antimicrobial susceptibility of isolates of Campylobacter spp. in retail poultry meat, antimicrobial resistance was present in all lineage clusters, but statistical testing showed a non-random distribution (Wimalarathna et al., 2013). For all antimicrobials tested, resistant isolates were distributed among relatively distant lineages, indicative of widespread acquisition. There was also limited evidence of clustering of resistance phenotypes within lineages, indicative of local expansion of resistant strains, i.e. clonal spread of resistant organisms in poultry at a local level.
Clonal spread of MDR E. coli pathogenic to humans is an increasingly important issue, particularly in relation to the spread of ESBL-producing strains in the community and in hospitals. The potential contribution of food-producing animals or foods to public health risks caused by ESBL-producing bacteria is related to specific plasmid-mediated ESBL genes encoded by a number of organisms and to the subsequent horizontal dissemination of such genes through bacteria in human and animal populations. Although there are a large number of genes which encode ESBL enzymes, not all are equally prevalent among human and animal bacteria. The predominant ESBL families encountered are CTX-M, TEM and SHV, and the bacterial species most commonly identified with these genes is E. coli, with the clonal lineages B2-E. coli O25:H4-ST131, D-E. coli O25a-ST648 and D-E. coli-ST69 and -ST393 being increasingly detected among both humans and food animals (Liebana et al., 2013). Furthermore, a recent comparative analysis of ESBL-positive E. coli isolates from animals (poultry), animal food products and cases of human infection from the United Kingdom, the Netherlands and Germany demonstrated the existence of different clonal complexes lineages among ESBL-positive isolates from human sources and poultry, with only 1.2 % of isolates tested sharing the same multilocus sequence typing (MLST) lineage (Wu et al., 2013). The results suggest that minimising human-to-human transmission is essential to control the spread of ESBL-positive E. coli in humans and, furthermore, that antimicrobial practices in humans and animal may not be directly comparable in relation to their ability to select for and promote the spread of ESBL-positive E. coli in the two populations.
A further example of clonal spread of a drug-resistant organism in an animal population without the direct involvement of antimicrobials is provided by a study of an increased occurrence of VRE in Swedish broilers since 2000 (Nilsson et al., 2009). In this country the proportion of VRE-positive samples increased gradually from < 1 %, in 2000, to slightly over 40 % in 2005. Species identification, antimicrobial susceptibility determination, vancomycin resistance genotyping, MLST and characterisation of Tn1546 in the VRE isolates demonstrated that all isolates tested were Enterococcus
ECDC/EFSA/EMA first joint report on the integrated analysis of the consumption of antimicrobial agents and occurrence of antimicrobial resistance in bacteria from humans and food-producing animals 636088/2013 Page 97/114

faecium and carried the vanA gene. A majority of the isolates had similar antibiograms, the same MLST and the Tn1546 transposon. These studies demonstrated that the increase in VRE isolates in broilers in Sweden from 2000 to 2005 was the result of the spread of one major clone and, furthermore, as avoparcin had not been used in broiler production in Sweden since 1986, this clonal spread had taken place without any obvious antimicrobial selective pressure (Nilsson et al., 2009).
In conclusion, clonal spread of resistant strains in food-producing animals and the community has been demonstrated for Salmonella spp., ESBL-producing E. coli, MRSA and VRE, but to a much lesser extent for Campylobacter spp. In comparison with MRSA, clonal spread of these organisms is much less common in the hospital environment. Although antimicrobial use is undoubtedly an important risk factor in the clonal spread of, for example, ESBL-producing organisms in cattle (Snow et al., 2012) and poultry (Leverstein-van Hall et al., 2011), such spread can take place without any obvious direct antimicrobial involvement, as described above. Thus, clonal spread of both pathogens and non-pathogens can profoundly affect conclusions about antimicrobial consumption and resistance development, as in many cases resistance which is spread by this means may not be directly linked to antimicrobial consumption in either the human or animal sectors.
A fourth key parameter is the prevalence of resistance. In hospitals, if resistance is rare, the probability of misclassification is low. In such cases clinical samples may be most appropriate for studying antimicrobial resistance. Conversely, if resistance is common, use the outcome of colonisation may be preferable, as this generally precedes infection and affects more patients (D'Agata, 2005).
ECDC/EFSA/EMA first joint report on the integrated analysis of the consumption of antimicrobial agents and occurrence of antimicrobial resistance in bacteria from humans and food-producing animals 636088/2013 Page 98/114

4. Annex D
4.1. Comparison between antimicrobial consumption and resistance from animals in 2011
Figure 26. Logistic regression analysis curves with OR estimates and 95 % PL CIs of the national consumption of tetracyclines in food-producing animals and the probability of “microbiological” resistance to tetracyclines in (a) indicator E. coli isolates (MIC > 8 mg/L) from cattle, domestic fowl and pigs, (b) Salmonella spp. isolates (MIC > 8 mg/L) from cattle, domestic fowl and pigs, (c) C. coli isolates (MIC > 2 mg/L) from domestic fowl and pigs and (d) C. jejuni isolates (MIC > 2 mg/L) from cattle and domestic fowl for the year 20111—dots represent the countries involved in the analysis
a. indicator E. coli isolates b. Salmonella spp. isolates
Countries included: AT, BE, CH, DE, DK, ES, FI, NL, NO, PL, SE Countries included: BE, DE, DK, EE, ES, FI, IE, IT, NL, SE p-value < 0.05; OR = 1.033; 95 % PL CI: [1.020, 1.047] OR = 1.011; 95 % PL CI: [0.998, 1.024] Note: the association remains significantly positive after
ignoring the point displayed on the graph upper right corner: p-value < 0.05; OR = 1.029; 95 % PL CI: [1.013, 1.048]
c. C. coli isolates d. C. jejuni isolates
Countries included: CH, ES, FR, HU, NL Countries included: AT, CH, DE, DK, ES, FI, IT, NL, NO p-value < 0.05; OR = 1.042; 95 % PL CI: [1.003, 1.100] p-value < 0.05; OR = 1.025; 95 % PL CI: [1.008, 1.048]
Note: the association remains significantly positive after ignoring the point displayed on the graph middle right side: p-value < 0.05; OR = 1.049; 95 % PL CI: [1.029, 1.074]
1In the absence of 2011 resistance data, proxy data for years prior to 2011 may have been used.
ECDC/EFSA/EMA first joint report on the integrated analysis of the consumption of antimicrobial agents and occurrence of antimicrobial resistance in bacteria from humans and food-producing animals 636088/2013 Page 99/114

Figure 27. Logistic regression analysis curves with OR estimates and 95 % PL CIs of the national consumption of 3rd-generation cephalosporins in food-producing animals and the probability of “microbiological” resistance to cefotaxime in (a) indicator E. coli isolates (MIC > 0.25 mg/L) from cattle, domestic fowl and pigs and (b) Salmonella spp. isolates (MIC > 0.5 mg/L) from cattle, domestic fowl and pigs for the year 20111—dots represent the countries involved in the analysis
a. indicator E. coli isolates
Countries included: AT, BE, CH, DE, DK, ES, FI, NL, NO, PL, SE p-value < 0.05; OR0.1-unit increment = 1.498; 95 % PL CI: [1.169, 1.951]
b. Salmonella spp. isolates
Countries included: BE, DE, DK, EE, ES, FI, IE, IT, NL, SE p-value < 0.05; OR0.1-unit increment = 1.635; 95 % PL CI: [1.197, 2.375]
1In the absence of 2011 resistance data, proxy data for years prior to 2011 may have been used.
ECDC/EFSA/EMA first joint report on the integrated analysis of the consumption of antimicrobial agents and occurrence of antimicrobial resistance in bacteria from humans and food-producing animals 636088/2013 Page 100/114
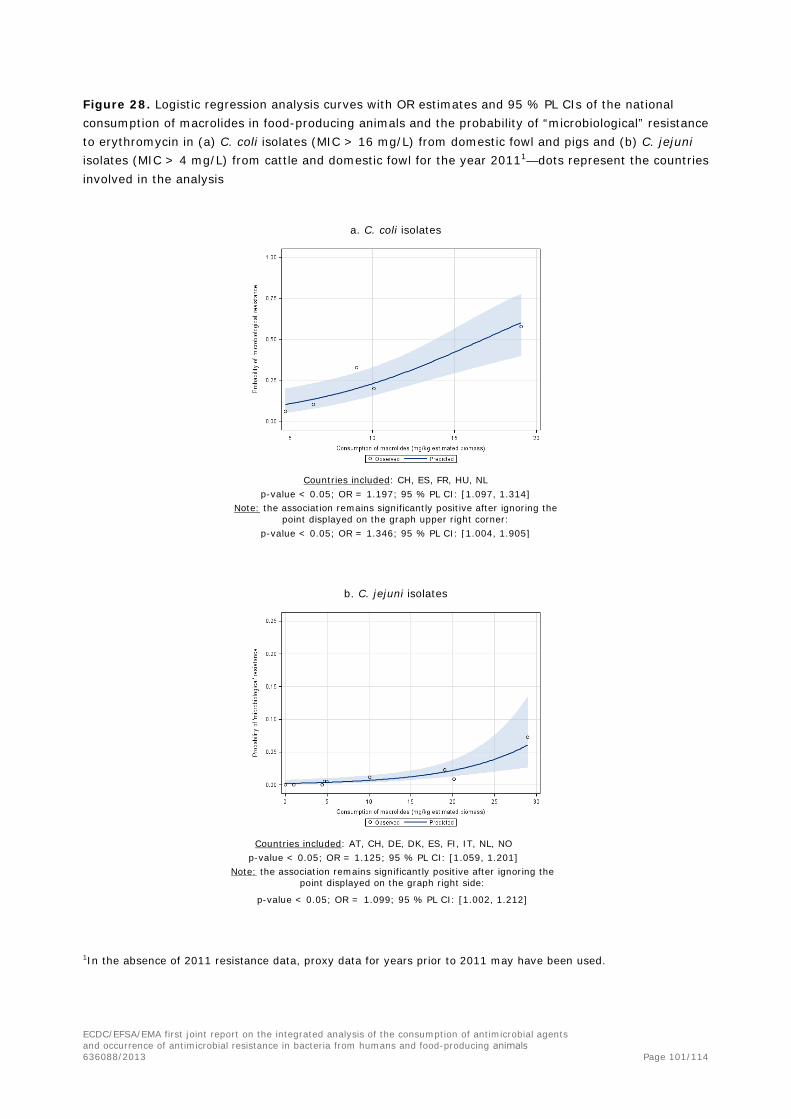
Figure 28. Logistic regression analysis curves with OR estimates and 95 % PL CIs of the national consumption of macrolides in food-producing animals and the probability of “microbiological” resistance to erythromycin in (a) C. coli isolates (MIC > 16 mg/L) from domestic fowl and pigs and (b) C. jejuni isolates (MIC > 4 mg/L) from cattle and domestic fowl for the year 20111—dots represent the countries involved in the analysis
a. C. coli isolates
Countries included: CH, ES, FR, HU, NL p-value < 0.05; OR = 1.197; 95 % PL CI: [1.097, 1.314]
Note: the association remains significantly positive after ignoring the point displayed on the graph upper right corner:
p-value < 0.05; OR = 1.346; 95 % PL CI: [1.004, 1.905]
b. C. jejuni isolates
Countries included: AT, CH, DE, DK, ES, FI, IT, NL, NO p-value < 0.05; OR = 1.125; 95 % PL CI: [1.059, 1.201]
Note: the association remains significantly positive after ignoring the point displayed on the graph right side:
p-value < 0.05; OR = 1.099; 95 % PL CI: [1.002, 1.212]
1In the absence of 2011 resistance data, proxy data for years prior to 2011 may have been used.
ECDC/EFSA/EMA first joint report on the integrated analysis of the consumption of antimicrobial agents and occurrence of antimicrobial resistance in bacteria from humans and food-producing animals 636088/2013 Page 101/114

Figure 29. Logistic regression analysis curves with OR estimates and 95 % PL CIs of the national consumption of (A) fluoroquinolones and (B) fluoroquinolones plus other quinolones in food-producing animals and the probability of “microbiological” resistance to ciprofloxacin in (1) indicator E. coli isolates (MIC > 0.03 mg/L) from cattle, domestic fowl and pigs, (2) Salmonella spp. isolates (MIC > 0.06 mg/L) from cattle, domestic fowl and pigs, (3) C. jejuni isolates (MIC > 1 mg/L) from cattle and domestic fowl and (4) C. coli isolates (MIC > 1 mg/L) from domestic fowl and pigs for the year 20111—dots represent the countries involved in the analysis
1) indicator E. coli isolates 2) Salmonella spp. isolates
a. a.
Countries included: AT, BE, CH, DE, DK, ES, NL, PL Countries included: BE, DE, DK, EE, ES, FI, IE, IT, NL, SE p-value < 0.05; OR = 1.173; 95 % PL CI: [1.026, 1.339] p-value < 0.05; OR = 1.195; 95 % PL CI: [1.022, 1.380]
Note: the association does not remain significantly positive after ignoring the point displayed on the right side of the
graph: OR = 1.829; 95 % PL CI: [0.896, 3.699]
b. b.
Countries included: AT, BE, CH, DE, DK, ES, NL, PL Countries included: BE, DE, DK, EE, ES, FI, IE, IT, NL, SE p-value < 0.05; OR = 1.203; 95 % PL CI: [1.064, 1.361] p-value < 0.05; OR = 1.154 ; 95 % PL CI: [1.041,1.279]
Note: the association does remain significantly positive after ignoring the two points displayed on the graph right side: p-value < 0.05; OR = 2.149; 95 % PL CI: [1.481, 3.145]
Note: the association remains significantly positive after ignoring the two points displayed on the graph right side: p-value < 0.05; OR = 2.589; 95 % PL CI: [1.485, 4.862]
1In the absence of 2011 resistance data, proxy data for years prior to 2011 may have been used.
ECDC/EFSA/EMA first joint report on the integrated analysis of the consumption of antimicrobial agents and occurrence of antimicrobial resistance in bacteria from humans and food-producing animals 636088/2013 Page 102/114
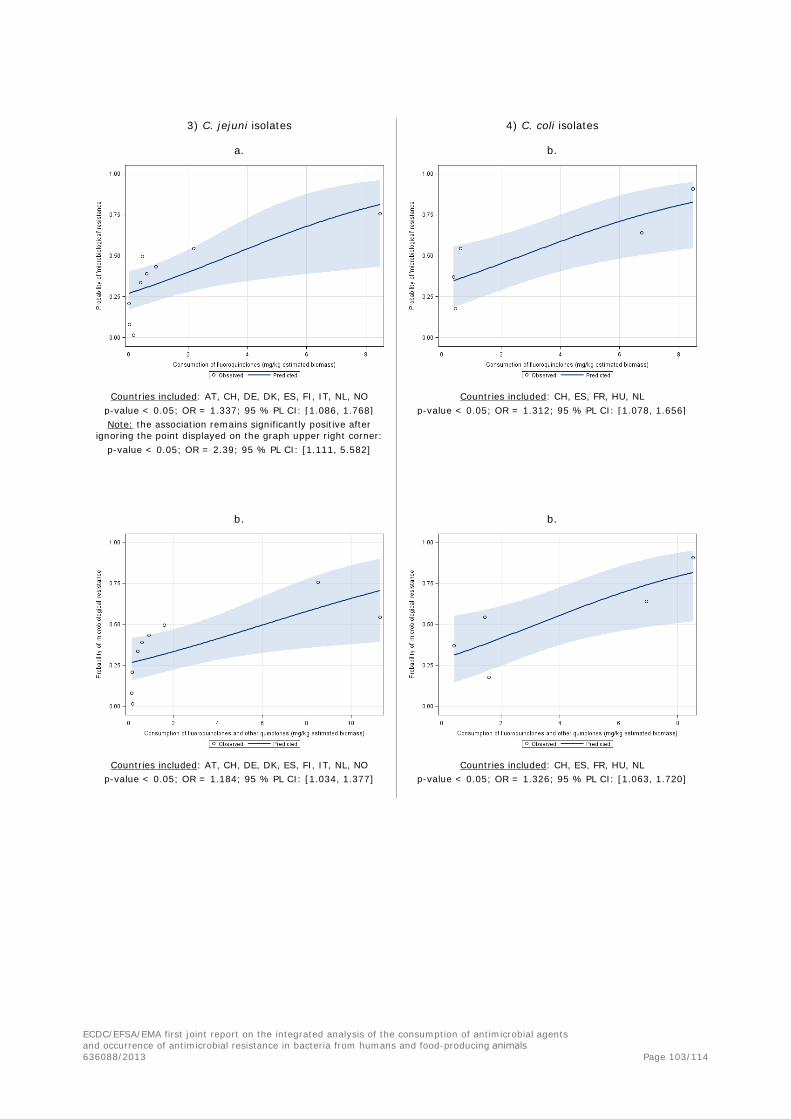
3) C. jejuni isolates 4) C. coli isolates
a. b.
Countries included: AT, CH, DE, DK, ES, FI, IT, NL, NO Countries included: CH, ES, FR, HU, NL p-value < 0.05; OR = 1.337; 95 % PL CI: [1.086, 1.768] p-value < 0.05; OR = 1.312; 95 % PL CI: [1.078, 1.656] Note: the association remains significantly positive after
ignoring the point displayed on the graph upper right corner: p-value < 0.05; OR = 2.39; 95 % PL CI: [1.111, 5.582]
b. b.
Countries included: AT, CH, DE, DK, ES, FI, IT, NL, NO Countries included: CH, ES, FR, HU, NL p-value < 0.05; OR = 1.184; 95 % PL CI: [1.034, 1.377] p-value < 0.05; OR = 1.326; 95 % PL CI: [1.063, 1.720]
ECDC/EFSA/EMA first joint report on the integrated analysis of the consumption of antimicrobial agents and occurrence of antimicrobial resistance in bacteria from humans and food-producing animals 636088/2013 Page 103/114

4.2. Comparison between antimicrobial consumption in humans and resistance in bacteria from humans
Figure 30. Logistic regression analysis curves with OR estimates and 95 % PL CIs of the national community and hospital consumption of 3rd- and 4th-generation cephalosporins in humans and the probability of clinical resistance to 3rd-generation cephalosporins in E. coli isolates from human BSIs for the year 2012—dots represent the countries involved in the analysis
Countries included: AT, BE, BG, CZ, DE, DK, EE, FI, FR, GR, HR, HU, IE, IT, LV, LT, LU, MT, NL, NO, PL, PT, SK, SI, ES, SE, UK
p-value = 0.049; OR = 1.618; 95 % PL CI: [1.002, 2.519]
Countries included: BE, BG, DK, EE, FI, FR, GR, HR, IE, IT, LT, LU, LV, MT, NL, NO, PT, SE, SI, SK
p-value < 0.05; OR0.1-unit increment = 1.421; 95 % PL CI: [1.196, 1.681]
Figure 31. Logistic regression analysis curves with OR estimates and 95 % PL CIs of the national community and hospital consumption of fluoroquinolones in humans and the probability of clinical resistance to fluoroquinolones in E. coli isolates from human BSIs for the year 2012—dots represent the countries involved in the analysis
30 countries included: AT, BE, BG, CY, CZ, DE, DK, EE, ES, FI, FR, GR, HR, HU, IE, IS, IT, LT, LU, LV, MT, NL, NO, PL, PT, RO,
SE, SI, SK, UK p-value < 0.0001; OR = 1.555; 95 % PL CI: [1.360, 1.778]
20 countries included: BE, BG, DK, EE, FI, FR, GR, HR, IE, IT, LT, LU, LV, MT, NL, NO, PT, SE, SI, SK
p-value = 0.44; OR = 2.873; 95 % PL CI: [0.196, 41.794] - not significant
ECDC/EFSA/EMA first joint report on the integrated analysis of the consumption of antimicrobial agents and occurrence of antimicrobial resistance in bacteria from humans and food-producing animals 636088/2013 Page 104/114

Figure 32. Logistic regression analysis curves with OR estimates and 95 % PL CIs of the national consumption of tetracyclines in the community in humans and the probability of clinical resistance to tetracycline in Salmonella spp. from human infections for the year 2012—dots represent the countries involved in the analysis
16 countries included: AT, EE, ES, FR, GR, HU, IE, IT, LT, LU, NL, NO, RO, SI, SK, UK
p-value = 0.58; OR = 0.910; 95 % PL CI: [0.645, 1.260] - not significant
Figure 33. Logistic regression analysis curves with OR estimates and 95 % PL CIs of the national consumption of tetracyclines in the community in humans and the probability of clinical resistance to tetracycline in C. jejuni from human infections for the year 2012—dots represent the countries involved in the analysis
Countries included: AT, EE, ES, IT, LU, NL, SI, SK, UK p-value = 0.58; OR = 0.910; 95 % PL CI: [0.645, 1.260] - not significant
ECDC/EFSA/EMA first joint report on the integrated analysis of the consumption of antimicrobial agents and occurrence of antimicrobial resistance in bacteria from humans and food-producing animals 636088/2013 Page 105/114

4.3. Comparison between antimicrobial consumption in food-producing animals and resistance in bacteria from humans, 2011
Figure 34. Logistic regression analysis curves with OR estimates and 95 % PL CIs of the national consumption of 3rd- and 4th-generation cephalosporins in food-producing animals and the probability of clinical resistance to 3rd- and 4th-generation cephalosporins in E. coli isolates from human BSIs for the year 2011—dots represent the countries involved in the analysis
25 countries included: AT, BE, BG, CY, CZ, DE, DK, EE, ES, FI, FR, HU, IE, IS, IT, LT, LV, NL, NO, PL, PT, SE, SI, SK, UK
p-value = 0.23; OR=1.116; 95 % PL CI [0.933, 1.327] - not significant
Figure 35. Logistic regression analysis curves with OR estimates and 95 % PL CIs of the national consumption of (a) fluoroquinolones and (b) fluoroquinolones plus other quinolones in food-producing animals in 2011 and the probability of clinical resistance to fluoroquinolones in E. coli isolates from human BSIs for the year 2012—dots represent the countries involved in the analysis
a. b.
25 countries included: AT, BE, BG, CY, CZ, DE, DK, EE, ES, FI, FR, HU, IE, IS, IT, LT, LV, NL, NO, PL, PT, SE, SI, SK, UK
p-value = 0.006; OR = 1.103; 95 % PL CI: [1.029, 1.180]
25 countries included: AT, BE, BG, CY, CZ, DE, DK, EE, ES, FI, FR, HU, IE, IS, IT, LT, LV, NL, NO, PL, PT, SE, SI, SK, UK
p-value < 0.0001; OR = 1.119; 95 % PL CI [1.066, 1.175]
ECDC/EFSA/EMA first joint report on the integrated analysis of the consumption of antimicrobial agents and occurrence of antimicrobial resistance in bacteria from humans and food-producing animals 636088/2013 Page 106/114

Figure 36. Logistic regression analysis curves with OR estimates and 95 % PL CIs of the national consumption of macrolides in food-producing animals in 2011 and the probability of clinical resistance to erythromycin in C. jejuni isolates from human infections for the year 2011—dots represent the countries involved in the analysis
Countries included: AT, EE, ES, FR, HU, IT, LT, LU, NL, SI, SK, UK p-value < 0.001; OR = 1.068; 95 % PL CI [1.033, 1.101]
Figure 37. Logistic regression analysis curves with OR estimates and 95 % PL CIs of the national consumption of tetracyclines in food-producing animals in 2011 and the probability of clinical resistance to tetracycline in (a) S. Typhimurium isolates from human infections and (b) Salmonella spp. isolates from human infections for the year 2012—dots represent the countries involved in the analysis
a. S. Typhimurium b. Salmonella spp.
Countries included: AT, DK, ES, FR, HU, IE, IT, LT, LU, NL, NO, SI, SK, UK
p-value = 0.003; OR = 1.011; 95 % PL CI [1.004, 1.019]
Countries included: AT, EE, ES, FR, HU, IE, IT, LT, LU, NL, NO, SI, SK, UK
p-value < 0.001; OR = 1.017; 95 % PL CI [1.011, 1.024]
ECDC/EFSA/EMA first joint report on the integrated analysis of the consumption of antimicrobial agents and occurrence of antimicrobial resistance in bacteria from humans and food-producing animals 636088/2013 Page 107/114

Figure 38. Logistic regression analysis curves with OR estimates and 95 % PL CIs of the national consumption of tetracyclines in food-producing animals in 2012 and the probability of clinical resistance to tetracycline in C. jejuni isolates from human infections for the year 2012—dots represent the countries involved in the analysis
Countries included: AT, EE, ES, FR, HU, IT, LT, NL, SI, SK, UK p-value = 0.001; OR = 1.016; 95 % PL CI [1.006, 1.027]
ECDC/EFSA/EMA first joint report on the integrated analysis of the consumption of antimicrobial agents and occurrence of antimicrobial resistance in bacteria from humans and food-producing animals 636088/2013 Page 108/114

5. Annex E
5.1. Abbreviations
AMR antimicrobial resistance AST antimicrobial susceptibility testing ATC anatomical therapeutic chemical BSI bloodstream infections CA–SFM Committé Antibiogramme–Société Française de Microbiologie CHMP Committee for Medicinal Products for Human Use CI confidence interval CIA critically important antimicrobial CLSI Clinical and Laboratory Standards Institute CVMP Committee for Medicinal Products for Veterinary Use DDD defined daily dose DT definitive phage type EARS-Net European Antimicrobial Resistance Surveillance Network EC European Commission ECDC European Centre for Disease Prevention and Control ECOFF epidemiological cut-off value EEA European Economic Area EFSA European Food Safety Authority EMA European Medicines Agency EP European Parliament EQA External Quality Assessment ESAC-Net European Surveillance of Antimicrobial Consumption Network ESBL extended-spectrum beta-lactamase ESVAC European Surveillance of Veterinary Antimicrobial Consumption EU European Union EUCAST European Committee on Antimicrobial Susceptibility Testing FAO Food and Agriculture Organization FAOSTAT FAO Statistical Databases FEDIAF The European Pet Food Industry FWD-Net Food- and Waterborne Diseases and Zoonoses Network JIACRA Joint Interagency Antimicrobial Consumption and Resistance Analysis MAH marketing authorisation holder MDR multidrug-resistant MIC minimum inhibitory concentration MLST multi-locus sequence typing MRL maximum residue limit MRSA methicillin-resistant Staphylococcus aureus MS Member State NCA National Competent Authority NPHRL National Public Health Reference Laboratories OR odds ratio PCU population correction unit PL CI profile-likelihood confidence interval SPC Summary of the Product Characteristics spp. species (plural) STEC Shiga-toxin-producing Escherichia coli (synonymous with VTEC) TESSy The European Surveillance System VMP veterinary medicinal product VRE vancomycin-resistant enterococci VTEC verocytotoxin-producing Escherichia coli (synonymous with STEC) WHO World Health Organization
ECDC/EFSA/EMA first joint report on the integrated analysis of the consumption of antimicrobial agents and occurrence of antimicrobial resistance in bacteria from humans and food-producing animals 636088/2013 Page 109/114

ISO Code Country
AT Austria BE Belgium BG Bulgaria CR Croatia CY Cyprus CZ Czech Republic DK Denmark EE Estonia FI Finland FR France DE Germany GR Greece HU Hungary IE Ireland IS Iceland IT Italy LV Latvia LT Lithuania LU Luxembourg MT Malta NL Netherlands NO Norway PL Poland PT Portugal RO Romania SL Slovakia SI Slovenia ES Spain SE Sweden CH Switzerland UK United Kingdom
5.2. References
Anderson, E.S., E.J. Threlfall, J.M. Carr, M.M. McConnell, and H.R. Smith. 1977. Clonal distribution of resistance plasmid-carrying Salmonella typhimurium, mainly in the Middle East. The Journal of hygiene 79:425-448.
Baquero, F. 2011. The 2010 Garrod Lecture: the dimensions of evolution in antibiotic resistance: ex unibus plurum et ex pluribus unum. The Journal of antimicrobial chemotherapy 66:1659-1672.
Bell, B.G., F. Schellevis, E. Stobberingh, H. Goossens, and M. Pringle. 2014. A systematic review and meta-analysis of the effects of antibiotic consumption on antibiotic resistance. BMC infectious diseases 14:13.
Chantziaras, I., F. Boyen, B. Callens, and J. Dewulf. 2014. Correlation between veterinary antimicrobial use and antimicrobial resistance in food-producing animals: a report on seven countries. The Journal of antimicrobial chemotherapy 69:827-834.
Codex Alimentarius. 2011. Guidelines for risk analysis of foodborne antimicrobial resistance (CAC/GL 77- 2011). In http://www.codexalimentarius.org/download/standards/11776/CXG_077e.pdf.
D'Agata, E.M.C. 2005. Methodologic issues of case-control studies: A review of established and newly recognized limitations. Infection Control and Hospital Epidemiology 26:338-341.
DANMAP. 2013. Use of antimicrobial agents and occurrence of antimicrobial resistance in bacteria from food animals, food and humans in Denmark. In http://www.danmap.org/Downloads/Reports.aspx.
EC. 2011. Communication from the Commission to the European Parliament and the Council - Action plan against the rising threats from Antimicrobial Resistance - COM (2011) 748. In http://eur-lex.europa.eu/legal-content/EN/TXT/?uri=COM:2011:0748:FIN.
ECDC/EFSA/EMA first joint report on the integrated analysis of the consumption of antimicrobial agents and occurrence of antimicrobial resistance in bacteria from humans and food-producing animals 636088/2013 Page 110/114
ECDC. 2014. EU protocol for harmonised monitoring of antimicrobial resistance in human Salmonella and Campylobacter isolates. In http://ecdc.europa.eu/en/publications/Publications/AMR-salmonella-campylobacter-protocol-monitoring.pdf.
ECDC/EFSA/EMA/SCENIHR. 2009. Joint Opinion on antimicrobial resistance (AMR) focused on zoonotic infections. In http://www.ema.europa.eu/docs/en_GB/document_library/Other/2009/11/WC500015452.pdf.
EFSA. 2007. Report of the Task Force on Zoonoses Data Collection including a proposal for a harmonized monitoring scheme of antimicrobial resistance in Salmonella in fowl (Gallus gallus), turkeys and pigs and Campylobacter jejuni and C. coli in broilers In EFSA Journal. http://www.efsa.europa.eu/en/efsajournal/pub/96r.htm.
EFSA. 2008. Report from the Task Force on Zoonoses Data Collection including guidance for harmonized monitoring and reporting of antimicrobial resistance in commensal Escherichia coli and Enterococcus spp. from food animals. In EFSA Journal. http://www.efsa.europa.eu/en/efsajournal/pub/141r.htm.
EFSA. 2010. Scientific Opinion on monitoring and assessment of the public health risk of “Salmonella typhimurium-like” strains. In EFSA Journal. http://www.efsa.europa.eu/en/efsajournal/doc/1826.pdf.
EFSA. 2012a. Guidance on selected default values to be used by the EFSA Scientific Committee, Scientific Panels and Units in the absence of actual measured data. In EFSA Journal. http://www.efsa.europa.eu/en/efsajournal/pub/2579.htm.
EFSA. 2012b. Technical specifications on the harmonised monitoring and reporting of antimicrobial resistance in Salmonella, Campylobacter and indicator Escherichia coli and Enterococcus spp. bacteria transmitted through food. In EFSA Journal. http://www.efsa.europa.eu/en/efsajournal/pub/2742.htm.
EFSA. 2013. EFSA BIOHAZ Panel. Scientific Opinion on carbapenem resistance in food animal ecosystems. In EFSA Journal. http://www.efsa.europa.eu/en/efsajournal/pub/3501.htm.
EFSA. 2015. EFSA BIOHAZ Panel. Scientific Opinion on the public health risks related to the consumption of raw drinking milk. In EFSA Journal. http://www.efsa.europa.eu/en/efsajournal/pub/3940.htm.
EFSA/ECDC. 2013. The European Union Summary Report on antimicrobial resistance in zoonotic and indicator bacteria from humans, animals and food in 2011. In EFSA Journal. http://www.efsa.europa.eu/en/efsajournal/doc/2598.pdf
EFSA/ECDC. 2014. The European Union Summary Report on antimicrobial resistance in zoonotic and indicator bacteria from humans, animals and food in 2012 In EFSA Journal. http://www.efsa.europa.eu/en/efsajournal/doc/2598.pdf
EMA/ESVAC. 2011. European Medicines Agency. Trends in the sales of veterinary antimicrobial agents in nine European countries. Reporting period: 2005-2009 (EMA/238630/2011). In http://www.ema.europa.eu/docs/en_GB/document_library/Report/2011/09/WC500112309.pdf.
EMA/ESVAC. 2014. European Medicines Agency. Sales of veterinary antimicrobial agents in 26 EU/EEA countries in 2012 (EMA/333921/2014). In http://www.ema.europa.eu/docs/en_GB/document_library/Report/2014/10/WC500175671.pdf.
European Commission. 2011. Communication from the Commission to the European Parliament and the Council: Action plan against the rising threats from antimicrobial resistance (2011). In http://ec.europa.eu/dgs/health_consumer/docs/communication_amr_2011_748_en.pdf.
Fajardo, A., N. Martínez-Martín, M. Mercadillo, J.C. Galán, B. Ghysels, S. Matthijs, P. Cornelis, L. Wiehlmann, B. Tümmler, F. Baquero, and J.L. Martínez. 2008. The neglected intrinsic resistome of bacterial pathogens. PLoS ONE 3:
Fischer, J., I. Rodriguez, S. Schmoger, A. Friese, U. Roesler, R. Helmuth, and B. Guerra. 2012a. Escherichia coli producing VIM-1 carbapenemase isolated on a pig farm. The Journal of antimicrobial chemotherapy 67:1793-1795.
Fischer, J., I. Rodriguez, S. Schmoger, A. Friese, U. Roesler, R. Helmuth, and B. Guerra. 2012b. Salmonella enterica subsp. enterica producing VIM-1 carbapenemase isolated from livestock farms. Journal of Antimicrobial Chemotherapy dks393.
Gordon, M.A. 2011. Invasive nontyphoidal Salmonella disease: epidemiology, pathogenesis and diagnosis. Current opinion in infectious diseases 24:484-489.
Harker, K.S., C. Lane, E. De Pinna, and G.K. Adak. 2011. An outbreak of Salmonella Typhimurium DT191a associated with reptile feeder mice. Epidemiology and infection 139:1254-1261.
Heuer, O.E., L. Diaz Högberg, C. Suetens, and EARS-Net. 2014. Proportions of community-associated and healthcare-associated isolates in the EARS-Net data vary depending on pathogen and antimicrobial combination – analysis of EARS-Net data 2011-2012 (poster). ECCMID 2014.
ECDC/EFSA/EMA first joint report on the integrated analysis of the consumption of antimicrobial agents and occurrence of antimicrobial resistance in bacteria from humans and food-producing animals 636088/2013 Page 111/114

Hopkins, K.L., M. Kirchner, B. Guerra, S.A. Granier, C. Lucarelli, M.C. Porrero, A. Jakubczak, E.J. Threlfall, and D.J. Mevius. 2010. Multiresistant Salmonella enterica serovar 4,[5],12:i:- in Europe: a new pandemic strain? Euro surveillance : bulletin Europeen sur les maladies transmissibles = European communicable disease bulletin 15:19580.
Kahlmeter, G., D.F. Brown, F.W. Goldstein, A.P. MacGowan, J.W. Mouton, A. Osterlund, A. Rodloff, M. Steinbakk, P. Urbaskova, and A. Vatopoulos. 2003. European harmonization of MIC breakpoints for antimicrobial susceptibility testing of bacteria. The Journal of antimicrobial chemotherapy 52:145-148.
Lazarus, B., D.L. Paterson, J.L. Mollinger, and B.A. Rogers. 2014. Do Human Extraintestinal Escherichia coli Infections Resistant to Expanded-Spectrum Cephalosporins Originate From Food-Producing Animals? A Systematic Review. Clinical infectious diseases : an official publication of the Infectious Diseases Society of America
Le Hello, S., R.S. Hendriksen, B. Doublet, I. Fisher, E.M. Nielsen, J.M. Whichard, B. Bouchrif, K. Fashae, S.A. Granier, N. Jourdan-Da Silva, A. Cloeckaert, E.J. Threlfall, F.J. Angulo, F.M. Aarestrup, J. Wain, and F.X. Weill. 2011. International spread of an epidemic population of Salmonella enterica serotype Kentucky ST198 resistant to ciprofloxacin. The Journal of infectious diseases 204:675-684.
Leverstein-van Hall, M.A., C.M. Dierikx, J. Cohen Stuart, G.M. Voets, M.P. van den Munckhof, A. van Essen-Zandbergen, T. Platteel, A.C. Fluit, N. van de Sande-Bruinsma, J. Scharinga, M.J. Bonten, D.J. Mevius, and E.s.g. National. 2011. Dutch patients, retail chicken meat and poultry share the same ESBL genes, plasmids and strains. Clinical microbiology and infection : the official publication of the European Society of Clinical Microbiology and Infectious Diseases 17:873-880.
Liebana, E., A. Carattoli, T.M. Coque, H. Hasman, A.P. Magiorakos, D. Mevius, L. Peixe, L. Poirel, G. Schuepbach-Regula, K. Torneke, J. Torren-Edo, C. Torres, and J. Threlfall. 2013. Public health risks of enterobacterial isolates producing extended-spectrum beta-lactamases or AmpC beta-lactamases in food and food-producing animals: an EU perspective of epidemiology, analytical methods, risk factors, and control options. Clinical infectious diseases : an official publication of the Infectious Diseases Society of America 56:1030-1037.
Lucarelli, C., A.M. Dionisi, M. Torpdahl, L. Villa, C. Graziani, K. Hopkins, J. Threlfall, A. Caprioli, and I. Luzzi. 2010. Evidence for a second genomic island conferring multidrug resistance in a clonal group of strains of Salmonella enterica serovar Typhimurium and its monophasic variant circulating in Italy, Denmark, and the United Kingdom. Journal of clinical microbiology 48:2103-2109.
Manges, A.R., and J.R. Johnson. 2012. Food-borne origins of Escherichia coli causing extraintestinal infections. Clinical infectious diseases : an official publication of the Infectious Diseases Society of America 55:712-719.
McCartney, A.C., G.F. Edwards, E.T. Curran, and E.J. Threlfall. 1993. Transmission of Salmonella from health care workers. The Journal of hospital infection 24:157.
Monnet, D., J.M. López‐Lozano, P. Campillos, A. Burgos, A. Yagüe, and N. Gonzalo. 2001. Making sense of antimicrobial use and resistance surveillance data: application of ARIMA and transfer function models. Clinical Microbiology and Infection 7:29-36.
Moulin, G., P. Cavalie, I. Pellanne, A. Chevance, A. Laval, Y. Millemann, P. Colin, and C. Chauvin. 2008. A comparison of antimicrobial usage in human and veterinary medicine in France from 1999 to 2005. The Journal of antimicrobial chemotherapy 62:617-625.
Nilsson, O., C. Greko, J. Top, A. Franklin, and B. Bengtsson. 2009. Spread without known selective pressure of a vancomycin-resistant clone of Enterococcus faecium among broilers. The Journal of antimicrobial chemotherapy 63:868-872.
Official Journal of the European Communities. 1998. Decision No 2119/98/EC of the European Parliament and of the Council of 24 September 1998 setting up a network for the epidemiological surveillance and control of communicable diseases in the Community In http://eur-lex.europa.eu/legal-content/EN/ALL/?uri=CELEX:31998D2119.
Official Journal of the European Communities. 2001a. Council Regulation (EEC) No 2001/83 of 2 June 1983 amending and updating Regulation (EEC) No 1408/71 on the application of social security schemes to employed persons, to self-employed persons and to members of their families moving within the Community and also amending and updating Regulation (EEC) No 574/72 laying down the procedure for implementing Regulation (EEC) No 1408/71. In http://eur-lex.europa.eu/legal-content/EN/TXT/?qid=1416479716753&uri=CELEX:31983R2001.
Official Journal of the European Communities. 2001b. Directive 2001/82/EC of the European Parliament and of the Council of 6 November 2001 on the Community code relating to veterinary medicinal products. In http://eur-lex.europa.eu/legal-content/EN/TXT/?qid=1416418106960&uri=CELEX:32001L0082.
ECDC/EFSA/EMA first joint report on the integrated analysis of the consumption of antimicrobial agents and occurrence of antimicrobial resistance in bacteria from humans and food-producing animals 636088/2013 Page 112/114

Official Journal of the European Communities. 2002. Regulation (EC) No 178/2002 of the European Parliament and of the Council of 28 January 2002 laying down the general principles and requirements of food law, establishing the European Food Safety Authority and laying down procedures in matters of food safety In http://eur-lex.europa.eu/legal-content/EN/TXT/?qid=1418924147681&uri=CELEX:32002R0178.
Official Journal of the European Union. 2003a. Directive 2003/99/EC of the European Parliament and of the Council of 17 November 2003 on the monitoring of zoonoses and zoonotic agents, amending Council Decision 90/424/EEC and repealing Council Directive 92/117/EEC. In http://eur-lex.europa.eu/LexUriServ/LexUriServ.do?uri=OJ:L:2003:325:0031:0040:EN:PDF.
Official Journal of the European Union. 2003b. Regulation (EC) No 1831/2003 of the European Parliament and of the Council of 22 September 2003 on additives for use in animal nutrition. In http://eur-lex.europa.eu/legal-content/EN/TXT/?qid=1416418929102&uri=CELEX:32003R1831.
Official Journal of the European Union. 2004a. Directive 2004/28/EC of the European Parliament and of the Council of 31 March 2004 amending Directive 2001/82/EC on the Community code relating to veterinary medicinal products. In http://eur-lex.europa.eu/legal-content/EN/TXT/?qid=1416417960408&uri=CELEX:32004L0028.
Official Journal of the European Union. 2004b. Regulation (EC) No 851/2004 of the European Parliament and of the Council of 21 april 2004 establishing a European Centre for disease prevention and control In http://eur-lex.europa.eu/legal-content/EN/TXT/?qid=1416419193386&uri=CELEX:32004R0851.
Official Journal of the European Union. 2004c. Regulation No 726/2004 of the European Parliament and of the Council of 31 March 2004 laying down Community procedures for the authorisation and supervision of medicinal products for human and veterinary use and establishing a European Medicines Agency. In http://eur-lex.europa.eu/legal-content/EN/TXT/?qid=1416477684261&uri=CELEX:32004R0726.
Official Journal of the European Union. 2006. Regulation (EC) No 1901/2006 of the European Parliament and of the Council of 12 December 2006 on medicinal products for paediatric use and amending Regulation (EEC) No 1768/92, Directive 2001/20/EC, Directive 2001/83/EC and Regulation (EC) No 726/2004. In http://eur-lex.europa.eu/legal-content/EN/TXT/?qid=1416418352546&uri=CELEX:32006R1901.
Official Journal of the European Union. 2007. Commission decision of 12 June 2007 on a harmonised monitoring of antimicrobial resistance in Salmonella in poultry and pigs (2007/407/EC). In http://eur-lex.europa.eu/legal-content/EN/TXT/?qid=1416419544633&uri=CELEX:32007D0407.
Official Journal of the European Union. 2009. Commission Regulation (EU) No 37/2010 of 22 December 2009 on pharmacologically active substances and their classification regarding maximum residue limits in foodstuffs of animal origin. In http://eur-lex.europa.eu/legal-content/EN/TXT/?qid=1416483379366&uri=CELEX:32010R0037.
Official Journal of the European Union. 2013. Commission Implementing Decision of 12 November 2013 on the monitoring and reporting of antimicrobial resistance in zoonotic and commensal bacteria (2013/652/EU). In http://eur-lex.europa.eu/legal-content/EN/TXT/?qid=1416491686645&uri=CELEX:32013D0652.
Poirel, L.B., B.; Millemann, Y.; Bonnin, R.A.; Pannaux, G.; Nordmann, P. 2012. Carbapenemase-producing Acinetobacter spp. in cattle, France. Emerg Infect Dis. 18:523-525.
Safrany, N., and D.L. Monnet. 2012. Antibiotics obtained without a prescription in Europe. The Lancet infectious diseases 12:182-183.
SAS, I. 1999. SAS/STAT User's Guide, Version 9.2. In SAS Cary, NC. Schwaber, M.J., T. De-Medina, and Y. Carmeli. 2004. Epidemiological interpretation of antibiotic
resistance studies–what are we missing? Nature Reviews Microbiology 2:979-983. Smet, A., F. Boyen, F. Pasmans, P. Butaye, A. Martens, A. Nemec, P. Deschaght, M. Vaneechoutte, and
F. Haesebrouck. 2012. OXA-23-producing Acinetobacter species from horses: a public health hazard? Journal of antimicrobial chemotherapy dks311.
Snow, L.C., R.G. Warner, T. Cheney, H. Wearing, M. Stokes, K. Harris, C.J. Teale, and N.G. Coldham. 2012. Risk factors associated with extended spectrum beta-lactamase Escherichia coli (CTX-M) on dairy farms in North West England and North Wales. Preventive veterinary medicine 106:225-234.
Søgaard, P. 1989. The epidemiology of antibiotic resistance in three species of the Enterobacteriaceae and the relation to consumption of antimicrobial agents in Odense University Hospital. Danish medical bulletin 36:65.
Spratt, B.G. 2004. Exploring the concept of clonality in bacteria. In Genomics, Proteomics, and Clinical Bacteriology. Springer, 323-352.
ECDC/EFSA/EMA first joint report on the integrated analysis of the consumption of antimicrobial agents and occurrence of antimicrobial resistance in bacteria from humans and food-producing animals 636088/2013 Page 113/114

Swedres-Svarm. 2013. Use of antimicrobials and occurrence of antimicrobial resistance in Sweden. In Solna/Uppsala, http://www.sva.se/en/Antibiotika/SVARM-reports/.
Threlfall, E., J. Wain, T. Peters, C. Lane, E. De Pinna, C. Little, A. Wales, and R. Davies. 2014. Egg-borne infections of humans with salmonella: not only an S. enteritidis problem. World's Poultry Science Journal 70:15-26.
Threlfall, E.J. 2000. Epidemic Salmonella typhimurium DT 104--a truly international multiresistant clone. The Journal of antimicrobial chemotherapy 46:7-10.
van de Sande-Bruinsma, N., H. Grundmann, D. Verloo, E. Tiemersma, J. Monen, H. Goossens, M. Ferech, G. European Antimicrobial Resistance Surveillance System, and G. European Surveillance of Antimicrobial Consumption Project. 2008. Antimicrobial drug use and resistance in Europe. Emerging infectious diseases 14:1722-1730.
Walsh, T.R. 2010. Emerging carbapenemases: a global perspective. International journal of antimicrobial agents 36:S8-S14.
Wener, K.M., V. Schechner, H.S. Gold, S.B. Wright, and Y. Carmeli. 2010. Treatment with fluoroquinolones or with β-lactam-β-lactamase inhibitor combinations is a risk factor for isolation of extended-spectrum- β-lactamase-producing klebsiella species in hospitalized patients. Antimicrobial Agents and Chemotherapy 54:2010-2016.
Westrell, T., D.L. Monnet, C. Gossner, O. Heuer, and J. Takkinen. 2014. Drug-resistant Salmonella enterica serotype Kentucky in Europe. The Lancet. Infectious diseases 14:270-271.
WHO. 2007. Critically Important Antimicrobials for Human Medicine. Report of the Second WHO Expert Meeting Copenhagen, 29–31 May 2007. In http://apps.who.int/iris/bitstream/10665/43765/1/9789241595742_eng.pdf?ua=1.
WHO. 2011. WHO list of Critically important antimicrobials in human medicine. Third revision. . In W.L.C.-i.-P. Data, editor http://apps.who.int/iris/bitstream/10665/77376/1/9789241504485_eng.pdf.
WHO. 2012. Critically important antimicrobials for human medicine - 3rd revision 2011. In World Health Organisation, http://apps.who.int/iris/bitstream/10665/77376/1/9789241504485_eng.pdf. 31.
WHO. 2014. Antimicrobial resistance: global report on surveillance. In http://apps.who.int/iris/bitstream/10665/112642/1/9789241564748_eng.pdf?ua=1.
Wierup, M., C. Lowenhielm, M. Wold-Troell, and I. Agenas. 1987. Animal consumption of antibiotics and chemotherapeutic drugs in Sweden during 1980, 1982 and 1984. Veterinary research communications 11:397-405.
Wimalarathna, H.M., J.F. Richardson, A.J. Lawson, R. Elson, R. Meldrum, C.L. Little, M.C. Maiden, N.D. McCarthy, and S.K. Sheppard. 2013. Widespread acquisition of antimicrobial resistance among Campylobacter isolates from UK retail poultry and evidence for clonal expansion of resistant lineages. BMC microbiology 13:160.
Wu, G., M.J. Day, M.T. Mafura, J. Nunez-Garcia, J.J. Fenner, M. Sharma, A. van Essen-Zandbergen, I. Rodríguez, C. Dierikx, and K. Kadlec. 2013. Comparative analysis of ESBL-positive Escherichia coli isolates from animals and humans from the UK, The Netherlands and Germany. PloS one 8:e75392.
Zou, L., J. Meng, P.F. McDermott, F. Wang, Q. Yang, G. Cao, M. Hoffmann, and S. Zhao. 2014. Presence of disinfectant resistance genes in Escherichia coli isolated from retail meats in the USA. The Journal of antimicrobial chemotherapy 69:2644-2649.
ECDC/EFSA/EMA first joint report on the integrated analysis of the consumption of antimicrobial agents and occurrence of antimicrobial resistance in bacteria from humans and food-producing animals 636088/2013 Page 114/114