ecb supervisory data quality framework, tools and …...ecb supervisory data quality framework,...
TRANSCRIPT

ECB Supervisory Data Quality Framework, Tools and Products
Supervisory Reporting Conference Frankfurt 15 November 2017
European Central Bank, Frankfurt
Patrick Hogan Head of Supervisory Data Services Section
Banking Supervision Data Division

Rubric
www.bankingsupervision.europa.eu ©
Overview
Supervisory Reporting Conference 2017 2
1
2 Data quality dimensions and metrics
Introduction and characteristics
3 Collaboration with SSM: Data Quality Products

Rubric
www.bankingsupervision.europa.eu ©
The supervisory statistics data quality framework
• Applied and selected set of dimensions and metrics to frame the assessment of supervisory data quality within the Supervisory Statistics Division.
• Based on the ECB Statistics Quality Framework and inspired by other practices of data quality implemented among international institutions.
• Efficient framework applicable to different units of observation,
different levels of aggregation and different time dimensions.
Introduction: framework
3 Supervisory Reporting Conference 2017

Rubric
www.bankingsupervision.europa.eu ©
Definitions
Dimensions:
According to the Principle 2 of the UN Principles of Official Statistics (1994) states: “to retain trust in official statistics, the statistical agencies need to decide according to strictly professional considerations, including scientific principles and professional ethics, on the methods and procedures for the collection, processing, storage and presentation of statistical data.” The list of these considerations responds to a set of dimensions which apply to supervisory statistics: punctuality, accuracy and reliability, consistency and plausibility.
4
Introduction: Dimensions and Metrics characteristics
Supervisory Reporting Conference 2017
Metrics: • Metrics are define as system or standard of
measurement: a set of figures or statistics that measure results.
• They have to take into account the nature and the
type of data analysed
• They have to measure a specific dimension in an unbiased way, i.e. being interpretable and comparable across time and unit of observation (e.g. ratios, skewness of the distributions).
• They have to measure a specific dimension in an
absolute way, i.e. making the user able to understand the actual magnitude of the comparison (e.g. levels, growth rates).
Rubric
www.bankingsupervision.europa.eu ©
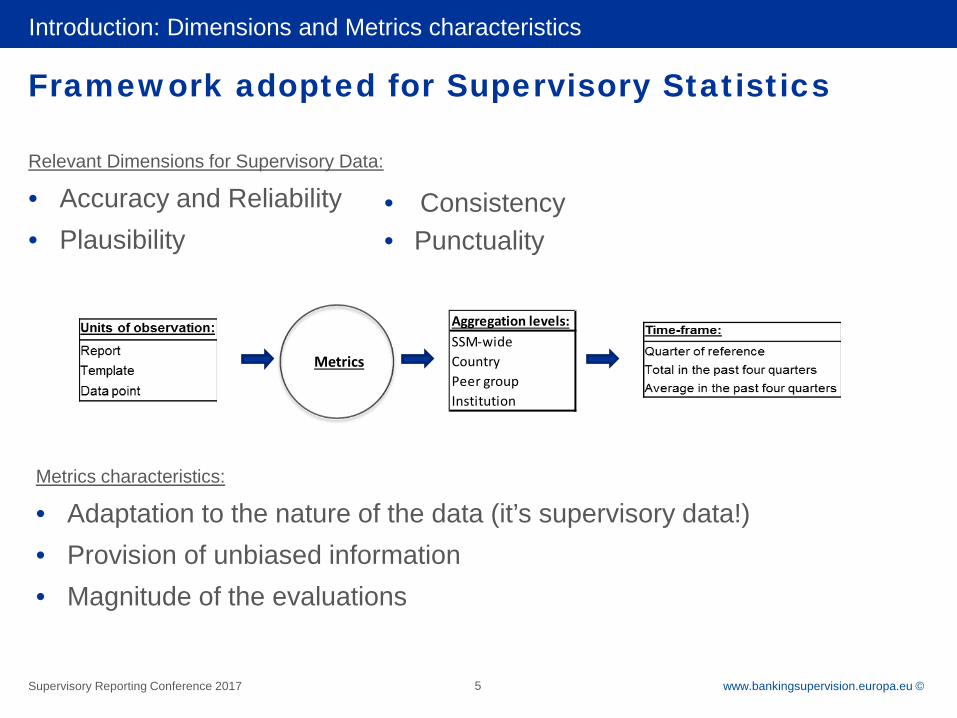
Framework adopted for Supervisory Statistics
Relevant Dimensions for Supervisory Data:
• Accuracy and Reliability • Plausibility
Introduction: Dimensions and Metrics characteristics
5
Metrics characteristics:
• Adaptation to the nature of the data (it’s supervisory data!) • Provision of unbiased information • Magnitude of the evaluations
Metrics
• Consistency • Punctuality
Aggregation levels:SSM-wideCountryPeer groupInstitution
Supervisory Reporting Conference 2017

Rubric
www.bankingsupervision.europa.eu ©
Introduction
Data Quality at the ECB 6
Introduction: Data Quality and Sequential Approach ECB-RESTRICTED
NCAs
First Level EBA Validation Rules
Additional national DQ checks Comparisons at a national
level
ECB
Second Level EBA Validation Rules
Additional ECB DQ checks Cross country (SSM)
comparisons (incl. monitoring of data received by NCAs)
EBA
Third Level EBA Validation Rules
Additional EBA DQ Checks (e.g. for Transparency
Exercise) Cross country (EU)
comparisons

Rubric
www.bankingsupervision.europa.eu ©
Overview
7
1
2 Accuracy and reliability
Dimensions and metrics characteristics 1
2 Data quality dimensions and metrics
Introduction and characteristics
Supervisory Reporting Conference 2017
3 Collaboration with SSM: Data Quality Products

Rubric
www.bankingsupervision.europa.eu ©
Hard Checks: Punctuality
Punctuality refers to the lag in time between the remittance date and the actual submission of the data from the NCA to the ECB (ongoing discussion to receive data on the submission from institutions to NCAs). The following metrics will be implemented both for each time-frame level. Metrics: – Average number of days of delay in receiving units of observation – Average number of delays after the remittance deadline for receiving fully valid
reports – Number of delayed units of observation divided by expected units of observation – Number of units of observation accepted on time divided by the total number of
expected units of observation – Number of fully valid reports accepted on time divided by total number of expected
reports – Concentration of number of days of delay per level of aggregation 8
Data quality dimensions and metrics
Supervisory Reporting Conference 2017

Rubric
www.bankingsupervision.europa.eu ©
Hard checks: accuracy and consistency Accuracy shall be defined as the absence of mistakes and exact correspondence of the reported values with the underlying concept for each data point. It is measured by the compliance of the institution with the EBA validation rules. • Failing VRs within a template:
In the supervisory statistics environment, we view accuracy as the closeness of the reported value to the underlying supervisory concept. Equivalently, it is the degree to which data correctly reflect the corresponding ITS concepts. It is quantified using the number of failing validation rules and completeness checks. In order to access reliability we analyse resubmissions.
• Resubmission studies: Based on the analysis of the difference between preliminary and revised reported values. All significant resubmissions (according to the guidelines on provided by the resubmission note) are automatically detected and lead to further investigations.
9
Data quality dimensions and metrics
Supervisory Reporting Conference 2017
Rubric
www.bankingsupervision.europa.eu ©
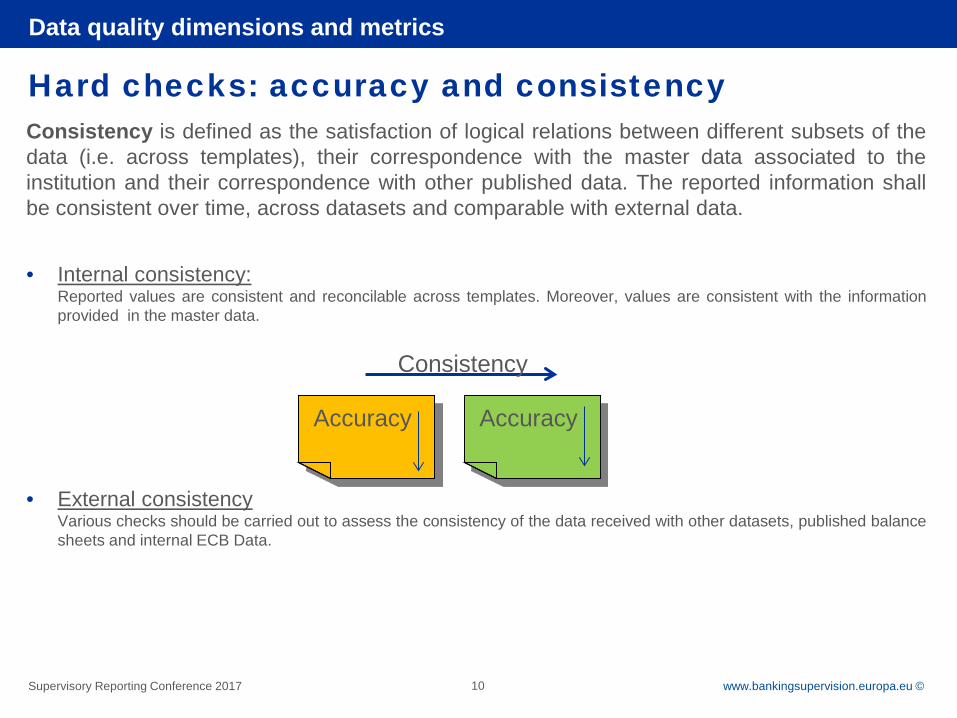
Hard checks: accuracy and consistency Consistency is defined as the satisfaction of logical relations between different subsets of the data (i.e. across templates), their correspondence with the master data associated to the institution and their correspondence with other published data. The reported information shall be consistent over time, across datasets and comparable with external data. • Internal consistency:
Reported values are consistent and reconcilable across templates. Moreover, values are consistent with the information provided in the master data.
• External consistency Various checks should be carried out to assess the consistency of the data received with other datasets, published balance sheets and internal ECB Data.
10
Data quality dimensions and metrics
Accuracy
Consistency
Accuracy
Supervisory Reporting Conference 2017

Rubric
www.bankingsupervision.europa.eu ©
Hard checks: accuracy and consistency metrics
Data quality dimensions and metrics
11
Validation errors: data points * failing VR Validation rules failing: which VRs out of the circa 2000
Validation rules categories: blocking, non blocking, overall • Overall number of validation errors: number of units of observation that are
failing validation rules • Percentage of failing validation rules: failing validation rules/total applicable
validation rules • Percentage of validation errors: number of validation errors/ maximum units of
observation that can fail given the units of observation reported • Concentration of validation errors in validation rules: number of validation
rules representing 75% (generally represents the top 10 failing VRs) of the total number of validation errors
• Concentration of validation errors in institutions: number of institutions representing 75% of the total number of validation errors
Supervisory Reporting Conference 2017

Rubric
www.bankingsupervision.europa.eu ©
Hard checks: accuracy and consistency metrics (2)
External consistency (qualitative check): • Number of selected indicators (e.g. own funds, equity and capital) that
differ significantly from the same indicators published externally (e.g. Pillar 3 disclosures, Bankscope, Bloomberg, Reuters, published annual accounts, etc.).
• Percentage difference of selected indicators from the same indicators published externally.
• Difference in the quarterly growth of selected indicators from the growth of the same indicators published externally.
Data quality dimensions and metrics
12 Supervisory Reporting Conference 2017

Rubric
www.bankingsupervision.europa.eu ©
Soft Checks: Stability and Completeness Stability It is analysed by examining changes between periods in the total number of data points reported per module and template. In addition to key data points for supervision, the number of countries that have been reported in the geographical breakdowns in COREP and FINREP and the number of significant currencies in ALMM and NSFR are analyzed Completeness: Is defined as the availability of the largest and most material subset of the required information
Some metrics: • Number of missing modules • Number of missing templates • Number of missing data points
13
Data quality dimensions and metrics
Supervisory Reporting Conference 2017

Rubric
www.bankingsupervision.europa.eu ©
Soft Checks: Completeness metrics
Completeness: • Quantification of missing data:
– Completeness rate: number of units of observations (modules, templates, data points) received / number of expected units of observation (e.g. overall rate of 83% of expected data points reported in Q2 2017)
– Concentration: analysis of the distributional biases of missing units of observation
• Identification and evaluation of main reasons for file rejection in the reporting processes: – Number of rejected files (last received) – Frequency of failing validation rules that cause file rejections
Data quality dimensions and metrics
14 Supervisory Reporting Conference 2017

Rubric
www.bankingsupervision.europa.eu ©
Soft Checks: Plausibility metrics
• Plausibility checks aim to detect outliers in the reported data. This is accomplished by reviewing the time series of the variable concerned with both a statistical approach and a business-based one. Values that markedly deviate from the usual pattern of the series are isolated and further analysed.
• Outlier analysis: Outlying unit of observations are flagged and explanations are requested to the institutions via the NCAs We look at values with: • extremely high (or extremely negative) growth rates. • extremely high (or extremely negative) levels.
15
Data quality dimensions and metrics
Supervisory Reporting Conference 2017

Rubric
www.bankingsupervision.europa.eu ©
Overview
16
1
2 Accuracy and reliability
Dimensions and metrics characteristics 1
2 Data quality dimensions and metrics
Introduction and characteristics
Supervisory Statistics Seminar
3 Collaboration with SSM: Data Quality Products

Rubric
www.bankingsupervision.europa.eu ©
Set of tables on data quality Produced 2 times per reference period Shared with SSM
Data Quality Assessment Report Produced for each reference period Shared with WG SUP & SSM For information to the SB
Thematic analysis of certain areas of the ITS Together with volunteers from EGDQ Resulting in additional data quality checks
Traffic light system (R-A-G) for a selection of data points Based on failed validation rules For data points used in RAS scores
Individual bank reports Based on the DQ dimensions
Data Quality Findings Produced for each reference period Serves as basis for Data Quality Assessment Report Shared with WG-SUP and SSM
Report on breaches Produced for each reference period Overview of not complying with regulatory ratios
Individual dashboard per institution With a rating of that institution
Data Quality Indicators in IMAS Based on internal consistency of data
Tracking Tool Process for ad-hoc issues
17
Data Quality products and processes

Rubric Use as rubric line or delete on slide master ECB-RESTRICTED
www.bankingsupervision.europa.eu ©
Collaboration SSM - SUP
18
ECB-RESTRICTED
The Data Quality assessment report is shared with: • NCAs
– Via the WG SUP and the EQDQ through presentations at meetings and follow-up written procedures
• Statistics Committee (in SSM composition) – Via written procedures and occasional presentations at meetings
• Supervisory Board – Following an initial discussion during supervisory board meeting
in 2015, now circulated for information after conclusion of written procedure in the STC
• JSTs – The different iterations of the report are loaded in IMAS
… up to the Supervisory Board
Supervisory Reporting Conference 2017

Rubric Use as rubric line or delete on slide master ECB-RESTRICTED
www.bankingsupervision.europa.eu © 19
Additional DQ Checks – overview of the EGDQ process
Data quality tools and products
Supervisory Reporting Conference 2017
Rubric
www.bankingsupervision.europa.eu ©
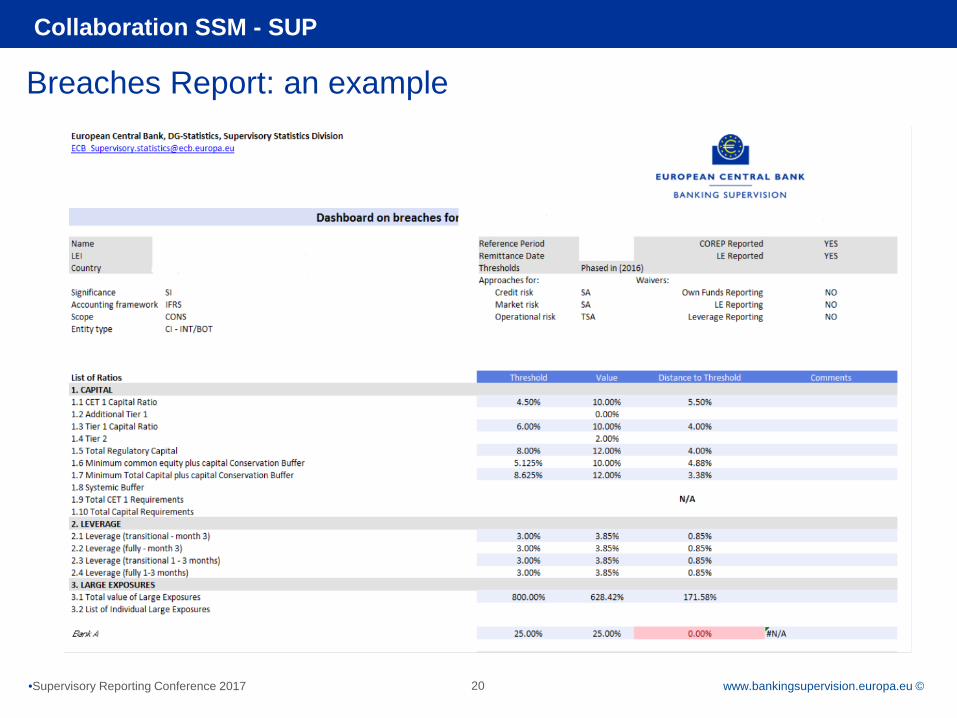
Breaches Report: an example
Collaboration SSM - SUP
20 •Supervisory Reporting Conference 2017

Rubric
www.bankingsupervision.europa.eu ©
Objective and key elements
• A 3 page document summarising the most important indicators in terms of data quality; assessing and rating data quality performance
• Focus on significant institution (first step)
• Analysis per entity and per reference period
• Historical performance viewpoint
• Individual & Peer group comparison
• Data Quality indicators on: – Punctuality
– Completeness
– Accuracy
• Data Quality Index – Rating scale:
21
Data quality tools and products
Data Quality Individual dashboard
Supervisory Reporting Conference 2017

Rubric
www.bankingsupervision.europa.eu ©
Rubric ECB-RESTRICTED Collaboration SSM - SUP
22
Individual Dashboard: an example (1/2)
•Supervisory Reporting Conference 2017

Rubric
www.bankingsupervision.europa.eu ©
Rubric ECB-RESTRICTED Collaboration SSM - SUP
23
2. Individual Dashboard: an example (2/2)
•Supervisory Reporting Conference 2017

Rubric
www.bankingsupervision.europa.eu © 24
Thank you: Questions or observations
•Supervisory Reporting Conference 2017