ec102 economics b -...
TRANSCRIPT

EC102EconomicsB
Class1
Week3/LT 25.01.2016
samirabarzin.jimdo.comOfficeHoursEC102:Mon10:30–11.30
(32L1.30)
EC102 SamiraBarzin
Class1:Q1WhichofthefollowingstatementsaboutGDPandRealGDParecorrect?a) GDPisthevalueofallgoodsproducedbytheeconomy
inagivenperiodb) GDPisthesumoftotalconsumpXonbyhouseholdsand
governments,investment(incl.newhouses),andnetexports
c) RealGDPcontrolsforinflaXonbyusingconstant-baseyearprices
d) RealGDPcontrolsforinflaXonbyusingthepricesofabasecountry

EC102 SamiraBarzin
Class1:Q1GDPTheGrossDomesXcProduct(GDP)isameasureoftheeconomicperformanceofacountryinagivenXmeperiodTheGDPincludesthefollowing• ConsumpXon(byhouseholds)• Governmentexpenditures(bythegovernment)• Investments(byfirms)• Netexports:Exports–Imports =>GDP=Y=C+G+I+(X–M)- importsarenotproducedinthecountry,hencetheyarenotpartofthe
GDP- Cvs.I:investmentsnormallyresultinareturninthelaterfuture,i.e.
outputgrowthduetoanewfactory,consumpXonisaoneXmeexpenditurethatwillnotproduceanyreturns
EC102 SamiraBarzin
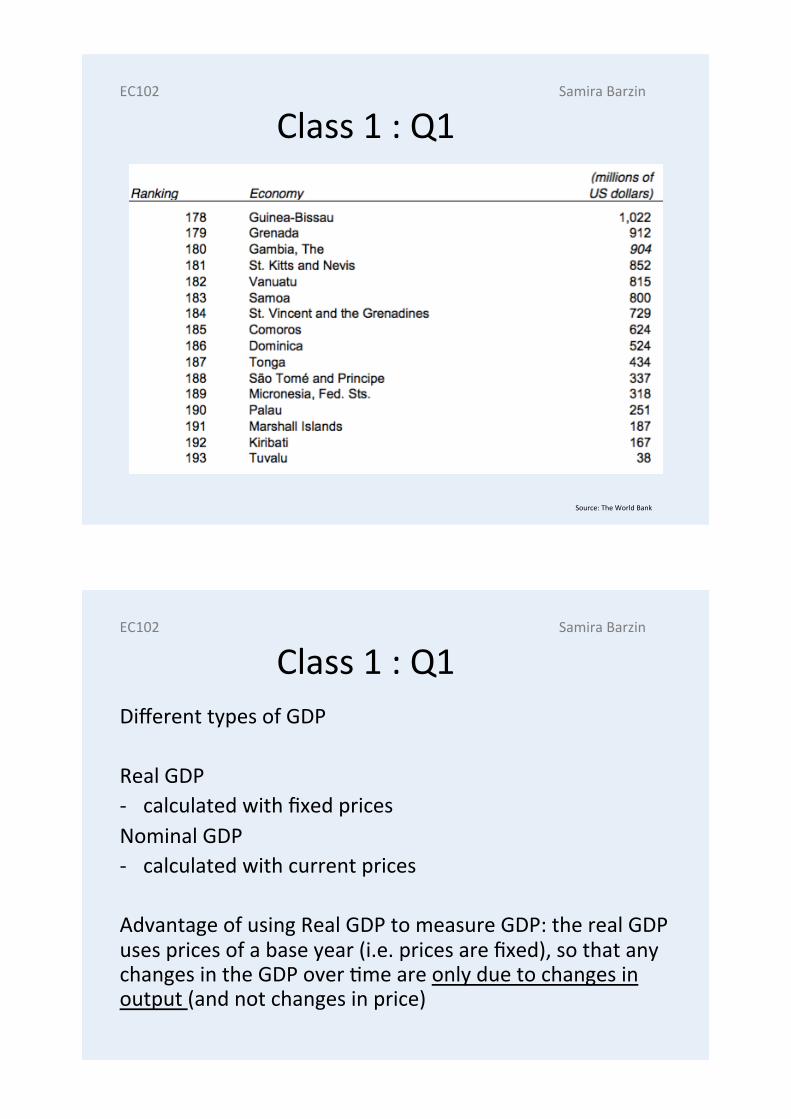
Class1:Q1
Source:TheWorldBank
EC102 SamiraBarzin
Class1:Q1
Source:TheWorldBank
EC102 SamiraBarzin
Class1:Q1DifferenttypesofGDPRealGDP- calculatedwithfixedpricesNominalGDP- calculatedwithcurrentpricesAdvantageofusingRealGDPtomeasureGDP:therealGDPusespricesofabaseyear(i.e.pricesarefixed),sothatanychangesintheGDPoverXmeareonlyduetochangesinoutput(andnotchangesinprice)

EC102 SamiraBarzin
Class1:Q1Asmallexample:Year1:10goodsareproducedintheeconomy,eachcosts£2(year1isthebaseyear)
nominalGDP1:£20(10(goods)x£2(priceyear1))realGDP1:£20(10(goods)x£2(priceyear1))
Year2:10goodsareproducedintheeconomy,eachcosts£3nominalGDP2:£30(10(goods)x£3(priceyear2)realGDP2:£20(10(goods)x£2(priceyear1))
->Thereisnochangeintheoutputproducedfromyear1to2,howeverthereexistsanincreaseinprices.Hence,thegrowthinnominalGDPisonlyduetopricechanges,realGDPismeasuredforbothyearswiththesamepricesandhencerealGDPisnotinfluencedbypricechanges.RealGDPgivesusamoreaccuratedescripXonoftheGDPgrowthoverXme.
EC102 SamiraBarzin
Class1:Q1WhichofthefollowingstatementsaboutGDPandRealGDParecorrect?a) GDPisthevalueofallgoodsproducedbytheeconomy
inagivenperiod✖b) GDPisthesumoftotalconsumpXonbyhouseholdsand
governments,investment(incl.newhouses),andnetexports✔
c) RealGDPcontrolsforinflaXonbyusingconstant-baseyearprices✔
d) RealGDPcontrolsforinflaXonbyusingthepricesofabasecountry✖
(inflaXon:changeinthegeneralpricelevel)

EC102 SamiraBarzin
Class1:GDPpercapita Someoftherichest
countries(intermsofpercapitaGDP(PPP))
EC102 SamiraBarzin
Class1:GDPpercapita Someofthe
poorestcountries(intermsofpercapitaGDP(PPP))

EC102 SamiraBarzin
Class1:Q2TheEconomisthasbeenpublishingtheBigMacPriceIndexsince1986.Theindexkeepstrackoftheaveragepriceofahamburgersoldindifferentcountries.Forexample,theaveragepriceofaBigMacinAmericain2015was$4.93;inChinaitwasonly$2,68atthemarketexchangerates.ThegraphshowstherelaXonbetweenGDPperpersonandtheBigMacprices(allconvertedtoUSD)acrosscountriesin2014.TherelaXonisverysimilarinallotheryear.
EC102 SamiraBarzin
Class1:Q2

EC102 SamiraBarzin
Class1:Q2Giventhegraph,whichofthefollowingstatementswouldbetrue?a) BigMacstendtobemoreexpensiveinrichcountriesb) ThereareopportuniXesforarbitraging(buyingatalow
price,sellingatahighprice)BigMacsacrosscountriesc) WecancomparetheoutputofBigMacsacross
countriesbycompuXnglocalcurrencymarketvalueofalltheBigMacsproduced,andmulXplybythemarketexchangerate
d) InpoorcountriesPPPconsumpXonofBigMacsexceedsnormalconsumpXon
EC102 SamiraBarzin
Class1:Q2a) BigMacstendtobemoreexpensiveinrichcountries✔ThegraphshowsaposiXvecorrelaXonbetweenpercapitaGDPandthepriceofaBigMac,sothehigherthepercapitaGDPthehighertheBigMacprice(percapitaGDP=averageincomeperperson)b) ThereareopportuniXesforarbitraging(buyingatalowprice,sellingat
ahighprice)BigMacsacrosscountries✖Generallyarbitraging(buyingBigMacsfromacountrywheretheyarecheapandsellingtheminacountrywheretheyareexpensive)ispossible,howeverinthisBigMaccasea)imporXngmeatisaproblemb)ifarbitragingwouldresultinposiXveprofitsandmorepeoplewouldengageinthis,asaconsequencedemandfortheofficialBigMacsinexpensivecountriesdecreases(andpriceswilldrop)andthedemandforunofficiallyimportedBigMacsincrease(pricewillrise).Sowecanseeanadjustmentofprices.InthedatawewouldthenseeverysimilarpricesfortheBigMacsacrosscountries,butwedonotseethisinthegraph.

EC102 SamiraBarzin
Class1:Q2c) WecancomparetheoutputofBigMacsacrosscountriesby
compuXnglocalcurrencymarketvalueofalltheBigMacsproduced,andmulXplybythemarketexchangerate✖
Thegeneralpricelevelisdifferentacrosscountries,andthiscalculaXondoesnottakethisintoaccount.ToillustrateassumetheBigMaccosts$5intheUSand£5intheUK,inbothcountries10BigMacsareproducedandthemarketexchangerateis$1.30for£1.TheUS-Outputwouldbe:$50andtheUK-Outputwouldbe£50,butonthemarket£50is$65(50x1.30).YouwereledtobelievethatthereismoreoutputintheUKsince$65>$50,butinrealtermsbothcountrieshadanequaloutputof10BigMacs.d) InpoorcountriesPPPconsumpXonofBigMacsexceeds
normalconsumpXon✔
EC102 SamiraBarzin
Class1:Q2Giventhegraph,whichofthefollowingstatementswouldbetrue?a) BigMacstendtobemoreexpensiveinrichcountries✔b) ThereareopportuniXesforarbitraging(buyingatalow
price,sellingatahighprice)BigMacsacrosscountries✖c) WecancomparetheoutputofBigMacsacrosscountries
bycompuXnglocalcurrencymarketvalueofalltheBigMacsproduced,andmulXplybythemarketexchangerate✖
d) InpoorcountriesPPPconsumpXonofBigMacsexceedsnormalconsumpXon✔

EC102 SamiraBarzin
Class1:Q3ThereisaposiXvecorrelaXonbetweena) GDPandlifeexpectancyb) GDPpercapitaandlifeexpectancyc) GDPpercapitaandinfantmortalityd) GDPpercapitaandadultliteracyrate
(AposiXvecorrelaXonexistswhentwovariablesmoveinthesamedirecXon,e.g.xincreases&yincreasesandxdecreases&ydecreases)*allthegraphsforthesoluXonsaregeneratedfromgapminder.org
EC102 SamiraBarzin
Class1:Q3a) GDPandlifeexpectancy✖
AnalysingthedatatrendsoverXme,itisobservablethatlifeexpectancyincreasedoverXme,butthemajorityofGDPsremainedconstant.ThereappearsnoposiXvecorrelaXonbetweenthesetwovariablesandwecannotconcludethatgrowthinlifeexpectancyisfromGDPgrowth,otherfactorscouldbeatplay,i.e.globaladvancesinmedicine,vaccines,infrastructure.

EC102 SamiraBarzin
Class1:Q3b) GDPpercapitaandlifeexpectancy✔
FromthedatawecanseethatthesetwovariablesbothincreaseoverXmeandwecanseeobserveaposiXvecorrelaXonofthesevariables:asincomeperpersonincreased,lifeexpectancyincreasetoo.WecannotmakeanystatementsastowhetherincreasesinGDPpercapitaincreasedlifeexpectancy(weneedtoanalysemuchmoredataforthat),butwecanobservethattheyhavemovedinthesamedirecXonoverXme.
EC102 SamiraBarzin
Class1:Q3c) GDPpercapitaandInfantmortality✖
FromthedatawecanobservethatinfantmortalitydecreasedoverXme,whereasincomeperpersonincreasedoverXme,sothesevariablesdidnotmoveinthesamedirecXonandhencearenotposiXvelycorrelated.WecanobserveanegaXvecorrelaXoninstead(asonevariableincreased,theothervariabledecreased).

EC102 SamiraBarzin
Class1:Q3d) GDPpercapitaandadultliteracyrate✔
FromthedatawecanobservethatbothadultliteracyrateandGDPpercapitahaveincreasedoverXmesowehaveaposiXvecorrelaXonbetweenthesetwovariables.Areasonbehindthiscouldbethatastheaverageincomeperpersongrewinagivencountry,thecountryonaveragebecamericherandincreasedinvestmentsineducaXon.
EC102 SamiraBarzin
Class1:Q3PossiblereasonsforthesecorrelaXons• Governmentspendingonhealth(hospitals,doctors,equipment,etc.)
• R&DandeducaXon• Governmentspendingoninfrastructure(beserroadstoreduceaccidents,beseraccesstocleanwatertoreducewaterbornediseases)

EC102 SamiraBarzin
Class1:Q3ThereisaposiXvecorrelaXonbetweena) GDPandlifeexpectancy✖b) GDPpercapitaandlifeexpectancy✔c) GDPpercapitaandinfantmortality✖d) GDPpercapitaandadultliteracyrate✔
EC102 SamiraBarzin
Class1:Q4Whichofthefollowingstatementsaboutgrowthfactsarecorrect?a) GDPperpersonhasbeenstagnantformostofhuman
historyandsignificantgrowthisarecentphenomenon
b) TheaverageBriXshresidenttodayalmostcertainlylivesingreatercomfortthananaristocratintheearly18thcentury
c) SomeAfricancountrieshavemeasuredGDPpercapitathatarelowerthanBritain’s1,000yearsago
d) GrowthinGDPpercapitaisalwaysposiXve

EC102 SamiraBarzin
Class1:Q4ThegraphbelowrepresentsthedevelopmentofGDPpercapitaoverXmeandhowitcomparestocurrentlevelsofGDPperpersonofothercountries.
EC102 SamiraBarzin
Class1:Q4a) GDPperpersonhasbeenstagnantformostofhumanhistory
andsignificantgrowthisarecentphenomenon✔ Fromthegraphwecanread
offthatunXlapproximatelythe18th–19thcentury,GDPpercapitahasremainedrelaXvelystableataround0.04.AstheverXcalaxismeasuredtoday’sGDPpercapita,wecanconcludethatupunXlroughlythe19thcentury,GDPpercapitawasstableataround4%oftoday’sGDPpercapita.

EC102 SamiraBarzin
Class1:Q4b) TheaverageBriXshresidenttodayalmostcertainlylivesin
greatercomfortthananaristocratintheearly18thcentury✔
ThegraphillustratesthatGDPpercapitahasremainedataround0.04unXl18th/19thcentury.Wecanseeanincreaseataroundthe18thcentury,sotheGDPpercapitaduringthe18thcenturywasapproximately0.1,i.e.10%oftoday’sGDPpercapita.Theaveragepersoninthe18thcenturycouldafford10%ofwhattoday’saveragepersoncan.AssumethatanaristocratwasaroundthreeXmesricherthantheaverageperson,then(s)hewouldhaveaGDPpercapitaof30%oftoday’sincome.Asthecountry’sweregenerallynotdeveloped,infrastructure,andthehealthsystemwerealsonotoncurrentlevels.
EC102 SamiraBarzin
Class1:Q4c) SomeAfricancountrieshavemeasuredGDPpercapitathatare
lowerthanBritain’s1,000yearsago✔
FromthegraphwecanreadoftheGDPpercapitalevelsofsomecountriescomparedtotheGDPpercapitaofBritain.MadagascarhasaGDPpercapitaofaround0.02,thatis2%oftoday’sGDPpercapitainBritain.Attheyear1000,BritainhadanapproximateGDPpercapitaof0.03oftoday’sGDPpercapita(largerthan0.02ofMadagascartoday).

EC102 SamiraBarzin
Class1:Q4d) GrowthinGDPpercapitaisalwaysposiXve✖
Source:TheWorldBank
ThegraphshowsGDPpercapitagrowthontheverXcalandXmeonthehorizontalaxis.AllcountriesshownhaveexperiencedadropinGDPpercapitagrowthwiththeglobaleconomiccrisisof2008/2009,somecountrieshaverecoveredaver.GDPpercapita=GDP/populaXon,soGDPpercapitacandecreaseifGDPdecreasesorpopulaXonincreases.PopulaXondoesnotfluctuateyearly(itmightdecrease/increaseoverlongXmehorizons),somostchangesinthegrowthrateofGDPpercapitaareduetoGDPfluctuaXons.IfGDPpercapitadecreases(itwillsXllbeposiXve),thatmeansitshrunk,sothegrowthrateisnegaXve.
EC102 SamiraBarzin
Class1:Q4Whichofthefollowingstatementsaboutgrowthfactsarecorrect?a) GDPperpersonhasbeenstagnantformostofhuman
historyandsignificantgrowthisarecentphenomenon✔b) TheaverageBriXshresidenttodayalmostcertainlylives
ingreatercomfortthananaristocratintheearly18thcentury✔
c) SomeAfricancountrieshavemeasuredGDPpercapitathatarelowerthanBritain’s1,000yearsago✔
d) GrowthinGDPpercapitaisalwaysposiXve✖

EC102 SamiraBarzin
Class1:Q5WhichofthefollowingwouldbeapossiblesoluXontotheshortageofnon-renewableresources?a) SubsXtuXontowardsrenewableresourcesb) Increaseefficiencyintheuseofnon-renewable
resourcesc) Recyclingofnon-renewableresourcesd) HoldGDPatcurrentlevels
EC102 SamiraBarzin
Class1:Q5ThisquesXonaskswhichpossibleopXoncanbeusedtoreduceouruseofnon-renewableresources.a) SubsXtuXontowardsrenewableresources✔UsingmorerenewableresourcesasanalternaXveallowsforareducXontheuseofnon-renewableresources(e.g.useenergyfromwindinsteadofenergyfromoilorcoal)b) Increaseefficiencyintheuseofnon-renewableresources
✔Increasedefficiencyallowstoproducethesameoutputwithlessinput,soincreasedefficiencyintheuseofnon-renewableresourcesallowstoproducethesameamountofoutputwithlessnon-renewableresources.

EC102 SamiraBarzin
Class1:Q5
c) Recyclingofnon-renewableresources✔Recyclingofnon-renewableresourcesallowstousemoreoftherecycledmaterialsasanalternaXvetoaddiXonalnon-renewableresources,hencereducingtheamountofnewnon-renewableresourcesrequired.d) HoldGDPatcurrentlevels✖IfGDPremainsconstant,thesameamountofnon-renewableresourcesisalsorequiredtoproduceit,hencethiswouldnotbeareducXonintheuseofnon-renewableresources.EC102 SamiraBarzin
Class1:Q5WhichofthefollowingwouldbeapossiblesoluXontotheshortageofnon-renewableresources?a) SubsXtuXontowardsrenewableresources✔b) Increaseefficiencyintheuseofnon-renewable
resources✔c) Recyclingofnon-renewableresources✔d) HoldGDPatcurrentlevels✖

EC102 SamiraBarzin
Class1:EssayQuesXonAccordingtoWorldBankesXmates,in2014thenominalGDPoftheUSandChinawere$17.42trioand$10.36triorespecXvely.Inthesameyear,thePPPGDPoftheUSandChinawere$17.42and$18.03triorespecXvely(thusmakingChinathelargesteconomyintheworldintermsofPPPGDP).
EC102 SamiraBarzin
Class1:EssayQuesXona) WhyarethenominalandPPPGDPsoftheUSthe
same?WhatdoesPPPstandfor?• PowerPurchasingParityWhydoweusePPP?• UsingPPPallowsforadirectcomparisonofthepurchasingpowerofacurrencycomparedtoanotherinrealterms;i.e.howmuchofacurrencytoweneedineachcountrytobuyafixedamountofgoods

EC102 SamiraBarzin
Class1:EssayQuesXona) WhyarethenominalandPPPGDPsoftheUSthe
same?• Globally,theUS$isgenerallyusedasthebasecurrencyagainstwhichallothercurrenciesarecomparedto
• Hence1US$buysyouasexactlyasmuchas1US$(e.g.fortheUKthePPPwouldbecalculatedassuch:howmuchmore/lesscanyouaffordwith1£intheUKcomparedto1US$intheUSorifabasketof10bananascostsUS$10,howmuch£doyouneedtobuythisintheUK?
EC102 SamiraBarzin
Class1:GDPpercapita Source:TheWorldBank

EC102 SamiraBarzin
Class1:GDPpercapita
Source:TheWorldBank
EC102 SamiraBarzin
Class1:GDPpercapitaPPP
Source:TheWorldBank

EC102 SamiraBarzin
Class1:GDPpercapitaPPP
Source:TheWorldBank
EC102 SamiraBarzin
Class1:WhydoweneedPPP?Burundivs.Norway&GDPp.c.vs.GDPp.c.PPP(theGDPpercapitaandPPPareconverted$foreasiercomparison)GDPpercapita-Norway–GDPpercapita:$97,307vs.Burundi–GDPpercapita:$286TheaverageNorwegianas340XmesaremuchincomeastheaverageBurundian.GDPpercapitaPPP-Norway–GDPpercapitaPPP:$64,856vs.Burundi–GDPpercapitaPPP:$770TheaverageNorwegianhas84XmestheincomeofanaverageBurundianPPP.InNorwaythepricesaremuchhigherthaninBurundi,PPPincludesthisinformaXonanddoesnotonlyconvertstheGDPp.c.usingtheconversionratebetweenthecurrenciesbutalsoincludestheinformaXonastohowmuchcanyouaffordwiththecurrencyofacountryinthatcountry.Theaveragecanafford84XmesaremuchinNorwayastheBurundiancaninBurundi(sXllalotmore,butnotasmuchas340Xmesmore).

EC102 SamiraBarzin
Class1:EssayQuesXonb) WhyistheChineseeconomy’sGDPPPPlargerthan
itsnominalGDP• NominalGDP:measuredincurrentprices• GDPPPP:measuredinUS$PPP• PricesinChinatendtobemuchlowerthanintheUS,hencethenominalvalueisbasedonthelowpriceswhereifChineseoutputismeasuredinUS$PPPandhencemuchlarger
EC102 SamiraBarzin
Class1:EssayQuesXonc) WhyistheChineseeconomy’sPPPGDPlargerthanthe
US’sPPPGDP?• TwofactorsinfluencethiscalculaXon
– Economy/GDP– Prices
TocomparetheChineseGDPandtheUS’sGDP,weneedtoexpresstheminacomparableunit.AdirectcomparisonofGDPs(evenifbothareexpressedinUS$)doesnottakethepricelevelofthecountryintoaccount,PPPtakesthelowerpricelevelinChinaintoaccount.ChineseoutputinphysicalquanXXesismuchlargerthantheUS’sGDP,henceChina’sGDPPPPislargerthanUS’sGDPPPP.