ebook1-sound-containment
TRANSCRIPT

I n f o r ma t i ona l Ebook
Home Theater Room Design
Book One
Sound and Acoustics
Soundproofing Techniques
Product Comparisons
Optimum Room Shapes
Optimum Room Dimensions
Room Resonance
Axial Mode Calculation
Decibels
STC Ratings
Sound Improvement
60 pages of unbiased straight forward information!
Plan, Design and Construct your Ultimate Home Theater.
Written by
J. Joseph Lupo Sound Engineer, Home Technology Design

2
Boston, MA Symphony Hall widely regarded as one of the two or three finest concert halls in the world.
The Boston Symphony Hall was the first concert hall ever built on scientifically derived acoustical engineering.
Everything was designed for ideal sound, no matter where you sat in the auditorium. The hall's 1.9 second reverberation time is considered ideal for orchestral performances.
The walls of the stage slope inward to help focus the sound. The side balconies are shallow so as not to trap any of the sound.
The recesses of the coffered ceiling, along with the statue-filled niches along the three sides, help to distrib-ute the sound throughout the hall.
The Boston Symphony Hall was designed after Vienna's Musikverein. Inside, the decor is minimal (it's all about the sound right?), and the leather seats are still original.
The Symphony Hall organ, an Aeolian Skinner designed by G. Donald Harrison and installed in 1949, is considered one of the finest concert hall organs in the world.
There is nothing like the experience of listening to quality music in a quality listening room. It is the equivalent of going from black and white to color.
The music comes to life and excites your senses like never before.
A standard of excellence does exist for concert hall sound;
Few concert halls are considered by many to be the best in the world.
Symphony Hall in Boston (1900)

3
Table of Contents Click on the page links to be brought directly to the page
page 4 Introduction
page 6 Room Design page 10 Sound and Acoustics page 16 Our Project Part One
page 18 Axial Modes Room Dimensions page 23 Our Project Part Two
page 25 Sound Containment
page 28 Decibels
page 30 STC Ratings Using The STC Ratings
page 35 MLV Products
page 36 OuietRock page 38 Green Glue
page 40 Resilient Channel page 42 Comparison Chart page 43 Acoustic Doors Additional Sound Proofing Tools
page 45 Our Project Part Three
page 48 Sound Control page 59 Closing page 60 In Their Words—Revel and Paradigm page 62 Glossary and Reference Listing
This book is dedicated to my father, Nicholas J. Lupo.
My Father instilled in me a love for music and technology. He also taught me to do all to
the best of my abilities with commitment, a sense of pride and a dedication to my craft.
Copyright © 2009 by J. Joseph Lupo and Perfect Harmony Designs. All rights reserved. All material con-
tained in this book is the intellectual property of the author unless otherwise stated. All Rights Reserved.
All Trademarks Remain The Property of Their Respective Owners.
Reprinting or re-publication is strictly prohibited by the author.

4
Introduction
I consider myself one of the lucky ones. I get to do what I really enjoy doing. The good
thing is that I am actually pretty good at it. It helps if you want to make a living at it.
I am not a professional writer. I do not work for a magazine writing equipment reviews
for my advertisers. My experience comes from actually doing it.
Not long ago I was having dinner with a manufacturers representative for some very
well known names in the electronics industry. Mr. Rep, (I’ll call him) who I am friendly
with possess an in depth knowledge of electronics. I always look forward to our conver-
sations regarding the industry. Joining us at dinner was Stewart FilmScreen’s; Product
Specialist for North America. We were discussing the finer points of home theater
screens and projectors. As the conversation progressed we shifted to talking audio.
One of my favorite subjects. Mr. Rep is a big believer in all the new equipment being
introduced with room correction capabilities.
My belief is room correction is exactly what is says ―Room CORRECTION‖.
Digital Correction reminds me of a something I would hear In my audio engineering
days.
―We’ll fix it in the mix‖
I hated hearing that phrase
Why not just make it right now?
Why proceed to make an inferior product and attempt to cover the mistakes in the mix?
If you build the room correctly you don’t need to rely on room correction. I believe less
is best when it comes to quality sound reproduction.
There is an over digitizing of signals today. Over digitizing can contribute to a degrading
of the overall quality of the sound. Another point was that in the end the most important
analyzer is your ears, which are analog not digital.
Vinyl LPs, remember them? They’re making a strong comeback. We are seeing a trend
take hold industry wide. Even non audiophiles are returning to vinyl as more and more
people tire of the made for Ipod compressed digital music.
Quality never goes out of fashion.
Index

5
Introduction part 2
As with any product there are many different levels of quality and pricing. Quality cor-
rection processors get very pricy. The Lexicon MC– 12 Balanced HD EQ comes with a
msrp in the zone of $14k. The Anthem Statement D-2 w/ARC runs about $7.5K.
Using cheap correction is worse than using no correction at all.
Sorry I digress.
To finish my story, in jest I issued a hypothetical challenge to Mr. Rep.
I put forth that we would start with equal amounts of money and each build a theater.
You put yours in to equipment only. Taking a bad room and utilizing the digital correc-
tion
I’ll split mine between the room and the equipment. At the end we’ll see whose room
sounds better. Since neither one of us is swimming in extra money and sound quality is
somewhat subjective to the listener we have not yet had the opportunity to carry out the
challenge. But the conversation and exchange of views was great fun. Hopefully one
day we will have the chance.
I am a fan of integrating correction but in a different approach. No sound system should
really ever be specified without equalization.
My commitment to proper room design is unwavering in the face of the new technology.
The new technologies should be applied to enhance room design not replace it.
The information in this book is gathered from my many years of continual education,
training, research, and field experience.
J. Joseph Lupo
Index

6
Room Design — The Shape
I was thinking of buying a race car engine for our minivan.
If a friend said that I’m sure your response would be. Why? That’s nuts!
To me that is the equivalent of placing hi-performance A/V equipment in a badly de-
signed room. You will never achieve the results you were hoping for and will never be
able to enjoy the equipment the way it is meant to be enjoyed.
Proper design of a Theater / Audio room or ―man cave‖ as I affectionately refer to our
room, is so important I consider it at the top of the list in terms of the overall plan. My
wife Madeline hates the term ―man cave‖ but allows me my illusions of ownership of the
space.
Put down that sale circular. Don’t even look or even think about a big screen until you
design the space.
Ah the Space, the first frontier.
Let the negotiation begin. A negotiation between what you want and what the space will
allow begins. The space will tell you what it wants. It’s always best to let the space win.
You do not want angry space. It will make you pay. Not good.
I design the room from what I call ―the outside in‖ approach. That means starting with
the structure and working my way inwards towards the
(1) layout/floor plan,
(2) the equipment specification
(3) interior décor of the room.
Taking some time to learn about sound and acoustics will pay huge dividends in the
performance of the space. It will determine the success or failure of the space over the
long term. It is always possible to upgrade equipment but changing the room would be
a major undertaking; In most cases impossible. So my view is to do it once and do it
right.
Many will tell you it is impossible to design a room for both hi quality audio and movie
soundtracks. That the room has to be designed for one or the other. To that I say, non-
sense. While I definitely agree in the case of an extreme audiophile (someone who
strives for perfect audio reproduction), I do not agree in a majority of cases or situa-
tions. Most theaters I have designed are not for audiophiles but for people who enjoy
movies and concerts. They are not spending hours critical listening to Beethoven on
vinyl. That does not imply that they do not desire quality sound and a quality room.
Index

7
Room Design — The Shape
Adhering to proper techniques and acoustic rules will result in a well rounded great
sounding place for both music and movies.
As a former audio engineer I am extremely pas-
sionate about quality audio but I do believe you
reach a point of diminishing returns. A point
where the effort and expense out weigh the
gains. I am extremely pleased with the audio
quality for not only music but also movie sound-
tracks that I achieved in our Theater/Music room.
On the inside cover of this book I placed a photo-
graph of Symphony Hall in Boston. You may
have said nice picture and moved on. Besides
the fact that I am a huge admirer of architecture
and acoustic design there is something important
you should notice about that picture .
Symphony Hall is a rectangle. Most of the finest
concert halls in the world share this shape.
Why? You may ask.
The rectangle shape has some acoustical advan-
tages. The room is more predictable in regards to
overall performance. It is more reliable in regards
to measurements and calculations. The shape
will usually produce excellent results. There are
of course other factors but starting with a rectan-
gle is the way to go.
The most important thing we need to avoid is a
room that is either square, a cube or has dimen-
sions that are multiples of it self.
Examples of this would be a 10’ H x 20’ W x 20’ L
room or a 10’ H x 10’ W x 20’ L.
Index
The Vienna Konzerthaus is home to the Viennese Symphony Orchestra. It was
completed in 1913
Avery Fisher Hall NY. The hall was origi-nally designed after Boston's Symphony Hall, however, when the seating design changed at the request of the critics, the acoustics changed also. Later, the hall
went through another redesign, which re-sulted in what we hear and see today.
8
Room Design — The Shape
It is also important to avoid parabolic shapes, cylindrical concavities and polygonal
shapes. These tend to concentrate sound in some areas at the expense of other areas.
May work well for a church or government building. Not a good thing for our theater
room.
These dimensions will tend to create excessive Room Resonant Tones.
Definition;
Resonate, the prolonging of the sound at a certain frequency and the tendency of
something to vibrate at a particular frequency after the source of energy is removed.
Excessive resonances will color the sound and have a tendency to make a room sound
boomey and droning, as my wife calls it.
When a room resonates the walls and ceiling are actually vibrating in time to the reso-
nant tone of the room. It actually causes the room to act as an amplifier for that fre-
quency or frequencies and harmonics. This creates artificial boosts at certain frequen-
cies. These boosts color the quality of the sound causing excessive listener fatigue and
diminishing the enjoyment of the theatre.
So always use a rectangle when possible. Now let’s talk about room dimensions.
When designing a room my main objective is to make the room as neutral sounding as
possible. We want to hear as much of the artists intent in the creation of the music or
sound track. A room that excessively colors or distorts the sound will result in a room
that can not deliver on the hopes and expectations of the project.
Besides the shape of the room, the room dimensions play a large part in the quality of
the experience. The dimensions affect both Audio and Video performance. Certain di-
mension ratios cause excessive room resonances which result in a buildup of sound at
certain frequencies.
This buildup of sound results in a very uneven coloring of the sound. It could very well
make the room a unpleasant place to watch a movie. There are many contributing fac-
tors to this result. In this writing I will address the main contributing factors. Again, my
intent is not to make you an expert but to give you a solid basic understanding. Here is
a observation you may identify with;
Think about this. Have you ever gone to a classical or jazz concert in a hockey arena?
At times It’s difficult to hear the intricacies of the music. It becomes just one big mush.
For me it becomes impossible to enjoy the concert. Compare that to going to an actual
concert hall for the same performance. The sound is much more pleasant and the en-
joyment factor rises significantly. Understand? Enough said on that.
Index

9
Here is a fabulous photo taken "by a military ob-
server from the deck of an aircraft carrier just as an
F/A-18 jet broke the sound barrier. Photo courtesy of
Oscar Medina.
Index
About Room Resonance
As I mentioned room resonances have a tremendous effect on sound quality. So let’s
take a few to get an understanding of these bad boys.
Room resonances are also referred to as room modes
There are actually three modes that can be addressed,
Axial, Tangential and Oblique.
The axial modes have the biggest effect on small room acoustics with Tangential hav-
ing 1/2 the energy and the oblique having only 1/4 the energy.
I am focusing on the axial for this writing.
Frequency spacing is an important consideration. While we now know that a build up of
frequencies are bad so is an excessive separation. This will cause a reverse effect with
the volume of a frequency being deemphasized (lowered).
To understand the effect of room dimensions and room modes we need to get a gen-
eral understanding of sound. I will take a detour to talk about sound for a few pages
and return to finding the perfect room dimensions.
Let’ talk some sound, Ok?
Axial Tangential Oblique
Each Axial mode involves only two
opposite and paral-lel surfaces. There are three per room.
(1) Front to back wall. (2) Left wall to
right wall. (3) Ceiling to floor
Each Tangential mode involve four
surfaces. There are three per room. (1)
Front, ceiling back and floor. (2) Front, side, rear, side. (3)
Floor, side, ceiling, side.
Each Oblique mode involves all six sur-faces of the room.

10
Some basics
1. Sound radiates from a source and travels in waves much like when
we throw a rock into a pond.
2. Sound is measured in frequencies (cycles per second) and re-
ferred to in Hertz (Hz).
3. We have the ability to hear from 16Hz (cycles per second) to approximately
20,000Hz. It is commonly referred to as 20-20,000Hz.
4. Sound travels by compressing and expanding air mole-
cules and transmitting that energy to the neighboring
molecules and so on until it loses strength and fades .
5. Every sound contains a fundamental frequency and what
is called harmonics of that frequency. Harmonics are very
important to the timbre or tonal quality of the sound.
6. Every Sound is a combination of multiple frequencies and the harmonics of the fun-
damental frequencies.
7. Every musical note produces a fundamental wave at a precise frequency.
8. The lower the tone of the sound (more bass) the lower the frequency.
9. 20Hz=ultra bass (low notes),
10. 20,000Hz= ultra treble (high notes)
11. The length of sound waves varies from as little as 1-1/16‖ (.0565‖) for a 20,000 Hz
to approximately 56 feet for a 20 Hz sound.
12. Our hearing is susceptible to damage and loss by exposure to overly loud listening
levels.
Harmonics of frequencies are extremely important to the tonal quality (timbre) of an in-
strument or voice. Harmonics give each instrument its own particular sound. Harmonics
are what makes a Trumpet sound like a Trumpet and a Piano sound like a Piano. With-
out harmonics every instrument would well, sound the same.
In this writing I will talk about harmonics but I will be focusing my attention on the funda-
mental frequencies. I do not want overlook harmonics but for simplicity the primary fo-
cus will be on the fundamentals.
You’re most likely saying ―ok, that is meaningless information‖. As I progress it will be-
come a lot more useful.
Index
Sound and Acoustics
11
I spoke briefly in the Room Shape section about resonant tones and frequencies. We
need an understanding of their creation and their importance to tonal quality. Sound is
a very complex subject to dig into. My intent is not to make you an expert but to give
you knowledge that will be useful for the purpose of designing your room.
As we now know, the lower bass frequency waves are much longer in length (up to 56
feet) and thus contain more energy than a high frequency wave. The lower frequencies
play a large role in room resonance. The length of the sound wave is important in cal-
culating these frequencies. Smaller high frequency waves are too short to play a role.
The range of frequencies relevant to room resonance is from 20Hz through around
400Hz. The size of the room determines the most relevant frequencies. I’ll explain more
later.
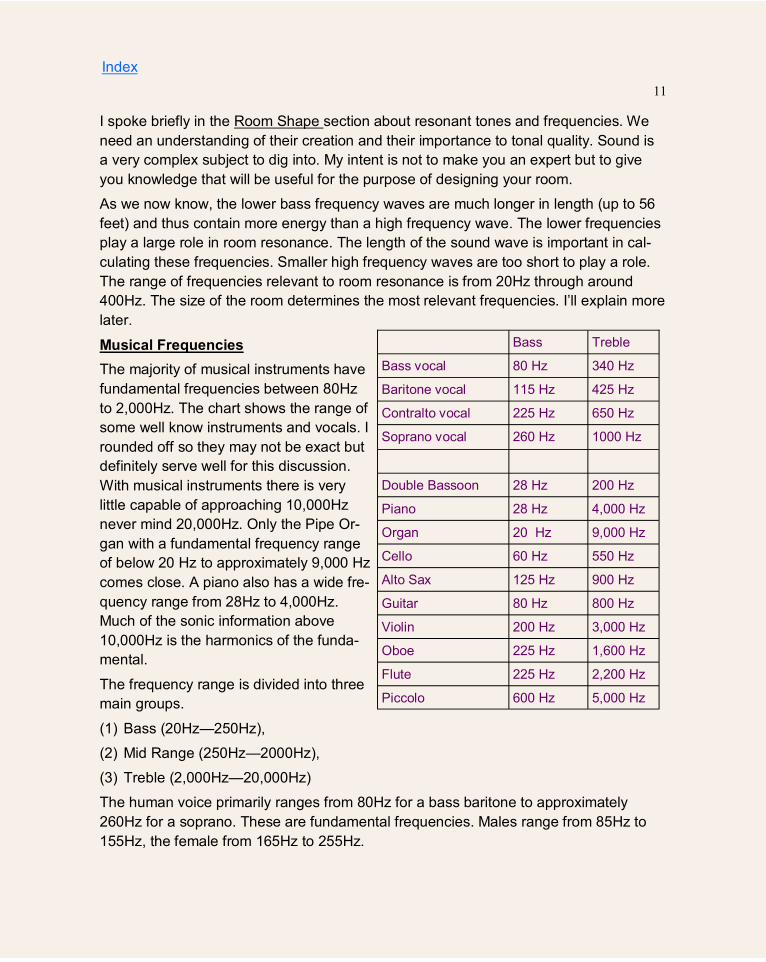
Musical Frequencies
The majority of musical instruments have
fundamental frequencies between 80Hz
to 2,000Hz. The chart shows the range of
some well know instruments and vocals. I
rounded off so they may not be exact but
definitely serve well for this discussion.
With musical instruments there is very
little capable of approaching 10,000Hz
never mind 20,000Hz. Only the Pipe Or-
gan with a fundamental frequency range
of below 20 Hz to approximately 9,000 Hz
comes close. A piano also has a wide fre-
quency range from 28Hz to 4,000Hz.
Much of the sonic information above
10,000Hz is the harmonics of the funda-
mental.
The frequency range is divided into three
main groups.
(1) Bass (20Hz—250Hz),
(2) Mid Range (250Hz—2000Hz),
(3) Treble (2,000Hz—20,000Hz)
The human voice primarily ranges from 80Hz for a bass baritone to approximately
260Hz for a soprano. These are fundamental frequencies. Males range from 85Hz to
155Hz, the female from 165Hz to 255Hz.
Bass Treble
Bass vocal 80 Hz 340 Hz
Baritone vocal 115 Hz 425 Hz
Contralto vocal 225 Hz 650 Hz
Soprano vocal 260 Hz 1000 Hz
Double Bassoon 28 Hz 200 Hz
Piano 28 Hz 4,000 Hz
Organ 20 Hz 9,000 Hz
Cello 60 Hz 550 Hz
Alto Sax 125 Hz 900 Hz
Guitar 80 Hz 800 Hz
Violin 200 Hz 3,000 Hz
Oboe 225 Hz 1,600 Hz
Flute 225 Hz 2,200 Hz
Piccolo 600 Hz 5,000 Hz
Index

12
Although human speech ranges from 85 Hz fundamental tone to approximately 260 Hz
studies have shown that most of the usable information for our ears is between 300 Hz
and 4,000 Hz. Our brain make use of the fundamental and harmonics of the frequen-
cies to process what we hear.
Our hearing is less sensitive to bass
tones. We require increased volume
levels to hear these frequencies. As
the tone rises our sensitivity in-
creases. Look at the chart below. No-
tice how we need less volume
(measured in dB) in the frequency
range of about 300Hz to 4,000Hz (highlighted in yellow).
Since this is our most sensitive area it is also the area where we can sustain the most
damage and loss to our hearing.
I will address excessive sound levels and hearing loss in the decibel section on page
31.
By design with the use of our stereo hearing (2 ears) we have the ability to accurately
locate the source of a sound. By calculating the delay between the time the sound
reaches each ear our brains compute the location of the source.
Our ears are designed to process localization information better on a horizontal plane
than a vertical plane.
Our ears and brain give us the incredible ability to filter sound. We can filter out noise or
unwanted sound and focus on the sound we want to hear. We can concentrate on the
violins over the rest of the orchestra if we choose. Amazing stuff, this ear and hearing
thing.
Just try it a few times. Close your eyes in different situations and just focus on listening.
Experiment with directional hearing. Experiment with filtering. This could explain how a
mother is able to pick out the cry of her baby amongst many other sounds.
Index
Source Wave Ear Drum Cochlea
Auditory Receptor
Cells
Nerve Impulse
Frequency Spectrum of Hearing Response
20Hz 50Hz 100Hz 300Hz 1,000Hz 3,000Hz 10,000Hz 20,000Hz
72dB 40dB 20dB 5dB 5dB 0dB 10dB 5dB
Human Ear Threshold of Hearing by Frequency
This chart represents the amount of loudness measured in decibels necessary for us to hear the sound.

13
Every sound we hear is a combination of frequencies and their
harmonics
Using light for an example when we walk outside we see sunlight as
white or colorless sunlight. But if we look through a prism we see all the
colors that combine to make the light we see. Sound works in pretty
much the same way.
We don’t hear the individual frequencies but we hear the total sum of all
the frequencies and harmonics blending together to create our own per-
sonal symphonies of sound every day.
We all know from our childhood music lessons a that a chord is made up of multiple
notes played together. A ―C‖ chord contains the notes C-E-G on a piano. Each one of
those notes has a distinct frequency. When played we here just a beautiful ―C‖ chord.
Octaves
Every doubling of frequency is 1 octave
Definition;
A difference of pitch where one tone has a frequency
that is double or one-half of the frequency of another
tone or the notes of the music scale.
From A to A (A, B, C, D, E, F, G, A) would be consid-
ered one octave.
As we discussed before each tone has a frequency
in the range from 20Hz to 20,000Hz. Looking at the
chart (below left) we see the 10 octaves that fall
within our range our hearing.
Octaves and Harmonics are totally different creatures and should not be confused. An
octave is a doubling of frequency. A harmonic is a multiple of a frequency. (See chart
below right).
Index
One
octave
1 20-40 Hz 6 640-1280 Hz
2 40-80 Hz 7 1280-2560 Hz
3 80-160 Hz 8 2560-5120 Hz
4 160-320 Hz 9 5120-10,420 Hz
5 320 to 640 Hz 10 10420-20,840 Hz
Fund Freq
1st 2nd 3rd 4rd
200Hz 400Hz 800Hz 1600Hz 3200Hz Octave
200Hz 400Hz 600Hz 800Hz 1000Hz Harmonic
14
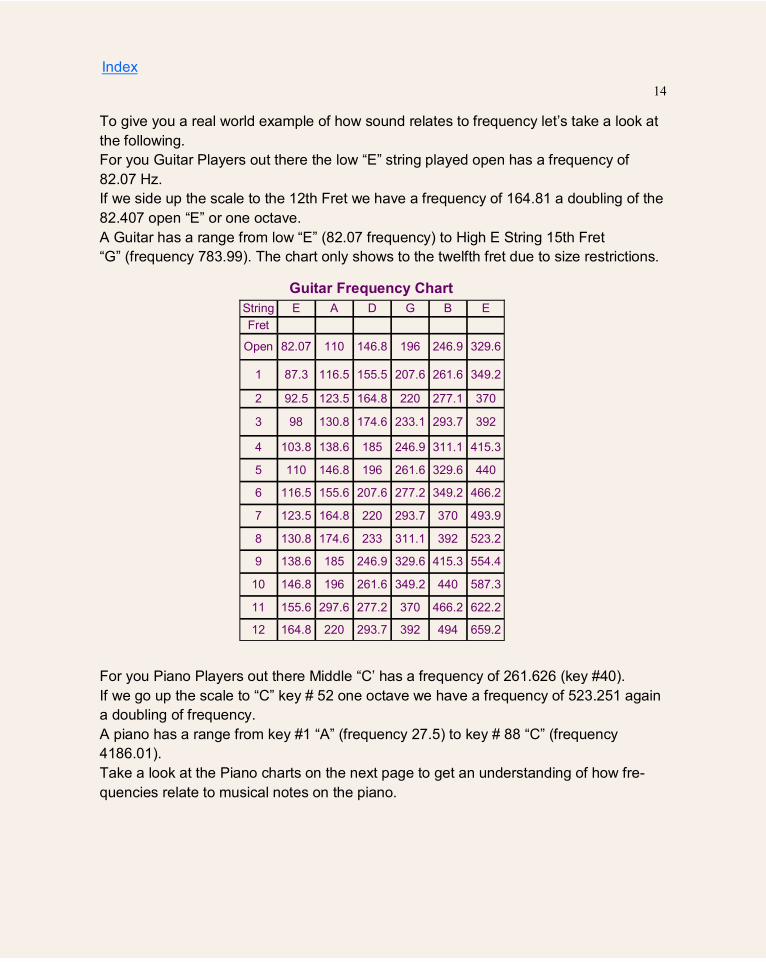
To give you a real world example of how sound relates to frequency let’s take a look at
the following.
For you Guitar Players out there the low ―E‖ string played open has a frequency of
82.07 Hz.
If we side up the scale to the 12th Fret we have a frequency of 164.81 a doubling of the
82.407 open ―E‖ or one octave.
A Guitar has a range from low ―E‖ (82.07 frequency) to High E String 15th Fret
―G‖ (frequency 783.99). The chart only shows to the twelfth fret due to size restrictions.
For you Piano Players out there Middle ―C’ has a frequency of 261.626 (key #40).
If we go up the scale to ―C‖ key # 52 one octave we have a frequency of 523.251 again
a doubling of frequency.
A piano has a range from key #1 ―A‖ (frequency 27.5) to key # 88 ―C‖ (frequency
4186.01).
Take a look at the Piano charts on the next page to get an understanding of how fre-
quencies relate to musical notes on the piano.
Index
String E A D G B E
Fret
Open 82.07 110 146.8 196 246.9 329.6
1 87.3 116.5 155.5 207.6 261.6 349.2
2 92.5 123.5 164.8 220 277.1 370
3 98 130.8 174.6 233.1 293.7 392
4 103.8 138.6 185 246.9 311.1 415.3
5 110 146.8 196 261.6 329.6 440
6 116.5 155.6 207.6 277.2 349.2 466.2
7 123.5 164.8 220 293.7 370 493.9
8 130.8 174.6 233 311.1 392 523.2
9 138.6 185 246.9 329.6 415.3 554.4
10 146.8 196 261.6 349.2 440 587.3
11 155.6 297.6 277.2 370 466.2 622.2
12 164.8 220 293.7 392 494 659.2
Guitar Frequency Chart

15
Octave Piano
Key Note Frequency Length ft
0 1 A 27.5 41.091
0 2 A#/Bb 29.14 38.778
0 3 B 30.87 36.605
1 4 C 32.7 34.557
1 5 C#/Db 34.65 32.612
1 6 D 36.71 30.782
1 7 D#/Eb 38.89 29.056
1 8 E 41.2 27.427
1 9 F 43.65 25.888
1 10 F#/Gb 46.25 24.432
1 11 G 49 23.061
1 12 G#/Ab 51.91 21.768
1 13 A 55 20.545
1 14 A#/Bb 58.27 19.392
1 15 B 61.74 18.303
2 16 C 65.41 17.276
2 17 C#/Db 69.3 16.306
2 18 D 73.42 15.391
2 19 D#/Eb 77.78 14.528
2 20 E 82.41 13.712
2 21 F 87.31 12.942
2 22 F#/Gb 92.5 12.216
2 23 G 98 11.531
2 24 G#/Ab 103.83 10.883
2 25 A 110 10.273
2 26 A#/Bb 116.54 9.696
2 27 B 123.47 9.152
3 28 C 130.81 8.638
3 29 C#/Db 138.59 8.154
3 30 D 146.83 7.696
3 31 D#/Eb 155.56 7.264
3 32 E 164.81 6.856
3 33 F 174.61 6.472
3 34 F#/Gb 185 6.108
3 35 G 196 5.765
3 36 G#/Ab 207.65 5.442
3 37 A 220 5.136
3 38 A#/Bb 233.08 4.848
3 39 B 246.94 4.576
4 40 C 261.63 4.319
4 41 C#/Db 277.18 4.077
4 42 D 293.66 3.848
4 43 D#/Eb 311.13 3.632
4 44 E 329.63 3.428
4 45 F 349.23 3.236
4 46 F#/Gb 369.99 3.054
4 47 G 392 2.883
4 48 G#/Ab 415.3 2.721
4 49 A 440 2.568
4 50 A#/Bb 466.16 2.424
4 51 B 493.88 2.288
5 52 C 523.25 2.160
5 53 C#/Db 554.37 2.038
5 54 D 587.33 1.924
5 55 D#/Eb 622.25 1.816
5 56 E 659.26 1.714
5 57 F 698.46 1.618
5 58 F#/Gb 739.99 1.527
5 59 G 783.99 1.441
5 60 G#/Ab 830.61 1.360
5 61 A 880 1.284
5 62 A#/Bb 932.33 1.212
5 63 B 987.77 1.144
6 64 C 1046.5 1.080
6 65 C#/Db 1108.73 1.019
6 66 D 1174.66 0.962
6 67 D#/Eb 1244.51 0.908
6 68 E 1318.51 0.857
6 69 F 1396.91 0.809
6 70 F#/Gb 1479.98 0.764
6 71 G 1567.98 0.721
6 72 G#/Ab 1661.22 0.680
6 73 A 1760 0.642
6 74 A#/Bb 1864.66 0.606
6 75 B 1975.53 0.572
7 76 C 2093 0.540
7 77 C#/Db 2217.46 0.510
7 78 D 2349.32 0.481
7 79 D#/Eb 2489.02 0.454
7 80 E 2637.02 0.429
7 81 F 2793.83 0.404
7 82 F#/Gb 2959.96 0.382
7 83 G 3135.96 0.360
7 84 G#/Ab 3322.44 0.340
7 85 A 3520 0.321
7 86 A#/Bb 3729.31 0.303
7 87 B 3951.07 0.286
8 88 C 4186.01 0.270
Octave Piano
Key Note Frequency Length ft
Index
16
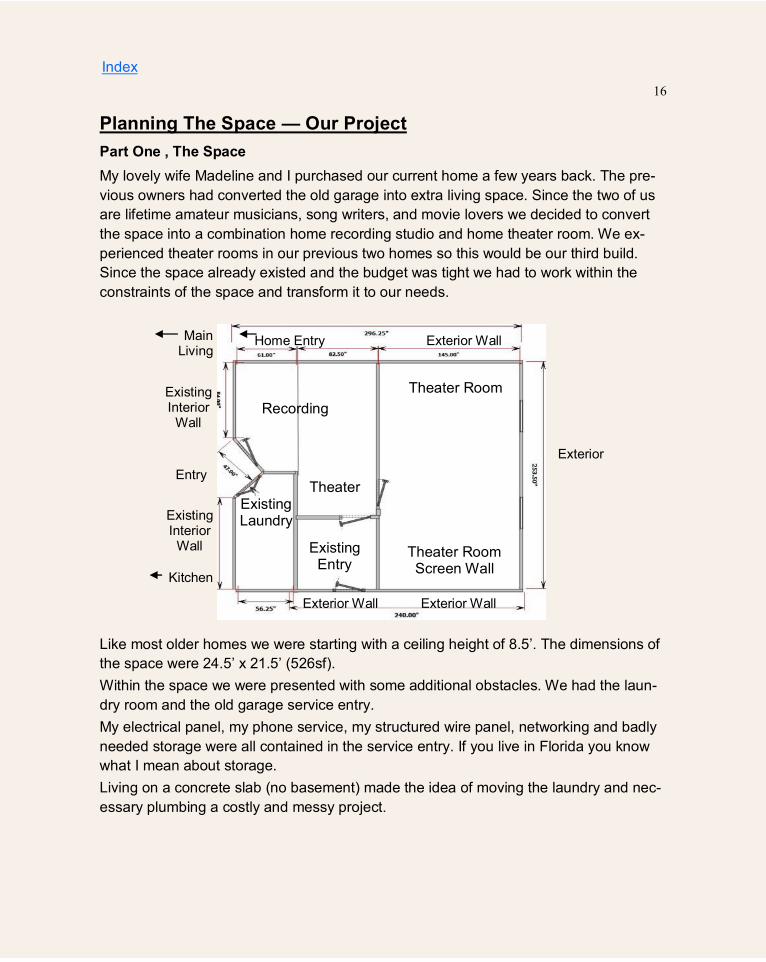
Planning The Space — Our Project
Part One , The Space
My lovely wife Madeline and I purchased our current home a few years back. The pre-
vious owners had converted the old garage into extra living space. Since the two of us
are lifetime amateur musicians, song writers, and movie lovers we decided to convert
the space into a combination home recording studio and home theater room. We ex-
perienced theater rooms in our previous two homes so this would be our third build.
Since the space already existed and the budget was tight we had to work within the
constraints of the space and transform it to our needs.
Like most older homes we were starting with a ceiling height of 8.5’. The dimensions of
the space were 24.5’ x 21.5’ (526sf).
Within the space we were presented with some additional obstacles. We had the laun-
dry room and the old garage service entry.
My electrical panel, my phone service, my structured wire panel, networking and badly
needed storage were all contained in the service entry. If you live in Florida you know
what I mean about storage.
Living on a concrete slab (no basement) made the idea of moving the laundry and nec-
essary plumbing a costly and messy project.
Index
Home Entry Exterior Wall
Existing Entry
Existing Laundry
Exterior
Exterior Wall
Existing Interior
Wall
Existing Interior
Wall
Theater Room Screen Wall
Theater Room
Theater
Recording
Entry
Exterior Wall
Kitchen
Main Living
17
Planning The Space — Our Project
Part one, Page 2
We decided to work with the available space leaving the laundry and vestibule. We did
this based upon cost/benefit analysis. We also decided against moving the electrical
and structured wire panel for the same reason.
We went to work laying out the room trying our best to balance space requirements
acoustical performance and equipment requirements. After much discussion, testing
and multiple layouts we settled on the layout shown on the previous page.
Giving you the layout so soon is the equivalent of putting the cart before the horse.
There was large amount of research, thought, discussion and give and take to arrive at
the overall best solution for our needs.
I will take you through the process with detailed information, test results and ―real
world‖ educated opinions regarding construction techniques and procedures.
In order to properly plan the space we need to understand how sound would react
within the space.
Luckily for us I do this for a living. My wife Madeline so happens is an Interior De-
signer. Her company Perfect Harmony Designs specializes in theater room design.
Perfect Harmony also specializes in integrating technology into today's interior living
spaces. So we have both sides covered.
Luckily for you, you have us to guide you through the process. So I will start at the be-
ginning and take you through the process.
Index

18
Axial Modes—Take control of these bad boys of sound
Room Modes and Standing Waves are the nemesis of quality sound. We spoke
about Room Resonance and the rooms ability to vibrate and amplify at the reso-
nant tone. This is a normal occurrence in sound and every room will produce a
resonant frequency. Actually a rectangle will produce three main resonant fre-
quencies referred to as Axial Modes.
(1) Front to back
(2) Side to side
(3) floor to ceiling
Extensive research has been performed over the years into understanding the
formation of these modes.
Scientist R. H. Bolt and others into understanding room modes and resonant
frequencies. Formulas and equations were developed that measure the per-
formance of different size and shaped rooms. They developed and put forth
their ideas for the best designs for audio listening rooms.
R. H. Bolt developed a range of room ratios that generally perform well. Other
researchers expanded upon that research and developed their own formulas.
Based upon my own research and experience I have settled on a few formulas that I
feel work best for theater rooms. One was
developed by L. W. Sepmeyer. Although he
developed 3 that fall within Bolts range the
Sepmeyer ratio I feel works the best in real
world conditions is;
1(h) to 1.6(w) to 2.33(L)
To explain this a little better let’s start with a 10’ ceiling.
If we multiply the ceiling height by 1.6 (10 x 1.6 =16’) we get a recommended room
width of 16’.
If we multiply the ceiling height by 2.33 (10 x 2.33 = 23.33’) we get a recommended
length of 23.33’.
As I discussed earlier (page 18) there are actually three types of room modes,
Axial, Tangential and Oblique.
While all three are important the axial modes are the dominant modes in regards to
room resonance. They take the lead due to the overall energy of the modes. We will
stay focused on them.
To calculate axial modes for a given space we use all three room dimensions, length
width, and height. We use the speed of sound which is 1130 feet per second at sea
level and each dimension to calculate the 3 fundamental modes. Once we establish the
fundamentals we calculate the harmonics of each fundamental. Once that is done we
look at the coincidences and frequency spacing for the space. The charts on the follow-
ing pages will lay this out in a more understandable format. But the formula is as follows.
We divide 565 (1/2 speed of sound) by each room dimension which gives us each fun-
damental frequency. Then (if you remember harmonics) we plot out each multiple of the
fundamental. Take a look at the charts for examples.
Ceiling height in
feet multiplier
Room Dimensions
10 10’ Ceiling Height
10 1.6 16’ Room Width
10 2.33 23.33’ Room Length
Index
19
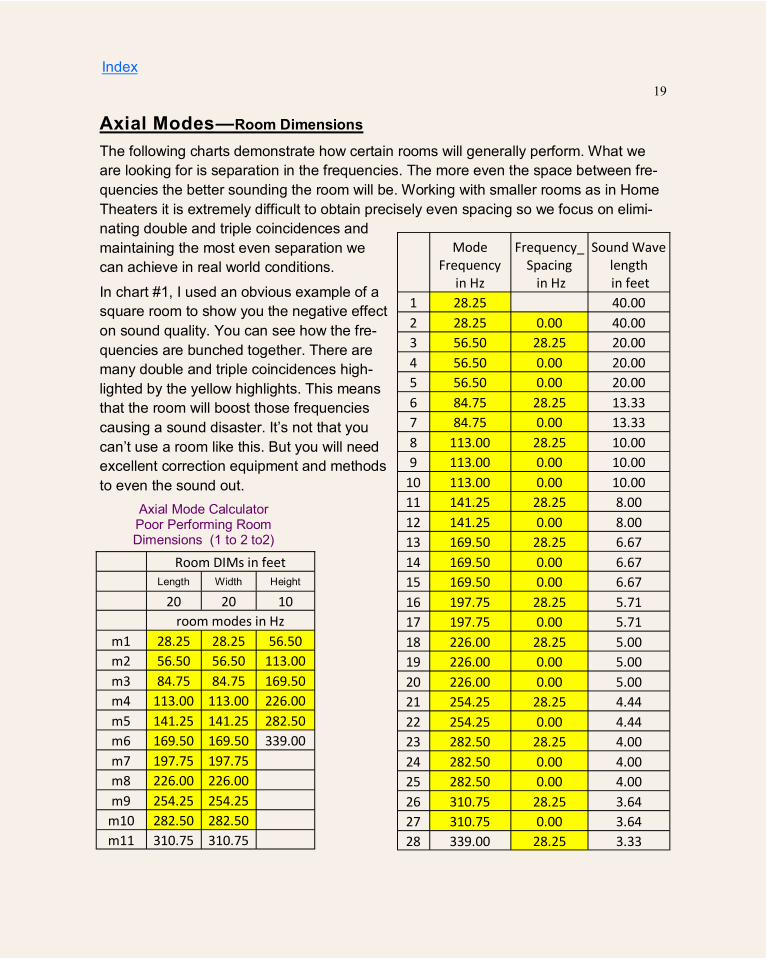
Axial Modes—Room Dimensions
The following charts demonstrate how certain rooms will generally perform. What we
are looking for is separation in the frequencies. The more even the space between fre-
quencies the better sounding the room will be. Working with smaller rooms as in Home
Theaters it is extremely difficult to obtain precisely even spacing so we focus on elimi-
nating double and triple coincidences and
maintaining the most even separation we
can achieve in real world conditions.
In chart #1, I used an obvious example of a
square room to show you the negative effect
on sound quality. You can see how the fre-
quencies are bunched together. There are
many double and triple coincidences high-
lighted by the yellow highlights. This means
that the room will boost those frequencies
causing a sound disaster. It’s not that you
can’t use a room like this. But you will need
excellent correction equipment and methods
to even the sound out.
Axial Mode Calculator Poor Performing Room Dimensions (1 to 2 to2)
Index
Room DIMs in feet
Length Width Height
20 20 10
room modes in Hz
m1 28.25 28.25 56.50
m2 56.50 56.50 113.00
m3 84.75 84.75 169.50
m4 113.00 113.00 226.00
m5 141.25 141.25 282.50
m6 169.50 169.50 339.00
m7 197.75 197.75
m8 226.00 226.00
m9 254.25 254.25
m10 282.50 282.50
m11 310.75 310.75
Mode Frequency
in Hz
Frequency_ Spacing
in Hz
Sound Wave length in feet
1 28.25 40.00
2 28.25 0.00 40.00
3 56.50 28.25 20.00
4 56.50 0.00 20.00
5 56.50 0.00 20.00
6 84.75 28.25 13.33
7 84.75 0.00 13.33
8 113.00 28.25 10.00
9 113.00 0.00 10.00
10 113.00 0.00 10.00
11 141.25 28.25 8.00
12 141.25 0.00 8.00
13 169.50 28.25 6.67
14 169.50 0.00 6.67
15 169.50 0.00 6.67
16 197.75 28.25 5.71
17 197.75 0.00 5.71
18 226.00 28.25 5.00
19 226.00 0.00 5.00
20 226.00 0.00 5.00
21 254.25 28.25 4.44
22 254.25 0.00 4.44
23 282.50 28.25 4.00
24 282.50 0.00 4.00
25 282.50 0.00 4.00
26 310.75 28.25 3.64
27 310.75 0.00 3.64
28 339.00 28.25 3.33
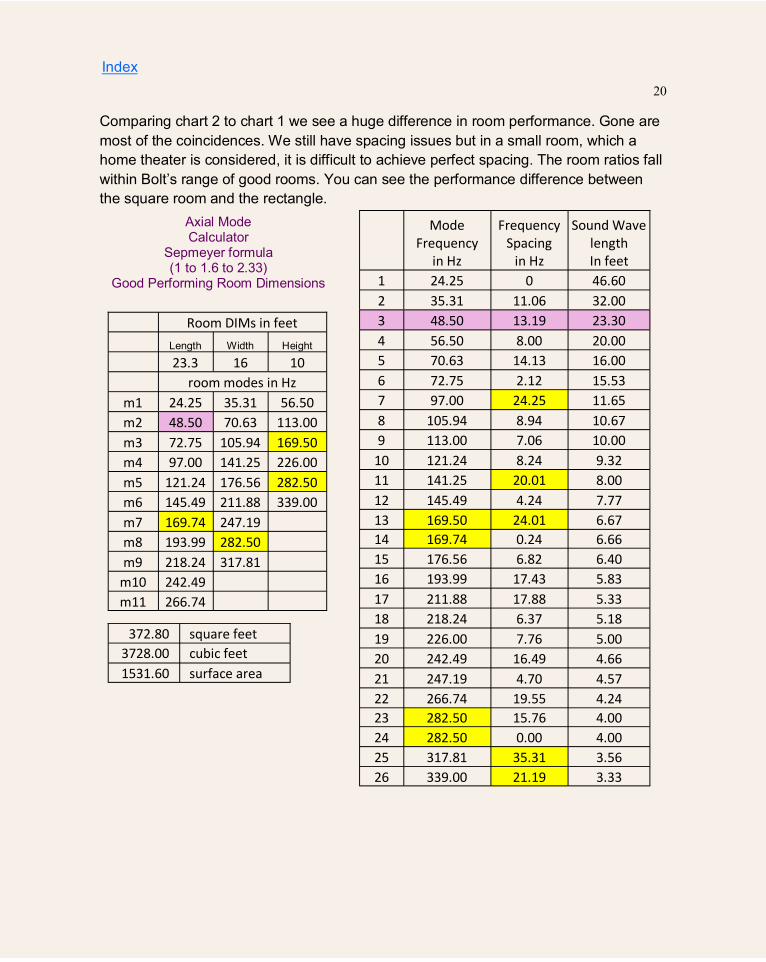
20
Axial Mode Calculator
Sepmeyer formula (1 to 1.6 to 2.33)
Good Performing Room Dimensions
Comparing chart 2 to chart 1 we see a huge difference in room performance. Gone are
most of the coincidences. We still have spacing issues but in a small room, which a
home theater is considered, it is difficult to achieve perfect spacing. The room ratios fall
within Bolt’s range of good rooms. You can see the performance difference between
the square room and the rectangle.
Index
Room DIMs in feet
Length Width Height
23.3 16 10
room modes in Hz
m1 24.25 35.31 56.50
m2 48.50 70.63 113.00
m3 72.75 105.94 169.50
m4 97.00 141.25 226.00
m5 121.24 176.56 282.50
m6 145.49 211.88 339.00
m7 169.74 247.19
m8 193.99 282.50
m9 218.24 317.81
m10 242.49
m11 266.74
Mode Frequency
in Hz
Frequency Spacing
in Hz
Sound Wave length In feet
1 24.25 0 46.60
2 35.31 11.06 32.00
3 48.50 13.19 23.30
4 56.50 8.00 20.00
5 70.63 14.13 16.00
6 72.75 2.12 15.53
7 97.00 24.25 11.65
8 105.94 8.94 10.67
9 113.00 7.06 10.00
10 121.24 8.24 9.32
11 141.25 20.01 8.00
12 145.49 4.24 7.77
13 169.50 24.01 6.67
14 169.74 0.24 6.66
15 176.56 6.82 6.40
16 193.99 17.43 5.83
17 211.88 17.88 5.33
18 218.24 6.37 5.18
19 226.00 7.76 5.00
20 242.49 16.49 4.66
21 247.19 4.70 4.57
22 266.74 19.55 4.24
23 282.50 15.76 4.00
24 282.50 0.00 4.00
25 317.81 35.31 3.56
26 339.00 21.19 3.33
372.80 square feet
3728.00 cubic feet
1531.60 surface area

21
Axial Mode Calculator
Best Performing Room Dimensions (1 to 1.78 to 2.46)
Notice there are no coincidences but some spacing issues. The room dimensions also
work well for interior layouts.
Ceiling height in
feet multiplier
Room Dimensions
10 1 10’ Ceiling Height
1.78 17.8’ Room Width
2.46 24.6’ Room Length
After much research combined with experience and interaction with Interior Designer
professionals I came up with my own formula that falls within Bolts range but also
serves the needs of functionality of the space. My formula 1 to 1.78 to 2.46. Taking into
account the entire scope of the project including seating and interior design elements I
feel this ratio serves all needs. There are no definite coincidences so we are good there.
We have some spacing issues to deal with but overall shows good performance.
Index
Room DIMs in feet
Length Width Height
24.6 17.8 10
room modes in Hz
m1 22.97 31.74 56.50
m2 45.93 63.48 113.00
m3 68.90 95.22 169.50
m4 91.87 126.97 226.00
m5 114.84 158.71 282.50
m6 137.80 190.45 339.00
m7 160.77 222.19
m8 183.74 253.93
m9 206.71 285.67
m10 229.67 317.42
m11 252.64
Mode Frequency
in Hz
Frequency Spacing in Hz
Sound Wave length in feet
1 22.97 49.20
2 31.74 8.77 35.60
3 45.93 14.19 24.60
4 56.50 10.57 20.00
5 63.48 6.98 17.80
6 68.90 5.42 16.40
7 91.87 22.97 12.30
8 95.22 3.35 11.87
9 113.00 17.78 10.00
10 114.84 1.84 9.84
11 126.97 12.13 8.90
12 137.80 10.84 8.20
13 158.71 20.90 7.12
14 160.77 2.06 7.03
15 169.50 8.73 6.67
16 183.74 14.24 6.15
17 190.45 6.71 5.93
18 206.71 16.26 5.47
19 222.19 15.48 5.09
20 226.00 3.81 5.00
21 229.67 3.67 4.92
22 252.64 22.97 4.47
23 253.93 1.29 4.45
24 282.50 28.57 4.00
25 285.67 3.17 3.96
26 317.42 31.74 3.56
27 339.00 21.58 3.33
437.88 square feet
4378.80 cubic feet
1723.76 surface area
22
Index
There are other room ratios that work well such as;
1 to 1.4 to 1.9
1 to 1.5 to 2.5
Taking into account the seating, viewing distance and overall usability of the space I
feel the 1 to 1.78 to 2.46 provides the best ratios for design and practicality. It charts
out well and maintains Bolt’s Range of good performing rooms as you can see.
The formula stays the same with any ceiling height. If you have the ability to design
the room from the floor up these dimensional ratio formulas will minimize room
resonance and greatly improve the sound quality.
But if you are renovating a space that has a fixed ceiling installed you can design the
room around the ceiling height.
Sometimes we have no choice as the space already exists or the construction
process has already begun and changes are not possible. In this case we need
to address the room resonances and correct them with either electronics
(equalizers) or acoustic treatments such as bass traps, diffusers, etc.. We have
to fine tune the room and eliminate the problem areas to improve the sound
quality.
A quick look at Splaying Room Surfaces.
There are many that falsely believe that by splaying wall surfaces you will
eliminate room modal issues. Truth is it will not have any significant effect. It
may shift the frequencies but not eliminate the problem. It will have a small ef-
fect on general diffusing of sound and controlling flutter echoes. But not worth
the time and effort to install.

23
Our Project Room Dimensions
Part Two, page 1
Great, now let’s put this new knowledge right to work. We’ll go back to my project and
pick up with finding the right room dimensions. As you know we have a studio and thea-
ter planned for our space. We decided to focus the efforts on sound quality in the thea-
ter. Since most of the critical recording would be done via studio, reference quality
headphones we could relax a bit in regards to the sound. I also decided to use the JBL
LSR4328 studio monitor system. The JBL monitors have built-in room correction capa-
bility. When I fine tuned the room with a parametric equalizer I was able to bring the mix
listening position up to standards. I know, there’s that term room correction. I had no
choice. I could not make both rooms ideal due to space limitations.
I also brought a feed from the outputs in the studio to the theater room ADA processor.
This enables us to listen to rough and final mixes with the quality of the big system.
Works great.
Determining the best layout for our room was made more difficult because we were
dealing with a fixed space. We wanted to maximize the usage of the 526sf space and
have the ability to enjoy our love of creating music, listening to music and enjoying mov-
ies. By careful analysis of the space we were successful in obtaining excellent perform-
ance, usage and most importantly; the total enjoyment of our new studio and theater
rooms.
How did we accomplish this amazing feat? You may ask. Great question. Glad you
asked. Remember those room resonant frequencies and axial modes? This is where we
use the information.
As I said earlier in this writing we are focusing on axial modes which for the majority of
us is sufficient.
Depending on the size of the room we want to focus in on the frequencies from
20 Hz to around 400Hz. These are the frequencies that will cause us the most trouble
as the higher frequency waves are too short to enter into the equation.
The zone of focus will change slightly with different room sizes based upon the calcu-
lated frequency regions.
In regards to room modes the frequencies are divided in to four groups.
A, B, C, D. Depending on the size of the sound wave and the size of the room each fre-
quency will fall into one of these groups. The main focus for room modes are groups B
and C. This is a complex formula that you really don’t need to worry about for your room
as I am incorporating this information in my formulas.
Index

24
Index
Our Project
Part Two, The Space page 2
For our Theater/Music room we ended up with 8.5’ h x 12.1 w x 21 L. Not very large but
comfortable enough to sit up to 7or 8. The dimensions were not ideal but when I calcu-
lated them out the plot looked good. Definitely have some excessive spacing issues.
But they were easy enough to deal with using para-
metric and graphic equalizers to dial in the room.
Room DIMs in feet
Length Width Height
21 12.1 8.5
room modes in Hz
m1 26.90 46.69 66.47
m2 53.81 93.39 132.94
m3 80.71 140.08 199.41
m4 107.62 186.78 265.88
m5 134.52 233.47 332.35
m6 161.43 280.17
m7 188.33 326.86
m8 215.24
m9 242.14
m10 269.05
m11 295.95
Mode
Frequency in Hz
Frequency Spacing
in Hz
Sound Wave length in feet
1 26.90 0 42.00
2 46.69 19.79 24.20
3 53.81 7.12 21.00
4 66.47 12.66 17.00
5 80.71 14.24 14.00
6 93.39 12.67 12.10
7 107.62 14.23 10.50
8 132.94 25.32 8.50
9 134.52 1.58 8.40
10 140.08 5.56 8.07
11 161.43 21.35 7.00
12 186.78 25.35 6.05
13 188.33 1.56 6.00
14 199.41 11.08 5.67
15 215.24 15.83 5.25
16 233.47 18.23 4.84
17 242.14 8.67 4.67
18 265.88 23.74 4.25
19 269.05 3.17 4.20
20 280.17 11.12 4.03
21 295.95 15.79 3.82
22 326.86 30.91 3.46
23 332.35 5.49 3.40
254.10 square feet
2159.85 cubic feet
1070.90 surface area

25
Sound Containment
Sound Containment is also referred to as Sound Proofing. Totally soundproofing a room
is near impossible task in most cases. It is possible but not probable in most homes.
The general idea is to let as little sound as possible escape the room or area. This is so
important it could make or break your entire project.
In sound proofing we will still be using our frequencies and decibels. Although the con-
cerns are different from room dimensions and modes the principles of sound are still the
same. Remember in room modes we spoke about the vibration of surfaces am-
plifying certain frequencies? Well those vibrations also affect sound proofing.
Our mission is to isolate the drywall and room surfaces from the framing studs
thus attenuating the sound entering into the structure and transmitting to every
inch of the home.
The result is that Mom and Dad can relax in quiet while the kids blast away in
the theater.
Sound Proofing is a critical ingredient in the design of any theater or audio lis-
tening room. Unfortunately it is commonly overlooked or thought not to be im-
portant.
Again you ask ,Why? Well, I will tell you, it is definitely important to anyone not
sitting in the room with you. What is music to your ears is just plain noise to anyone
outside of the room. If you have ever had the situation of someone asking you to ―turn it
down‖ you know exactly what I am referring to. This is a very common situation.
The reason is that no one addressed sound containment.
The noise that escapes the room is referred to as Structure-borne Sound Transmission.
Or more simply, unwanted noise.
About Sound Frequencies (a quick review)
In the world of sound and acoustics we refer to the term frequency. But, what is fre-
quency? As the word implies frequency is a measurement of a pattern. How many times
something repeats itself and the time it takes to do so is referred to as frequency.
As sound travels in waves, we measure how many cycles per second it completes. This
is how we measure and define the tone of the sound.
Every note on the music scale has a frequency. An ultra low bass note has a frequency
of 20Hz (cps) the ultra high notes that complete as many as 20,000Hz (cps).
Index
26
Sound Containment
Construction Methods and Products
Without a doubt the two most effective methods of sound proofing are double wall
construction and concrete walls.
While poured concrete walls and ceiling are not practicable in most cases the density
of the product is excellent at sound proofing. You are still faced with other concerns
such as A/C, lighting, electrical, and entry doors. These issues can be addressed with
other products that are available.
In case you do not want to create your own personal concrete bunker the next item
up would be dual wall construction.
The concept is to construct a room within a room using two individual unattached
walls, floor and ceiling. This completely isolates the room from the remaining structure
and decouples the sound vibrations from the main home structure. Every aspect of
the room needs to be isolated including walls, ceiling, floor, heat and air conditioning,
electrical outlets and lighting fixtures. Absolutely no conduit for vibrations from the
one room to the other can exist. Otherwise performance will be reduced and all the
effort wasted.
These are not typically an option in most homes due to the extra space and construc-
tion required but they are extremely effective solutions.
In every room the biggest weak point is the entry. Got to have one. After all what
good is a room if we can’t get in. The best approach to this issue consists of a double
door system. One door for each wall. The best scenario to minimize sound leakage
would be to offset the doors so the weakest point, the frames, do not line up.
The two ways of treating single wall construction for containment are either mass or
isolation.
Options are the use of
(1) adding Mass Loaded Vinyl (MLV) to drywall construction,
(2) the use of composite drywall such as a product named Quiet Rock and
(3) the use of a Room Isolation Package or resilient channel product and (4) the use
of a viscoelastic material.
Index

27
I will go into much detail about sound proofing material options, the products and the
results.
Within the electronics industry there is so much misinformation regarding the ability of
sound proofing materials. What makes matters even worse is the ignorance that pre-
vails throughout the a/v contractor industry. I possess many years of experience in the
industry.
I have never ceased to be amazed at some of the thoughts and beliefs of some
―professionals‖ regarding sound proofing techniques and materials.
I have seen many projects where clients spend large sums of money for products and
techniques that just could not deliver on their promises.
It is essential that you gain an understanding of the facts regarding sound proofing ma-
terials otherwise you will fall into the same pit. Not good.
In the next section I examine four types of products. You will see the differences in per-
formance levels and we will even discuss some estimated cost for each product.
The most important and frequent terms I will refer to in sound proofing are the Decibel
and the Sound Transmission Class ratings of products.
In order to understand the performance of these products we need to understand the
elements of the ratings. All products used in sound containment will use either the STC
or an NRC (noise reduction coefficient). In this section the STC is more relevant.
There are others such as OITC (outdoor indoor transmission class) and the MTC
(music transmission class). These are not frequently used and difficult to find. They do
offer a better judging of performance. But we still need more.
So let’s go back to school and learn about the Decibel (dB) and Sound Transmission
Class (STC) ratings.
Index
28
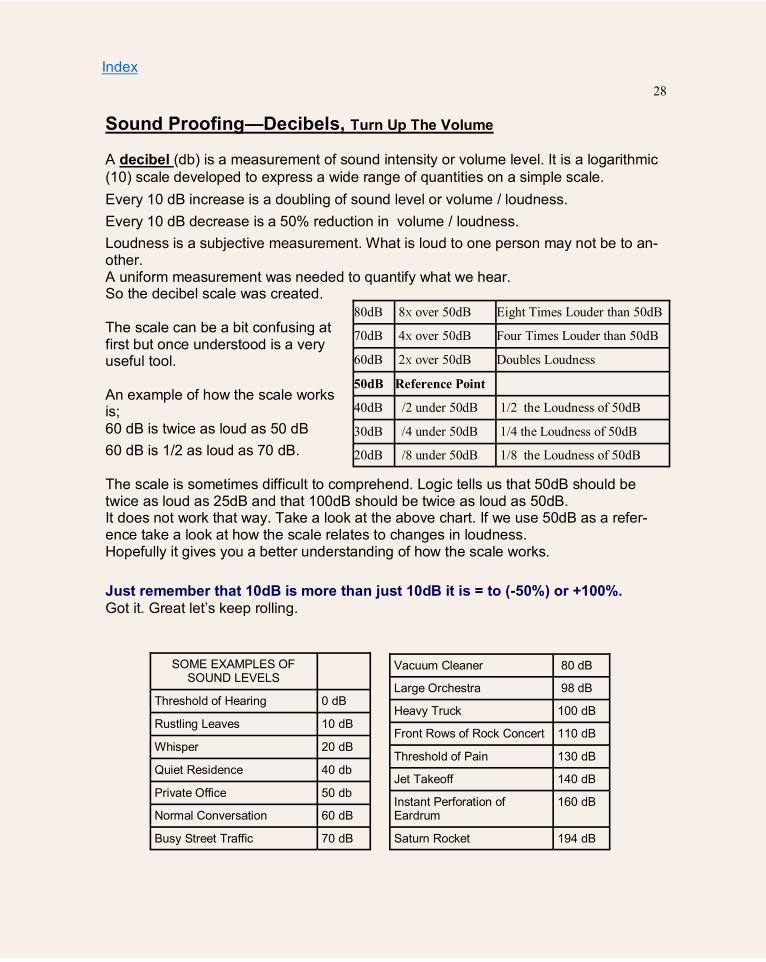
Sound Proofing—Decibels, Turn Up The Volume A decibel (db) is a measurement of sound intensity or volume level. It is a logarithmic
(10) scale developed to express a wide range of quantities on a simple scale.
Every 10 dB increase is a doubling of sound level or volume / loudness.
Every 10 dB decrease is a 50% reduction in volume / loudness.
Loudness is a subjective measurement. What is loud to one person may not be to an-other. A uniform measurement was needed to quantify what we hear. So the decibel scale was created. The scale can be a bit confusing at first but once understood is a very useful tool. An example of how the scale works is;
60 dB is twice as loud as 50 dB
60 dB is 1/2 as loud as 70 dB. The scale is sometimes difficult to comprehend. Logic tells us that 50dB should be twice as loud as 25dB and that 100dB should be twice as loud as 50dB. It does not work that way. Take a look at the above chart. If we use 50dB as a refer-ence take a look at how the scale relates to changes in loudness. Hopefully it gives you a better understanding of how the scale works.
Just remember that 10dB is more than just 10dB it is = to (-50%) or +100%.
Got it. Great let’s keep rolling.
80dB 8X over 50dB Eight Times Louder than 50dB
70dB 4X over 50dB Four Times Louder than 50dB
60dB 2X over 50dB Doubles Loudness
50dB Reference Point
40dB /2 under 50dB 1/2 the Loudness of 50dB
30dB /4 under 50dB 1/4 the Loudness of 50dB
20dB /8 under 50dB 1/8 the Loudness of 50dB
Vacuum Cleaner 80 dB
Large Orchestra 98 dB
Heavy Truck 100 dB
Front Rows of Rock Concert 110 dB
Threshold of Pain 130 dB
Jet Takeoff 140 dB
Instant Perforation of Eardrum
160 dB
Saturn Rocket 194 dB
SOME EXAMPLES OF SOUND LEVELS
Threshold of Hearing 0 dB
Rustling Leaves 10 dB
Whisper 20 dB
Quiet Residence 40 db
Private Office 50 db
Normal Conversation 60 dB
Busy Street Traffic 70 dB
Index

29
Speaking of decibels it is important to remember that hearing damage is a serious is-sue overlooked by most younger people. I want to address this and remind you to pro-tect your ears whenever you are exposed to loud listening levels for extended periods of time. Please remember that prolonged listening to high sound levels will result in sub-stantial hearing loss. Please do all you can to protect both yours and your children's
hearing. Visit the OSHA web site for details. http://www.osha.gov/pls/oshaweb/owadisp.show_document?p_table=STANDARDS&p_id=9735
I am a big lover of listening to music at high levels. But when I see the younger gen-eration with these huge power amplifiers, listening to incredibly high sound levels in a contained area such as a car I am concerned for their hearing health. A sound level meter is a good investment. They are inexpensive and available at Radio Shack and other electronics stores. If you enjoy the beautiful sounds of life protect your ears and
hearing. It’s worth the effort.
Index
Music Practice Room Electric Drill Ipod 94dB 4hrs
French Horn Average Factory Blender 100dB 2hrs
Orchestra Diesel Truck Motorcycle 105dB 1hr
Computer Room Printing Press Train 105dB 1hr
Bass Drum Heavy Truck Power Saw 110dB .5hr
Dog Kennel Power Mower Baby Crying 110dB .5hr
Cymbal Crash Punch Press Rock Concert 110dB .5hr
Dance Club Sandblasting Shot Gun 120dB .0
Pneumatic Hammer Rescue Siren 120dB 0hrs
Drag Race Pain Begins 130dB 0
Military Jet 140dB 0
Aircraft Carrier Deck Jet Takeoff 140dB 0
Chest Wall Begins to Vibrate 150dB 0
Ear Drum Breaks Instantly 160dB 0
Death of Hearing Tissue 180dB 0
Loudest Possible Sound Saturn Rocket 194dB 0
This chart shows examples of sound levels and the maximum daily exposure without ear protection established by The US Government
Occupational Safety and Health Administration (OSHA)
30
Treating your room for sound containment
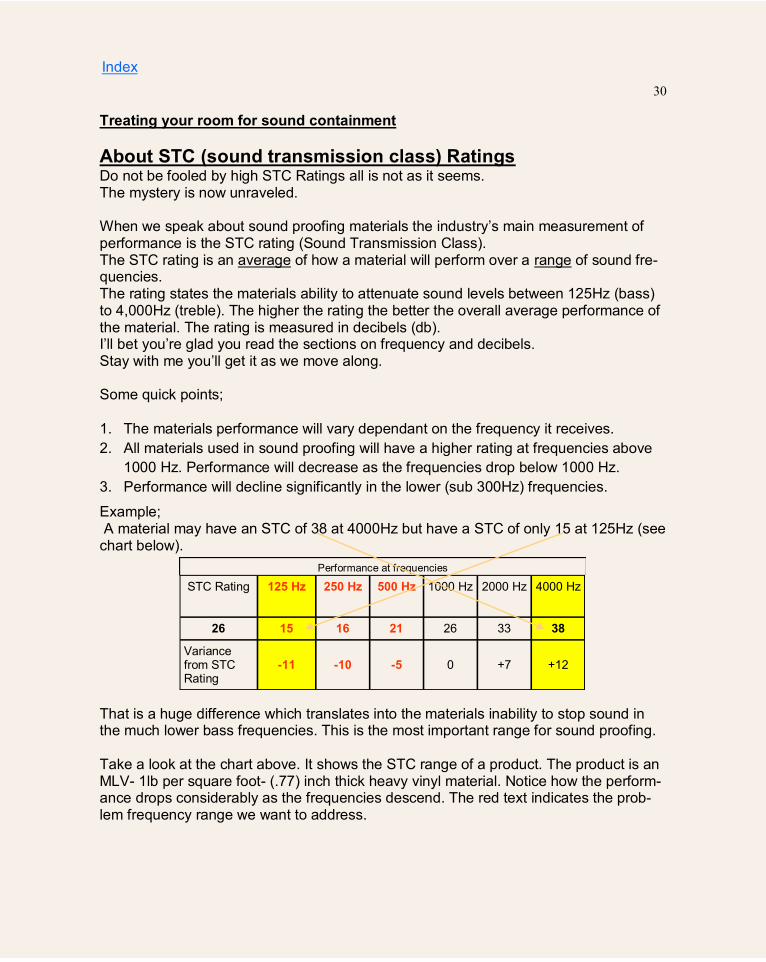
About STC (sound transmission class) Ratings Do not be fooled by high STC Ratings all is not as it seems. The mystery is now unraveled. When we speak about sound proofing materials the industry’s main measurement of performance is the STC rating (Sound Transmission Class). The STC rating is an average of how a material will perform over a range of sound fre-quencies. The rating states the materials ability to attenuate sound levels between 125Hz (bass) to 4,000Hz (treble). The higher the rating the better the overall average performance of the material. The rating is measured in decibels (db). I’ll bet you’re glad you read the sections on frequency and decibels. Stay with me you’ll get it as we move along. Some quick points;
1. The materials performance will vary dependant on the frequency it receives.
2. All materials used in sound proofing will have a higher rating at frequencies above
1000 Hz. Performance will decrease as the frequencies drop below 1000 Hz.
3. Performance will decline significantly in the lower (sub 300Hz) frequencies.
Example; A material may have an STC of 38 at 4000Hz but have a STC of only 15 at 125Hz (see chart below). That is a huge difference which translates into the materials inability to stop sound in the much lower bass frequencies. This is the most important range for sound proofing. Take a look at the chart above. It shows the STC range of a product. The product is an MLV- 1lb per square foot- (.77) inch thick heavy vinyl material. Notice how the perform-ance drops considerably as the frequencies descend. The red text indicates the prob-lem frequency range we want to address.
STC Rating 125 Hz 250 Hz 500 Hz 1000 Hz 2000 Hz 4000 Hz
26 15 16 21 26 33 38
Variance from STC Rating
-11 -10 -5 0 +7 +12
Performance at frequencies
Index

31
When we talk about sound containment in a theatre room we need to address frequen-
cies down to 20Hz. A THX Sub-Woofer operates at fundamental frequencies between
20Hz and 80Hz.
The big problem with STC Ratings is that only sound from 125Hz to 4000Hz is meas-
ured They totally ignore frequencies between 20Hz and 125Hz.
Take a look at this chart below. This is how deceiving the rating can be. The STC
measurement zone is shown in red. The blue line is a measurement of the sound level
of a movie soundtrack shown in Decibels (dB). Notice the amount of sound ignored by
the STC rating. Remember we need to control the low frequencies. These are the worst
offenders and will transfer the most noise from one area to the other.
We really want to focus on the frequencies from 20 Hz to 315 Hz for soundproofing.
This tells us most of what we need.
Unfortunately very little test data is available from the industry. Everyone wants to show
high ratings but we need to dissect the numbers to find the right solution for our room.
As noted earlier, a better measure of sound containment is OITC (Outdoor Indoor Transmission) or MTC (Music Transmission Class). These ratings are more relative to music and movie sound as they extend down to 80Hz. These measurements are more difficult to find as most manufacturers use the STC rating. But even these do not give us all we need. So how do we find the informa-tion that we need? Good question.
Index
Target area for containment
20Hz to 260Hz

32
Using the STC Rating
Quick review. The STC rating refers to a materials ability to resist airborne sound trans-
fer at the frequencies between 125Hz to 4000Hz. In principle the higher the STC rating
the more effective it is at stopping the transmission of sound from one area to the other.
The STC rating is good information if you’re building apartments or office space and are
concerned with normal everyday sound levels.
For me the STC rating is meaningless in the world of music and theater rooms. It does
not address the most problematic frequencies. In my opinion it should not be consid-
ered a reliable source of measurements for our purpose. Why is has become a stan-
dard comparison tool is beyond me. As I have shown you the rating is an average and
performance will vary within the range of frequencies considered by the STC. We need
to examine the effectiveness by tested frequency not the overall average.
If we want true data and performance ratings we need the actual test results for the fre-
quencies below 125Hz. These are difficult to find but they are available from some
manufacturers. Of course the products that do not test well for these frequencies do not
publish them. Why shoot yourself in the foot if you don’t have to?
It is very important to remember that not all frequencies will be treated equal. Some will
be blocked totally. Some will be only slightly affected depending on the treatment used.
Using music as an example.
Let’s say you’re in the theater listening to music at 90dB. A treated wall with an STC
rating of 45 is reducing the sound outside the room to 45dB. Sounds pretty good right?
Let’s take a better look at this product’s performance in the target frequencies of 20Hz to 315Hz. The test results are from Orfield Labs Minneapolis MN Test # OL05-0822.
Wall STC rating of 45
Top row is frequencies in Hz 2nd row is sound attenuation in dB 3rd row is variance from STC rating 4th row is audible sound level outside of room. Not one of these tested frequencies comes close to the STC45 rating for this product. Look at the performance variance at the low frequencies. This is why we need the full test report.
Index
The highlighted area is the operating fundamental frequency range of a THX Subwoofer
25Hz 31.5Hz 40Hz 50Hz 63Hz 80Hz 100Hz 125Hz 160Hz 200Hz 250Hz 315Hz
n/a 25dB 19dB 23dB 15dB 15dB 18dB 29dB 37dB 40dB 33dB 36dB
-20dB -26dB -22dB -30dB -30dB -27dB -16dB -8dB -5dB -12dB -9dB
65dB 71dB 67dB 75dB 75dB 72dB 61dB 53dB 50dB 57dB 54dB
33
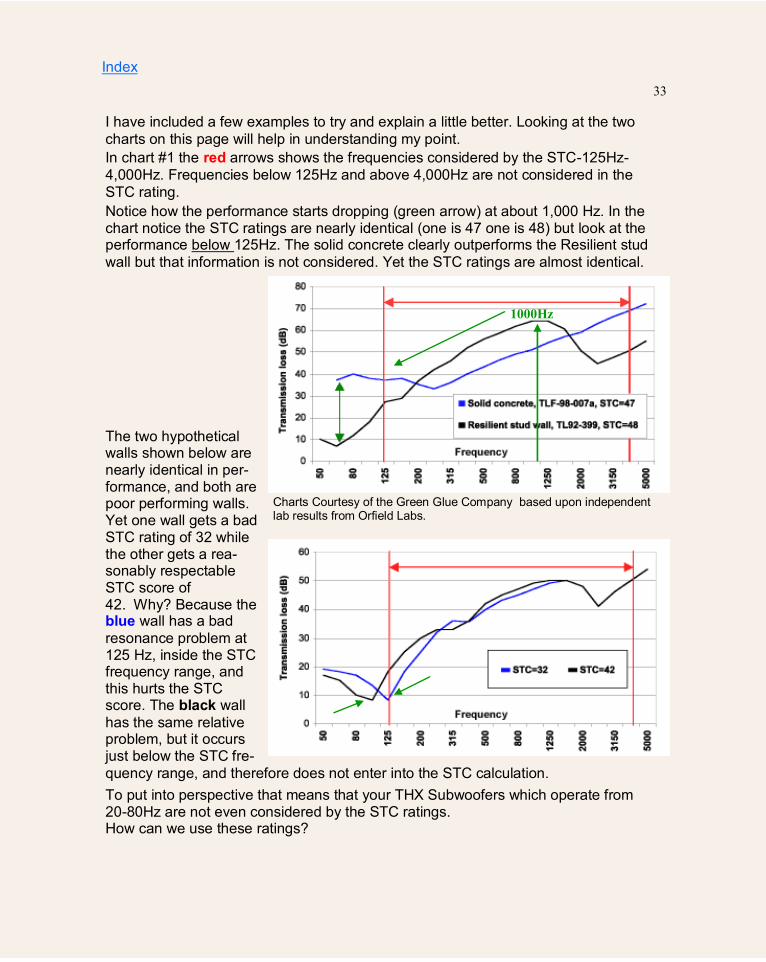
I have included a few examples to try and explain a little better. Looking at the two
charts on this page will help in understanding my point.
In chart #1 the red arrows shows the frequencies considered by the STC-125Hz-
4,000Hz. Frequencies below 125Hz and above 4,000Hz are not considered in the
STC rating.
Notice how the performance starts dropping (green arrow) at about 1,000 Hz. In the chart notice the STC ratings are nearly identical (one is 47 one is 48) but look at the performance below 125Hz. The solid concrete clearly outperforms the Resilient stud
wall but that information is not considered. Yet the STC ratings are almost identical.
The two hypothetical walls shown below are nearly identical in per-formance, and both are poor performing walls. Yet one wall gets a bad STC rating of 32 while the other gets a rea-sonably respectable STC score of 42. Why? Because the blue wall has a bad
resonance problem at 125 Hz, inside the STC frequency range, and this hurts the STC score. The black wall
has the same relative problem, but it occurs just below the STC fre-
quency range, and therefore does not enter into the STC calculation.
To put into perspective that means that your THX Subwoofers which operate from 20-80Hz are not even considered by the STC ratings. How can we use these ratings?
Index
1000Hz
Charts Courtesy of the Green Glue Company based upon independent lab results from Orfield Labs.
34
Sound Containment continued.
The worst offender of sound permeating through the home is the low frequencies from
20Hz to approximately 400Hz (from the lower midrange down to the ultra low bass
notes). I’m sure you’ve had the experience of listening to the annoying boom coming
from the car next to you at the traffic light or your teenage daughter blasting the latest
hip hop from her bedroom while you’re trying to watch TV. Not good.
We do not ignore the higher frequencies at all. They are just as important to control. But
I have yet to hear of a product that performs well at low frequencies but not at higher
frequencies. So focusing on the lower frequencies will cover us across the spectrum.
The low frequency sound waves contain greater energy than the higher frequencies.
These waves radiate from the speakers, travel through the room and collide with the
walls, ceiling and floor. When this happens the kinetic energy of the wave is converted
into mechanical energy (vibrations). This transformation causes the interior surfaces to
vibrate or resonate. Remember our room resonant tones. This vibration is transferred
from the surface to the structure (studs and framing). The vibration travels through the
framing of the home vibrating walls and ceilings in every room. The result is you now
have a house full of ugly room rattling low frequency noise.
The combination of the length of the wave and the energy it carries make these bad
boys a tough adversary. You can call them the tsunami waves of sound.
As an non scientific example think of a trampoline in place of drywall Let’s compare a
200lb man with and something that weights 1/50th of a pound. That simulates the ratio
of low to high frequencies. If we use a small pebble as the high frequencies and drop it
on the trampoline it will have very little effect if any. Now to simulate the low frequen-
cies visualize our 200lb man jumping on the trampoline. I think you get the picture.
That is an approximation of how sound reacts within your room. The higher frequencies
don’t have enough power to cause the wall to vibrate. They either will fade out before
contacting the wall or will bounce off the wall creating an echo. The power of the low.
frequency bass notes are the ones we need to stop. That is unless of course you desire
to hear the thump, thump, thump throughout the house.
The point is simple. If you want to enjoy your room without inflicting it on everyone else
in the home you best address those nasty low frequencies tones. It is essential to con-
tain those super waves other wise there will be a price to pay.
Ok, let’s get into some materials that can help address the situation. In the next section
I will be using the Decibel and Sound Transmission Class ratings. This is important in-
formation so pay attention, ok?
Index
35
- Sellers of Mass Loaded Vinyl recommended slightly thinner insulation to avoid interfering with the limpness of the MLV. Official lab reports are available.
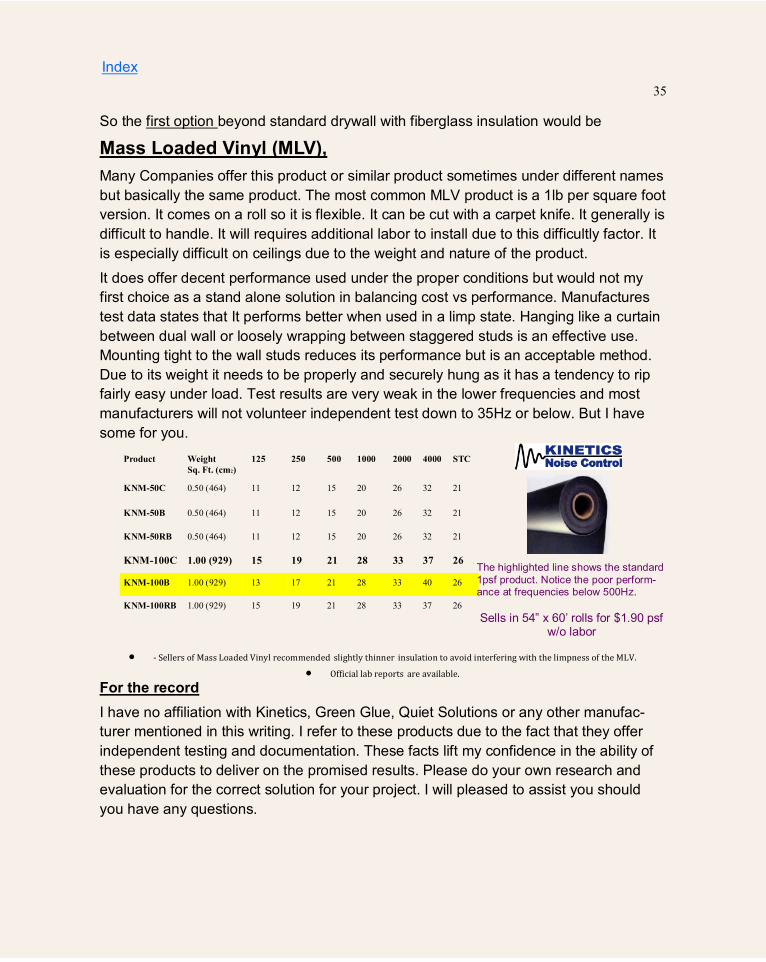
So the first option beyond standard drywall with fiberglass insulation would be
Mass Loaded Vinyl (MLV),
Many Companies offer this product or similar product sometimes under different names
but basically the same product. The most common MLV product is a 1lb per square foot
version. It comes on a roll so it is flexible. It can be cut with a carpet knife. It generally is
difficult to handle. It will requires additional labor to install due to this difficultly factor. It
is especially difficult on ceilings due to the weight and nature of the product.
It does offer decent performance used under the proper conditions but would not my
first choice as a stand alone solution in balancing cost vs performance. Manufactures
test data states that It performs better when used in a limp state. Hanging like a curtain
between dual wall or loosely wrapping between staggered studs is an effective use.
Mounting tight to the wall studs reduces its performance but is an acceptable method.
Due to its weight it needs to be properly and securely hung as it has a tendency to rip
fairly easy under load. Test results are very weak in the lower frequencies and most
manufacturers will not volunteer independent test down to 35Hz or below. But I have
some for you.
For the record
I have no affiliation with Kinetics, Green Glue, Quiet Solutions or any other manufac-
turer mentioned in this writing. I refer to these products due to the fact that they offer
independent testing and documentation. These facts lift my confidence in the ability of
these products to deliver on the promised results. Please do your own research and
evaluation for the correct solution for your project. I will pleased to assist you should
you have any questions.
Product Weight
Sq. Ft. (cm2)
125 250 500 1000 2000 4000 STC
KNM-50C 0.50 (464) 11 12 15 20 26 32 21
KNM-50B 0.50 (464) 11 12 15 20 26 32 21
KNM-50RB 0.50 (464) 11 12 15 20 26 32 21
KNM-100C 1.00 (929) 15 19 21 28 33 37 26
KNM-100B 1.00 (929) 13 17 21 28 33 40 26
KNM-100RB 1.00 (929) 15 19 21 28 33 37 26
Index
The highlighted line shows the standard
1psf product. Notice the poor perform-ance at frequencies below 500Hz.
Sells in 54‖ x 60’ rolls for $1.90 psf w/o labor
36
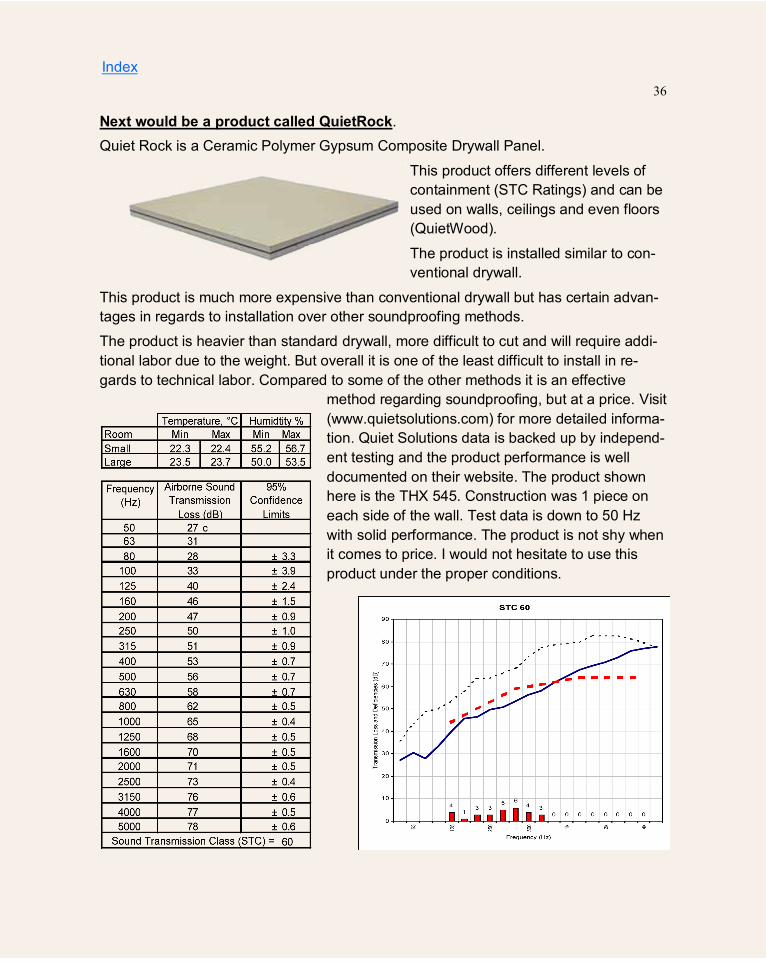
Next would be a product called QuietRock.
Quiet Rock is a Ceramic Polymer Gypsum Composite Drywall Panel.
This product offers different levels of
containment (STC Ratings) and can be
used on walls, ceilings and even floors
(QuietWood).
The product is installed similar to con-
ventional drywall.
This product is much more expensive than conventional drywall but has certain advan-
tages in regards to installation over other soundproofing methods.
The product is heavier than standard drywall, more difficult to cut and will require addi-
tional labor due to the weight. But overall it is one of the least difficult to install in re-
gards to technical labor. Compared to some of the other methods it is an effective
method regarding soundproofing, but at a price. Visit
(www.quietsolutions.com) for more detailed informa-
tion. Quiet Solutions data is backed up by independ-
ent testing and the product performance is well
documented on their website. The product shown
here is the THX 545. Construction was 1 piece on
each side of the wall. Test data is down to 50 Hz
with solid performance. The product is not shy when
it comes to price. I would not hesitate to use this
product under the proper conditions.
Index

37
QuietRock is available in multiple performance levels and price points.
Below is the data on a notch below the THX545 product. The 530 performs well, is less
expensive than the 545 and is a reasonable alternative. The charts and graphs show
test data for the QR-530 and also compares to the QR-545.Construction of the walls is
the same, one sheet on each side of the wall. Again looking at the chart notice the per-
formance curve as it descends to the lower frequencies. The wall diagram shows a typi-
cal wood stud wall construction with a sheet of 530 applied to both source and receiv-
ing walls.
As you can see by looking at the comparison the THX545 substantially outperforms the
530 from 50Hz through 500HZ.
Chart Provided by Quiet Solutions. This graph compares the per-formance of QR 530 to MLV product.
A double drywall assembly and plain old standard wall.
Index
Frequency QR-545 QR-530
50 27 19
63 31 16
80 28 16
100 33 25
125 40 35
160 46 39
200 47 39
250 50 43
315 51 45
400 53 47
500 56 53
630 58 57
800 62 61
1000 65 64
1250 68 66
1600 70 67
2000 71 69
2500 73 70
3150 76 71
4000 77 71
5000 78 68
This chart shows the per-formance comparison be-tween the QR545 and 530

38
Our next option would utilize a product called Green Glue
Green Glue is a viscoelastic material applied like caulk between the two
layers of Drywall. It offers solid performance, and reasonable installation
costs. Take a look at the pictures below. It is applied over a sheet of drywall
achieving uniform coverage. It is placed over another sheet of drywall. Cre-
ating a sandwich. The force of the compression spreads the material as
shown below. It will take a few weeks to completely cure. But once it does it
separates the two layers of drywall (the sandwich bread) and dampens the
transfer of the vibration. The suggested application rate is three tubes per 4x8 sheet of
drywall.
Green Glue can be used to soundproof walls, floors and ceilings.
Green Glue can be used both in new construction, building upgrades
and renovations.
Since Green Glue is intended to be sandwiched between two sheets
of building materials such as drywall, it can be placed over existing
drywall. Which in some cases in a sig-
nificant cost savings. It eliminates the
need to remove existing wall and floor
materials.
You will need to figure for extra labor on
the drywall for spreading the product
and double layering if necessary. But
overall it would be a good choice bal-
ancing budget vs performance. On the
following page is test data of Green
Glue versus an MLV product. Let’s take
a deeper look at this product compared
to the other methods across the fre-
quency spectrum.
Product sells for $15.00 per tube. Typi-
cal cost is $45 per 4x8 sheet of drywall
(3 tubes x $15ea).It is also available in
5 gallon pails at the cost of $265.00ea.
Visit greengluecompany.com for instal-
lation and necessary accessories. Green Glue offers in-
dependent testing reports for your review.
Index
Frequency STC
STC 56
31.5 28
40 24
50 25
63 20
80 23
100 27
125 35
160 41
200 42
250 47
315 50
400 50
500 53
630 56
800 59
1000 60
1250 59
1600 61
2000 61
2500 62
3150 67
4000 70
5000 70
6300 70
8000 69
10,000 63

39
Green Glue Test Description – Green Glue vs Mass Loaded Vinyl (MLV).
To address this question, The
Green Glue Company ran a
series of tests at Orfield Labo-
ratories, a NVLAP certified
independent lab in Minneapo-
lis, MN. Below are the wall
configurations, from source
room to receive room. All de-
tails of the walls were identi-
cal, including insulation,
screw length and spacing,
stud configurations, and so
forth. Of particular interest is
the exceptional improvement
around the resonance points
of the wall. At the primary low
frequency resonance (around
80Hz or so), the Green Glue
wall outperforms the MLV as-
semblies by as much as 9dB – the equivalent of tripling the mass of the wall. Over most
of the vocal/speech frequency range, the Green Glue assembly outperforms the MLV
assemblies by 10-15 dB. While the performance of the limp mass material is not poor,
Green Glue – a damping material – notably out performs. Official lab reports are avail-
able.
MLV Assem-bly I Limp Mass Test
MLV Assem-bly II Constrained Test
GG As-sembly I 1 Layer on Source Side
GG Assembly II 1 Layer on Both Sides
5/8‖ drywall + MLV (1 lb per square foot, limply hung)
1/2‖ drywall+ MLV (1lb per square foot, bonded with carpet adhe-sive) + 1/2‖ drywall
5/8‖ drywall + Green Glue @ 58 fluid ounces per 4’ x 8’ sheet + 5/8‖ drywall
1/2‖ drywall + Green Glue @ 58 fluid ounces per 4’ x 8’ sheet+ 1/2‖ drywall
2x4 single wood studs, 24‖ on center
2x4 single wood studs, 24‖ on center
2x4 single wood studs, 24‖ on center
2x4 single wood studs, 24‖ on center
R8 fiberglass insulation*
R13 fiberglass insulation
R13 fiber-glass insu-lation
R13 fiberglass insulation
5/8‖ drywall 1/2‖ drywall 5/8‖ drywall 5/8‖ drywall + Green Glue @ 58 fluid ounces per 4’ x 8’ sheet + 5/8‖ drywall
Index

40
Resilient Channel Systems
Resilient channel systems are a very effective way of treating your room. Resilient
channel shares the objective of damping vibrations and stopping structure borne
transmissions. It offers a means of obtaining separation without loosing space to dou-
ble wall construction.
Resilient Channel and Floating Rooms offer solid performance across the frequency
spectrum and perform well at the lower frequencies which we know are the worst of-
fenders at noise transmission.
This method isolates the walls, ceiling and floor from the rest of the structure using
materials such as resilient channel (hat channel), Isolation Hangers and floating floor
treatments. The object is to de-couple the walls, ceiling and
floor surfaces from the framing structure by the use of resil-
ient/hat channel (see picture ). The resilient channel is at-
tached directly to the wall and ceiling framing. The drywall
is attached to the resilient channel not the framing. This
approach impedes the transfer of the mechanical energy
(vibrations) into the framing which carries the energy
throughout the home
The main problem with this system is that any misplaced screw going into a framing
stud will short circuit the intent of the system reducing the effectiveness and perform-
ance. The result is you will spend a lot of money and effort and it simply won’t work to
its full potential. Not good.
The down side of resilient channel is in the installation. Great care and supervision is
required to be sure the system is installed properly.
The introduction of the Isolation Clip (see right) by both Kinetics and more recently
Green Glue to the system greatly improve on the installation is-
sues. Helping in reducing installation errors and cost. It elimi-
nates the problem of misplaced screws which simplifies installa-
tion. I have used this system in my own project and can person-
ally verify its performance. I will detail in the continuation of my
project the real world performance of this product.
Index

41
Construction 2 x 4 studs, 16" o.c. R19 Insulation in stud cavity Source side IsoMax clips with 7/8" fur-ring channel spaced 24" o.c. 2 layers 5/8" drywall Receive side Single layer of drywall on the receive side
Index
Frequency STC
STC 61
31.5 16
40 22
50 20
63 23
80 28.1
100 33
125 37
160 42
200 46
250 52
315 57
400 59
500 61
630 61
800 63
1000 63
1250 65
1600 64
2000 61
2500 64
3150 67
4000 69
5000 71
6300
8000
10,000
Kinetics Resilient Sound Isolation Wall and Ceiling Clip
IsoMax System
Receive side single drywall
Source side double drywall
Example of wall and
ceiling application

42
Shown below is a comparison chart of different types of sound proofing. All test results are from certified testing labs. All tests performed with 2x4 wood studs. Steel studs will yield slightly better results. Consult test data for your wall assembly for relative results. My intention here is to give you a consolidated look at some options. I did my best to keep everything equal and fair. The best product for you is of course dependant on your situation.
MLV single drywall
each side Orfield Labs OL 05-0822
QR-530 Single sheet
each side National
Research Council of Canada
#B3414-4
Green Glue both sides
double dry-wall both
sides Orfield Labs #OL 05-1035
Kinetics ISOMAX
Double drywall channel side Riverbank
Acoustical Labs #RAL-TL02-35
QR-545 THX Single sheet
each side National Re-search Coun-cil of Canada
#B3433.4
Green Glue Clip System
single drywall channel side Orfield Labs OL08-0710
STC Rating 45 54 56 61 60 56
Frequency
31.5 25 28 16 24.5
40 19 24 22 19
50 23 19 25 20 27 17
63 15 16 20 23 31 14.3
80 15 16 23 28.1 28 23.2
100 18 25 27 33 33 30
125 29 35 35 37 40 35
160 37 39 41 42 46 34.8
200 40 39 42 46 47 40.4
250 36 43 45 52 50 48.2
315 33 45 47 57 51 53.3
400 38 47 50 59 53 55.9
500 41 53 53 61 56 57
630 45 57 56 61 58 59.7
800 46 61 59 63 62 63.7
1000 50 64 60 63 65 65.5
1250 53 66 59 65 68 65.3
1600 55 67 61 64 70 61.6
2000 54 69 61 61 71 58
2500 50 70 62 64 73 55.9
3150 49 71 67 67 76 58.6
4000 53 71 70 69 77 66.3
5000 58 68 70 71 78 69
6300 70 69.2
8000 69 69.1
10,000 63 64.5
Index
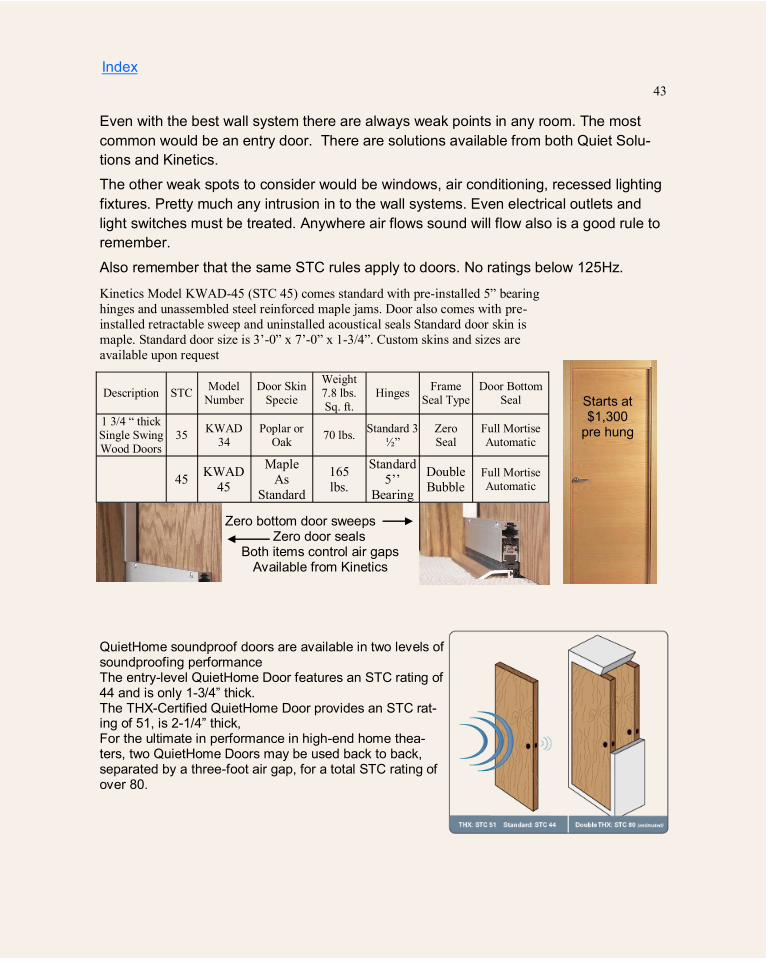
43
Index
Even with the best wall system there are always weak points in any room. The most
common would be an entry door. There are solutions available from both Quiet Solu-
tions and Kinetics.
The other weak spots to consider would be windows, air conditioning, recessed lighting
fixtures. Pretty much any intrusion in to the wall systems. Even electrical outlets and
light switches must be treated. Anywhere air flows sound will flow also is a good rule to
remember.
Also remember that the same STC rules apply to doors. No ratings below 125Hz.
Kinetics Model KWAD-45 (STC 45) comes standard with pre-installed 5” bearing
hinges and unassembled steel reinforced maple jams. Door also comes with pre-
installed retractable sweep and uninstalled acoustical seals Standard door skin is
maple. Standard door size is 3’-0” x 7’-0” x 1-3/4”. Custom skins and sizes are
available upon request
Description STC Model
Number Door Skin
Specie
Weight 7.8 lbs. Sq. ft.
Hinges Frame
Seal Type Door Bottom
Seal
1 3/4 “ thick Single Swing Wood Doors
35 KWAD
34 Poplar or
Oak 70 lbs.
Standard 3 ½”
Zero Seal
Full Mortise Automatic
45 KWAD
45
Maple
As
Standard
165
lbs.
Standard
5’’
Bearing
Double
Bubble Full Mortise Automatic
QuietHome soundproof doors are available in two levels of soundproofing performance The entry-level QuietHome Door features an STC rating of 44 and is only 1-3/4‖ thick. The THX-Certified QuietHome Door provides an STC rat-ing of 51, is 2-1/4‖ thick, For the ultimate in performance in high-end home thea-ters, two QuietHome Doors may be used back to back, separated by a three-foot air gap, for a total STC rating of over 80.
Zero bottom door sweeps Zero door seals
Both items control air gaps Available from Kinetics
Starts at $1,300
pre hung

44
Index
Kinetics InJoist Duct Silencer
Quiet HVAC. Control unwanted HVAC noise from en-
tering the home theater and minimize sound from
transmitting through the home.
Our InJoist Duct Silencer achieves broad band noise
reduction while maintaining proper air flow and distri-
bution. It requires little space because it is installed in
the floor joist area, leaving zero loss of head space.
Composition: 6'' diameter inlet and exhaust flanges
with a solid outer casing of
commercial gauge sheet metal. Its perforated metal inner lining encases an acoustical
media for superior sound absorption.
Standard size is designed for use with 10'' floor joist positioned on 16'' centers
standard size: 17-1/2'' w x 60'' L x 9'' H. Custom sizes available, consult factory.
Kinetics InLine Duct Silencer
Quiet HVAC. Acoustically this silencer per-
forms much like our InJoise Duct Silencer, but
the InLine Duct Silencer is round and requires
additional space for installation.
Standard size: 14'' diameter x 36'' length
overall, including inlet and exhaust flange.
Custom sizes available, consult factory.
Sells for $585
Sells for $765
Kinetics Acoustical Fire Rated Outlet Backer Pads. Designed to maintain high acoustical ratings in fire rated walls. 20 pads per box. Sells for $160 per box
Kinetics IsoMax Drywall Isolation Clip Isolate drywall from wall studs or ceiling joists. Sells for $4.75 ec under 500 quanity.
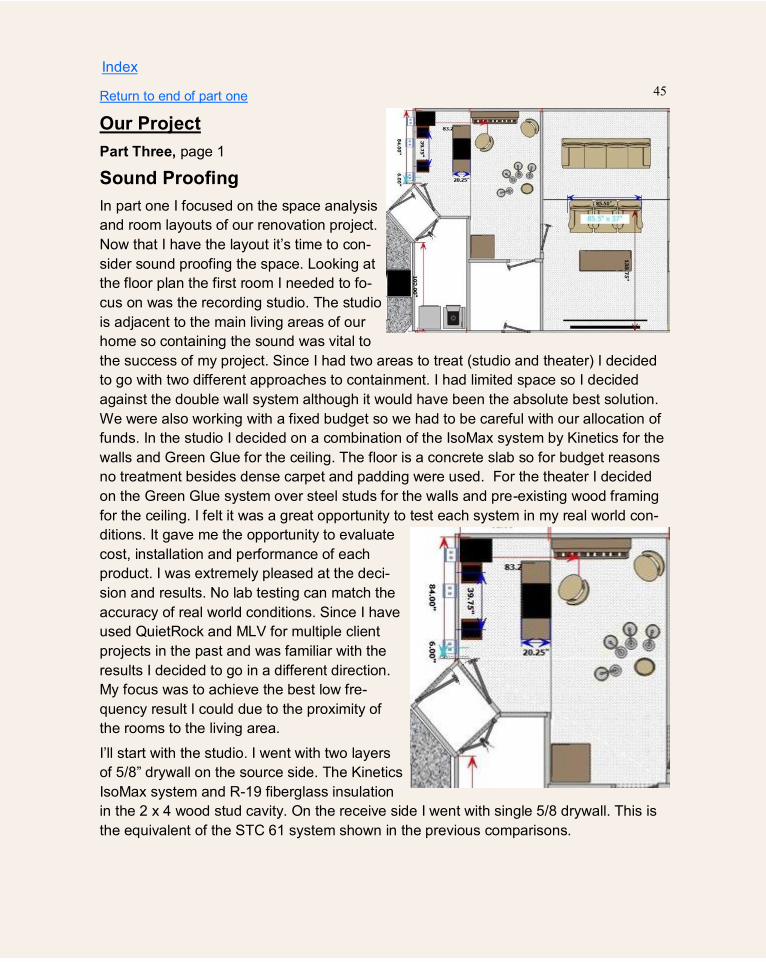
45
Index
Our Project
Part Three, page 1
Sound Proofing
In part one I focused on the space analysis
and room layouts of our renovation project.
Now that I have the layout it’s time to con-
sider sound proofing the space. Looking at
the floor plan the first room I needed to fo-
cus on was the recording studio. The studio
is adjacent to the main living areas of our
home so containing the sound was vital to
the success of my project. Since I had two areas to treat (studio and theater) I decided
to go with two different approaches to containment. I had limited space so I decided
against the double wall system although it would have been the absolute best solution.
We were also working with a fixed budget so we had to be careful with our allocation of
funds. In the studio I decided on a combination of the IsoMax system by Kinetics for the
walls and Green Glue for the ceiling. The floor is a concrete slab so for budget reasons
no treatment besides dense carpet and padding were used. For the theater I decided
on the Green Glue system over steel studs for the walls and pre-existing wood framing
for the ceiling. I felt it was a great opportunity to test each system in my real world con-
ditions. It gave me the opportunity to evaluate
cost, installation and performance of each
product. I was extremely pleased at the deci-
sion and results. No lab testing can match the
accuracy of real world conditions. Since I have
used QuietRock and MLV for multiple client
projects in the past and was familiar with the
results I decided to go in a different direction.
My focus was to achieve the best low fre-
quency result I could due to the proximity of
the rooms to the living area.
I’ll start with the studio. I went with two layers
of 5/8‖ drywall on the source side. The Kinetics
IsoMax system and R-19 fiberglass insulation
in the 2 x 4 wood stud cavity. On the receive side I went with single 5/8 drywall. This is
the equivalent of the STC 61 system shown in the previous comparisons.
Return to end of part one

46
Index
Our Project
Part Three, page 2
Sound Proofing
I added double independent offset entry doors using solid core
doors with gasket sealing to minimize leakage. Offsetting the
doors eliminates the seams from lining up for a bit of extra pro-
tection.
In addition to the double drywall and IsoMax resilient clips I used the Kinetics outlet
backer pads, the kinetics RWS resilient isolation strip and plenty of acoustic caulk. The
double drywall was hung as follows, sheet 1 vertical sheet 2
horizontal. This was done so all seems were covered.
Each and every seam was treated with acoustic caulk elimi-
nating all air gaps on both layers of drywall. The outer layer
was finished off with tape and drywall mud and readied for
primer and paint.
Our budget did not allow for duct silencers so for the AC system I ran an independent
feed and return utilizing (3) 90° turns in each to limit the transmission of sound through
the ductwork.
For extra protection I added 2‖ acoustic sound panels to the source walls and ceiling. I
will cover these more in the Sound Control section. They do help in reducing the
amount of kinetic sound energy in the mid-range frequencies that contacts the drywall.
After completion I ran several tests on the room to check performance. Overall I was
pleased at how the system performed. I have included my results for review. This
should also help in giving you a clearer understanding of some of the points I have
made earlier.
Tests were made using my Audio Control SA-3051 Spectrum Analyzer and Digital SPL
Display (54dB to 136dB). I have used this instrument for years and it has always served
me well.
First the room was acoustically calibrated and adjusted to be as frequency neutral as
possible. Adjustments were made using parametric equalizers along with the internal
room correction from my (JBL) studio monitors.
Using the Audio Control’s internal Pink Noise Generator I brought the volume up to very
loud 105 dB inside the studio. Basically the volume of a rock concert.
Return to end of part one
Door 1
Door 2

47
Index
Return to end of part one
Our Project
Part Three, page 3
Sound Proofing
The chart below shows the overall performance result. I obtained a 32 dB overall reduc-
tion. As I suspected the main contributors to the rating were from 20Hz through 63Hz.
Remember these frequencies are not even considered in standard STC Ratings
(125Hz-4000Hz).
The chart on the right is the Kinetics IsoMax test results shown
earlier. I will use as a reference since the wall construction is simi-
lar to mine.
I focused my tests on the lower frequencies (25Hz to 250Hz). My
Audio Control SPL analyzer has a lower limit of 54dB so I could not
obtain accurate reduction measures below 54dB for the 220 Hz
and 250 Hz test.
Since I was re-
ceiving no read-
ing at those fre-
quencies it is
safe to believe
that I was obtaining a minimum 51 dB reduction. The chart below
shows my tested frequencies and the results. Compared to the Lab
Test (right) I actually achieved better results in the range tested.
In regards to our theater room my test results were similar. Due to it’s location and
sound proofing almost no sound was heard in the living area even during the most ac-
tion packed adventure movie. Needless to say I am extremely pleased with both the
sound quality and sound containment of our theater. It is without a doubt the most popu-
lar room in our house. My wife, daughters and their friends, and of course me enjoy the
rooms on a continuous basis. I can lock myself in and enjoy Mozart to Sade to Zepplin
with great quality sound at high listening levels with no worries of disturbing anyone else
in the house.
Can’t describe what a great feeling that is to a music lover like me.
Frequency STC
STC 61
31.5 16
40 22
50 20
63 23
80 28.1
100 33
125 37
160 42
200 46
250 52
315 57
400 59
500 61
630 61
800 63
Source Side Source
Frequency In dB
Receive
Side dB
Reduc-
tion dB
%
Reduc-
tion
Frequency Range of Reading
Pink Noise Full range 105 73 (32) 88 % 25 Hz, 31.5Hz, 40Hz, 50Hz, 63 Hz
All other frequencies below 66dB
27.5 55 110 220 250 Frequency
105 105 105 105 105 Inside room
82 80 65.2 54 54 Outside room
23 25 39.8 51 51 Difference
Test
results from my home
studio
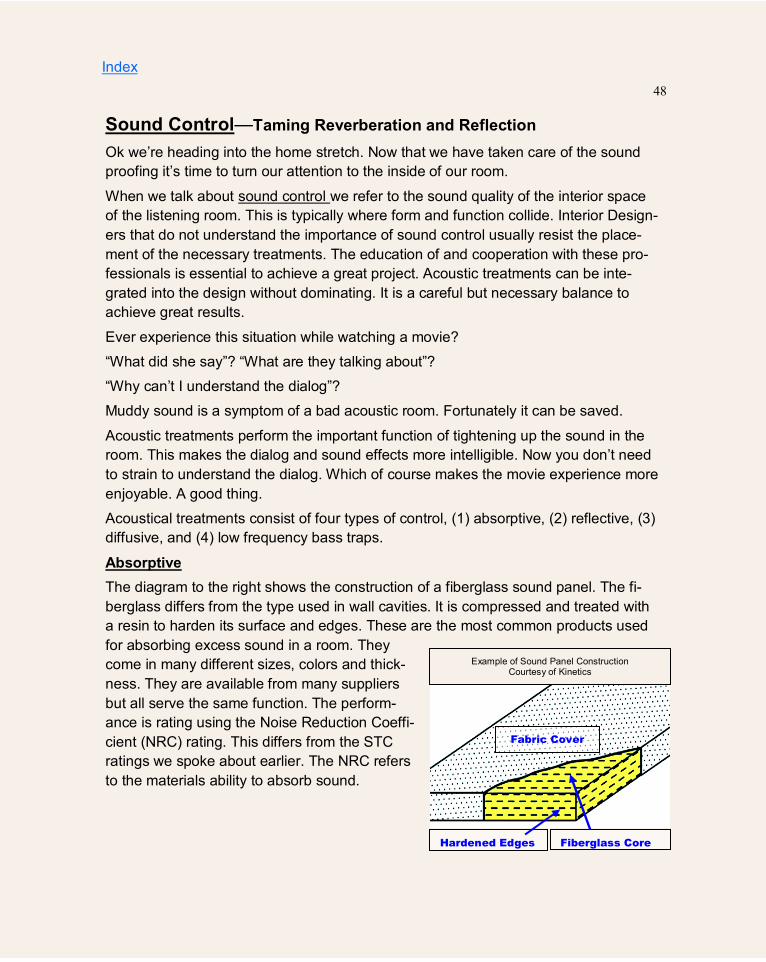
48
Sound Control—Taming Reverberation and Reflection
Ok we’re heading into the home stretch. Now that we have taken care of the sound
proofing it’s time to turn our attention to the inside of our room.
When we talk about sound control we refer to the sound quality of the interior space
of the listening room. This is typically where form and function collide. Interior Design-
ers that do not understand the importance of sound control usually resist the place-
ment of the necessary treatments. The education of and cooperation with these pro-
fessionals is essential to achieve a great project. Acoustic treatments can be inte-
grated into the design without dominating. It is a careful but necessary balance to
achieve great results.
Ever experience this situation while watching a movie?
―What did she say‖? ―What are they talking about‖?
―Why can’t I understand the dialog‖?
Muddy sound is a symptom of a bad acoustic room. Fortunately it can be saved.
Acoustic treatments perform the important function of tightening up the sound in the
room. This makes the dialog and sound effects more intelligible. Now you don’t need
to strain to understand the dialog. Which of course makes the movie experience more
enjoyable. A good thing.
Acoustical treatments consist of four types of control, (1) absorptive, (2) reflective, (3)
diffusive, and (4) low frequency bass traps.
Absorptive
The diagram to the right shows the construction of a fiberglass sound panel. The fi-
berglass differs from the type used in wall cavities. It is compressed and treated with
a resin to harden its surface and edges. These are the most common products used
for absorbing excess sound in a room. They
come in many different sizes, colors and thick-
ness. They are available from many suppliers
but all serve the same function. The perform-
ance is rating using the Noise Reduction Coeffi-
cient (NRC) rating. This differs from the STC
ratings we spoke about earlier. The NRC refers
to the materials ability to absorb sound.
Index
Fabric Cover
Example of Sound Panel Construction Courtesy of Kinetics
Fiberglass Core Hardened Edges
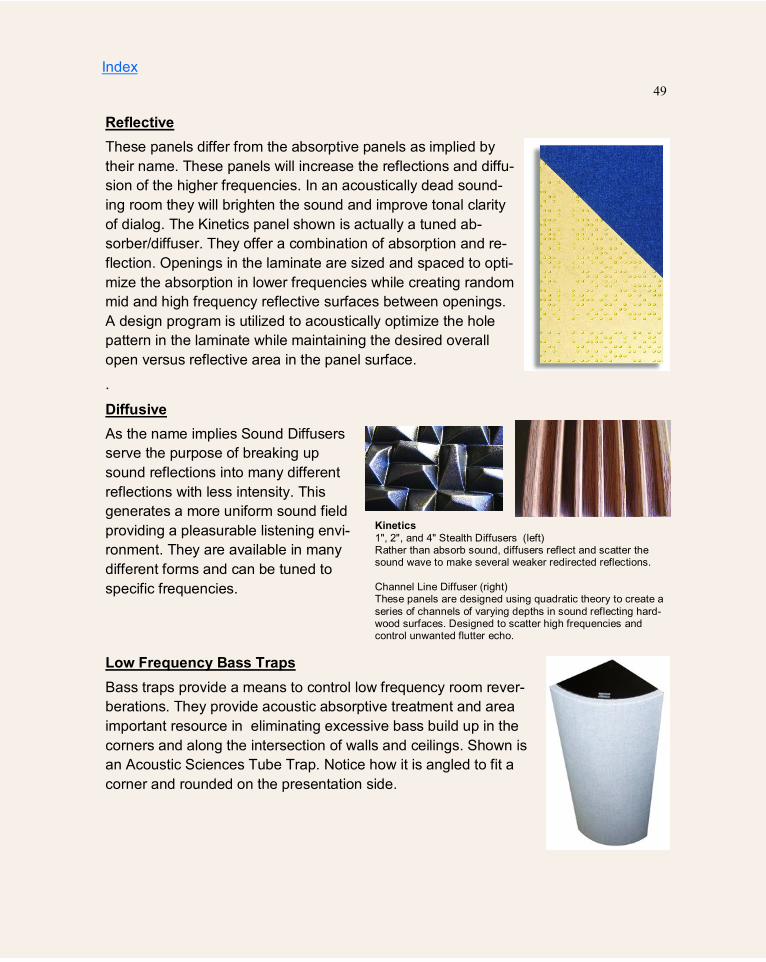
49
Reflective
These panels differ from the absorptive panels as implied by
their name. These panels will increase the reflections and diffu-
sion of the higher frequencies. In an acoustically dead sound-
ing room they will brighten the sound and improve tonal clarity
of dialog. The Kinetics panel shown is actually a tuned ab-
sorber/diffuser. They offer a combination of absorption and re-
flection. Openings in the laminate are sized and spaced to opti-
mize the absorption in lower frequencies while creating random
mid and high frequency reflective surfaces between openings.
A design program is utilized to acoustically optimize the hole
pattern in the laminate while maintaining the desired overall
open versus reflective area in the panel surface.
.
Diffusive
As the name implies Sound Diffusers
serve the purpose of breaking up
sound reflections into many different
reflections with less intensity. This
generates a more uniform sound field
providing a pleasurable listening envi-
ronment. They are available in many
different forms and can be tuned to
specific frequencies.
Low Frequency Bass Traps
Bass traps provide a means to control low frequency room rever-
berations. They provide acoustic absorptive treatment and area
important resource in eliminating excessive bass build up in the
corners and along the intersection of walls and ceilings. Shown is
an Acoustic Sciences Tube Trap. Notice how it is angled to fit a
corner and rounded on the presentation side.
Index
Kinetics
1", 2", and 4" Stealth Diffusers (left) Rather than absorb sound, diffusers reflect and scatter the sound wave to make several weaker redirected reflections.
Channel Line Diffuser (right) These panels are designed using quadratic theory to create a
series of channels of varying depths in sound reflecting hard-wood surfaces. Designed to scatter high frequencies and control unwanted flutter echo.

50
When treating a home theater it requires the right mixture of all four to properly fine
tune the space into the ultimate listening environment.
It is important to keep in mind that over treating is just as bad as not treating. I have
seen many theater rooms where the wall surfaces are completely covered with 1‖
sound absorbing panels. The result is a loss of brightness. The room becomes dull
sounding. I have also seen theater rooms without any treatment at all. Both are bad
ideas.
By absorbing excess high frequency reflections, unwanted bass resonance, adding re-
flective surfaces to brighten the room, and diffusing frequencies to offer a more bal-
anced sound, we can fine tune or dial in (industry term) the room for excellent sound
quality.
I will take you through the some of the available products and techniques of sound con-
trol.
Quick Sound Review: As the sound radiates from the speakers it collides with the
walls, ceiling and floor. The waves will bounce off the hard reflec-
tive surfaces of the room. We want to control these sound waves
otherwise we run the risk of the room actually sounding like a
cave. A bad thing. A overly reflective room will produce exces-
sive echo and reverberations. Think about the canyon or cave
effect. We hear the sound bounce off the rock and repeat over
and over, hello, hello, hello, etc…. Singing in the shower is a per-
fect example of this effect. The sound bounces off the hard sur-
faces and creates a reverb or delayed echo. Well too much of this effect is definitely not
what we desire in our theatre room. As the sound reflects off
the hard surfaces it mixes with new direct waves and contin-
ues to build causing excessive echo. The result is a real mess
of sound. A ―sound stew‖ as I call it. This effect decreases the
intelligibility of the sound track making it difficult to pick up the
subtleties in the dialog. We have new waves, some middle
aged waves and even some senior citizen waves hanging
around. All these generations of sound waves crashing
about cause all kinds of issues that even a great therapist
couldn’t work out.
Think off a crowded cafeteria with everyone talking and
sound bouncing everywhere. You find yourself almost
shouting just to be heard.
Index

51
Now think about a Broadway Theatre or a well designed concert hall. When you enter
you can almost feel the quiet. Even with a full room you can easily enjoy a simple
conversation. The reason is that great effort went into the sound design of the hall. To
achieve similar results it’s important to focus on sound absorption and diffusion.
We definitely do not want to remove all reverberation and make the room totally dead
(anechoic). The result would be a loss of brightness.
We want to achieve a balance of reflection, diffusion and absorption.
The higher frequencies (zone D and some zone C) will reflect off the surface at the
same angle that it strikes the surface. These are referred to as sound rays. They are
the smaller higher frequency sounds. These frequencies are more directional than
low frequency sounds.
Example; sound collides with the wall at a 170° angle it will reflect off the untreated
surface at 170°.
This is easier to predict. If we can find the strike point we should be able to calculate
the reflection path. We refer to the first point of contact as the primary reflection point.
You may have heard or read about the mirror test. It’s a simple test but effective. To
sum it up you simply place your speakers and seating then using a friend and a
dressing mirror to find the primary reflection points for each of your front speakers. As
you sit in your chair have your friend move the mirror along the wall. When you see
both the speaker and yourself you have found the primary reflection point for that seat
and speaker. This is a very basic way of locating the reflection point but is effective to
a degree. But is it the best solution? You may ask.
Here is my biggest problem with the mirror test.
How do you complete an interior design plan without knowing the location of the
sound treatments first? Hmmmm.
You need to complete the room. At least as far as the vanilla box. Place your speak-
ers and seating. Perform your mirror test measurements. Then submit to your de-
signer so the process can progress. Then break everything down. Store it somewhere
until the work can be completed. Remember custom millwork can take months to
complete. Then put it back together again.
In every luxury theater I have done I had an Interior Design team depending on my
specifications. They need the information at the start not end of the project.
―Well Mr. or Ms. Interior Design professional, I really don’t know where the sound
treatments go‖. Ok yeah, that will work out well.
In my opinion you need a better way.
Index
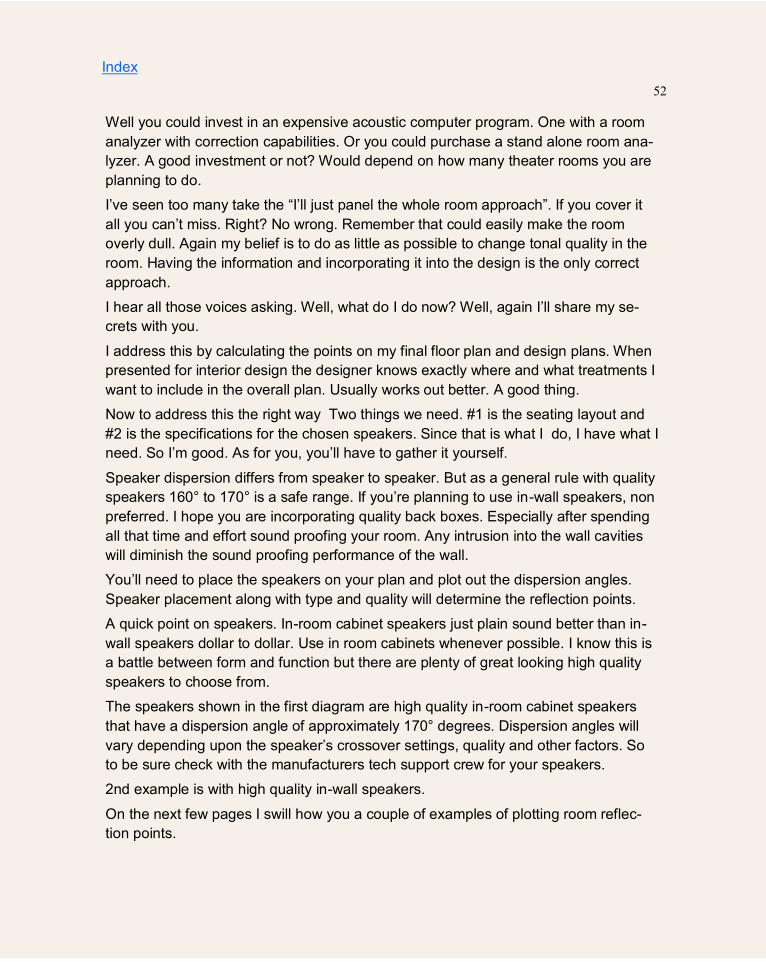
52
Well you could invest in an expensive acoustic computer program. One with a room
analyzer with correction capabilities. Or you could purchase a stand alone room ana-
lyzer. A good investment or not? Would depend on how many theater rooms you are
planning to do.
I’ve seen too many take the ―I’ll just panel the whole room approach‖. If you cover it
all you can’t miss. Right? No wrong. Remember that could easily make the room
overly dull. Again my belief is to do as little as possible to change tonal quality in the
room. Having the information and incorporating it into the design is the only correct
approach.
I hear all those voices asking. Well, what do I do now? Well, again I’ll share my se-
crets with you.
I address this by calculating the points on my final floor plan and design plans. When
presented for interior design the designer knows exactly where and what treatments I
want to include in the overall plan. Usually works out better. A good thing.
Now to address this the right way Two things we need. #1 is the seating layout and
#2 is the specifications for the chosen speakers. Since that is what I do, I have what I
need. So I’m good. As for you, you’ll have to gather it yourself.
Speaker dispersion differs from speaker to speaker. But as a general rule with quality
speakers 160° to 170° is a safe range. If you’re planning to use in-wall speakers, non
preferred. I hope you are incorporating quality back boxes. Especially after spending
all that time and effort sound proofing your room. Any intrusion into the wall cavities
will diminish the sound proofing performance of the wall.
You’ll need to place the speakers on your plan and plot out the dispersion angles.
Speaker placement along with type and quality will determine the reflection points.
A quick point on speakers. In-room cabinet speakers just plain sound better than in-
wall speakers dollar to dollar. Use in room cabinets whenever possible. I know this is
a battle between form and function but there are plenty of great looking high quality
speakers to choose from.
The speakers shown in the first diagram are high quality in-room cabinet speakers
that have a dispersion angle of approximately 170° degrees. Dispersion angles will
vary depending upon the speaker’s crossover settings, quality and other factors. So
to be sure check with the manufacturers tech support crew for your speakers.
2nd example is with high quality in-wall speakers.
On the next few pages I swill how you a couple of examples of plotting room reflec-
tion points.
Index

53
33
2
4
S S
24‖
Center
The diagram on the right shows my small listening room (12.1’ x 21’). The left, center and right speaker placement is pictured. I am showing an approximation of the forward radiation of the sound waves. Notice how some of the reflection points bunch up. This gives us a fairly good idea of where treatments are necessary.

54
Index
30”
SW SW
24‖
Corner Bass Trap
Corner Bass Trap
Primary
Reflection Point Treatment
Absorptive Sound Panel
Primary
Reflection Point Treatment
Absorptive Sound Panel
Min 42”
panel
30”
24‖
170° speaker dispersion angle Sound Control

55
Ok now that we have a good idea about the room reflection points how do we go
about treating the surfaces?
On the next page I have shown an example of treatments for the room shown back
on page 54. The diagram shows the primary and secondary reflection points. As I
also mentioned we change from the STC rating to the NRC rating. So let’s start with a
bit of info on the NRC rating, OK?
As with STC ratings the NRC ratings focus on the frequencies between 125Hz and
4000Hz.
Noise Reduction Coefficient (NRC) (definition republished from www.nrcratings.com)
The NRC is a single-number index determined in a lab test and used for rating how
absorptive a particular material is. This industry standard ranges from zero (perfectly
reflective) to 1* (perfectly absorptive). It is simply the average of the mid-frequency
sound absorption coefficients (250, 500, 1000 and 2000 Hertz) rounded to the near-
est 5%.
The absorption coefficient is a measure of the efficiency of a surface or material in
absorbing sound. If 75% of the sound energy is absorbed, the absorption coefficient
is said to be 0.75. One square foot of the this material gives.75 absorption units. A
rating of 1.0 means that no sound passing through the material is returned to the
room.
As with the STC rating the materials performance will diminish as the frequencies
descend. So we need to look at the full testing to be sure we are addressing the
frequencies we desire to control.
Let’s start at the front end and I will take you through the available treatments. I will
be using standard available products in this section. I will not go into custom products
or ―build it yourself‖ type products as I feel they are not relevant in our discussion and
purpose. There is much good information for those who want explore these options.
My favorite resource is the ―Master Handbook of Acoustics by F. Alton Everest‖. It is
never far from my side when researching.
You’ll notice on the diagram that I have placed (4) corner bass traps. As we know
from our reading the low frequency bass can cause some nasty effects in our room.
The importance of treating the corners is due to the fact that all four room surfaces
converge in a corner (floor, (2) walls and ceiling. This results in a collecting or gather-
ing of sound reflections. Not good. We could even take this a step further by treating
the wall-ceiling and wall-floor convergence. What we want to achieve is quality bass
not quantity of bass. Huge difference.
Index
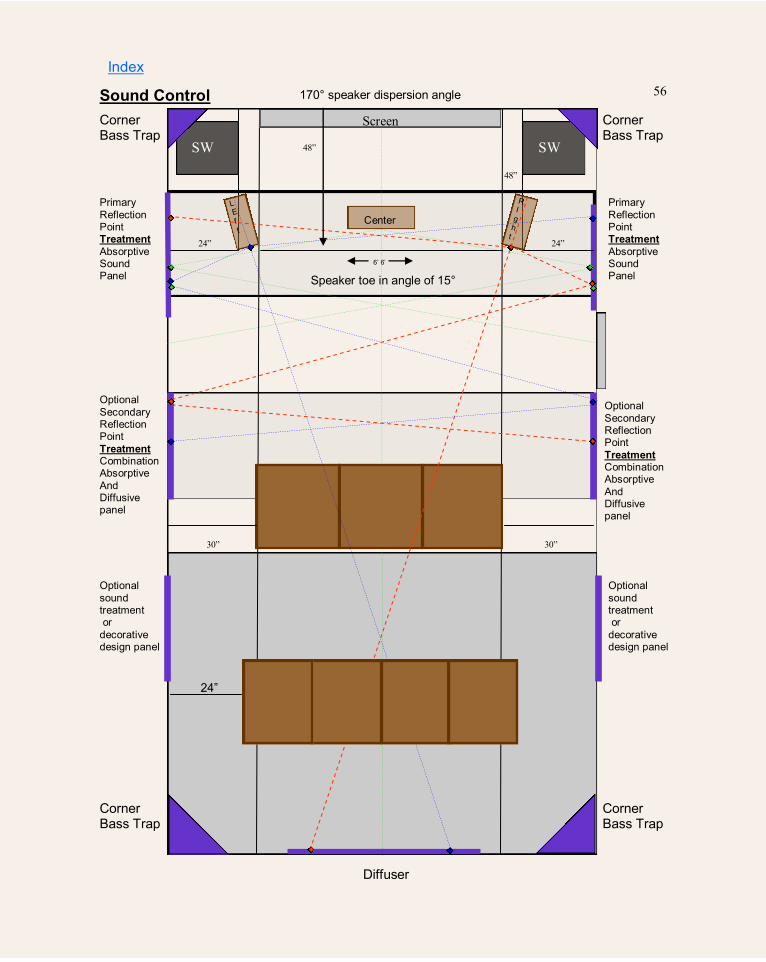
56
Primary
Reflection Point Treatment
Absorptive Sound Panel
Optional
Secondary Reflection Point
Treatment Combination Absorptive
And Diffusive panel
170° speaker dispersion angle
Speaker toe in angle of 15°
Index
Sound Control
6’ 6’
30” 30”
24” 24”
48”
48”
R I
g h
t
Screen
L
E
f
t
SW SW
Center
24‖
Primary
Reflection Point Treatment
Absorptive Sound Panel
Optional
Secondary Reflection Point
Treatment Combination Absorptive
And Diffusive panel
Corner Bass Trap
Corner Bass Trap
Diffuser
Corner Bass Trap
Corner Bass Trap
Optional
sound treatment or
decorative design panel
Optional
sound treatment or
decorative design panel
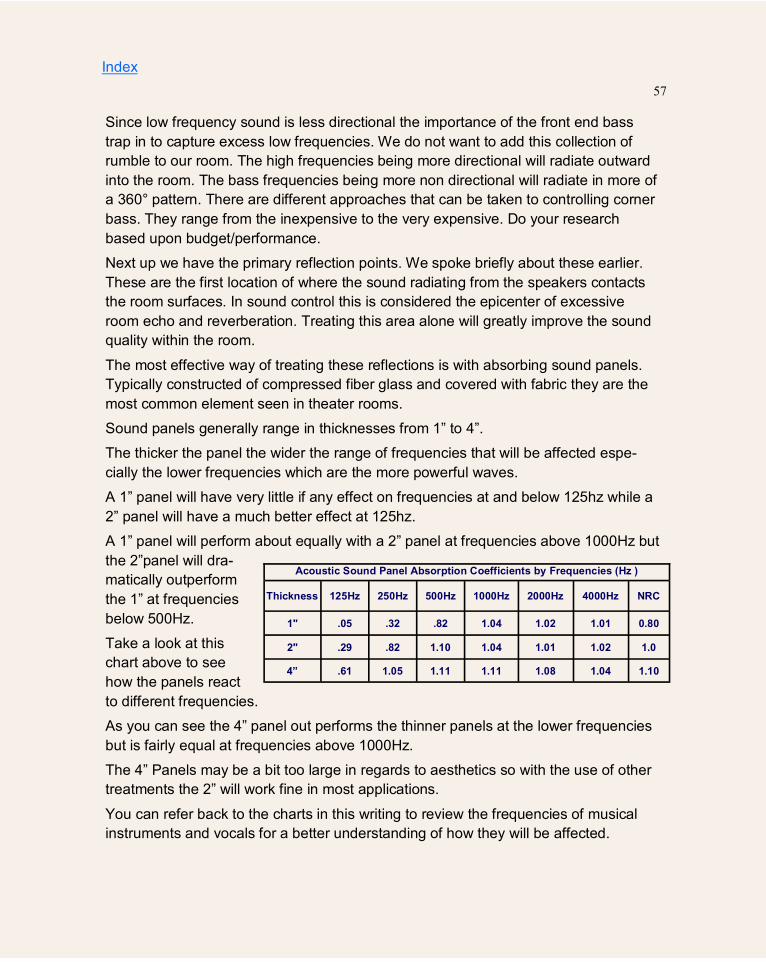
57
Since low frequency sound is less directional the importance of the front end bass
trap in to capture excess low frequencies. We do not want to add this collection of
rumble to our room. The high frequencies being more directional will radiate outward
into the room. The bass frequencies being more non directional will radiate in more of
a 360° pattern. There are different approaches that can be taken to controlling corner
bass. They range from the inexpensive to the very expensive. Do your research
based upon budget/performance.
Next up we have the primary reflection points. We spoke briefly about these earlier.
These are the first location of where the sound radiating from the speakers contacts
the room surfaces. In sound control this is considered the epicenter of excessive
room echo and reverberation. Treating this area alone will greatly improve the sound
quality within the room.
The most effective way of treating these reflections is with absorbing sound panels.
Typically constructed of compressed fiber glass and covered with fabric they are the
most common element seen in theater rooms.
Sound panels generally range in thicknesses from 1‖ to 4‖.
The thicker the panel the wider the range of frequencies that will be affected espe-
cially the lower frequencies which are the more powerful waves.
A 1‖ panel will have very little if any effect on frequencies at and below 125hz while a
2‖ panel will have a much better effect at 125hz.
A 1‖ panel will perform about equally with a 2‖ panel at frequencies above 1000Hz but
the 2‖panel will dra-
matically outperform
the 1‖ at frequencies
below 500Hz.
Take a look at this
chart above to see
how the panels react
to different frequencies.
As you can see the 4‖ panel out performs the thinner panels at the lower frequencies
but is fairly equal at frequencies above 1000Hz.
The 4‖ Panels may be a bit too large in regards to aesthetics so with the use of other
treatments the 2‖ will work fine in most applications.
You can refer back to the charts in this writing to review the frequencies of musical
instruments and vocals for a better understanding of how they will be affected.
Index
Acoustic Sound Panel Absorption Coefficients by Frequencies (Hz )
Thickness 125Hz 250Hz 500Hz 1000Hz 2000Hz 4000Hz NRC
1" .05 .32 .82 1.04 1.02 1.01 0.80
2" .29 .82 1.10 1.04 1.01 1.02 1.0
4” .61 1.05 1.11 1.11 1.08 1.04 1.10

58
We have learned in this writing that the lower the frequency the more energy it con-
tains. That translates into the need for thicker better performing low frequency panels
to control the sound. A 1‖ panel does not offer the absorption that I feel is necessary
to have a positive effect on frequencies below 500Hz.
The carpet, chairs, drapery and
even people will also absorb
sound. But in most cases will
not be enough to achieve a
great sounding room. So we
start with our primary reflection
points. Keep in mind that we
have primary reflection points
on the walls, the floor and the ceiling. Using a high density fiber count carpet would
be the best choice for floor reflections. That is unless you want to lay a 2‖ panel in the
middle of the room. In regards to the ceiling most times it is not practical to place ceil-
ing panels. Also depending on the ceiling height and the sound dispersion from the
speakers it may not be necessary. Some speakers are designed to limit vertical dis-
persion so the effect may be limited by those factors. I would not sweat it.
As mentioned earlier I prefer the 2‖ panels for their effectiveness on the lower fre-
quencies.
The next point up would be secondary reflection points. If we used the 2‖ and prop-
erly placed our primary panels the secondary points become much less important.
Looking at the absorption chart we see that the 2‖ panels will absorb most if not all
frequencies above 250Hz. They also become more difficult to pin point as the reflec-
tion of the sound waves interacting with the primary panels may be altered.
At this location in the room I prefer the use of Diffusers or possibly the Absorber/
Diffuser combination panels.
Adding diffuser panels to the side and rear wall will break up reflections without ab-
sorbing them. They are an excellent complement to sound absorption and are effec-
tive at reducing distinct echoes and reflections while not over deadening the room.
The Diffusers causes the sound energy to be broken up and radiated in many direc-
tions. The diffusion of sound reflections greatly improves sound quality and consis-
tency for the listener. Diffusion will keep the sound waves from grouping which will
add a sense of openness and space to the room. It will also help in eliminating hot
spots along with nulls/voids improving the tonal quality of the space.
Index
Examples of Sound Panel Designs from Kinetics Home Theatre
59
Ok so you made through three out of the four elements. I’m happy you are still with
me. It means you are serious about getting the best result for your Theatre Room.
I’ve spoken about Room Dimensions, Sound Containment and Sound Control.
I sincerely hope the information I provided in my book has or will help you towards
your goal of a quality theater room.
Now you are ready to go at it armed with a ton of useful information and most impor-
tantly the knowledge to ensure you achieve your goal.
The fourth element is the most personal but just as important as the previous items
we discussed. Whether you prefer a Grand Palace Theatre or a simple Family Room
approach the choices are limitless. With the assistance of a Professional Theatre In-
terior Specialist (Perfect Harmony Designs) the results are sure to provide your family
many years of great Home Entertainment. There are many items that need to be de-
cided upon to achieve the results you desire for your room. Obliviously the first item to
be decided is the decorating budget. Theatre rooms can range in price from $20, 000
to well over $100,000 depending upon the amount and quality of the items you de-
sire. It is essential to start with an overall plan. Laying out the room décor on a simple
floor plan is the place to start. One of the most important choices would be of course
the chairs. They come in many shapes, sizes, fabric or leather, motorized, heat mas-
sage, recliner or incliner, lounger. I think you get the point. Blending all the Interior
Elements together definitely requires proper research and planning. Choices of Fab-
rics, Patterns, Wood Work, Curtains or Draperies require the guidance of a profes-
sional like Perfect Harmony Designs. That is the subject of another writing. .
In book two, which is coming soon, I will cover interior room design. It will cover floor
plans, seating layouts, site lines, theater screens, projector placement and much
more.
I hope this gives you a good understanding of the importance of the Room Design in
achieving superior results for your Theatre Room. I thank you for investing your time
in reading my book. I know you’ll be better off for your effort.
J. Joseph Lupo
Index

60
LISTENING ROOM ACOUSTICS republished from the Revel Speaker website, revelspeakers.com.
Listening rooms have a profound impact on sound, particularly at lower frequencies. In fact, listening rooms can dominate the sound below about 400 Hz. Ideally, listening rooms would have optimized dimensions to minimize the effects of room resonances. But in reality, most listening rooms are not designed to enhance loudspeaker perform-ance. The interaction between loudspeakers and listening rooms is complex, depending on two important determinants that affect the loudspeaker and the listener. 1. Surfaces and other boundaries often cause large peaks and dips in low-frequency response. These peaks and dips often reach ranges of 12 dB or more. 2. Standing waves (also known as room modes or resonances) interact with both the loudspeaker and the listener locations, resulting in large fre-quency response errors. Unfortunately, there is no simple solution that considers both factors. Even computer software programs that examine one or both factors may not calculate proper primary listening position or loudspeaker placement values. ACOUSTIC TREATMENT MATERIALS
As previously mentioned, the Gem2 Loudspeakers utilize high-order networks which optimize both the on-axis and off-axis response. Their optimized response minimizes sonic degradation that can occur in overly ―live‖ rooms. Placing minimal acoustic treat-ment materials at primary reflection points will reduce these distortions even further. Ideally, acoustic absorbers should be placed at the first reflection points on the front and side walls and either acoustic absorbers or diffusers should be placed at the first reflection point on the rear wall.
Index
Quick Note about Speakers Below and on the following page is some good information from two top quality speaker manufactures. When you are ready to select your speakers I suggest you visit their websites for some valuable information on speaker construction and performance. I’m sure other manufacturers have some good info also. Do your research for your price range and room requirements.

61
What is Coloration?
republished from the Paradigm Speaker website, paradigm.com.
Every material resonates when struck or activated. This is how different materials, or for that matter musical instruments, make their identifiable sounds or tones. Speakers should be neutral, having no identifiable sound of their own, but speakers are prone to resonances that color or alter the sound–these are un-wanted and must be eliminated. In the same way the tint in a pair of sunglasses colors what you see, unwanted resonances color what you hear. They impose themselves on vocals and instrumental sounds being reproduced ( see chart). Coloration compro-mises fidelity and hampers imaging by blending sounds together. Speakers with low coloration are timbrally accurate–they faithfully represent the timbre or distinctive char-
acter of every sound it reproduce.
The fundamentals of natural sound travel uniformly in all directions – a piano, for ex-
ample, distributes sound throughout a room.
Our hearing favors speakers that reproduce sound in the same way. Wide-dispersion speakers sound more real because they too fill the room. Limited-dispersion speakers
seem less realistic because they beam, or project sound into only one area.
Wide dispersion throughout a speaker’s bandwidth is difficult to achieve. Most high-frequency and bass/midrange drive units have good dispersion at the lower limits of their frequency range, but they naturally start to beam as they reach their upper-frequency limits. With high-performance high-frequency drivers beaming occurs be-yond audibility. Beaming from midrange drivers, however, occurs within the audible range. Speakers with beaming problems will not sound the same in all areas of a room. They may sound balanced in one area, but nasal, dull, or even harsh and shrill in other
areas.
Midrange beaming can be reduced by lowering the crossover frequency. The high-frequency driver’s lower range will then provide wider dispersion and the bass/
midrange driver’s output can be rolled off before its dispersion narrows.
This is an effective approach but requires the use of a high-frequency drivers that can handle the vast amounts of power it takes to reproduce these frequencies. This driver must be very robust and as a consequence, will be expensive to produce. Many speaker companies are unwilling to incur the cost of building high-power high-
frequency drivers, thus not all speakers have uniformly wide dispersion.
A crossover is a network of electrical devices that divides the audio signal into sepa-rate frequency bands and directs them to the individual speaker drivers. The frequency
at which it does this is called the crossover frequency, or crossover point.
In order to protect a delicate high-frequency driver from damage, many speaker com-panies will set their crossovers quite high. Unfortunately, this encourages midrange
beaming
Speakers with more robust high-frequency drivers and lower crossover points do not
suffer from beaming problems – they disperse sound uniformly and widely
Index

62
Index
National Research Council Can-ada Institute for Research in Con-struction Acoustics Laboratory 1200 Montreal Road, Ottawa, Ontario K1A 0R6 Tel: 613-993-2305 Fax: 613-954-1495
PREPARED BD
David M. Berg Orfield Laboratories, Inc. 2709 East 25th Street Minneapolis MN 55406 Voice: (612) 721-2455 FAX: (612) 721-2457 email: [email protected]
Republished from Wikipedia.
Viscoelasticity is the property of materials that exhibit both viscous and elastic characteristics when undergoing deformation. Viscous materials, like honey, resist shear flow and strain linearly with time when a stress is applied. Elastic materials strain instantaneously when stretched and just as quickly return to their original state once the stress is removed. Viscoe-lastic materials have elements of both of these properties and, as such, exhibit time depend-ent strain. Whereas elasticity is usually the result of bond stretching along crystallographic planes in an ordered solid, viscoelasticity is the result of the diffusion of atoms or molecules inside an amorphous material.
Return to previous

63
STC Ratings Of Common Wall Structures Ratings are Measured at Frequencies from 125Hz to 4000Hz
STC Rating
5/8‖ Gypsum Drywall 2x4 Construction Drywall Both Sides 34
5/8‖ Gypsum Drywall 2x4 Construction Drywall Both Sides with Fiberglass Insulation 36
5/8‖ Gypsum Drywall One Side, Double 5/8‖ Drywall Other Side, 2x4 Construction 37
5/8‖ Gypsum Drywall One Side, Double 5/8‖ Drywall Other Side, 2x4 Construction with
Fiberglass Insulation 39
4‖ Concrete Block Wall 40
4‖ Concrete Block Plastered on both sides 48
8‖ Concrete Block Wall 45
8‖ Concrete Block Plastered on both sides 56
Staggered Wall Using 2x6 Plate and 2x4 Construction 5/8‖ Gypsum Both Sides without
Fiberglass Insulation 42
Staggered Wall Construction using 2x6 Plates and 2x4 Construction 5/8‖ Gypsum Both Sides with Fiber-
glass Insulation. Attaining full STC52 Requires Walls Constructed to ensure they are truly independent. Any connections between walls will reduce STC
46-52
Double Wall Construction Using Independent 2x4 plates Separated, 2x4Construction 5/8‖ Gypsum Both
Sides with 9‖ Fiberglass Insulation 58
Mass Loaded Vinyl/Sound Cor 1 pound per square ft 27
Mass Loaded Vinyl/Sound Cor 1 pound per square ft with Single Stud 2x4, 5/8‖ drywall and Fiberglass Insulation
43
Mass Loaded Vinyl/Sound Cor 1 pound per square ft with Double Wall Construction Using Independent
2x4 plates Separated, 2x4 Steel Stud Construction with 9‖ Fiberglass Insulation NOTE: This STC claim seems very optimistic I would need to see the actual test data.
66
QuietRock 525 Ceramic Polymer Gypsum 5/8‖ One Side, 5/8‖ Drywall Other Side, 2x4 Stud Construc-
tion, Fiberglass Insulation 51
QuietRock 525 Ceramic Polymer Gypsum 5/8‖ One Side, 5/8‖ Drywall Other Side, 2x4 Steel Stud Con-
struction, Fiberglass Insulation 55
QuietRock 525 Ceramic Polymer Gypsum 5/8‖ Both Sides, 2x4 Stud Construction, Fiberglass Insulation 55
Staggered Wall Construction using QuietRock 525 Ceramic Polymer Gypsum 5/8‖ One Side, 5/8‖ Dry-
wall Other Side, 2x4 Stud Construction, Fiberglass Insulation 56
Double Wall Construction Using Independent 2x4 plates Separated, 2x4Construction with 9‖ Fiberglass Insulation, QuietRock 525 Ceramic Polymer Gypsum 5/8‖ One Side, 5/8‖ Drywall Other Side
61
Green Glue viscoelastic material Double Gypsum 5/8‖ One Side, Double 5/8‖ Drywall Other Side, 2x4
Stud Construction 24‖ OC , Fiberglass Insulation R13 56
Green Glue viscoelastic material Double Gypsum 5/8‖ Both Sides, 2x4 Steel 25gauge 24‖ OC , Fiber-
glass Insulation R13 59
Staggered Wall Construction using 2x6 Plates and 2x4 Construction QuietRock 545 THX Certified
Both Sides with Fiberglass 68
Double Wall Construction Using Independent 2x4 plates Separated, 2x4Construction QuietRock 545
THX Certified Both Sides with 9‖ Fiberglass Insulation 75
Double Wall Construction Using Independent 2x4 plates Separated, 2x4Construction Double Layer
QuietRock 545 THX Certified Both Sides with 9‖ Fiberglass Insulation 80
Kinetics Noise Control Resilient IsoMax System
Double 5/8‖ Drywall IsoMax Drywall Furring Channel 2x4 Wood Studs 16‖ OC R19 Fiber Glass Double 5/8‖ Drywall other side
64
Index