ebi research methods - amazon s3s3.amazonaws.com/zanran_storage/environmental... · environmental...
TRANSCRIPT

Environmental Industry Research Methods of EBI, Inc.
© 1997 Environmental Business International, Inc. (San Diego, CA, USA) Page 1
EBI Market andIndustry ResearchMethods
ENVIRONMENTAL BUSINESS INTERNATIONAL, INC.
Prepared byDan Noble, VP Director of ResearchEnvironmental Business International, Inc.San Diego, CAhttp://www.ebiusa.com • [email protected]

Environmental Industry Research Methods of EBI, Inc.
© 1997 Environmental Business International, Inc. (San Diego, CA, USA) Page 2
Contents
1. OVERVIEW..........................................................................................3
2. DEFINITIONS AND CLASSIFICATION.......................................................4
2.1. INDUSTRY DEFINITION ...................................................................................................... 42.1.1 Current Definition of the Industry ......................................................................... 42.1.2 Extending the Current Definition ........................................................................ 10
2.2. INFORMATION CONSISTENCY............................................................................................ 112.3. INDUSTRY IN TRANSITION ................................................................................................ 12
3. ELEMENTS OF EBI’S MARKET RESEARCH METHOD ................................ 14
3.1. COMPANY DATABASES.................................................................................................... 163.2. SURVEY INSTRUMENTS.................................................................................................... 163.3. RESPONSE DATA COMPILING ............................................................................................ 173.4. MARGIN ANALYSIS MODELING ........................................................................................ 17
3.4.1. Gross Revenue Data........................................................................................ 173.4.2. Service/Product Analysis ................................................................................ 173.4.3. Analysis by Environmental Media Type ............................................................. 183.4.4. Analysis by Client Type................................................................................... 183.4.5. Public vs. Private Entities ................................................................................ 19
3.5. DATA ELEMENTS NOT CAPTURED IN THIS METHOD .............................................................. 203.5.1 Buying Pattern, or Buy Side Analysis................................................................... 203.5.2 Government Data on Cost of Environmental Expenditures ...................................... 22
4. FURTHER DATA NEEDS ...................................................................... 24
4.1. MORE DATA ON THE TRADITIONAL ENVIRONMENTAL INDUSTRY SEGMENTS............................. 244.1.1. United States Environmental Industry Data ......................................................... 244.1.2. Primary Environmental Industry Data-Worldwide................................................ 25
4.2. ELEMENTS, DEFINITIONS AND METHODS FOR TRACKING INDUSTRY SUSTAINABILITY ................. 264.2.1 Elements and Definitions................................................................................... 264.2.2 Methods for Data Gathering ............................................................................. 27
5. APPENDIX ........................................................................................ 29
5.1. ENVIRONMENTAL INDUSTRY SEGMENTS AND SIC CODE CORRELATIONS ................................. 295.2. EXAMPLE SURVEY INSTRUMENTS...................................................................................... 315.3. SURVEY DATABASE STRUCTURE ........................................ ERROR! BOOKMARK NOT DEFINED.5.4. MATERIALS CONNECTIONS BETWEEN INDUSTRIES WITH HIGH ENVIRONMENTAL EXPENDITURE
COSTS (TOWARD A CIRCULAR ECONOMIC MODEL) ...................... ERROR! BOOKMARK NOT DEFINED.

Environmental Industry Research Methods of EBI, Inc.
© 1997 Environmental Business International, Inc. (San Diego, CA, USA) Page 3
1. Overview
Environmental Business International, Inc. (EBI) is a strategic market research, publishingand consulting firm devoted to the environmental products and services industry. EBI ispublisher of the leading business publication on the industry, the Environmental BusinessJournal, founding this publication in Fall of 1988. EBI maintains extensive databases andpersonal industry contacts of thousands of companies actively engaged in doing business inthis industry, both in the United States, as well as worldwide. The company has becomerecognized as the industry leader in defining and providing strategic intelligence and contactswithin and for this industry, both on the sell-side (environmental product and service vendors)as well as the customer or buy-side (polluting industries and municipalities, the so-called“regulated community”).
EBI has thousands of subscribers to its publications and has worked on hundreds of projectswith presidents and business development managers of start-ups to fortune 50 firms doingbusiness in the environmental industry. The EBI research staff has also worked with variousgovernment agencies to provide market intelligence and industry briefings (e.g. the U.S. EPA,the U.S. DOC, the United Nations, the U.S. Agency for International Development, etc.). Inaddition, EBI principals have performed numerous introductions for the purposes offinancing, strategic partnerships or merger/acquisition relationships between environmentalfirms and the development of public/private partnerships and project finance.
As part of this ongoing work, EBI employs a full time market research, editorial andconsulting staff of 15 people. The EBI research staff is continuously engaged in performingprimary and secondary business and market intelligence research. Secondary research isfairly standard–review of published material, i.e. books, reports, publications and databases(both hardcopy and electronic, via the internet). However, it is the ongoing primary researchthat sets EBI apart from all other publication, research or consulting companies in thisindustry.
This brief paper explains in some detail the methods used by EBI to arrive at itsindustry/market size estimates, i.e. its primary research methodology.

Environmental Industry Research Methods of EBI, Inc.
© 1997 Environmental Business International, Inc. (San Diego, CA, USA) Page 4
2. Definitions and Classification
Before anything can be measured, the entities and units of measure must be clearly defined.In the study of markets and economics the standard unit of measure is U.S. dollars, or thecurrency of the particular country in question times the current exchange rate at the time, andfor the particular country of interest. However, the definition of entities is not so straightforward and has been an ongoing issue in the measurement of environmental industry activityever since EBI has been studying this business. The discussion in this section provides acurrent synopsis of definition and classifications of this industry.
2.1. Industry Definition
2.1.1 Current Definition of the Industry
2.1.1.1 IntroductionThe following section presents a definition, segmentation and business overview of the U.S.environmental industry. EBI has been analyzing and tracking the environmental industrysince 1987 and was the first to define the industry in its monthly publication, EnvironmentalBusiness Journal. In the absence of any Standard Industry Classification (SIC) codes forenvironmental companies, EBI’s segmentation and quantification of the environmentalindustry has been adopted by the U.S. Department of Commerce (USDOC) and numerousother government and private sector sources. A current best correlation between the EBIdefined business sectors and the U.S. SIC code numbers is provided in Appendix 5.1.
Each segment in this review is characterized in terms of the range of products and servicesoffered, the size of the market, including historical and projected growth and the approximatenumber of companies participating in the segment. Some of the revenues listed for firms areestimates based on data provided by the company and EBI’s analysis. EBI has made everyreasonable effort to be accurate and any errors or omissions are unintentional.
2.1.1.2 Definition of the Environmental IndustryEBI defines the environmental industry as all revenue generation associated withenvironmental assessment, compliance with environmental regulations, pollution control, wastemanagement, remediation of contaminated property and the provision and delivery ofenvironmental resources. The U.S. environmental industry represents total 1994 revenues of$170 billion, generated by nearly 114,000 companies in the United States. The globalenvironmental industry is in the order of $408 billion annually. The breakdown of thenumber of companies (and/or public entities) in the U.S. is shown in Exhibit 2-1.
Within the scope of this definition, EBI has identified fourteen segments of business activityin the environmental industry (summarized and discussed in detail below), which it dividesinto three broad categories: services, equipment and resources. These segments are neitherclassifications of environmental problems in a media sense, such as air pollution or solidwaste, nor are they market segments centered around solutions like the cleanup ofcontaminated sites that typically involve the contributions of many types of companies. EBI'senvironmental industry segments are classifications of types of businesses from theperspective of what the companies themselves typically offer along the lines of the SICsystem, whether it be engineering services or environmental laboratory services relating to anynumber of environmental problems, or specific equipment manufacturers, or resourceproviders.

Environmental Industry Research Methods of EBI, Inc.
© 1997 Environmental Business International, Inc. (San Diego, CA, USA) Page 5
Exhibit 2-1 Environmental Industry Segments and Numbersof U.S. Companies/Public Entities
Environmental Industry SegmentNumber ofCompanies
ServicesAnalytical Services 1,400Water Treatment Works 27,000Solid Waste Management 5,900Hazardous Waste Management 2,500Remediation / Industrial Services 3,800Environmental Consulting & Engineering 5,900EquipmentWater Equipment & Chemicals 2,600Instruments & Information Systems 500Air Pollution Control Equipment 800Waste Management Equipment 2,000Process & Pollution Prevention Equipment 300ResourcesWater Utilities 58,000Resource Recovery 2,000Alternative & Renewable Energy 600
Source: Environmental Business International Inc. (San Diego, Calif.)
Market size numbers presented in the following analysis are in terms of revenues generatedby public- and private-sector entities and not total expenditures made by buyers. As anillustration, a chemical company or municipal government may account for $200 million inenvironmental expenditures, but not all of this results in revenues for vendors ofenvironmental products and services. Whereas in some segments this portion of“outsourced” expenditures is high (such as specialized equipment or remediation ofcontaminated sites) in other areas it is considerably lower (water quality testing or pollutionprevention design services).
It is important to note that EBI does count some public sector revenues as part of theenvironmental industry. Traditional municipal services like water delivery, water treatment andgarbage collection are gradually being privatized in the United States, though not to the extentthat these services (especially water) have been privatized in countries such as France and theUnited Kingdom. These basic services also represent the majority of environmental businessopportunities in the developing world in the next 20 years, so it is important not to underemphasize them. Municipalities in the water utility segment (roughly 85%) and the solidwaste management segment (roughly 33%) account for considerable revenues, but theremainder of industry is in the private sector.

Environmental Industry Research Methods of EBI, Inc.
© 1997 Environmental Business International, Inc. (San Diego, CA, USA) Page 6
2.1.1.3 Environmental Industry SegmentsThe table below briefly describes EBI’s 14 environmental business segments.
Exhibit 2-2 Environmental Industry Segments
Segment Description Examples of ClientsEnvironmental ServicesEnvironmental Testing &Analytical Services
Provide testing of “environmentalsamples” (soil, water, air and somebiological tissues)
Regulated industries, Gov’t,Environmental consultantsHazardous waste and remediationcontractors
Water Treatment Works Management and operation ofwastewater treatment plants
Households, Commercial firmsand All industries
Solid Waste Management Collection, processing and disposalof solid waste
Municipalities & All industries
Hazardous Waste Management Manage on-going hazardous wastestreams, medical waste, nuclearwaste handling
Chemical companiesPetroleum companiesGovernment agencies
Remediation/IndustrialServices
Physical cleanup of contaminatedsites, buildings and environmentalcleaning of operating facilities
Government agenciesProperty ownersIndustry
Environmental Consulting &Engineering (C&E)
Engineering, consulting, design,assessment, permitting, projectmanagement, O&M, monitoring,etc.
Industry, GovernmentMunicipalitiesWaste Mgmt. companies
Environmental EquipmentWater Equipment &Chemicals
Provide equipment, supplies andmaintenance in the delivery andtreatment of water
Municipalities & All industries
Instrument Manufacturing Produce instrumentation for theanalysis of environmental samples
Analytical services, Gov’tRegulated companies
Air Pollution ControlEquipment
Produce equipment and tech. tocontrol air pollution
Utilities, Waste-to-energyIndustries
Waste ManagementEquipment
Equipment for handling, storing ortransporting solid, liquid or haz.waste. Includes info systems.
MunicipalitiesGenerating industriesSolid waste companies
Process & PreventionTechnology
Equipment and technology for in-process (rather than end-of-pipe)pollution prevention and treatment
All industries
Environmental ResourcesWater Utilities Selling water to end users Municipalities & All industriesResource Recovery Selling materials recovered and
converted from industrial by-productsor post-consumer waste
MunicipalitiesGenerating industriesSolid waste companies
Environmental EnergySources
Selling power and systems in solar,wind, geothermal, small scale hydro,energy efficiency and DSM
UtilitiesAll industries and consumers
Source: Environmental Business International Inc. (San Diego, Calif.)

Environmental Industry Research Methods of EBI, Inc.
© 1997 Environmental Business International, Inc. (San Diego, CA, USA) Page 7
History of the Environmental IndustryThe environmental industry has its roots in sanitary engineering and waste management,dating back to the 1800s. In 1970, with the birth of the Environmental Protection Agency asthe acting arm of the National Environmental Protection Act, the environmental industry wasgiven new coherence and impetus. During this formative era, environmental priorities tendedto be those that the public could see, smell and touch, like garbage and sewage, which relatedto the industry’s origins, but also included new areas like air pollution. These solutionsusually involved large capital projects and central public sector involvement. Landmarklegislation later launched a toxics or hazardous waste era that focused more on a “polluterpays” approach, stimulating more revenue contribution from industry.
From modest beginnings, the environmental industry has grown from less than $20 billion in1970 to $170 billion today. It has recently been recognized as a valuable and vital part of theeconomy, responsible for almost 3% of GNP and employment of more than 1.2 millionpeople in the United States in 1994.
Exhibit 2-3 Historical and Projected Size of U.S.Environmental Industry
$Millions
0
20,000
40,000
60,000
80,000
100,000
120,000
140,000
160,000
180,000
1970 1975 1980 1985 1990 1995 2000 2005 2010
Source: Environmental Business International Inc. (San Diego, Calif.)
Having grown in excess of 15% per year during the hazardous waste era in the late 1980s, theenvironmental industry slowed to 10% growth in 1990, 2% in 1991, 4% in 1992, 3% in 1993,and 6% in 1994.

Environmental Industry Research Methods of EBI, Inc.
© 1997 Environmental Business International, Inc. (San Diego, CA, USA) Page 8
Exhibit 2-4 Recent Growth in Environmental IndustrySegments
Environmental Revenues and Growth ($ Billions)Industry Segment 1990 89-90
Growth 1991 90-91Growth 1992 91-92
Growth 1993 92-93Growth 1994 93-94
Growth
ServicesAnalytical Services 1.5 6% 1.6 1% 1.6 3% 1.6 0% 1.6 2% Water Treatment Works 19.8 8% 20.7 5% 21.7 5% 23.4 8% 25.7 10%Solid Waste Management 26.1 8% 27.0 3% 28.2 4% 29.4 4% 31.0 5%Hazardous Waste Management 6.3 11% 6.4 2% 6.6 4% 6.5 -2% 6.4 -1%Remediation/Industrial Services 8.5 4% 7.9 -7% 8.2 4% 8.4 3% 8.6 2%Consulting & Engineering 12.5 19% 13.5 8% 14.23 6% 14.6 2% 15.3 5%EquipmentWater Equipment and Chemicals 12.1 3% 12.5 3% 13.0 4% 13.2 2% 13.5 2%Instrument Manufacturing 2.0 21% 2.3 15% 2.6 12% 2.7 6% 2.9 5%Air Pollution Control Equipment 10.7 8% 10.9 3% 11.2 2% 11.5 3% 11.7 2%Waste Management Equipment 10.4 6% 10.8 4% 11.1 3% 10.9 -2% 11.2 3%Process & Prevention Technology 0.4 37% 0.5 22% 0.6 20% 0.7 14% 0.8 11%ResourcesWater Utilities 19.8 5% 21.0 6% 21.9 4% 23.1 6% 24.2 5%Resource Recovery 13.1 9% 12.0 -8% 12.2 2% 13.3 9% 15.4 16%Environmental Energy Sources 1.8 11% 1.9 7% 2.0 5% 2.1 5% 2.2 7%Total Industry: 145.0 8% 149.0 3% 155.1 4% 161.3 4% 170.4 6%
Source: Environmental Business International Inc. (San Diego, Calif.)
The environmental industry now certainly displays the characteristics of a maturing industryin the United States, Western Europe and Japan, such as decelerating growth, heightenedcompetition, growing sophistication among its client base, greater emphasis on marketing, etc.Beyond facing the challenges of a maturing industry, however, environmental companiessuffered a difficult stage of regulatory uncertainty in the U.S. in 1991-1993. Government sentan important direct and indirect message that environmental quality would take a back seat toeconomic growth. The Bush Administration established the Competitiveness Council thatsought, among other things, to gut the Clean Air Act Amendments passed in 1990. Itannounced a “moratorium on new regulations” for the sake of improving the economy.
Ironically, the transition to the Clinton Administration was even worse for the environmentalindustry. Signs of uncertainty within the government only led to further postponements andcancellations of environmental projects by the regulated community. But by far the mostimportant cause of the collapse of environmental industry growth was the recession. A badeconomy exposed how truly discretionary most environmental spending was. What was oncepromoted by Wall Street and others as a recession-proof industry was revealed as recessionprone.
Even as recession subsided and regulatory uncertainty has cleared up to some extent, theenvironmental industry will never again experience the boom of an emerging market in theU.S. Current EBI projections for industry growth are from $170 billion in 1994 to over $207billion by 2000, reflecting average composite annual growth of 3-5%.

Environmental Industry Research Methods of EBI, Inc.
© 1997 Environmental Business International, Inc. (San Diego, CA, USA) Page 9
Exhibit 2-5 Projected Growth in the U.S. EnvironmentalIndustry
EnvironmentalAverageAnnualGrowth Revenues and Growth ($ Billions)
Industry Segment ‘94-’99 1994 1995 1996 1997 1998 1999Environmental ServicesAnalytical Services 3% 1.6 1.7 1.8 1.8 1.9 1.9Water Treatment Works 5% 25.7 27.3 28.9 30.5 32.0 33.6Solid Waste Management 4% 31.0 32.3 33.7 35.0 36.4 37.7Hazardous Waste Management -3% 6.4 6.3 6.1 5.9 5.8 5.6Remediation/Industrial Services 3% 8.6 8.9 9.2 9.6 9.9 10. 2Consulting & Engineering 5% 15.3 16.1 17.0 17.9 18.6 19.3Environmental EquipmentWater Equipment and Chemicals 4% 13.5 14.2 15.0 15.7 16.4 17.1Instruments & Information System 6% 2.9 3.0 3.2 3.3 3.5 3.6Air Pollution Control Equipment 2% 11.7 12.0 12.2 12.5 12.7 12.9Waste Management Equipment -1% 11.2 11.4 11.4 11.4 11.2 10.9Process & Prevention Technology 14% 0.8 0.9 1.0 1.2 1.3 1.5Environmental ResourcesWater Utilities 4% 24.2 25.3 26.5 27.6 28.8 30.0Resource Recovery 5% 15.4 16.4 17.4 18.4 19.3 20.1Environmental Energy Sources 9% 2.2 2.4 2.6 2.8 3.0 3.2Total United States Market 170.4 178.2 185.9 193.6 200.9 207.7
Source: Environmental Business International Inc. (San Diego, Calif.)
Soon after the turn of the century, however, environmental industry revenues, particularly inthe most regulatory driven segments (pollution control, hazardous waste management and siteremediation), are expected to decline. Beyond showing all the classic signs of a maturingindustry as mentioned, these segments face the fundamental long-term challenge that theenvironmentally negligent and resource-rich environment that created much of its revenueopportunity will no longer exist. We are no longer creating Superfund sites at the rate we did;we no longer use asbestos, each new manufacturing or industrial facility is now designed withmaterial efficiency and pollution prevention in mind.
Historical and projected growth for the entire environmental industry are presented in thegraph below, divided into three major categories. Resource segments already exert astabilizing influence on the environmental industry, with their influence no doubt increasing inthe future. Delivery of clean water, recovery of used materials and alternative energy eachcarry the promise of sustainable growth, whereas many of the cleanup and control sectors inservice and equipment categories face a soberingly finite life cycle.

Environmental Industry Research Methods of EBI, Inc.
© 1997 Environmental Business International, Inc. (San Diego, CA, USA) Page 10
Exhibit 2-6 Relative Historical and Projected Growth in theEnvironmental Industry
0
20
40
60
80
100
120
140
160
180
70 75 80 85 90 95 00 05 10
$Billions
Resource Revenue
Equipment Revenue
Service Revenue
Source: Environmental Business International Inc. (San Diego, Calif.)
This more exhaustive analysis of the United States environmental industry, included in thissection, highlights a number of important points that should be observed when viewing theinternational data contained in studies published by EBI.
• Solid waste (including recycled scrap sales) comprises almost one-third (~28%) ofthe market
• Water and wastewater (including delivery, treatment and equipment) comprises overone-third (~38%) of the market
• Air pollution control, analytical services, consulting services, remediation, hazardouswaste management renewable energy production make up the other third.
While these conclusions don't hold precisely for all countries or regions in the world, theynevertheless form a broad outline for what can be expected to occur as an economy develops.
2.1.2 Extending the Current Definition
The discussion on the environmental industry definition continues to evolve. The areasdiscussed above have been the basis of all of EBI’s market and industry analysis to date.However, the Organization of Economic Cooperation and Development (OECD) incooperation with the statistical arm of the European Union (EUROSTAT) has engaged in theprocess of holding a series of meetings to address the issue of a global definition for theenvironmental industry. The OECD/EUROSTAT “Informal Working Group on theEnvironment Industry” recently published a working document entitled “CommonDefinition and Classification of the Environment Industry for Data Collection. SynthesisReport.” Dan Noble, V.P. Director of Research for EBI, attended both working groupmeetings (October 14th & 15th, 1994 in Washington, DC and April 26th and 27th, 1995 inLuxembourg). The main extension, and changes to the definition from the industry,compared to EBI’s definition are twofold:
1. the exclusion of water delivery and resource recovery as “environmental industries,”which EBI does include in the “Resource” super-category, and
2. the inclusion of all construction costs related to environmental projects.These differences will need to be resolved throughout the course of future studies.
In addition, as discussed further in Section 2.3, the environmental industry finds itself in aprofound transition that should eventually lead toward an environmentally sustainableeconomy. This transition will fundamentally alter the way we view pollution generators and

Environmental Industry Research Methods of EBI, Inc.
© 1997 Environmental Business International, Inc. (San Diego, CA, USA) Page 11
have a deep and lasting impact on the environmental industry. This transition, which manysigns indicate has already begun, is an important, recurring theme throughout any industryanalysis. While the transition to sustainability will most certainly extend the current definitionof the environmental industry to something much more comprehensive, EBI’s work to datehas not attempted to define it or include it in the market estimates. However, due to theimportance and impact that this transition will have on the environmental industry and itsclients, the generators, the importance of extending the definition and tracking the transitioncannot be understated (see also "Bridge to a Sustainable Future," White House, April 1995,and Sections 2.3 of this monograph).
2.2. Information Consistency
The two major challenges in performing international market analyses and in drawingmeaningful conclusions from the data contained in them are:
• Segment or business activity definitions, and• Units of measure
It is clear that most published reports on the environmental industry as a whole and varioussubsegments are defined differently from those defined by EBI. Thus, strict comparisonsbetween data from different studies in different countries is not currently possible.Nevertheless, the data collected can provide strong indications of relative size of industries andmarkets in various countries.
One of the largest definitional problems observed in studies other than EBI’s is thecategorization of markets by the traditional environmental media type, i.e. air, water, solidwaste, etc. In many cases, aggregate values are provided that included services and productsof many business activities, e.g. analytical services, consulting, various products, etc. Thesecan often not be disaggregated into constituent business activities. In order to clarify thisissue, the following chart (Exhibit 2-7) illustrates how the various data accumulated by EBIfor the U.S. can be categorized by environmental media in addition to environmentalbusiness activity.

Environmental Industry Research Methods of EBI, Inc.
© 1997 Environmental Business International, Inc. (San Diego, CA, USA) Page 12
Exhibit 2-7 U.S. Environmental Markets by Media
1994-Environmental Business Sectors By MediaWater/ Hazardous Remed- Solid
Business Type Air Wastewater Waste iation Waste Other TOTALServicesAnalytical Services 84 375 336 602 137 67 1,600Wastewater Treatment Services 25,700 25,700Solid Waste Management 31,000 31,000Hazardous Waste Management 6,400 6,400Remediation/Industrial Services 8,600 8,600Consulting & Engineering 1,450 3,381 3,632 3,577 1,108 2,152 15,300
Subtotal Services: 1,534 29,456 10,367 12,779 32,244 2,219 88,600EquipmentWater Equipment and Chemicals 13,500 13,500Instrument Manufacturing 725 1,073 441 661 2,900Air Pollution Control Equipment 11,700 11,700Waste Management Equipment 3,140 1,100 6,960 11,200Process & Prevention Technology 800 800
Subtotal Equipment: 12,425 14,573 3,581 1,761 6,960 800 40,100ResourcesWater Utilities 24,200 24,200Resource Recovery 462 14,938 15,400Environmental Energy Sources 2,200 2,200
Subtotal Equipment: 0 24,200 0 462 14,938 2,200 41,800TOTAL ALL SEGMENTS: 13,959 68,229 14,410 14,540 54,142 5,219 170,500
Source: Environmental Business International, Inc. (San Diego, CA)
Significant variability of units of measure are found in studies other than EBI’s direct primaryresearch results. Typically the variance is due to the currency of the country in question. Tosolve the currency issue, every attempt is made to convert currency to U.S. dollars (USD) atan the exchange rate for the year in question when EBI is performing secondary researchanalysis on using other international research data. Primary international research of theenvironmental industry has not been performed and is discussed further in Section 4.1.2.
2.3. Industry In Transition
The U.S. and European environmental industries have precipitated a transition in pollutiongenerating companies an economic shift from end-of-pipe pollution control to more in-process pollution prevention. This transition is, in turn, making way for an even greater shiftin the fundamental economic structure toward more environmentally sustainable industrialpractices. The current U.S. Executive Administration defines this as a movement frompollution "measurement and assessment, " "remediation" and "control" to pollution"avoidance." To date, this transition has not been quantitatively measured. However, if thetraditional environmental industry, as defined in the above section, is put into this emergingframework, the following picture results (Exhibit 2-8).

Environmental Industry Research Methods of EBI, Inc.
© 1997 Environmental Business International, Inc. (San Diego, CA, USA) Page 13
Exhibit 2-8 U.S. Environmental Markets by Process Type
1994-Environmental Sectors By Process/Solution Segments
Environmental Monitoring & Remediation & 1994Business Segment Avoidance Assessment Control Restoration TotalServicesAnalytical Services 1.6 1.6Wastewater Treatment Services 25.7 25.7Solid Waste Management 31.0 31.0Hazardous Waste Management 6.4 6.4Remediation/Industrial Services 8.6 8.6Consulting & Engineering 1.5 5.2 5.0 3.5 15.3EquipmentWater Equipment and Chemicals 13.5 13.5Instrument Manufacturing 2.9 2.9Air Pollution Control Equipment 11.7 11.7Waste Management Equipment 1.1 7.8 2.2 11.2Process & Prevention Technology 0.8 0.8ResourcesWater Utilities 24.2 24.2Resource Recovery 15.4 14.7Environmental Energy Sources 2.2 2.2TOTAL INDUSTRY: 19.9 10.8 125.4 14.4 170.5
11.7% 6.3% 73.5% 8.4%
Source: Environmental Business International, Inc. (San Diego, CA)
Based on these new definitions, then, it is possible to begin to measure this transition.However, an attempt to measure this transition, makes more complex the measurement of thetraditional environmental industry. While the measurement of this transition is seen asimportant by the authors of this paper, it is only now just beginning to occur. It is possible,however, to use EBI’s preliminary work as a benchmark, a starting point, for attempting tomeasure the broader structural change from a predatory to a more sustainable economy. Thisbeginning methodology is further discussed in Section 4.2. of this paper.

Environmental Industry Research Methods of EBI, Inc.
© 1997 Environmental Business International, Inc. (San Diego, CA, USA) Page 14
3. Elements of EBI’s Market Research Method
Over the years, EBI has established a method for performing research on environmentalcompanies that is both efficient and comprehensive. The cost for performing this work hasbeen born by the private sector through the purchase of EBI’s products and services. For thisreason, the data, interpretation and analyses have been crafted to directly serve the needs ofenvironmental industry executives in the private sector for their use in developing marketingand strategic plans for their individual business operations and expansions. Since businessesmust rely on this data to make multi-million dollar investment decisions, EBI researchers havebeen very conscious and conscientious in collecting, processing and interpreting the data.
Any market can be viewed as a population of sales events between a buyer and a seller. Sofrom that perspective, a market research analyst can either count purchases by individualbuyers or, alternatively, s/he can count the revenues/sales of the seller. Since buyers typicallyout number sellers, and since buyers don’t always keep good track of their purchases, it isusually easier to study revenue generated, rather than purchases made, in a given market. Thatis, it’s typically less costly and more accurate to survey the sell side of a market. This hasbeen the method employed by EBI in surveying the environmental industry. In this way, wesurvey actual, existing markets.
Basically, EBI “adds up” the revenues generated by companies/entities in each of the 14environmental business sectors outlined above to determine individual segment and then totalindustrial size. It does this in four distinct steps:
1. Generation and Maintenance of Company Databases2. Development of Survey Instruments3. Response Data Compiling4. Margin Analysis Modeling
Each of these steps are discussed in greater detail in the following four sections. The lastsection reviews the market and industry intelligence that is not captured using this method,and discusses how EBI obtains that other data.
The EBI information management system outlined in Exhibit 3-1 shows a schematic of thisresearch method. EBI integrates information from all available sources through a computer-based data collection, storage, retrieval and analysis system designed to meet the demands andmatch the discipline imposed by the rapidly evolving environmental marketplace. The key tothis method is that EBI continually collects primary data from companies, using that data tomodel industry size. It does not use “industry expert” opinion to derive its market numbers.

Environmental Industry Research Methods of EBI, Inc.
© 1997 Environmental Business International, Inc. (San Diego, CA, USA) Page 15
Exhibit 3-1 EBI INFORMATION MANAGEMENT MODEL
PROPRIETARYGENERATORSURVEYS
EBI CLIENTS
PROPRIETARYCLIENTSURVEYS
PUBLICINFO
DATA I N
MARKET DATA SOURCES
SECONDARYSOURCES
ANECDOTE
DATABASES
.ML.SRV
COMPANYFILES
SUBJECTFILES
DATA STORAGE
DATA OUT
EBJOTSREPORTSEBC
PRODUCTS
(U .S . and Internatio nal)
SEG13
SEG1 SEG2 SEG3 SEG4 SEG5 SEG6
SEG7 SEG8 SEG9 SEG10 SEG11 SEG12
ENVIRONMENTALINDUSTRY ANALYSISAND FORECASTS
DATA ANALYSI S
SEG14
SOURCE: © 1996 Environmental Business International, Inc., San Diego, CA

Environmental Industry Research Methods of EBI, Inc.
© 1997 Environmental Business International, Inc. (San Diego, CA, USA) Page 16
3.1. Company Databases
EBI continuously collects and updates its lists of environmental product and servicecompanies. These databases are derived from industry directories, electronic down-loadsfrom Dun and Bradstreet databases, list trades from other information companies andexhibitor and attendee lists from environmental industry conferences.
Companies larger than $10 million in sales are all captured, however, there are manythousands of companies or departments and divisions of companies that are smaller than $10million in sales in this industry. It is these companies that are the most challenging to findand to survey. However, EBI maintains these databases and there are over 50,000 records ofenvironmental companies in the fourteen segments in the U.S. alone.
These databases are coded by company type (the fourteen segments). They are used as thesource databases for performing survey mail-outs. Typically Marketing Directors or ChiefFinancial Officers are the ones who fill out EBI surveys. The completed surveys form thebackbone of the EBI primary research data.
3.2. Survey Instruments
EBI designs and implements its own surveys on the environmental industry. Based on itsyears of experience in performing these surveys it has evolved a method to receive financialdata from companies who are willing to fill out and return the survey instruments.
Examples of four such surveys are shown in Appendix 5.2. These surveys shown in theAppendix are designed specifically for four of the fourteen segments. They are:
• Environmental Engineering and Consulting Companies• Water/Wastewater Equipment and Chemicals• Environmental Analytical Instruments• Environmental Information Products and Services
A brief review of the surveys will reveal that EBI routinely collects at least the followinginformation from each company in the various business segments:
• Financial Information- Company information,- Gross revenues-past two years, most recent year and one year future estimate,- Segment specific revenues- Operating Income- International Revenues
• Product or service line revenue breakdown- this revenue breakdown is specific to the environmental business segment
• Market or client type revenue breakdown- this includes government and private client breakdowns
• Geographic revenue breakdown• Other segment specific categories.
These surveys are sent out with a cover letter that describes the survey, why we’re doing it andwhat they can expect to receive for filling out their survey.
The survey data is kept confidential in EBI’s files. The only piece that is published is thetotal gross and environmental revenues. This is explained in the cover letter. The aggregatedata, however, is used to form market size estimates based on the primary data collected fromthese surveys.

Environmental Industry Research Methods of EBI, Inc.
© 1997 Environmental Business International, Inc. (San Diego, CA, USA) Page 17
3.3. Response Data Compiling
Each returned survey is entered into an electronic database so that the data may be easilytabulated. An example of a typical database structure for one of these surveys is shown inAppendix 5.3.
As can be seen in the database structure, both quantitative and qualitative data can be stored inthese databases. Total summaries, averages, highs and lows, etc. can all be easily calculated inthese databases.
If cross-tabbing or other statistical manipulations need to be performed, the data can be easilymoved into a statistical program like STATPAC. If more straight forward “margin analysis”is needed, then the data is moved into spreadsheet programs.
3.4. Margin Analysis Modeling
3.4.1. Gross Revenue Data
Typically revenues for the top 100, or so, companies in each sector is known. This comesfrom published reports on the publicly traded companies or from EBI’s surveys. Wetypically obtain data from all of the companies with revenues greater than $100 million. Ofthe firms in the $10 million to $100 million range we will get up to 50%. Of the vast majorityof firms in the <$10 million revenue range, we will receive about 3-4 % response on thesurveys. The revenues on these companies is then modeled. So while EBI may receivesurveys on 5-6% of the total companies surveyed, through modeling the revenues of thecompanies that are not received, we capture about 60 to 70% of the total revenues for eachindustry segment that we survey.
An example for our survey results from air pollution control equipment companiesdemonstrates these results, shown in Exhibit 3-2. EBI received surveys from 194 firms, inthis case 20% of the 665 firms believed to be in this industry segment. However, thisrepresents–using this model–about 78% of the total revenues for this segment. Based on thisanalysis, EBI has developed a high degree of confidence in its models of market size.
Exhibit 3-2 Air Pollution Control Equipment RevenueModeling ($million)
Size Category # ofCos.
Avg.Revs
Revs MissingCos.
MissingRevs
TotalCos.
TotalRevs
% ofInd.
>$100 Million 8 151.3 1,210 0 0 8 1,210 33%$50 Million–$100 Million 5 61.6 308 2 123 7 431 12%$20 Million–$50 Million 20 30.3 606 4 121 24 727 20%$10 Million–$20 Million 21 12.7 267 15 191 36 458 12%$1 Million–$10 Million 140 3.1 439 50 157 190 596 16%<$1 Million 0.7 400 280 400 280 8%Total 194 2,830 471 872 665 3,702 100%
SOURCE: © 1996 Environmental Business International, Inc., San Diego, CA
3.4.2. Service/Product Analysis

Environmental Industry Research Methods of EBI, Inc.
© 1997 Environmental Business International, Inc. (San Diego, CA, USA) Page 18
Using the data from the surveys received, the product service breakdown can also be modeled.Continuing with the APC Equipment survey of 1994 revenue data, the product breakdown forrevenue is shown in Exhibit 3-3.
Exhibit 3-3 Air Pollution Control Equipment Revenue byEquipment Type ($million)
Equipment TypeRevenues
Reported byType
PercentTotal
ReportedFGD/Scrubbers 634.5 26%Fabric Filters & Baghouses 504.0 21%Electrostatic Precipitators 457.3 19%Oxidation Systems 392.0 16%NOx Control Systems 304.9 13%Carbon Adsorption 87.4 4%Others 40.7 2%
Total Revenue Reported : 2,420.8 100%
SOURCE: © 1996 Environmental Business International, Inc., San Diego, CA
The percentages in the margins, then, are used to multiply times the total revenue (see Exhibit3-2), thus creating a model of the revenue breakdown by segment or product, for the wholeindustry segment.
3.4.3. Analysis by Environmental Media Type
In a similar fashion as the product or service type breakdowns, revenues can be broken downby environmental media. The environmental media in question are:
• air• water• hazardous waste• soil remediation• solid waste
In the five environmental business segments where the environmental media may be amultidisciplinary function (i.e. not a single media focus like APC equipment, or solid wasteservices, etc.) the revenue data is subdivided by media type. The segments where this is thecase are:
• Analytical Services• Consulting and Engineering• Instrument Manufacturing• Waste Management Equipment• Resource Recovery
The overall numerical breakdown by media type was shown in Exhibit 2-7.
3.4.4. Analysis by Client Type

Environmental Industry Research Methods of EBI, Inc.
© 1997 Environmental Business International, Inc. (San Diego, CA, USA) Page 19
In addition, to the analysis of the data by the above categories, most companies want to knowhow the market breaks down by buyer type. This information is also included on the survey,so an analysis of the summarized revenues is straightforward from the completed survey data.This type of data is shown for the APC equipment example in Exhibit 3-4.
Exhibit 3-4 Air Pollution Control Equipment Revenue byClient Type ($million)
Client TypeRevenues
Reported byType
PercentTotal
ReportedElectric Utilities 785.1 42.8%Chemical, Pharm. & Plastics 150.7 8.2%Pulp & Paper Manufacturing 148.9 8.1%Independent Power Producers 120.3 6.6%Incinerators & Waste-to-Energy 108.7 5.9%Petroleum Refining 102.0 5.6%Auto/Machinery Manufacturing 68.1 3.7%Primary Metals (Steel, Copper, etc.) 53.8 2.9%Others:Stone, Clay, Glass & Cement 49.1 2.7%Paint & Coatings/Metal Finishing 46.4 2.5%Others 39.7 2.2%Printing & Publishing 37.8 2.1%Electronics & Computers 35.0 1.9%Food Processing 31.3 1.7%Mining 23.2 1.3%Wastewater Treatment Plants 17.7 1.0%Remediation & Env. Cons. Firms 5.0 0.3%Landfills 4.7 0.3%Energy Exploration (Coal, Oil & Gas) 4.2 0.2%Textiles & Leather 2.9 0.2%
Total Revenue Reported : 1,834.6 100.0%
SOURCE: © 1996 Environmental Business International, Inc., San Diego, CA
3.4.5. Public vs. Private Entities
As stated in Section 2 above, not all of the entities in the environmental industry are privatecompanies (either publicly or privately owned). Some, especially solid waste, water deliveryand wastewater treatment are owned and operated by incorporated municipalities, counties orspecial districts. However, owing to the worldwide movement to privatize these traditional“environmental infrastructure” entities, EBI tracks the entire “industry” of both public andprivate entities who own and operate these facilities. In the United States, EBI has estimatedthe approximate revenue breakdown and revenue sources of these entities. This is shown inExhibit 3-5.

Environmental Industry Research Methods of EBI, Inc.
© 1997 Environmental Business International, Inc. (San Diego, CA, USA) Page 20
Exhibit 3-5 Environmental Industry Segments by OwnershipType
ENVIRONMENTAL Revenue Generator ($Bil)
INDUSTRY SEGMENT 1994 pub% priv% pub$ priv$Services
Analytical Services 1.6 8% 92% 0.1 1.5 Water Treatment Works 25.7 95% 5% 24.4 1.3 Solid Waste Management 31.0 33% 67% 10.2 20.8 Hazardous Waste Management 6.4 10% 90% 0.6 5.8 Remediation/Industrial Services 8.6 0% 100% 0.0 8.6 Consulting & Engineering 15.3 0% 100% 0.0 15.3Equipment
Water Equipment and Chemicals 13.5 0% 100% 0.0 13.5 Instruments & Information Systems 2.9 0% 100% 0.0 2.9 Air Pollution Control Equipment 11.7 0% 100% 0.0 11.7 Waste Management Equipment 11.2 0% 100% 0.0 11.2 Process & Prevention Technology 0.8 0% 100% 0.0 0.8Resources
Water Utilities 24.2 84% 16% 20.3 3.9 Resource Recovery 15.4 25% 75% 3.9 11.6 Environmental Energy Sources 2.2 5% 95% 0.1 2.1 Total 170.4 35% 65% 59.7 110.7
SOURCE: © 1996 Environmental Business International, Inc., San Diego, CA
What is clearly evident from this analysis is that all equipment manufacturing and distributionis private. This is typical in all western, free-market economies. However, the environmentalinfrastructure services are public. Although solid waste has largely been privatized in theU.S., the biggest opportunities for privatization are in the water delivery (utilities) and in thewastewater treatment segments. This, of course, represents a major opportunity for privateenvironmental companies in these sectors. These opportunities are being actively pursued byEuropean companies in the U.S., while U.S. solid waste companies are actively pursuing solidwaste opportunities abroad.
3.5. Data Elements Not Captured in this Method
As already stated, the major data that is not captured in the method described above is the“buy-side” data, i.e. a record of environmental purchases by companies and municipalities.EBI selectively captures this data on a case-by-case basis. However, the U.S. Government(via the Department of Commerce) does capture a large amount of environmental spendingdata by industry.
3.5.1 Buying Pattern, or Buy Side Analysis
EBI surveys buyers of environmental products and services to determine the buying patternsof the customers of these services. Typically these studies are performed for individualclients and are therefore client private. However, EBI is currently engaged in the authoring ofa report on this subject for its general readership.

Environmental Industry Research Methods of EBI, Inc.
© 1997 Environmental Business International, Inc. (San Diego, CA, USA) Page 21
While there are tens of thousands of environmental companies, there are on the order ofhundreds of thousands of environmental pollution generators in the United States. This factalone makes forming generalizations about these markets very tentative, from just the buy-sideperspective.
In addition, many recent studies by EBI have shown that certain services by generators areperformed more internal more frequently, while others are tend to be more frequentlycontracted out. This is shown for the Consulting and Engineering services in the U.S.chemical industry in Exhibit 3-6. What this points to is that aside from the actual market thatEBI surveys in the sell-side surveys of industry companies, there is still a larger potentialmarket that can be “captured” from the “Do-It-Yourself” companies in this industry.
Exhibit 3-6 Consulting and Engineering Services Used by the ChemicalIndustry
Service CategoryPerform
In-House
Outside
VendorService Category
PerformIn-
House
Outside
VendorTesting/AnalyticalServices
24% 76% Solid Waste 60% 40%
Analytical Testing 14 86 Landfill Design/Closure 24 76Sampling-Air 27 73 Solid Waste Characterization 57 43Sampling-Water 32 68 Solid Waste Recycling 76 24Sampling-Soil 28 72
Water/Wastewater 72% 28%Hazardous Waste 35% 65
%Industrial Pre-Treatment 59 41
Aquifer Remediation 14 86 Operations & Maintenance 89 11Asbestos Abatement 25 75 Stormwater Management 89 11Closure/Remediation 6 94 Sludge Management 74 26On-Site HW Management 72 28 Water Supply 79 21Part-B Permitting 58 42 Wastewater
Treatment/Disposal55 45
RCRA 53 47Remedial Design 21 79 General Env'l
Consulting75% 25%
RI/FS, SiteAudit/Assessment
38 62 Risk Assessment 49 51
Soil Remediation 11 89 Env. Impact Statement 56 44Superfund PRP 24 76 Permitting 74 26UST Compliance 41 59 Pollution Prevention 92 8
Project Management 73 27Air Compliance 51% 49
%Regulatory Assistance 67 33
Air EmissionStudy/Control
45 55 Strategic Env'l Management 88 12
Air Permitting 57 43 Waste Minimization 90 10Wetlands 31 69
SOURCE: Environmental Business International, Inc. San Diego, CA
Environmental Industry Research Methods of EBI, Inc.
© 1997 Environmental Business International, Inc. (San Diego, CA, USA) Page 22
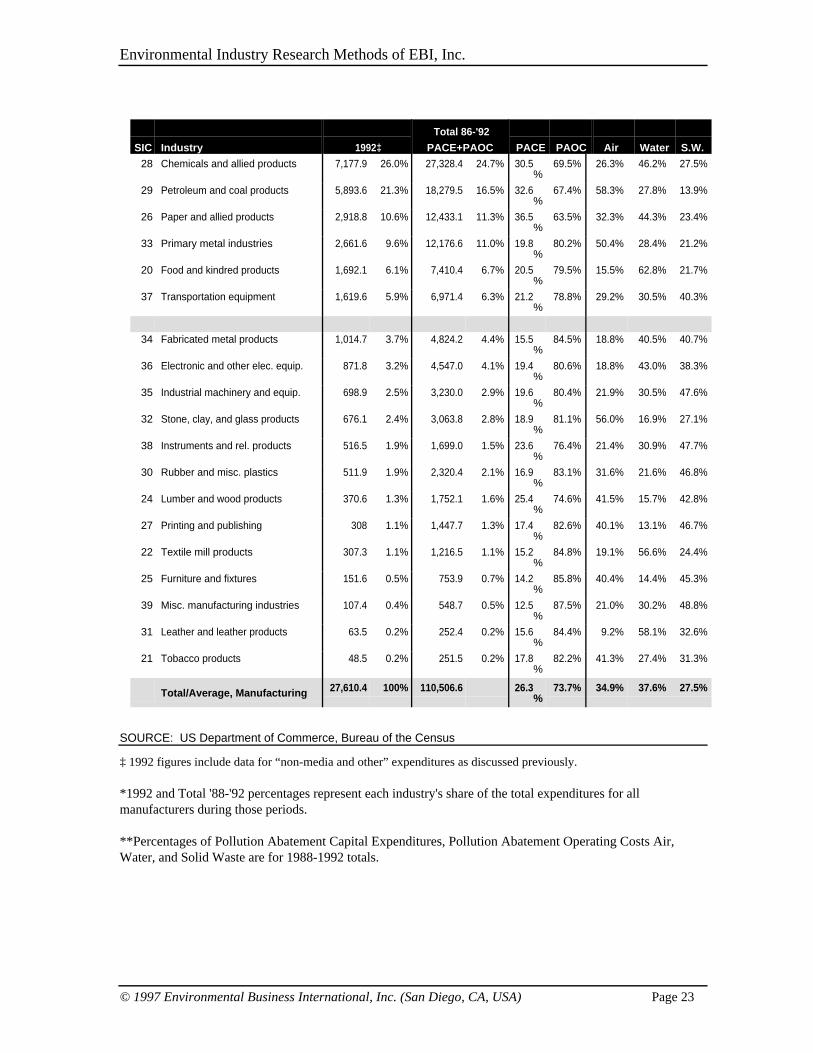
3.5.2 Government Data on Cost of Environmental Expenditures
In addition to the private data collected by companies like EBI, the U.S. government collectsenvironmental expenditure data as well. The bulk of this data is based on a comprehensiveannual survey performed by the U.S. Department of Commerce. A summary of a portion ofthis data is shown in Exhibit 3-7. The percent of expenditures by three media categories ofair, water and solid waste are also included in this data.
To date no one has funded a correlation of this buy-side, or expenditure data with the sell-sideor revenue data that EBI produces. While this exercise would likely be very instructive,revealing holes and problems with definitions and data sources, this would be a major (multi-million dollar) undertaking.
Exhibit 3-7 Total Manufacturing Industry PollutionAbatement Expenditures ($ Millions)
Environmental Industry Research Methods of EBI, Inc.
© 1997 Environmental Business International, Inc. (San Diego, CA, USA) Page 23
SIC Industry 1992‡
Total 86-'92
PACE+PAOC PACE PAOC Air Water S.W.
28 Chemicals and allied products 7,177.9 26.0% 27,328.4 24.7% 30.5%
69.5% 26.3% 46.2% 27.5%
29 Petroleum and coal products 5,893.6 21.3% 18,279.5 16.5% 32.6%
67.4% 58.3% 27.8% 13.9%
26 Paper and allied products 2,918.8 10.6% 12,433.1 11.3% 36.5%
63.5% 32.3% 44.3% 23.4%
33 Primary metal industries 2,661.6 9.6% 12,176.6 11.0% 19.8%
80.2% 50.4% 28.4% 21.2%
20 Food and kindred products 1,692.1 6.1% 7,410.4 6.7% 20.5%
79.5% 15.5% 62.8% 21.7%
37 Transportation equipment 1,619.6 5.9% 6,971.4 6.3% 21.2%
78.8% 29.2% 30.5% 40.3%
34 Fabricated metal products 1,014.7 3.7% 4,824.2 4.4% 15.5%
84.5% 18.8% 40.5% 40.7%
36 Electronic and other elec. equip. 871.8 3.2% 4,547.0 4.1% 19.4%
80.6% 18.8% 43.0% 38.3%
35 Industrial machinery and equip. 698.9 2.5% 3,230.0 2.9% 19.6%
80.4% 21.9% 30.5% 47.6%
32 Stone, clay, and glass products 676.1 2.4% 3,063.8 2.8% 18.9%
81.1% 56.0% 16.9% 27.1%
38 Instruments and rel. products 516.5 1.9% 1,699.0 1.5% 23.6%
76.4% 21.4% 30.9% 47.7%
30 Rubber and misc. plastics 511.9 1.9% 2,320.4 2.1% 16.9%
83.1% 31.6% 21.6% 46.8%
24 Lumber and wood products 370.6 1.3% 1,752.1 1.6% 25.4%
74.6% 41.5% 15.7% 42.8%
27 Printing and publishing 308 1.1% 1,447.7 1.3% 17.4%
82.6% 40.1% 13.1% 46.7%
22 Textile mill products 307.3 1.1% 1,216.5 1.1% 15.2%
84.8% 19.1% 56.6% 24.4%
25 Furniture and fixtures 151.6 0.5% 753.9 0.7% 14.2%
85.8% 40.4% 14.4% 45.3%
39 Misc. manufacturing industries 107.4 0.4% 548.7 0.5% 12.5%
87.5% 21.0% 30.2% 48.8%
31 Leather and leather products 63.5 0.2% 252.4 0.2% 15.6%
84.4% 9.2% 58.1% 32.6%
21 Tobacco products 48.5 0.2% 251.5 0.2% 17.8%
82.2% 41.3% 27.4% 31.3%
Total/Average, Manufacturing 27,610.4 100% 110,506.6 26.3%
73.7% 34.9% 37.6% 27.5%
SOURCE: US Department of Commerce, Bureau of the Census
‡ 1992 figures include data for “non-media and other” expenditures as discussed previously.
*1992 and Total '88-'92 percentages represent each industry's share of the total expenditures for allmanufacturers during those periods.
**Percentages of Pollution Abatement Capital Expenditures, Pollution Abatement Operating Costs Air,Water, and Solid Waste are for 1988-1992 totals.

Environmental Industry Research Methods of EBI, Inc.
© 1997 Environmental Business International, Inc. (San Diego, CA, USA) Page 24
4. Further Data Needs
“In politics [science and business], numbers beat no numbers every time.”Jodie Allen, Former U.S. Assistant Secretary of Labor
Even though EBI has spent the last 9 years doing nothing but analyzing the environmentalindustry, we nevertheless feel that our job is just beginning. We need to continue to betteranalyze and track the traditional environmental industry. In addition, we feel that beginning tounderstand the transition to a sustainable economy, participated by the environmental industry,is a much larger, important and more challenging task.
4.1. More Data on the Traditional Environmental Industry Segments
4.1.1. United States Environmental Industry Data
As indicated in the previous chapter, EBI feels that it has collected sufficient data in a numberof segments. However, owing to the lack of sufficient buyers for certain segment data in theUnited States, we believe that the following data sets could use more work using our methods.
• Solid Waste: The U.S. solid waste industry is dominated by three very largecompanies (WMX International, BFI, and Laidlaw). These companies all have verylarge internal market intelligence staffs (or so we have been led to believe). Inaddition, the remainder of the other companies are quite small and regional. For thesereasons, EBI has not found a sufficient client base to fund more extensive marketresearch in this arena. We do have plenty of publicly available data on these largecompanies, and have other data from the smaller ones, as well as industry associationsand government data on waste production. Therefore, we believe our market estimatesare sufficiently accurate without performing more primary survey research on thissector.
• Hazardous Waste: The U.S. hazardous waste industry is relatively small ($8 billion)compared to the other sectors and appears to be shrinking. In addition, there is a lotof government data on this sector from the hazardous waste generation side. Thissector could use more in depth research as it continues to decline. Though owing tothe decline in this segment, the private sector is not likely to fund such an effort (i.e.there is an insufficient market for this information beyond the current level of effort).
• PPT: Prevention and Process Technologies are a “mixed bag” of company types.However, it is rapidly growing and EBI believes that it is the harbinger of thetransition to an environmentally sustainable economy. EBI will likely study thissegment more as it refines its definitions and uses that analysis to work towardanalyzing sustainable development (see Section 4.2)
• Construction: EBI has not studied the straight construction side of theenvironmental industry. Portions of these costs are contained in the design andengineering function of the C&E firms. In addition, capital improvements arecaptured as expenditures and debt service within the water and solid waste industries.But the revenues generated in these sectors largely goes to the services that the entitiesin these sectors provide. Disaggregating just the construction costs has, to date, beenbeyond the scope of work performed by EBI.

Environmental Industry Research Methods of EBI, Inc.
© 1997 Environmental Business International, Inc. (San Diego, CA, USA) Page 25
• Lawyers: EBI estimates that lawyers in the U.S. collectively generate between $3 to5 billion in revenues annually on just environmental law issues. Because this sectortends not to buy strategic market data, and EBI has never had it in its charter to surveythis data, this revenue data is missing from our analysis.
• Environmentally Friendly Products: Another important and emerging sector inthe U.S. economy that appears to be environmentally driven is environmentallyfriendly products. These include a broad range of multiple sectors like:- apparel (e.g. chemical free cotton)- personal care products- natural food products and supplements- recycled products- reused products- energy saving products and services.Along with the industrial and prevention products, EBI is considering studying theseproducts further once clear definitions are established.
4.1.2. Primary Environmental Industry Data-Worldwide
As is evident from the entire preceding discussion, EBI has focused almost entirely on theU.S. market for its primary research. The reason for this is that our customers have been inthe U.S. and the markets for exports have not been sufficiently uniform or robust to warrantthe very significant expenditures involved in international market analysis.
One study that EBI performed that was partially funded by a U.S. EPA grant is the “GlobalEnvironmental Industry: A market and needs assessment.” This study, however, was basedentirely on secondary research, i.e. reports and studies performed by other researchers. Asdiscussed at length in that study, this is very problematical since each study used both diversedefinitions and diverse methods to arrive at their market figures. For this reason, EBIproduced a companion “world model” that became the basis for comparing environmentalmarkets worldwide, using the definitions and methods established for our work in the U.S.market. This data is contained in an “executive review” of the larger global study.
The real work that remains to be done is the development of a comprehensive program thatstudies environmental companies worldwide. While this is clearly possible given theadvanced information technologies available to research companies such as EBI, it isnevertheless at least an order of magnitude more difficult (read expensive) than doing thiswork just for the U.S. EBI estimates that it has earned and spent in excess of $4 milliondollars to reach its current level of understanding of the U.S. environmental industry.Multiplying that times ten would likely give us an equivalent understanding of worldenvironmental industry and markets to the same degree of detail and articulation as EBI nowhas for the U.S. environmental market.

Environmental Industry Research Methods of EBI, Inc.
© 1997 Environmental Business International, Inc. (San Diego, CA, USA) Page 26
4.2. Elements, Definitions and Methods for Tracking IndustrySustainability
Having a sound measurement system and accurate maps, coupled with the ability to updatethem regularly as new information is received is the life blood of any exploration exercise. Todate, however, measuring the inevitable, yet slow march to industrial environmentalsustainability has not occurred. There are at least three generic facets to this process:
1. identification of the key elements that need to be measured,2. creating operational definitions that can yield quantitative measures, and3. articulating sound, reproducible methods for acquiring and interpreting data.
This section will flesh out this structure. †
4.2.1 Elements and Definitions
The primary strategic question for developing environmentally sustainable business strategyis “where are the un-sustainable parts of the economy?” These will be the elements that willrepresent the new sustainable business opportunities as long as they are “essential” tosatisfying human needs. The goal is to create a model that identifies these elements andtracks them in such a way that business strategy can be crafted using them as a reference.
The three basic material components of any economy are:1. the raw (or virgin) resources,2. the processes and products produced from those resources, and,3. the waste generated from the extraction, production, distribution, use and discard of
manufactured goods.
Traditional economic analysis has often ignored one or more of these elements, sometimestreating resources and generally regarding waste (and its effects) as external to economicconsideration. Environmental regulations and the resultant environmental industry haschanged that forever. As a result of the “internalization of environmental costs” brought onby these regulations, new economic analysis is only now emerging. The elements of thisanalysis must necessarily center around resources–the “stuff” of an economy–for it is onlythe resources as used and dispersed that matter with respect to environmental sustainability,i.e. resource depletion and waste production.
Resources can be broadly categorized into three main groups:1. Non-renewable: can only be used once in the product and can not be directly replaced
once used, e.g. fossil fuels.2. Renewable: can be used but there is a practicable basis for replenishing the resource,
e.g. agriculture and silvaculture.3. Recyclable: can be used and re-used indefinitely with minor losses due to friction and
dust, e.g. aluminum, steel, water, etc.
Given these general considerations, then, we can come to the following definition:An environmentally sustainable economy is one that both depends on renewable and
recyclable resources and, ultimately, produces no waste.
† The contents of this sub-section draw from concepts and notions contained in “Industrial Metabolism:Restructuring for Sustainable Development” Edited by Robert U. Ayres and Udo E. Simonis United NationsUniversity Press, 1994. and “Industrial Ecology: Metrics, Systems, and Technologic Choices” by DavidRejeski, Future Studies Unit, Office of Policy, Planning and Evaluation U.S. EPA, 1994.

Environmental Industry Research Methods of EBI, Inc.
© 1997 Environmental Business International, Inc. (San Diego, CA, USA) Page 27
As any chemist will tell you however, there is a problem of entropy. An important but notentirely intuitive concept that tells us that every bit of work (energy output–common to allnatural and economic systems) creates a degree of randomness in the environment. Themajor unanswered question for ours–and likely many succeeding–generations is “whatdegree of randomness is sustainable on this planet?” This, while extremely important, is yetbeyond the scope of EBI’s research capabilities.
Identifying the unsustainable elements and extracting them from existing data is the task athand, however. A number of government and non-government organizations have beenmaking it their task to collect such data. On the most generic level, this includes the followinglist of resource, construction, primary and secondary manufacturing industries (StandardIndustrial Classification Codes–two digit SIC–01 to 39, see Appendix 5-4). The approximatenumber of facilities involved in these activities and their approximate current “environmentalspending” is also shown. This Appendix chart shows the most general level of the material(and therefore economic) interrelationships between all of these key industries. This is thebare beginnings of a macro-industrial metabolism analysis. What is not shown are the masstransfer, and waste production and recycling between all of these elements and the end-users(i.e. commercial, residential/municipal sectors of the economy). These elements must beincluded as part of any rigorous strategic quantification of the market–this is the contents of aseparate study.
For the purposes of this analysis it is sufficient to outline the statistics that need to begathered for each industry. These are shown in following table of industrial sustainabilityaccounts.
Exhibit 4-1 - Basic Accounts for Industrial Sustainability
Resource Account Product Account Waste AccountSolid, Liquid, Gas (Tons each) Solid, Liquid, Gas (Tons each) Solid, Liquid, Gas (Tons each)
Non-renewable Non-renewable Non-renewableRenewable Renewable RenewableRecyclable Recyclable Recyclable
Energy Consumed (BTU total) Energy (BTU Consumed inproduction)
Energy (BTU lost, wasted)
Non-renewable Non-renewable Non-renewableRenewable Renewable Renewable
A mass balance/energy balance for each industry holds–owing to the laws of conservation ofmass and energy–such that the total resource input should equal the sum of the product andwaste outputs.
Again, the goal is to identify those industries that have high non-renewable inputs and highwaste outputs. These represent clear resource/product substitution and pollution preventionopportunities for environmental businesses.
4.2.2 Methods for Data Gathering
Much of the data elements described above are available from current sources. However, theyhave never been consistently gathered for the purposes of guiding sustainable businessstrategy or government policy. While the comprehensive gathering of such data is wellbeyond the scope of EBI’s current efforts, some direction in compiling this intelligence will

Environmental Industry Research Methods of EBI, Inc.
© 1997 Environmental Business International, Inc. (San Diego, CA, USA) Page 28
provide the reader with a framework for analysis. Alternatively, an outside research service(like EBI) could produce this work on a industrywide basis, thus distributing the cost for theentire environmental industry.
The following data elements can be found at the sources listed:Resource Usage:
Department of the InteriorWorld Resources Institute
Product Production by Industry:Industrial Census
Waste Production:EPA TRIEPA Bi-annual ReportsSolid Waste Production DataDOC Environmental Expenditures by Industry
Clearly, primary research by any one company to gather this data would be too expensive forthem to undertake. A need to collect this data on an ongoing basis is definitely warranted inorder to support the movement to environmentally sustainable economic development.

Environmental Industry Research Methods of EBI, Inc.
© 1997 Environmental Business International, Inc. (San Diego, CA, USA) Page 29
5. Appendix
5.1. Environmental Industry Segments and SIC Code Correlations
Environmental Industry Segment SIC Code Description
Environmental Services
Analytical Services 8734 Testing Laboratories873401 Radiation Laboratories873403 Pollution Testing
Solid Waste Management 4953 Refuse Systems495302 Refuse Collection & Disposal Svcs495303 Nonhazardous Waste Disposal Sites
Hazardous Waste Management 4953 Refuse Systems495301 Hazardous Waste Collection & Distribution
Remediation/Industrial Services 4959 Sanitary Services495903 Toxic or Hazardous Waste Cleanup
Consulting & Engineering 8711 Engineering Services738902 Inspection & Testing Services871101 Sanitary Engineers871102 Industrial Engineers874800 Urban Planning & Consulting Services
Wastewater Treatment 4952 Sewerage Systems495200 Sewerage Systems
Environmental Equipment
Water Equipment and Chemicals 3589 Service Industry Machinery, nec3494 Valves and Pipe Fittings3498 Fabricated Pipe and Fittings3561 Pumps and Pumping Equipment358903 Sewage and Water Treatment Equipment
Instrument Manufacturing 3826 Analytical Instruments382601 Spectroscopic & Other Optical Parts382602 Analytical Optical Instruments382603 Liquid Testing Apparatus382605 Gas Testing Apparatus382999 Measuring & Controlling Devices, nec
Air Pollution Control Equipment No Single SIC3564 Purification & Dust Collection Equipment356901 Filters358999 Service Industry Machinery, nec

Environmental Industry Research Methods of EBI, Inc.
© 1997 Environmental Business International, Inc. (San Diego, CA, USA) Page 30
Environmental Equipment
Waste Management Equipment No Single SIC3448 Prefabricated Metal Bldgs3535 Conveyors and Conveying Equipment3564 Blowers and Fans358902 Commercial Cleaning Equipment382299 Environmental Controls, nec384201 Personal Safety Equipment504901 Scientific & Engineering Equipment
Process & Prevention Technology No Single SIC3823 Process Control Instruments
Environmental Resources
Water Utilities 4941 Water Supply494100 Water Supply
Resource Recovery 5093 Scrap & Waste Materials509301 Waste Paper and Cloth Material509302 Metal Scrap and Waste Material509399 Scrap and Waste Material, nec
Environmental Energy Sources No Single SIC
Environmental Industry Research Methods of EBI, Inc.
© 1997 Environmental Business International, Inc. (San Diego, CA, USA) Page 31
5.2. Example Survey Instruments
The following four survey instruments are included in order to provide an example of EBI’ssurvey’s.
• Environmental Engineering and Consulting Companies• Water/Wastewater Equipment and Chemicals• Environmental Analytical Instruments• Air Pollution Control Equipment