eba 1.0 finance 101 for entreprenuers
TRANSCRIPT

Copyright of Brunei Shell Petroleum Co Sdn Bhd RESTRICTED
EBA 1.0
FINANCE 101 FOR ENTREPRENUERS
April 2021
Training TeamErdiana Rahim FMA/5
Osmali Othman FMA/1
Afiqah Leong FMA/4
Firdauz Majid FMA/51
1
AGENDA• INTRODUCTION & OBJECTIVES
• BSP FINANCE
• UNDERSTANDING FINANCIAL STATEMENTS
• FINANCIAL ANALYSIS
• PROJECTION AND BUDGETING
• FINANCE CLINIC
2

INTRODUCTIONGetting to know You & Me
3
OBJECTIVE By the end of this learning event, you will:
1. Get to know BSP Finance2. Understanding Financial Statements (FS)3. Financial Management through FS4. Taking control of your Finances before it controls you
PART 1
INTRODUCTION TO BSP FINANCE
4
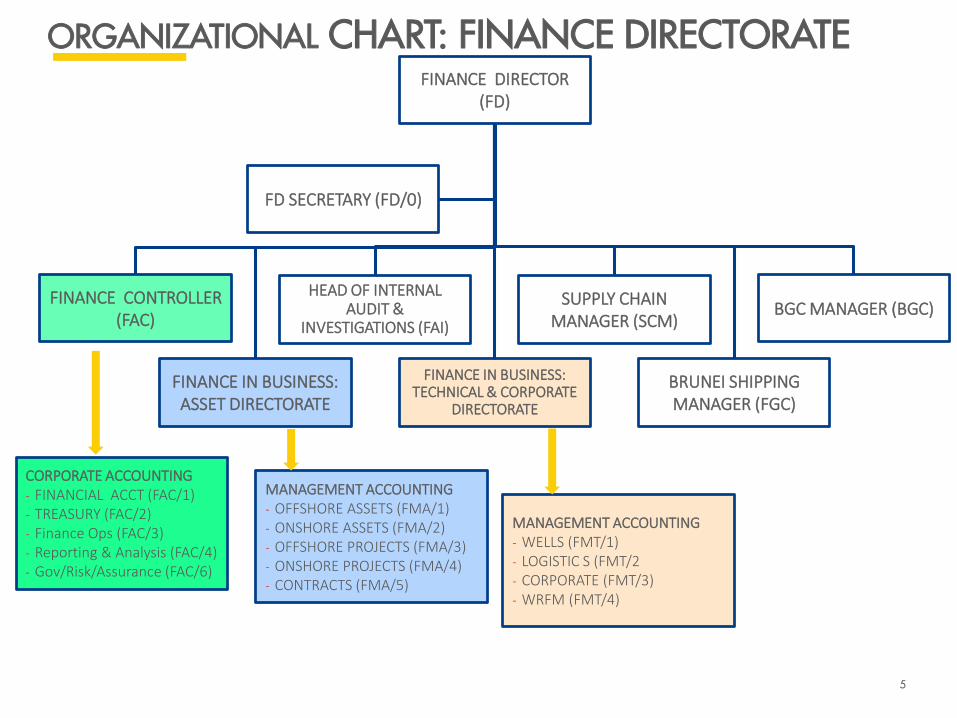
FINANCE DIRECTOR (FD)
FINANCE CONTROLLER (FAC)
HEAD OF INTERNAL AUDIT &
INVESTIGATIONS (FAI)
FINANCE IN BUSINESS: ASSET DIRECTORATE
FINANCE IN BUSINESS: TECHNICAL & CORPORATE
DIRECTORATE
SUPPLY CHAIN MANAGER (SCM)
BGC MANAGER (BGC)
BRUNEI SHIPPING MANAGER (FGC)
FD SECRETARY (FD/0)
ORGANIZATIONAL CHART: FINANCE DIRECTORATE
CORPORATE ACCOUNTING- FINANCIAL ACCT (FAC/1)- TREASURY (FAC/2) - Finance Ops (FAC/3)- Reporting & Analysis (FAC/4)- Gov/Risk/Assurance (FAC/6)
MANAGEMENT ACCOUNTING- OFFSHORE ASSETS (FMA/1)- ONSHORE ASSETS (FMA/2) - OFFSHORE PROJECTS (FMA/3)- ONSHORE PROJECTS (FMA/4)- CONTRACTS (FMA/5)
MANAGEMENT ACCOUNTING- WELLS (FMT/1)- LOGISTIC S (FMT/2 - CORPORATE (FMT/3)- WRFM (FMT/4)
5

PART 2
UNDERSTANDING FINANCIAL STATEMENTS
6
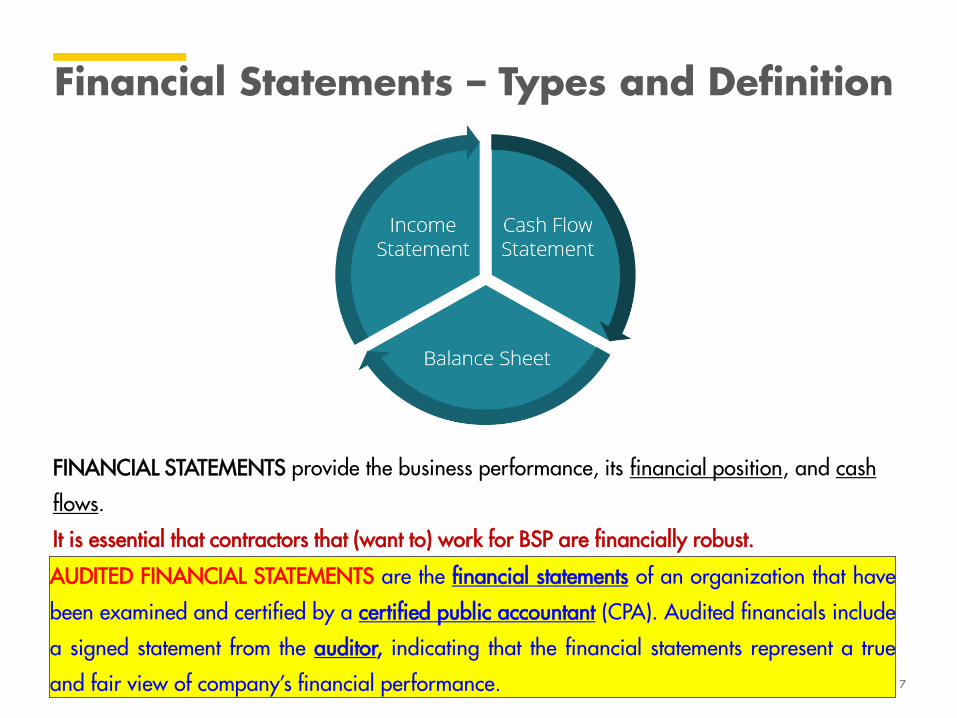
Financial Statements – Types and Definition
FINANCIAL STATEMENTS provide the business performance, its financial position, and cash
flows.
It is essential that contractors that (want to) work for BSP are financially robust.
AUDITED FINANCIAL STATEMENTS are the financial statements of an organization that have
been examined and certified by a certified public accountant (CPA). Audited financials include
a signed statement from the auditor, indicating that the financial statements represent a true
and fair view of company’s financial performance. 7
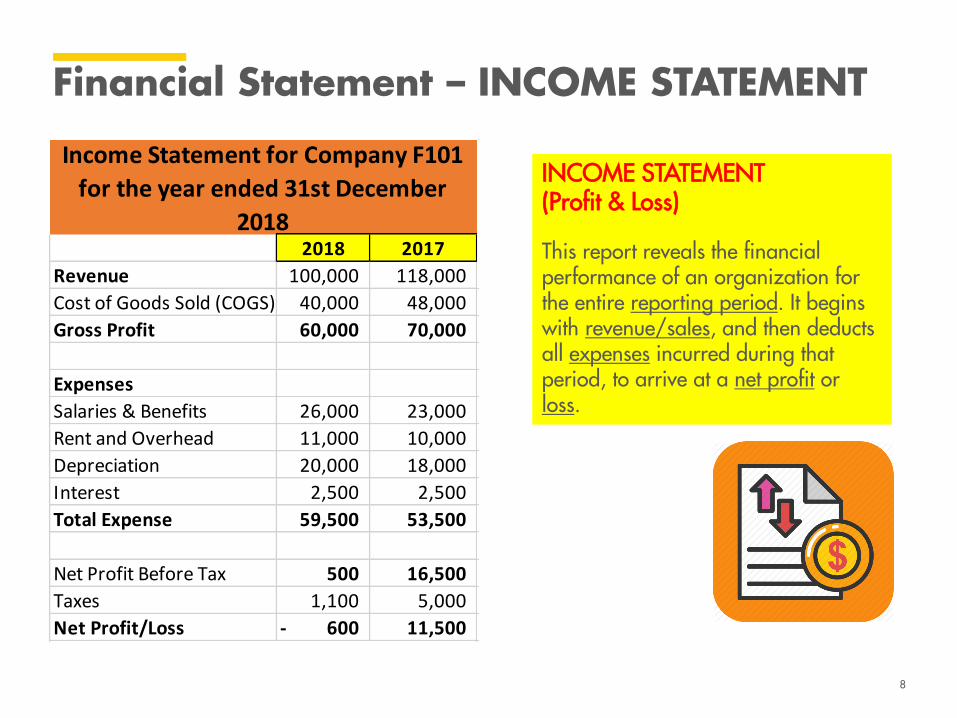
2018 2017
Revenue 100,000 118,000
Cost of Goods Sold (COGS) 40,000 48,000
Gross Profit 60,000 70,000
Expenses
Salaries & Benefits 26,000 23,000
Rent and Overhead 11,000 10,000
Depreciation 20,000 18,000
Interest 2,500 2,500
Total Expense 59,500 53,500
Net Profit Before Tax 500 16,500
Taxes 1,100 5,000
Net Profit/Loss 600- 11,500
Income Statement for Company F101
for the year ended 31st December
2018
INCOME STATEMENT (Profit & Loss)
This report reveals the financial performance of an organization for the entire reporting period. It begins with revenue/sales, and then deducts all expenses incurred during that period, to arrive at a net profit or loss.
8
Financial Statement – INCOME STATEMENT
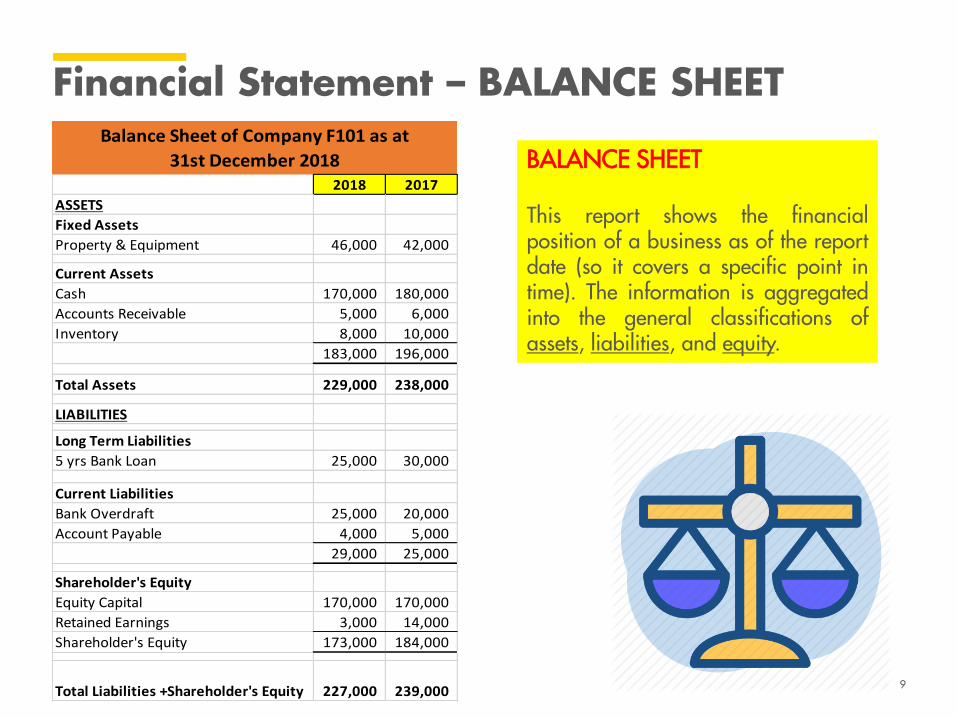
BALANCE SHEET
This report shows the financialposition of a business as of the reportdate (so it covers a specific point intime). The information is aggregatedinto the general classifications ofassets, liabilities, and equity.
2018 2017
ASSETS
Fixed Assets
Property & Equipment 46,000 42,000
Current Assets
Cash 170,000 180,000
Accounts Receivable 5,000 6,000
Inventory 8,000 10,000
183,000 196,000
Total Assets 229,000 238,000
LIABILITIES
Long Term Liabilities
5 yrs Bank Loan 25,000 30,000
Current Liabilities
Bank Overdraft 25,000 20,000
Account Payable 4,000 5,000
29,000 25,000
Shareholder's Equity
Equity Capital 170,000 170,000
Retained Earnings 3,000 14,000
Shareholder's Equity 173,000 184,000
Total Liabilities +Shareholder's Equity 227,000 239,000
Balance Sheet of Company F101 as at
31st December 2018
9
Financial Statement – BALANCE SHEET
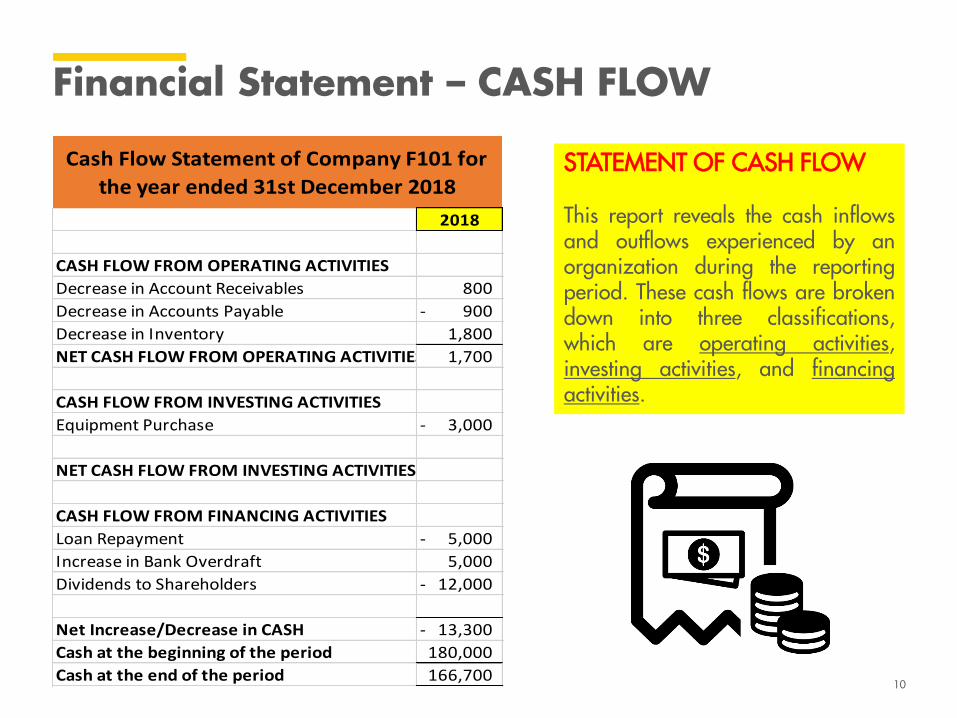
STATEMENT OF CASH FLOW
This report reveals the cash inflowsand outflows experienced by anorganization during the reportingperiod. These cash flows are brokendown into three classifications,which are operating activities,investing activities, and financingactivities.
2018
CASH FLOW FROM OPERATING ACTIVITIES
Decrease in Account Receivables 800
Decrease in Accounts Payable 900-
Decrease in Inventory 1,800
NET CASH FLOW FROM OPERATING ACTIVITIES 1,700
CASH FLOW FROM INVESTING ACTIVITIES
Equipment Purchase 3,000-
NET CASH FLOW FROM INVESTING ACTIVITIES
CASH FLOW FROM FINANCING ACTIVITIES
Loan Repayment 5,000-
Increase in Bank Overdraft 5,000
Dividends to Shareholders 12,000-
Net Increase/Decrease in CASH 13,300-
Cash at the beginning of the period 180,000
Cash at the end of the period 166,700
Cash Flow Statement of Company F101 for
the year ended 31st December 2018
10
Financial Statement – CASH FLOW

PART 3
FINANCIAL ANALYSIS
11
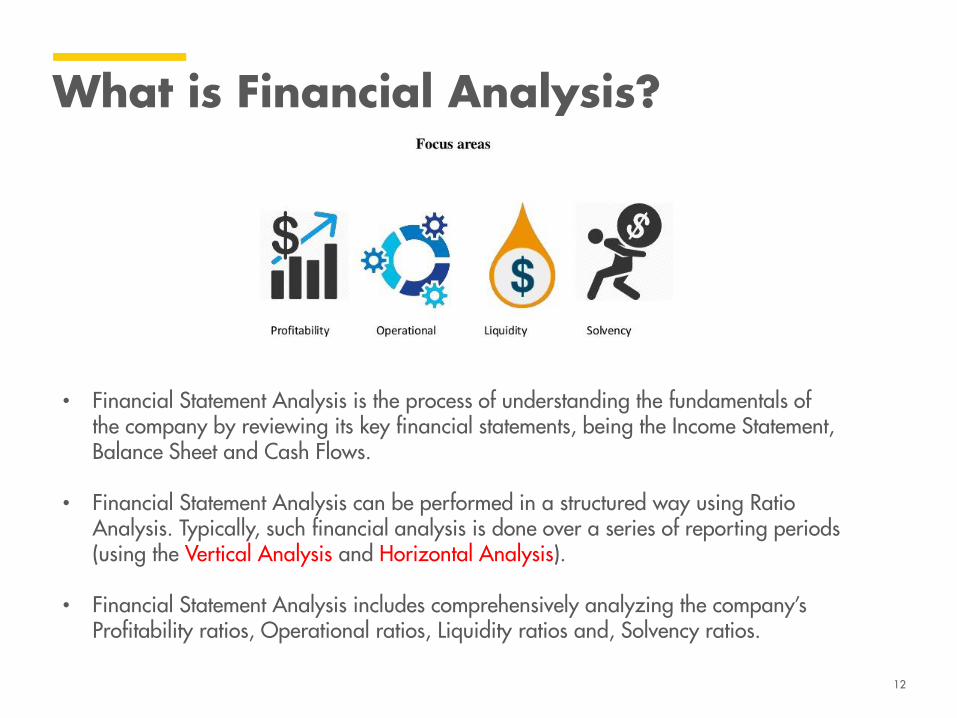
What is Financial Analysis?
• Financial Statement Analysis is the process of understanding the fundamentals of the company by reviewing its key financial statements, being the Income Statement, Balance Sheet and Cash Flows.
• Financial Statement Analysis can be performed in a structured way using Ratio Analysis. Typically, such financial analysis is done over a series of reporting periods (using the Vertical Analysis and Horizontal Analysis).
• Financial Statement Analysis includes comprehensively analyzing the company’s Profitability ratios, Operational ratios, Liquidity ratios and, Solvency ratios.
12
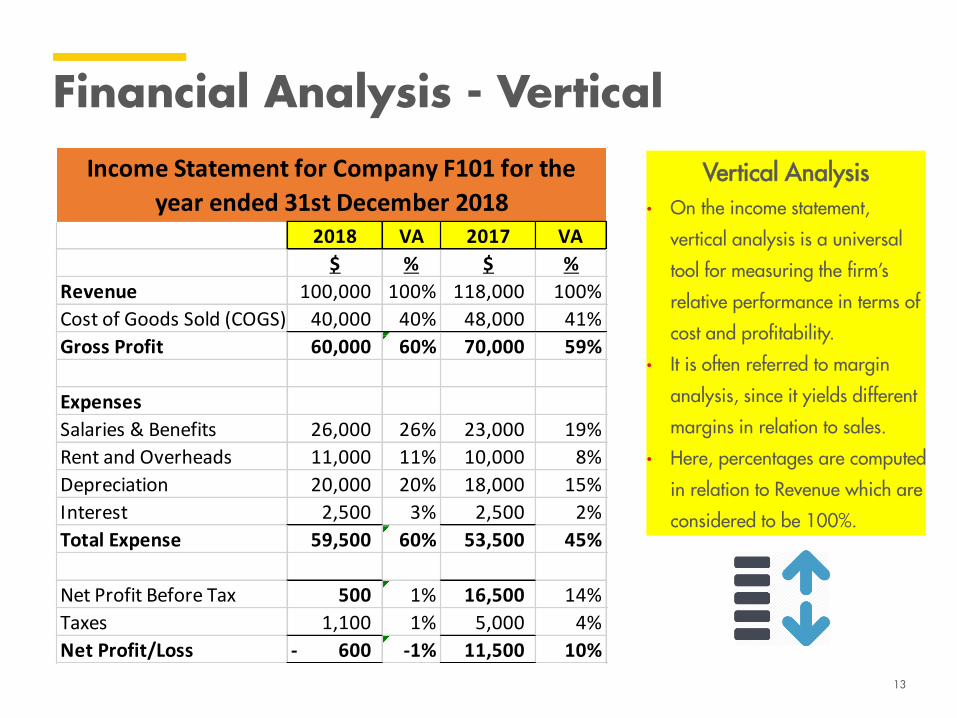
Vertical Analysis• On the income statement,
vertical analysis is a universal
tool for measuring the firm’s
relative performance in terms of
cost and profitability.
• It is often referred to margin
analysis, since it yields different
margins in relation to sales.
• Here, percentages are computed
in relation to Revenue which are
considered to be 100%.
2018 VA 2017 VA
$ % $ %
Revenue 100,000 100% 118,000 100%
Cost of Goods Sold (COGS) 40,000 40% 48,000 41%
Gross Profit 60,000 60% 70,000 59%
Expenses
Salaries & Benefits 26,000 26% 23,000 19%
Rent and Overheads 11,000 11% 10,000 8%
Depreciation 20,000 20% 18,000 15%
Interest 2,500 3% 2,500 2%
Total Expense 59,500 60% 53,500 45%
Net Profit Before Tax 500 1% 16,500 14%
Taxes 1,100 1% 5,000 4%
Net Profit/Loss 600- -1% 11,500 10%
Income Statement for Company F101 for the
year ended 31st December 2018
13
Financial Analysis - Vertical
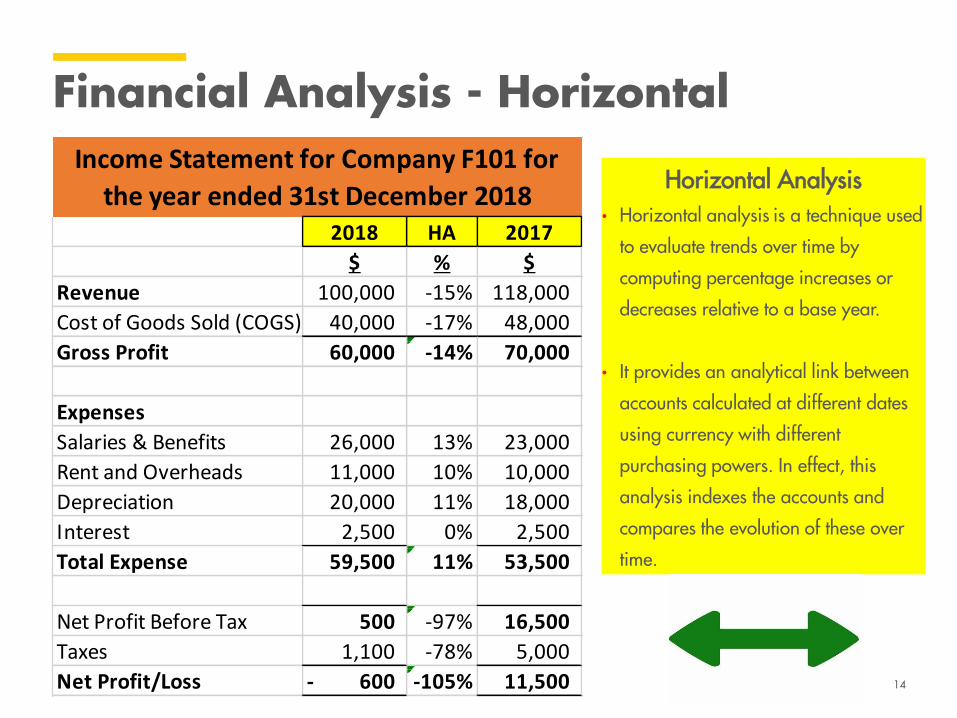
Horizontal Analysis• Horizontal analysis is a technique used
to evaluate trends over time by
computing percentage increases or
decreases relative to a base year.
• It provides an analytical link between
accounts calculated at different dates
using currency with different
purchasing powers. In effect, this
analysis indexes the accounts and
compares the evolution of these over
time.
2018 HA 2017
$ % $
Revenue 100,000 -15% 118,000
Cost of Goods Sold (COGS) 40,000 -17% 48,000
Gross Profit 60,000 -14% 70,000
Expenses
Salaries & Benefits 26,000 13% 23,000
Rent and Overheads 11,000 10% 10,000
Depreciation 20,000 11% 18,000
Interest 2,500 0% 2,500
Total Expense 59,500 11% 53,500
Net Profit Before Tax 500 -97% 16,500
Taxes 1,100 -78% 5,000
Net Profit/Loss 600- -105% 11,500
Income Statement for Company F101 for
the year ended 31st December 2018
14
Financial Analysis - Horizontal
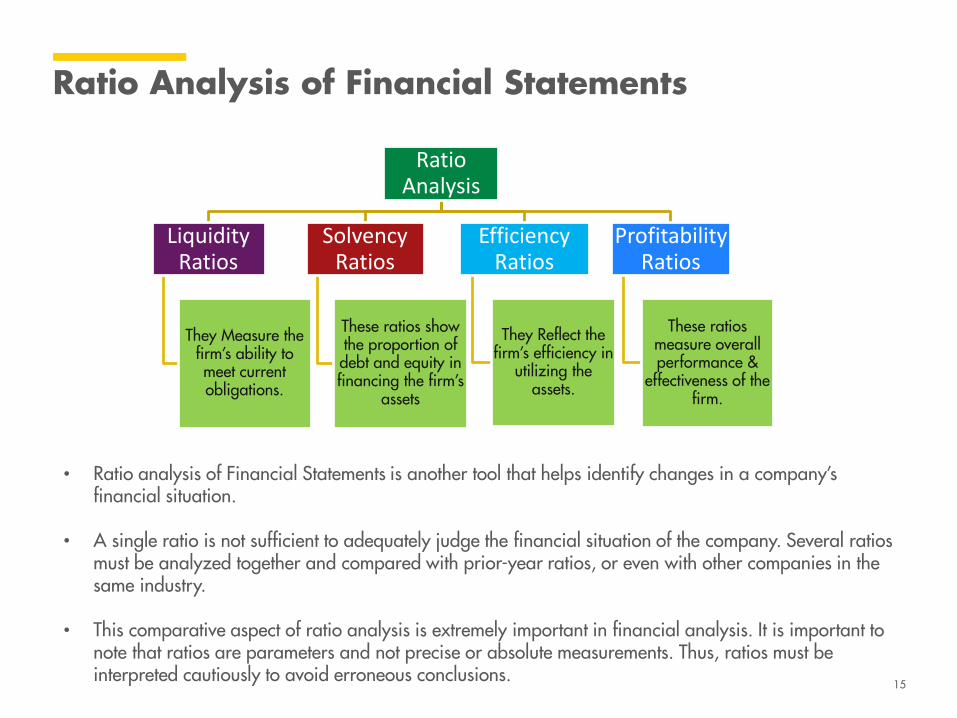
• Ratio analysis of Financial Statements is another tool that helps identify changes in a company’s financial situation.
• A single ratio is not sufficient to adequately judge the financial situation of the company. Several ratios must be analyzed together and compared with prior-year ratios, or even with other companies in the same industry.
• This comparative aspect of ratio analysis is extremely important in financial analysis. It is important to note that ratios are parameters and not precise or absolute measurements. Thus, ratios must be interpreted cautiously to avoid erroneous conclusions.
Ratio Analysis of Financial Statements
Ratio Analysis
Liquidity Ratios
They Measure the firm’s ability to meet current obligations.
Solvency Ratios
These ratios show the proportion of debt and equity in financing the firm’s
assets
Efficiency Ratios
They Reflect the firm’s efficiency in
utilizing the assets.
Profitability Ratios
These ratios measure overall performance &
effectiveness of the firm.
15
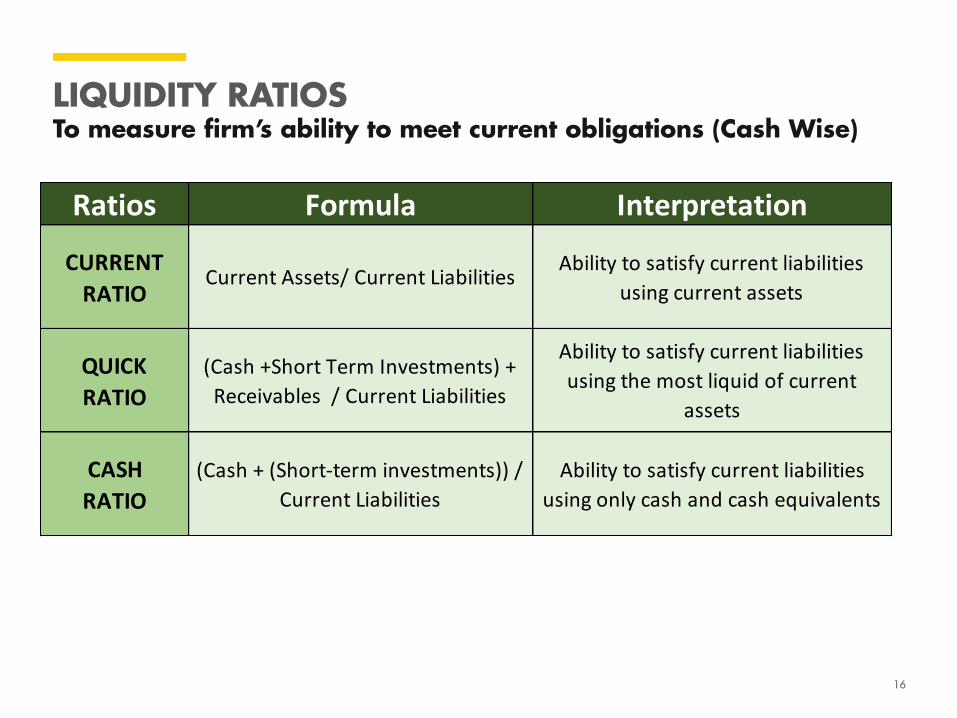
LIQUIDITY RATIOS To measure firm’s ability to meet current obligations (Cash Wise)
Ratios Formula Interpretation
CURRENT
RATIOCurrent Assets/ Current Liabilities
Ability to satisfy current liabilities
using current assets
QUICK
RATIO
(Cash +Short Term Investments) +
Receivables / Current Liabilities
Ability to satisfy current liabilities
using the most liquid of current
assets
CASH
RATIO
(Cash + (Short-term investments)) /
Current Liabilities
Ability to satisfy current liabilities
using only cash and cash equivalents
16

SOLVENCY/LEVERAGE RATIOS These ratios show the proportion of debt and equity in financing the firm’s assets
Ratios Formula Interpretation
SOLVENCY
RATIOTotal Assets / Total Liabilities
Shows the firms's ability to cover its
Total liabilities over its Total assets
DEBT TO
EQUITY
RATIO
Total Liabilities / Total Owners'
Equity
Debt to equity ratio compares total
liabilities to owner's equity
DEBT TO
ASSETS
RATIO
Total Liabilities / Total AssetsDebt to asset ratio shows the
percentage of assets through debt
17

EFFICIENCY RATIOSThey Reflect the firm’s efficiency in utilizing the assets.
Ratios Formula Interpretation
ACCOUNT RECEIVABLE TURNOVER
Credit Sales / Average Account Receivables
This ratio measures how quickly a company collects bills from its
customers. It is an indicator of how efficient a company’s credit policies.
INVENTORY TURNOVER
COGS / Average InventoryInventory turnover ratio measures how
efficiently a company manages its inventory.
FIXED ASSET TURNOVER
Sales / Average Fixed AssetsThe fixed assets turnover ratio
measures the efficiency of a company’s long-term capital investments.
ACCOUNT PAYABLE
TURNOVERTotal Purchases / Average Payables
This measures how a company manages its own bills.
18

PROFITABILITY RATIOSThese ratios measure overall performance & effectiveness of the firm.
Ratios Formula Interpretation
PROFIT MARGIN
Net Income / Total RevenueShows management's ability to
generate sales, control expenses and provide a net profit
GROSS PROFIT
MARGINGross Profit / Total Revenue
Shows management's ability to generate sales, control expenses and
provide a gross profit.
RETURNS ON ASSETS RATIO
Net Income / Total AssetsReturn on assets show the firm's ability to use total assets to generate income
statement
RETURN ON EQUITY RATIOS
Net Income / Total Owner's EquityShows the firm's ability to use owner's
equity to generate net income.
19

PART 3
PROJECTIONS AND BUDGETING
21
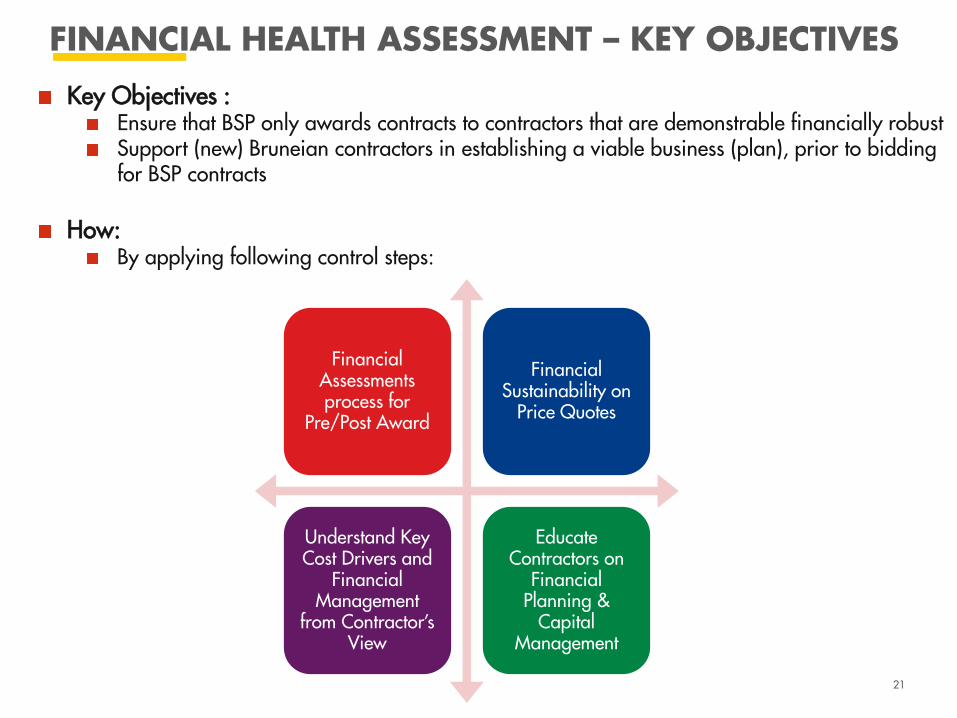
FINANCIAL HEALTH ASSESSMENT – KEY OBJECTIVES
Key Objectives : Ensure that BSP only awards contracts to contractors that are demonstrable financially robustSupport (new) Bruneian contractors in establishing a viable business (plan), prior to bidding for BSP contracts
How: By applying following control steps:
Financial Assessments process for
Pre/Post Award
Financial Sustainability on
Price Quotes
Understand Key Cost Drivers and
Financial Management
from Contractor’s View
Educate Contractors on
Financial Planning &
Capital Management

FINANCE EVALUATION: METHODS
• Financial Assessment of existing financial status of potential contractors (bidders).
• This include ascertaining their current liquidity positions and profitability ratios.
Financial Health Check
• A breakdown of projected Cash Outflow and Inflows throughout tender contract period.
• Assessment of the potential contractor’s financial and capital planning management strategy.
• Assessment of financial sustainability on rates quoted
Cash Flow Projection
• Profitability projection of the potential contractor during tender contract period.
• Understanding on the breakdown of cost elements
• Provides clear understanding on contractor’s contract strategy.
Financial Statements Projection
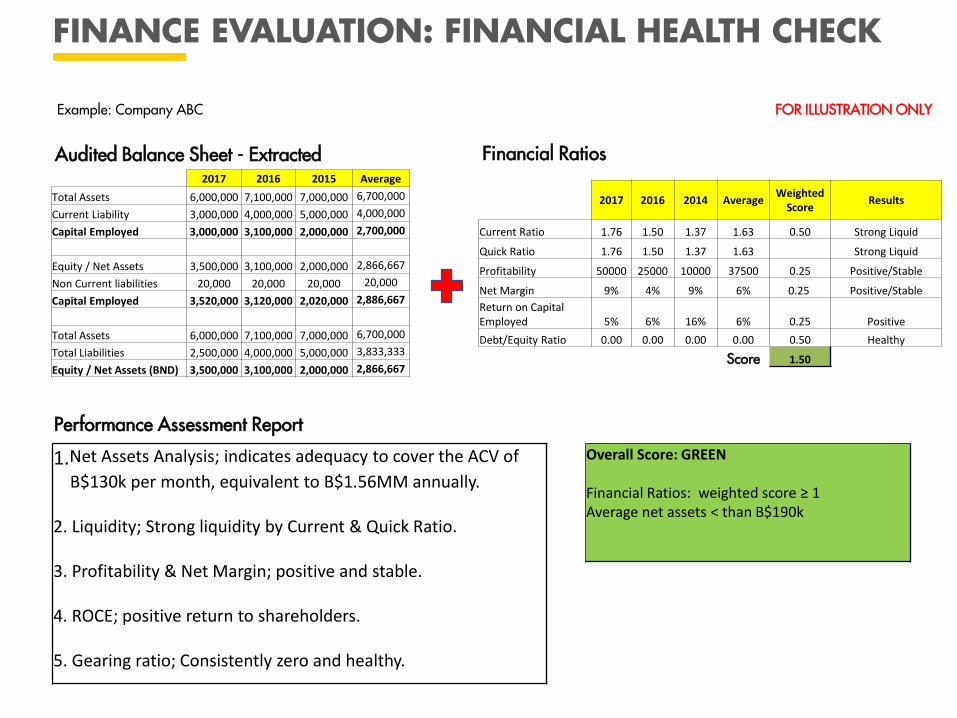
FINANCE EVALUATION: FINANCIAL HEALTH CHECK
Example: Company ABC FOR ILLUSTRATION ONLY
Audited Balance Sheet - Extracted2017 2016 2015 Average
Total Assets 6,000,000 7,100,000 7,000,000 6,700,000
Current Liability 3,000,000 4,000,000 5,000,000 4,000,000
Capital Employed 3,000,000 3,100,000 2,000,000 2,700,000
Equity / Net Assets 3,500,000 3,100,000 2,000,000 2,866,667
Non Current liabilities 20,000 20,000 20,000 20,000
Capital Employed 3,520,000 3,120,000 2,020,000 2,886,667
Total Assets 6,000,000 7,100,000 7,000,000 6,700,000
Total Liabilities 2,500,000 4,000,000 5,000,000 3,833,333
Equity / Net Assets (BND) 3,500,000 3,100,000 2,000,000 2,866,667
2017 2016 2014 AverageWeighted
ScoreResults
Current Ratio 1.76 1.50 1.37 1.63 0.50 Strong Liquid
Quick Ratio 1.76 1.50 1.37 1.63 Strong Liquid
Profitability 50000 25000 10000 37500 0.25 Positive/Stable
Net Margin 9% 4% 9% 6% 0.25 Positive/Stable
Return on Capital Employed 5% 6% 16% 6% 0.25 Positive
Debt/Equity Ratio 0.00 0.00 0.00 0.00 0.50 Healthy
1.50
Financial Ratios
Overall Score: GREEN
Financial Ratios: weighted score ≥ 1Average net assets < than B$190k
Performance Assessment Report
1.Net Assets Analysis; indicates adequacy to cover the ACV of
B$130k per month, equivalent to B$1.56MM annually.
2. Liquidity; Strong liquidity by Current & Quick Ratio.
3. Profitability & Net Margin; positive and stable.
4. ROCE; positive return to shareholders.
5. Gearing ratio; Consistently zero and healthy.
Score

FINANCE EVALUATION: CASH FLOW PROJECTION
Month / YearYEAR 1
1 2 3 4 5 6
CASH INFLOW
Monthly Opening Balance $ - $ - $ - $ - $ - $ -
Operating Revenue
Cash Payment from Contract $ - $ - $ - $ - $ - $ -
Collection of Receivables $ - $ - $ - $ - $ - $ -
Cash Investments $ - $ - $ - $ - $ - $ -
Total Operating Revenue $ - $ - $ - $ - $ - $ -
Non-Operating Cash Inflows
Funds Borrowed $ - $ - $ - $ - $ - $ -
Proceeds from sale of assets $ - $ - $ - $ - $ - $ -
Proceeds from Investment withdrawal $ - $ - $ - $ - $ - $ -
Total Non-Operating Cash Inflow $ - $ - $ - $ - $ - $ -
TOTAL CASH INFLOW $ - $ - $ - $ - $ - $ -
CASH
OUTFLOW
Inventory Purchases $ - $ - $ - $ - $ - $ -
Other Cost of Goods $ - $ - $ - $ - $ - $ -
Total Cost of Goods $ - $ - $ - $ - $ - $ -
Operating Expenses
Salaries and Wages $ - $ - $ - $ - $ - $ -
Other Employee Benefit Expenses $ - $ - $ - $ - $ - $ -
Directors Fees, allowances and expenses $ - $ - $ - $ - $ - $ -
Office Rental $ - $ - $ - $ - $ - $ -
Entertainment $ - $ - $ - $ - $ - $ -
Utilities & Bills $ - $ - $ - $ - $ - $ -
Bank charges $ - $ - $ - $ - $ - $ -
Professional Fees $ - $ - $ - $ - $ - $ -
Office Expenses $ - $ - $ - $ - $ - $ -
Repair & Maintenance $ - $ - $ - $ - $ - $ -
Regulatory Fees $ - $ - $ - $ - $ - $ -
Funds Financing repayment $ - $ - $ - $ - $ - $ -
Insurance $ - $ - $ - $ - $ - $ -
Motor Vehicle Expenses $ - $ - $ - $ - $ - $ -
Office Equipment Purchase $ - $ - $ - $ - $ - $ -
Operational Equipment Purchase $ - $ - $ - $ - $ - $ -
Furniture and Fittings $ - $ - $ - $ - $ - $ -
Promotional Expenses $ - $ - $ - $ - $ - $ -
Taxes $ - $ - $ - $ - $ - $ -
Total Operating Expenses $ - $ - $ - $ - $ - $ -
TOTAL CASH OUTFLOW $ - $ - $ - $ - $ - $ -
Auto Calculate MONTHLY NET CASH FLOW $ - $ - $ - $ - $ - $ -
Auto Calculate CASH BALANCE AT MONTH END $ - $ - $ - $ - $ - $ -
Monthly cash inflow and
outflow breakdown projection.
Assessment of the cashflow
health during the contract
tender period.
Identify key cash flow drivers.
Capital Management Strategy.
Justification of prices and
rates.
Payment terms and frequency.
Company Estimation cash
flow view.
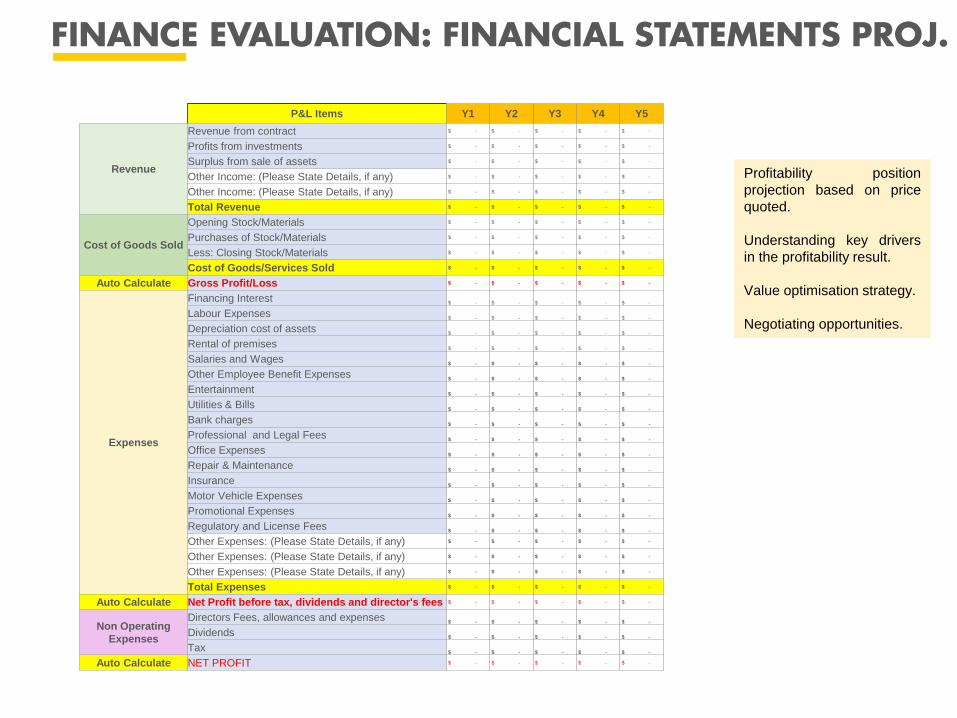
FINANCE EVALUATION: FINANCIAL STATEMENTS PROJ.
Profitability position
projection based on price
quoted.
Understanding key drivers
in the profitability result.
Value optimisation strategy.
Negotiating opportunities.
P&L Items Y1 Y2 Y3 Y4 Y5
Revenue
Revenue from contract $ - $ - $ - $ - $ -
Profits from investments $ - $ - $ - $ - $ -
Surplus from sale of assets $ - $ - $ - $ - $ -
Other Income: (Please State Details, if any) $ - $ - $ - $ - $ -
Other Income: (Please State Details, if any) $ - $ - $ - $ - $ -
Total Revenue $ - $ - $ - $ - $ -
Cost of Goods Sold
Opening Stock/Materials $ - $ - $ - $ - $ -
Purchases of Stock/Materials $ - $ - $ - $ - $ -
Less: Closing Stock/Materials $ - $ - $ - $ - $ -
Cost of Goods/Services Sold $ - $ - $ - $ - $ -
Auto Calculate Gross Profit/Loss $ - $ - $ - $ - $ -
Expenses
Financing Interest$ - $ - $ - $ - $ -
Labour Expenses$ - $ - $ - $ - $ -
Depreciation cost of assets$ - $ - $ - $ - $ -
Rental of premises$ - $ - $ - $ - $ -
Salaries and Wages$ - $ - $ - $ - $ -
Other Employee Benefit Expenses$ - $ - $ - $ - $ -
Entertainment$ - $ - $ - $ - $ -
Utilities & Bills$ - $ - $ - $ - $ -
Bank charges$ - $ - $ - $ - $ -
Professional and Legal Fees$ - $ - $ - $ - $ -
Office Expenses$ - $ - $ - $ - $ -
Repair & Maintenance$ - $ - $ - $ - $ -
Insurance$ - $ - $ - $ - $ -
Motor Vehicle Expenses$ - $ - $ - $ - $ -
Promotional Expenses$ - $ - $ - $ - $ -
Regulatory and License Fees$ - $ - $ - $ - $ -
Other Expenses: (Please State Details, if any) $ - $ - $ - $ - $ -
Other Expenses: (Please State Details, if any) $ - $ - $ - $ - $ -
Other Expenses: (Please State Details, if any) $ - $ - $ - $ - $ -
Total Expenses $ - $ - $ - $ - $ -
Auto Calculate Net Profit before tax, dividends and director's fees $ - $ - $ - $ - $ -
Non Operating
Expenses
Directors Fees, allowances and expenses$ - $ - $ - $ - $ -
Dividends$ - $ - $ - $ - $ -
Tax$ - $ - $ - $ - $ -
Auto Calculate NET PROFIT $ - $ - $ - $ - $ -

FINANCE CLINICHow can we help you?

Recap….
THANK YOU
FOR YOUR ATTENTION