eastside statistics you must know...
TRANSCRIPT
SeptemberNovember
2016November
2015Difference
% Change
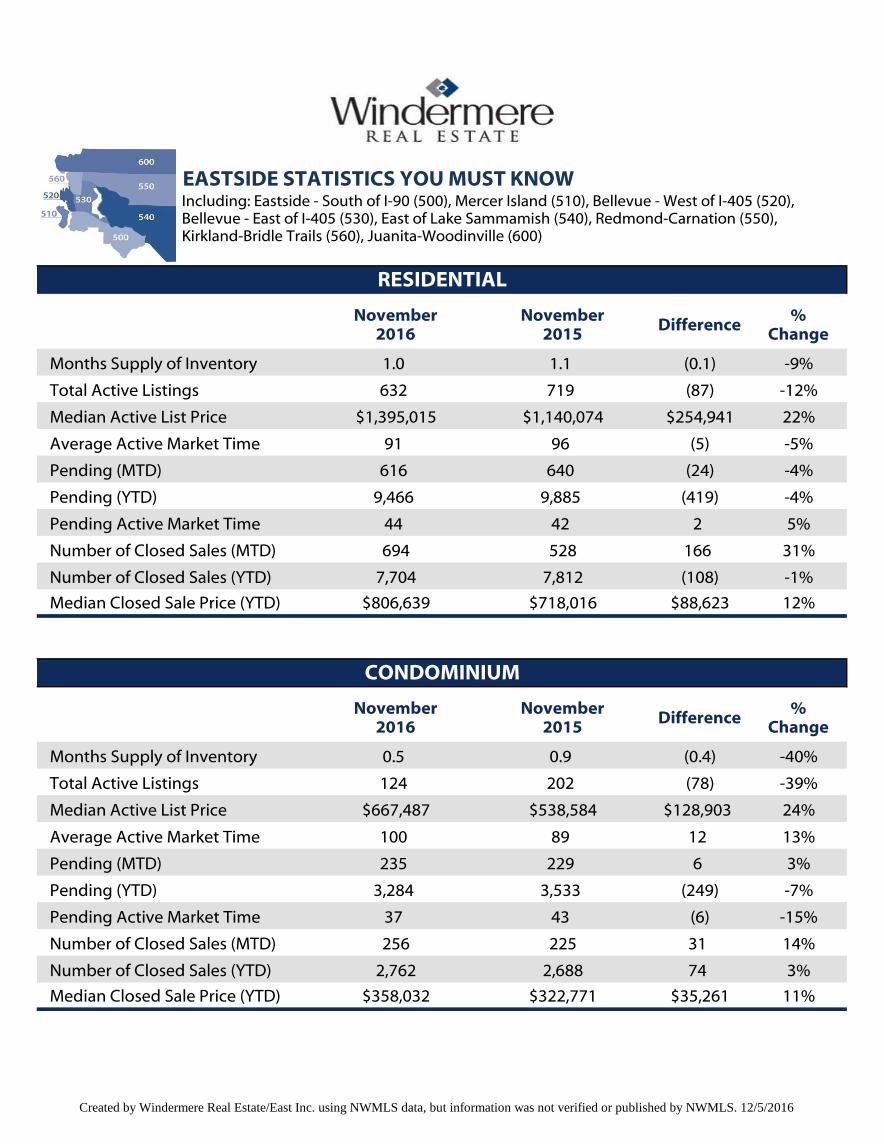
Months Supply of Inventory 1.0 1.1 (0.1) -9%
Total Active Listings 632 719 (87) -12%
Median Active List Price $1,395,015 $1,140,074 $254,941 22%
Average Active Market Time 91 96 (5) -5%
Pending (MTD) 616 640 (24) -4%
Pending (YTD) 9,466 9,885 (419) -4%
Pending Active Market Time 44 42 2 5%
Number of Closed Sales (MTD) 694 528 166 31%
Number of Closed Sales (YTD) 7,704 7,812 (108) -1%
Median Closed Sale Price (YTD) $806,639 $718,016 $88,623 12%
November2016
November2015
Difference%
Change
Months Supply of Inventory 0.5 0.9 (0.4) -40%
Total Active Listings 124 202 (78) -39%
Median Active List Price $667,487 $538,584 $128,903 24%
Average Active Market Time 100 89 12 13%
Pending (MTD) 235 229 6 3%
Pending (YTD) 3,284 3,533 (249) -7%
Pending Active Market Time 37 43 (6) -15%
Number of Closed Sales (MTD) 256 225 31 14%
Number of Closed Sales (YTD) 2,762 2,688 74 3%
Median Closed Sale Price (YTD) $358,032 $322,771 $35,261 11%
EASTSIDE STATISTICS YOU MUST KNOWIncluding: Eastside - South of I-90 (500), Mercer Island (510), Bellevue - West of I-405 (520), Bellevue - East of I-405 (530), East of Lake Sammamish (540), Redmond-Carnation (550), Kirkland-Bridle Trails (560), Juanita-Woodinville (600)
RESIDENTIAL
CONDOMINIUM
Created by Windermere Real Estate/East Inc. using NWMLS data, but information was not verified or published by NWMLS. 12/5/2016

EASTSIDE SUMMARY REPORT - RESIDENTIAL AND CONDOMINUMIncluding: Eastside - South of I-90 (500), Mercer Island (510), Bellevue - West of I-405 (520), Bellevue - East of I-405 (530),East of Lake Sammamish (540), Redmond-Carnation (550), Kirkland-Bridle Trails (560), Juanita-Woodinville/Duvall (600)
JAN FEB MAR APR MAY JUN JUL AUG SEP OCT NOV
NOV 16vs. NOV 15% Change
Year to Date
Year over
Year % Change
Annual Totals
# of Agents 5,412 5,494 5,535 5,563 5,601 5,668 5,722 5,800 5,849 5,849 5,883 9% 5,671 8% A
# of Active Listings 742 788 932 1,123 1,130 1,341 1,493 1,371 1,352 1,059 756 -18% 1,099 -21% A
# of Pending Transactions 749 967 1,176 1,251 1,451 1,412 1,267 1,275 1,214 1,137 851 -2% 12,750 -5% T
Average List Price of Pending 737,147 745,904 750,034 777,514 760,058 780,640 769,864 802,127 751,507 839,278 704,800 2% 768,450 12% WA
Months Supply of Inventory 1.0 0.8 0.8 0.9 0.8 0.9 1.2 1.1 1.1 0.9 0.9 -16% 0.9 -16% WA
# of Agents 5,032 5,081 5,152 5,230 5,266 5,326 5,343 5,350 5,378 5,386 5,376 5,372 5,265 12% A 5,274
# of Active Listings 1,147 1,235 1,268 1,425 1,577 1,629 1,659 1,594 1,472 1,277 921 682 1,382 -20% A 1,324
# of Pending Transactions 825 1,030 1,351 1,386 1,481 1,471 1,383 1,303 1,208 1,111 869 566 13,418 8% T 13,984
Average List Price of Pending 606,025 638,374 702,025 712,753 703,056 702,807 702,487 684,047 679,345 690,482 693,707 757,699 687,310 6% WA 690,159
Months Supply of Inventory 1.4 1.2 0.9 1.0 1.1 1.1 1.2 1.2 1.2 1.1 1.1 1.2 1.1 -26% WA 1.1
# of Agents 4,437 4,527 4,583 4,636 4,696 4,716 4,756 4,788 4,822 4,838 4,956 5,018 4,705 10% A 4,731
# of Active Listings 1,194 1,265 1,368 1,474 1,820 1,974 2,189 2,284 2,087 1,893 1,499 1,149 1,732 4% A 1,683
# of Pending Transactions 867 876 1,186 1,309 1,401 1,315 1,262 1,157 1,123 1,070 879 671 12,445 -3% T 13,116
Average List Price of Pending 623,998 638,307 659,715 659,022 673,943 647,859 634,925 648,852 652,234 650,229 635,307 659,617 649,258 9% WA 649,787
Months Supply of Inventory 1.4 1.4 1.2 1.1 1.3 1.5 1.7 2.0 1.9 1.8 1.7 1.7 1.5 7% WA 1.5
# of Agents 4,118 4,148 4,183 4,219 4,231 4,292 4,309 4,359 4,402 4,404 4,422 4,434 4,281 -2% A 4,293
# of Active Listings 1,263 1,259 1,292 1,422 1,661 1,844 2,015 2,147 2,092 1,836 1,521 1,230 1,668 -25% A 1,632
# of Pending Transactions 944 1,047 1,229 1,319 1,386 1,338 1,328 1,263 1,062 1,091 830 601 12,837 5% T 13,438
Average List Price of Pending 547,191 584,131 572,434 590,394 618,071 590,325 624,220 619,066 591,509 616,331 602,250 593,368 597,351 13% WA 597,173
Months Supply of Inventory 1.3 1.2 1.1 1.1 1.2 1.4 1.5 1.7 2.0 1.7 1.8 2.0 1.4 -28% WA 1.5
JAN FEB MAR APR MAY JUN JUL AUG SEP OCT NOV DECYear to
DateAnnual Totals
2,609 2,726 2,858 3,047 3,277 3,382 3,510 3,491 3,447 3,205 2,850 2,359 3,128 A 3,064
85% 89% 93% 99% 107% 110% 115% 114% 113% 105% 93% 77% 102% A 100%
733 864 1,099 1,129 1,154 1,137 1,078 1,041 927 922 745 579 10,828 T 11,406
77% 91% 116% 119% 121% 120% 113% 109% 98% 97% 78% 61%
3.6 3.2 2.6 2.7 2.8 3.0 3.3 3.4 3.7 3.5 3.8 4.1 3.2 WA 3.2
111% 98% 81% 84% 88% 92% 101% 104% 115% 108% 119% 126%
20
16
20
15
20
14
20
13
% of monthly active vs. Avg. Month
MONTHLY AVERAGES BASED ON 10 YEARS OF DATA FROM 2006 THROUGH 2015
Months Supply month vs. Avg. Month
% of monthly pending vs. Avg. Month
Months Supply of Inventory
# of Active Listings
# of Pending Transactions
Created by Windermere Real Estate/East Inc. using NWMLS data, but information was not verified or published by NWMLS. A=Average, T=Total, WA=Weighted Average 12/5/2016

EASTSIDE SUMMARY REPORT - RESIDENTIAL AND CONDOMINUMIncluding: Eastside - South of I-90 (500), Mercer Island (510), Bellevue - West of I-405 (520), Bellevue - East of I-405 (530),East of Lake Sammamish (540), Redmond-Carnation (550), Kirkland-Bridle Trails (560), Juanita-Woodinville (600)
JAN FEB MAR APR MAY JUN JUL AUG SEP OCT NOV DECYear to
Date
Year over
Year % Change
Annual Totals
# of Agents 4,446 4,430 4,472 4,435 4,382 4,385 4,402 4,412 4,364 4,347 4,124 4,121 4,382 -5% A 4,360
# of Active Listings 2,514 2,412 2,290 2,329 2,360 2,334 2,322 2,323 2,181 1,821 1,570 1,246 2,223 -38% A 2,142
# of Pending Transactions 805 1,015 1,304 1,232 1,303 1,194 1,151 1,126 1,060 1,202 855 699 12,247 21% T 12,946
Average List Price of Pending 465,072 476,603 502,394 505,279 531,457 572,348 542,443 559,376 564,456 543,752 559,644 510,082 530,436 3% WA 529,337
Months Supply of Inventory 3.1 2.4 1.8 1.9 1.8 2.0 2.0 2.1 2.1 1.5 1.8 1.8 2.0 -49% WA 2.0
# of Agents 4,635 4,654 4,631 4,608 4,601 4,619 4,594 4,591 4,566 4,523 4,491 4,477 4,592 0% A 4,582
# of Active Listings 3,372 3,402 3,557 3,694 3,694 3,932 3,921 3,796 3,634 3,340 2,979 2,551 3,575 -19% A 3,489
# of Pending Transactions 700 838 994 1,002 1,045 995 1,015 959 873 911 804 627 10,136 13% T 10,763
Average List Price of Pending 537,592 522,030 509,390 524,907 571,908 498,981 525,700 510,072 479,790 489,865 494,181 439,187 515,527 -7% WA 511,080
Months Supply of Inventory 4.8 4.1 3.6 3.7 3.5 4.0 3.9 4.0 4.2 3.7 3.7 4.1 3.9 -28% WA 3.9
# of Agents 4,282 4,351 4,507 4,368 4,638 4,712 4,711 4,715 4,825 4,748 4,667 4,627 4,593 1% A 4,596
# of Active Listings 3,742 3,944 4,173 4,404 4,565 4,724 4,992 4,899 4,825 4,454 3,926 3,325 4,423 -8% A 4,331
# of Pending Transactions 723 835 1,106 1,187 751 749 734 738 713 742 718 598 8,996 9% T 9,594
Average List Price of Pending 549,980 545,471 536,226 512,060 646,545 584,256 576,638 548,105 541,974 524,125 556,250 502,366 553,537 -2% WA 550,347
Months Supply of Inventory 5.2 4.7 3.8 3.7 6.1 6.3 6.8 6.6 6.8 6.0 5.5 5.6 5.4 -16% WA 5.4
# of Agents 4,605 4,668 4,690 4,666 4,638 4,454 4,413 4,486 4,498 4,483 4,494 4,491 4,554 -10% A 4,549
# of Active Listings 4,407 4,736 4,927 5,001 5,249 5,144 5,190 4,920 4,780 4,441 4,156 3,460 4,814 -8% A 4,701
# of Pending Transactions 428 431 569 777 825 942 872 948 908 926 643 573 8,269 16% T 8,842
Average List Price of Pending 562,344 540,112 569,890 584,115 605,897 566,660 551,844 574,807 539,565 539,695 547,589 553,345 562,724 -13% WA 562,116
Months Supply of Inventory 10.3 11.0 8.7 6.4 6.4 5.5 6.0 5.2 5.3 4.8 6.5 6.0 6.4 -21% WA 6.4
# of Agents 5,214 5,203 5,229 5,199 5,134 5,050 5,038 4,975 4,923 4,925 4,870 4,741 5,069 -6% A 5,042
# of Active Listings 4,022 4,533 4,914 5,377 5,821 5,581 5,808 5,696 5,531 5,299 4,881 4,235 5,224 44% A 5,142
# of Pending Transactions 495 593 701 734 733 829 730 698 686 473 427 320 7,099 -33% T 7,419
Average List Price of Pending 629,432 671,549 661,645 666,396 663,402 683,005 613,765 613,030 642,208 605,591 637,766 556,719 646,640 0% WA 642,762
Months Supply of Inventory 8.1 7.6 7.0 7.3 7.9 6.7 8.0 8.2 8.1 11.2 11.4 13.2 8.1 115% WA 8.3
# of Agents 5,208 5,258 5,321 5,351 5,380 5,389 5,458 5,485 5,468 5,439 5,400 5,212 5,378 6% A 5,364
# of Active Listings 2,402 2,425 2,661 3,065 3,584 3,947 4,171 4,338 4,648 4,519 4,217 3,543 3,634 40% A 3,627
# of Pending Transactions 794 1,027 1,231 1,111 1,247 1,223 1,105 952 655 663 595 430 10,603 -13% T 11,033
Average List Price of Pending 585,072 670,353 639,801 619,208 670,272 691,658 662,237 623,225 617,476 644,390 646,994 633,515 646,231 9% WA 645,735
Months Supply of Inventory 3.0 2.4 2.2 2.8 2.9 3.2 3.8 4.6 7.1 6.8 7.1 8.2 3.8 61% WA 3.9
# of Agents 4,834 4,868 4,930 4,990 5,049 5,011 5,100 5,180 5,230 5,280 5,285 5,207 5,069 11% A 5,080
# of Active Listings 2,031 2,051 2,134 2,282 2,441 2,711 2,835 2,917 3,218 3,168 2,833 2,165 2,602 5% A 2,566
# of Pending Transactions 744 948 1,322 1,235 1,367 1,315 1,196 1,261 981 1,028 831 701 12,228 -17% T 12,929
Average List Price of Pending 561,442 566,824 578,058 587,545 610,432 609,673 586,090 617,884 611,144 608,440 583,783 603,294 594,644 13% WA 595,113
Months Supply of Inventory 2.7 2.2 1.6 1.8 1.8 2.1 2.4 2.3 3.3 3.1 3.4 3.1 2.3 16% WA 2.4
20
07
20
10
20
09
20
06
20
12
20
11
20
08
Created by Windermere Real Estate/East Inc. using NWMLS data, but information was not verified or published by NWMLS. A=Average, T=Total, WA=Weighted Average 12/5/2016

Average Median
Properties that sold above original list price 7.6
3
6.0
Properties that sold at the original list price 13.3
8.0
Properties that sold below the original list price 25.6 18.0
Properties that sold with a price change 62.8 46.0
Properties that sold above
the original list price
Average percentage over OLP 5.37%
Median percentage over OLP 4.23%
Range of percentage over OLP 0.01 to 33.69%
Properties that sold below
the original list price
Average percentage below OLP 3.35%
Median percentage below OLP 2.37%
% Range of percentage below OLP 0.11 to 18.72%
Moving from For Sale to Sold
Eastside November 2016 – Additional Analysis
% of Properties
sold
Number of
properties sold
Properties that sold above original list price 37% 259
Properties that sold at the original list price 15% 104
Properties that sold below the original list price 19% 128
Properties that sold with a price change 29% 202
Totals 100% 693
Percentage Above/Below Original List Price
Cumulative Days on the market
* Sold means residential properties with a sold status date in November 2016 located in Eastside.
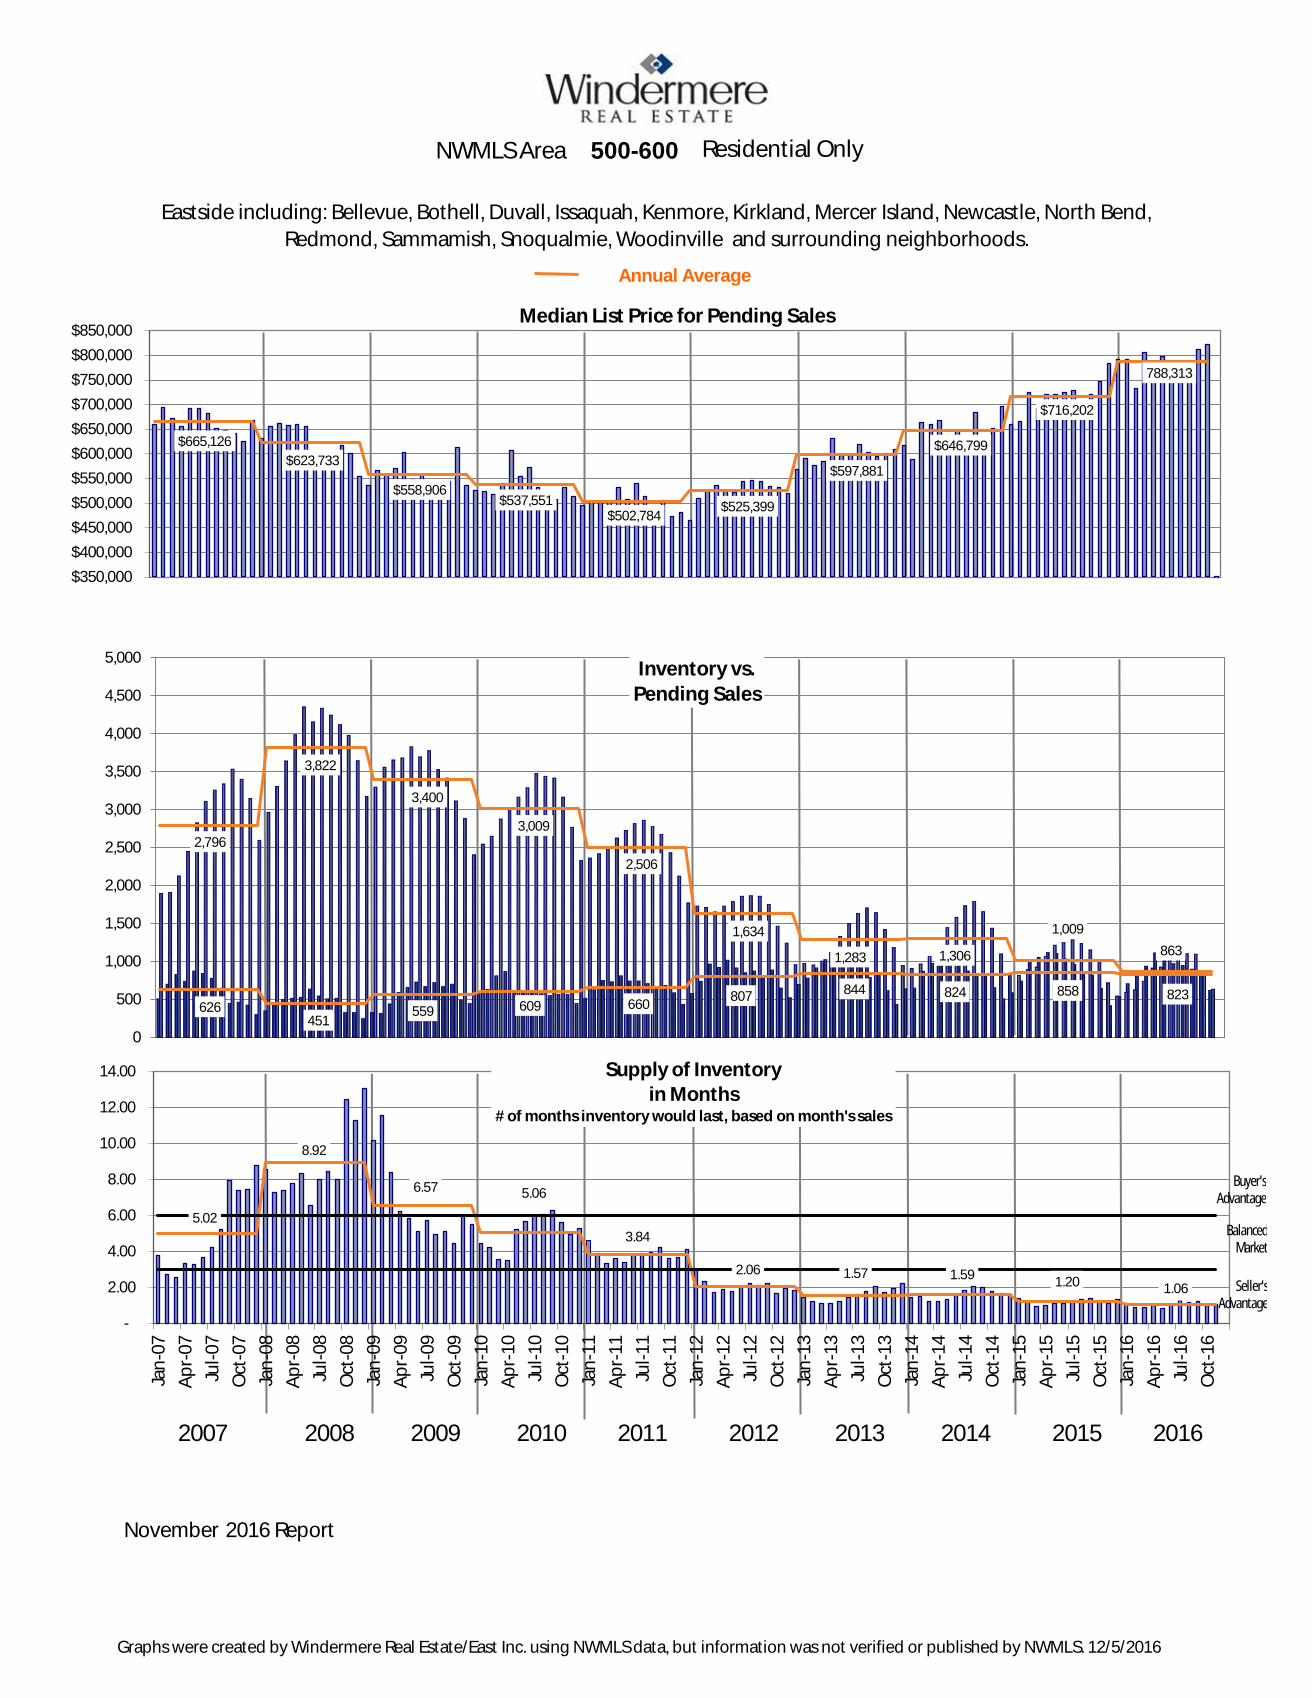
500-600
November 2016 Report
Eastside including: Bellevue, Bothell, Duvall, Issaquah, Kenmore, Kirkland, Mercer Island, Newcastle, North Bend,
Redmond, Sammamish, Snoqualmie, Woodinville and surrounding neighborhoods.
Annual Average
2007 2008 2009 2010 2011 2012 2013 2014 2015 2016
5.02
8.92
6.57 5.06
3.84
2.06 1.57 1.59 1.20
1.06 1.06
-
2.00
4.00
6.00
8.00
10.00
12.00
14.00
Jan
-07
Ap
r-0
7
Jul-
07
Oct
-07
Jan
-08
Ap
r-0
8
Jul-
08
Oct
-08
Jan
-09
Ap
r-0
9
Jul-
09
Oct
-09
Jan
-10
Ap
r-1
0
Jul-
10
Oct
-10
Jan
-11
Ap
r-1
1
Jul-
11
Oct
-11
Jan
-12
Ap
r-1
2
Jul-
12
Oct
-12
Jan
-13
Ap
r-1
3
Jul-
13
Oct
-13
Jan
-14
Ap
r-1
4
Jul-
14
Oct
-14
Jan
-15
Ap
r-1
5
Jul-
15
Oct
-15
Jan
-16
Ap
r-1
6
Jul-
16
Oct
-16
Supply of Inventory in Months
# of months inventory would last, based on month's sales
$665,126
$623,733
$558,906$537,551
$502,784$525,399
$597,881
$646,799
$716,202
788,313
$350,000
$400,000
$450,000
$500,000
$550,000
$600,000
$650,000
$700,000
$750,000
$800,000
$850,000Median List Price for Pending Sales
626 451
559 609 660 807 844 824 858 823
2,796
3,822
3,400
3,009
2,506
1,634
1,283 1,306
1,009
863
0
500
1,000
1,500
2,000
2,500
3,000
3,500
4,000
4,500
5,000Inventory vs.
Pending Sales
Buyer's Advantage
Balanced Market
Seller's Advantage
NWMLS Area Residential Only
Graphs were created by Windermere Real Estate/East Inc. using NWMLS data, but information was not verified or published by NWMLS. 12/5/2016
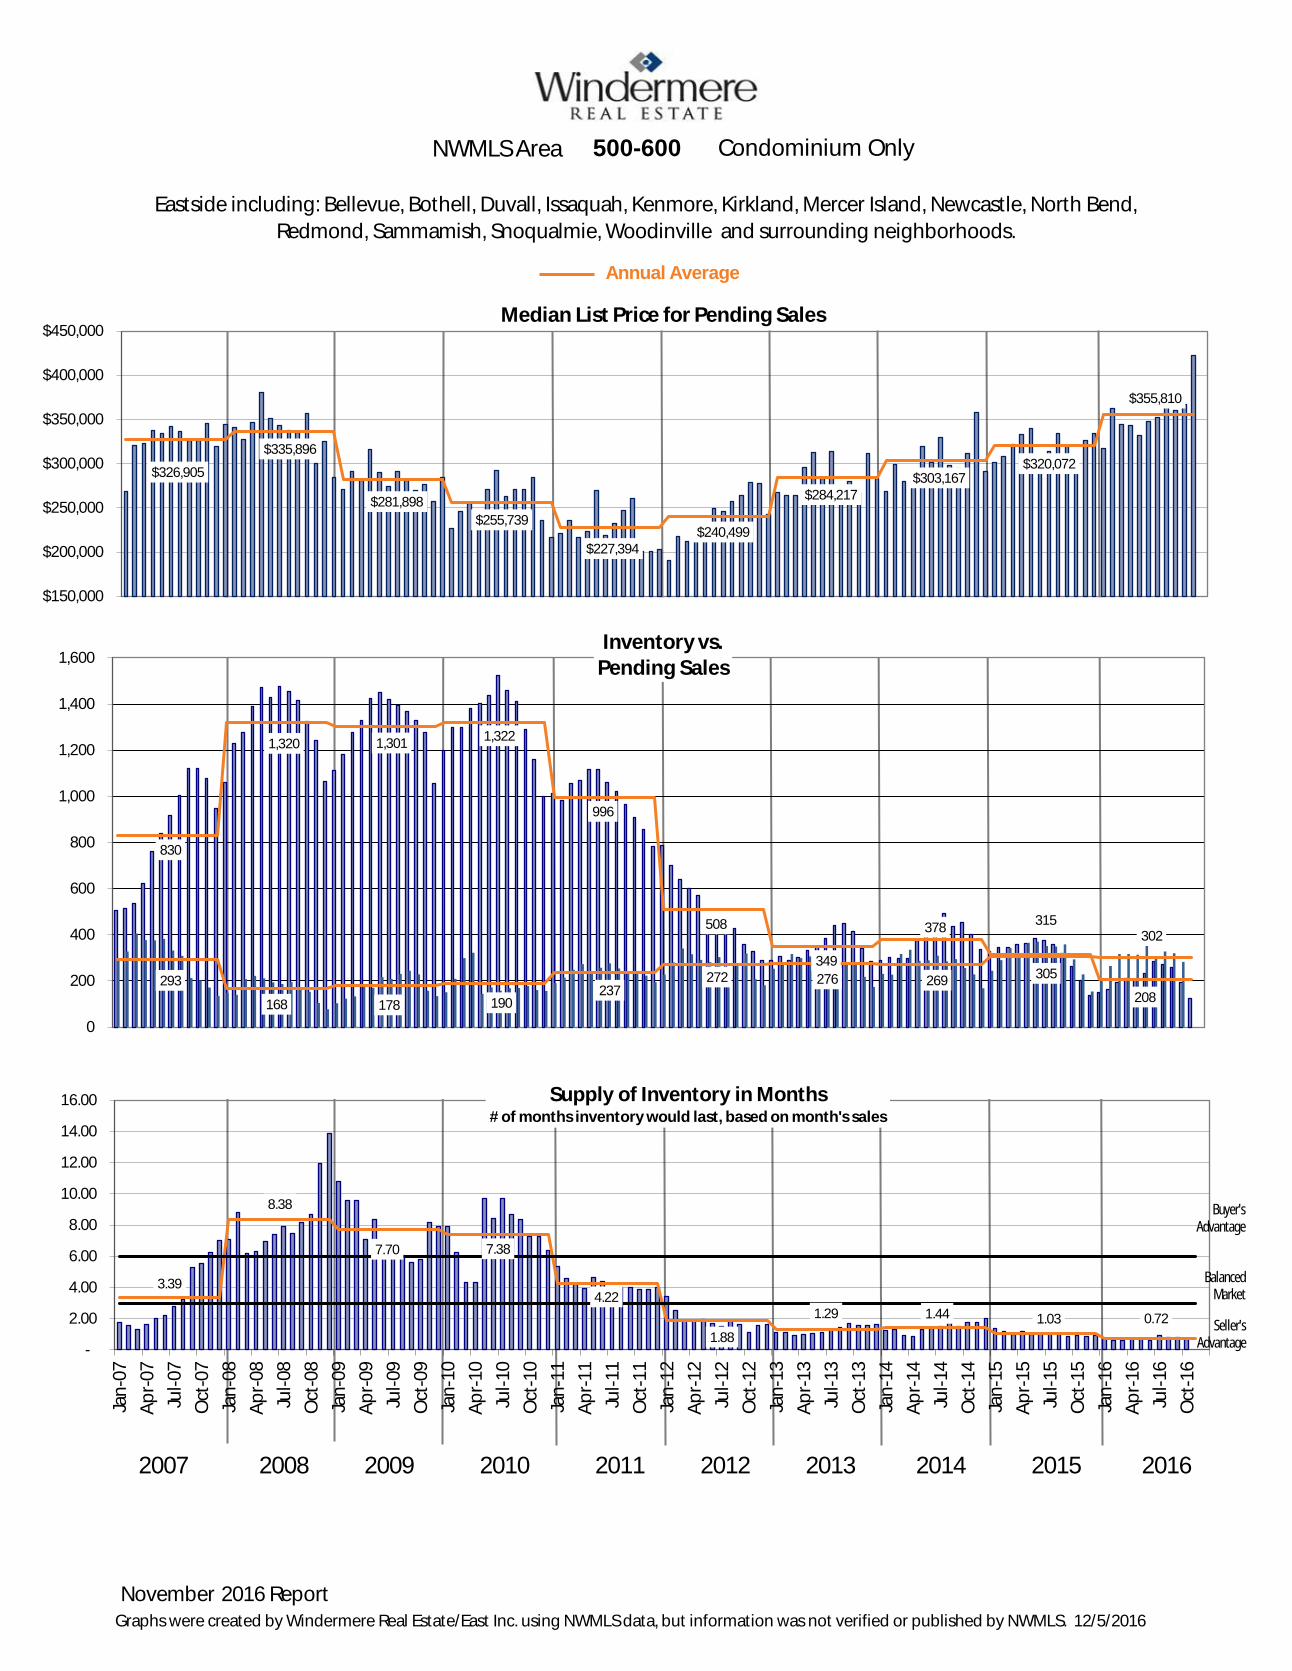
November 2016 Report
2007 2008 2009 2010 2011 2012 2013 2014 2015 2016
500-600
Annual Average
Eastside including: Bellevue, Bothell, Duvall, Issaquah, Kenmore, Kirkland, Mercer Island, Newcastle, North Bend,
Redmond, Sammamish, Snoqualmie, Woodinville and surrounding neighborhoods.
3.39
8.38
7.70 7.38
4.22
1.88
1.29 1.44 1.03 0.72
-
2.00
4.00
6.00
8.00
10.00
12.00
14.00
16.00
Jan
-07
Ap
r-0
7
Jul-
07
Oct
-07
Jan
-08
Ap
r-0
8
Jul-
08
Oct
-08
Jan
-09
Ap
r-0
9
Jul-
09
Oct
-09
Jan
-10
Ap
r-1
0
Jul-
10
Oct
-10
Jan
-11
Ap
r-1
1
Jul-
11
Oct
-11
Jan
-12
Ap
r-1
2
Jul-
12
Oct
-12
Jan
-13
Ap
r-1
3
Jul-
13
Oct
-13
Jan
-14
Ap
r-1
4
Jul-
14
Oct
-14
Jan
-15
Ap
r-1
5
Jul-
15
Oct
-15
Jan
-16
Ap
r-1
6
Jul-
16
Oct
-16
Supply of Inventory in Months# of months inventory would last, based on month's sales
$326,905
$335,896
$281,898
$255,739
$227,394$240,499
$284,217$303,167
$320,072
$355,810
$150,000
$200,000
$250,000
$300,000
$350,000
$400,000
$450,000Median List Price for Pending Sales
830
1,320 1,301 1,322
996
508
349
378 315
208 293
168 178 190 237
272 276 269 305
302
0
200
400
600
800
1,000
1,200
1,400
1,600Inventory vs.
Pending Sales
Buyer'sAdvantage
Balanced Market
Seller'sAdvantage
NWMLS Area Condominium Only
Graphs were created by Windermere Real Estate/East Inc. using NWMLS data, but information was not verified or published by NWMLS. 12/5/2016

EASTSIDE CLOSED & ACTIVE INVENTORY BY PRICE RANGE - RESIDENTIAL & CONDOIncluding: Eastside - South of I-90 (500), Mercer Island (510), Bellevue - West of I-405 (520), Bellevue - East of I-405 (530),East of Lake Sammamish (540), Redmond-Carnation (550), Kirkland-Bridle Trails (560), Juanita-Woodinville/Duvall (600)
Sales Price
ClosedSales
January
ClosedSales
February
ClosedSales
March
ClosedSalesApril
ClosedSalesMay
ClosedSalesJune
ClosedSalesJuly
ClosedSales
August
ClosedSales
September
ClosedSales
October
ClosedSales
November
ClosedSales
December Total
Active on 11/30/16 by
List Price
Months Supply of
Inventory*
$0 to $349,999 114 99 153 164 164 167 171 176 130 176 134 - 1,648 58 0.4
$350,000 to $499,999 103 88 122 150 147 186 165 158 167 122 141 - 1,549 50 0.4
$500,000 to $749,999 159 154 234 304 298 413 368 349 314 327 301 - 3,221 124 0.4
$750,000 to $999,999 110 117 149 167 229 243 268 250 186 227 162 - 2,108 139 0.9
$1,000,000 to $1,499,999 37 53 79 94 117 160 127 154 140 124 132 - 1,217 147 1.1
$1,500,000 to $2,999,999 20 24 58 50 62 69 71 62 63 73 66 - 618 146 2.2
$3,000,000 and up 10 8 5 8 15 13 17 12 13 8 14 - 123 94 6.7
Totals 553 543 800 937 1,032 1,251 1,187 1,161 1,013 1,057 950 - 10,484 758 0.8
Sales Price
ClosedSales
January
ClosedSales
February
ClosedSales
March
ClosedSalesApril
ClosedSalesMay
ClosedSalesJune
ClosedSalesJuly
ClosedSales
August
ClosedSales
September
ClosedSales
October
ClosedSales
November
ClosedSales
December Total
Active on 11/30/15 by
List Price
Months Supply of
Inventory*
$0 to $349,999 131 153 187 185 206 219 234 222 196 191 158 160 2,082 120 0.8
$350,000 to $499,999 109 107 203 188 196 250 223 204 215 211 147 146 2,053 72 0.5
$500,000 to $749,999 148 163 255 299 344 394 363 363 310 286 212 268 3,137 174 0.8
$750,000 to $999,999 104 90 140 190 189 214 215 178 190 179 138 153 1,827 205 1.5
$1,000,000 to $1,499,999 38 35 52 68 92 112 127 101 80 84 63 81 852 131 2.1
$1,500,000 to $2,999,999 24 23 49 37 49 62 61 61 51 37 31 44 485 146 4.7
$3,000,000 and up 4 4 3 5 13 15 8 14 10 11 9 3 96 61 6.8
Totals 558 575 889 972 1,089 1,266 1,231 1,143 1,052 999 758 855 10,532 909 1.2
Sales Price
ClosedSales
January
ClosedSales
February
ClosedSales
March
ClosedSalesApril
ClosedSalesMay
ClosedSalesJune
ClosedSalesJuly
ClosedSales
August
ClosedSales
September
ClosedSales
October
ClosedSales
November
ClosedSales
December TotalActive by List Price
Months Supply of
Inventory*
$0 to $349,999 -13% -35% -18% -11% -20% -24% -27% -21% -34% -8% -15% -21% -52% -43%
$350,000 to 499,999 -6% -18% -40% -20% -25% -26% -26% -23% -22% -42% -4% -25% -31% -28%
$500,000 to $749,999 7% -6% -8% 2% -13% 5% 1% -4% 1% 14% 42% 3% -29% -50%
$750,000 to $999,999 6% 30% 6% -12% 21% 14% 25% 40% -2% 27% 17% 15% -32% -42%
$1,000,000 to $1,499,999 -3% 51% 52% 38% 27% 43% 0% 52% 75% 48% 110% 43% 12% -46%
$1,500,000 to $2,999,999 -17% 4% 18% 35% 27% 11% 16% 2% 24% 97% 113% 27% 0% -53%
$3,000,000 and up 150% 100% 67% 113% -14% 30% 56% 28% 54% -1%
Totals -1% -6% -10% -4% -5% -1% -4% 2% -4% 6% 25% 0% -17% -33%
* Months supply of inventory is calculated by dividing Active Inventory by the number of closed sales for the last month, rounded to the nearest month.
2016
2015
% Change
Created by Windermere Real Estate/East Inc. using NWMLS data, but information was not verified or published by NWMLS. 12/7/2016

EASTSIDE CLOSED & ACTIVE INVENTORY BY PRICE RANGE - RESIDENTIALIncluding: Eastside - South of I-90 (500), Mercer Island (510), Bellevue - West of I-405 (520), Bellevue - East of I-405 (530),East of Lake Sammamish (540), Redmond-Carnation (550), Kirkland-Bridle Trails (560), Juanita-Woodinville/Duvall (600)
Sales Price
ClosedSales
January
ClosedSales
February
ClosedSales
March
ClosedSalesApril
ClosedSalesMay
ClosedSalesJune
ClosedSalesJuly
ClosedSales
August
ClosedSales
September
ClosedSales
October
ClosedSales
November
ClosedSales
December Total
Active on 11/30/16 by
List Price
Months Supply of
Inventory*
$0 to $349,999 15 8 17 19 22 26 24 22 12 22 17 204 16 0.9
$350,000 to $499,999 72 51 69 82 84 92 95 84 93 61 71 854 29 0.4
$500,000 to $749,999 136 138 202 243 252 355 327 309 274 275 249 2,760 112 0.4
$750,000 to $999,999 105 108 138 166 217 235 256 241 181 209 156 2,012 122 0.8
$1,000,000 to $1,499,999 36 51 74 89 111 154 122 149 135 118 127 1,166 125 1.0
$1,500,000 to $2,999,999 20 24 58 48 59 66 67 60 62 69 59 592 137 2.3
$3,000,000 and up 10 8 5 8 15 13 17 12 13 8 14 123 91 6.5
Totals 394 388 563 655 760 941 908 877 770 762 693 - 7,711 632 0.9
Sales Price
ClosedSales
January
ClosedSales
February
ClosedSales
March
ClosedSalesApril
ClosedSalesMay
ClosedSalesJune
ClosedSalesJuly
ClosedSales
August
ClosedSales
September
ClosedSales
October
ClosedSales
November
ClosedSales
December Total
Active on 11/30/15 by
List Price
Months Supply of
Inventory*
$0 to $349,999 42 38 43 35 48 64 53 47 39 26 23 32 458 29 1.3
$350,000 to $499,999 87 90 144 144 138 182 152 138 140 145 90 101 1,450 53 0.6
$500,000 to $749,999 135 143 227 275 302 350 338 345 281 255 187 237 2,838 142 0.8
$750,000 to $999,999 99 82 128 179 182 205 205 167 180 169 129 149 1,725 177 1.4
$1,000,000 to $1,499,999 37 35 47 68 88 104 119 93 75 79 62 77 807 115 1.9
$1,500,000 to $2,999,999 23 23 49 36 46 61 57 61 48 34 30 44 468 128 4.3
$3,000,000 and up 4 4 3 5 13 15 8 14 10 11 9 3 96 60 6.7
Totals 427 415 641 742 817 981 932 865 773 719 530 643 7,842 704 1.3
Sales Price
ClosedSales
January
ClosedSales
February
ClosedSales
March
ClosedSalesApril
ClosedSalesMay
ClosedSalesJune
ClosedSalesJuly
ClosedSales
August
ClosedSales
September
ClosedSales
October
ClosedSales
November
ClosedSales
December TotalActive by List Price
Months Supply of
Inventory*
$0 to $349,999 -64% -79% -60% -46% -54% -59% -55% -53% -69% -15% -26% -55% -45% -25%
$350,000 to 499,999 -17% -43% -52% -43% -39% -49% -38% -39% -34% -58% -21% -41% -45% -31%
$500,000 to $749,999 1% -3% -11% -12% -17% 1% -3% -10% -2% 8% 33% -3% -21% -41%
$750,000 to $999,999 6% 32% 8% -7% 19% 15% 25% 44% 1% 24% 21% 17% -31% -43%
$1,000,000 to $1,499,999 -3% 46% 57% 31% 26% 48% 3% 60% 80% 49% 105% 44% 9% -47%
$1,500,000 to $2,999,999 -13% 4% 18% 33% 28% 8% 18% -2% 29% 103% 97% 26% 7% -46%
$3,000,000 and up 150% 100% 67% 60% 15% -13% 113% -14% 30% -27% 56% 28% 52% -3%
Totals -8% -7% -12% -12% -7% -4% -3% 1% 0% 6% 31% -2% -10% -31%
* Months supply of inventory is calculated by dividing Active Inventory by the number of closed sales for the last month, rounded to the nearest month.
2016
2015
% Change
Created by Windermere Real Estate/East Inc. using NWMLS data, but information was not verified or published by NWMLS. 12/7/2016

EASTSIDE CLOSED & ACTIVE INVENTORY BY PRICE RANGE - CONDOMINIUMIncluding: Eastside - South of I-90 (500), Mercer Island (510), Bellevue - West of I-405 (520), Bellevue - East of I-405 (530),East of Lake Sammamish (540), Redmond-Carnation (550), Kirkland-Bridle Trails (560), Juanita-Woodinville/Duvall (600)
Sales Price
ClosedSales
January
ClosedSales
February
ClosedSales
March
ClosedSalesApril
ClosedSalesMay
ClosedSalesJune
ClosedSalesJuly
ClosedSales
August
ClosedSales
September
ClosedSales
October
ClosedSales
November
ClosedSales
December Total
Active on 11/30/16 by
List Price
Months Supply of
Inventory*
$0 to $349,999 99 91 136 145 142 141 147 154 118 154 117 1,444 42 0.4
$350,000 to $499,999 31 37 53 68 63 94 70 74 74 61 70 695 21 0.3
$500,000 to $749,999 23 16 32 61 46 58 41 40 40 52 52 461 12 0.2
$750,000 to $999,999 5 9 11 1 12 8 12 9 5 18 6 96 17 2.8
$1,000,000 to $1,499,999 1 2 5 5 6 6 5 5 5 6 5 51 22 4.4
$1,500,000 to $2,999,999 - - - 2 3 3 4 2 1 4 7 26 9 1.3
$3,000,000 and up - - - - - - - - - - - - 3 -
Totals 159 155 237 282 272 310 279 284 243 295 257 - 2,773 126 0.5
Sales Price
ClosedSales
January
ClosedSales
February
ClosedSales
March
ClosedSalesApril
ClosedSalesMay
ClosedSalesJune
ClosedSalesJuly
ClosedSales
August
ClosedSales
September
ClosedSales
October
ClosedSales
November
ClosedSales
December Total
Active on 11/30/15 by
List Price
Months Supply of
Inventory*
$0 to $349,999 89 115 144 150 158 155 181 175 157 165 135 128 1,624 91 0.7
$350,000 to $499,999 22 17 59 44 58 68 71 66 75 66 57 45 603 19 0.3
$500,000 to $749,999 13 20 28 24 42 44 25 18 29 31 25 31 299 32 1.3
$750,000 to $999,999 5 8 12 11 7 9 10 11 10 10 9 4 102 28 3.1
$1,000,000 to $1,499,999 1 - 5 - 4 8 8 8 5 5 1 4 45 16 16.0
$1,500,000 to $2,999,999 1 - - 1 3 1 4 - 3 3 1 - 17 18 18.0
$3,000,000 and up - - - - - - - - - - - - - 1 -
Totals 131 160 248 230 272 285 299 278 279 280 228 212 2,690 205 0.9
Sales Price
ClosedSales
January
ClosedSales
February
ClosedSales
March
ClosedSalesApril
ClosedSalesMay
ClosedSalesJune
ClosedSalesJuly
ClosedSales
August
ClosedSales
September
ClosedSales
October
ClosedSales
November
ClosedSales
December TotalActive by List Price
Months Supply of
Inventory*
$0 to $349,999 11% -21% -6% -3% -10% -9% -19% -12% -25% -7% -13% -11% -54% -47%
$350,000 to 499,999 41% 118% -10% 55% 9% 38% -1% 12% -1% -8% 23% 15% 11% -10%
$500,000 to $749,999 77% -20% 14% 154% 10% 32% 64% 122% 38% 68% 108% 54% -63% -82%
$750,000 to $999,999 0% 13% -8% -91% 71% -11% 20% -18% -50% 80% -33% -6% -39% -9%
$1,000,000 to $1,499,999 0% #DIV/0! 0% #DIV/0! 50% -25% -38% -38% 0% 20% 400% 13% 38% -73%
$1,500,000 to $2,999,999 100% 0% 200% 0% #DIV/0! -67% 33% 600% 53% -50% -93%
$3,000,000 and up 200%
Totals 21% -3% -4% 23% 0% 9% -7% 2% -13% 5% 13% 3% -39% -45%
* Months supply of inventory is calculated by dividing Active Inventory by the number of closed sales for the last month, rounded to the nearest month.
2016
2015
% Change
Created by Windermere Real Estate/East Inc. using NWMLS data, but information was not verified or published by NWMLS. 12/7/2016