eastern massasauga rattlesnake - csu home · indiana dunes national lakeshore ... eastern...
TRANSCRIPT

Status of the Eastern Massasauga Rattlesnake at Indiana Dunes National Lakeshore
Gary Glowacki and Ralph Grundel
U.S. Geological Survey Great Lakes Science Center
Lake Michigan Ecological Research Station 1100 N. Mineral Springs Road
Porter, IN 46304
January 10, 2005
Great Lakes Network Report GLKN/2005/02

Glowacki, G. and R. Grundel. 2005. Status of the eastern massasauga rattlesnake at
Indiana Dunes National Lakeshore. U.S. Geological Survey, Porter, IN, for National Park Service Great Lakes Inventory and Monitoring Network Report GLKN/2005/02.

2
Status of the Eastern Massasauga Rattlesnake at Indiana Dunes National Lakeshore
Gary Glowacki and Ralph Grundel, U.S. Geological Survey, Great Lakes Science Center, Lake Michigan Ecological Research Station, 1100 N. Mineral Springs Road Porter, IN 46304
Abstract
The eastern massasauga rattlesnake (Sistrurus catenatus catenatus) is listed as threatened or endangered in ten of the eleven states and provinces in which it currently is found. Records suggest that the eastern massasauga was frequently encountered in the vicinity of present-day Indiana Dunes National Lakeshore (INDU) until the 1930s. Since establishment of INDU in 1966, confirmed massasauga sightings within the park’s vicinity have been rare and no confirmed sightings were made within the official boundary of the park. To examine the current status of the eastern massasauga rattlesnake at INDU, both active searching and passive collection were used. A three-phase survey process, including visual searching, drift fencing, and the use of artificial cover objects, was employed to search for the massasauga within INDU. The objective of the surveys was to document presence of massasaugas at sites within Indiana Dunes National Lakeshore where the snakes were thought most likely to occur. Visual searching, drift fencing, and artificial cover objects yielded twenty-three species of amphibians and reptiles. Among these were nine frog and toad, five salamander, two turtle, one lizard, and six snake species. One eastern massasauga rattlesnake was captured in a drift fence. Within INDU, a combination of fire suppression in upland areas and the draining of the Great Marsh has led to an influx of woody vegetation in both upland and wetland areas. This has significantly limited open habitats within the East Unit of INDU. While the surveys have established that an individual S. c. catenatus exists within the boundary of Indiana Dunes National Lakeshore, further monitoring is needed to determine the snake’s status, to further identify critical habitat, and to provide park managers the information necessary to properly insure the long-term survival of the species at INDU.

3
Introduction
The eastern massasauga rattlesnake (Sistrurus catenatus catenatus) is a candidate for federal listing as a threatened or endangered Distinct Population Segment (DPS) (U.S. FWS 2003). Although the massasauga rattlesnake is thought to be in decline throughout much of its range, only the eastern subspecies (Sistrurus c. catenatus) is currently under consideration for listing. The eastern subspecies has been described as historically ranging from central New York and southern Ontario, southwest to Iowa and Missouri (Johnson 1995, Minton 2001). This eastern subspecies encompasses all S. catenatus residing north and east of the Missouri River.
The eastern massasauga is listed as threatened or endangered in ten of the eleven
states and provinces in which it occurs (Casper et al. 2000). The massasauga is thought to no longer reside in 40% of the 203 counties with documented historic populations. Of the extant populations, only 22% are considered to have long-term viability (Szymanski 1998). Habitat loss and persecution have likely contributed to these range-wide declines.
A variety of vegetation communities have been identified as possible massasauga
habitat. However, throughout its range the massasauga exhibits an affinity for wetland habitats. Massasaugas have been documented in wet areas including bogs, marshes, wet prairies, fens, peatlands, swamp forests, and sedge meadows (Szymanski 1998). Adults often use both wetland and upland habitats during the course of the year. In general, massasaugas use wetlands in the spring and fall and shift to drier, open-canopy habitats in the summer. Massasaugas tend to avoid habitats with closed canopies, but will occasionally travel through them. Spatial patterns of prey availability, location of thermoregulatory sites, and snakes using marginal or degraded habitats may account for regional and seasonal variations in habitat use. Furthermore, the eastern massasauga’s use of wetlands may simply reflect the snake’s need for overwintering sites near the water table. These overwintering sites include crayfish or mammal burrows, grassy or mossy hummocks, and tree root masses (Conant 1951, Szymanski 1998). Massasaugas may only seek out drier, upland habitats if the wetlands fail to provide them with both their food and thermoregulatory needs during the remainder of the year.
At Indiana Dunes National Lakeshore (INDU), the status of the eastern
massasauga rattlesnake reflects the species’ rangewide decline. Alan Resetar, collections’ manager for amphibians and reptiles at the Field Museum of Natural History in Chicago, summarized available information on the current and historic distribution of the massasauga in the Indiana Dunes region of northwest Indiana (Resetar 1994a, b). He compiled 34 museum and collector records and newspaper reports from 1913 to 1990. The records documented purported massasauga sightings within the East Unit of INDU, the Indiana Dunes State Park (adjacent to the East Unit of INDU), and from other sites in northwest Indiana (Figure 1). Of particular significance are newspaper articles documenting the construction of a power line corridor in the 1930s near the Great Marsh wetland that runs between Michigan City and Gary, Indiana within the current boundary of INDU and Indiana Dunes State Park. These accounts report the killing of dozens of “rattlesnakes” in an area that today is surrounded by the park’s East Unit. These accounts,
4
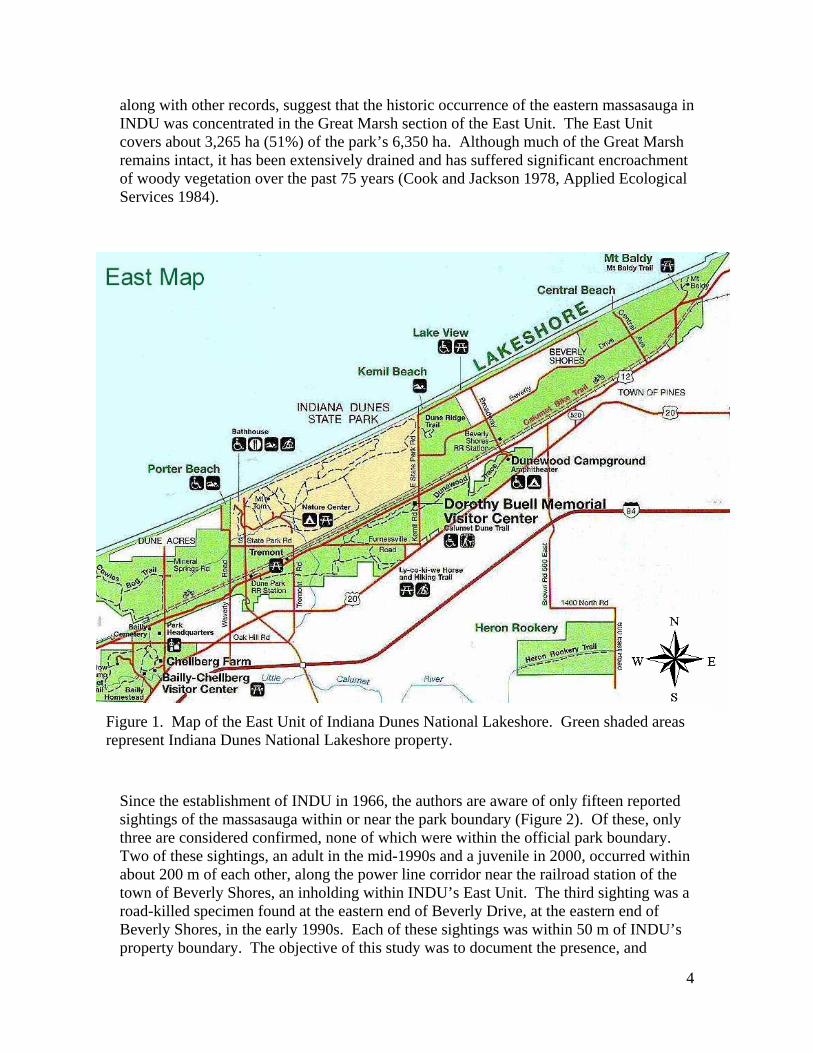
along with other records, suggest that the historic occurrence of the eastern massasauga in INDU was concentrated in the Great Marsh section of the East Unit. The East Unit covers about 3,265 ha (51%) of the park’s 6,350 ha. Although much of the Great Marsh remains intact, it has been extensively drained and has suffered significant encroachment of woody vegetation over the past 75 years (Cook and Jackson 1978, Applied Ecological Services 1984).
Since the establishment of INDU in 1966, the authors are aware of only fifteen reported sightings of the massasauga within or near the park boundary (Figure 2). Of these, only three are considered confirmed, none of which were within the official park boundary. Two of these sightings, an adult in the mid-1990s and a juvenile in 2000, occurred within about 200 m of each other, along the power line corridor near the railroad station of the town of Beverly Shores, an inholding within INDU’s East Unit. The third sighting was a road-killed specimen found at the eastern end of Beverly Drive, at the eastern end of Beverly Shores, in the early 1990s. Each of these sightings was within 50 m of INDU’s property boundary. The objective of this study was to document the presence, and
Figure 1. Map of the East Unit of Indiana Dunes National Lakeshore. Green shaded areas represent Indiana Dunes National Lakeshore property.

5
Figure 2. Reported sightings of the eastern massasauga rattlesnake since establishment of Indiana Dunes National Lakeshore in 1966. Confidence of sighting scale estimated by authors based on frequency of sightings in the area, expertise of observer, and quality of habitat where purported sighting occurred. The 2002 sighting represents a potential sighting by Gary Glowacki as report in Results.

6
potentially provide information on the distribution, of the eastern massasauga rattlesnake at the Indiana Dunes National Lakeshore.
Materials and Methods
Survey Methods
Because the eastern massasauga is a cryptic species that is likely rare at INDU, using multiple methods to survey for the species is important. To determine whether the eastern massasauga rattlesnake is present at the INDU, both active searching and passive collecting were used. A three-phase survey process, including visual searching, drift fencing, and the use of artificial cover objects, was employed. The objective of the surveys was to document presence of massasaugas at those sites within the park where the snakes were thought most likely to occur. Quantification of populations and random sampling of habitats were not attempted in this preliminary survey. Survey Methods: Visual Searches
Visual searches were conducted from April 1 - October 11, 2002 on days when the temperature exceeded 16 ºC. Searches took place either in the early morning or late afternoon and lasted for two to three hours. At least two field workers searched a given area during each observation period. GPS (Garmin GPS III+, GPS 76, and GPS 2CX) handheld receiver track logs were used to record locations where searches took place. All search tracks from one section of INDU are illustrated in Figure 4.
Figure 3. Field technicians searching for the eastern massasauga at the Indiana Dunes National Lakeshore, 2002-2003.

7
Figure 4. Visual search tracks for the eastern massasauga rattlesnake from one section of Indiana Dunes National Lakeshore, 2002-2003. Points along a given track were recorded at < 30 second intervals.
Track points were recorded at intervals of less than 30 seconds. Search locations were chosen to maximize coverage within the East Unit of Indiana Dunes National Lakeshore. Areas that had historical sightings, or habitat conducive to the massasauga, were checked on multiple occasions. Temperature, humidity, and wind (Beaufort scale) were measured before and after a visual search was undertaken. Locations of crayfish burrows, sphagnum moss, and other habitat elements massasaugas are known to use (marshes, sedge meadows, open or open-shrub habitats) were also recorded using GPS.

8
Survey Methods: Drift Fences Fourteen drift fences (Figure 5) were placed across the East Unit of the park. The fences were constructed of aluminum window screen (0.9 m wide, 12 m long) with funnel traps at both ends for collecting animals. Funnel traps (Figure 6) consisted of a 25 cm diameter funnel with an 0.8 m long cylinder of window screen attached around the perimeter of the funnel. The opposite end of the screen cylinder was held shut with clothespins. The neck of the funnel was removed to maintain an opening larger than an adult massasauga’s body diameter. Snakes meeting the drift fence tended to move along the fence and enter the funnel trap but typically were not able to get out after entering the trap. Wet sponges were placed in the funnel traps to maintain suitable moisture levels. Cardboard covers were placed over the traps to maintain shade.
Figure 5. Twelve-meter drift fence used to capture the eastern massasauga rattlesnake at Indiana Dunes National Lakeshore, 2002-2003.
Figure 6. Funnel trap used to capture amphibians and reptiles at Indiana Dunes National Lakeshore, 2002-2003.
9
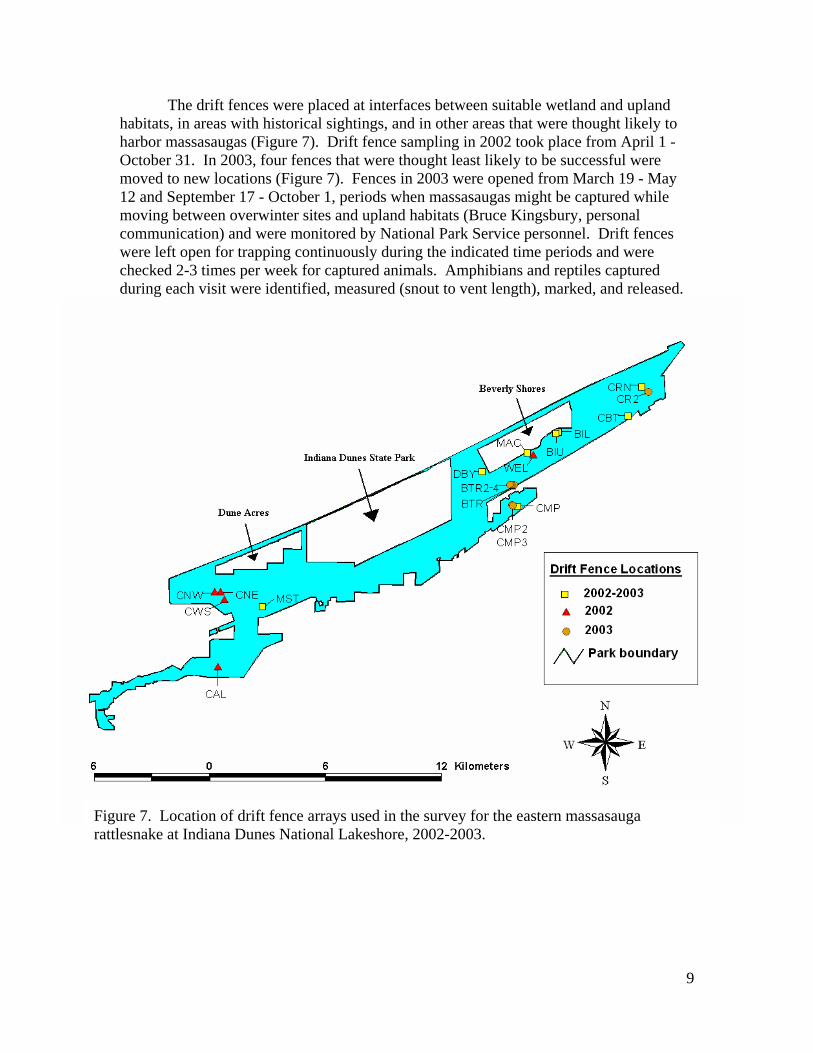
The drift fences were placed at interfaces between suitable wetland and upland habitats, in areas with historical sightings, and in other areas that were thought likely to harbor massasaugas (Figure 7). Drift fence sampling in 2002 took place from April 1 - October 31. In 2003, four fences that were thought least likely to be successful were moved to new locations (Figure 7). Fences in 2003 were opened from March 19 - May 12 and September 17 - October 1, periods when massasaugas might be captured while moving between overwinter sites and upland habitats (Bruce Kingsbury, personal communication) and were monitored by National Park Service personnel. Drift fences were left open for trapping continuously during the indicated time periods and were checked 2-3 times per week for captured animals. Amphibians and reptiles captured during each visit were identified, measured (snout to vent length), marked, and released.
Figure 7. Location of drift fence arrays used in the survey for the eastern massasauga rattlesnake at Indiana Dunes National Lakeshore, 2002-2003.
10
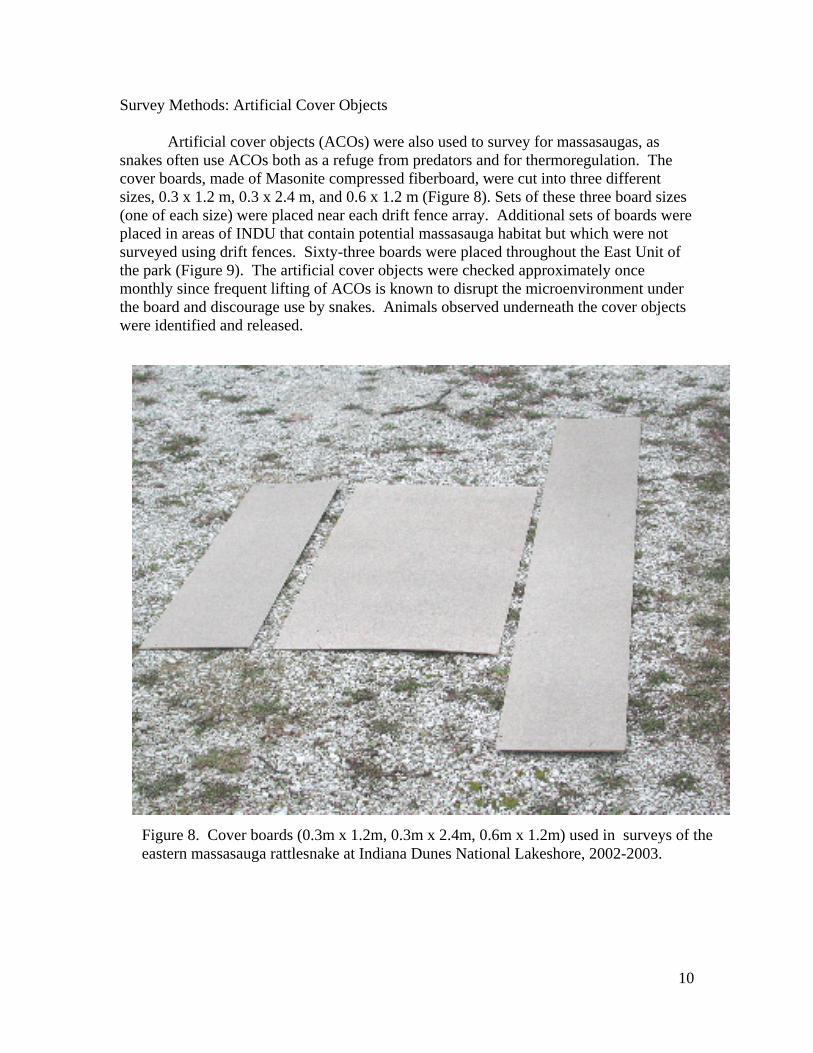
Survey Methods: Artificial Cover Objects Artificial cover objects (ACOs) were also used to survey for massasaugas, as snakes often use ACOs both as a refuge from predators and for thermoregulation. The cover boards, made of Masonite compressed fiberboard, were cut into three different sizes, 0.3 x 1.2 m, 0.3 x 2.4 m, and 0.6 x 1.2 m (Figure 8). Sets of these three board sizes (one of each size) were placed near each drift fence array. Additional sets of boards were placed in areas of INDU that contain potential massasauga habitat but which were not surveyed using drift fences. Sixty-three boards were placed throughout the East Unit of the park (Figure 9). The artificial cover objects were checked approximately once monthly since frequent lifting of ACOs is known to disrupt the microenvironment under the board and discourage use by snakes. Animals observed underneath the cover objects were identified and released.
Figure 8. Cover boards (0.3m x 1.2m, 0.3m x 2.4m, 0.6m x 1.2m) used in surveys of the eastern massasauga rattlesnake at Indiana Dunes National Lakeshore, 2002-2003.

11
Habitat Mapping Individual habitat polygons > 10 m2 in area were mapped within a 200 m radius of each drift fence (Figure 10). The polygons were initially delineated using National Park Service aerial photographs and further verified and corrected by ground truthing. Definitions of the thirteen habitat types are summarized below and in Figure 11. We estimated percent open water, floating vegetation, emergent vegetation, herbaceous vegetation, woody vegetation, and standing water in wetland habitat types, and percent canopy cover, herbaceous vegetation, bare ground, and litter cover in other habitat types. Habitat boundaries were mapped as polygons on National Park Service paper base maps (1: 2400) initially using aerial photos, existing Arcview GIS (ESRI 2002) based vegetation maps of INDU, and USGS digital orthophotos to delineate obvious habitat discontinuities. These habitat boundaries were confirmed and refined with field observation. The habitat polygons were later digitized for GIS analysis using ArcView GIS 3.3 software (ESRI 2002). Listed below are the thirteen habitat types used in this study (see also Figure 11). These habitat types were adopted from a study of habitat use by amphibians and reptiles in 17 upland areas of INDU, carried out by the authors between 2000-2002.
Figure 9. Location of artificial cover objects used in surveys for the eastern massasauga rattlesnake at Indiana Dunes National Lakeshore, 2002-2003.

12
Mapped Habitat Types 1) Non-Oak Savanna Non-oak savannas have canopy cover 10 - 90%; typical woody species are not oaks (Quercus spp.). Little woody vegetation exists below the tree canopy (< 5 m) 2) Oak Savanna or Woodland Oak savannas have canopy cover of 10 - 90% with nearly all trees oaks (Quercus velutina, Q. rubra, Q. alba, or Q. palustris). Little woody vegetation exists below the tree canopy (< 5 m). 3) Oak Scrub Woodland Oak scrub woodlands are habitats dominated by oaks (Q. velutina, Q. rubra, Q. alba, or Q. palustris) at multiple vertical strata. Canopy cover of Quercus spp. is at least 50%, of which oak trees > 5 m makes up at least 25% of the total canopy and oak saplings < 5 m also comprise at least 25% of the total canopy. 4) Non-Oak Scrub Non-oak scrub is a habitat dominated by woody vegetation other than oaks (Q. spp.) at multiple vertical strata. Canopy cover is at least 50%, of which trees > 5 m makes up at least 25% of the total canopy and other woody vegetation < 5 m also comprises at least 25% of the total canopy. 5) Non-Oak Woodland/Forest Canopy cover is > 80%. The canopy contains multiple tree species, not dominated by Q. spp. Non-oak woodlands contain multiple woody vegetation layers with the subcanopy often consisting of different woody species than the larger canopy trees (> 5 m). 6) Wetland Tree Wetland tree habitats are dominated (> 50% of total tree cover) by Populus tremuloides, Q. palustris, Fraxinus pennsylvanica, or other wetland facultative tree species. This habitat may or may not contain standing water or saturated soils. 7) Wetland Shrub Wetland shrub habitat consists of areas dominated (> 50% of total woody cover) by Salix spp. (willows) or other wetland facultative woody shrubs. This habitat may or may not contain standing water or saturated soils. These are transitional communities that occur where environmental gradients are drawn out gradually over a long distance. 8) Wetland Forb Habitats designated as wetland forb are dominated (> 50% of vegetative cover) by wetland grasses (or forbs) such as Panicum virgatum. This habitat may or may not contain standing water or saturated soils. These are transitional communities that occur where environmental gradients are drawn out gradually over a long distance.

13
9) Open Open habitats are primarily composed of herbaceous vegetation with < 10% woody vegetation cover. Open sites are not wetlands and do not contain wetland obligate or facultative vegetation. 10) Human Human habitats contain man-made elements such as homes, buildings, paved roads, unpaved roads or old railroad beds, and railroads. These habitats generally lack a significant amount of vegetation, although some may persist in lawns and landscaping. 11) Permanent Wetland Permanent wetlands contain hydrophytic vegetation, hydric soils, and wetland hydrology. Permanent wetland habitats are differentiated from ephemeral and ephemeral edge habitats by retaining standing water throughout the year. 12) Ephemeral Wetland Ephemeral wetlands contain hydrophytic vegetation, hydric soils, and wetland hydrology. Ephemeral wetland habitats are differentiated from permanent wetlands in that they typically dry out during the summer months. 13) Ephemeral Edge Wetland Ephemeral edge wetlands occur around the fringe of ephemeral wetlands. While this habitat also contains hydrophytic vegetation and hydric soils, clear wetland hydrology may be lacking in dry years. Ephemeral edge wetlands are a transition from ephemeral wetlands to drier, upland areas and thus often contain elements of both. Statistical Analyses
The objective of this study was to document the presence, and potentially provide information on the distribution, of the eastern massasauga rattlesnake at Indiana Dunes National Lakeshore. Surveys were purposefully conducted at locations where history and habitat structure suggested the massasauga might most likely be found. Random sampling of habitats, and extensive evaluation of habitat structure, was not included in the study design. However, the authors have completed a separate study of amphibians and reptiles at seventeen upland INDU sites, with forty-one drift fences, between 2000-2002 (Figure 12). Detailed discussion of that study is beyond the purview of this report. However, to allow possible future comparison between the data collected in the 2000-2002 upland herpetofaunal study and in this massasauga survey, a habitat mapping protocol used in the upland study was repeated here. For this protocol, habitats were mapped within 200 m of each drift fence (see Methods above). These mapped habitat data may suggest habitat features associated with the massasauga.

14
Figure 10. Sample of habitat mapping within 200 m of drift fences used in the survey for the eastern massasauga rattlesnake at the Indiana Dunes National Lakeshore, 2002-2003.

15
Figure 11. Flow chart demonstrating the key characteristics of the thirteen habitat types used in the habitat mapping around drift fence arrays used in the survey for the eastern massasauga rattlesnake at Indiana Dunes National Lakeshore, 2002-2003.

16
Figure 12. Location of drift fences used in three-year study (2000-2002) of herpetofauna at the Indiana Dunes National Lakeshore.
Based on these mapped data, non-metric multidimensional scaling (NMS)
(McCune and Mefford 1999), a non-parametric ordination technique, was used to identify sites that resembled the location (BTR: Beverly Shores Train Station, Figure 7) where we captured an eastern massasauga rattlesnake in the surveys (see Results). Ordination was based on the percentage (untransformed) of each habitat type within 200 m of each of the fourteen drift fence arrays. Ordination and similarity measurements were based on Sørenson distance (McCune and Mefford 1999). We also used NMS to compare the similarity of the amphibian and reptile assemblage captured at the BTR drift fence array to assemblages captured at other arrays. The habitat and species assemblage NMS ordinations provide insight into similarities between a site where massasaugas are known to occur and other sites within INDU. Correlation analysis between ordination values and environmental variables was used to interpret ordination results (McCune and Grace 2002).
The intent of this study was to determine whether the eastern massasauga
rattlesnake currently resides within the boundary of INDU. Below, we assess similarity between the one site where a massasauga was found (see Results and Data Analysis) to other sites where the presence of the massasauga is uncertain, to provide potential clues as to where future search or restoration efforts might be concentrated. However, this

17
study was not designed as an investigation of massasauga habitat preferences. Sample sizes and capture rates are not adequate to provide any manner of statistical validation to the brief analyses carried out below. Furthermore, we do not know whether the occupied site represents preferred habitat. Therefore, the reader should approach the analyses with caution recognizing that they are a cursory attempt to compare a site with massasaugas to other sites that may, or may not, have massasaugas.
Results
Twenty-three species of amphibians and reptiles were encountered during visual searching, drift fence surveys, and under artificial cover objects. Among these were nine frog and toad, five salamander, two turtle, one lizard, and six snake species, including the eastern massasauga rattlesnake (Tables 1 and 2).
A single massasauga was captured on September 24, 2002 in a drift fence near the
Beverly Shores train station (BTR, Figure 7; photo of captured snake on cover). The massasauga, a juvenile, measured 262 mm snout-vent length and weighed 20.6 grams. Another eastern massasauga was possibly encountered during a visual search (at UTM: 4616021 E; 505193 N) on July 10, 2002. However, that snake was not captured and positive identification could not be made. As that snake was approached, it moved off the Calumet Bike Trail (CBT, Figure 7), where it was observed, into brush, leaving behind a dead rodent presumed to be its prey. While the snake was not captured and positively identified, only one other snake found in the park, the northern water snake (Nerodia sipedon), is similar in appearance to the massasauga. However, the northern water snake does not typically feed on small rodents (Harding 1997) and adults are rarely found this far (> 300m) away from a permanent body of water.
For three years (2000-2002), an additional 41 drift fences were deployed across
INDU’s East and West Units, mainly at upland sites, for approximately six months per year, as part of a separate study. Although data from that study are not yet published and are not presented here, we note that no massasaugas were captured in any of those drift fences (Figure 12).

18
Table 1. List of amphibian and reptile species found using different survey methods at Indiana Dunes National Lakeshore during surveys for the eastern massasauga rattlesnate, 2002-2003. Survey Method
Scientific Name Common Name Drift Fence
Cover Board
Visual Search
Pseudacris triseriata Chorus Frog x x x Pseudacris crucifer Spring Peeper x x x Hyla versicolor Gray Tree Frog x Bufo americanus americanus Eastern American Toad x x x Bufo fowleri Fowler’s Toad x Rana catesbeiana Bullfrog x Rana clamitans Green Frog x x x Rana pipiens Leopard Frog x x x Rana sylvatica Wood Frog x x x Ambystoma jeffersonianum Complex
Jefferson Salamander Complex x
Ambystoma laterale Blue-spotted Salamander x x x Hemidactylium scutatum Four-toed Salamander x Plethodon cinereus Redback Salamander x x Notophthalmus viridescens Eastern Newt x Clemmys guttata Spotted Turtle x x Cnemidophorus sexlineatus Sixlined Racerunner x x Coluber constrictor Blue Racer x x Heterodon platyrhinos Eastern Hognose Snake x x Nerodia sipedon Northern Water Snake x x Sistrurus catenatus catenatus Eastern Massasauga Rattlesnake x ? Storeria dekayi Brown Snake x x x Terrapene carolina Eastern Box Turtle x Thamnophis sirtalis Eastern Garter Snake x x x
Totals 22 9 16

19
Table 2. Frequency of species captures in drift fences at Indiana Dunes National Lakeshore, 2002, during surveys for the eastern massasauga rattlesnake. Array Site Species BIL BIU BTR CAL CBT CMP CNE CNW CRN CWS DBY MAC MST WEL Total Pseudacris triseriata 49 0 1 0 0 0 2 3 2 14 2 0 1 1 75 Pseudacris crucifer 2 0 2 0 0 1 1 7 4 16 4 1 0 1 40 Hyla versicolor 0 0 0 0 0 0 0 1 0 0 2 0 0 0 3 Bufo americanus americanus
0 2 0 0 1 0 0 0 1 0 0 2 1 0 7
Bufo fowleri 0 0 0 0 0 0 0 0 0 0 1 0 0 0 1 Rana catesbeiana 0 0 0 0 0 0 0 0 0 1 0 1 0 0 2 Rana clamitans 5 4 22 0 4 4 1 1 4 54 10 9 9 39 166 Rana pipiens 3 1 5 0 0 1 0 1 5 2 1 10 0 16 45 Rana sylvatica 1 5 2 0 0 6 4 0 1 177 19 6 8 0 229 Ambystoma jeffersonianum Complex
0 0 0 0 0 0 0 0 0 0 0 0 0 1 1
Ambystoma laterale 5 0 1 0 0 0 0 0 0 5 3 6 0 0 20 Hemidactylium scutatum 0 0 2 0 0 0 0 0 0 1 0 0 0 0 3 Plethodon cinereus 0 0 0 0 3 7 0 0 0 0 0 0 0 0 10 Notophthalmus viridescens
0 0 0 0 0 0 0 1 0 0 0 0 0 0 1
Clemmys guttata 0 0 5 0 0 0 0 0 0 0 0 0 0 0 5 Cnemidophorus sexlineatus
0 0 0 0 0 1 0 0 0 0 0 0 0 0 1
Nerodia sipedon 0 0 0 0 0 0 0 0 1 0 0 0 1 0 2 Storeria dekayi 2 4 3 1 5 1 0 3 2 33 26 6 1 1 88 Thamnophis sirtalis 13 17 18 2 2 13 17 15 43 12 39 8 40 10 249 Coluber constrictor 0 1 0 0 0 0 0 1 0 0 0 0 0 0 2 Heterodon platyrhinos 1 1 0 3 0 0 0 0 1 1 0 0 1 0 8 Sistrurus catenatus catenatus
0 0 1 0 0 0 0 0 0 0 0 0 0 0 1

20
Data Analysis
Drift Fence Arrays
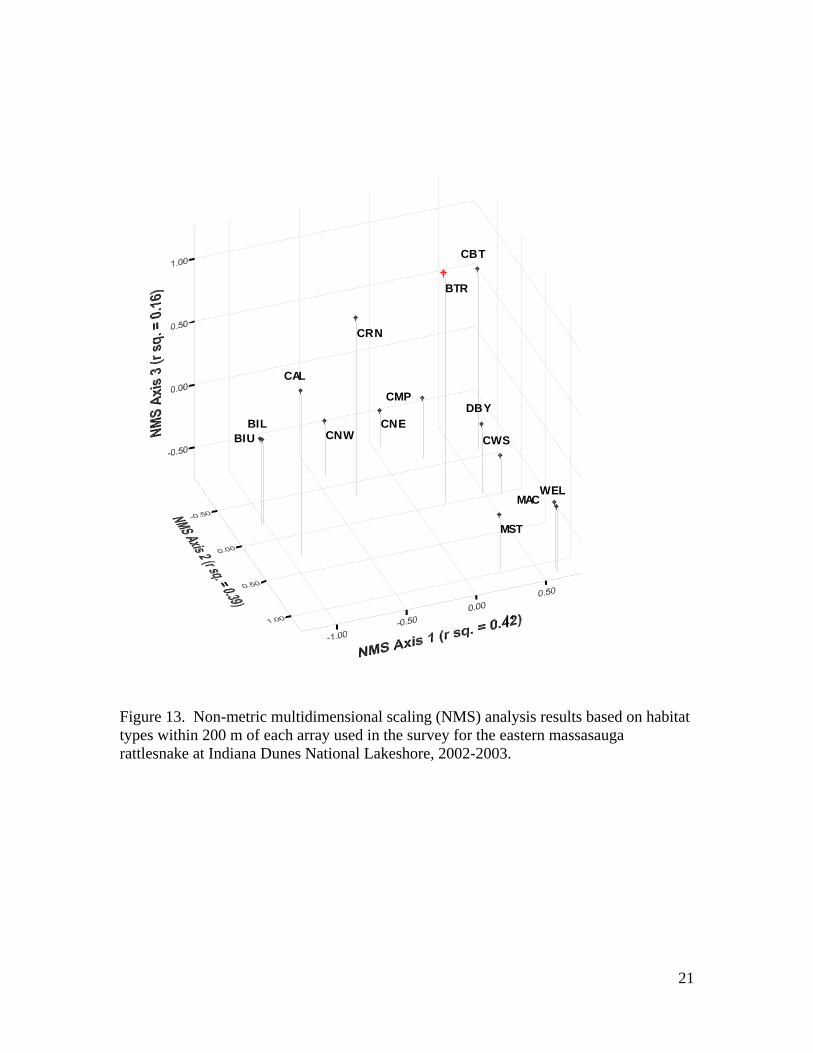
Results of NMS ordination of the fourteen arrays, based on habitat within 200 m of each array, are shown in Figure 13 (final stress for three dimensional solution shown = 4.5). In three dimensional ordination space, BTR was closest to the CBT (Calumet Bike Trail) and CRN (Corner) sites (Figure 13, Table 3). Of the three NMS axes, Axis 1 explained the greatest percentage of variation (r2 = 0.42) in Sørenson distances among sites. Along Axis 1, ordination values were most strongly, and negatively, correlated with percentage of ephemeral wetlands and non-oak woodlands within 200 m and most positively correlated with percentage of permanent wetlands (Table 4) suggesting a gradient of decreasing canopy cover and permanency of wetlands proceeding from lower to higher ordination values along Axis 1. Sites along Axis 2 (r2 = 0.39) separated most strongly along a gradient of permanent wetlands and oak savannas. Higher values along Axis 2 corresponded to higher percentages of permanent wetlands and lower cover of savanna. Sites along Axis 3 (r2 = 0.16) separated most strongly along a gradient of wetland trees and open habitats. Higher ordination values on Axis 3 corresponded to greater cover of wetland dependent trees and greater percentage of open habitats. While those trends might seem contradictory, in fact, cover of wetland tree and open habitats was not high at most sites (Table 5) so both trends, higher wetland tree and open cover, could be present concurrently at any given site. In comparison with all other arrays, the area around BTR was distinguished by a high percentage of wetland dependent tree habitat, a relatively high percentage of open areas, and by relatively low percentages of permanent or ephemeral wetlands (Table 5).
21
BILBIU
BTR
CBT
CAL
CMP
CRN
CNECNW CWS
DBY
MAC
MST
WEL
Figure 13. Non-metric multidimensional scaling (NMS) analysis results based on habitat types within 200 m of each array used in the survey for the eastern massasauga rattlesnake at Indiana Dunes National Lakeshore, 2002-2003.

22
Table 3. Sørenson similarity between BTR and other arrays based on habitat composition within 200 m of array. Two arrays with the same habitat composition would have similarity = 1 while two arrays with no habitat types in common would have similarity = 0.
Site Similarity with BTR
BIL 0.24 BIU 0.23 CBT 0.55 CAL 0.48 CMP 0.32 CRN 0.61 CNE 0.20 CNW 0.21 CWS 0.29 DBY 0.39 MAC 0.21 MST 0.25 WEL 0.16 Table 4. Correlations between habitat types and NMS axis values in Figure 13. Correlation with Habitat Type Axis 1 Axis 2 Axis 3 Oak Savanna or Woodland 0.21 -0.78 -0.32Oak Scrub Woodland 0.30 -0.26 0.38Non-Oak Woodland/Forest -0.82 -0.10 0.13Non-Oak Savanna 0.30 -0.26 0.38Non-Oak Scrub 0.09 <0.01 0.61Open 0.04 0.02 0.79Human 0.41 -0.04 0.60Wetland Tree -0.21 -0.06 0.80Wetland Shrub <0.01 -0.19 0.49Wetland Forb 0.23 0.49 -0.16Ephemeral Wetland -0.92 -0.40 -0.08Ephemeral Edge Wetland -0.12 -0.49 -0.36Permanent Wetland 0.60 0.89 -0.42

23
Table 5. Percent habitat composition within 200 m of each site used in the survey for the eastern massasauga rattlesnake at Indiana Dunes National Lakeshore, 2002-2003. Habitat Type BIL BIU BTR CBT CAL CMP CRN CNE CNW CWS DBY MAC MST WEL Mean1
Oak Savanna or Woodland 14.0 18.1 14.9 36.0 0 69.0 22.2 70.4 36.9 45.5 39.4 2.4 0.7 0 27.3 Oak-Scrub Woodland 0 0 0 3.9 0 0 0 0 0 0 0 0 0 0 0.3 Non-Oak Woodland/Forest 33.3 35.9 2.3 4.6 22.3 0 0 0 0 0 0 0 0 0 7.4 Non-Oak Scrub 0 0 1.3 0 0 0 0 0 0 0 0 0 0 0 0 Non-Oak Savanna 0 0 0 0.6 0 0 0 0 0 0 0 0 0 0 0 Open 0 0 17.7 16 15.9 1.7 1.5 0 0 0 1.5 0 8.2 0 3.4 Human 4 3.4 19.6 37 0 5 5.5 0 0 0 3.5 10 5.4 8.0 6.3 Wetland Tree 0 0 29.7 0 19.4 0 31 0 0.6 0.5 4.3 0 0 0 4.3 Wetland Shrub 1.8 0 4 1.5 0 0 11.9 0 0 2.7 4.2 0 0 0 1.7 Wetland Forb 0.4 0 0 0 0 0 0 0 0 0 0 0 0 4.1 0.3 Ephemeral Wetland 46.5 42.6 2.1 0 33.7 14.0 25.1 17.2 49.1 3.9 8 0.6 11.1 0 19.4 Ephemeral Edge Wetland 0 0 0 0 0 0 0 9.1 9.8 0.4 0 0 0 0 1.5 Permanent Wetland 0 0 8.3 0.5 8.7 10.3 2.8 3.3 3.5 47.0 39.0 87.0 74.6 87.8 28 1Mean of row, excluding values for BTR

24
From ordinations of sites based on frequencies of each amphibian and reptile species at a site, several sites were similar to BTR (Figure 14). r2 between ordination distances and Sørenson distances between arrays were 0.79 and 0.09 for Axis 1 and Axis 2, respectively, indicating that differences in species composition between arrays are much better described by Axis 1 than by Axis 2. Final stress value for the ordination was 12.0 indicating that the two dimensional ordination was adequate.
Figure 14. NMS analysis based on amphibian and reptile species captured at each of the drift fences during survey for the eastern massasauga rattlesnake at Indiana Dunes National Lakeshore, 2002.

25
Table 6. Correlations between species frequency of capture and NMS axis values in Figure 14. Data obtained from survey of the eastern massasauga rattlesnake at Indiana Dunes National Lakeshore, 2002. Species Axis 1 Axis 2Pseudacris triseriata 0.52 0.10Pseudacris crucifer 0.75 0.03Hyla versicolor 0.27 0.38Bufo americanus americanus -0.22 -0.19Bufo fowleri 0.24 0.14Rana catesbeiana 0.36 -0.34Rana clamitans 0.66 -0.67Rana pipiens 0.49 -0.57Rana sylvatica 0.54 -0.14Ambystoma jeffersonianum Complex 0.12 -0.48Ambystoma laterale 0.56 -0.24Hemidactylium scutatum 0.43 -0.29Plethodon cinereus -0.30 -0.33Notophthalmus viridescens 0.12 0.43Clemmys guttata 0.19 -0.20Cnemidophorus sexlineatus -0.09 -0.11Nerodia sipedon -0.02 0.16Storeria dekayi 0.48 -0.24Thamnophis sirtalis 0.50 0.33Coluber constrictor 0.02 0.38Heterodon platyrhinos -0.35 0.28Sistrurus catenatus catenatus 0.19 -0.20
NMS Axis 1 in Figure 14 is most highly correlated with frequency of Pseudacris
crucifer (spring peeper, r = 0.75) and Rana clamitans (green frog, r = 0.66) (Table 6). Among the snakes, site ordination scores on Axis 1 were most strongly correlated (r = 0.50) with Thamnophis sirtalis (eastern garter snake) capture frequency. BTR exhibited 51- 66% similarity in species composition with all other arrays except Calumet Fen (CAL, 18%) and Carolina Bike Trail (CBT, 33%) (Table 7).

26
Table 7. Sørenson similarity between BTR and other arrays based on species composition from survey of the eastern massasauga rattlesnake at the Indiana Dunes National Lakeshore, 2002.
Site Similarity with BTR
BIL 0.61 BIU 0.55 CAL 0.18 CBT 0.33 CMP 0.54 CNE 0.53 CNW 0.54 CRN 0.63 CWS 0.51 DBY 0.60 MAC 0.63 MST 0.54 WEL 0.66
Artificial Cover Objects
No massasaugas were found under ACOs. In general, ACOs, as deployed, were not very effective in capturing amphibians or reptiles (Table 8). All species captured using cover boards, were also captured or observed using other survey methods. Table 8. Species found under artificial cover objects during survey for the eastern massasauga rattlesnake at the Indiana Dunes National Lakeshore, 2002. Species Number of capturesPseudacris triseriata 10 Pseudacris crucifer 9 Rana clamitans 1 Rana pipiens 1 Rana sylvatica 1 Ambystoma laterale 2 Storeria dekayi 4 Thamnophis sirtalis 19 Bufo americanus 3
Visual Searches In total, 141 individual visual searches over 326 hours were conducted in 2002. No massasaugas were confirmed during the visual searches although one likely sighting occurred (Figure 2).
27
Discussion
We know that at least one site, BTR, possessed characteristics amenable to the presence of massasaugas, although we cannot say whether BTR represents a high quality site. CBT and CRN were the two sites most similar to BTR in habitat composition. However, while CRN was 63% similar to BTR in species captured, CBT and BTR were only 33% similar, suggesting that BTR and CRN shared more key habitat elements for amphibian and reptile species than did BTR with CBT. CBT is along the Calumet Bike Trail as is BTR. CRN is at the eastern end of the East Unit and is very close to the location where an adult road killed massasauga was found in 1991 and where a possible sighting was made by the survey crew in 2002. Although we do not fully understand which landscape parameters may predict the presence of the massasauga, these two sites, and especially CRN, may be prime locations for intensified surveying or restoration in the future. As noted, one feature BTR and CRN share is a relatively high percentage of areas dominated by wetland obligate or facultative trees within 200 m of the array. Massasaugas have been found overwintering in tree root masses in wet soil (Conant 1951, Prior 1991 in Szymanski 1998). BTR and CBT, on the other hand, share relatively high percentages of open habitats, which are potentially good foraging habitats, within 200 m of the fence.
Three habitat elements commonly occur at known massasauga sites: (1) open
areas with intermixed sunlit and shaded regions, (2) a water table near the surface, and (3) availability of both lowland and upland areas (Szymanski 1998). Intermixed, sunlit and shaded regions provide proper thermoregulatory conditions for massasaugas. Moist soil, facilitated by water near the surface, helps massasaugas avoid desiccation during the winter. Lowland and upland habitat provide both foraging and overwintering areas. The Great Marsh area of INDU, located in a low area between two dune ridges paralleling Lake Michigan, might fulfill requirements (2) and (3) in the prescription above. What appears to be missing from most sites in the East Unit are sunlit open, upland areas with a herbaceous vegetation layer that is sufficiently open to allow sunlight to penetrate to the ground. A combination of fire suppression in upland areas and draining of the Great Marsh has led to an influx of woody vegetation in both upland and wetland areas. Such shrubby habitat is not suitable for massasaugas. While several small areas of open habitat exist in the East Unit, only the powerline corridor, within which the Calumet Bike Trail runs, contains a large amount of open habitat (Figure 2). Although this corridor is not Indiana Dunes National Lakeshore property, it is located along the southern boundary of the park’s East Unit. Overgrowth of woody vegetation has not occurred in this corridor because powerline and railroad companies have maintained its openness. Furthermore, the most reputable massasauga reports seem to be centered on this corridor, especially near the Beverly Shores Train Station (Figure 2). To what degree this represents an observer bias is unclear, as the Calumet Bike Trail, particularly near the Beverly Shores Train Station, generally has more human traffic than most of the East Unit.

28
Figure 15. Possible dispersal corridors for massasaugas near the Beverly Shores Train Station at Indiana Dunes National Lakeshore.

29
While other sites along the Calumet Bike Trail contain elements suitable for massasauga survival, BTR is unique in that an additional powerline corridor, running north from the Calumet Bike Trail, connects potential open water and marsh overwintering sites with the open Bike Trail habitats likely used during the summer (Figure 15). The snakes might use this additional power line corridor during migration to and from the possible overwintering site.
While previous research suggests that the chief requirement of an overwintering
site is water at or near the surface, habitat elements such as animal burrows, mosses, and hummocks (often found in sedge meadows) may be used to reach the water table while still providing shelter (Szymanski 1998). Locations of these potentially important overwintering features (mammal and crayfish burrows, sedge meadows, marshes, and sphagnum mounds) were mapped (Figure 16). Although no formal analysis was conducted, reported sightings of the eastern massasauga rattlesnake often coincide with the presence of these overwintering features (Figure 17), suggesting that massasaugas might still be found in areas where these overwinter features occur.

30
Figure 16. Potential massasauga hibernacula habitat elements encountered during visual searches within the East Unit of Indiana Dunes National Lakeshore, 2002-2003.

31
Figure 17. Hibernacula habitat elements and reported massasauga sightings since establishment of Indiana Dunes National Lakeshore in 1966.

32
Summary and Recommendations
Our surveys established that S. c. catenatus exists within the boundary of Indiana Dunes National Lakeshore. Further monitoring is needed to determine the snake’s status, to identify critical habitat, and to provide park managers with information necessary to properly ensure the long-term survival of the species. Our surveys emphasized maximizing coverage throughout the East Unit of the park. Surveys in the future should focus on areas with historical massasauga sightings and in areas identified as potential habitat. Visual searches during the summer months, when vegetation was dense, were not successful, in part, because the eastern massasauga is a cryptic species. Future visual searches, if undertaken, should be limited to early spring and late fall when vegetation is less dense, or should be conducted in areas with less dense vegetation throughout the year. Cover boards were ineffective in 2002, attracting few amphibians or reptiles. It is unclear whether the low capture rate represents general ineffectiveness of cover objects at these particular locations or of the particular material used. The compressed fiberboard that was used may not have provided the proper thermoregulatory conditions to attract herpetofauna or perhaps the composition of the fiberboard repelled the animals. If cover board monitoring is to continue, different material, such as sheet metal or rough-cut wood, should be selected (Fitch 1992, Grant et al. 1992, Reading 1997). Drift fences proved to be the most successful survey method. Future fences should be placed primarily in areas that have had historic sightings and that have been identified as potential massasauga habitat (Figure 17). In addition to future searches, it is important to incorporate potential massasauga habitat into the park’s management plans. The East Unit has probably lost much open-canopy land over the past century due to decreases in wildfires and periodic flooding (Applied Ecological Services 1984). Exposed open areas are essential to the thermoregulatory needs of all temperate snakes, in particular gravid females. Increased canopy cover can also result in losses of important overwinter habitats such as sedge hummocks, sphagnum mounds, and animal burrows (Johnson et al. 2000). Furthermore, prey communities change with a changing landscape. Loss of foraging opportunities may force snakes to use unfavorable habitat, reducing viability. To counter these successional trends, Johnson et al. (2000) suggested a general management goal of providing areas with a relatively open canopy (majority of vegetation is less than 0.5 m tall), intermixed with areas of greater canopy cover (majority of the vegetation greater than 0.5 m tall). Although relative proportions of the two cover classes may vary, overall canopy cover should not exceed 50%. The implementation of controlled burns, mechanical treatments, restoration of hydrological regime, or herbicide treatment have been useful in preserving and enhancing massasauga habitat at other sites (Johnson et al. 2000). While our surveys establish the existence of the eastern massasauga rattlesnake at the Indiana Dunes National Lakeshore, little is known about its status and habitat use. It is important that more information be gathered to determine what current aspects of the

33
landscape allow the massasauga to persist and what changes have led to its decline. Historical records, along with vigorous searching and mapping efforts have identified several areas within the park’s East Unit as potential massasauga habitat. With careful monitoring and habitat management we can increase the likelihood that the eastern massasauga rattlesnake will survive at the Indiana Dunes National Lakeshore for years to come.
Acknowledgments
Eric Garza and Gary Glowacki gathered most of the data described in this study. The authors thank Eric for his contributions to this study. We also thank John Drake, Randy Grass, Steve Korcha, Krystal Potts, and Mick Zelski for participating in the surveys on which this report is based and Randy Knutson for assisting in drift fence monitoring in 2003. Noel Pavlovic helped with many aspects of the habitat mapping process. This study was funded by the National Park Service Great Lakes Network Inventory and Monitoring Program and by in-kind salary support from the U.S. Geological Survey.

34
Update October 2004
Since the completion of the surveys outlined in this report, two likely massasauga sightings have occurred. On August 21, 2004, the Beverly Shores Police Department reported a “rattlesnake” sunning itself on the concrete pavement located at the southwest corner of the Beverly Shores Train Station. Indiana Dunes National Lakeshore Visitor Protection Ranger Steve Chorba investigated the sighting. He described the snake as approximately 24-28 inches (60-71 cm) in length, brown with darker brown irregular spots, and a rattle. Mr. Chorba had previous experience handling rattlesnakes while working on a resource management project at Delaware Water Gap National Recreation Area so his identification of the snake as a rattlesnake is very likely correct. This adult snake was found ~ 20 m from the confirmed sighting of a juvenile in 2000, and is also within 100 m of the juvenile captured in the fall of 2002 in the current study. Although no photographs were taken, the knowledge of the observer and the proximity to other sightings, lend particular credence to its confirmation. This recent report further verifies the presence of massasaugas in the area around the Beverly Shores Train Station.
A second and more unexpected observation occurred on October 1, 2004. A local
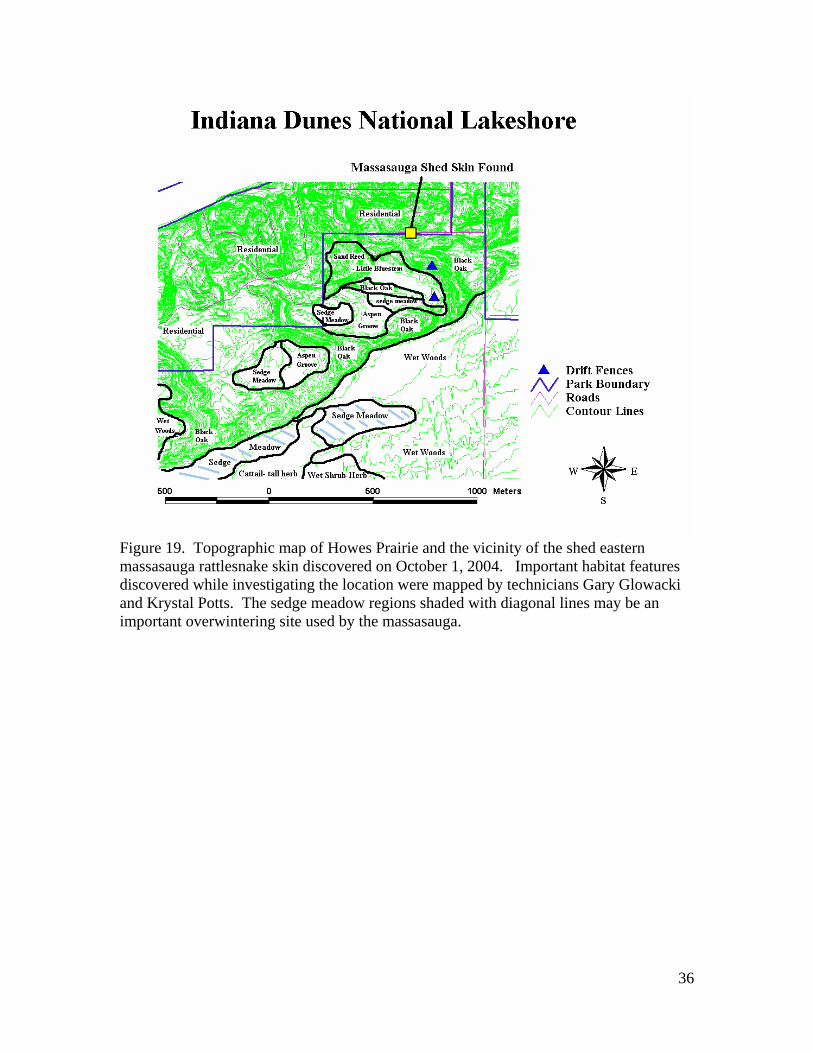
resident reported the discovery of a shed rattlesnake skin to Randy Grass of the National Park Service. Randy Grass found the shed skin adjacent to Roskin Road, just east of Wabash Avenue, in Porter, Indiana (Figure 18). The skin was ~5 cm long segment and contained the rattle and enough pattern to confirm it as a rattlesnake and consistent with being a massasauga. Additionally, the resident reporting the skin also mentioned to Mr. Grass that another neighbor has frequently seen rattlesnakes throughout the years, both large and small, in the vicinity of the shed skin. This particular unit of the Park was not searched during the survey as no historical records indicated the presence of the massasauga, nor did the habitat appear particularly conducive to massasauga survival. Furthermore, during a separate amphibian and reptile study, mentioned previously, two drift fences were operated at Howes Prairie, within 200 m of the site where the shed skin was found. In four years of continuous spring to fall sampling, no massasaugas were captured. Upon discovery of the shed skin, technicians Gary Glowacki and Krystal Potts investigated the nearby area. Oak forest was the dominant habitat at the immediate location the shed skin was found. Roughly 250 m south, exists several low-lying mesic prairies/grasslands dominated by Panicum virgatum and to a lesser extent Calamagrostis canadensis (Figure 19). These low-lying grasslands are subject to periodic flooding (Pavlovic et al. 1983, Cole 1988, Cole and Pavlovic 1988). Flood events can have profound effects upon the vegetative community. Since the last flood, which occurred in 1983, the vegetation has shifted from that of a wet prairie (Calamagrostis canadensis and Carex stricta) to a more mesic prairie (Panicum virgatum). While the habitat under flood conditions is likely suitable, the current low-water levels make these sites unlikely overwintering sites.
Farther south within the Dunes Creek Watershed (~900-1000 m), wetlands exist
that may have suitable overwintering sites for the massasauga (Figure 19). While most of these wetlands are heavily shaded wet woods, a large marsh also exists. This marsh contains a fringe of sedge meadow surrounding cattails. The fringe contains an extensive

35
system of sedge hummocks as well as sphagnum moss and crayfish burrows, all known characteristics of massasauga hibernacula. While this area is rather far from the location the shed skin was found (~1 km), massasaugas have been known to travel in excess of 2.7 km (Johnson 1995, Johnson et al. 2000).
Both of these new discoveries warrant additional investigation. The shed skin
found near Howes Prairie demonstrates the lack of understanding we have regarding the distribution of the snake within the park, what habitat elements are important to the snake, and what elements are essential. The third documented observation of a massasauga near the Beverly Shores Train Station in the last four years exemplifies the need to gain more understanding of the massasaugas at the Indiana Dunes National Lakeshore. It is essential that we understand the eastern massasaugas’ patterns of habitat use, distribution, and general demography if we are to retain this species at the Indiana Dunes National Lakeshore.
Figure 18. Location of the shed eastern massasauga rattlesnake skin found on October 1, 2004 by Randy Grass of the National Park Service. Note the proximity to the drift fences used in a previous study of hepetofauna in which no massasaugas were captured.
36
Figure 19. Topographic map of Howes Prairie and the vicinity of the shed eastern massasauga rattlesnake skin discovered on October 1, 2004. Important habitat features discovered while investigating the location were mapped by technicians Gary Glowacki and Krystal Potts. The sedge meadow regions shaded with diagonal lines may be an important overwintering site used by the massasauga.
37
Literature Cited Applied Ecological Services. 1984. Ecological condition and management opportunity
for the Great Marsh system, Indiana Dunes National Lakeshore, Porter, Indiana. Brodhead, WI.
Casper, G. S., T. G. Anton, R. W. Hay, A. T. Holycross, R. S. King, B. A. Kingsbury, D.
Mauger, C. Parent, C. A. Phillips, A. Resetar, R. A. Seigel, and T. P. Wilson. 2000. Recommended standard survey protocol for the eastern massasauga Sistrurus catenatus catenatus. U.S. Fish and Wildlife Service, Fort Snelling, MN 55111-4056.
Cole, K.L. 1988. Historical impacts on communities in disequilibrium. In: Cole, K.L.
(ed.) Proceedings of the First Indiana Dunes Research Conference, Symposium on Plant Succession, pp. 3-17. National Park Service Science Publication Office, Atlanta, GA.
Cole, K.L. and Noel B. Pavlovic. 1988. Howes Prairie, a remnant of the Indiana prairie preserved by periodic flooding. Indiana Dunes National Lakeshore, Porter, IN. Conant, R.C. 1951. The reptiles of Ohio. Second Edition. The American Midland
Naturalist. University of Notre Dame, Notre Dame, IN, USA. Cook, G. S., and R. S. Jackson. 1978. The Bailly area of Porter County, Indiana. Robert
Jackson & Associates, Evanston, IL, USA. ESRI. 2002. ArcView GIS Release 3.3. Fitch, H. S. 1992. Methods of sampling snake populations and their relative success.
Herpetological Review 23:17-19. Grant, W. G., D. T. Anton, J. E. Lovich, A. E. Mills, P. M. Philip, and J. W.
Gibbons. 1992. The use of coverboards in estimating patterns of biodiversity. In Wildlife 2001, pp. 379-403. Elsevier, London.
Harding, J. H. 1997. Amphibians and reptiles of the Great Lakes region. The University
of Michigan Press, Ann Arbor, MI, USA. Johnson, G. 1995. Spatial ecology, habitat preference, and habitat management of the
eastern massasauga, Sistrurus c. catenatus in a New York weakly-minerotrophic peatland. Ph.D. dissertation. State University of New York, Syracuse, NY, USA.
Johnson, G., B. A. Kingsbury, R. S. King, C. Parent, R. A. Seigel, and J. Szymanski.
2000. The eastern massasauga rattlesnake: a handbook for land managers. U. S. Fish and Wildlife Service, Fort Snelling, MN, USA.

38
McCune, B., and J. B. Grace. 2002. Analysis of ecological communities. MjM Software Design, Gleneden Beach, OR, USA.
McCune, B., and M. J. Mefford. 1999. PC-ORD. Multivariate analysis of ecological data,
Version 4. MjM Software Design, Gleneden Beach, Oregon, USA. Microsoft Corporation. 1999. Access 2000, version 9.0.6926-SP3. Minton, S. A., Jr. 2001. Amphibians and reptiles of Indiana. Indiana Academy of
Science, Indianapolis. Pavlovic, N.B., N. Henderson, and R. Hiebert. 1983. Status report concerning the study
of the effects of fire and flooding on the Howes Prairie ecosystem. Indiana Dunes National Lakeshore, Porter, IN.
Prior, K.A. 1991. Eastern massasauga rattlesnake (Sistrurus catenatus) Biology, Status,
and Management: A Guide for Recovery. Unpublished report for the Ontario Ministry of Natural Resources. 40pp.
Reading, C. J. 1997. A proposed standard method for surveying reptiles on dry lowland
heath. Journal of Applied Ecology 34: 1057-1069. Resetar, A. 1994a. Amphibians and reptiles in the most recent land additions of the
Indiana Dunes National Lakeshore. Report submitted to the National Park Service Indiana Dunes National Lakeshore, Porter, Indiana.
Resetar, A. 1994b. The amphibians and reptiles of the Indiana Dunes National Lakeshore.
Report submitted to the National Park Service Indiana Dunes National Lakeshore, Porter, Indiana.
Szymanski, J. 1998. Status assessment for eastern massasauga (Sistrurus c. catenatus).
U.S. Fish and Wildlife Service, Fort Snelling, MN, USA. U.S. Fish and Wildlife Service. “Notice of availability of a draft environmental
assesment entitled: Proposal to implement candidate conservation agreements and conservation measures for eastern massasaugas in states within Region 3 of the U.S. Fish and Wildlife Service” Federal Register, 68:207 (27 October 2003).

39
Appendix Two sets of data are included as appendices with this report – 1) Geographic Information System (GIS) layers describing survey locations and paths. Presented in ArcView 3.3 (ESRI 2002). 2) A database of site descriptive data and capture data from 2002. Presented in Microsoft Access 2000 (Microsoft Corporation 1999). Components of these two data sets include: (1) ArcView 3.3 layers: Massasaugaarray (.dbf, .htm, .met, .sbn, .sbx, .shp): Documents locations of drift fences. Massasaugamapping (.dbf, .htm, .met, .sbn, .sbx, .shp): Maps habitat types within 200 m of each array. Surveyhab (.dbf, .htm, .met, .sbn, .sbx, .shp): Locations of potential massasauga preferred habitat elements encountered during surveys. Masssurvey2002 (.dbf, .htm, .met, .sbn, .sbx, .shp): Area covered during visual searches in 2002. Sightings (.dbf, .htm, .met, .sbn, .sbx, .shp): Locations of reported massasauga sightings in the vicinity of Indiana Dunes National Lakeshore since the formation of the park. Aco (.dbf, .htm, .met, .sbn, .sbx, .shp): Locations of artificial cover objects. In addition, several reference layers are provided. These include: Contour east: Contour lines for Indiana Dunes National Lakeshore East Unit. Park Boundary: Boundary of Indiana Dunes National Lakeshore East Unit. Railroad: Railroad lines within Indiana Dunes National Lakeshore East Unit. Road: Roads within Indiana Dunes National Lakeshore East Unit. Reference layers are included as a background for the massasauga survey and habitat mapping layers. These reference layers were provided by Indiana Dunes National Lakeshore and are not documented with metadata. All layers produced expressly for this study are documented with metadata. (2) Database (Indiana Dunes Massasauga Survey 2002): Note: All variables within database tables are described within the table under “Design View”. To access Design View from the Microsoft Access menu, select “View” and then “Design View”.

40
ACO Database: List of species found under artificial coverboard objects during each visit to the ACO’s. ACO Locations: Size and UTM coordinates of each ACO. Drift Fence Capture Database: List of species captured in drift fence arrays during each visit to an array. Drift Fence Locations: UTM coordinates and habitat composition within 200 m of each drift fence array. Observer: List of participants in massasauga surveys. ParkCode: List of national park codes. Project: Massasauga rattlesnake survey. Species Code: List of four letter species codes used in study and associated common and scientific names.