eastern contra costa transit authority
TRANSCRIPT

i | P a g e
ShortRangeTransitPlan
2020‐2029
Eastern Contra Costa Transit Authority

ii | P a g e
Short Range Transit Plan
FY 2020 – FY 2029
Eastern Contra Costa Transit Authority TRI DELTA TRANSIT
Approved: August 26, 2020
Federal transportation statutes require that the Metropolitan Transportation Commission (MTC), in partnership with state and local agencies, develop and periodically update a long‐range Regional Transportation Plan (RTP), and a Transportation Improvement Program (TIP) which implements the RTP by programming federal funds to transportation projects contained in the RTP. In order to effectively execute these planning and programming responsibilities, MTC requires that each transit operator in its region which receives federal funding through the TIP, prepare, adopt, and submit to MTC a Short Range Transit Plan (SRTP).

iii | P a g e
TABLE OF CONTENTS
Chapter 1: Overview of Transit System
Agency History ................................................................................................................................. 1 Governance ...................................................................................................................................... 2 Organizational Structure .................................................................................................................. 3 Transit Services Provided and Areas Served .................................................................................... 5 Fare Structure .................................................................................................................................. 9 Revenue Fleet ................................................................................................................................ 11 Facilities ......................................................................................................................................... 12
Chapter 2: Goals, Objectives and Standards
Process for Establishing, Reviewing and Updating Goals .............................................................. 13 Mission Statement Goals ............................................................................................................... 14
Chapter 3: Service and System Evaluation
Demographic Evaluation ................................................................................................................ 16 Fixed Route Trends ........................................................................................................................ 21 Paratransit Trends .......................................................................................................................... 25 Paratransit Compliance with ADA Regulations .............................................................................. 27 FTA Triennial Review ...................................................................................................................... 27
Chapter 4: Operations Plan and Budget Operations Plan ............................................................................................................................. 29 Operations Budget ......................................................................................................................... 31
Chapter 5: Capital Improvement Plan Capital Plan .................................................................................................................................... 37
Fleet Plan ....................................................................................................................................... 37 Facilities Plan .................................................................................................................................. 43 Unfunded Capital Projects ............................................................................................................. 45 Fleet and Facilities Inventories ...................................................................................................... 45

iv | P a g e
TABLE OF FIGURES
Figure 1.1 Organizational Structure ................................................................................................. 3 Figure 1.2 Tri Delta Transit System Map .......................................................................................... 6 Figure 1.3 Fixed Routes Summary ................................................................................................... 7 Figure 1.4 Fare Structure ............................................................................................................... 10 Figure 1.5 Summary of Revenue Vehicles...................................................................................... 11 Figure 2.1 ECCTA Mission Statements ........................................................................................... 14 Figure 2.2 Summary of ECCTA Objectives, Measures and Standards ............................................ 15 Figure 3.1 Population Estimates and Projections by City .............................................................. 16 Figure 3.2 Population Densities by City ......................................................................................... 16 Figure 3.3 Map of Service Area – Population ................................................................................ 17 Figure 3.4 Race/Ethnicity by City ................................................................................................... 18 Figure 3.5 Household Income Levels by City ................................................................................. 18 Figure 3.6 Map of Service Area – Ethnicity .................................................................................... 19 Figure 3.7 Map of Service Area – Poverty (200%) ........................................................................ 20 Figure 3.8 Average Fuel Prices in California ................................................................................... 21 Figure 3.9 Comparative Annual FR Ridership by Route ................................................................. 22 Figure 3.10 Graph of Comparative Annual Fixed Route Ridership by Route ................................ 23 Figure 3.11 Fixed Route Key Performance Indicators (KPI) ........................................................... 24 Figure 3.12 Comparison of Fixed Route KPI Versus Performance Standards ................................ 25 Figure 3.13 Paratransit Key Performance Indicators (KPI)............................................................. 26 Figure 3.14 Comparison of Paratransit KPI Versus Performance Standards ................................ 27 Figure 4.1 Projections of Motor Bus Service Levels ....................................................................... 29 Figure 4.2 Projections of Demand Response Service Levels .......................................................... 30 Figure 4.3 Three‐Year Retrospective of Motor Bus Revenues and Expenses ................................ 33 Figure 4.4 Motor Bus Estimated Budget for SRTP Period ............................................................. 34 Figure 4.5 Three‐Year Retrospective of Demand Response Revenues and Expenses ................... 35 Figure 4.6 Demand Response Estimated Budget for SRTP Period ................................................. 36 Figure 5.1 Planned Capital Expenditures over SRTP Period ........................................................... 38 Figure 5.2 ZEB Purchase Schedule as a Percentage of Total New Bus Purchases ......................... 38 Figure 5.3 Planned Fleet Capital Expenditure Summary ............................................................... 40 Figure 5.4 Revenue Vehicle Replacement Schedule by Year ........................................................ 40 Figure 5.5 Revenue Vehicle Replacement Schedule Details .......................................................... 41 Figure 5.6 Revenue Vehicle Price List ............................................................................................ 41 Figure 5.7 Non‐Revenue Vehicle Expenditure Summary ............................................................... 42 Figure 5.8 Facilities and Equipment Expenditure Summary .......................................................... 44 Figure 5.9 Unfunded Projects ........................................................................................................ 45 Figure 5.10 Revenue Vehicle Inventory – Motor Bus ............................................................... 45‐46 Figure 5.11 Revenue Vehicle Inventory – Paratransit and Microtransit (DR) ................................ 47 Figure 5.12 Non‐Revenue Vehicle Inventory ................................................................................. 48 Figure 5.13 Facilities and Equipment Inventory ........................................................................... 49

1 | P a g e
CHAPTER 1: TRANSIT SYSTEM OVERVIEW
AGENCY HISTORY The Eastern Contra Costa Transit Authority (ECCTA) was formed in 1976 as a Joint Powers Agency (JPA) under the provisions of the California Joint Exercise of Powers Act, Government Code Sections 6500 et. seq. by the cities of Antioch, Brentwood, Pittsburg and the County of Contra Costa. After Oakley became a city in 1999, the JPA was restated to admit the City of Oakley as a member of ECCTA, effective April 5, 2000. The area served by ECCTA is the 225‐square mile area in eastern Contra Costa County. ECCTA was formed to provide local transit service and to provide connections to BART express bus service, which began in 1975 as a “rubber tire extension” of BART. The Metropolitan Transportation Commission (MTC) funded the first two years of ECCTA operations as a demonstration project. Once the demonstration project was over in 1979, ECCTA became a claimant for Transportation Development Act (TDA) funds. Tri Delta Transit, ECCTA’s adopted marketing and system identity, began service on June 6, 1977. Routes 380 and 381 provided local service in Antioch and Pittsburg and feeder connections to BART express bus service, which in turn linked Eastern Contra Costa County residents to the Concord BART station. AC Transit provided the service under contract to ECCTA. In 1979, door‐to‐door paratransit service began through a contract with Community Transit Service (CTS) for older residents and persons with disabilities. The paratransit system was expanded in 1981 to serve rural residents of Eastern Contra Costa County. In 1991, eligibility policies were changed to limit service to the elderly and persons with disabilities. ECCTA terminated the AC Transit contract for fixed route service in 1984, consolidating both fixed route and paratransit operations under an agreement with Community Transit Service (CTS). The CTS operating and maintenance facility was located at a former U.S. Steel facility in Pittsburg, while ECCTA administrative offices were located on Sycamore Drive in Antioch. In 1986, ECCTA replaced CTS with Laidlaw Transit Services, Inc. as its service contractor. Laidlaw or, its successor organization, First Transit continues in this capacity today (Laidlaw was purchased by First Transit in late 2007). The current service agreement became effective July 2016 for a four‐year term with three, two‐year options. Those options were exercised and the contract expires June 30, 2026. The existing ECCTA facility at 801 Wilbur Avenue in Antioch was constructed and occupied in 1987, consolidating operations, maintenance and administrative functions of ECCTA and its service contractor at a single location. This facility was expanded in February 2004 and additional bus parking was built on property adjacent to the facility in July 2004. Tri Delta Transit began a specialized paratransit service, the Antioch Senior Bus Service, in May 2003. The Antioch Senior Bus Service was operated by the Antioch Senior Citizens Club and, through Tri Delta Transit, claimed TDA and Contra Costa County Measure C transportation sales tax funds for the service, and purchased vehicles for the program using County Measure C funds. Tri Delta Transit ceased the provisions of funds for the Antioch Senior Bus program in September of 2012. This change was accompanied with extensive outreach efforts on Tri Delta Transit’s part to absorb those former Antioch

2 | P a g e
Senior Bus patrons who qualified under Tri Delta Transit’s criterion in transitioning to using the paratransit system on the same basis as other East County users. Beginning in the mid 1980’s and continuing through the 1990’s, ECCTA expanded local fixed route service, adding neighborhoods in Pittsburg and southeast Antioch, and improved service coverage in Brentwood, Oakley and rural East County. When BART rail service was extended from North Concord to the Bay Point station in December 1996, ECCTA revised a number of routes to provide BART feeder service and improved express service along the Highway 4 corridor. In August 2007, local transit service was extended from Bay Point to Concord. This route provides direct, no transfer service for the hundreds of Bay Point students who attend high school in Concord, and links with other needed services such as health care in northeast Concord, including services for veterans. In 2014 ECCTA was recognized by the American Public Transportation Association (APTA) as Transit System of the Year (in the category: providing 4 million or fewer annual passenger trip) for its achievements in effective policies, innovative customer outreach and exemplary service. In June 2019, an on‐demand microtransit service, Tri MyRide, was launched in two neighborhoods primarily connecting commuters in underserved communities to and from BART stations adjacent to these communities.
Governance ECCTA is governed by an eleven‐member board of directors composed of two appointed representatives from each of the JPA member jurisdictions and a single member at large selected by the other ten board members on a biennial basis. The appointed representatives are selected by the mayor and/or city council of each of the four cities with two more appointed by the county Board of Supervisors. There is currently no term of expiration for the ten, city/county appointed board members. As of December 31 2019, ECCTA board members include:
City of Antioch: Lamar Thorpe Monica Wilson
City of Brentwood: Barbara Guise Robert Taylor (Chair)
City of Oakley: Sue Higgins Kevin Romick
City of Pittsburg: Merl Craft Shanelle Scales‐Preston (Vice‐Chair)
Contra Costa County: Diane Burgis Federal Glover
Member at Large: Ken Gray The Board meets once a month at ECCTA’s administrative office. In addition, three formal subcommittees are convened as needed: Administration and Budget Committee ‐ oversees financial activities of the organization, including purchasing, contracts, bookkeeping and accounting, grant applications, and fare policy.
3 | P a g e
Marketing and Operations Committee ‐ oversees service planning, public information, customer service, and advertising policies.
Personnel Committee ‐ oversees personnel policies. The Board may also convene special ad‐hoc committees to handle contract negotiations and conduct other business as required on an “as necessary” basis. ECCTA directly employs more than 37 personnel for administrative, maintenance, finance, marketing, customer service, contract management and transit planning. ECCTA contracts with First Transit, a private for‐profit company, for the services of more than 180 bus operators, supervisors and operations management. First Transit is responsible for screening, hiring, testing and the supervision of all operations staff and the booking, scheduling and dispatching of all paratransit trips. The current contract, with a 4‐year term, began on July 1, 2016 and has three 2‐year options which were exercised. This contract expires June 30, 2026. The Board of Directors appoints a Chief Executive Officer (CEO), who in turn is supported by the Chief Operating Officer, Chief Financial Officer, Manager of Administrative Services, Chief Communications Officer, other administrative staff, as well as a General Manager employed by the operations contractor.

4 | P a g e
Organizational Structure Figure 1.1 ECCTA Organizational Structure
Chief Executive Officer
Chief Communications
Officer
Executive Assistant DBE Liaison Officer Civil Rights Officer SMS Executive
Manager of Administrative
Services
Director of Maintenance
Chief Operating Officer
First Transit General Manager
Chief Financial Officer
Administrative Assistant
Customer Service Associate
Operations Manager
Payroll Clerk
AP/Payroll Associate
Manager of Accessible Services
AR Associate
Mechanics
Service Workers
Maintenance Coordinator
Bus Stop and Facility
Maintainer
Safety and Training
Shop Manager
ECCTA Board of Directors
Accessible Services
Coordinator
Special Projects Analyst
Receptionist
Facilities Manager
Supervisors, Schedulers,
and Operators
Manager of Planning and Grants(vacant)

5 | P a g e
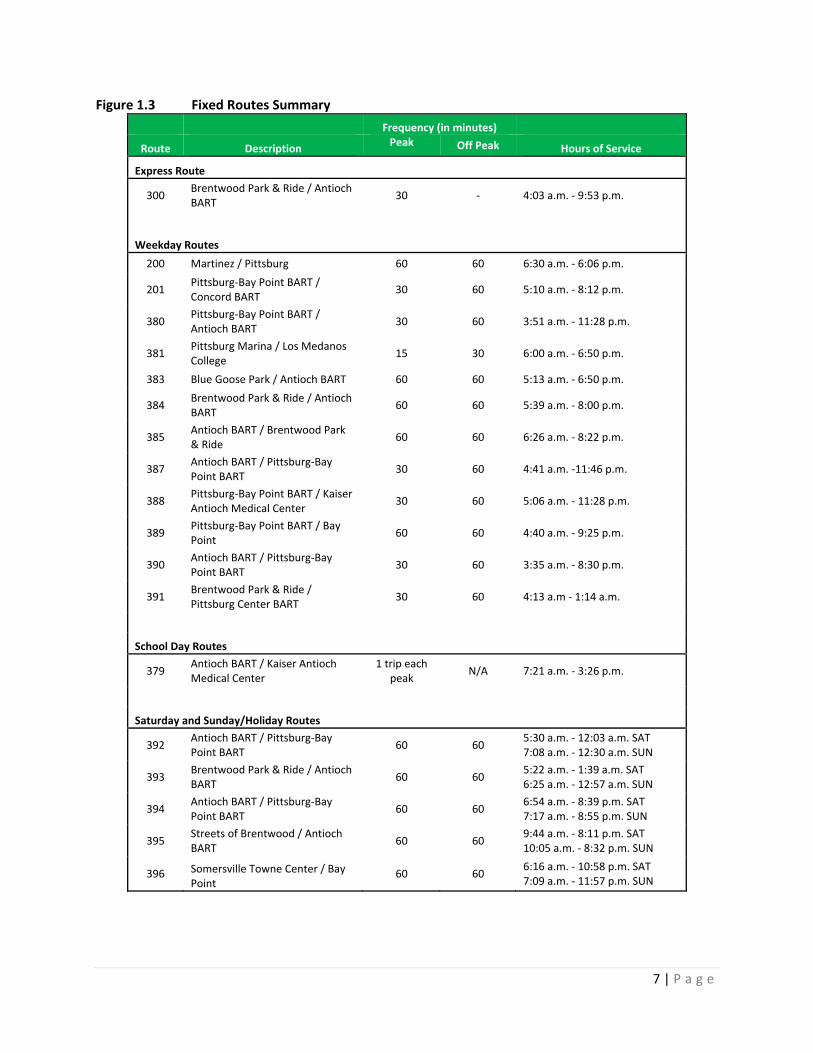
Transit Services Provided and Areas Served Fixed Route (Motor Bus) The Tri Delta Transit fixed route network consists of 12 local weekday routes, one weekday express route, one school day route, and five local weekend and holiday routes providing coverage between Bay Point and Brentwood through Oakley, Antioch and Pittsburg. Selected routes operate beyond the boundaries of the ECCTA service area into Martinez and Central Concord. A depiction of ECCTA’s service area and transit system are provided below in Figure 1.2 as well as a summary of the routes in Figure 1.3. Local service includes long‐established routes covering the mature areas of Antioch, Pittsburg and the unincorporated area of Bay Point, as well as to the newer developments southeast Antioch, Oakley and Brentwood. Most of existing Route 380 and segments now covered by Routes 387, 388 and 389 have been operating since the late 1970’s. Service coverage, frequency and span improvements were implemented incrementally in Antioch and Pittsburg during the mid‐1980s and 1990s. Brentwood Dimes‐a‐Ride service began as a circulatory route subsidized by the City of Brentwood in 1987 and expanded somewhat in 1995. The local network was partially restructured in 1994, and again in 1996 following the opening of the Pittsburg/Bay Point BART station. Route 383 serving Oakley was added in April 2001. Route 201 between Pittsburg and Concord began operations in August 2007. Tri Delta Transit first introduced express bus service in 1996 when the Pittsburg/Bay Point BART station opened. In 1997, Tri Delta Transit assumed responsibility for BART Express bus service between Pittsburg/Bay Point BART and Brentwood via the Highway 4 corridor. Additional Express Routes to the Lawrence Livermore Lab and to Dublin BART were created but services to these destinations were eliminated in 2010 and 2012, respectively. Presently there remains only one Express route (300) in the network which provides limited‐stop service between the Antioch BART station and existing park‐and‐ride lot in Brentwood via Highway 4. Currently, buses operate on weekdays at 15‐minute frequencies during peak periods, and 30 minute headways during midday and night hours. Route 200 links the Contra Costa County Medical Clinic on East Leland Road in Pittsburg with medical facilities in Martinez, including Veterans Hospital, the Contra Costa Regional Medical Center and the Summit Building. Route 200 also serves downtown Martinez, inter‐connecting with County Connection, Westcat, and Amtrak Capitol Corridor trains.

6 | P a g e
Figure 1.2 Tri Delta Transit System Map
7 | P a g e
Figure 1.3 Fixed Routes Summary
Frequency (in minutes)
Route Description Peak Off Peak Hours of Service
Express Route
300 Brentwood Park & Ride / Antioch BART
30 ‐ 4:03 a.m. ‐ 9:53 p.m.
Weekday Routes
200 Martinez / Pittsburg 60 60 6:30 a.m. ‐ 6:06 p.m.
201 Pittsburg‐Bay Point BART / Concord BART
30 60 5:10 a.m. ‐ 8:12 p.m.
380 Pittsburg‐Bay Point BART / Antioch BART
30 60 3:51 a.m. ‐ 11:28 p.m.
381 Pittsburg Marina / Los Medanos College
15 30 6:00 a.m. ‐ 6:50 p.m.
383 Blue Goose Park / Antioch BART 60 60 5:13 a.m. ‐ 6:50 p.m.
384 Brentwood Park & Ride / Antioch BART
60 60 5:39 a.m. ‐ 8:00 p.m.
385 Antioch BART / Brentwood Park & Ride
60 60 6:26 a.m. ‐ 8:22 p.m.
387 Antioch BART / Pittsburg‐Bay Point BART
30 60 4:41 a.m. ‐11:46 p.m.
388 Pittsburg‐Bay Point BART / Kaiser Antioch Medical Center
30 60 5:06 a.m. ‐ 11:28 p.m.
389 Pittsburg‐Bay Point BART / Bay Point
60 60 4:40 a.m. ‐ 9:25 p.m.
390 Antioch BART / Pittsburg‐Bay Point BART
30 60 3:35 a.m. ‐ 8:30 p.m.
391 Brentwood Park & Ride / Pittsburg Center BART
30 60 4:13 a.m ‐ 1:14 a.m.
School Day Routes
379 Antioch BART / Kaiser Antioch Medical Center
1 trip each peak
N/A 7:21 a.m. ‐ 3:26 p.m.
Saturday and Sunday/Holiday Routes
392 Antioch BART / Pittsburg‐Bay Point BART
60 60 5:30 a.m. ‐ 12:03 a.m. SAT 7:08 a.m. ‐ 12:30 a.m. SUN
393 Brentwood Park & Ride / Antioch BART
60 60 5:22 a.m. ‐ 1:39 a.m. SAT 6:25 a.m. ‐ 12:57 a.m. SUN
394 Antioch BART / Pittsburg‐Bay Point BART
60 60 6:54 a.m. ‐ 8:39 p.m. SAT 7:17 a.m. ‐ 8:55 p.m. SUN
395 Streets of Brentwood / Antioch BART
60 60 9:44 a.m. ‐ 8:11 p.m. SAT 10:05 a.m. ‐ 8:32 p.m. SUN
396 Somersville Towne Center / Bay Point
60 60 6:16 a.m. ‐ 10:58 p.m. SAT 7:09 a.m. ‐ 11:57 p.m. SUN

8 | P a g e
Paratransit (Demand Response) ECCTA’s ADA complementary paratransit service provides a door‐to‐door, demand responsive service throughout the ECCTA service area during fixed route hours. A two‐tier service is provided, one serves persons eligible for ADA service and the second serves non‐ADA senior passengers aged 65 and older who have completed ECCTA’s travel training program. Regular paratransit service covers the majority of local trip requests. Express paratransit service is provided under a contract with BART on Sundays and outside regular, ECCTA service hours. ECCTA also provides Paratransit service for non‐emergency trips to medical appointments.
Regular paratransit serves provides 445 weekday trips and 57 passenger trips on Saturdays.
Express paratransit serves about 31 daily trips on Saturdays and 47 passenger trips on Sundays.
The MedVan non‐emergency medical service carries more than 20 round trip passengers per day all week.
Mobility On Demand provides 150 weekday trips and 100 passenger trips on Satudarys.
Tri MyRide provides 170 weekday passenger trips. There is no weekend service. There are two service areas for ADA paratransit and Non‐ADA paratransit. ADA paratransit is provided within ¾ mile of scheduled fixed route service and non‐ADA paratransit service covers the entire ECCTA service area beyond the ¾ mile distance from fixed routes. The eligibility status of each patron determines what service can be used and available service times. ADA service is available throughout the ECCTA service area during all hours that the fixed route system is in operation, on weekdays between 3:35 a.m. and 1:14 a.m.; Saturdays between 5:22 a.m. and 1:39 a.m., and Sundays between 6:25 a.m. and 12:57 a.m. Non‐ADA paratransit service operates between 6:30 a.m. and 5:30 p.m. Monday through Friday, 10:00 a.m. to 6:00 p.m. on Saturdays, with no service on Sundays. A higher fare is also charged for service to and from locations in the non‐ADA paratransit area. Eligibility Process The ADA‐eligible certification process incorporates an explanation of how the applicants’ disability limits their ability to use regular bus service completed by a medical professional, and if necessary, a functional assessment conducted by Tri Delta Transit’s Manager of Accessible Services. The functional assessment was introduced to help manage demand. An applicant may still qualify for non‐ADA eligibility, and be able to use the more limited non‐ADA paratransit service if denied ADA service. Approximately 4,700 persons are registered to use the paratransit system, including 3,000 ADA‐eligible registrants and 918 non‐ADA eligible registrants (mostly seniors). 933 registrants use a wheelchair or scooter (20% of the total registrants). The registration database is updated regularly. All registrants must re‐apply every three years. Tri Delta Transit uses an Integrated Voice Response (IVR) telephone system that automatically dials and notifies customers one month prior to expiration of their eligibility. Paratransit Operations Driver duties include assisting paratransit passengers on and off the bus, securing wheelchairs, escorting passengers to‐and‐from the front door at the point of trip origin or destination, and assisting riders with reasonably‐sized parcels with no more than three trips between the bus and a patron’s door. A maximum of 34 buses are used for paratransit service in annual service.

9 | P a g e
Paratransit allows for a 30‐minute window for each pickup and drop‐off, e.g., a bus can arrive up to 15 minutes before or 15 minutes after the confirmed pick up time. The IVR system automatically notifies customers via telephone 15 minutes prior to the projected actual bus arrival time based on “real‐time” operations processes. Mobile Data Terminals (MDTs) and Automatic Vehicle Location (AVL) equipment have been installed on each paratransit vehicle. In most cases, maximum onboard travel times are scheduled to be less than one hour. Passengers must meet the paratransit driver within three minutes of arrival during the 30‐minute window, or risk becoming a “no show.” If a passenger must cancel an already‐scheduled trip, ECCTA requests so the trip can be canceled so at least one day in advance. Trips cancelled less than one hour before a scheduled pickup time is recorded as a no show. Service may be suspended for one month if a rider is a no show more than three times in six months.
Fare Structure The ECCTA Board of Directors establishes and periodically adjusts transit fares as necessary to maintain the financial viability of the system. The present fare structure was enacted in June 2015. Current rates are summarized in Figure 1.4 In addition to cash fares, a number of prepaid fare instruments are offered, including a 20‐ride pass, coupon books and monthly passes for local, bus‐rail feeder and express services. In January 2007, Tri Delta Transit successfully introduced day passes to replace system transfers. The current paratransit cash fare is $2.75 per one‐way passenger trip between locations within the ADA service area. Service to and from locations in the non‐ADA service area is $5.50 per one‐way passenger trip. Personal care attendants (PCA) can ride free and companions are charged the full fare. There are no discounted paratransit fares. Ten‐ticket booklets priced at $27.50 each are available for passenger convenience. The current fixed route cash fare is $2.00 per one‐way passenger trip. A discounted cash fare of $0.85 is available to eligible senior and disabled passengers. Express routes 200 and 201 cash fare is $2.50 per one‐way passenger trip, or $1.25 per one‐way senior and disabled passengers. In November 2015 Tri Delta Transit began to accept Clipper on all fixed routes. Clipper is the all‐in‐one transit card accepted on most Bay Area transit systems. The Clipper card can hold transit passes, cash value, parking value or any combination. Each fixed route bus has been equipped with a Clipper terminal making it much more convenient for passengers with the Clipper card. In June 2018 a mobile ticketing option was implemented. This gave our customers the ability to purchase and store any of our fare passes on an app in their mobile device. In June 2019 the $2.00 cash fare per one‐way passenger trip was implemented for the Tri MyRide service.

10 | P a g e
Figure 1.4 Fare Structure
Fares and Passes Price
Route 200, 201 and 300 Cash Fares
Single ride, no transfers (general public age 6 years to 64 years) $2.50
Single ride, no transfers (seniors 65+ and passengers with disabilities) $1.25
BART Transfer (general public age 6 years to 64 years) $1.75
BART Transfer (seniors 65+ and passengers with disabilities) $1.25
Local Route Cash Fares
Single ride, no transfers (general public age 6 years to 64 years) $2.00
Single ride, no transfers (seniors 65+ and passengers with disabilities) $0.85
Children 5 and under (with paying customer) $0.00
BART Transfer (general public age 6 years to 64 years) $1.25
BART Transfer (seniors 65+ and passengers with disabilities) $0.85
Day Passes and Special Passes
Unlimited rides on all Tri Delta Transit buses, except paratransit buses, the day of purchase/validation (general public age 6 years to 64 years)* *If Clipper Card is used, the day‐pass accumulator can be used on all East Bay buses (County Connection, Wheels, WestCat and Tri Delta Transit)
$3.75
Unlimited rides on all Tri Delta Transit buses, except paratransit buses, the day of purchase/validation (seniors 65+ and passengers with disabilities)
$1.75
Summer Youth Pass ‐ Unlimited rides June 1 ‐ August 31 for youth aged 18 and under $60.00
31‐Day Passes
31‐Day Pass ‐ Unlimited rides on Tri Delta Transit buses for 31 consecutive days. Time begins when pass is first validated
$57.00
20‐Ride Passes
General Public 20‐Ride Pass (age 6‐64) ‐ 20 single rides, no transfer on all Tri Delta Transit buses except paratransit buses
$33.00
Senior/Disabled 20‐Ride Pass (seniors 65+ and passengers with disabilities) ‐ 20 single rides, no transfer on all Tri Delta Transit buses except paratransit buses
$17.00
Paratransit (Dial‐a‐Ride) Fares and Passes
One‐way trip starting and ending in Tri Delta Transit's ADA service area $2.75
One‐way trip starting and/or ending outside Tri Delta Transit's ADA service area $5.50
Direct trips to Concord or Martinez* $5.50
Regional Trips (transfer to link) Mon‐Fri + all other applicable fees for other transit agencies $5.50
Regional Trips (transfer to link) Sat‐Sun + all other applicable fees for other transit agencies $7.00
10 one‐way ride tickets valued at $2.75 each $27.50
Tri MyRide (microtransit) Fares
One‐way trip starting or ending inside a single service area $2.00

11 | P a g e
Revenue Fleet ECCTA operates a total of 100 revenue vehicles. The fixed route fleet is comprised of 58 Gillig 40’ heavy‐duty low floor transit buses manufactured between 2009 and 2018, two BYD battery electric buses, and two Proterra battery electric buses. All Tri Delta Transit fixed route buses are equipped with wheelchair ramps and bicycle racks, each holding up to two bicycles. All fixed‐route vehicles have a 12‐year useful life. The paratransit fleet consists of 28 Ford cut‐away vans and 6 specialized med‐vans. Additionally, four retired paratransit vehicles are being used for a microtransit pilot program. Due to the success of the program the four vehicles will be replaced and the microtransit fleet will be expanded to 8 vehicles. All Tri Delta Transit paratransit vehicles are equipped with wheelchair lifts or ramps and have a useful life of 5 years. More details on this will be provided in chapter 5. The Figure below summarizes the current ECCTA fleet roster. A detailed roster of revenue fleet vehicles is provided later in Chapter 5. Figure 1.5 Summary of Revenue Vehicles
Year Make/Model Quantity
Fixed‐Route (MB)
2009 Gillig Low Floor ‐ 40' 8
2013 Gillig Low Floor ‐ 40' 25
2016 Gillig Low Floor ‐ 40' 20
2018 Gillig Low Floor ‐ 40' 5
2018 BYD K9 ‐ 40' 2
2018 Proterra Catalyst C2 ‐ 40' 2
Subtotal 62
Paratransit (DR)
2018 Ford E450 Cutaway ‐ 25' 28
2018 Dodge Grand Caravan 6
Subtotal 34
Microtransit (DR)
2011 Ford E450 Cutaway ‐ 20' 4
Grand Total 100

12 | P a g e
Facilities ECCTA opened a consolidated facility to house administrative, maintenance and contract operations functions in 1987. Located at 801 Wilbur Avenue in northeast Antioch, the facility includes a dispatch center, gilley (driver) room and locker area, a fully equipped maintenance shop, outdoor service lanes, a fenced vehicle storage area, and administrative offices housing both ECCTA and contractor personnel. This facility was expanded in February 2004 and additional bus parking was built on property adjacent to the facility in July 2004. Tri Delta Transit maintains a maximum of 62 standard passenger shelters and 194 benches located at the busiest of more than 600 bus stops throughout the service area. ECCTA currently does not own nor maintain off‐street passenger facilities. Tri Delta Transit buses use BART‐owned bus transfer centers at the Pittsburg/Bay Point BART station, near the Pittsburg City Center BART station, at the Antioch BART stations and an 80‐space Brentwood Park & Ride lot located on the east side of Walnut Boulevard opposite Dainty Avenue on the west side of downtown. All facilities include an off‐street bus stop equipped with standard passenger shelters and bench seating. In FY2021 Tri Delta Transit will be constructing a Park & Ride facility in the City of Oakley near the intersection of Highway 4/Main Street and East Cypress Road. This location will have 164 parking spaces, 6 bus bays, EV charging stations and bike lockers. The main hubs of Tri Delta Transit operations are the large multi‐space bus transfer facilities at the Pittsburg‐Bay Point BART and Antioch BART stations. Tri Delta Transit provides nearly 150 bus arrivals and departures daily at the Pittsburg‐Bay Point BART station. The Antioch BART Station provides nearly 250 bus arrivals and departures daily.

13 | P a g e
CHAPTER 2: GOALS, OBJECTIVES & STANDARDS
Process for Establishing, Reviewing and Updating Goals Realistic goals, practical objectives and service standards are key elements of an SRTP, serving as a foundation for development of service strategies and delivery of transit service. Transit serves the travel needs of persons without automobiles, helps control congestion, and addresses many other community goals such as equity, improving the environment, economic development, and improved land use. Objectives and policy statements supporting goals should be achievable and supported by realistic service standards providing measurable benchmarks of transit system performance. Measuring transit system performance has four elements:
Goals are broad statements of purpose that are grounded in the basic values and aims of the community as reflected by the ECCTA Board of Directors through an organizational mission statement. Goals are usually achieved over several years. Often goals are not quantifiable, but are needed to validate that the transit program is meeting the need for which it was originally intended.
Objectives are specific statements that describe the desired results of pursuing stated goals, and are the means by which goal attainment is measured. Objectives should be measurable over time, and subject to periodic adjustment in response to actual results.
Measures are the quantifiable criteria through which attainment of objectives is determined. Selected performance measures are usually calculated and monitored on a monthly basis.
Standards are thresholds that measure how an objective is being met. Standards are usually quantitative (e.g., 20 passengers per revenue hour) or sometimes qualitative (e.g., minimizing preventable accidents).
Re‐Evaluation of Goals
ECCTA has made effective use of performance indicators and standards, both in its internal evaluation
process and incorporating meaningful measures in its operating contracts. Accordingly, this chapter
emphasizes improving adopted performance measures, based on actual operational and financial
performance, as well as incorporating the perceptions and expectations of bus riders and the general
public. The measures showed below in Figure 2.2 show the most recently adopted measures. The most
notable changes in these measures from the last SRTP pertain to safe transit and system efficiency. The
standards for miles between preventable accidents and miles between road calls increased significantly.
As for system efficiency, the measure for paratransit productivity (passengers/revenue hour) increased.
ECCTA has also added a new group of objectives for Annual Safety Performance Targets.
Transit Sustainability Project
Even though ECCTA is not one of the seven largest transit agencies in the Bay Area and not subject to
the performance measures and targets set by the Transit Sustainability Project (TSP), the performance
measures outlined in the TSP have long been closely monitored as Key Performance Indicators for

14 | P a g e
ECCTA’s fixed route and paratransit services. A 5‐year retrospective of these performance measures is
provided in the next section.
Mission Statement and Goals ECCTA is guided by the mission statement adopted by the ECCTA Board of Directors. Figure 2.1 ECCTA Mission Statements
Number Statement
1. To provide safe, reliable, friendly, high quality and economical transportation service to the Eastern Contra Costa community;
2. To provide an organizational environment that encourages cooperation, rewards excellence and develops a team of highly motivated staff;
3. To empower employees to function as owners of the Eastern Contra Costa Transit Authority organization;
4. To develop Eastern Contra Costa Transit Authority services and facilities to better serve the transit dependent community and capture a greater share of the commute market;
5. To secure and manage funds to maintain and expand transit service and to operate Eastern Contra Costa Transit Authority according to fiscally sound business practices;
6. To take a leadership role in developing a coherent transportation policy to deal with problems of traffic congestion, air quality and growth management;
7. And to build constituencies at all levels of government that support the Eastern Contra Costa Transit Authority and its programs.
ECCTA’s goals that support the adopted Mission Statement are summarized below:
I. Provide safe, reliable and high quality public transportation to ECCTA service area residents.
II. Provide efficient public transportation to the residents of the ECCTA service area.
III. Provide an accessible public transportation system to the residents of the ECCTA service
area. Adopted objectives, performance indicators and standards are summarized in Figure 2.2. These measures serve as the framework of the evaluation of operational and financial performance included in Chapter 3.

15 | P a g e
Figure 2.2 Summary of ECCTA Objectives, Measures and Standards
Objective Measure Standard
I.A. Safe Transit
Miles between preventable accidents FR ‐ 150,000mi , Para ‐ 100,000mi
CHP Safety Compliance Report Satisfactory rating annually
RVM* between road calls FR ‐ 50,000mi , DAR ‐ 100,000mi
Preventative Main. Inspections (PMI) PMIs within 400 miles of scheduled
Contractor accident & loss reporting Next day verbal report by 9:00 a.m.
Written report within 5 working days
I.B. Reliable Transit
Fixed route schedule adherence–late 95.01%+ within 5 minutes of schedule
Fixed route schedule adherence‐early .74% or less of trips ahead of schedule
Fixed route‐missed trips Less than .74% of scheduled trips
Paratransit – pick‐up time deviations 95.01% of pickups within 15 minutes of the time promised to riders
Paratransit – early No pickups more than 30 minutes ahead of the time promised to riders
Paratransit – denials Zero ADA trip denials
Zero Regional ADA trip denials
1.C. High‐Quality Transit
Clean Buses
Every bus interior cleaned every day
Every other day ‐ bus exterior washed
Monthly ‐ every bus detailed
Uniformed Operators 100% compliance contract dress code
Road Supervisors At least one road supervisor to be on duty at all times
Air‐Conditioned Buses 100% of revenue vehicles in service with functioning air conditioning when temperature is above 80 degrees
Customer Complaints <0.3% of passengers complain
Calls presented ‐ avg time to answer All three types must meet the standard of less than 90 seconds
Abandoned Calls ‐ avg time to abandoned
Answered Calls ‐ avg time to answer
II. Efficient System
Productivity (passengers per RVH**)
Fixed Route‐average 20 pass/RVH
At least 10 pass/RVH on any route
Paratramsot‐average 3.0 pass/RVH
Farebox Cost Recovery (Percent) Fixed Route‐minimum 20% system wide
Dial‐A‐Ride‐minimum 10% system wide
III.A. Accessible System ‐
Disabilities Wheelchair Lift Reliability 100% of lifts functional at all times
III.B. Accessible System ‐Transit Dependents
Bus Benches & Shelters One amenity for every directional route mile
III.C. Accessible System ‐Choice Riders & Commuters
BART Schedule Coordination
Less than 15 minute wait for BART connections during peak period travel direction for routes serving one BART station
Coordinate schedule on key routes to key BART stations ‐ arrive/depart 10 min. before/after BART
Annual Safety
Performance Targets
Fatalities 0
Injuries 20
Safety Events 32
System Reliability (miles between road calls)
FR 50,000 Para 100,000
* Revenue vehicle miles ** Revenue vehicle hours

16 | P a g e
CHAPTER 3: SYSTEM AND SERVICE EVALUATION
This chapter summarizes recent Tri Delta Transit operating and financial trends and evaluates these results in terms of system strengths and weaknesses, opportunities and constraints in reference to Tri Delta Transit’s key objectives and the primary transit markets that the system serves.
Demographic Evaluation Tri Delta Transit’s 225‐square mile service area has an estimated population of 315,000 people. According to Plan Bay Area 2040, a regional transportation planning study made by the Metropolitan Transportation Commission, the population of the area is expected to grow at an average of 1% per year. Figure 3.1 shows a 5‐year retrospective of estimated population by city as well as projections for year 2020 and 2025. The cities of Antioch and Pittsburg currently have the highest population and make up nearly 50% the entire east county population. Brentwood is third based on population and, along with Oakley, have been the fastest growing cities in the Tri Delta Transit service area. The current demographics for each city in terms of race/ethnicity are shown in Figure 3.4. Figure 3.1 Population Estimates and Projections by City
Population Trends
Estimates Projections
2013 2014 2015 2016 2017 2018 2020 2025
Antioch 107,384 109,119 110,326 111,074 111,419 111,535 114,107 118,527
Pittsburg 66,668 68,003 69,273 70,797 71,963 72,437 76,139 82,733
Brentwood 54,943 56,894 58,825 60,599 62,271 63,800 69,787 81,040
Oakley 38,164 39,148 39,727 40,680 41,611 42,129 44,705 49,353
Bay Point 23,325 23,558 23,794 24,032 24,272 24,515 25,258 26,546
Totals 290,484 296,722 301,945 307,182 311,536 314,416 329,996 358,199
Figure 3.2 Population Densities by City
Population (2018) Area (sq. miles) Density/ sq. mile
Antioch 111,535 29.08 3835.45
Pittsburg 72,437 19.15 3782.61
Brentwood 63,800 14.81 4307.90
Oakley 42,129 16.15 2608.61
Bay Point 24,515 6.99 3507.12

17| P
age
Figure 3.3 Map of Service Area – Population

18 | P a g e
18| P
age
Figure 3.4 Race/Ethnicity by City
Demographics by Race/Ethinicity
White African American
American Indian/ Alaska Native Asian
Hawaiian/ Pacific Islander
Hispanic/ Latino
Antioch 35.60% 17.30% 0.90% 10.50% 0.80% 31.70%
Pittsburg 20.00% 17.70% 0.80% 15.60% 1% 42.40%
Brentwood 54.30% 6.60% 0.60% 7.90% 0.40% 26.80%
Oakley 47.50% 7.30% 0.90% 6.30% 0.40% 34.90%
Bay Point 20.50% 11.60% 1.10% 9.90% 0.70% 54.90%
Discovery Bay 72.30% 4.10% 0.60% 3.90% 0.40% 15.50%
Average 41.70% 10.77% 0.82% 9.02% 0.62% 34.37%
According to the 2014 American Community Survey, more than 90% of households in the Tri Delta Transit service area have access to a motor vehicle, and only about 9% percent of commuters used transit. Attracting choice transit users in a dispersed, suburban and partially rural low‐density environment such as East Contra Costa County is a very difficult task. Public transit generally is most successful where trip destinations and travel patterns are concentrated, and transit can offer frequent services and travel times competitive with driving. Even with the Bay Area’s severe congestion problem, it is very difficult both operationally and economically to provide a transit alternative that meets these criteria, particularly in widely dispersed communities such as East Contra Costa County. As a result, Tri Delta Transit’s primary existing patronage is comprised of “transit dependent” persons. That is, the system primarily serves those who don’t own motor vehicles or live in a household with a vehicle, but lack reliable regular access. These markets include seniors, persons with disabilities, youth, and low‐income persons. Figure 3.5 Household Income Levels by City
Subject Antioch
Households Pittsburg
Households Brentwood Households
Oakley Households
Bay Point Households
Discovery Bay Households
Total 32,900 19,629 17,138 11,136 6,431 4,976
Less than $10,000 4.80% 6.40% 2.50% 3.10% 8.30% 3.30%
$10,000 to $14,999 4.50% 5.00% 2.50% 3.90% 7.80% 0.80%
$15,000 to $24,999 8.50% 10.50% 4.50% 8.10% 11.20% 2.50%
$25,000 to $34,999 8.60% 7.60% 6.30% 5.20% 15.10% 5.30%
$35,000 to $49,999 12.30% 11.40% 12.50% 9.60% 16.40% 6.20%
$50,000 to $74,999 17.90% 20.40% 14.30% 17.90% 16% 15.10%
$75,000 to $99,999 13.80% 12.90% 11.50% 15.70% 10.60% 10.20%
$100,000 to $149,999 18.00% 16.20% 24.30% 22.70% 9.50% 25.80%
$150,000 to $199,999 6.70% 5.90% 14.30% 10.10% 4.20% 20.40%
$200,000 or more 4.90% 3.70% 7.20% 3.90% 0.90% 10.40%
Median income (dollars) $65,770 $60,376 $88,697 $78,597 $41,749 $112,063
Mean income (dollars) $79,307 $74,516 $103,413 $90,410 $55,886 $123,604

19| P
age
Figure 3.6 Map of Service Area – Ethnicity

20| P
age
Figure 3.7 Map of Service Area – Poverty (200%)

21| P a g e
Fixed Route Trends Figure 3.9 and Figure 3.10 summarize the overall Tri Delta Transit fixed route ridership trends from Fiscal Year 2017 through Fiscal Year 2019. While the level of service provided by Tri Delta Transit has remained relatively constant, fixed route ridership has slowly decreased year over year. There are several factors that can be attributed to the decreases in ridership. 1. Economy. The peak of the most recent recession coincides with some of Tri Delta Transit’s highest levels of ridership in FY08 and FY09. Unemployment reached a rate of 10% which left public transportation the only viably affordable mode of transportation for many. As the economy begins to slowly improve, the costs of maintaining a personal vehicle becomes more manageable, leading to a decrease in ridership. 2. Fuel prices. Ridership trends have fluctuated as the average price of fuel changes. When the price of gasoline soared above $4.00/gal Tri Delta Transit experienced our highest levels in ridership. During FY09 and FY13 the average price of gasoline was above $4.50/gal and the increase was reflected in some of Tri Delta Transit’s highest levels of ridership in recent years. As prices began to slowly drop below $3.00/gal, so did ridership. Figure 3.8 shows the trend of gas prices in California over the past 10 years. 3. Assembly Bill 60 (AB60). Under AB 60, the California Department of Motor Vehicles can issue an original driver license to an applicant who lacks proof of legal presence in the United States and meets all other requirements to obtain a driver license, including proof of identity and California residency. Implemented on January 2, 2015, the California DMV reported that over 600,000 driver licenses were issued to undocumented immigrants in the first year. With an estimated undocumented immigrant population of 77,500 in the Contra Costa County, many of our existing riders made the transition to commuting by a personal vehicle. Figure 3.8 Average Fuel Prices in California

22| P a g e
Figure 3.9 Comparative Annual FR Ridership by Route
Comparative Annual FR Ridership by Route
ROUTE FY15 FY16 FY17 FY18 FY19
200 54,167 48,866 44,467 40,568 36,024
201 112,116 116,301 117,839 115,491 94,352
300 353,802 340,127 351,131 323,694 72,088
379 3,223 3,659 2,407 2,358 2,578
380 666,704 606,012 552,671 510,333 453,770
381 51,256 99,469
383 30,200 25,830 21,936 21,987 37,225
384 3,366 42,917
385 68,013 66,045 54,207 55,316 47,845
386 1,583 1,507 1,398 1,104
387 257,944 233,185 198,990 180,733 172,060
388 370,128 327,585 287,820 265,449 237,268
389 51,480 45,836 40,557 41,396 41,820
390 71,211 70,022 71,431 70,019 35,220
391 402,579 360,256 317,873 286,436 224,909
709 4,583
Shuttle 5,375 13,410 2,956 2,027 4,841
Weekday Total 2,448,525 2,258,641 2,065,683 1,971,533 1,606,969
392 (Sat) 71,889 62,557 55,638 51,620 47,455
393 (Sat) 71,586 62,260 55,822 48,802 17,651
394 (Sat) 33,141 26,411 23,808 23,911 25,196
395 (Sat) 5281 4,906 3,174 3,005 3,698
396 (Sat) 2,126 17,812
Saturday Total 181,897 156,134 138,442 129,464 111,812
392 (Sun/Hol) 70,761 62,151 55,049 53,530 42,774
393 (Sun/Hol) 69,695 64,393 58,200 49,368 17,940
394 (Sun/Hol) 29,946 27,483 24,581 23,815 24,851
395 (Sun/Hol) 5204 6,062 3,030 2,932 3,144
396 (Sun/Hol) 1,827 17,846
Sun/Hol Total 175,606 160,089 140,860 131,472 106,555
TOTALS 2,806,028 2,574,864 2,344,985 2,232,469 1,825,336

23| P a g e
Figure 3.10 Graph of Comparative Annual Fixed Route Ridership by Route
0
500,000
1,000,000
1,500,000
2,000,000
2,500,000
3,000,000
FY15 FY16 FY17 FY18 FY19
396 (Sun/Hol)
395 (Sun/Hol)
394 (Sun/Hol)
393 (Sun/Hol)
392 (Sun/Hol)
396 (Sat)
395 (Sat)
394 (Sat)
393 (Sat)
392 (Sat)
Shuttle
709
391
390
389
388
387
386
385
384
383
381
380
379
300

24| P a g e
Figure 3.11 Fixed Route Key Performance Indicators (KPI)
FIXED ROUTE KPI
Actuals Budget
16/17 17/18 18/19 19/20
PASSENGERS
Total FR Trips Provided 2,344,985 2,232,469 1,825,574 1,638,490
Average Weekday Ridership 8,230 7,886 6,455 5,771
Average Sat Ridership 2,715 2,490 2,150 1,901
Average Sun/Hol Ridership 2,236 2,087 1,665 1,471
Average Passengers/Hour 16.1 14.7 12.0 10.3
CUSTOMER SERVICE Customer Complaints 0.025% 0.025% 0.035% 0.035%
On Time Performance 82% 83% 82% 84%
MAINTENANCE Gallons of Fuel Consumed 584,879 575,568 539,672 551,739
Miles Between Preventable Accidents 117,465 145,522 84,366 100,000
Miles Between Road calls 21,084 19,951 35,980 50,000
COST RATIOS Farebox Recovery Ratio 16% 13% 9% 9%
$/Gal Fuel $2.07 $2.30 $2.90 $2.92
Operating Cost/Passenger $6.93 $7.56 $9.80 $11.21
Operating Cost/Revenue Hour $111.83 $111.07 $117.91 $114.88
Operating Cost/Revenue Mile $7.98 $8.19 $9.24 $9.00
25| P a g e
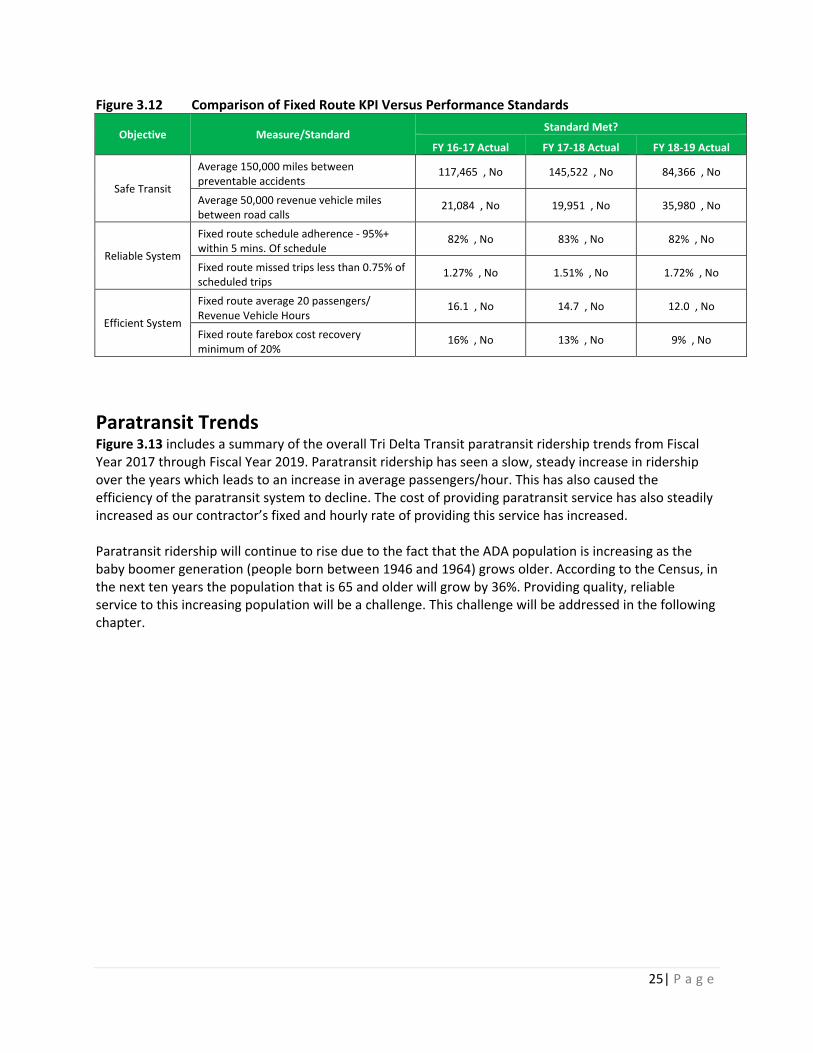
Figure 3.12 Comparison of Fixed Route KPI Versus Performance Standards
Objective Measure/Standard Standard Met?
FY 16‐17 Actual FY 17‐18 Actual FY 18‐19 Actual
Safe Transit
Average 150,000 miles between preventable accidents
117,465 , No 145,522 , No 84,366 , No
Average 50,000 revenue vehicle miles between road calls
21,084 , No 19,951 , No 35,980 , No
Reliable System
Fixed route schedule adherence ‐ 95%+ within 5 mins. Of schedule
82% , No 83% , No 82% , No
Fixed route missed trips less than 0.75% of scheduled trips
1.27% , No 1.51% , No 1.72% , No
Efficient System
Fixed route average 20 passengers/ Revenue Vehicle Hours
16.1 , No 14.7 , No 12.0 , No
Fixed route farebox cost recovery minimum of 20%
16% , No 13% , No 9% , No
Paratransit Trends Figure 3.13 includes a summary of the overall Tri Delta Transit paratransit ridership trends from Fiscal Year 2017 through Fiscal Year 2019. Paratransit ridership has seen a slow, steady increase in ridership over the years which leads to an increase in average passengers/hour. This has also caused the efficiency of the paratransit system to decline. The cost of providing paratransit service has also steadily increased as our contractor’s fixed and hourly rate of providing this service has increased. Paratransit ridership will continue to rise due to the fact that the ADA population is increasing as the baby boomer generation (people born between 1946 and 1964) grows older. According to the Census, in the next ten years the population that is 65 and older will grow by 36%. Providing quality, reliable service to this increasing population will be a challenge. This challenge will be addressed in the following chapter.

26| P a g e
Figure 3.13 Paratransit Key Performance Indicators (KPI)
Paratransit KPI
Actual Budget
16/17 17/18 18/19 19/20
PASSENGERS Total DR Trips Provided 133,406 125,558 160,584 158,115
Average Weekday Ridership 498 469 450 568
Average Sat Ridership 107 105 98 179
Average Sun/Hol Ridership 47 47 47 101
Average Passengers/Hour (Weekdays) 2.9 2.9 3.1 3.0
CUSTOMER SERVICE Customer Complaints 0.382% 0.486% 0.426% 0.496%
On Time Performance 81% 66% 63% 70%
MAINTENANCE Gallons of Fuel Consumed 131,936 122,057 109,838 107,424
Miles Between Preventable Accidents 153,397 207,048 394,189 200,000
Miles Between Road calls 919,507 276,017 788,773 100,000
COST RATIOS Farebox Recovery Ratio 11% 10% 10% 10%
$/Gal Fuel $2.57 $3.21 $3.27 $3.44
Operating Cost/Passenger $29.15 $29.68 $23.43 $34.69
Operating Cost/Revenue Hour $73.97 $80.33 $69.74 $99.82
Operating Cost/Revenue Mile $5.18 $5.38 $4.05 $5.95

27| P a g e
Figure 3.14 Comparison of Paratransit KPI Versus Performance Standards
Objective Measure/Standard Standard Met?
FY 16‐17 Actual FY 17‐18 Actual FY 18‐19 Actual
Safe Transit
Average 100,000 miles between preventable accidents
153,397 , Yes 207,048 , Yes 394,189 , Yes
Average 100,000 revenue vehicle miles between road calls
919,507 , Yes 276,017 , Yes 788,773 , Yes
Reliable System
95% of pickups within 15 minutes of the time promised to riders
81% , No 66% , No 63% , No
No denials of trips for ADA passengers 0, Yes 0, Yes 0, Yes
Efficient System
Dial‐a‐Ride average 3.0 passengers/ Revenue Vehicle Hours (weekdays)
2.9 , No 2.9 , No 3.1 , Yes
Dial‐a‐Ride farebox cost recovery minimum of 10%
11% , Yes 10% , Yes 10% , Yes
Paratransit Compliance with ADA Regulations The Americans with Disabilities Act (ADA) of 1990 requires transit agencies that provide fixed route service to operate a complementary demand responsive service to potential transit users who are unable to use fixed route transit due to a disability. This service must be equivalent to the fixed‐route service as much as possible. ADA regulations define the minimum level of service required only apply to demand responsive services when delivered to ADA‐eligible persons, and have no effect on demand‐responsive services when also provided to non‐ADA eligible patrons. Many paratransit systems including Tri Delta Transit provide a level of service exceeding minimum ADA requirements. However, in cases where agencies provide service exceeding these requirements, it is important to closely review compliance with ADA regulations in order to avoid liability under those rules. In most cases, close adherence to ADA requirements can often reduce operating expenses and more effectively manage paratransit demand. Tri Delta Transit met applicable ADA requirements, and exceeded them in a number of cases including:
1. a service area exceeding the ¾ mile radius from fixed routes in a number of areas; 2. providing service to non‐ADA clients; 3. accommodating same day bookings; 4. providing “door to door” service rather than just “curb to curb”, e.g., drivers are allowed to
assist passengers to/from the door of their origins and destinations, and to assist with a limited number of packages.
FTA Triennial Review Chapter 53 of Title 49, United States Code, requires the Federal Transit Administration (FTA) to review and evaluate how FTA grant recipients have used Urbanized Area Formula Grants (FTA Section 5307 funds) and complied with relevant statutory and administrative requirements at least every three years. This requirement is enumerated in 49 U.S.C. 5307(i), as follows:

28| P a g e
(2) At least every three years, the Secretary [of Transportation] shall review and evaluate completely the performance of a recipient in carrying out the recipient’s program, specifically referring to compliance with statutory and administrative requirements and the extent to which actual program activities are consistent with the activities proposed under subsection (d) of this section and the planning process required under section 5303‐5306 of this title.
(3) The Secretary may take appropriate action consistent with the review, audit and evaluation under this subsection, including making an appropriate adjustment in the amount of a grant or withdrawing the grant.
The Triennial Review analyzes and evaluates grantee performance and compliance in 17 distinct areas, which are not listed here for brevity. The latest review of the Tri Delta Transit system, conducted in February 2018, included the following findings, which mainly consist of updating documentation and procedures. Tri Delta Transit staff took corrective action to comply with deficiencies in the following areas:
Financial Management and Capacity F1‐1 Missing, insufficient, or out of date financial operating procedures
F2‐1 No segregation of financial duties and functions; inadequate internal checks and balances
Technical – Award Management TC‐AM1‐1 Missing FFRs/MPRs TC‐AM5‐1 Inactive award/untimely closeouts
Satisfactory Continuing Control SSC1‐1 Lacking plans for idle facilities SCC3‐1 Lacking excess real property utilization inventory/plan out‐of‐date SCC7‐3 Inadequate equipment records SCC7‐4 Inventory results not reconciled to equipment records

29| P a g e
CHAPTER 4: OPERATIONS PLAN AND BUDGET
Operations Plan Fixed Route (MB) Operations Plan FY18 route 386 was eliminated due to a lack of ridership. This route served the unincorporated area of Discovery Bay. This route will be replaced with a route that will operate between the Brentwood Park & Ride and the new Los Medanos College campus in Brentwood that is scheduled to open its doors in FY21. This will not have a significant impact on service levels. The level of service provided by our fixed route system has remained relatively unchanged for the past 3 years. It is anticipated that service levels will increase with a route re‐design that will coincide with the opening of the new Oakley Park and Ride in FY21. The most significant increase will be the increase in peak frequency of our express route 300 that will serve the new Oakley Park and Ride. There are plans in place for an inter‐modal facility in Brentwood that will be served by Tri Delta Transit and BART but it is in the beginning stages and will likely not be completed during the period of this SRTP. When this inter‐modal facility is completed, there will be a system re‐design that will coincide with its opening. It is anticipated that service levels will increase to serve it. Figure 4.1 Projections of Motor Bus Service Levels
Fiscal Year Motor Bus
Revenue Vehicle Hours Motor Bus
Revenue Vehicle Miles
2019‐20 162,000 2,071,000
2020‐21 222,000 2,690,000
2021‐22 222,000 2,690,000
2022‐23 222,000 2,690,000
2023‐24 222,000 2,690,000
2024‐25 222,000 2,690,000
2025‐26 222,000 2,690,000
2026‐27 222,000 2,690,000
2027‐28 222,000 2,690,000
2028‐29 222,000 2,690,000

30| P a g e
Paratransit (DR) Operations Plan With the growing population of the baby boomer generation, Tri Delta Transit’s current paratransit operations could be at risk of becoming over‐burdened and inefficient. A policy change may be necessary to address the possible influx of new ADA and non‐ADA paratransit users. With paratransit ridership remaining high, providing these services has become costlier than ever and trip times are increasing. In an attempt to remedy this problem, ECCTA implemented a service called Mobility on Demand that incorporates the use of Transportation Network Companies (TNC) to provide passengers with a flexible, on‐demand option. ECCTA has partnered with Uber, Lyft, and a local taxi company to offer discounted rides to paratransit users. This service allows customers to schedule same‐day rides. This is a curb‐to‐curb ride unlike our regular paratransit service which is door‐to‐door. To be funded in part by Federal 5310 funds, this project has boosted the productivity of our regular paratransit service by easing some of the stress of high demand. Overall ridership has greatly increased while operating costs have decreased. Figure 4.2 Projections of Demand Response Service Levels
Fiscal Year Demand Response
Revenue Vehicle Hours Demand Response
Revenue Vehicle Miles
2019‐20 44,000 603,000
2020‐21 70,000 868,000
2021‐22 70,700 876,680
2022‐23 71,407 885,447
2023‐24 72,121 894,301
2024‐25 72,842 903,244
2025‐26 73,571 912,277
2026‐27 74,306 921,399
2027‐28 75,049 930,613
2028‐29 75,800 939,920

31| P a g e
Demand Response – Microtransit Operations Plan After a successful pilot, ECCTA will be implementing permanent operations of its microtransit project called Tri MyRide. The program began with four vehicles and two service zones, one in Antioch and one in Pittsburg, which are in close proximity to BART stations. With Tri MyRide, public users are able to request an on‐demand trip from anywhere in the designated zone to its corresponding BART station or nearby shopping centers and vice versa. Demand for this service rose much faster than anticipated and we are considering expanding the service to other areas. The Tri MyRide fleet will be increased from four to eight vehicles in FY21. This will coincide with the system re‐design in which the identification of new Tri MyRide service zones will be explored. Tri MyRide will account for most of the increases in Demand Response service levels.
Operations Budget Motor Bus and Demand Response Operations Budget With the upcoming system re‐design and increasingly large number of potential ADA‐eligible users, it is our plan to operate both fixed route and paratransit operations under similar service parameters with no major additional expenses after the increase in FY21. The main change that will occur over time is the increased cost of purchased transportation in the operations contract with First Transit. The options on the operations contract with First Transit have been exercised and, at the start of FY21, there will be a significant increase (13%) in the variable costs in the contract. There will be about a 5% increase each year going forward. Purchased transportation is the largest component of Tri Delta Transit’s operating budget. Revenue from operations only accounts for a small percentage of the total operating budget. Fixed‐route and paratransit operations each have a farebox recovery ratio of about 10%. A majority of operating funds come from state and local sources. A small amount of federal funding for operating such as ADA set‐aside is received but the majority of federal funds received are for capital replacements of revenue vehicles. State funds include Transportation Development Act (TDA) and State Transit Assistance (STA) funding. TDA established a quarter‐cent sales tax for transit operations and accounts for a majority of Tri Delta Transit’s operating fund. STA funds are generated by the sales tax on diesel fuel, and are split into two components: population‐based and revenue‐based. STA accounts for the second largest source of our operating funds. Since TDA and STA are sales tax‐based, the amount of money available for transit agencies varies from year to year based on the ups and downs. Local funds come from Contra Costa’s Measure J and Bay Area’s Regional Measure 2 (RM2). Measure J is a half‐cent local transportation sales tax that helps fund transportation services for the elderly and persons with disabilities. This program directly funds our paratransit operations and is set to expire in 2029 which covers the entire period of this SRTP. RM2 funding comes from a $1 increase in bridge tolls from the seven state‐owned bridges in the Bay Area. ECCTA uses RM2 funds to operate the express route 300. Aside from the funding mentioned above, ECCTA is always looking for new sources of funds for its operations. The Low Carbon Transit Operations Program (LCTOP) has provided some operating funds for

32| P a g e
specific routes in which we are able to reduce greenhouse gas emissions by deploying our zero‐emission buses. LCTOP funds can also be used for capital projects so it may be used for capital purposes rather than operating depending on the needs for each fiscal year. Another possible source of funds is Federal 5310 funds. This is FTA's Enhanced Mobility of Seniors & People with Disabilities program. This could be a possible funding source for our expanded paratransit program, Mobility on Demand. Figures 4.3 and 4.5 below show a 3‐year retrospective of operating revenues and expenses for Motor Bus and Demand Response operations, respectively. We expect a steady 4% increase each year in the total budget each year after the service increases in FY21. The annual budget for each year in the SRTP period can be seen in Figures 4.4 and 4.6.

33| P a g e
Figure 4.3 Three‐Year Retrospective of Motor Bus Revenues and Expenses
Fixed Route Revenues and Expenses
FY 2016‐17 FY 2017‐18 FY 2018‐19
OPERATING REVENUES
Passenger Fares $ 2,612,164 $ 2,270,198 $ 1,676,283
Other Income $ 119,738 $ 156,393 $ 150,212
Total Operating Revenues $ 2,731,902 $ 2,426,591 $ 1,826,495
NON‐OPERATING REVENUE
Federal Funds $ 126,353 $ 408,649 $ 347,105
State Funds $ 9,874,244 $ 10,764,557 $ 11,936,520
Local Funds $ 995,049 $ 644,321 $ 1,039,642
Inter‐Operator Agreements $ 2,528,512 $ 2,624,596 $ 2,685,749
Interest & Other Misc Income $ 4,327 $ 7,555 $ 61,364
Total Non‐operating Revenues $ 13,528,485 $ 14,449,678 $ 16,070,380
Total Revenues $ 16,260,387 $ 16,876,269 $ 17,896,875
OPERATING EXPENSES
Purchased Transportation $ 8,879,342 $ 9,376,671 $ 9,769,492
Materials and Supplies $ 2,172,810 $ 2,294,579 $ 2,512,050
Salaries & Benefits $ 3,414,130 $ 3,409,089 $ 3,906,069
Services $ 615,673 $ 695,053 $ 590,676
Other $ 407,388 $ 372,039 $ 417,627
Casualty and Liability Insurance $ 487,630 $ 554,842 $ 521,710
Utilities $ 266,341 $ 156,636 $ 162,252
Taxes $ 17,073 $ 17,360 $ 16,999
Total Operating Expenses $ 16,260,387 $ 16,876,269 $ 17,896,875

34| P
age
Figure 4.4 Motor Bus Estimated Budget for SRTP Period
FY 2019‐20 FY 2020‐21 FY 2021‐22 FY 2022‐23 FY 2023‐24 FY 2024‐25 FY 2025‐26 FY 2026‐27 FY 2027‐28 FY 2028‐29
OPERATING REVENUES
Passenger Fares 1,635,953$ 1,636,794$ 1,702,266$ 1,770,357$ 1,841,171$ 1,914,818$ 1,991,411$ 2,071,067$ 2,153,910$ 2,240,066$
Other Income 85,000$ 57,872$ 60,187$ 62,595$ 65,099$ 67,702$ 70,411$ 73,227$ 76,156$ 79,202$
Total Operating Revenues 1,720,953$ 1,694,667$ 1,762,453$ 1,832,951$ 1,906,270$ 1,982,520$ 2,061,821$ 2,144,294$ 2,230,066$ 2,319,268$
NON‐OPERATING REV
Federa l Funds ‐$ ‐$ ‐$ ‐$ ‐$ ‐$ ‐$ ‐$ ‐$ ‐$
State Funds 13,264,443$ 16,229,804$ 16,789,632$ 17,372,490$ 17,979,603$ 18,612,282$ 19,271,930$ 19,960,051$ 20,678,253$ 21,428,264$
Loca l Funds 563,014$ 675,617$ 702,641$ 730,747$ 759,977$ 790,376$ 821,991$ 854,871$ 889,066$ 924,628$
Inter‐Operator Agreements 2,802,048$ 3,362,458$ 3,496,956$ 3,636,834$ 3,782,308$ 3,933,600$ 4,090,944$ 4,254,582$ 4,424,765$ 4,601,755$
Interes t & Other Misc Income 4,002$ 4,802$ 4,994$ 5,194$ 5,402$ 5,618$ 5,843$ 6,077$ 6,320$ 6,572$
Tota l Non‐operating Revenues 16,633,507$ 20,272,680$ 20,994,224$ 21,745,266$ 22,527,289$ 23,341,876$ 24,190,708$ 25,075,580$ 25,998,403$ 26,961,220$
Total Revenues 18,354,460$ 21,967,347$ 22,756,677$ 23,578,217$ 24,433,559$ 25,324,396$ 26,252,529$ 27,219,874$ 28,228,469$ 29,280,489$
OPERATING EXPENSES
Purchased Transportation 10,232,343$ 12,269,127$ 12,637,201$ 13,016,317$ 13,406,806$ 13,809,011$ 14,223,281$ 14,649,979$ 15,089,479$ 15,542,163$
Materia ls and Suppl ies 2,323,242$ 3,238,291$ 3,335,440$ 3,435,503$ 3,538,568$ 3,644,725$ 3,754,067$ 3,866,689$ 3,982,689$ 4,102,170$
Sa laries & Benefi ts 3,863,440$ 4,502,490$ 4,727,614$ 4,963,995$ 5,212,195$ 5,472,804$ 5,746,445$ 6,033,767$ 6,335,455$ 6,652,228$
Services 721,311$ 882,438$ 908,911$ 936,179$ 964,264$ 993,192$ 1,022,988$ 1,053,677$ 1,085,288$ 1,117,846$
Other 434,136$ 332,374$ 342,345$ 352,615$ 363,194$ 374,089$ 385,312$ 396,872$ 408,778$ 421,041$
Casualty and Liabi l i ty Insurance 601,823$ 575,151$ 632,666$ 695,932$ 765,525$ 842,078$ 926,286$ 1,018,914$ 1,120,806$ 1,232,886$
Uti l i ties 160,784$ 148,384$ 152,835$ 157,420$ 162,143$ 167,007$ 172,017$ 177,178$ 182,493$ 187,968$
Taxes 17,382$ 19,093$ 19,666$ 20,256$ 20,863$ 21,489$ 22,134$ 22,798$ 23,482$ 24,186$
Total Operating Expenses 18,354,460$ 21,967,347$ 22,756,677$ 23,578,217$ 24,433,558$ 25,324,396$ 26,252,529$ 27,219,874$ 28,228,469$ 29,280,489$
Motor Bus (MB) Operating Budget

35| P a g e
Figure 4.5 Three‐Year Retrospective of Demand Response Revenues and Expenses
Demand Response Revenues and Expenses
FY 2016‐17 FY 2017‐18 FY 2018‐19
OPERATING REVENUES
Passenger Fares $ 411,051 $ 390,382 $ 386,855
Other Income $ 148,245 $ 133,199 $ 109,529
Total Operating Revenues $ 559,296 $ 523,581 $ 496,384
NON‐OPERATING REVENUE
Federal Funds $ 532,570 $ 541,024 $ ‐
State Funds $ 1,971,714 $ 1,345,872 $ 2,318,921
Local Funds $ 820,065 $ 1,315,869 $ 924,297
Inter‐Operator Agreements $ ‐ $ ‐ $ ‐
Interest & Other Misc Income $ 5,097 $ 286 $ 23,089
Total Non‐operating Revenues $ 3,329,446 $ 3,203,051 $ 3,266,307
Total Revenues $ 3,888,742 $ 3,726,632 $ 3,762,691
OPERATING EXPENSES
Purchased Transportation $ 2,616,909 $ 2,411,083 $ 2,810,235
Materials and Supplies $ 520,543 $ 521,858 $ 435,834
Salaries & Benefits $ 490,117 $ 563,941 $ 313,982
Services $ 183,221 $ 155,934 $ 116,249
Other $ 22,945 $ 21,062 $ 29,253
Casualty and Liability Insurance $ 35,020 $ 39,240 $ 44,604
Utilities $ 15,525 $ 9,623 $ 9,242
Taxes $ 4,462 $ 3,891 $ 3,292
Total Operating Expenses $ 3,888,742 $ 3,726,632 $ 3,762,691
36| P
age
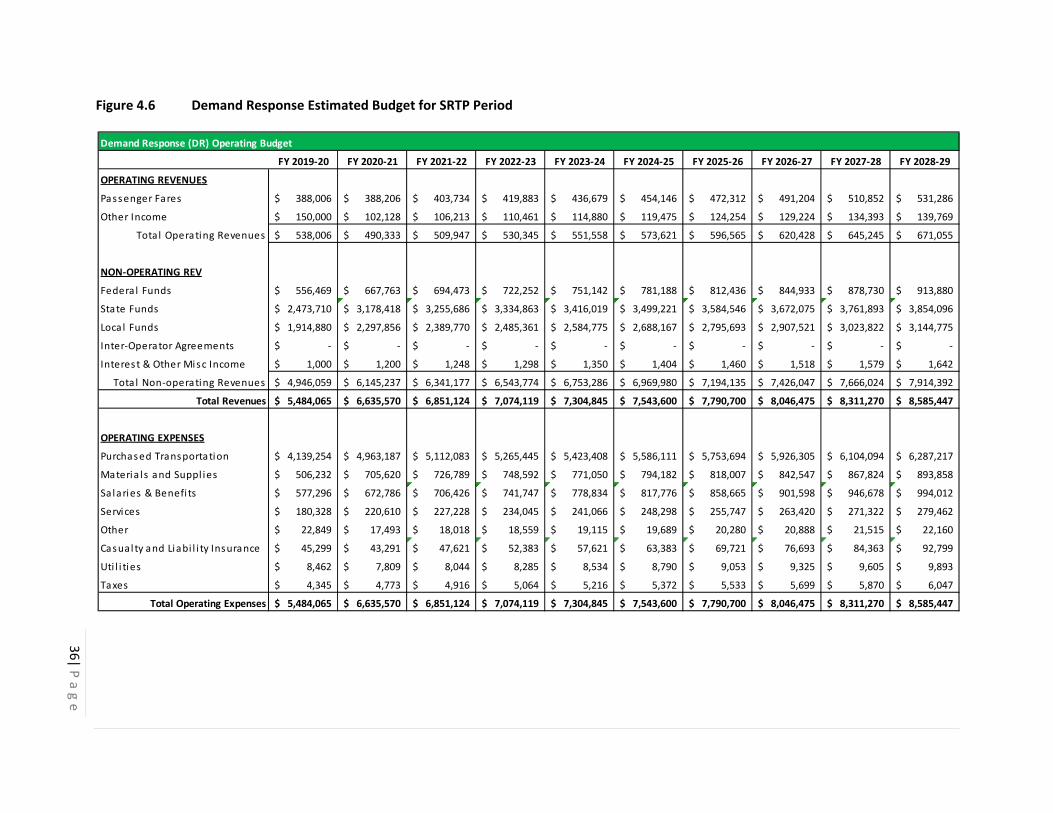
Figure 4.6 Demand Response Estimated Budget for SRTP Period
FY 2019‐20 FY 2020‐21 FY 2021‐22 FY 2022‐23 FY 2023‐24 FY 2024‐25 FY 2025‐26 FY 2026‐27 FY 2027‐28 FY 2028‐29
OPERATING REVENUES
Passenger Fares 388,006$ 388,206$ 403,734$ 419,883$ 436,679$ 454,146$ 472,312$ 491,204$ 510,852$ 531,286$
Other Income 150,000$ 102,128$ 106,213$ 110,461$ 114,880$ 119,475$ 124,254$ 129,224$ 134,393$ 139,769$
Total Operating Revenues 538,006$ 490,333$ 509,947$ 530,345$ 551,558$ 573,621$ 596,565$ 620,428$ 645,245$ 671,055$
NON‐OPERATING REV
Federa l Funds 556,469$ 667,763$ 694,473$ 722,252$ 751,142$ 781,188$ 812,436$ 844,933$ 878,730$ 913,880$
State Funds 2,473,710$ 3,178,418$ 3,255,686$ 3,334,863$ 3,416,019$ 3,499,221$ 3,584,546$ 3,672,075$ 3,761,893$ 3,854,096$
Loca l Funds 1,914,880$ 2,297,856$ 2,389,770$ 2,485,361$ 2,584,775$ 2,688,167$ 2,795,693$ 2,907,521$ 3,023,822$ 3,144,775$
Inter‐Operator Agreements ‐$ ‐$ ‐$ ‐$ ‐$ ‐$ ‐$ ‐$ ‐$ ‐$
Interes t & Other Misc Income 1,000$ 1,200$ 1,248$ 1,298$ 1,350$ 1,404$ 1,460$ 1,518$ 1,579$ 1,642$
Tota l Non‐operating Revenues 4,946,059$ 6,145,237$ 6,341,177$ 6,543,774$ 6,753,286$ 6,969,980$ 7,194,135$ 7,426,047$ 7,666,024$ 7,914,392$
Total Revenues 5,484,065$ 6,635,570$ 6,851,124$ 7,074,119$ 7,304,845$ 7,543,600$ 7,790,700$ 8,046,475$ 8,311,270$ 8,585,447$
OPERATING EXPENSES
Purchased Transportation 4,139,254$ 4,963,187$ 5,112,083$ 5,265,445$ 5,423,408$ 5,586,111$ 5,753,694$ 5,926,305$ 6,104,094$ 6,287,217$
Materia ls and Suppl ies 506,232$ 705,620$ 726,789$ 748,592$ 771,050$ 794,182$ 818,007$ 842,547$ 867,824$ 893,858$
Sa laries & Benefi ts 577,296$ 672,786$ 706,426$ 741,747$ 778,834$ 817,776$ 858,665$ 901,598$ 946,678$ 994,012$
Services 180,328$ 220,610$ 227,228$ 234,045$ 241,066$ 248,298$ 255,747$ 263,420$ 271,322$ 279,462$
Other 22,849$ 17,493$ 18,018$ 18,559$ 19,115$ 19,689$ 20,280$ 20,888$ 21,515$ 22,160$
Casual ty and Liabi l i ty Insurance 45,299$ 43,291$ 47,621$ 52,383$ 57,621$ 63,383$ 69,721$ 76,693$ 84,363$ 92,799$
Uti l i ties 8,462$ 7,809$ 8,044$ 8,285$ 8,534$ 8,790$ 9,053$ 9,325$ 9,605$ 9,893$
Taxes 4,345$ 4,773$ 4,916$ 5,064$ 5,216$ 5,372$ 5,533$ 5,699$ 5,870$ 6,047$
Total Operating Expenses 5,484,065$ 6,635,570$ 6,851,124$ 7,074,119$ 7,304,845$ 7,543,600$ 7,790,700$ 8,046,475$ 8,311,270$ 8,585,447$
Demand Response (DR) Operating Budget

37 | P a g e
CHAPTER 5: Capital Improvement Plan
The Capital Improvement Plan identifies projects necessary for maintaining and improving ECCTA fleet
and facilities as necessary to provide quality transit service into the future. Due to limited federal transit
funds, the process of developing projects as part of MTC’s Transit Capital Priorities program helps
ensure that available funds go to projects that are essential. Therefore, this section focuses mainly on
the replacement of rolling stock and support vehicles that qualify for MTC funding.
Capital Plan This chapter summarizes the proposed 10‐year transit capital plan for the Tri Delta Transit system for
Fiscal Year (FY) 2020 through 2029. Necessary capital improvements include revenue vehicle and non‐
revenue vehicle replacements, upgrades to existing vehicles to meet California air quality regulations,
equipment replacement, and the development of a new park‐and‐ride lot. Proposed capital
improvements are constrained by future funding allocations. From a planning perspective, a constrained
capital plan that doesn’t include full funding for capital projects will not meet all identified needs. Figure
5.1 summarizes the projected 10‐year Tri Delta Transit capital plan. There are no planned capital
expenditures for FY22, FY27, or FY29. Total projected capital needs are $66.2 million through FY29.
Fleet Plan The California Air Resources Board (CARB) has established an Innovative Clean Transit (ICT) Regulation
that requires all public transit agencies to gradually transition to a 100% zero‐emission bus (ZEB) fleet.
Beginning in 2029, 100% of new purchases by transit agencies must be ZEBs, with a goal for full
transition by 2040. This regulation applies to all transit agencies that own, operate, or lease buses with a
gross vehicle weight rating greater than 14,000 lbs. It includes standard, articulated, over‐the‐road,
double decker, and cutaway buses.1
CARB ICT requirements differ for large and small transit agencies, with purchase requirements beginning
for large agencies in 2023 and for small agencies in 2026, shown in Figure 5.2. A transit agency is
considered large if it operates at least 100 buses in maximum service in an urbanized area of at least
200,000 people. All other agencies, including Tri Delta Transit, are considered small transit agencies. Tri
Delta Transit is ahead of the curve for small transit agencies, with four battery electric vehicles currently
in the fleet. By the end of the 10‐year horizon of this SRTP, Tri Delta Transit plans to have a fleet of 33
ZEBs and 29 diesel‐powered buses.
1 CARB Innovative Clean Transit Regulation Fact Sheet (https://ww2.arb.ca.gov/sites/default/files/2019‐07/ICTreg_factsheet.pdf)

38| P
age
Figure 5.1 Planned Capital Expenditures over SRTP Period
Replacement Year 10‐Year Total FY20 FY21 FY22 FY23 FY24 FY25 FY26 FY27 FY28 FY29
Revenue Vehicles $0 $5,088,271 $0 $3,716,457 $0 $20,022,102 $643,432 $0 $29,781,805 $0 $59,252,067
Non‐Revenue Vehicles
$0 $0 $0 $151,135 $103,941 $0 $0 $0 $0 $0 $255,076
Facilities $0 $6,624,100 $0 $0 $0 $0 $0 $0 $0 $0 $6,624,100
Equipment $31,098 $13,086 $0 $0 $0 $0 $0 $0 $51,331 $0 $95,515
Total $31,098 $11,725,457 $0 $3,867,592 $103,941 $20,022,102 $643,432 $0 $29,833,136 $0 $66,226,758
Figure 5.2 ZEB Purchase Schedule as a Percentage of Total New Bus Purchases
Year Large Transit Agency
Small Transit Agency
2023 25% ‐‐
2024 25% ‐‐
2025 25% ‐‐
2026 50% 25%
2027 50% 25%
2028 50% 25%
2029 100% 100%
SOURCE: CALIFORNIA AIR RESOURCES BOARD

39 | P a g e
Figure 5.3 summarizes the details of the Tri Delta Transit vehicle fleet over the 10‐year planning horizon
of this SRTP. The objective of the fleet plan is to maintain a fleet of 62 fixed‐route buses, 28 cutaways for
paratransit operations, and expand the existing fleet of four cutaways for the Tri MyRide microtransit
service to include eight cutaways. A total of 53 fixed‐route buses, 60 cutaways, and 14 vans will be
replaced under the plan, consistent with a full useful life for each vehicle in accordance with FTA
requirements. A detailed list of the current fixed‐route vehicle fleet can be found later in this chapter in
Figure 5.10, which is followed by a detailed list of the paratransit and microtransit vehicles in Figure
5.11.
A detailed year‐by‐year schedule for revenue vehicle acquisitions, including the type and number of
vehicles, is shown in Figure 5.4. Detailed descriptions of each of these scheduled replacement
acquisitions is shown in Figure 5.5, and the associated price per vehicle for each fiscal year is shown in
Figure 5.6.
The non‐revenue vehicle replacement schedule is shown in Figure 5.7. These vehicles do not qualify for
replacement from formula funds under MTC’s Transit Capital Priorities policy. This includes replacing
two minivans in FY23 and six cars in FY24. The non‐revenue vehicle inventory is shown later in this
chapter in Figure 5.12.

40| P
age
Figure 5.3 Planned Fleet Capital Expenditure Summary
Replacement Year
Vehicle Type FY20 FY21 FY22 FY23 FY24 FY25 FY26 FY28 FY29
10‐Year Total
Transit Bus 40 ft. Diesel $0 $3,399,930 $0 $0 $0 $11,083,941 $0 $0 $0 $14,483,871
Transit Bus 40 ft. Alt. Fuel (Hydrogen Fuel Cell)
$0 $2,225,780 $0 $0 $0 $8,465,512 $0 $25,743,194 $0 $36,434,486
Cutaway/Van, 7 Year, Gas $0 $0 $0 $3,716,457 $0 $0 $0 $4,038,611 $0 $7,755,068
Minivan under 22 ft. $0 $0 $0 $0 $0 $472,649 $643,432 $0 $0 $1,116,081
Total Cost $0 $5,625,710 $0 $3,716,457 $0 $20,022,102 $643,432 $29,781,805 $0 $59,789,506
Federal Allocation $0 $4,613,082 $0 $3,047,494 $0 $16,418,123 $527,614 $24,421,080 $0 $49,027,395
Local Allocation $0 $1,012,628 $0 $668,962 $0 $3,603,978 $115,818 $5,360,725 $0 $10,762,111
Figure 5.4 Revenue Vehicle Replacement Schedule by Year
Year Vehicle Type FY20 FY21 FY22 FY23 FY24 FY25 FY26 FY27 FY28 FY29
2009 (8) Gillig Low Floor – 40 ft. ‐‐ 8 ‐‐ ‐‐ ‐‐ ‐‐ ‐‐ ‐‐ ‐‐ ‐‐
2013 (25) Gillig Low Floor – 40 ft. ‐‐ ‐‐ ‐‐ ‐‐ ‐‐ 25 ‐‐ ‐‐ ‐‐ ‐‐
2016 (20) Gillig Low Floor – 40 ft. ‐‐ ‐‐ ‐‐ ‐‐ ‐‐ ‐‐ ‐‐ ‐‐ 20 ‐‐
2018 (30) Ford E450 Cutaway – 25 ft. ‐‐ ‐‐ ‐‐ 30 ‐‐ ‐‐ ‐‐ ‐‐ 30 ‐‐
2018 (6) Dodge Grand Caravan ‐‐ ‐‐ ‐‐ ‐‐ ‐‐ 6 ‐‐ ‐‐ ‐‐ ‐‐
2021 (8) Ford Transit Conversion – 18 ft. ‐‐ ‐‐ ‐‐ ‐‐ ‐‐ ‐‐ 8 ‐‐ ‐‐ ‐‐
Total Vehicles to be Replaced 0 8 0 30 0 31 8 0 50 0

41| P
age
Figure 5.5 Revenue Vehicle Replacement Schedule Details
Year Vehicle Type Description of Replacement
FY21 (8) Gillig Low Floor – 40 ft. Will be replaced with (2) 40 ft. Fuel Cell Electric buses and (6) 40 ft. Diesel buses
FY23 (30) Ford E450 Cutaway – 25 ft. Will be replaced with (30) 25 ft. Cutaways
FY25 (25) Gillig Low Floor – 40 ft. Will be replaced with (7) 40 ft. Fuel Cell Electric buses and (18) 40 ft. Diesel buses
FY25 (6) Dodge Grand Caravan Will be replaced with (6) Minivans
FY26 (8) Ford Transit Conversion – 18 ft. Will be replaced with (8) 18 ft. Cutaways
FY28 (20) Gillig Low Floor – 40 ft. Will be replaced with (20) 40 ft. Fuel Cell Electric buses
FY28 (30) 25 ft. Cutaways Will be replaced with (30) 25 ft. Cutaways
Figure 5.6 Revenue Vehicle Price List
Fiscal Year Vehicle Type FY20 FY21 FY22 FY23 FY24 FY25 FY26 FY27 FY28 FY29 Transit Bus 40 ft.
Diesel $555,000 $566,655 $578,555 $590,704 $603,109 $615,774 $628,706 $641,909 $655,389 $669,152
Federal $444,000 $453,324 $462,844 $472,564 $482,487 $492,620 $502,965 $513,527 $524,311 $535,321
Local $111,000 $113,331 $115,711 $118,141 $120,622 $123,155 $125,741 $128,382 $131,078 $133,830
Transit Bus 40 ft. Electric $1,090,000 $1,112,890 $1,136,261 $1,160,122 $1,184,485 $1,209,359 $1,234,755 $1,260,685 $1,287,160 $1,314,190
Federal $872,000 $890,312 $909,009 $928,098 $947,588 $967,487 $987,804 $1,008,548 $1,029,728 $1,051,352
Local $218,000 $222,578 $227,252 $232,024 $236,897 $241,872 $246,951 $252,137 $257,432 $262,838
Cutaway/Van, 7 Year, Gas $114,000 $116,394 $118,838 $121,334 $123,882 $126,483 $129,140 $131,851 $134,620 $137,447
Federal $91,200 $93,115 $95,071 $97,067 $99,106 $101,187 $103,312 $105,481 $107,696 $109,958
Local $22,800 $23,279 $23,768 $24,267 $24,776 $25,297 $25,828 $26,370 $26,924 $27,489
Minivan under 22 ft. $71,000 $72,491 $74,013 $75,568 $77,155 $78,775 $80,429 $82,118 $83,843 $85,603
Federal $56,800 $57,993 $59,211 $60,454 $61,724 $63,020 $64,343 $65,694 $67,074 $68,483
Local $14,200 $14,498 $14,803 $15,114 $15,431 $15,755 $16,086 $16,424 $16,769 $17,121

42| P
age
Figure 5.7 Non‐Revenue Vehicle Expenditure Summary
Replacement Year
Vehicle Type FY20 FY21 FY22 FY23 FY24 FY25 FY26 FY27 FY28 FY29 10‐Year Total
Price List
Car $0 $0 $0 $17,068 $17,324 $0 $0 $0 $0 $0 $0
Minivan under 22 ft. $0 $0 $0 $75,568 $77,155 $0 $0 $0 $0 $0 $0
Truck $0 $0 $0 $44,803 $45,475 $0 $0 $0 $0 $0 $0
Cutaway/Van, 7 Year, Gas $0 $0 $0 $121,334 $123,882 $0 $0 $0 $0 $0 $0
Replacement Schedule
Total Replacement Cost for Cars $0 $0 $0 $0 $103,941 $0 $0 $0 $0 $0 $103,941
Total Replacement Cost for Minivans
$0 $0 $0 $151,135 $0 $0 $0 $0 $0 $0 $151,135
Total Replacement Cost for Trucks $0 $0 $0 $0 $0 $0 $0 $0 $0 $0 $0
Total Replacement Cost for Cutaways
$0 $0 $0 $0 $0 $0 $0 $0 $0 $0 $0
Total Cost $0 $0 $0 $151,135 $103,941 $0 $0 $0 $0 $0 $255,077

43 | P a g e
Facilities Plan There are no facilities scheduled for replacement during the 10‐year period of this SRTP. Planning and
land acquisition for two park‐and‐ride lots in Oakley and Antioch began in FY04. Both facilities have
completed planning, design, and engineering, with remaining construction estimates of $6,624,100 for
each park‐and‐ride facility. The Oakley Park‐and‐Ride is fully funded and programmed for completion in
FY21. Funding for the Antioch Park‐and‐Ride construction has not yet been identified.
Equipment replacements are scheduled for FY20, FY21, and FY28. These replacements include four KONI
Lifts in FY20, one power pusher in FY21, one bus scaffolding in FY28 and two Connexionz Antioch BART
signs in FY28. Equipment replacement costs over the course of the 10‐year SRTP total $95,514.
Facilities and equipment expenditures over the 10‐year planning horizon are shown in Figure 5.8. The
10‐year total planned expenditure for facilities and equipment is approximately $6.7 million.

44| P
age
Figure 5.8 Facilities and Equipment Expenditure Summary
Replacement Year
FY20 FY21 FY22 FY23 FY24 FY25 FY26 FY27 FY28 FY29 10‐Year Total
Facilities
Oakley Park‐and‐Ride Lot $0 $6,624,100 $0 $0 $0 $0 $0 $0 $0 $0 $6,624,100
Total $0 $6,624,100 $0 $0 $0 $0 $0 $0 $0 $0 $6,624,100
$0 $0 $0 $0 $0 $0 $0 $0 $0 $0 $0
Equipment
KONI Lifts $31,098 $0 $0 $0 $0 $0 $0 $0 $0 $0 $31,098
Power Pusher $0 $13,086 $0 $0 $0 $0 $0 $0 $0 $0 $13,086
Bus Scaffolding $0 $0 $0 $0 $0 $0 $0 $0 $40,853 $0 $40,853
Connexionz Antioch BART Signs $0 $0 $0 $0 $0 $0 $0 $0 $10,478 $0 $10,478
Total $31,098 $13,086 $0 $0 $0 $0 $0 $0 $51,331 $0 $95,514
Grand Total $31,098 $6,637,186 $0 $0 $0 $0 $0 $0 $51,331 $0 $6,719,615

45 | P a g e
Unfunded Capital Projects Tri Delta Transit has identified several priority projects that are currently unfunded. In addition to the
Antioch Park‐and‐Ride lot, the agency has an identified need for a bus lot resurfacing project at an
estimated cost of $2.4 million. Tri Delta Transit’s identified unfunded projects are estimated to cost
approximately $9.0 million and are shown in more detail in Figure 5.9.
Figure 5.9 Tri Delta Transit Unfunded Projects
Unfunded Project Estimated Cost
Bus Lot Resurfacing $2,400,000
Antioch Park‐and‐Ride Lot $6,624,100
Hydrogen Fueling Station $3,200,000
Additional Electrical Infrastructure $1,100,000
Bus Rapid Transit Lines (x2) $9,800,000
Total $23,124,100
Fleet and Facilities Inventories A comprehensive inventory of Tri Delta Transit’s fleet, equipment, and facilities is shown in Figure 5.10, Figure 5.11, Figure 5.12, and Figure 5.13. Four 20 ft. vans listed in the paratransit and microtransit fleet inventory were scheduled for replacement in 2016. These vehicles were repurposed to launch the Tri My Ride microtransit pilot project. While listed in the fleet inventory, these vehicles have been retired and will be replaced by previously‐purchased vehicles scheduled for delivery in FY21.
Figure 5.10 Revenue Vehicle Inventory – Motor Bus
Motor Bus (MB) Vehicles
Vehicle Make Model Year Size/Type Power Vehicle ID Seats Useful Life
Replacement Year
1891 BYD K9 2018 40 ft. Battery Electric
4B9KSLA60H2038034 32/2 12 Years 2030
1892 BYD K9 2018 40 ft. Battery Electric
4B9KSLA62H2038035 32/2 12 Years 2030
1893 Gillig Low Floor 2018 40 ft. Diesel 15GGD2719J3189107 36/2 12 Years 2030
1894 Gillig Low Floor 2018 40 ft. Diesel 15GGD2710J3189108 36/2 12 Years 2030
1895 Gillig Low Floor 2018 40 ft. Diesel 15GGD2712J3189109 36/2 12 Years 2030
1896 Gillig Low Floor 2018 40 ft. Diesel 15GGD2719J3189110 36/2 12 Years 2030
1897 Gillig Low Floor 2018 40 ft. Diesel 15GGD2719J3189111 36/2 12 Years 2030
1898 Proterra Catalyst C2 2018 40 ft. Battery Electric
1M9TH16J0JL816232 38/2 12 Years 2030
1899 Proterra Catalyst C2 2018 40 ft. Battery Electric
1M9TH16J4JL816234 38/2 12 Years 2030
0992 Gillig Low Floor 2009 40 ft. Diesel 15GGD271391176859 36/2 12 Years 2021
0993 Gillig Low Floor 2009 40 ft. Diesel 15GGD271X91176860 36/2 12 Years 2021
0994 Gillig Low Floor 2009 40 ft. Diesel 15GGD271191176861 36/2 12 Years 2021
0995 Gillig Low Floor 2009 40 ft. Diesel 15GGD271391176862 36/2 12 Years 2021
0996 Gillig Low Floor 2009 40 ft. Diesel 15GGD271591176863 36/2 12 Years 2021
0997 Gillig Low Floor 2009 40 ft. Diesel 15GGD271791176864 36/2 12 Years 2021

46 | P a g e
Motor Bus (MB) Vehicles
Vehicle Make Model Year Size/Type Power Vehicle ID Seats Useful Life
Replacement Year
0998 Gillig Low Floor 2009 40 ft. Diesel 15GGD271991176865 36/2 12 Years 2021
0999 Gillig Low Floor 2009 40 ft. Diesel 15GGD271091176866 36/2 12 Years 2021
1375 Gillig Low Floor 2013 40 ft. Diesel 15GGD2713D1182007 36/2 12 Years 2025
1376 Gillig Low Floor 2013 40 ft. Diesel 15GGD2715D1182008 36/2 12 Years 2025
1377 Gillig Low Floor 2013 40 ft. Diesel 15GGD2717D1182009 36/2 12 Years 2025
1378 Gillig Low Floor 2013 40 ft. Diesel 15GGD2713D1182010 36/2 12 Years 2025
1379 Gillig Low Floor 2013 40 ft. Diesel 15GGD2715D1182011 36/2 12 Years 2025
1380 Gillig Low Floor 2013 40 ft. Diesel 15GGD2717D1182012 36/2 12 Years 2025
1381 Gillig Low Floor 2013 40 ft. Diesel 15GGD2719D1182013 36/2 12 Years 2025
1382 Gillig Low Floor 2013 40 ft. Diesel 15GGD2710D1182014 36/2 12 Years 2025
1383 Gillig Low Floor 2013 40 ft. Diesel 15GGD2712D1182015 36/2 12 Years 2025
1384 Gillig Low Floor 2013 40 ft. Diesel 15GGD2714D1182016 36/2 12 Years 2025
1385 Gillig Low Floor 2013 40 ft. Diesel 15GGD2716D1182017 36/2 12 Years 2025
1386 Gillig Low Floor 2013 40 ft. Diesel 15GGD2718D1182018 36/2 12 Years 2025
1387 Gillig Low Floor 2013 40 ft. Diesel 15GGD271XD1182019 36/2 12 Years 2025
1388 Gillig Low Floor 2013 40 ft. Diesel 15GGD2716D1182020 36/2 12 Years 2025
1389 Gillig Low Floor 2013 40 ft. Diesel 15GGD2718D1182021 36/2 12 Years 2025
1390 Gillig Low Floor 2013 40 ft. Diesel 15GGD271XD1182022 36/2 12 Years 2025
1391 Gillig Low Floor 2013 40 ft. Diesel 15GGD2711D1182023 36/2 12 Years 2025
1392 Gillig Low Floor 2013 40 ft. Diesel 15GGD2713D1182024 36/2 12 Years 2025
1393 Gillig Low Floor 2013 40 ft. Diesel 15GGD2715D1182025 36/2 12 Years 2025
1394 Gillig Low Floor 2013 40 ft. Diesel 15GGD2717D1182026 36/2 12 Years 2025
1395 Gillig Low Floor 2013 40 ft. Diesel 15GGD2719D1182027 36/2 12 Years 2025
1396 Gillig Low Floor 2013 40 ft. Diesel 15GGD2710D1182028 36/2 12 Years 2025
1397 Gillig Low Floor 2013 40 ft. Diesel 15GGD2712D1182029 36/2 12 Years 2025
1398 Gillig Low Floor 2013 40 ft. Diesel 15GGD2719D1182030 36/2 12 Years 2025
1399 Gillig Low Floor 2013 40 ft. Diesel 15GGD2710D1182031 36/2 12 Years 2025
1680 Gillig Low Floor 2016 40 ft. Diesel 15GGD2718G1187711 36/2 12 Years 2028
1681 Gillig Low Floor 2016 40 ft. Diesel 15GGD271XG1187712 36/2 12 Years 2028
1682 Gillig Low Floor 2016 40 ft. Diesel 15GGD2711G1187713 36/2 12 Years 2028
1683 Gillig Low Floor 2016 40 ft. Diesel 15GGD2713G1187714 36/2 12 Years 2028
1684 Gillig Low Floor 2016 40 ft. Diesel 15GGD2715G1187715 36/2 12 Years 2028
1685 Gillig Low Floor 2016 40 ft. Diesel 15GGD2717G1187716 36/2 12 Years 2028
1686 Gillig Low Floor 2016 40 ft. Diesel 15GGD2719G1187717 36/2 12 Years 2028
1687 Gillig Low Floor 2016 40 ft. Diesel 15GGD2710G1187718 36/2 12 Years 2028
1688 Gillig Low Floor 2016 40 ft. Diesel 15GGD2712G1187719 36/2 12 Years 2028
1689 Gillig Low Floor 2016 40 ft. Diesel 15GGD2719G1187720 36/2 12 Years 2028
1690 Gillig Low Floor 2016 40 ft. Diesel 15GGD2710G1187721 36/2 12 Years 2028
1691 Gillig Low Floor 2016 40 ft. Diesel 15GGD2712G1187722 36/2 12 Years 2028
1692 Gillig Low Floor 2016 40 ft. Diesel 15GGD2714G1187723 36/2 12 Years 2028
1693 Gillig Low Floor 2016 40 ft. Diesel 15GGD2716G1187724 36/2 12 Years 2028
1694 Gillig Low Floor 2016 40 ft. Diesel 15GGD2718G1187725 36/2 12 Years 2028
1695 Gillig Low Floor 2016 40 ft. Diesel 15GGD271XG1187726 36/2 12 Years 2028
1696 Gillig Low Floor 2016 40 ft. Diesel 15GGD2711G1187727 36/2 12 Years 2028
1697 Gillig Low Floor 2016 40 ft. Diesel 15GGD2713G1187728 36/2 12 Years 2028
1698 Gillig Low Floor 2016 40 ft. Diesel 15GGD2715G1187729 36/2 12 Years 2028
1699 Gillig Low Floor 2016 40 ft. Diesel 15GGD2711G1187730 36/2 12 Years 2028

47 | P a g e
Figure 5.11 Revenue Vehicle Inventory – Paratransit and Microtransit (DR)
Paratransit and Microtransit Vehicles (DR)
Vehicle Make Model Year Size/Type Power Vehicle ID Seats Useful Life
Replacement Year
0800 Ford E450 2018 25 ft. Unleaded 1FDFE4FS5HDC75875 16/5 5 Years 2023
0801 Ford E450 2018 25 ft. Unleaded 1FDFE4FS6HDC75822 16/5 5 Years 2023
0802 Ford E450 2018 25 ft. Unleaded 1FDFE4FS8HDC75854 16/5 5 Years 2023
0803 Ford E450 2018 25 ft. Unleaded 1FDFE4FS3HDC75860 16/5 5 Years 2023
0804 Ford E450 2018 25 ft. Unleaded 1FDFE4FSXHDC78643 16/5 5 Years 2023
0805 Ford E450 2018 25 ft. Unleaded 1FDFE4FS5HDC78629 16/5 5 Years 2023
0806 Ford E450 2018 25 ft. Unleaded 1FDFE4FS4HDC78637 16/5 5 Years 2023
0807 Ford E450 2018 25 ft. Unleaded 1FDFE4FS6HDC78638 16/5 5 Years 2023
0808 Ford E450 2018 25 ft. Unleaded 1FDFE4FS8HDC78639 16/5 5 Years 2023
0809 Ford E450 2018 25 ft. Unleaded 1FDFE4FS3HDC78628 16/5 5 Years 2023
0810 Ford E450 2018 25 ft. Unleaded 1FDFE4FS3HDC78631 16/5 5 Years 2023
0811 Ford E450 2018 25 ft. Unleaded 1FDFE4FS7HDC78633 16/5 5 Years 2023
0812 Ford E450 2018 25 ft. Unleaded 1FDFE4FS4HDC78640 16/5 5 Years 2023
0813 Ford E450 2018 25 ft. Unleaded 1FDFE4FS6HDC78641 16/5 5 Years 2023
0814 Ford E450 2018 25 ft. Unleaded 1FDFE4FS1HDC78627 16/5 5 Years 2023
0815 Ford E450 2018 25 ft. Unleaded 1FDFE4FS5HDC78632 16/5 5 Years 2023
0816 Ford E450 2018 25 ft. Unleaded 1FDFE4FS9HDC78634 16/5 5 Years 2023
0817 Ford E450 2018 25 ft. Unleaded 1FDFE4FS2HDC78636 16/5 5 Years 2023
0818 Ford E450 2018 25 ft. Unleaded 1FDFE4FS1HDC78630 16/5 5 Years 2023
0819 Ford E450 2018 25 ft. Unleaded 1FDFE4FS0HDC78635 16/5 5 Years 2023
0820 Ford E450 2018 25 ft. Unleaded 1FDFE4FS5JDC01457 16/5 5 Years 2023
0821 Ford E450 2018 25 ft. Unleaded 1FDFE4FD9JDC01459 16/5 5 Years 2023
0822 Ford E450 2018 25 ft. Unleaded 1FDFE4FS9JDC01462 16/5 5 Years 2023
0823 Ford E450 2018 25 ft. Unleaded 1FDFE4FS6JDC16419 16/5 5 Years 2023
0824 Ford E450 2018 25 ft. Unleaded 1FDFE4FS5JDC16427 16/5 5 Years 2023
0825 Ford E450 2018 25 ft. Unleaded 1FDFE4FS4JDC16421 16/5 5 Years 2023
0826 Ford E450 2018 25 ft. Unleaded 1FDFE4FS8JDC16423 16/5 5 Years 2023
0827 Ford E450 2018 25 ft. Unleaded 1FDFE4FS4JDC16418 16/5 5 Years 2023
0111 Ford E450 2011 20 ft Unleaded 1FDFE4FS4BDB12237 12/4 5 Years 2016
0117 Ford E450 2011 20 ft Unleaded 1FDFE4FSXBDB12243 12/4 5 Years 2016
0119 Ford E450 2011 20 ft Unleaded 1FDFE4FS3BDB12245 12/4 5 Years 2016
0120 Ford E450 2011 20 ft Unleaded 1FDFE4FS5BDB12246 12/4 5 Years 2016
2106 Dodge Grand Caravan 2018 17 ft. Unleaded 2C7WDGBG85R361519 3/1 5 Years 2023
2107 Dodge Grand Caravan 2018 17 ft. Unleaded 2C7WDGBG8JR361536 3/1 5 Years 2023
2108 Dodge Grand Caravan 2018 17 ft. Unleaded 2C7WDGBG8JR362727 3/1 5 Years 2023
2109 Dodge Grand Caravan 2018 17 ft. Unleaded 2C7WDGBG8JR362856 3/1 5 Years 2023
2110 Dodge Grand Caravan 2018 17 ft. Unleaded 2C7WDGBG8JR362881 3/1 5 Years 2023
2111 Dodge Grand Caravan 2018 17 ft. Unleaded 2C7WDGBG7JR363732 3/1 5 Years 2023

48 | P a g e
Figure 5.12 Non‐Revenue Vehicle Inventory
Non‐Revenue Vehicles
Vehicle Make Model Year Size/Type Power Vehicle ID Seats Useful Life
Replacement Year
0031 Ford E450 2018 25 ft. Van Unleaded 1FDFE4FS6JDC16422 16/5 5 Years 2023
0032 Ford E450 2018 25 ft. Van Unleaded 1FDFE4FS0JDC17341 16/5 5 Years 2023
0018 Dodge Grand Caravan
2010 Van Unleaded 2D4RN4DE9AR248845 7 5 Years 2015
0019 Dodge Grand Caravan
2010 Van Unleaded 2D4RN4DE0AR248846 7 5 Years 2015
0020 Ford F‐550 2011 Shelter Truck
Unleaded 1FDUF5GYXBEA03045 3 5 Years 2016
0021 Ford F‐550 2011 Shop Truck
Unleaded 1FDUF5GY8BEA03044 3 5 Years 2016
0033 Ford F‐350 2003 Shelter Repair
Unleaded 1FDFWF36L03EB88243 3 5 Years 2008
0034 Ford Taurus 2019 Admin. Car
Unleaded 1FAHP2D85KG103487 5 5 Years 2024
0035 Ford Taurus 2019 Support Car
Unleaded 1FAHP2D8XKG103484 5 5 Years 2024
0036 Ford Taurus 2019 Support Car
Unleaded 1FAHP2D81KG103485 5 5 Years 2024
0037 Ford Taurus 2019 Support Car
Unleaded 1FAHP2D87KG103488 5 5 Years 2024
0038 Ford Taurus 2019 Support Car
Unleaded 1FAHP2D89KG103489 5 5 Years 2024
0039 Ford Taurus 2019 Support Car
Unleaded 1FAHP2D83KG103486 5 5 Years 2024

49 | P a g e
Figure 5.13 Facilities and Equipment Inventory
Facilities
Name Year Useful Life Quantity Total Cost Replacement
Year
Administration and Maintenance Building 2004 30 years 1 $11,171,380 2034
Electric Bus Charging Stations 2018 12 years 4 $258,884 2030
HVAC System 2006 10 years 1 $148,983 2016
Photovoltaic System 2018 30 years 1 $1,313,978 2048
Bus Wash 2006 10 years 1 $205,496 2016
Underground Storage Tank 2009 10 years 1 $48,915 2019
Security Card Access System 2013 5 years 1 $15,289 2018
Equipment
Name Year Useful Life Quantity Total Cost Replacement
Year
GFI Fareboxes 2012 5 years 56 $1,021,295 2017
All Admin Furniture and Equipment 2011 5 years 1 $3,284,130 2016
Bus Scaffolding 2018 10 years 1 $40,853 2028
Connexionz Antioch BART Signs 2018 10 years 2 $10,478 2028
Engine Hoist 2009 5 years 1 $10,581 2014
KONI Lifts 2015 5 years 4 $31,098 2020
Power Pusher 2016 5 years 1 $13,086 2021
Coats Tire Machine 2019 12 years 1 $15,470 2031