eastern bay choptank miles and wye rivers
TRANSCRIPT

2012 Report Card
Eastern Bay Choptank Miles and Wye Rivers

Midshore Riverkeeper Conservancy (MRC) is pleased to release our third annual River Report Card. In our efforts to continually improve this product, and to make it a more accessible tool for our community, we have redesigned the footprint. We welcome any feedback.
This year we have added new sampling sites within the Eastern Bay watershed as well as the Tuckahoe River. We also have expanded our coverage from 9 to 16 subject tributaries. Over the past year we tested 122 sites and collected 533 samples and data readings. We use analysis protocols developed in collaboration with the Maryland Tributary Assessment Coalition.
Each of the core indicators, other than dissolved oxygen, is scored on a scale of 0 to 5, the score of 5 reflecting the healthiest water quality condition. Dissolved oxygen is scored on a pass/fail basis. Each score is determined by benchmarks that vary according to season and salinity regime. The scores are converted into percentages based on what a pristine tributary would reflect. The percentages are then converted to letter grades, explained in the chart herein. Results reflect a range of B+ to C for all of our watersheds.
MRC staff and volunteers are continuing to work at every level to ensure that these grades improve over time. It will not happen overnight. But with the support of our community, we truly can restore our waterways such that they are rich with life, health, beauty and vitality. Please join us! Tim Junkin
Executive Summary

Our data was collected by our two Riverkeeper scientists and over 50 Midshore Creekwatchers (acknowledged on the back page), who are trained by our Riverkeepers in methodology and protocols. Our testers measured water clarity, dissolved oxygen, temperature, pH, salinity, and sample for nitrogen, phosphorus, and chlorophyll a. Observations of flora and fauna were also recorded, and unusual occurrences or observable sources of pollution were reported to our Riverkeepers. Data was compared to thresholds established by the Maryland Tributary Assessment Coalition. Threshold values equate to those that a healthy river would yield.
Report Card Approach

Dissolved Oxygen
Oxygen is essential for life and is a key indicator of ecosystem health. Underwater, oxygen is found in the form of dissolved oxygen and without it, aquatic wildlife can become stressed or die.
Low levels of oxygen in the water are most often a result of eutrophication. This occurs when excess nutrients are released into the water, causing excessive algae growth. As the algae die, decomposing bacteria deplete the water of available oxygen.
Most problems associated with low dissolved oxygen occur during the summer due to increased temperatures (warmer water holds less oxygen).
Report Card Indicators
Water Clarity
Clear water is essential for the life of underwater grasses. Sunlight must be able to reach these plants in order for them to grow. Our rivers become murky when excess nutrients and sediments are washed into the waterways, and as the excess nutrients fuel algae growth. Water clarity fluctuates naturally depending on weather conditions. During dry and cool conditions water is clearer. After storm events, the water will look more like chocolate milk.
Water clarity is measured by using a Secchi disk. The “Secchi depth” is the depth at which the disk is no longer visible, mimicking the depth at which light is unable to penetrate the water.
Pho
to c
redi
t: Ja
y Fl
emm
ing

Chlorophyll a / Algae
Chlorophyll is the green pigment that is found in plankton and algae; it is used to absorb sunlight for photosynthesis. Chlorophyll a is measured to determine the concentration of algae in our waterways. Algae is an important source of food for many organisms, but too much of it can be harmful. Algal blooms occur as a result of too much nutrient pollution. These blooms block light from reaching underwater grasses and lead to oxygen depletion which can cause fish kills and threaten all aquatic life. The best way to reduce the amount of chlorophyll a in the water is to minimize the amount of nutrient pollution entering our waterways.
If you suspect an algal bloom is occurring, please contact Midshore Riverkeeper Conservancy.
Report Card Indicators
Nutrients
In our rivers, nutrients are essential for the growth and development of phytoplankton, underwater grasses, and algae. However, too much of a good thing can be bad! If too much fertilizer is placed on a lawn, it will die.
The same is true for our rivers. Excess nutrients cause excessive growth in algae and phytoplankton, leading to dissolved oxygen deficiencies.
Nitrogen and phosphorus naturally enter our waterways through the atmosphere and soil, but human activity has greatly increased the amount of nutrients entering our rivers. The nutrients in our watersheds come from a variety of sources including agricultural fertilizers that run off the land or seep into groundwater, lawn fertilizers, septic systems, and waste water.

What do the Grades Mean?
All water quality and biological health indicators meet desired levels. Quality of water in these locations tends to be very good, most often leading to very good habitat conditions for fish and shellfish.
A
B
C
D
F
By using the same core indicators, scores, and grading scale as other similar programs, it’s possible to compare conditions in various rivers throughout the Chesapeake Bay by their Report Card results.
Very few or no water quality and biological health indicators meet desired levels. Quality of water in these locations tends to be very poor, most often leading to very poor habitat conditions for fish and shellfish.
Some or few water quality and biological healthindicators meet desired levels. Quality of water in these locations tends to be poor, often leading to poor habitat conditions for fish and shellfish.
There is a mix of good and poor levels of water quality and biological health indicators. Quality of water in these locations tends to be fair, leading to fair habitat conditions for fish and shellfish.
Most water quality and biological health indicators meet desired levels. Quality of water in these locations tends to be good, often leading to good habitat conditions for fish and shellfish.
MRC is engaged in the fight to reduce pollution entering our rivers from our land. Our staff and volunteers regularly patrol our tributaries on the lookout for pollution plumes, hotspots, algal blooms, or other issues that threaten the health of these waterways. In our local counties, in Annapolis, through the regulatory and legal process, and through collaborative in-the-ground projects, we work at every level to ensure that these rivers remain robust. And together, communities from Lancaster, Pennsylvania to Easton, Maryland, to Tidewater, Virginia are finding ways to design, pay for, and implement pollution reducing strategies. The entire universe of biotic diversity that our rivers support is benefiting from this effort.

2012 Results
% measurements that met threshold
Waterway Wat
er C
larit
y
Dis
solv
ed O
xyge
n
Nitr
ogen
Pho
spho
rus
Chl
orop
hyll
a
Aver
age
Gra
de
Choptank River Watershed
Harris Creek 47 98 87 53 49 67 B
Broad Creek 42 99 58 45 49 59 C+
Tuckahoe* 43 97
Tred Avon 45 94 69 40 49 56 C+
LaTrappe and Island Ck 37 89 62 26 30 49 C
Choptank 55 93 68 34 20 54 C
Miles Wye Rivers and Eastern Bay Watershed
Cox Creek 41 79 90 60 68 B
Crab Alley Creek 50 97 100 70 79 B+
Prospect Bay 52 94 93 53 73 B
Greenwood Creek 48 86 65 35 59 C+
Shipping Creek 54 92 80 30 65 B
Eastern Bay 54 94 67 47 66 B
Wye East 40 84 60 20 51 C
Wye Narrows 24 100 60 20 51 C
Wye River 37 97 58 34 57 C+
Miles River 45 81 66 42 33 53 C
* Insufficient data was collected to determine score

2012 Report Card
Wye NarrowsC
Prospect BayC
Greenwood CreekC+
Miles RiverC
Miles Wye River
Watershed
Wye EastC
Shipping CreekB
Cox CreekB
Eastern BayB
Wye RiverC+
Crab Alley CreekB+

Maryland Fertlizer Bill2012 Report Card
Choptank RiverWatershed
LaTrappe & Island Ck C
Choptank River C
Tred Avon River C+
Broad Creek C+
Miles Wye River
Watershed
Harris Creek B

The Choptank River watershed comprises 700 square miles, approximately 60% of which is in agricultural use. The Choptank remains one of only two rivers in the Chesapeake Bay watershed with increasing nutrient loads, most of which are delivered by slow-moving groundwater. Scientists continue to try to determine what portion of the Choptank’s nutrient load is caused by legacy nutrients and what percentage can be attributed to current practices.
During this past year, 2012, we faced drought conditions which typically produce better water quality, more underwater grasses, and strong oyster production. Year 2012 was a bit odd in that the Choptank experienced a slight decline in underwater grasses and had high phosphorus levels. Underwater grasses, however, were still more abundant than in typical years past. Rockfish production was poor, but oyster production was good.
MRC continues to try and find ways to reverse the trend in the Choptank of increasing nutrient loads. This past fall, MRC obtained a $130,000 grant from the National Fish and Wildlife Foundation (NFWF) to develop, fund, and implement collaborative water stewardship projects with farmers. For information about this program, please contact Tim Rosen, Agricultural Outreach Coordinator at 443.385.0511 or [email protected].
Choptank River
Photo credit: Margaret Carter
C+

The Miles River watershed comprises approximately 54 square miles, most of which is used for agriculture. The overall grade for the Miles River improved from 41% to 53% in the past year, with substantial improvement in water clarity. MRC is working on oyster restoration throughout the watershed. Oysters filter algae and nutrients from our rivers and improve biotic vitality.
Comprised of the Wye East, Wye Main Stem and Wye Narrows, the Wye River Complex is just over 78 square miles, is largely tidal, yet lacks the reaches of freshwater streams found in the Chester and Choptank, rendering it a poorly flushing system. MRC has begun the first-ever assessment of the Wye River watershed for the purpose of identifying opportunities to reduce pollution loads. Funding was secured through foundation and private donors. The project will identify pollution sources and key pollution reducing projects.
This was the first year that Eastern Bay was included in our testing. Its better grades are not surprising in that Eastern Bay is a well-flushed body of water and is open to the tidal flows of the Chesapeake. Also, importantly, there is less proportionate influence from land-based runoff and groundwater. This result underscores a key truth: the excess of nutrients and sediments that degrade our rivers comes primarily from the surrounding land, not from the Chesapeake or the Susquehanna. This fact explains why it is that the farther we travel up each of our rivers, the worse the water quality becomes. Thus, in order for us to reduce these pollution threats, we must address the conditions we create on the land that surrounds our rivers.
Miles Wye Rivers and Eastern Bay
Photo credit: Chesapeake Bay Maritime Museum
C
C
B

Riverkeeper Observations
Underwater grasses are the lifeblood of the Chesapeake Bay. In the Choptank we have seen a fairly significant decline in underwater grasses (SAV). Scientists have linked the decline in underwater grasses to declining water clarity. Algae blooms fueled by high nutrient loads cloud the water and prevent sunlight from reaching the underwater grasses. In 2011 we saw a dramatic increase in SAV in the Choptank, with more grasses than we’ve seen since 2004. In 2012, there was a substantial decline from 2011 but more grasses than 2006-2010. SAV numbers are far below the levels that would equate to a recovered Choptank River.
Early season SAV was spread throughout the Eastern Bay, Miles, and Wye region with several dense concentrations in smaller, more protected environments. For example, Hambleton Creek at the confluence of the Miles and Eastern Bay had complete coverage of several species. Similar beds were found at the mouth of Greenwood Creek in open water in May. No Name Creek, immediately south of Shipping Creek held a beautiful thick bed of widgeon grass in late April. In June, Marshy Creek near Kent Narrows held patchy coverage of milfoil. Unfortunately much of these beds fell victim to reduced water clarity in the summer, which diminished the density and diversity of many of these grass beds. As the mere presence of these grass species is encouraging, caution should be taken not to disturb or damage them.
The midshore rivers are home to a variety of animals, including ospreys, blue herons, a number of oyster reefs, egrets, red tail hawks, and striped bass. There have also been sightings of river otters and porpoises. Southern Talbot County represents one of the few areas within the Choptank River watershed where there are large tracts of forest close to the river. This combination provides a plethora of nesting sites for one of our most easily recognizable and noble birds, the bald eagle. On any given day running between Cambridge and Dover Bridge you can see as many as 25 bald eagles either perched along the river in families or soaring across the broad Choptank. In late summer, after many of the osprey have migrated south, we have seen the most eagles on a given cruise.
Pho
to c
redi
t: C
huck
Wac
hter
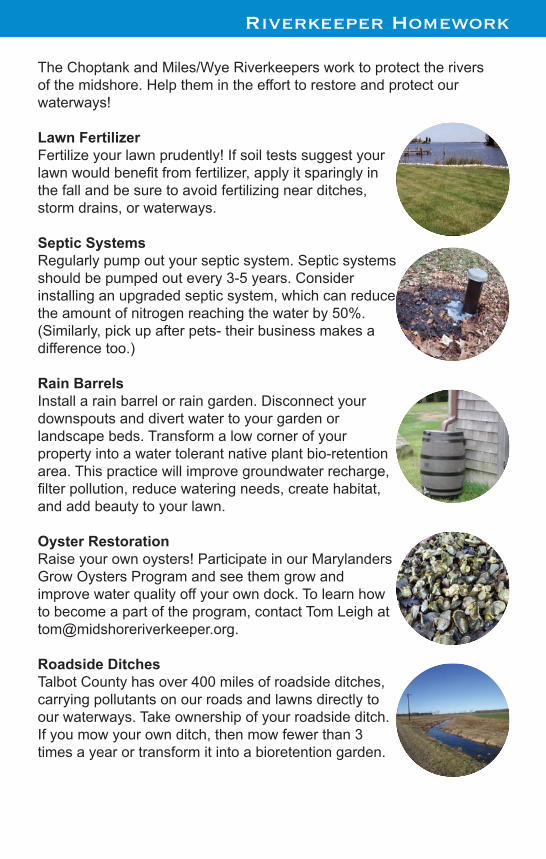
The Choptank and Miles/Wye Riverkeepers work to protect the rivers of the midshore. Help them in the effort to restore and protect our waterways!
Lawn Fertilizer Fertilize your lawn prudently! If soil tests suggest your lawn would benefit from fertilizer, apply it sparingly in the fall and be sure to avoid fertilizing near ditches, storm drains, or waterways.
Septic SystemsRegularly pump out your septic system. Septic systems should be pumped out every 3-5 years. Consider installing an upgraded septic system, which can reduce the amount of nitrogen reaching the water by 50%. (Similarly, pick up after pets- their business makes a difference too.)
Rain BarrelsInstall a rain barrel or rain garden. Disconnect your downspouts and divert water to your garden or landscape beds. Transform a low corner of your property into a water tolerant native plant bio-retention area. This practice will improve groundwater recharge, filter pollution, reduce watering needs, create habitat, and add beauty to your lawn.
Oyster RestorationRaise your own oysters! Participate in our Marylanders Grow Oysters Program and see them grow and improve water quality off your own dock. To learn how to become a part of the program, contact Tom Leigh at [email protected].
Roadside DitchesTalbot County has over 400 miles of roadside ditches, carrying pollutants on our roads and lawns directly to our waterways. Take ownership of your roadside ditch. If you mow your own ditch, then mow fewer than 3 times a year or transform it into a bioretention garden.
Riverkeeper Homework

Congratulations to Talbot, Queen Anne’s, and Kent County farmers for an impressive achievement in their efforts to prevent excess nutrients from entering our waters during 2012. A record number of Maryland farmers signed on to plant cover crops during the autumn. In Queen Anne’s County, 151 farmers planted 62,035 acres of cover crops and in Talbot County farmers signed up to plant 57,864 acres.
This seeding of winter grains is needed annually to uptake bay-threatening nutrients left in fields (particularly this past summer, by drought-stricken corn too weak to absorb the fertilizers). This record of cover crop acreage represents 170% of the current two-year goal for the Watershed Implementation Plan for cover crops. Cover crops are one of the most cost-effective means of helping to protect the Bay.
According to the Maryland Department of Agriculture, Talbot County enrolled the 5th largest percentage of eligible farmland with 78%. Kent followed with 73%. Kent also lead the state when ranked by most acres enrolled with 62,938 followed by Queen Anne’s and Talbot. In all, the state approved 607,000 acres of winter grains requested by 1,860 farmers (152 more than last year) according to Lt. Gov. Anthony Brown, who unveiled this year’s cover crop enrollment numbers. Take a moment and thank your neighboring farmer!
Thank a Farmer

Thank a Farmer
Bob & Judy AmdurRoger Baldwin
Dick BemisMike Bilek
Mary BollingerRoger & Jane Bollman
Rick BrandesJim Britt
Stan BrownBetty & Tony Brunetti
Perry CarmenAndy Coombs Jim Cooney
Bill CoxNicholis Fidis
Jack & Maria FischerDiane Flagler
John FordRobert Frenz
Brice & Carol Gamber
Thomas GermanBarry Gillman
Dennis & Nancy Greene
Peter & Susan HaleJay & Janet Harford
George HoffmanDan Hopkins
Joe JelichNancy KellyDrew Koslow
Al & Mary Jo KubeluisTom Leigh
Annabel & Ron Lesher
Sue MarquardtBill Mattimore
Lin MoellerJack & Marcia Moore
Richard Morrical
Mel & Marlies MrazDorette & Larry
MurrayBrian O’HareBob Petizon
John SchreinerJohn Short
Don & Carol SillimanCyrus & Debbie Smith
Harley SpeirMario Tama
Bob and Bev WolffeBuck Waller
Karen & Bud Wood
Special thanks to Lois Lindsley & Dave Perry for
their work in data compilation.
Our citizen scientist volunteers collect much of the information necessary to produce this annual report and are an integral part of our program and an invaluable resource. Midshore Riverkeeper Conservancy extends its gratitude to these individuals for their hard work.
Thanks to our Midshore Creekwatchers

Midshore Riverkeeper Conservancy23 N. Harrison StreetEaston, MD 21601
Return Service Requested
NON PROFIT ORGUS POSTAGE
PAIDMAIL MOVERS
MRC thanks our project funders and partners:
Become a Member!MRC is dependent on contributions for its growth and sustainability. Donate or become a member to show your support! Recruit new members to our cause.
Become a conservation activist.
For more information on how to get started with your homework, visit our website at www.midshoreriverkeeper.org
or contact us at 443.385.0511
Front Cover: Blue Heron in flight. Taken by Chuck Wachter.