earthen dam irrigation schemes in tigray...
TRANSCRIPT

EARTHEN DAM IRRIGATION SCHEMES IN TIGRAY, ETHIOPIA
DEVELOPMENT OPPORTUNITIES VERSUS SUSTAINABILITY CHALLENGES
Eyasu Yazew1+2, Herman Depeweg1 and Mitiku Haile2
ABSTRACT
Tigray is a semi-arid area located in the northern part of Ethiopia. It is one of the most degraded and drought prone areas with many recorded famine evidences in the last two centuries. The farming system is entirely dominated by traditional methods of rainfed crop production and livestock rearing. Except for some surplus producing areas in the Western and Southern zones during good rainfall years, the rest either produces just enough for subsistence during good rainfall years or faces chronic food deficit. There are many causes of the structural food shortage of which moisture deficit plays a significant role. Moisture stress is particularly severe due to the insufficient and erratic rainfall.
Realising these problems, the regional Government of Tigray has been engaged in earthen dam irrigation development activities for the last few years. The principal objectives are to change the agrarian system to widespread irrigated agriculture and to gradually attain self-sufficiency in food production. So far about 44 earthen dams with related irrigation facilities have been constructed. The average catchment area, reservoir area, reservoir capacity, dam height, crest length and irrigated area per dam is 950 ha, 25 ha, 1.1 million m3, 15.5 m, 378 m, and 32 ha respectively. There is however a considerable variation among individual dams.
A study has been carried out in two of these schemes, Gumsalasa and Korir, with a major objective of developing an integrated approach and modelling tool for sustainable land and water development and management. In this paper is described:- potentials for the development of earthen dam irrigation schemes in the region;- major environmental impacts that may hamper the sustainability of these schemes;- conclusions on the present situation and possible future outlooks.
The methodologies employed for the study include review of available secondary data and field data collection and analysis on the water management practices, the soil and water quality and the reservoir water balance.
The results have revealed that there are conducive situations that favour the development of earthen dam irrigation schemes. These include the water, land and labour resources of the region, and the commitment of the Government and the farming community. The region has an estimated irrigation potential of 325,000 ha, of which only about 15,000 ha is utilized so far traditionally. Besides, about 9 billion m3 of water is estimated to leave the region as runoff annually. The topography of the region is convenient for the construction of dams to store part of the runoff for irrigation use. The Government has established a commission (CoSAERT) responsible for the development of irrigation and finances its activities. The farming population, that constitutes 90% of the total, has also proven its commitment to the cause by actively participating in the development processes and offering 22 – 25 days free annual labour for land and water development and maintenance works.
However, field investigation in the study sites has revealed some outstanding environmental challenges that may hamper the potential benefits and sustainability of the irrigation schemes. The major challenges discussed in the paper are related to water management practices, waterlogging and salinity problems, and evaporation from the open reservoir water.
1 UNESCO-IHE Institute for Water Education, P.O.Box 3015, 2601 DA Delft, The Netherlands2 Mekelle University, P.O.Box 231, Mekelle, Tigray, Ethiopia

INTRODUCTION
In arid and semi-arid areas of Africa, the marginal and erratic rainfall renders rainfed agriculture unreliable. Under these circumstances irrigated agriculture may provide a degree of self-sufficiency in food production or at least aid in ensuring national food security, raising the rural population’s living standard, creating employment opportunities, and reducing urbanization pressure. For countries with arid and semi-arid climates, the lack of certainty about rainfall, along with the raising population pressure, would require irrigation development as a primary means for future food strategies. Ethiopia is one of the countries in this category (Elahi, 1992).
Ethiopia, a landlocked country in East-Africa, is located between the latitudes 5o N and 15o N, and longitudes 35o E and 45o E. With the involvement of 90% of the population, agriculture is the major source of employment, revenue and export earnings. The total area of Ethiopia is about 110 million ha and 67% lies in arid and semi-arid zones. The population has increased from 33.4 million in 1975 to 70 million at present with an annual growth rate of 3%.
According to Webb and Braun (1994) Ethiopia’s history is accentuated by famine as a result of three closely related factors, namely: - population pressure, especially on the highlands with an altitude of higher than 1,500 m+MSL where
about 80% of the population is concentrated;- natural resource base degradation; - droughts.
Tigray, located in the northern part of the country (Figure 1), is one of the most drought prone and food-insecure regions of Ethiopia. Rainfed agriculture is characterised by low productivity. Except for some surplus producing areas in the Western and Southern zones during good rainfall years, the rest either produces just enough for subsistence during good rainfall years or faces chronic food deficit. There are many causes of the structural food shortage of which moisture deficit plays a significant role. Moisture stress is particularly severe due to the insufficient and erratic rainfall. As a result, irrigation development is taken as an essential component of the food security strategy to improve food production and agricultural productivity in the region (Girmay, et al., 2000). CoSAERT has been established in 1994 to construct 500 dams and irrigate 50,000 ha in order to secure the food self-sufficiency of the region. So far about 44 earthen dams with related irrigation facilities have been constructed, while 47 are designed.
The construction of earthen dam irrigation schemes in semi-arid areas like Tigray could have some undesirable environmental impacts such as salinity and loss of considerable amount of water from the open reservoir by evaporation. Little is so far done in Tigray to investigate the source and extent of such environmental aspects. A research is at the moment underway in two of the schemes, Gumsalasa and Korir, to understand the water management, environmental and hydrological aspects as a basis for developing an integrated approach for sustainable land and water development and management in Tigray.
The objectives of this paper are:- to identify the potentials for the development of earthen dam irrigation schemes in the region;- to investigate the water management practices;- to investigate the source and extent of waterlogging and salinity problems;- to quantify the amount of water being lost from the open reservoir without being used for irrigation;- to present conclusions on the present situation and possible future outlooks.
THE STUDY AREA
Tigray has a population of 3.3 million and an annual population growth rate of 3.3%. The climate is mainly semi-arid with almost a uni-modal rainfall. For the larger part of the region the main rainfall season (locally called Kiremti/Meher) is three to four months, from June to mid-September. The region receives 80% of the total annual rainfall during this season. Some areas in the Southeastern highlands and Northeastern lowlands get some rainfall during January and February (Belgi/Belg). The region receives the smallest amount of rainfall compared to other parts of Ethiopia. The average annual rainfall for the period (1961 – 1987) was 571 mm, which was 38% less than the national average for the same period,

which was 921 mm (Webb and Braun, 1994). The mean annual rainfall ranges from 980 mm on the Central plateaux to 450 mm on the Northeastern escarpments of the region (Solomon, 1999). On the other hand, the average annual potential evapotranspiration of the region is about 1,539 mm. The rainfall exceeds the potential evapotranspiration only in two months of the year, i.e. July and August (NEDECO, 1997).
The study is being carried out in two earthen dam irrigation schemes in Tigray, namely the Gumsalasa and Korir (Table 1 and Figure 1). The rainfall data for the two sites are comparable. The average annual rainfall of Gumsalasa and Korir are 513 mm and 543 mm respectively. Rainfall at the two sites tend to be uni-modal, with more than 85% of the rain falling during the four months from June to September. Table 1 Some basic characteristics of the schemes
Gumsalasa KorirLocation Altitude (m+MSL) Latitude (N)Longitude (E)
Administrative zoneWeredaReservoir pointHighest point in the catchment
SouthernHentalo-Wajerat
1,960
2,06013015’ - 13013’39032’ – 39035’
EasternWukero1,960
2,100
13045’00’’39031’08’’
Population 7,834 4,761Basic scheme data Construction year
Start of irrigationCatchment area (ha)
199519971,855
199619971,550
Reservoir Area (ha)Fetch length (m)Capacity (million m3)
481,2001.9
328601.6
Embankment Effective dam height (m)Free board (m)Crest length (m)Crest width (m)Designed irrigable area (ha)
112.54286
110
151.25055
100Soil types and their area coverage (%)
Vertisol (Walka)Luvisol (Mekayih)Cambisol (Baekel)Regosol (Hutsa)Mixture of vertisol and regosol (hutsa-walka)
301045510
23134519-
Crop types Rainfed
Irrigated
Wheat, teff, barley, vetch
Maize, potato, onion, tomato, pepper, leafy vegetables
Wheat, teff, barley, bean, pea, chickpeaMaize, onion, tomato, pepper, leafy vegetables
(a) the names in the brackets represent the local names of the soils.

Figure 1 Administrative Weredas of the Tigray Region in Ethiopia
THE EARTHEN DAM IRRIGATION SCHEMES
The earthen dam irrigation schemes in Tigray consist of a catchment area, a reservoir, an earthen dam (embankment), and a command area with irrigation and, in some cases, drainage infrastructure. A view of the earthen dam projects is presented in Figure 2. As a result of precipitation, water flows from the catchment area (1) to the reservoir (2); the reservoir supplies irrigation water (3) to the command area (4) (Figure 2). Usually the flow is larger than the quantity required by the crops to be irrigated, because water is also used by non-irrigated vegetation or is lost as evaporation and/or seepage from conveyance and distribution canals, by deep percolation from irrigated fields and as runoff at the tail ends (Bos and Wolters, 1994). In addition to the release of water from the reservoirs through outlet works, water also seeps through the embankments of these dams. Downstream farmers usually divert this water for irrigation.
Most of the catchments are composed of steep slopes, which are prone to soil erosion because of runoff (Figure 3). As a result, the strategy has set a compulsory and intensive soil conservation and forestation programme in the catchment prior to the commencement of the construction of an irrigation scheme. The objective is to rehabilitate the degraded lands in the project area by constructing conservation works and planting millions of seedlings for soil protection and forest products. In this way, soil erosion and siltation of the earthen dams will decrease (CoSAERT, 1994). However, until now there are no cases of catchment rehabilitation prior to the dam construction. Priority was given to the construction aspects only and all the available labour was allocated to it. As a result, the rehabilitation program of most of the dams was started after completion of the construction works. There is a widespread fear in the region that reservoirs will be silted up before serving their design life. However, there are so far no systematic studies carried out to quantify the effect.

Figure 2 View and major hydrological processes of an earthen dam project
Figure 3 Partial view of the catchment area, reservoir and embankment of the Korir earthen dam
The reservoirs are constructed on a gentle slope and most of them are situated on farmlands causing displacement of a number of farmers. The embankments are made of earth with an impermeable clay core at the centre. The upstream slope of embankments is protected by riprap of stones against erosion by wave action; the crest and downstream slopes are protected by grass against erosion by wind and rain. The irrigation and drainage infrastructure consists of open canals made of earthen material. A summary of the various scheme components of the earthen dam irrigation schemes constructed so far is presented in Table 2.

Table 2 Various components of the 44 earthen dam irrigation schemes in TigrayScheme component Representative sizes
Total(44
dams)
Minimum(per dam)
Maximum(per dam)
Average(per dam)
Catchment area (ha) 41,826 36 3,001 950Reservoir area (ha)
capacity (million m3)77651
2.10.1
953.1
251.1
Dam embankment height (m)crest length (m)
66614,384
9104
24867
15.5378
Command area potential irrigable area (ha)actual irrigated area (ha)
2,9651,418
73
250155
6732
METHODOLOGY
Relevant primary and secondary data related to development opportunities, water management, salinity and reservoir operation were collected and analysed.
Salinity varies with time and space. As a result soil and water quality assessments of the study sites were carried out at different times and locations during the irrigation season. In addition to the release of water from the reservoirs through outlet works, water also seeps through the embankments of these dams. Downstream farmers usually divert this water for irrigation. Consequently, most of the dams in Tigray have primary and secondary command areas. The primary command areas are irrigated by proper canal water while the secondary command areas are irrigated by seepage water. Accordingly, the study sites were generally divided into rainfed, catchment, reservoir, primary command and secondary command areas. The rainfed area is included to serve as a control in the investigation of the impact of irrigation development on salinity. Surface water and soil samples at different times and locations were collected and analysed (Figure 4).
KEY Catchment area with main stream and tributaries
Reservoir Earthen dam
Traditional diversion
Primary command areaSecondary command area
Natural drain/seepage line Surface soil sample locations
W1
W5
W4
W3
W2
W6
W1
Rainfed area
Irrigation canal
Surface water sample locations
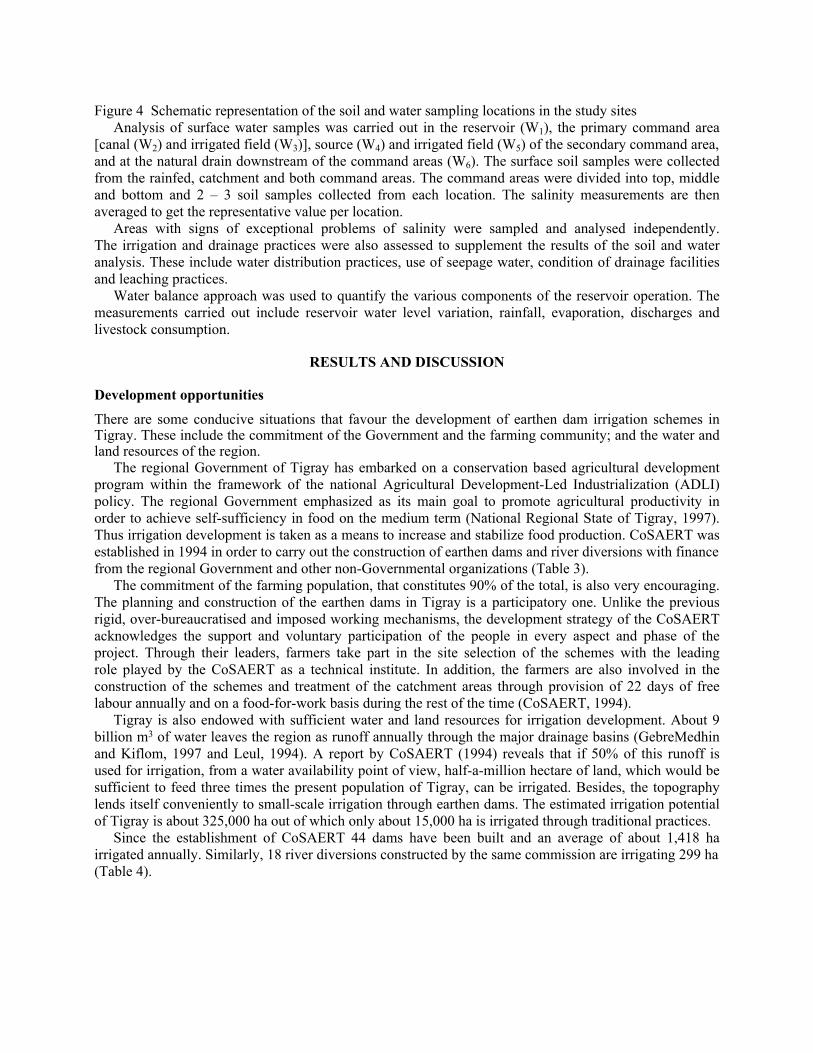
Figure 4 Schematic representation of the soil and water sampling locations in the study sitesAnalysis of surface water samples was carried out in the reservoir (W1), the primary command area
[canal (W2) and irrigated field (W3)], source (W4) and irrigated field (W5) of the secondary command area, and at the natural drain downstream of the command areas (W6). The surface soil samples were collected from the rainfed, catchment and both command areas. The command areas were divided into top, middle and bottom and 2 – 3 soil samples collected from each location. The salinity measurements are then averaged to get the representative value per location.
Areas with signs of exceptional problems of salinity were sampled and analysed independently. The irrigation and drainage practices were also assessed to supplement the results of the soil and water analysis. These include water distribution practices, use of seepage water, condition of drainage facilities and leaching practices.
Water balance approach was used to quantify the various components of the reservoir operation. The measurements carried out include reservoir water level variation, rainfall, evaporation, discharges and livestock consumption.
RESULTS AND DISCUSSION
Development opportunities
There are some conducive situations that favour the development of earthen dam irrigation schemes in Tigray. These include the commitment of the Government and the farming community; and the water and land resources of the region.
The regional Government of Tigray has embarked on a conservation based agricultural development program within the framework of the national Agricultural Development-Led Industrialization (ADLI) policy. The regional Government emphasized as its main goal to promote agricultural productivity in order to achieve self-sufficiency in food on the medium term (National Regional State of Tigray, 1997). Thus irrigation development is taken as a means to increase and stabilize food production. CoSAERT was established in 1994 in order to carry out the construction of earthen dams and river diversions with finance from the regional Government and other non-Governmental organizations (Table 3).
The commitment of the farming population, that constitutes 90% of the total, is also very encouraging. The planning and construction of the earthen dams in Tigray is a participatory one. Unlike the previous rigid, over-bureaucratised and imposed working mechanisms, the development strategy of the CoSAERT acknowledges the support and voluntary participation of the people in every aspect and phase of the project. Through their leaders, farmers take part in the site selection of the schemes with the leading role played by the CoSAERT as a technical institute. In addition, the farmers are also involved in the construction of the schemes and treatment of the catchment areas through provision of 22 days of free labour annually and on a food-for-work basis during the rest of the time (CoSAERT, 1994).
Tigray is also endowed with sufficient water and land resources for irrigation development. About 9 billion m3 of water leaves the region as runoff annually through the major drainage basins (GebreMedhin and Kiflom, 1997 and Leul, 1994). A report by CoSAERT (1994) reveals that if 50% of this runoff is used for irrigation, from a water availability point of view, half-a-million hectare of land, which would be sufficient to feed three times the present population of Tigray, can be irrigated. Besides, the topography lends itself conveniently to small-scale irrigation through earthen dams. The estimated irrigation potential of Tigray is about 325,000 ha out of which only about 15,000 ha is irrigated through traditional practices.
Since the establishment of CoSAERT 44 dams have been built and an average of about 1,418 ha irrigated annually. Similarly, 18 river diversions constructed by the same commission are irrigating 299 ha (Table 4).

Table 3 Role of various organisations in irrigation development (Girmay, et. al., 2000)Organisation RoleBureau of Agriculture and Natural Resources (BoANR)
- financing, material and technical assistance to develop schemes
- organise maintenance of canals and infrastructure- provide technical assistance and training on irrigation
agronomy and water management- encourage participation of farmers from within or outside
communities in catchment treatment- overall follow-up and evaluation of the performance of
irrigation systems- provide extension and technology support- encourage farmers to form Water Users Association- monitor environmental impact of irrigation
CoSAERT - construct irrigation schemes on selected sites (including site study, design, financing, etc.)
- provide maintenance services- training of users- monitoring the status of irrigation systems and environmental
effectsEthiopian Social Rehabilitation Fund (ESRDF)
- financing (co-financing) irrigation schemes
Relief society of Tigray (REST) - financing/constructing schemes- rehabilitation and upgrading of traditional sources
FARM Africa - financing schemesRedCross - financing schemes
Table 4 The status of irrigation development in Tigray (Girmay, et al., 2000) Zone Quantity of constructed
schemesArea irrigated
in ha Dams Diversions Dams River diversions Potential Actual ActualSouthern 33 16 2,163 925 249
Eastern 8 2 508 298 50
Central 2 - 194 128 -
Western 1 - 100 67 -
Total 44 18 2,965 1,418 299
Challenges to sustainability
Inadequate water management practices
Furrow irrigation is the common practice in the study areas. The preliminary design by the CoSAERT recommends a gross application of 2.5 l/s.ha regardless of the soil type, crop type, growth stage, and the change in potential evapotranspiration. The design assumes about 11 – 12 hours of irrigation per day and the recommended delivery time is about 2 hours for each holding of 0.2 ha. This assumes rotational distribution among plots and the whole discharge (2.5 l/s) is allocated to each plot during the delivery time. A total of 10 hours are required to irrigate all the plots within a hectare, and the remaining 1 – 2 hours are wasted during transfer of water from one plot to the other. This would provide 18,000 l of

irrigation water for each 0.2 ha plot, which is equivalent to applying a gross irrigation depth of 9 mm/d. However, the practice of the water distribution in Tigray in general and in the study areas in particular can be summarized as poorly organized. No consideration seems to be given to the recommended discharge and delivery time. Water is distributed among the farmers based on direct observations of the soil and plant conditions. The discharge going to an irrigation field is not monitored.
The existing practice in the two schemes is that the elected irrigation leader, locally known as “Abo Mai”, distributes water among the farmers. Water is distributed on a rotational basis. However, the individual farmer decides the delivery time. The 2 hour delivery time per 0.2 ha does not work and the common practice is that a farmer passes the water to the next user only after he/she feels that his/her farm is well irrigated. As a result, over-watering of the fields and subsequent wastage of irrigation water is a common practice. The interviews with the farmers revealed the same result. According to them the present arrangement creates a sense of competition and selfishness resulting in excessive water applications.
This inadequate water distribution practice is threatening the sustainability of the schemes. The effect of this mismanagement is two-fold. On the one hand, the excessive water application is causing irrigation water to be wasted and less area irrigated. On the other, it causes waterlogging and gradual accumulation of salts on the fields.
Salinity problems
The surface water quality analysis of the study sites is presented in Table 5 and Figure 5. The result clearly indicates that there is insignificant difference in reservoir and proper canal water qualities of the two study sites. The difference is more pronounced in the quality of the seepage water.
The reservoir water of the irrigation schemes is generally of good quality. The slight variation in reservoir salinity of the two study sites is possibly the result of the catchment soil salinity. As indicated in Table 5, soil salinity of the catchment area of Gumsalasa is slightly higher than that of Korir. It is therefore possible that the runoff from the Gumsalasa catchment carries more salt than Korir. The variation in salinity between the reservoir water and the irrigation water delivered through the proper canal infrastructures is very small in both study sites (Figure 5). Based on the result, the reservoir and proper canal irrigation water is categorized as suitable for irrigation of all soils and crop types.
The quality of the seepage water is poor compared to the proper canal water and varies greatly between locations in the irrigation scheme and irrigation seasons. As it can be seen from the results, the seepage water in the study sites is categorized as high saline and allows only the growth of salt tolerant crops. The source of the seepage water is mainly the reservoir. However, it is further supplemented by seepage from adjacent irrigation canals and drainage from irrigated fields. These contribute to the increase in salinity level due to the leaching effect. As a result, unlike the proper canal water, the quality of the seepage water shows a high variation and decreases from top to bottom (i.e., from the source to the irrigated field and the downstream area). The soil type plays a very important role in leaching. The irrigated areas of Gumsalasa are dominated by heavy soils (Vertisos) while Korir is dominated by medium soils (Cambisols). The leaching efficiency depends on the soil type and is generally higher in medium soils than heavy soils (Arar, 1971). This indicates that medium soils have higher capacity to leach the salt available in the soil profile. The infiltration analysis in the study sites have resulted in a basic infiltration rate of 8 mm/hr and 12 mm/hr for heavy soils and medium soils respectively. This might also contribute to the high leaching efficiency at Korir. As a result, Korir shows a higher salinity level of the seepage water.
The soil salinity analysis of the study sites reveals a very low electrical conductivity depicting the low level of salinity (Table 5, Figure 6 and Figure 7). Salinity is generally higher at Gumsalasa than Korir. In both schemes, salinity increases over the irrigation season due to the higher evapo(transpi)ration that leaves salt in the root zone of the crops. Salinity of the secondary command area is also higher than the primary. This is due to the high salinity of the seepage water used for irrigating the secondary command. Compared to the rainfed field, which is considered as a control, the salinity of the study sites have shown an increase of about 68% - 282% at Gumsalasa and 4% - 280% at Korir during the irrigation season. As it could be seen from the results, the soil salinity of the schemes drops immediately after the rainy season because of the leaching of the soluble salts. The soil salinity of the schemes generally commensurate with

the water quality trend.
Table 5 Irrigation water and surface soil (0 – 15 cm) quality of the study sites for the 2001/2002 irrigation season
Area Sample location Sample code1
Electrical conductivityin dS/m
Gumsalasa2 Korir2
April June Sept. April June Sept.Water analysisReservoir Reservoir W1 0.30 0.35 - 0.26 0.26 -Primary command Canal W2 0.30 0.35 - 0.26 0.27 - Irrigated field W3 0.32 0.36 - 0.27 0.29 -Secondary command Source W4 0.51 0.75 - 1.30 1.36 - Irrigated field W5 0.77 1.11 - 1.71 1.72 -Downstream Main drain W6 0.88 1.06 - 1.74 1.74 -Soil analysisRainfed Rainfed S1 0.22 0.22 0.22 0.24 0.24 0.24Catchment Catchment S2 0.44 0.44 0.44 0.29 0.29 0.29Primary command Top S3 0.49 0.64 0.19 0.25 0.33 0.15 Middle S4 0.45 0.49 0.3 0.39 0.43 0.24 Bottom S5 0.37 0.46 0.19 0.27 0.3 0.15Secondary command Top S6 0.50 0.68 0.28 0.91 0.49 0.2 Middle S7 0.53 0.65 0.29 - - - Bottom S8 0.73 0.84 0.26 0.36 0.32 -1 = W1 to W6 and S1 to S8 refer respectively to the surface water and soil sampling locations indicated in Figure 4. These codes
are used in Figure 5, Figure 6 and Figure 7;2 = April refers to the middle of the irrigation season, June to the late season and September end of the rainy season.
Previous studies (1997 – 1999) at Gumsalasa by Mitiku et al. (2002) have indicated soil salinity of 0.15, 0.29 and 0.15 dS/m for the top, middle and bottom of the command area respectively during the irrigation season. A comparison with the current results shows an increase of the salinity by a factor two or more. This indicates that salinity could be a major problem threatening the sustainability of land and water development in Tigray in general and the study sites in particular in the years to come.
00.20.40.60.8
11.21.41.61.8
2
W1 W2 W3 W4 W5 W6
Sample location
Elec
trica
l con
duct
ivity
(dS/
m)
Gumsalasa-April Gumsalasa-June Korir-April Korir-June

Figure 5 Salinity of irrigation water at different locations in the irrigation schemes
Figure 6 Soil salinity of different locations at Gumsalasa irrigation scheme
Figure 7 Soil salinity of different locations at Korir irrigation scheme
The results in Table 5 give the general condition of the salinity in the study sites. However, observation of the schemes shows the presence of high level of localized salinity especially at Gumsalasa. These localized saline areas were sampled and assessed separately. The results generally exhibit the presence of slightly saline to extremely saline conditions (Figure 8 and Figure 9). The first 9 samples were taken from the primary command area while the rest belong to the secondary. The peak value in Figure 8 corresponds
00.20.40.60.8
11.21.41.61.8
2
S1 S2 S3 S4 S5 S6 S7 S8
Sample location
Elec
trica
l con
duct
ivity
(dS/
m)
April June September
00.20.40.60.8
11.21.41.61.8
2
S1 S2 S3 S4 S5 S6 S8
Sample location
Elec
trica
l con
duct
ivity
(dS/
m)
April June September

to the field shown in Figure 9. This field is at the moment almost abandoned from agriculture.
Figure 8 Localized soil salinity at Gumsalasa at different locations
Figure 9 A salinized irrigated field at Gumsalasa
Evaporation from the reservoir
The main rainfall and evaporation events of the study sites are summarized in Table 6. The results clearly indicate that the rainfall and evaporation variation between the study sites is very small. The situation within a site is however different. The daily rainfall ranges from 0 – 48 mm at Gumsalasa and 0 – 56 mm at Korir. Similarly, the daily evaporation ranges from 2.1 – 10.5 mm at Gumsalasa and 1.4 – 9.1 mm at
02468
1012141618202224262830
1 2 3 4 5 6 7 8 9 10 11 12 13 14 15
Sample location
Elec
trica
l con
duct
ivity
(dS/
m)

Korir. Taking into account the potential impact a small variation in rainfall or evaporation may have on crop growth, the standard deviation of rainfall is relatively high in both sites.
Table 6 Summary of the rainfall and evaporation events at the study sites during April – September, 2002Rainfall/evaporation Gumsalasa Korir Rainfall Evaporation Rainfall EvaporationTotal (mm) 283.5 934.2 278.1 886.3Rainfall and evaporation days 31 183 27 183Average (mm/d) 9.1 5.1 10.3 4.8Minimum (mm/d) - 2.1 - 1.4Maximum (mm/d) 48 10.5 56 9.1Standard deviation (mm/d) 5.2 2.2 5.7 1.9
The results of the reservoir water balance analysis are indicated in Table 7. The table reveals that the
volume of the reservoir at Gumsalasa decreased about 432,000 m3 over the observation period in relation
to the volume at the beginning of the data collection. Korir on the other hand decreased only 254,000 m3. The higher decrease at Gumsalasa is due to the higher evaporation rate and the poorer rainfall condition during the observation period.
Table 7 Reservoir water balance of the study sites during 20021
Water balance variable Gumsalasa Korir in 103 m3 in % in 103 m3 in %Outflow (-)629.6 (-)577.1
Reservoir evaporation (-)293.9 46.7 (-)211.1 36.6Canal discharge (-)253.1 40.2 (-)345.4 59.8Seepage discharge (-)36.3 5.8 - -Livestock consumption (-)2.2 0.3 (-)5 0.9Groundwater recharge (-)44.1 7.0 (-)15.6 2.7
Inflow (+)197.1 (+)323.1 Change in reservoir water volume (-)432.5 (-)254
Some basic dataTotal number of record days 105 128 Total number of irrigation days 53 107 Total number of rainfall days within the observation period 13 17 Total rainfall (mm) with in the observation period 102 170 1 = the periods considered are April 02 – July 29, 2002 for Gumsalasa and April 04 – August 09, 2002 for Korir(-) = indicates withdrawal or decrease(+) = indicates inflow or increase
Reservoir evaporation, canal discharge, groundwater recharge, seepage flow and livestock consumption at Gumsalasa constitute 46.7%, 40.2%, 7%, 5.8% and 0.3% of the decrease in the reservoir water volume respectively. On the other hand, canal discharge, reservoir evaporation, groundwater recharge and livestock consumption at Korir contribute 59.8%, 36.6%, 2.7% and 0.9% of the decrease respectively. The results clearly indicate that a lot part of the reservoir water is lost by evaporation without being used for irrigation.
CONCLUSIONS AND RECOMMENDATIONS
The results of the water quality analysis show that the reservoir and proper canal irrigation water is suitable for irrigation of all soils and crops. On the other hand, the seepage water is highly saline and allows only the growth of salt tolerant crops.
The surface soil salinity in both sites was generally found to have low electrical conductivity indicating

the low level of salinity. Salinity is generally higher at Gumsalasa than Korir. In both schemes, salinity increases over the irrigation season due to the higher evapo(transpi)ration that leaves salt in the root zone of the crops. Salinity of the secondary command area is also higher than the primary. The soil salinity of the schemes generally commensurates with the water quality trend. A comparison of the present salinity with previous studies shows an increase of the salinity by a factor two or more. This indicates that salinity could be a major problem threatening the sustainability of land and water development in Tigray in general and the study sites in particular in the years to come.
The main reasons of salinity development in the study sites include inadequate water management, inadequate leaching and drainage facility, inappropriate irrigation timing, use of seepage water for irrigation and lack of salinity monitoring.
In Tigray in general and in the study sites in particular, irrigation scheduling is not based on the crop water and leaching requirements. Water is distributed based on direct observation of soil and plant conditions. The discharge going to the irrigated fields and the delivery time are not monitored. As a result, over-watering of fields and subsequent wastage of irrigation water is common. The schemes are however not equipped with well designed drainage ditches to remove the excess water and excess irrigation water from one field is mostly transferred to the next. Owing to the semi-arid nature of Tigray, the inadequate water management coupled to the poor drainage facility would obviously aggravate the salinity situation.
According to the farmers the salinity problem is further aggravated due to the change in the irrigation time. During the initial phase of the development, irrigation water was available only during the early morning, the late afternoon and the early evening hours. At the moment, irrigation water is available the whole day including the hot hours that would cause high evapotranspiration leaving the salt on the surface of the soil.
The other factor aggravating the salinity problem is the use of seepage water for irrigation with no attention given to its quality. The assessment in the study sites has clearly shown a very high salinity of the seepage water compared to the reservoir and proper canal system. This has in turn caused higher soil salinity in the secondary command areas compared to the primary.
The last but most important factor contributing to the worsening of salinity is the lack of monitoring of the situation. The least that could be done is to carry out regular physical observations (such as white crust formation) for incidences of salinity and to take mitigation measures in time. The increasing trend of the salinity problems in the schemes, the loss of a farmland at Gumsalasa and the development of localized high salinity areas indicate the lack of it.
Irrigation in Tigray usually starts towards the end of December and extends till June. This period however coincides with a high amount of evaporation rate. As a result, a considerable amount of the reservoir water is evaporated back to the atmosphere without being used for irrigation.
The regional Government in general and BoANR and CoSAERT in particular should therefore devise and implement proper strategies in order to operate the irrigation schemes more efficiently and sustainably. Primarily, proper water management practices, and salinity monitoring and prevention mechanisms should be introduced to all irrigation schemes. Introduction of a better operational plan to maximize the utilization efficiency of the reservoir water should also be given due attention. This may include:- starting irrigation as early as possible during the low evaporation rate season;- irrigating short duration crops so that the number of evaporation days will be reduced and more area
irrigated.The present study in the two irrigation schemes will support the effort through the development of an
integrated approach for sustainable development and management of irrigated lands in Tigray.
REFERENCES
Bos, M. G. and Wolters W., (1994). Influences of Irrigation on Drainage. In: Ritzema, H. P. (ed.): Drainage Principles and Applications, 2nd ed. International Institute for Land Reclamation and Improvement. Publ. no. 16. Wageningen, The Netherlands.

CoSAERT (1994). Sustainable Agriculture and Environmental Rehabilitation in Tigray: Basic Text. Mekelle, Tigray.Elahi, A. (1992). Irrigation Development in Sub-Saharan Africa: Future Perspectives. In: Moigne, G. L. et al. (eds.): Developing and Improving Irrigation and Drainage Systems: Selected Papers from World Bank Seminars. World Bank Technical Paper Number 178. The World Bank. Washington, D.C., USA.GebreMedhin, B. and Kiflom, B. (1997). Progress, Potentials and Problems of Small Scale Irrigation Development in Tigray. Paper Presented on the Regional Workshop on Small-Scale Irrigation Development in Tigray. Mekelle, Ethiopia. Girmay T., Mitiku H., Berhanu G., Pender J., and Eyasu Y. (2000). Small Scale Irrigation in Tigray: Management and Institutional Considerations. Paper Presented at Seminar on Policies for Sustainable Land Management in the Highlands of Ethiopia. ILRI. Addis Ababa, Ethiopia.Hillel, D. (1997). Small-Scale Irrigation for Arid Zones: Principles and Options. FAO. Rome, Italy.Leul, K. (1994). Need, Potentials and Limitations for Irrigation Development in Tigray. Commission for Sustainable Agriculture and Environmental Rehabilitation in Tigray. Mekelle, Ethiopia.National Regional State of Tigray (1997). Integrated Food Security Program for Drought Prone Areas (IFSP-DPA) 1998 – 2002: Main Summary Document. Mekelle, Ethiopia.NEDECO (1997). Tekeze River Basin Integrated Development Master Plan. A Report by The Netherlands Engineering Consultants and Ethiopian Ministry of Water Resources. Quoted in Mintesinot, B. (2002): Assessment and Optimization of Traditional Vertisol Irrigation in Northern Ethiopia: A case study at Gumsalasa microdam using Maize as an indicator crop. PhD dissertation. pp 13. Faculty of Agricultural and Biological Sciences, Ghent University. Ghent, Belgium.Mitiku, H., Tedros, A., Witten, K., Mekonnen, Y., Byass, P., and Lindsay, P. (2002). Environmental and Social Aspects of Earth Dam Building in the Semi-Arid Areas of Tigray, Ethiopia. Paper Presented at the 6th Symposium on Sustainable Water Resources Development. 8 - 9 July 2002, Arba Minch Water Technology Institute, Arba Minch, Ethiopia.Webb P. and Braun J. V. (1994). Famine and Food Security in Ethiopia: Lessons for Africa. John Wiley and Sons Ltd. Chichetser, England.Solomon, H. (1999). Analysis of Irrigation Water Management Practices and Strategies in Betmera - Hiwane, Tigray, Ethiopia. MSc Thesis. Wageningen Agricultural University. Wageningen, The Netherlands.