earth, wind, sea, and sky - soars.ucar.edu 2009.pdf · soars and resess protégé abstracts 2009...
TRANSCRIPT

SOARS and RESESS Protégé Abstracts 2009
Earth, Wind, Sea, and SkyR E S E A R C H M E N T O R I N G C O M M U N I T Y

R E S E A R C H M E N T O R I N G C O M M U N I T Y
SOARS protégé Karl Clarke with his science mentors Kirsten
Meymaris and Sandra Henderson. As his summer project,
Karl developed a citizen science campaign to engage the
public in collecting tree phenological data.

As RESESS completes five years and SOARS enters its15th year, it is an excellent time to think about the meaningand impact of diversity. In Science, Technology, Engineering and Math, diversity is a common shorthand for theparticipation of people from historically under-represented groups, including Latinos, American Indians and AlaskaNatives, and African-Americans. The National Science Foundation and others have invested heavily in SOARS andRESESS to increase participation of students from these groups in atmospheric and solid Earth geosciences.
This investment is based, in part, on the idea that the new perspectives from a more diverse community ofscientists will improve science. The abstracts in this volume provide direct evidence that this is true in the formof our protégés’ immediate contributions to their disciplines.
There is also a more subtle and long-term improvement. As newcomers, our protégés remind us that scientists, likeall people, are animated by personal values and relationships. Introducing more diversity has introducednew values and new relationships to the atmospheric and solid Earth geosciences. For example,our protégés have helped our sciences reach out to new communities. UCAR’s recent research on climatechange on tribal lands, for example, is a direct outgrowth of questions and suggestions from SOARS protégés.This last summer, our protégés voluntarily put together hands-on science activities for elementary-aged childrenin two low-income housing communities, and RESESS has added an outreach component to its newly fundedfive-year plan. In the same way that greater biodiversity enhances an ecosystem’s resilience, this increaseddiversity of relationships and values will enhance our sciences’ relevance and resilience.
The challenge of the next five years, for SOARS and RESESS, is to continue to learn, to expand our understandingof diversity, and to leverage diversity to improve our sciences and their connections to the increasingly diverseworld. Given the evidence of the last few years, we are optimistic and excited. Read on, and you will be too…
Director and Principal Investigator, SOARS RAJUL PANDYA Director of Community Building Program, UCAR
Director and Principal Investigator, RESESS SUSAN ERIKSSON Director of Education and Outreach, UNAVCO
ARE DEDICATED TO BROADENING PARTICIPATION IN GEOSCIENCE THROUGH RESEARCH, MENTORING, AND COMMUNITY.
THIS ABSTRACT COLLECTION REPRESENTS THE RESEARCH PERFORMED BY OUR PROTÉGÉS IN THE SUMMER OF 2009.
SOARS AND RESESS

i
SOARS Protégé Abstracts 2009
Poleward moisture transport by a recurving tropical cyclone and its effect on midlatitudeprecipitation
Graylen Boone
Modeling wildfires and analyzing emissionsMarques Cameron
Decrease in the summer rainfall of the southern United States coast and the Caribbean dueto climate change
Roque V. Céspedes
A citizen science campaign encouraging urban forest professionals to engage the public in thecollection of tree phenological data
Karl C. Clarke
Orographic effects on rainfall induced by the passage of tropical cyclones over mountainousislands. Part 1: The effect of cloud microphysics
Ian C. Colón-Pagán
The effects of cloud cover on photosynthesis in a sub-alpine forest ecosystem focusing onNiwot Ridge, Colorado
Raymond Detweiler
Reconsidering the role of Rossby waves in the Madden-Julian Oscillation (MJO)Alex O. Gonzalez
Comparison of ABL heights derived from COSMIC RO and the RUC Model Sharome Goode
Evaluating the effects of latent heating in tropical cyclone Sinlaku's extratropical transitionusing ARW and energetics analysis
Michael K. Hernandez
Eliassen-Palm fluxes of the diurnal tides from Whole Atmosphere Community Climate Model-Extended (WACCM-X)
McArthur Jones
A higher order tracer transport scheme for icosahedral hexagonal grids Maximo Q. Menchaca
Climatology of precipitation in West Africa through observational studies Imani Morris
The effects of convective clouds on vertical scalar transport using a numerically simulatedflow field
Nicole Ngo
01
02
03
04
05
06
07
08
09
10
11
12
13
Table of Contents

ii
14
15
16
17
18
19
20
21
22
23
24
Lightning activity in Atlantic tropical cyclones: Using the Long-range Lightning Detection Network (LLDN)
Lumari Pardo-Rodriguez
Comparison of the VORTRAC retrieved structure of Hurricane Danny (1997) to prior analyses Matthew Paulus
Different ways of knowing: exploring traditional ecological knowledge and climate modelingfor the Turtle Mountains, North Dakota
Dana Pauzauskie
Flash floods: a spatial and temporal analysis. A case study of the March 2008 flash floods insouthwestern Missouri
Daniel A. Pollak
The relationship between sea breezes and rainfall along western Mexico during the NorthAmerican Monsoon
Vanessa M. Vincente
Re-examination of Northeast United States drought trends and characteristicsMarcus D. Walter
Model analysis of 27-day solar induced variability of chemical dynamics in the equatorialupper and middle atmosphere
Anastasia G. Yanchilina
RESESS Protégé Abstracts 2009
Understanding past conditions of early Earth using trace metals in sulfide mineralsJohn J. Braswell
Geochemical evidence for flat-slab subduction in Cenozoic western North AmericaKatherine F. Fornash
Shear wave splitting analysis from newly-installed seismic stations in AntarcticaStephen Hernandez
A study of gully erosion dynamics and processes at Bijou Creek, Colorado, using laser scanningand aerial photography
Fernando A. Martínez Torres
Earth,Wind,Sea,andSky

Graylen Boone
Poleward moisture transport by a recurving tropical cyclone and its effect
on midlatitude precipitation
[ ]
1st-year Protégé
SeniorNorth Carolina State UniversityMeteorology
Mentors
Science ResearchChris Davis – NCAR Russ Schumacher – NCAR
Writing & CommunicationNicole Gordon – UCAR
CommunityMarina LaGrave – UCAR E&O
PeerMcArthur Jones Jr. – SOARS Protégé
2009 SOARS Abstracts Significant Opportunities in Atmospheric Research and Science01
Tropical cyclones (TCs) can cause extensive damage due to strong winds, storm surge, and rainfall. Thesesystems are capable of torrential downpours, producing flooding and forceful winds that damage buildings.Past studies and forecasts have focused on the immediate impacts surrounding the area of a TC; however,few studies have examined the effects that TCs have away from their immediate areas. The focus of thisstudy is to examine the moisture properties of Hurricane Ike, the properties of the storm’s pre-existingconditions, and how Ike contributed to the intensification of precipitation poleward from itself. Version 3.1of the Advanced Research version of the Weather Research and Forecasting model (WRF-ARW) wasinitialized to simulate Hurricane Ike on 13 September 2008 at 0000 UTC and on12 September 2008 at1200 UTC, with both ending on16 September at 0000 UTC. The WRF-ARW model was able to replicatethe occurrence of Hurricane Ike in the real atmosphere. Comparisons between both simulations andobservations illustrated differences in reference to each other, but the general structure of the precipitation,water vapor, and temperature fields were similar. To test the sensitivity of rainfall accumulations to thepresence of Ike, another simulation was run with Ike removed at the initialization of the second simulation.Initial analysis of the Ike removal scheme revealed a decrease in the moisture parameters; however, furtherstudy is needed to quantify Ike’s impact. This study offers insight into forecasting issues with areas polewardof tropical cyclones such as Hurricane Ike.
Figure 1
12-hour precipitation totals from 13 September 2008 at 1200 UTC. Observations on the left, first model simulation in the middle, secondmodel simulation on the right. This image is used to compare the observations with the model simulations to determine which simulationbest replicates the observations.

Marques Cameron
Modeling wildfires and analyzing emissions
[ ]
2nd-year Protégé
Norfolk State UniversityBS in Physics, 2009
Mentors
Science ResearchJanice Coen – NCAR
Writing & CommunicationLesley Smith – NCAR
2009 SOARS Abstracts Significant Opportunities in Atmospheric Research and Science 02
The new atmospheric prediction model, the Weather Research and Forecasting Model version 3.1 (WRF)coupled with the empirical fire spread model was used to model wildfire behavior and analyze emissions.Modeling wildfires includes knowing the spread rate and where a fire will propagate based on environmentalconditions. These play a key role in fire suppression efforts. The products and emissions of wildfires contributeto the weather and the air quality. WRF-Fire is a two-way coupled module. While providing feedback tothe fire directing where it travels and controlling the spread rate, the fire module provides feedback to theatmosphere creating its own weather. Using the fire module WRF-Fire, we analyze the emissions from astandard model (the control) with a fuel category of short grass, fuel moisture level of 8 percent, windspeed of 2.5 m/s, and fuel loading of 0.166 kg/m2 as shown in the figure. The fuel moisture, wind speed,fuel loading, and fuel category were changed, then the emissions were compared to the standard model.We found that heat flux is directly proportional to fuel moisture level and fuel loading. Fire spread rate isdirectly proportional to the wind speed. Using a new fire module we were able to reproduce the shapeof naturally occurring fires and relate how they depend on environmental conditions. The results gainedfrom this research can be used as verification data for future models.
Figure 1
Contours of heat flux (W/m2) from the surface fire in the standard model.

Roque V.Céspedes
Decrease in the summer rainfall of the southern United States coast and the Caribbean due to climate change
[ ]
2nd-year Protégé
Graduate StudentUniversity of MiamiMeteorology andPhysical Oceanography
Mentors
Science ResearchGreg Holland – NCARLinda Mearns – NCAR
Writing & CommunicationRichard Loft – NCAR
2009 SOARS Abstracts Significant Opportunities in Atmospheric Research and Science03
Comparison and contrast of simulations from the North American Regional Climate Change AssessmentProgram (NARCCAP) Geophysical Fluid Dynamics Laboratory (GFDL) AM2.1 timeslice experiment weremade for current climate (1971-2000) and future climate (2041-2070) to assess how May through Octoberaccumulated rainfall is responding to climate change along the southern United States coast and in theCaribbean under the Intergovernmental Panel on Climate Change (IPCC) A2 emissions scenario (a scenarioof relatively high emissions increase). The simulations were done on a global domain at a horizontalresolution of roughly 50 km.
There is an overall decrease of about 200 mm (30 percent) in May through October rainfall in the regionof the southern United States coast and the Caribbean. The absolute decrease is larger in the regions thatreceive the most rain. Proportionally, however, the decrease is larger in the regions that receive the leastrain. For the subregion of Florida, rainfall time series indicate a delay of the region’s late wet period in thefuture climate. This shift needs to be examined further to determine its significance and the underlyingphysical processes. Florida also received less rainfall in future climate, but the standard deviation of theearly and late wet periods was found to be larger. This is in accord with the findings of the IPCC of anincrease in global extremes as a result of climate change. In a future study, the time series for four othersubregions will be analyzed.
Figure 1
GFDL AM2.1 percent changes in May through October accumulated rainfall between 1971-2000 and 2041-2070.
Percent Change in the GFDL AM2.1 Average May–October Caribbean Accumulated RainfallFuture Climate minus Current Climate (%)

Karl C.Clarke
A citizen science campaign encouragingurban forest professionals to
engage the public in the collection of tree phenological data
[ ]
2nd-year Protégé
Graduate StudentOregon State University
Atmospheric Sciences
Mentors
Science ResearchSandra Henderson
– UCAR E&OKirsten Meymaris
– UCAR E&ODudley Hartel
– US Forest Service
Writing & CommunicationSusan Foster – UCAR E&O
ComputingDennis Ward – UCAR E&O
2009 SOARS Abstracts Significant Opportunities in Atmospheric Research and Science 04
There are growing concerns among leading national and local organizations about American scientific literacy,fundamental understanding of science, and public appreciation for the value of scientific research. Theseorganizations, including the University Corporation for Atmospheric Research, have been at the forefront inaddressing these concerns. In an effort to improve scientific literacy, research conducted by Sam Droege, amongothers, suggested using citizen science and public participation as instrumental methods to engage thepublic. Urban Tree Phenology (UTP), a project of Project BudBurst and the USDA Forest Service, is one suchcitizen science program that sought to engage the public, including the professionals and amateurs amongthem, in collecting urban tree phenophase data. UTP participants monitored and reported the stages ofphenological events, such as First Leaf and Leaf Fall, of 24 native and cultivated urban tree species, usingthe steps shown in Figure1. Data collected will support the long-term research of plant ecology, climatechange, public health, the effect of urban heat islands on tree physiology, and urban tree management.UTP, using the architectures of online learning, has developed two instructional tutorials to assist datacollection (Phase1). The instructional tutorials were published online, in print and PowerPoint formats, atwww.UrbanTree Phenology.com. By completing these tutorials, participants will gain the skills necessaryto provide urban tree phenological data to national research databases via the Internet. Phase 2 will testand review the instructional materials developed, and in Phase 3, the administrators of UTP will distributepromotional materials to national research organizations and to participants of the Project BudBurstnational citizen science campaign.
Figure 1
An overview of the phenological investigation. By completing these steps required for data collection,UTP participants will gain the skills necessary to submit quality data to support long-term research ofclimate change, urban tree management, urban heat islands, and public health.

Ian C.Colon-Pagan
Orographic effects on rainfall induced by the passage of tropical cyclones over
mountainous islands. Part I: The effect of cloud microphysics
[ ]
3rd-year Protégé
Graduate StudentNorth Carolina A&T StateUniversityPhysics
Mentors
Science ResearchBill Kuo – NCAR/COSMIC Bill Schreiner – COSMIC
Writing & CommunicationSara Frank Bristow– COSMIC
ComputingWei Wang – NCAR
2009 SOARS Abstracts Significant Opportunities in Atmospheric Research and Science05
The passage of a tropical cyclone (TC) over a mesoscale mountainous island, such as Puerto Rico, often bringsheavy rainfall that produces flooding and landslides. Factors that affect orographic rainfall in this regionare not well understood. This study investigates the impact of microphysics (MP) schemes in TC simulationsusing the numerical mesoscale Advanced Research version of the Weather Research and Forecasting model(ARW) model, particularly for Hurricane Jeanne’s (2004) passage over the island. Sensitivity experimentsusing four different MP schemes were performed. Each experiment was represented by a single MPscheme, i.e., WSM 5-Class (EXP1), Eta Ferrier Microphysics (EXP2), WSM 6-Class (EXP3), and ThompsonGraupel scheme (EXP4).
Results show strong consistency for cyclonic track among experiments, with landfall about four hours aheadof observations. Rainfall distribution was well represented, with maxima on the southeastern and highermountain regions. EXP3 produced the best simulation in terms of rainfall distribution and high rainfall peaklocations. However, there were sizeable differences between the model cyclone’s wind intensity andminimum sea-level pressure at landfall and those of the observed storm. EXP2 and EXP3 produced amore realistic sea-level pressure and sustained wind speed. In conclusion, the simulation using the WSM6-Class scheme (EXP3) was strongly comparable with observations, and is the best choice for furtherinvestigations. Future study will examine some control parameters and common ingredients, such asConvective Available Potential Energy (CAPE), Precipitation Efficiency (E), and the impact of mountainheight variations, to help understand the processes associated with orographic precipitation induced bythe passage of TCs.
Figure 1
Hurricane Jeanne’s track for observations and model experiments. Tracks represent a 30-hour period starting on September 15th at 0000 Z.

Raymond Detweiler
The effects of cloud cover on photosynthesisin a sub-alpine forest ecosystem
focusing on Niwot Ridge,Colorado
[ ]
1st-year Protégé
SeniorBall State University
Chemistry
Mentors
Science ResearchLynette Laffea – NCAR
Writing & CommunicationBob Henson
– UCAR Communications
ComputingJoe VanAndel – NCAR
CommunityBob Roesch – UCAR
PeerIan C. Colón-Pagán
– SOARS Protégé
2009 SOARS Abstracts Significant Opportunities in Atmospheric Research and Science 06
Climate change is an increasing concern worldwide. In the Northern Hemisphere, sub-alpine ecosystemsserve as a major carbon sink. Recent research has shown that these ecosystems are particularly vulnerableto changes in climate. Even small changes in water availability and temperature – despite longer growingseason length – have been shown to cause significant reductions in the ecosystem’s ability to sequestercarbon. In this study, sensors measuring photosynthetically active radiation, air temperature, relativehumidity, sap flow, soil moisture, and soil temperature were deployed to a high-altitude sub-alpine forestecosystem on Niwot Ridge near Nederland, Colorado, to collect data at a high spatial and temporal density.Using the data obtained from these sensors, preliminary observations were made concerning the effectsof cloud cover on CO2 sequestration. Data from three representative days in July were analyzed to observedifferences among sunny, cloudy, and partly cloudy days. The carbon uptake appeared to be greatest onthe sunny day, less on the partly cloudy day, and even less on the overcast day. This is contrary to existingresearch, which suggests that cloudy and partly cloudy days should increase sequestration because lightis distributed more evenly and temperatures keep exchange passages within the leaf open. These resultsmay be due to a number of factors, such as the atypical rains that occurred this season and decreasedtemperatures overall. Reviewing additional data collected this summer and in past years, along with datacollected this year, should further improve understanding of the effects of climate change in sub-alpine forests.
Figure 1
Photosynthetically Active Radiation (PAR) vs. time on a representative clear, cloudy, and partly cloudy day.

Alex O.Gonzalez
Reconsidering the role of Rossby waves in the Madden-Julian Oscillation (MJO)
[ ]
3rd-year Protégé
Graduate StudentColorado State UniversityAtmospheric Science
Mentors
Science ResearchBrian Mapes– University of MiamiWayne Schubert– Colorado State University
Writing & CommunicationCindy Worster – NCAR
2009 SOARS Abstracts Significant Opportunities in Atmospheric Research and Science07
"Truncated" model total wave geopotential (m) and wind anomaly (m/s)
0o 40oE 80oE 120oE 160oE
20oS
10oS
0o
10oN
20oN
Many studies attempt to gain insight into atmospheric and oceanic phenomena in the tropics using the Gill(1980) model because it simplifies the equatorial wave spectrum by making the“longwave approximation.”How can the equatorial wave spectrum be simplified to reproduce the waves important for theMadden-Julian Oscillation. The MJO is the main intraseasonal fluctuation in tropical weather, modulatingprecipitation, pressure and winds all year. Global Climate Models (GCMs) do not simulate the MJO well duein part to a lack of physical understanding. To improve physical understanding, the dynamical aspects of theMJO were investigated in a simple model framework. Steady-state anomalies of winds and geopotentialheights, as well as momentum fluxes in both a “filtered”and “truncated”shallow-water model on theequatorial beta-plane were compared to those in a “complete”shallow-water model on the equatorialbeta-plane that represented all waves. The“filtered”model produced all Rossby and Kelvin waves, andthe“truncated”model produced all Kelvin waves and only long Rossby waves. Three scenarios of diabaticheating were analyzed. Winds, geopotential heights, and momentum fluxes were generally weaker, andmaximum values were less concentrated in the“filtered”and “truncated”models. Therefore, short Rossbywaves must be well represented in idealized models of the MJO, and inertia-gravity waves may also playan important role. Idealized models such as the one used here can help improve physical understandingof the MJO, and GCMs can be interpreted and revised so that the MJO is simulated with more accuracy.
Figure 1
The wind and geopotential height anomalies for the “truncated”model in the eastward propagating heatingscenario. Winds are in vector form, with a minimum of 0.01 m/s and a maximum of 4.93 m/s. Geopotentialheights are contoured, with a maximum of -11.12 mand a minimum of -166.2 m. The contour interval is 20 m. The diabatic heating is also contoured.

Sharome Goode
Comparison of ABL heights derived fromCOSMIC RO and the RUC Model
[ ]
1st-year Protégé
SeniorUniversity of Central Oklahoma
Chemistry
Mentors
Science ResearchLidia Cucurrull – NOAA
Sergey Sokolovskiy– COSMIC
Writing & CommunicationBrian Bevirt – NCAR
ComputingDoug Hunt – COSMIC
CommunityJeff Weber – Unidata
PeerDana Pauzauskie – SOARS Protégé
2009 SOARS Abstracts Significant Opportunities in Atmospheric Research and Science 08
This study investigates two approaches for determining the height of the Atmospheric Boundary Layer(ABL): analyzing radio occultation (RO) observations and using NOAA’s Rapid Update Cycle (RUC) model.The first approach determines the ABL height by examining radio wave bending angle profiles from theConstellation Observing System for Meteorology, Ionosphere and Climate (COSMIC). The second approachexamines the vertical structure of meteorological parameters reproduced by the RUC model. This studycompares the values of collocated ABL heights obtained by each approach over North America and adjacentoceans for both summer and winter months to determine seasonal variations. Significant differencesin the ABL heights were found for the two approaches, as well as seasonal variations. High-precisioncomparisons were not produced between RUC and COSMIC ABL heights, because this ABL analysis didnot include RUC model data for water vapor and turbulence. To perform a better comparison, the RUCABL should be better characterized by accounting for water vapor and turbulent mixing.
Figure 1
This image shows bending angle profiles received from COSMIC.
A shows a profile with a sharp ABL top
B shows a smooth profile with no sharp top
C shows a profile that does not have a significantly sharp ABL top but has fluctuation which may be due to other factors such as multiple layers, convection, or noise.

Michael K.Hernandez
Evaluating the effects of latent heating intropical cyclone Sinlaku’s extratropical
transition using ARW and energetics analysis
[ ]
3rd-year Protégé
Graduate StudentThe Pennsylvania State UniversityMeteorology
Mentors
Science ResearchBill Kuo – NCAR/COSMIC
Writing & CommunicationEmily Laidlaw – NCAR
2009 SOARS Abstracts Significant Opportunities in Atmospheric Research and Science09
Of all the Tropical Cyclones (TC) that occur worldwide, 42% of the North Atlantic and 27% of the westernNorth Pacific storms undergo Extratropical Transition (ET) into Extratropical Cyclones (EC). ECare asymmetriccold-core systems as opposed to their warm-core predecessors, and their radii of gale-force winds (17ms-1)may increase by a factor of two to three times their original radii. This expansion of the gale-force windscan cause a significant amount of damage. In addition, these ET can trigger and amplify upper atmosphericwaves that indirectly lead to the generation of other powerful storms across the world, which makes itimperative to study the dynamics and energetics involved with the ET. The ET of TC Sinlaku (2008), withthe aid of a 500-mb shortwave, was well observed through an international field campaign,THORPEXPacific-Asian Regional Campaign (T-PARC). To understand the effects of latent heating when Sinlaku tran-sitioned,this study followed techniques similar to Kuo et al. (1990). Two different sets of simulations usingthe Weather Research and Forecasting (WRF) model with the Advanced Research dynamical core wereconducted, involving a full set of physics and fake dry physics (neglecting latent heating). This studyexamined the evolution of horizontal kinetic energy and its components to examine the impact of latentheating on the energetics of the ET processes. Results drawn from both simulations suggest that latentheating is crucial for the maintenance of the TC and the 500 mb trough, and for the ET process. This isclearly reflected by the significant differences in the kinetic energy of the two WRF-ARW simulations withand without latent heating.
Figure 1
A comparison of tracks for TC Sinlaku’sbest track (circles), full physics simulation(diamonds), and adiabatic simulation (triangles).

McArthur Jones, Jr.
Eliassen-Palm fluxes of the diurnal tidesfrom the Whole Atmosphere Community
Climate Model-Extended (WACCM-X)
[ ]
3rd-year Protégé
Senior Millersville University
Meteorology
Mentors
Science ResearchHanli Liu – NCAR
Arthur Richmond – NCAR
Writing & CommunicationJamaica Jones
– NCAR Library
ComputingJoe McInerney – NCAR
2009 SOARS Abstracts Significant Opportunities in Atmospheric Research and Science 10
Through perturbation interactions with the zonal mean flow, the migrating diurnal tide and the diurnaleastward 3 (DE3) tide are fundamental to a holistic understanding of the atmospheric dynamics at thealtitudes of the mesosphere and lower thermosphere (MLT) and the ionosphere. Previous tidal studies havenoted the semiannual variability associated with the migrating diurnal tide and the DE3 tide, whichmaximize around equinox and minimize around solstice. Seasonally varying source and dissipation regionsand/or wind structures are believed to cause the differences in the maximum amplitudes experiencedbetween the two equinoxes. Using monthly averaged output from the Whole Atmosphere CommunityClimate Model-Extended (WACCM-X), this study is among the first to apply this model to a diagnosticexamination of the sources and sinks of tidal momentum and document the associated seasonal variability.From the averaged amplitudes obtained during March and September, the WACCM-X replicates theobserved seasonal variability associated with the migrating diurnal tide and the DE3 tide. Calculating thedivergence of the Eliassen-Palm Flux (EP Flux) for the migrating diurnal tide revealed robust seasonalvariation that may be linked to differential solar heating of ozone in the stratosphere. Seasonal variationin the tropospheric sources of the DE3 tidal momentum alone does not appear to explain the semiannualvariability observed in the tidal amplitudes. This study provides a better understanding of the seasonalvariation in the generation and dissipation mechanisms of the migrating diurnal tide and the DE3 tide.
Figure 1
The migrating diurnal tide reconstructed U-Wind Field from March 21 at 0˚ longitude and 0 local time, with wind contours at 5 m/s.

Maximo Q.Menchaca
A higher order tracer transport schemefor icosahedral hexagonal grids
[ ]
1st-year Protégé
Junior University of Illinois atUrbana-Champaign Physics
Mentors
Science ResearchWilliam Skamarock – NCAR
Writing & CommunicationArlene Laing – NCAR
CommunityKate Pohl – UCAR
PeerAlex O. Gonzalez– SOARS Protégé
2009 SOARS Abstracts Significant Opportunities in Atmospheric Research and Science11
Weather and climate models require both efficient and accurate numerical methods to simulate tracer(e.g., moisture, salinity) advection. The distribution of the tracer used in transport equations is approximatedby a Taylor expansion. A method was developed that builds on a simpler, second-order convergent methodnamed Miura’s Scheme. This original method describes tracer distributions with a first-order Taylor expansion,while the Extended Scheme uses a second-order expansion to describe the distribution. The original methodis conservative and defines a simple departure region, but it violates monotonicity preservation. Due to itssimplicity, Miura’s Scheme is not very accurate with more complex tracer and velocity flow configurations.The Extended Scheme required three specific modifications:Green’s Theorem was used to calculate thesenext-order terms and minimize the computational stencil, Gauss Quadrature was employed to calculatethe tracer advected in a departure region, and the cell-averaged value was re-normalized to correct forthe addition of these higher-order terms. Two tests were run on a planar, perfect hexagonal grid: a solidbody rotation case and a time-dependent deformational-flow case. The extension of the tracer distributionfunction shows marked improvements over the original method, and this extended scheme is third-orderconvergent for the solid-body rotation case. The improvements, however, are not as obvious in thedeformational-flow test. Nonetheless, the results indicate that the Extended Scheme warrants furthertesting. The successful application of a flux limiter shows that the method can be prepared further forpossible implementation in weather and climate models.
Figure 1
Final results for nx =169 of(a) Miura’s Scheme and (b) the Extended Scheme forsolid body rotation, and (c) Miura’s Scheme and (d) the Extended Scheme fora time-dependent deforma-tional-flow case. The exactsolution, outlined in the thickdashed line, is overlaid overthe numerical solution.

Imani Morris
Climatology of precipitation in West Africathrough observational studies
[ ]
2nd-year Protégé
Graduate StudentGeorgia State University
Geography
Mentors
Science ResearchPaul Kucera – NCAR
Michael Chapman – NCARBarbara Brown – NCAR
Writing & CommunicationSteven Massie – NCAR
2009 SOARS Abstracts Significant Opportunities in Atmospheric Research and Science 12
The occurrence of precipitation in the Sahelian belt is highly variable and unpredictable. Incessant droughtsand sporadic flash floods cause residents to experience crop failures and subsequent famine. Theseunfortunate occurrences served as the motivation for this study. This research used the ThunderstormIdentification,Tracking, Analysis, and Nowcasting (TITAN) tool to detect and evaluate storms, summarizethe precipitation regime of Mali, West Africa, and compare storm statistics of observed squall lines andMesoscale Convective Systems (MCS) for the study period of 2006-2008. The results of this research arepromising for the future of precipitation occurrence in the Sahelian region. Time series and storm distributionanalysis showed that the region experienced atypical rainy seasons for the last three years, with stormsin 2008 being the most intense and producing the most precipitation. The comparison of MCS and squallline statistics allowed for the preliminary designation of storm characteristics. Results showed that com-pared to chosen MCS cases, squall lines tend to be more intense, produce more precipitation, last longer,and have higher storm heights. Future work includes scrutinizing additional storms and storm statisticsand performing model verification.
Figure 1
Daily averaged precipitation flux estimated from TITAN storm cells observed during the 2008 field season in Mali.

Nicole Ngo
The effects of convective clouds on vertical scalar transport
using a numerically simulated flow field
[ ]
4th-year Protégé
Graduate StudentColumbia UniversitySustainable Development
Mentors
Science ResearchChin-Hoh Moeng – NCARJeff Weil – NCAR
Writing & CommunicationReta Lorenz – NCAR
ComputingNed Patton – NCAR
2009 SOARS Abstracts Significant Opportunities in Atmospheric Research and Science13
In the planetary boundary layer (PBL), pollutants travel shorter distances and have shorter residence timesrelative to those in the upper troposphere. Without clouds, pollutants released near the surface are likely tostay within the PBL or deposit onto the ground if there is no deep convection to carry them upward. Theobjective of this study was to understand how deep convective cloud systems influence the transport ofinsoluble species to the upper troposphere using a Lagrangian approach. We used velocity field data froma synthetic flow field numerically generated from a 3-D large eddy simulation (LES) model of a deep convectionsystem. The domain was large, consisting of 2048 x 2048 x256 (or109) grid points, so this LES is also knownas a giga-LES. The results showed three interesting features. First, a peak in the particle concentrationoccurred around 8-9 km at 3,6, and12 hours after their release. Possible mechanisms explaining this includewater loading and a larger areal coverage of downward motion than upward motion at that height. Second,approximately 25% of particles remained near the surface, the lowest level used for the particles. This isprobably due to neglecting the subgrid-scale (SGS) motion in our Lagrangian approach. Finally, within thePBL, we found a sharp drop in pollutants. Possible explanations include (1) neglecting the SGS effect and(2) the use of a large time interval (15 minutes) for the velocity field. Our future work will include the SGS effect,and will use a five-minute time interval for the flow field.
Figure 1
Average concentration profile of particles 3, 6, and 12 hours after release.
Lumari Pardo-Rodriguez
Lightning activity in Atlantic tropical cyclones: Using the Long-range Lightning
Detection Network (LLDN)
[ ]
3rd-year Protégé
Graduate StudentColumbia UniversityClimate and Society
Mentors
Science ResearchJoseph Golden
– CIRES (ret.)Bill Woodley
– CIRES (ret.)
Writing & CommunicationAmy Stevermer – COMET
ComputingMike Page – NCAR
2009 SOARS Abstracts Significant Opportunities in Atmospheric Research and Science 14
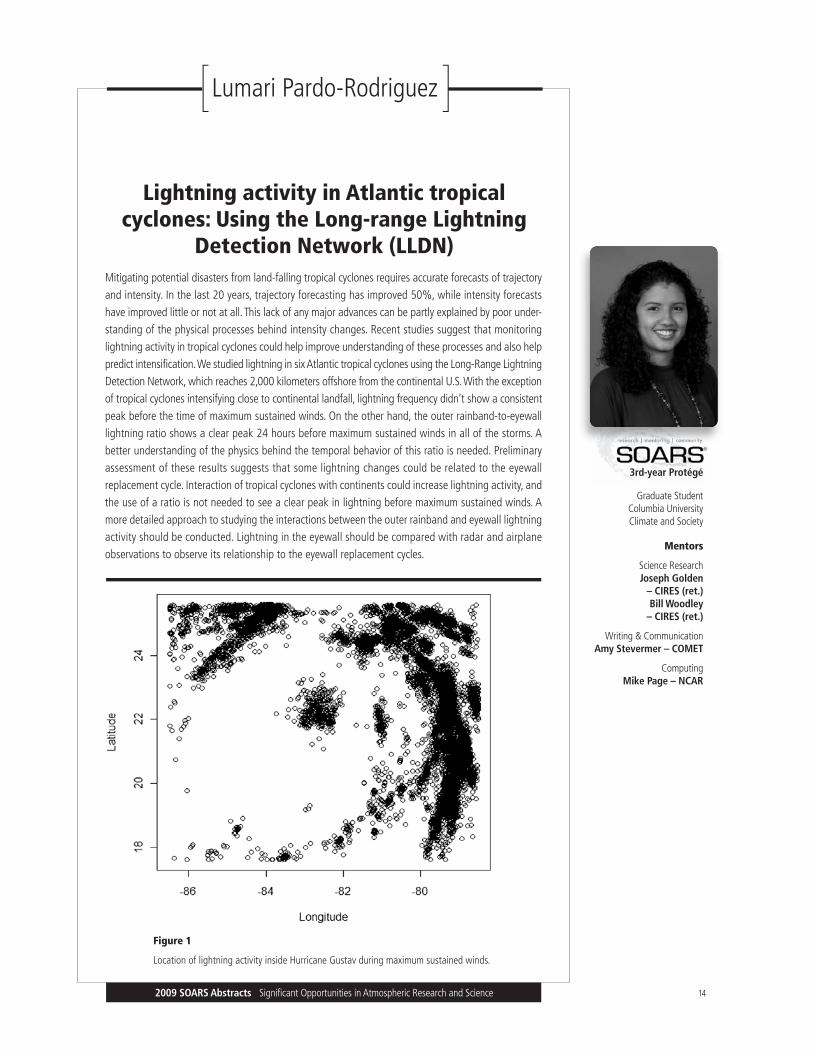
Mitigating potential disasters from land-falling tropical cyclones requires accurate forecasts of trajectoryand intensity. In the last 20 years, trajectory forecasting has improved 50%, while intensity forecastshave improved little or not at all. This lack of any major advances can be partly explained by poor under-standing of the physical processes behind intensity changes. Recent studies suggest that monitoringlightning activity in tropical cyclones could help improve understanding of these processes and also helppredict intensification. We studied lightning in six Atlantic tropical cyclones using the Long-Range LightningDetection Network, which reaches 2,000 kilometers offshore from the continental U.S. With the exceptionof tropical cyclones intensifying close to continental landfall, lightning frequency didn’t show a consistentpeak before the time of maximum sustained winds. On the other hand, the outer rainband-to-eyewalllightning ratio shows a clear peak 24 hours before maximum sustained winds in all of the storms. Abetter understanding of the physics behind the temporal behavior of this ratio is needed. Preliminaryassessment of these results suggests that some lightning changes could be related to the eyewallreplacement cycle. Interaction of tropical cyclones with continents could increase lightning activity, andthe use of a ratio is not needed to see a clear peak in lightning before maximum sustained winds. Amore detailed approach to studying the interactions between the outer rainband and eyewall lightningactivity should be conducted. Lightning in the eyewall should be compared with radar and airplaneobservations to observe its relationship to the eyewall replacement cycles.
Figure 1
Location of lightning activity inside Hurricane Gustav during maximum sustained winds.

Matthew Paulus
Comparison of the VORTRAC retrieved structure of Hurricane Danny
(1997) to prior analyses
[ ]
1st-year Protégé
SeniorEmbry-Riddle Aeronautical UniversityB.S. Applied Meteorology
Mentors
Science ResearchMichael Bell – NCARWen-Chau Lee – NCAR
Writing & CommunicationDavid Ahijevych – NCAR
CommunityTim Barnes – UCAR E&O
PeerRoque V. Céspedes– SOARS Protégé
2009 SOARS Abstracts Significant Opportunities in Atmospheric Research and Science15
Tropical cyclone (TC) intensity forecasts continue to be one of the most challenging aspects of hurricaneprediction. However, through an innovative new tracking and analysis tool, a high resolution, real-timeanalysis and greater understanding of the complex dynamics of TCs is possible; both lead to betterforecasting skill. The validity of this tool was analyzed in this research.
Through the ground-based Velocity Track Display (GBVTD) technique, a single ground-based Doppler radarcan be used to retrieve the three-dimensional (3-D) kinematic structure of a TC. The GBVTD techniqueand GBVTD-simplex center-finding algorithm is used within the Vortex Objective Radar Tracking andCirculation (VORTRAC) software package for this purpose. VORTRAC is capable of automatic centertracking and retrieval of storm-scale circulation, structure, and central pressure tendency of a TC, foruse in real-time forecasting and research. VORTRAC was used to analyze Hurricane Danny (1997). Thisanalysis was then compared to the National Hurricane Center (NHC) best track (considered to be the
“ground truth”) and the manual GBVTD analysis previously performed on Danny. Additionally, the VORTRACruns from two separate radars were compared.
The VORTRAC software package was shown to be a viable tool for the retrieval of the detailed 3-D structureof a TC. VORTRAC was shown to agree well with observations and with manual GBVTD analyses, whileefficiently processing data at a high temporal resolution. This promises to be a useful tool for bothforecasting and research.
Figure 1
VORTRAC retrieved 60-minute averaged central pressure (solid line) of Hurricane Danny from the KLIX radarand the six hour National Hurricane Center best track central pressure (dashed line).

Dana Pauzauskie
Different ways of knowing: exploring traditional ecological knowledge
and climate modeling for the Turtle Mountains, North Dakota
[ ]
2nd-year Protégé
University of KansasBachelor of Social Welfare
2008
Mentors
Science ResearchMary Hayden – NCAR
Writing & CommunicationJulia Lee-Taylor – NCAR
2009 SOARS Abstracts Significant Opportunities in Atmospheric Research and Science 16
Different ways of understanding climate change are pertinent to its study. To better understand the fullscope of the impacts brought about by a changing climate, observations and perspectives from in-digenous and local peoples, in combination with scientific climate data, are important to include in dis-cussions and considerations of regional climate change. This study explores impacts of climate changeon plants, and therefore culture, in the Turtle Mountain Reservation (North Dakota) community as seenthrough the eyes of an Anishinabe tribal elder who is the community’s medicine man. The analysis ofCCSM3 coupled climate model projections for north central North Dakota revealed potential increasesof 0.5 – 3.0° C in regional monthly temperatures by 2020. Precipitation is projected to increase in springmonths and decrease in summer and fall. Through a semi-structured interview, the elder reportedunpredictable regional weather conditions over the last 10 –12 years. Observations included changesin winter temperatures and precipitation, unstable weather patterns during the transition from winterto spring, and dry summer conditions. The elder stated he is indirectly impacted when the harvest ofculturally significant plants is compromised by changing environmental conditions. The ecosystem’splant, insect, and wildlife species are shifting. By way of exploring Traditional Ecological Knowledge andclimate modeling, we understand projected changes in temperature and precipitation are already underwayin the Turtle Mountains. The breadth of knowledge and understanding of the region’s environment exposesthe changing weather’s impacts on not only the ecosystem, but on a community’s cultural practice.
Figure 1
The CCSM3 projected change in temperaturefrom end of the 20th century to 2020 fornorth central North Dakota.

Daniel A.Pollak
Flash floods: A spatial and temporal analysis. A case study of the March 2008
flash floods in southwestern Missouri
[ ]
1st-year Protégé
JuniorThe Pennsylvania State UniversityMeteorology
Mentors
Science ResearchJennifer Boehnert – NCARIsabelle Ruin – NCAROlga Wilhelmi – NCAR
Writing & CommunicationVickie Johnson – COMET
CommunityZhenya Gallon– UCAR Communications
PeerMarques Cameron– SOARS Protégé
2009 SOARS Abstracts Significant Opportunities in Atmospheric Research and Science17
Floods are the leading cause of weather-related fatalities in the United States and the second most commoncause of weather-related death worldwide. Of all floods, flash floods are found to be the most deadly withan average global mortality rate of 3.62%. This study performed a spatial and temporal analysis of flashflood risk using Geographic Information Systems (GIS) to analyze an event that occurred in southwesternMissouri in March 2008. The goals of the study were to identify different impacts of the disaster asindicated by flood reports, examine the social and natural factors that account for the spatial and temporaldistribution and severity of the impacts, and compare the results with a previous study of a flash floodevent in France. In the Missouri case, the analysis confirmed that small catchments react faster thanlarge catchments, and they react to smaller amounts of rainfall. Seventy-seven percent of incidents(water rescues, fatalities, flooded homes, and flooded roads) occurred in catchments smaller than 200km2. The study also showed that a majority of the severe impacts (water rescues, fatalities, and floodedhomes) occurred after the rainfall had tapered off, perhaps indicating that people erroneously believethat the danger has passed after the rain stops. When looking at water rescues and fatalities, this studyfound that fewer incidents occurred in medium-sized catchments (50-450 km2) than in either large(>450 km2) or small catchments (<50 km2). This is similar to the French study which found that nofatalities occurred in medium-sized catchments. Using GIS to examine flash flood risk will take stridesforward in comparing human vulnerability with catchment size.
Figure 1
Time series displaying the circumstancessurrounding the flood report incident incatchment 5. The time series was createdby performing a temporal analysis.

Vanessa M.Vincente
The relationship between sea breezes and rainfall along western Mexico
during the North American Monsoon
[ ]
1st-year Protégé
JuniorValparaiso University
Meteorology
Mentors
Science ResearchLeslie M. Hartten
– CIRES/NOAAPaul E. Johnston
– CIRES/NOAA
Writing & CommunicationJoseph S. Wakefield
– CIRES/NOAA
CommunityLuanna Allapowa – UCAR
PeerNicole Ngo
– SOARS Protégé
2009 SOARS Abstracts Significant Opportunities in Atmospheric Research and Science 18
The North American Monsoon (NAM) is an annual phenomenon that influences the southwestern UnitedStates and northwest Mexico during the summer months. Atmospheric general circulation models havehad difficulty forecasting precipitation events during the NAM season. The cause of this predicament hasbeen linked to models’ insufficiency in simulating the daily cycle of winds within this region. Previousstudies examined the daily cycle of winds measured by a 915-MHz wind profiler stationed at EstaciónObispo (ETO), Mexico in an attempt to characterize the sea breeze events during the 2005 NAM season.This research extends that work by investigating the relationship between variations in the sea breezesover ETO and variations in the precipitation that fell on the western slopes of the Sierra Madre Occidental(SMO) in Mexico during the 2005 NAM season. Examination of the mid-afternoon (14-17 Local Time) winddirections at ETO revealed that onshore flow was present from a broad range of directions but within thesouth to west sector. Sea breezes occurred almost every day at ETO, more frequently than previous studiesindicated. Daily rainfall from the North American Monsoon Experiment Event Rain Gauge Network (NERN)showed high variability throughout the season as well as between NERN stations. There was no significantassociation between the mid-afternoon wind direction along the west coast of Mexico and the daily rainfallon the SMO. These results may guide NAM scientists as they seek better methods to relate onshore flowwith convective activity across the SMO.
Figure 1
Two polar plots of the daily rainfall at one NERN station versus the mid-afternoon wind direction atEstación Obispo, Mexico. NERN Station 79 (left) shows high variability in its summer rainfall amounts,and most of the rain fell on days with a general southwest wind direction. The precipitation amountsfor NERN station 67 (right) were not as variable and tended to be concentrated in small amounts.Again, the majority of its rainfall events occurred on days with a southwest wind direction.
Marcus D.Walter
Re-examination of Northeast United Statesdrought trends and characteristics
[ ]
3rd-year Protégé
Graduate StudentCornell UniversityAtmospheric Sciences
Mentors
Science ResearchEric Gilleland – NCARBalaji Rajagopalan– University of Colorado
Writing & CommunicationSusie Siders – UCAR
ComputingJohn Halley Gotway – NCAR
2009 SOARS Abstracts Significant Opportunities in Atmospheric Research and Science19
Drought or dry periods can have devastating societal and environmental impacts. For the northeasternUnited States, increases in dry periods could negatively impact the 54 million people who live in theregion and depend upon the regional water resources. Because of climate change and the fluctuatingprecipitation patterns, drought/dry periods are expected to increase in the northeastern United States.
In this study we use Principle Component Analysis (PCA), Extreme Value Theory (EVT), and other statisticaltechniques to diagnose trends, characteristics, and possible causality of summer drought/dry periodsfor this region. The Palmer Drought Severity Index (PDSI), a widely employed and popular drought index,is used for the first part of the study. An independently developed dry period index, based on evaporationestimates and precipitation data, is used for the second part of the study.
Early results from the PCA performed on the PDSI data show a drying trend, spatially and temporally, forthe northeastern United States, with the most intense drying visible over Pennsylvania. Results also showthat there may be significant antecedent and seasonal correlations between the PDSI dataset and globalweather and climate indices, such as land and sea surface temperatures and global surface wind fields.
This analysis is an important step in understanding the seasonal and sub-seasonal drought/dry periodoccurrences in the Northeast. It also provides insight into how these events are related to climate changeand climate indices, and it improves the assessment and understanding of changes in drought/dryperiods in this region.
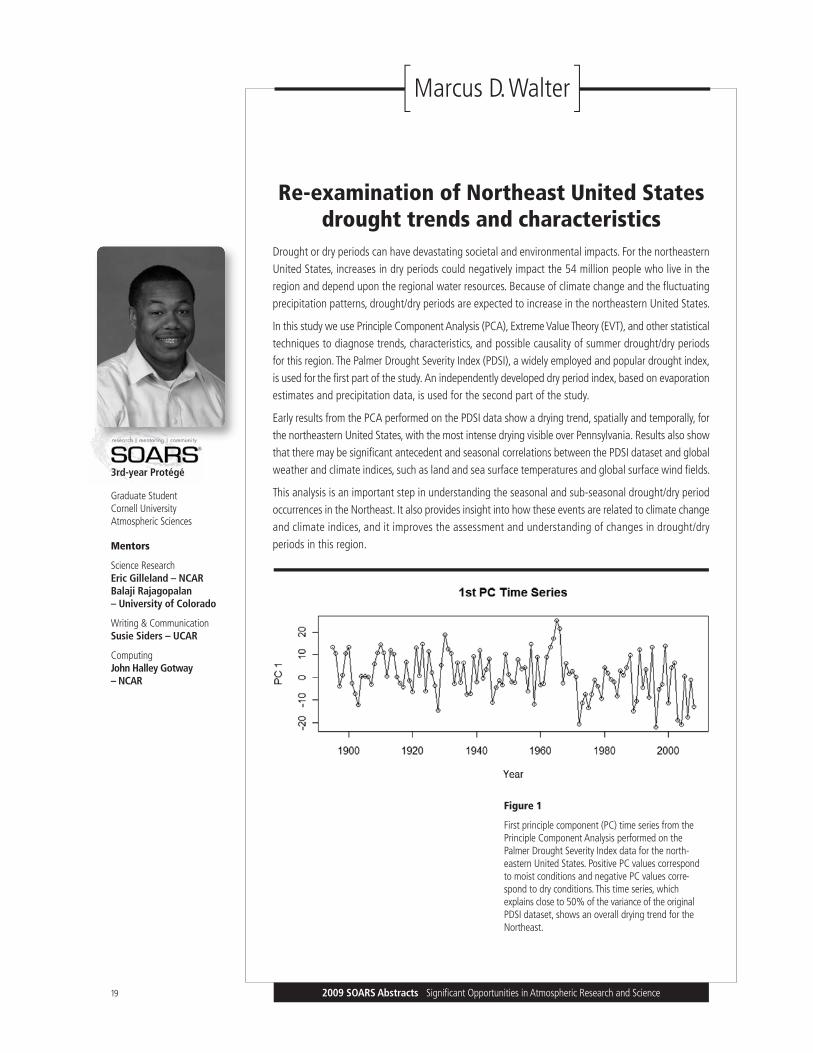
Figure 1
First principle component (PC) time series from thePrinciple Component Analysis performed on thePalmer Drought Severity Index data for the north-eastern United States. Positive PC values correspondto moist conditions and negative PC values corre-spond to dry conditions. This time series, which explains close to 50% of the variance of the originalPDSI dataset, shows an overall drying trend for theNortheast.

Anastasia G.Yanchilina
Model analysis of 27-day solar-induced variability of chemical dynamics in the
equatorial upper and middle atmosphere
[ ]
2nd-year Protégé
Graduate StudentColumbia University
Paleoclimatology
Mentors
Science ResearchDan Marsh – NCAR
Natalia Calvo – NCAR
Writing & CommunicationKelley Barsanti – NCAR
ComputingJulia Lee-Taylor – NCAR
2009 SOARS Abstracts Significant Opportunities in Atmospheric Research and Science 20
The effect of solar variability on the atmosphere remains poorly understood. This study explored the impactof 27-day rotation of sunspots on the equatorial upper and middle atmospheric photochemistry fromWhole Atmosphere Community Climate Model 3 (WACCM3) output. WACCM3 was driven with observedsolar and greenhouse gas forcing for a period during the last solar maximum which included1999, 2000,and 2001. Fourier and wavelet analysis were applied to determine the magnitude and phase responsesto the solar-induced forcing on ozone (O3), temperature, hydrogen species (OH, HO2, H), molecularoxygen (O(3P)), water vapor (H2O), and shortwave heating. Wavelet analysis demonstrated that theresponse of these atmospheric constituents to the 27-day forcing is largely intermittent and depends onthe magnitude of solar forcing. Fourier and phase analysis demonstrated that the largest responses ofozone occurred around 80 and 40 km. The former is attributed to increased production of odd hydrogen(HOX) from photolysis of water vapor at Lyman-α, while the latter is attributed to increased O3 productionin the stratopause from increased UV. The analysis also demonstrated that the largest responses oftemperature occurred around 70 km and 40 km. They are attributed to increased UV at those altitudes.The figure illustrates these responses. The amplitude of these responses compared well with data frommodels and observations. Phase difference, on the other hand, did not. Internal modes of variabilityclose to 27 days and the realistic forcing mechanisms used to drive the model may contribute to this.
Figure 1
Profiles of temperature (dotted) and O3 (solid) for a zonally averaged latitudinalband, 20S to 20N, during a period of increased 27-daysolar forcing during the 1999-2001solar maximum.

Understanding past conditions of early Earthusing trace metals in sulfide minerals
1st-year Protégé
SeniorUniversity of MichiganEarth Science
Mentors
Science ResearchStephen Mojzsis – University of Coloradoat Boulder
Writing & CommunicationBeth Bartel – UNAVCO
CommunityAbe Morrison – UNAVCO
PeerMarcus D. Walter– SOARS Protégé
2009 RESESS Abstracts Research Experiences in Solid Earth Science for Students21
It is widely believed that drastic changes in Earth’s biosphere led to the great oxidation event (GOE),asudden increase in atmospheric oxygen approximately 2.5-2.4 Ga. Nickel is an essential nutrient formethanogens, and there was a decrease in nickel production during this time due to Earth’s cooling. Theemergence of cyanobacteria and the declining population of methanogens resulted. Cyanobacteriaare photosynthetic bacteria that supplied an appreciable amount of oxygen to the atmosphere by firstoxygenating the ocean surface. This created an iron oxide which settled to the bottom of the ocean flooras sediments in layered deposits called banded-iron formations (BIF). Once iron was nearly depleted, therelease of oxygen from the oceans filled the atmosphere. BIF store geochemical signatures from earlyEarth that contain sulfide minerals with various amounts of trace metals in each sulfide mineral. Bystudying the abundance of trace metals (Ni, Zn, Cu, Co, Mo) before and after GOE, we can betterunderstand the catalytic processes that were influential. Through use of an electron microprobe, new linesof evidence can be obtained to support the theory of the rise of atmospheric oxygen. Analysis of Ni/Feratios coincides with the nickel famine theory. During the GOE, there was a decrease in Co/Fe ratios. Theother trace metals noted above are under further investigation.
John J.Braswell[ ]
Figure 1
Results (Graph1) suggest decreasing ratios of Ni/Fe from 3.87-1.87Ga. In comparison toK. Konhauser’s data (Graph 2), our results reveal similar trends of decreasing Ni/Fe ratiosbefore and after the great oxidation event.
Cobalt analysis (Graph 3) yielded results ofdecreasing Co/Fe ratios suggesting possibledecrease in cobalt after the great oxidationevent.
Graph 1 Graph 2
Graph 3
Katherine F. Fornash
Geochemical evidence for flat-slab subductionin Cenozoic western North America
[ ]
3rd-year Protégé
SeniorUniversity of Arizona
Geosciences
Mentors
Science ResearchG. Lang Farmer
– University of Coloradoat Boulder
Writing & CommunicationFreddy Blume – UNAVCO
2009 RESESS Abstracts Research Experiences in Solid Earth Science for Students 22
Voluminous intermediate to silicic composition magmatism occurred in the Cenozoic throughout much ofwestern North America and is generally attributed to melting in the upper mantle triggered by shallowingand resteepening of oceanic lithosphere subducting along the western continental margin during thistime. If so, then not only should there be systematic variations in the position of the magmatic activitythrough time, but these magmas should also should carry geochemical signatures characteristic of arcmagmatism, including enrichments in the abundances of large-ion lithophiles (LIL) relative to high-field-strength elements. With this issue in mind, a re-examination of space-time-composition patterns of Cenozoicmagmatism in the western United States and northern Mexico is presented here, using igneous rock datacompiled in the on-line western North American Volcanic and Intrusive Rock Database (NAVDAT).
An investigation of 5,625 volcanic rocks from the Rocky Mountain region in the western United Statesrevealed latitudinal variations in the age of the mid-Tertiary magmatic pulse, and longitudinal variationsin chemical composition, with alkalic character increasing to the east, and the highest Sr/Nb concentrationsfound in the central Rocky Mountain region. Isotopically, there was little to no variation in initial 87Sr/86Srratios, while there were marked differences in initial εNd values, with values increasing to both the eastand west of the central Rockies. Space-time patterns from 6,788 volcanic and plutonic rock samples fromnorthern Mexico indicate that while there is evidence for periods of magmatic migration from120 Mya tothe present, these migrations are confined to the northernmost latitudes (36° N–28° N).
Taken together, these observations suggest that (1) variations in the mantle source region and the intensityof metasomatism existed during the mid-Tertiary in the western United States, and (2) flat-slab subductiondid not extend into the southernmost latitudes (28° N–16° N) of northern Mexico.
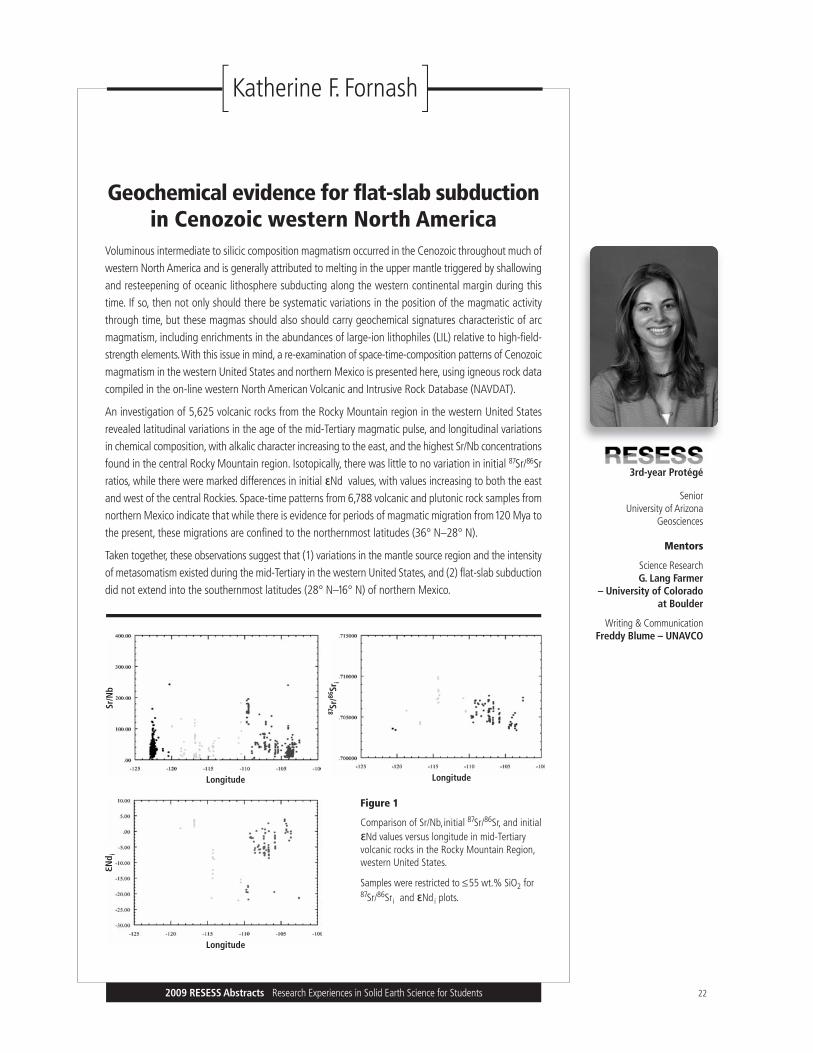
Figure 1
Comparison of Sr/Nb,initial 87Sr/86Sr, and initialεNd values versus longitude in mid-Tertiary volcanic rocks in the Rocky Mountain Region,western United States.
Samples were restricted to ≤55 wt.% SiO2 for87Sr/86Sri and εNdi plots.
87Sr
/86Sr
i
Sr/N
bεN
d i
LongitudeLongitude
Longitude

Stephen Hernandez
Shear wave splitting analysis from newly-installed seismic stations
in Antarctica
[ ]
4th-year Protégé
SeniorUniversity of Texas at El PasoMathematics
Mentors
Science ResearchDoug Wiens– Washington University
2009 RESESS Abstracts Research Experiences in Solid Earth Science for Students23
The tectonic fabric of the upper mantle is inferred using SKS and SKKS splitting analysis of data from15newly-installed broadband seismic stations in West and East Antarctica. Data collected between December2007and December 2008 from 5 stations from the Polar Earth Observing Network (POLENET experiment)and10 stations from the Gamburtsev Antarctic Mountains Seismic Experiment (GAMSEIS experiment) areused to perform an SKS and SKKS anisotropy analysis of the regions. In West Antarctica, POLENETstations straddle the West Antarctic Rift System (WARS) while in East Antarctica GAMSEIS stations arecentered on and around the Gamburtsev Subglacial Mountains (GSM). POLENET stations show splittingtimes ranging from .85s to1.25s and fast axes in cursory agreement with the inferred direction of WARSextension. For the larger focus of our study, GAMSEIS stations show a wider range of delay times (.65sto 1.55s) and fast splitting directions that may indicate the existence of 2 distinct tectonic regimes.
Figure 1
A Normalized overlaid radial (solid) and transverse (dashed) broadband recordings of a teleseismic SKS wave.Note the non-trivial amplitude of the transverse component SKS energy.
B Uncorrected elliptical particle motion for the SKS energy of figure A.
C,D Reconstructed versions of A, B. Linearized particle motion in D indicates we have correctly modeled the best-fit splitting parameters characterizing the anisotropy beneath our station.

Fernando A.Martínez Torres
A study of gully erosion dynamics andprocesses at Bijou Creek, Colorado,
using laser scanning and aerial photography
[ ]
1st-year Protégé
SophomoreUniversity of Puerto Rico
MayagüezGeology
Mentors
Science ResearchGreg Tucker
– University of Coloradoat Boulder
David Phillips – UNAVCO
Writing & CommunicationShelley Olds – UNAVCO
CommunityBarrett Friesen – UNAVCO
PeerKatherine Fornash– RESESS Protégé
2009 RESESS Abstracts Research Experiences in Solid Earth Science for Students 24
A
The process of gully erosion is not completely understood by geologists due to insufficient data. We usevarious techniques including 3-D laser scanning (terrestrial and airborne), real-time kinematic-GPS andaerial photography to acquire new data from a study site at Bijou Creek, Colorado, to help improve ourunderstanding of this process. Analysis of the data shows that the average rate of erosion in the head cutof this specific gully is 0.5 meters per year with the rate of movement every year to be generally veryconstant. We also analyzed the rate of erosion of other gullies in Bijou Creek and found that their ratesof erosion vary depending on the location of the landscape. The aerial photographs confirm the rate oferosion for the general head cut of the gully, but with TLS, we can analyze the locations of the gully beingeroded the quickest and how much each area has been eroded. By comparing TLS scans from 2008 and2009, we observed that the main erosion is in the head cut of the gully; everything else in the scan areawas seen to move at a slower rate (or showed no movement over the this period).
Figure 1
Point Cloud of 2008 imposed over 2009 data, colors indicate the difference in meters from oneyear to the next. To view this figure in color, visithttp://resess.unavco.org/past2009.html.
,
S O A R S A N D R E S E S S

P R O T É G É S 2 0 0 9
RESESS combines structured mentoring, ongoingresearch internships, and a supported learningcommunity for undergraduate students fromunderrepresented groups in order to increasediversity within geology and geophysics.
RESESS participants share the SOARS organiza-tional, structural,and social environment,centeredon a series of 10-week summer internships inBoulder, Colorado. The internships include aresearch project in collaboration with a solid earthscientist who is trained as a mentor, an experienceof living and working with other students fromunderrepresented populations in science, andmultidimensional mentoring from writing andcommunication, community, and peer mentors.
Students who enter the program after theirsophomore or junior year can participate in theprogram for up to four years. This continuityprovides a bridge to graduate school with somefinancial support during their master’s program.
envisions a diverse community of atmosphericscientists, educators, and policy makers collabo-rating to understand our atmosphere and to usethat understanding for the benefit of all
is dedicated to enhancing diversity within thescientific communities of the future by increasingthe number of students from historically under-represented groups who enroll and succeed inmaster’s and doctoral degree programs in theatmospheric and related sciences
is committed to diversity of thought, opinion,perspective and background; we value inclusive-ness as we work together to strengthen the atmospheric and related scientific community
is a four-year program for undergraduate andgraduate students interested in pursuing careersin the atmospheric and related sciences
includes a 10-week summer program at theNational Center for Atmospheric Research(NCAR), operated by the University Corporationfor Atmospheric Research (UCAR), UCAR Officeof Programs (UOP), or other national laboratories
provides educational and research opportunities,mentoring, career counseling and guidance, andthe possibility of financial support for graduateand undergraduate education
www.resess.unavco.org
→ →
→
→
→
→
→
→
→
www.soars.ucar.edu
NCAR National Center for Atmospheric Research
NOAA National Oceanic and Atmospheric Administration
UCAR University Corporation for AtmosphericResearch
UCAR E&O UCAR’s Office of Education & Outreach
Key to Mentors’ Affiliations
CIRES Cooperative Institute for Research in Environmental Sciences
COMET Cooperative Program for Operational Meteorology, Education and Training
COSMIC Constellation Observing System for Meteorology Ionosphere & Climate

R E S E A R C H M E N T O R I N G C O M M U N I T Y

E N H A N C I N G S C I E N T I F I C C O M M U N I T I E S O F T H E F U T U R E
Kneeling (L to R): Raymond Detweiler, Nicole Ngo, Vanessa Vincente, Daniel Pollak, Alex Gonzalez
Front Row (L to R): Roque Céspedes, Michael Hernandez, Fernando Martínez Torres, Katherine Fornash, John Braswell, Imani Morris, Marques Cameron, Matthew Paulus, Dana Pauzauskie, Ian Pagán-Colón
Back Row (L to R): Karl Clarke, Maximo Menchaca, Sharome Goode, Marcus Walter, McArthur Jones, Graylen Boone.
Not pictured: Stephen Hernandez, Lumari Pardo-Rodríguez, and Anastasia Yanchalina
SOARS AND RESESS PROTÉGÉS 2009 IN FRONT OF THE FLATIRONS IN BOULDER, COLORADO

SOARS
National Science Foundation, Directorate for Geosciences, Atmospheric Sciences
National Oceanic and Atmospheric Administration,Climate Program Office
National Oceanic and Atmospheric Administration,Oceans and Human Health Initiative
Center for Multi-scale Modeling of Atmospheric Processes at Colorado State University
Cooperative Institute for Research in Environmental Sciences
University Corporation for Atmospheric Research
RESESS
National Science Foundation, Directorate for Geosciences, Earth Sciences
UNAVCO
Incorporated Research Institutions for Seismology
United States Geological Survey
Authors: SOARS and RESESS protégés and staffEditors: SOARS and RESESS mentorsReview Editor: Brian BevirtPhotography: Carlye Calvin, UCAR and Kate Tallerday, UNAVCO (except where noted below)Design: Gene Malowany, Malowany AssociatesPrinting: ColorQuest Graphics
Front Cover Photos:Super Cell Thunderstorm: UCARVolcano: George SteinmetzLightning: Carlye CalvinPolar Explorer: UNAVCO
The material is based upon work supported by the National ScienceFoundation under Grant No. 0503613 and 0618847. The materialwas prepared by SOARS under award number NA06OAR4310119from the National Oceanic and Atmospheric Administration, U.S.Department of Commerce. The statements, findings, conclusions, andrecommendations are those of the author(s) and do not necessarilyreflect the views of the National Oceanic and Atmospheric Adminis-tration or the Department of Commerce.
S O A R S A N D R E S E S S 2 0 0 9 S P O N S O R S A N D A C K N O W L E D G E M E N T S
Opinions, findings, conclusions, and recommendations expressed inthis publication do not necessarily reflect the views of any SOARS or RESESS sponsors or managing organizations. UCAR and UNAVCOare Equal Opportunity/Affirmative Action employers.
SOARS is a registered trademark of the University Corporation for Atmospheric Research.
Earth, Wind, Sea, and Sky is a joint publication of SOARS and RESESS.
This publication has been printed on recycled-content paper by an environmentally-friendly printer.
Back Cover Photos:Aurora Borealis: UCARMountain Range: UNAVCOAltocumulus Clouds: Caspar AmmanoSnow Cave: Jayme Margolin

Research Experiences in Solid Earth Science for Students UNAVCO www.resess.unavco.org
Significant Opportunities in Atmospheric Research and Science University Corporation for Atmospheric Research (UCAR) www.soars.ucar.edu