earth system monitor - national oceanographic … · the earth system monitor (issn 1068- ... n.y.;...
TRANSCRIPT

U.S. DEPARTMENTOF COMMERCE
National Oceanicand AtmosphericAdministration
Vol. 9, No. 1 ● September 1998
EARTH SYSTEM MONITOR
A guide toNOAA's data and
informationservices
INSIDE
3News briefs
7NOAA Fisheries and
the State of Louisianajoin forces
in large wetlandsreconstruction project
10Oceans and the Earth’s
climate: the WorldOcean Circulation
Experiment
12NOAA’s GOES-10replaces GOES-9
13Ocean Community
Conference ’98
14NOAA/NASA Prototype
Long-Term Archiveoperational
15Data productsand services
DE
PA
RTMENT OF COMMERC
E
★ ★
UN
ITEDSTATES OF AMER
ICA
ERS satellite gravity and airborne gravityover the Arctic Ocean: a comparison
Gravity surveying techniques produce accurate, high spatial resolution results
D. C. McAdoo1
Laboratory for Satellite AltimetryNOAA/NESDIS
V. A. Childers2
Naval Research LaboratoryU.S. Navy
S. Laxon3
Space and Climate Physics Dept.University College London
Year-round ice cover in theArctic Ocean has made geo-physical and oceanographicsurveying with traditional ship-board techniques difficult orimpossible. Until recently, thesparse surveys of opportunityfrom ice islands and icebreak-ers yielded virtually all of theavailable geophysical data forthe bulk of the marine Arctic -aside from airborne magneticsurveys. As a result, the Arcticis the least understood of allthe world’s ocean basins, andthe geologic history of the Arc-tic remains quite uncertain.
Moreover, it is importantfor global climate research tounderstand the Arctic Oceanand, in particular, the varia-tions—with time and place—in its sea ice thick-ness. A new effort is now underway to redressthis gap in our scientific knowledge of the Arctic.This article focuses on two relatively new meth-ods for observing and mapping gravity that aremajor contributors to these new studies in Arcticscience. These techniques are: retracked EarthRemote Sensing (ERS) satellite altimetry and Na-val Research Laboratory (NRL) airborne gravim-etry. Other contributors to this endeavor includethe ongoing Scientific Ice Experiment (SCICEX)program to collect unclassified marine geophysi-cal data from U.S. Navy nuclear powered subma-rines (Pyle et al., 1997) as well release of previ-ously classified U.S. Navy bathymetric data(Johnson and Brass, 1998).
Arctic marine gravity field determinationsusing each of these two new techniques will
continue to improve in accuracy and resolutionas more data are collected and further refine-ments are realized. However, both techniques arenow reaching a level of maturity where it is im-portant to compare them in accuracy and spatialresolution. As part of this comparison, an assess-ment of the horizontal spatial resolution is criti-cal. Seafloor tectonic structures of horizontalscales 10 km to roughly 300 km, such as sea-mounts, mid-ocean ridge, and fracture zones areassociated with significant seafloor topographycrustal structure and hence with significantanomalies in the marine, free-air gravity field.Consequently, if one can accurately map marinegravity to scales as short as 10 or 20 km then oneis able to map, often rather well, the tectonicfabric of the seafloor (e.g., Smith, 1998).
- continued on page 2
▲ Figure 1. Artist’s rendition of the European Space Agency’s ERS-1satellite, which operated from 1991 to 1996. Data collected via the sat-ellite was used to extend existing altimetric gravity fields of the globalocean (Laxon and Mcadoo, 1994, Sandwell and Smith, 1997). Figurereproduced from The Data Book of ERS-1: The European Remote SensingSatellite, European Space Agency, esa BR-75, April 1991.

2 September 1998EARTH SYSTEM MONITOR
EARTH SYSTEM MONITOR
The Earth System Monitor (ISSN 1068-2678) is published quarterly by the NOAAEnvironmental Information Services office.Questions, comments, or suggestions forarticles, as well as requests for subscrip-tions and changes of address, should bedirected to the Editor, Sheri A. Phillips.
The mailing address for the Earth SystemMonitor is:National Oceanographic Data CenterNOAA/NESDIS E/OC1SSMC3, 4th Floor1315 East-West HighwaySilver Spring, MD 20910-3282
MANAGING EDITORDr. Anthony R. Picciolo
Telephone: 301-713-3281 ext.140Fax: 301-713-3302
E-mail: [email protected]
EDITORSheri Phillips
Telephone: 301-713-3280 ext.127Fax: 301-713-3302
E-mail: [email protected]
ASSOCIATE EDITORRoger Torstenson
Telephone: 301-713-3281 ext.107Fax: 301-713-3302
E-mail: [email protected]
DISCLAIMERMention in the Earth System Monitor ofcommercial companies or commercialproducts does not constitute an endorse-ment or recommendation by the NationalOceanic and Atmospheric Administrationor the U.S. Department of Commerce.Use for publicity or advertising purposes ofinformation published in the Earth SystemMonitor concerning proprietary productsor the tests of such products is notauthorized.
U.S. DEPARTMENT OF COMMERCEWilliam M. Daley, Secretary
National Oceanic andAtmospheric Administration
D. James Baker,Under Secretary and Administrator
NA
TIO
NA
LO
CEA
NICAND ATMOSPHERIC
ADMIN
IST
RA
TIO
N
U.S. DEPARTMENT OF COMMER
CE
1Laboratory for Satellite AltimetryNOAA/NESDIS/NODCSSMC3, 3rd Floor1315 East-West HighwaySilver Spring, MD 20910E-mail: [email protected]
2Naval Research Laboratory4555 Overlook Avenue, SWWashington, DC 20375E-mail: [email protected]
3Department of Space and Climate PhysicsUniversity College LondonMullard Space Science LaboratoryHolmbury St. Mary, DorkingSurrey RH5 6NT, United KingdomE-mail: [email protected] —continued on page 4
Indeed, the results of the gravitycomparisons which are reported belowindicate that both techniques do a goodjob of resolving short spatial wave-lengths and hence can be used in map-ping the tectonic fabric of the Arcticseafloor. Many of these results were alsoreported at the 1998 meeting of theEuropean Geophysical Society (McAdooet al., 1998).
ERS-1 and -2 altimetryERS-1 (Figure 1) is the European
Space Agency’s remote sensing satellite
which operated from 1991 to 1996 in ahigh-inclination (81.6°) orbit. Laxonand McAdoo (1994) showed that 35days’ worth of radar altimeter data fromERS-1 could be used to derive a moder-ate-resolution gravity field of the largelyice-covered circum-Arctic Ocean,thereby extending existing altimetricgravity fields of the global ocean(Sandwell and Smith, 1997) north to81.5° N.
However, standard ERS data oceanproducts (OPRs from the tracker onboard ERS-1) of sea surface height couldnot be used because the highly specular,radar echoes from sea ice confuse theonboard data processor. A careful andlaborious analysis of the full ERS wave-form (WAP) data set (much larger thanthe OPR data set) is necessary prior toestimating Arctic Ocean sea surface to-pography and gravity. Suitable wave-forms (WAPs) are reprocessed using asimple threshold-retracking algorithmto recover acceptable estimates of seasurface height and thence along-trackslope. The slopes are then used to com-pute the gravity field, i.e., free-air grav-ity anomalies at sea level, usingestablished methods (Sandwell andSmith, 1997; Laxon and McAdoo, 1994;McAdoo and Marks, 1992). Althoughthis first ERS-1 circum-Arctic Ocean
▲ Figure 2. ERS-1/ERS-2 satellite marine gravity in the Canada Basin and five NRLaerogeo-physical groundtracks (in white). Line ‘5’ crosses the Chukchi Borderland. Notethe gravity low labelled CBR (Canadian Basin Ridge) indicating an apparent extinctspreading axis of the Canada Basin.
Satellite & airborne gravity, from page 1

3September 1998 EARTH SYSTEM MONITOR
News briefsKurt J. Schnebele named DeputyDirector of NODC Kurt J. Schnebele, an oceanographerwith extensive experience in field work,data processing and analysis, and techni-cal program management, has beennamed Deputy Director of the NationalOceanographic Data Center (NODC) inSilver Spring, MD. The Center is part ofthe Commerce Department’s NationalOceanic and Atmospheric Administration(NOAA). The facility is the nation’s reposi-tory and dissemination center for globaloceanographic data. It manages and dis-tributes physical, chemical, and biologicaloceanographic data collected by organiza-tions in the United States and dozens ofother countries around the world. “I’m very proud to be at NODC. It’s agreat institution with a vital role to serveboth nationally and internationally,”Schnebele said. Schnebele retired from the NOAACorps in 1997 after serving for 26 years.He served aboard several NOAA ships,including Oceanographer, Peirce, and wascommanding officer of the Ferrel and R/VVickers. On shore, he served with the Na-tional Ocean Service and NOAA’s AtlanticMarine Center. He also was an assistantprofessor at the Naval PostgraduateSchool and, most recently, the executivedirector of NOAA’s Office of Oceanic andAtmospheric Research. Schnebele holds a B.S. and M.S. inoceanography from the University ofWashington and the Naval PostgraduateSchool, respectively. His awards includethe Navy Commendation Medal, twoNOAA Commendation Medals, NOAASpecial Achievement Awards, and unitcitations.
NWS releases service assessmentfor 1998 ice storm and flood
A National Weather Service (NWS)assessment of services provided during theice storm and flood of January 1998 innorthern New England and northern NewYork has been completed and is availableon the Web at: http://www.nws.noaa.gov /om/omdis.htm.
The extent and magnitude of thisstorm was unprecedented in New Englandhistory, according to John T. Forsing, di-rector, Eastern Region, NWS. The teamthat documented NWS performance infulfilling its mission of providing accurateforecasts and timely warnings prior to,during and after the ice storm and flood
of January 1998 found that warning coor-dination and communications by the NWSfield offices and the NWS Hydrometeoro-logical Prediction Center were excellent.The NWS issued the first alert of the im-pending ice storm up to three days inadvance of the event. As the storm un-folded, warnings provided 12 to 39 hoursof lead time before the severe icing devel-oped.
Flood potential statements were is-sued up to two and a half days before theflooding materialized. A survey of NWScustomers found that the early forecastshelped utility companies and emergencymanagement officials deploy staffs earlyand take appropriate preparedness ac-tions. In many instances, states of emer-gency were declared based on theforecasts to ensure a rapid response oncethe storm developed. The NWS officesproviding services during the storm were:Gray, Maine; Albany, N.Y.; Taunton,Mass.; Burlington, Vt.; Buffalo, N.Y.;Northeast River Forecast Center, Taunton,Mass.; and NWS HydrometeorologicalPrediction Center, Camp Springs, Md.
Fire monitoring in South AmericaThe 1998 fire season in the southern
Amazon region is expected to be worsethan normal. An Interagency WorkingGroup has been formed to address theconcerns of the Brazilians as relayedthrough the U.S. Embassy in Brasilia.NOAA’s National Environmental Satellite,Data, and Information Service was askedby the State Department and U.S. Aid toInternational Development to monitorfires and vegetation stress as determinedfrom imagery recorded on POES, GOES,and DMSP satellites.
Increased radiation hazards to theinternational space station
The Committee on Solar and SpacePhysics (CSSP) is reviewing the Interna-tional Space Station (ISS) for NASA in lightof its change in orbital inclination fromabout 20 to 51 degrees. At 51 degrees,ISS astronauts will encounter significantlyincreased doses of radiation from theouter radiation belts of the near-Earthspace environment, especially during ex-tra-vehicular activity needed to constructthe ISS. The National Geophysical Data
Center was asked to study the outer radia-tion belts using POES Space EnvironmentMonitor and DMSP auroral particle mea-surements and to report back to CSSP/CSTR.
GCIP Mississippi River ClimateConference
Drs. Tingjun Zhang and RichardArmstrong, National Snow and Ice DataCenter (NSIDC), attended the recent Glo-bal Energy and Water Cycle Experiment(GEWEX) Continental-Scale InternationalProject (GCIP) Mississippi River ClimateConference, in St. Louis, MO. Their pre-sented paper “Detection of frozen soilextent in the Upper Mississippi River dur-ing winter of 1997-1998 over snow-freeland surface using passive microwave re-mote sensing data” could provide a re-gional scale frozen soil extent for globalcirculation model and hydrological modelvalidation. Also, in situ data gathered bythe GCIP community can be used for fur-ther validation of the remote sensed fro-zen soil extent in the region. Additionally,Tingjun Zhang presented NSIDC’s dataproducts at the GCIP Summer School onData Sets (also at the University of St.Louis).
Coral reefs to get protectionAt the National Ocean Conference in
Monterey, Calif., President Clinton andVice President Gore launched a series ofmajor initiatives to explore, protect andrestore America’s vital ocean resources.One of these efforts is dedicated to pro-tecting coral reefs. To strengthen protec-tion of natural coral reefs in U.S. waters,President Clinton signed an executiveorder directing Federal agencies to expandresearch, preservation and restorationactivities. The President is proposing anadditional $6 million through 2002 tospeed these efforts and complete restora-tion of 18 damaged reefs in the Atlantic,Caribbean and Pacific.
The Year of the Ocean falls on theheels of last year’s International Year of theCoral Reef. This initiative builds on theefforts that began last year. For moreonline information on Year of the Ocean,please see : www.yoto98.noaa.gov. Formore online information on the Year ofthe Coral Reef (97) see: www.noaa.gov/public-affairs/coral-reef.html. For more in-formation on this initiative, please contactMatt Stout at 202-482-6090.
4 September 1998EARTH SYSTEM MONITOR
gravity field was based on a smallamount (35-days) of data and hencehad limited accuracy and resolution, itrepresented a leap forward in Arcticscience.
With the shutdown of ERS-1 in1996, an improved Arctic Ocean gravityfield (Laxon and McAdoo, 1998) wasderived using all available ERS-1 dataincluding the geodetic phase data. ThisERS-1-only field is available on theWWW at http://ibis.grdl.noaa.gov/SAT orat http://msslsp.mssl.ucl.ac.uk:80/people/swl/. Laxon and McAdoo have contin-ued to significantly improve the ERSArctic Ocean gravity field by incorpo-rating the many new repeat cycles ofaltimeter (WAP) data from the ERS-2satellite.
ERS-2 was launched in 1995 andcontinues to observe along the same35-day groundtrack begun by ERS-1. Byincorporating these ERS-2 WAP datainto the gravity estimation, one contin-ues to reduce measurement noise fromsea ice and other sources. Further im-provements have been realized via re-finements in waveform processing and
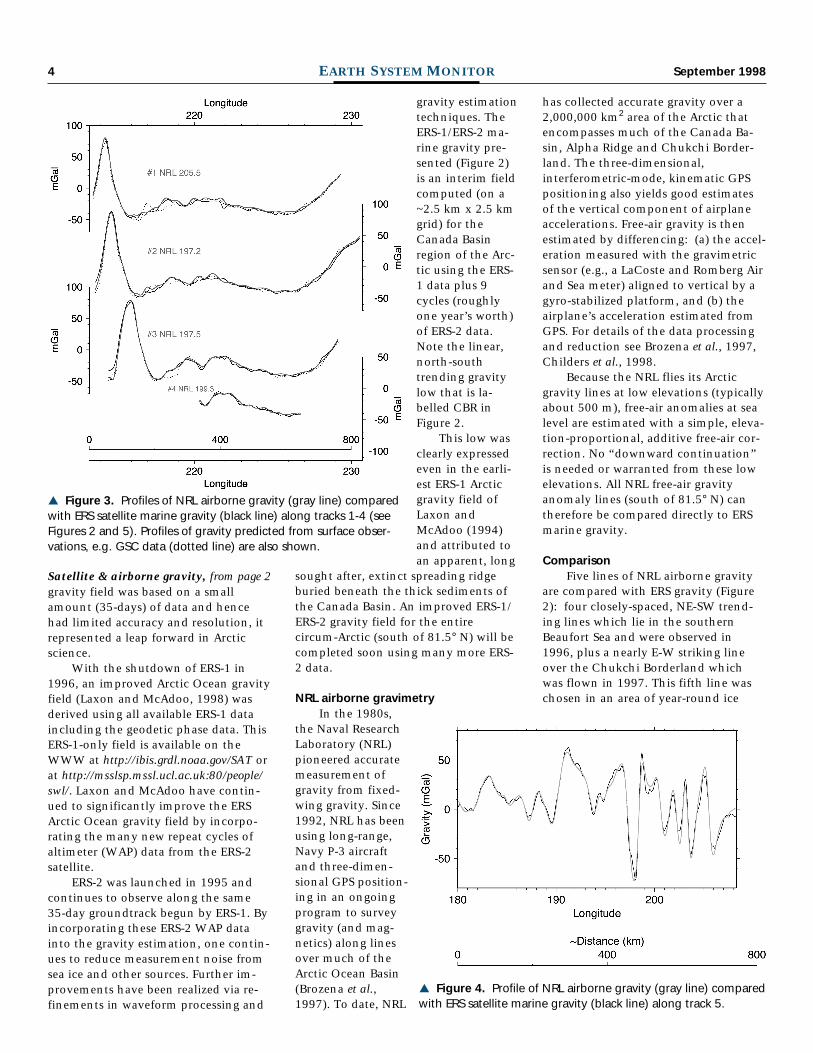
gravity estimationtechniques. TheERS-1/ERS-2 ma-rine gravity pre-sented (Figure 2)is an interim fieldcomputed (on a~2.5 km x 2.5 kmgrid) for theCanada Basinregion of the Arc-tic using the ERS-1 data plus 9cycles (roughlyone year’s worth)of ERS-2 data.Note the linear,north-southtrending gravitylow that is la-belled CBR inFigure 2.
This low wasclearly expressedeven in the earli-est ERS-1 Arcticgravity field ofLaxon andMcAdoo (1994)and attributed toan apparent, long
sought after, extinct spreading ridgeburied beneath the thick sediments ofthe Canada Basin. An improved ERS-1/ERS-2 gravity field for the entirecircum-Arctic (south of 81.5° N) will becompleted soon using many more ERS-2 data.
NRL airborne gravimetryIn the 1980s,
the Naval ResearchLaboratory (NRL)pioneered accuratemeasurement ofgravity from fixed-wing gravity. Since1992, NRL has beenusing long-range,Navy P-3 aircraftand three-dimen-sional GPS position-ing in an ongoingprogram to surveygravity (and mag-netics) along linesover much of theArctic Ocean Basin(Brozena et al.,1997). To date, NRL
has collected accurate gravity over a2,000,000 km2 area of the Arctic thatencompasses much of the Canada Ba-sin, Alpha Ridge and Chukchi Border-land. The three-dimensional,interferometric-mode, kinematic GPSpositioning also yields good estimatesof the vertical component of airplaneaccelerations. Free-air gravity is thenestimated by differencing: (a) the accel-eration measured with the gravimetricsensor (e.g., a LaCoste and Romberg Airand Sea meter) aligned to vertical by agyro-stabilized platform, and (b) theairplane’s acceleration estimated fromGPS. For details of the data processingand reduction see Brozena et al., 1997,Childers et al., 1998.
Because the NRL flies its Arcticgravity lines at low elevations (typicallyabout 500 m), free-air anomalies at sealevel are estimated with a simple, eleva-tion-proportional, additive free-air cor-rection. No “downward continuation”is needed or warranted from these lowelevations. All NRL free-air gravityanomaly lines (south of 81.5° N) cantherefore be compared directly to ERSmarine gravity.
ComparisonFive lines of NRL airborne gravity
are compared with ERS gravity (Figure2): four closely-spaced, NE-SW trend-ing lines which lie in the southernBeaufort Sea and were observed in1996, plus a nearly E-W striking lineover the Chukchi Borderland whichwas flown in 1997. This fifth line waschosen in an area of year-round ice
▲ Figure 3. Profiles of NRL airborne gravity (gray line) comparedwith ERS satellite marine gravity (black line) along tracks 1-4 (seeFigures 2 and 5). Profiles of gravity predicted from surface obser-vations, e.g. GSC data (dotted line) are also shown.
▲ Figure 4. Profile of NRL airborne gravity (gray line) comparedwith ERS satellite marine gravity (black line) along track 5.
Satellite & airborne gravity, from page 2

5September 1998 EARTH SYSTEM MONITOR
—continued on page 6
cover and represents a more stringenttest inasmuch as the southern ends ofthe other four lines include seas occa-sionally free of ice, and seasonally ice-free seas are accessible withconventional altimetric methods.
By interpolating (using a bicubicoption in GMT) the dense, 2.5 km, ERS-1/ERS-2 field marine gravity field de-scribed above (Figure 2) onto NRL flightlines, we constructed the comparisonplots shown in Figures 3 and 4. Theagreement between ERS altimetric grav-ity and NRL aerogravity is excellent.Table 1 presents summary statistics.Coherency represents well the short-wavelength, limit of resolution. Thecoherencies listed in this table are com-parable to those observed betweenhigh-quality shipboard and conven-tional altimetric gravity which lie inthe range of 23 to 30 km (e.g., Sandwelland Smith, 1997, Marks, 1996) in non-polar, ice-free seas. We describe (paperin preparation) the detailed significance—and techniques for estimation—ofthese coherencies. Simply put: short-wavelength limits of resolution on or-der of 20 to 35 km imply that bothairborne and retracked ERS gravity do agood job of resolving short spatialwavelengths and hence can be used toeffectively map tectonic fabric of theArctic seafloor. The apparent extinctspreading ridge in the Canada Basin(CBR in Figure 2) is but one example.
Note in Figure 3 that the NRL air-borne profiles 1-4 and correspondingERS gravity estimates are comparedwith gravity prediction from surfacegravity (dotted). Profiles 1-4 were cho-sen precisely because they overfly aregion of extraordinarily dense gravitymeasurements (Figure 5) taken on icefrom the surface of the southeasternBeaufort Sea using primarily helicopterlandings. These point measurements,compiled by the Geological Survey of
Canada (GSC) were observed for explo-ration purposes and are spaced approxi-mately 5 km apart in an orthogonal grid.
Much of the Arctic Ocean is devoidof surface gravity observations. There-fore these data provide a unique oppor-tunity in the Arctic to “groundtruth” orassess the quality of these new fielddeterminations, as well as compare thecorrespondence of the two data sets.Note for example, for line 4 in Table 1that the RMS difference between anyone of the three gravity types—ERS,airborne or surface—and any other, isalways 1.9 mGal (1 mGal=10-3 gal; 1 gal,named for Galileo, equals 1 cm·s-2) orless. Generally speaking, the ERS andairborne gravity agree with one anotherapproximately as well as each agreeswith the gravity from GSC surface ob-servations.
Note, however, that west of 220° Elongitude, where the dense GSC surface
# NRL Track RMS Difference Coherency/Resolution Limit1 205.5 3.3 mGal 39 +/-5 km2 197.2 3.8 mGal 34 +/-43 197.5 4.1 mGal 36 +/-54 199.3 1.9*mGal **5 183.2 4.6 mGal 19 +/-4 km
▲ Table 1. ERS-1,2 satellite gravity (NOAA/UCL) vs. airborne gravimetry (NRL)
* RMS Difference between ERS gravity and GSC surface gravity along track 4 is 1.5 mGal** Track too short to estimate coherency.
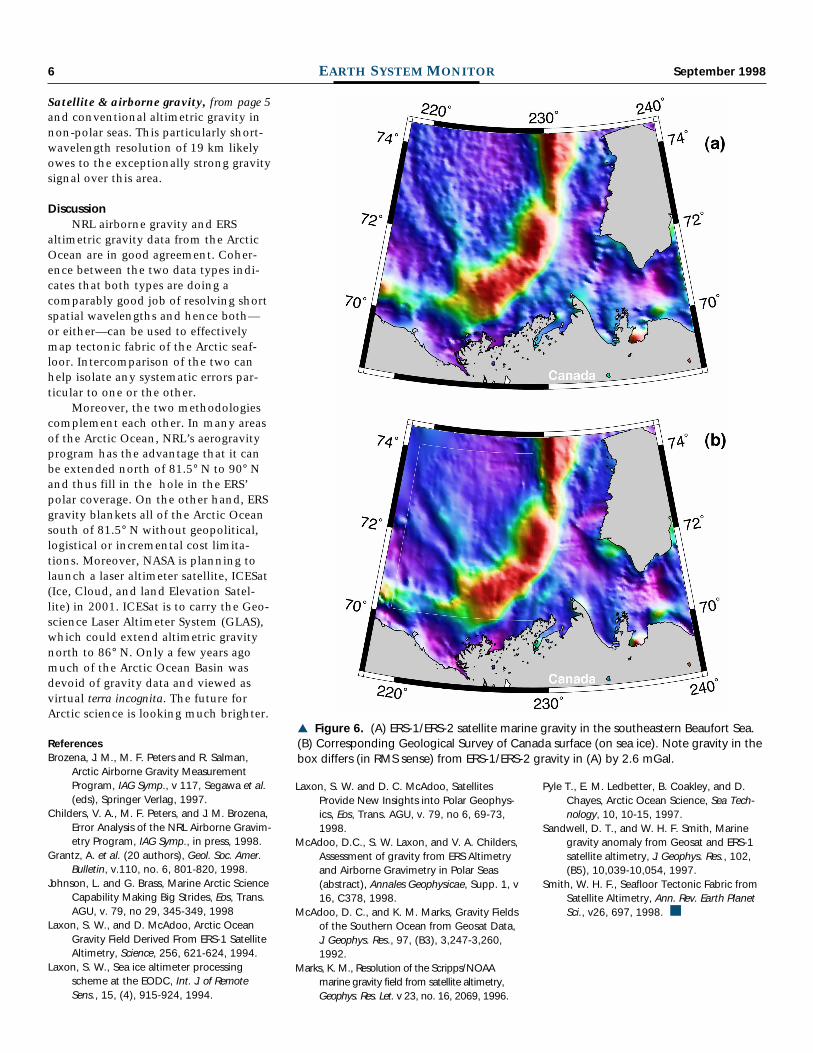
observations are replaced by sparseshipboard gravity (profiles 1-3 in Fig-ures 3 and 4) causing the “ground-truth” to be slightly discrepant, i.e.,less-than-truthful. In Figures 6A and 6B,ERS satellite marine gravity is visuallycompared in both dimensions with theGSC surface (on sea ice) in the south-eastern-most Beaufort Sea. A 2.6 mGal,RMS difference observed (see Figure 6)between the ERS and surface gravitytestifies to the precision the ERS gravityand therefore further validates thestrong agreement we see between ERSand NRL aerogravity. These compari-sons with surface data reveal variousstrengths and weaknesses of both of thetechniques.
In Figure 4 a profile of NRL air-borne gravity across the Chukchi Bor-derland is compared with ERS marinegravity along track 5. The very “rough”or strong gravity signal—due to rifts/grabens in the highly deformed conti-nental crust of this area (Grantz et al.,1998)—is clearly, and similarly, re-solved in both NRL airborne and ERSgravity. Note the ~30 km wavelength,100+ mGal gravity anomalies on thisline. Note also that coherency for line 5(Table 1) is 19 km which is decidedlybetter than those for profiles 1-3 andslightly better even than coherencies(23-30 km; above) between shipboard
▲ Figure 5. Distribution of GSC surface (on sea ice) gravity and shipborne gravity. NRLaerogeophysical groundtracks 1-4 (thick).
6 September 1998EARTH SYSTEM MONITOR
and conventional altimetric gravity innon-polar seas. This particularly short-wavelength resolution of 19 km likelyowes to the exceptionally strong gravitysignal over this area.
DiscussionNRL airborne gravity and ERS
altimetric gravity data from the ArcticOcean are in good agreement. Coher-ence between the two data types indi-cates that both types are doing acomparably good job of resolving shortspatial wavelengths and hence both—or either—can be used to effectivelymap tectonic fabric of the Arctic seaf-loor. Intercomparison of the two canhelp isolate any systematic errors par-ticular to one or the other.
Moreover, the two methodologiescomplement each other. In many areasof the Arctic Ocean, NRL’s aerogravityprogram has the advantage that it canbe extended north of 81.5° N to 90° Nand thus fill in the hole in the ERS’polar coverage. On the other hand, ERSgravity blankets all of the Arctic Oceansouth of 81.5° N without geopolitical,logistical or incremental cost limita-tions. Moreover, NASA is planning tolaunch a laser altimeter satellite, ICESat(Ice, Cloud, and land Elevation Satel-lite) in 2001. ICESat is to carry the Geo-science Laser Altimeter System (GLAS),which could extend altimetric gravitynorth to 86° N. Only a few years agomuch of the Arctic Ocean Basin wasdevoid of gravity data and viewed asvirtual terra incognita. The future forArctic science is looking much brighter.
ReferencesBrozena, J. M., M. F. Peters and R. Salman,
Arctic Airborne Gravity MeasurementProgram, IAG Symp., v 117, Segawa et al.(eds), Springer Verlag, 1997.
Childers, V. A., M. F. Peters, and J. M. Brozena,Error Analysis of the NRL Airborne Gravim-etry Program, IAG Symp., in press, 1998.
Grantz, A. et al. (20 authors), Geol. Soc. Amer.Bulletin, v.110, no. 6, 801-820, 1998.
Johnson, L. and G. Brass, Marine Arctic ScienceCapability Making Big Strides, Eos, Trans.AGU, v. 79, no 29, 345-349, 1998
Laxon, S. W., and D. McAdoo, Arctic OceanGravity Field Derived From ERS-1 SatelliteAltimetry, Science, 256, 621-624, 1994.
Laxon, S. W., Sea ice altimeter processingscheme at the EODC, Int. J. of RemoteSens., 15, (4), 915-924, 1994.
Laxon, S. W. and D. C. McAdoo, SatellitesProvide New Insights into Polar Geophys-ics, Eos, Trans. AGU, v. 79, no 6, 69-73,1998.
McAdoo, D.C., S. W. Laxon, and V. A. Childers,Assessment of gravity from ERS Altimetryand Airborne Gravimetry in Polar Seas(abstract), Annales Geophysicae, Supp. 1, v16, C378, 1998.
McAdoo, D. C., and K. M. Marks, Gravity Fieldsof the Southern Ocean from Geosat Data,J. Geophys. Res., 97, (B3), 3,247-3,260,1992.
Marks, K. M., Resolution of the Scripps/NOAAmarine gravity field from satellite altimetry,Geophys. Res. Let. v 23, no. 16, 2069, 1996.
Satellite & airborne gravity, from page 5
▲ Figure 6. (A) ERS-1/ERS-2 satellite marine gravity in the southeastern Beaufort Sea.(B) Corresponding Geological Survey of Canada surface (on sea ice). Note gravity in thebox differs (in RMS sense) from ERS-1/ERS-2 gravity in (A) by 2.6 mGal.
Pyle T., E. M. Ledbetter, B. Coakley, and D.Chayes, Arctic Ocean Science, Sea Tech-nology, 10, 10-15, 1997.
Sandwell, D. T., and W. H. F. Smith, Marinegravity anomaly from Geosat and ERS-1satellite altimetry, J. Geophys. Res., 102,(B5), 10,039-10,054, 1997.
Smith, W. H. F., Seafloor Tectonic Fabric fromSatellite Altimetry, Ann. Rev. Earth PlanetSci., v26, 697, 1998. ■

7September 1998 EARTH SYSTEM MONITOR
—continued on page 8
Erik C. Zobrist, PhD and Tim OsbornNOAA Habitat Restoration CenterNOAA/NMFS
Two large dredging projects arenearing completion in the AtchafalayaRiver delta (Figure 1), creating new wet-land habitats in coastal Louisiana.These projects, sponsored by NOAA’sNational Marine Fisheries Service(NMFS) and the Louisiana Departmentof Natural Resources (DNR), are locatedabout 18 miles southwest of MorganCity, Louisiana. When completed, theBig Island and Atchafalaya SedimentDelivery Projects will immediately cre-ate over 900 acres of wetlands by strate-gic placement of dredged material.
The projects will cause another3,000 acres to be created through natu-ral processes over the next 20 years.Funding for the wetland restorationwork is through the Coastal WetlandsPlanning, Protection and RestorationAct (Pub. L. No. 101-646, Title III-CWPPRA), also know as the “BreauxAct” after Senator John B. Breaux ofLouisiana who led the effort to enactthe legislation.
Five Federal agencies and the Stateof Louisiana are joined in a Task Forceto implement the “comprehensive ap-proach to restore and prevent the lossof coastal wetlands in Louisiana” man-dated by CWPPRA. The five Federalagencies involved are: the U.S. Depart-ment of the Army, the U.S. Departmentof Commerce (i.e., NMFS), the U.S.Department of Interior, the U.S. De-partment of Agriculture, and the U.S.Environmental Protection Agency. Ap-proximately $40 million per year infederal funding is available for Louisi-ana wetlands protection and restora-tion projects approved by the CWPPRATask Force.
Louisiana contains over 40% ofthe coastal wetlands in the contiguousUnited States. These wetlands supportthe ecological, economic, cultural,aesthetic, and recreational needs ofboth the State and the nation. They arethe source of much of the nation’s oiland natural gas, they provide habitatfor many species of plants and wildlife,and they serve as a vitally importantnursery for commercially importantfisheries. Louisiana waters alone con-tributed 75% of the total Gulf ofMexico region fisheries harvest byweight in 1995 and 1996, generatingnearly $280 million in dockside value.
The natural processes of accretionand erosion that constantly create anddestroy coastal wetlands have histori-cally existed in relative equilibrium.But human activities have disruptedthat equilibrium and now jeopardizethe future health of the state’s wet-lands, and hence the resources thatthey support. Louisiana’s marshes areeroding at an estimated rate of 25square miles per year, which accounts
for roughly 80% of total nationalcoastal wetland loss. Without interven-tion, the losses within the next 50years could total 800,000 acres.
Natural expansion of the Atchafa-laya River Delta has been hampered bythe deposition of material dredgedfrom the Federal navigation channeland is the focus of the Big Island andAtchafalaya Sediment Deliveryprojects. Big Island was created in 1973as a designated disposal site fordredged material generated duringmaintenance dredging of navigationchannels within the Atchafalaya Riverdelta. Resulting from frequent disposalof dredged material at this location,Big Island, which is located just west ofthe navigation channel, presently con-tains 1,070 acres and has an elevationof +10 to +12 feet National GeodeticVertical Data (NGVD), the highestpoint in the Atchafalaya coastal basin.Big Island effectively blocks the flow ofwater and sediments to the westernreaches of Atchafalaya Bay and thus
NOAA Fisheries and the state of Louisianajoin forces in large wetlands reconstruction project
Successful joint project creates 900 acres of new wetlands
NOAA Habitat Restoration CenterNOAA/NMFSSSMC3, 14th Floor1315 East West HighwaySilver Spring, MD 20910E-mail: [email protected]; [email protected]
▲ Figure 1. Atchafalaya River Delta and site of Big Island and Atchafalaya SedimentDelivery projects (Photo courtesy of NASA Goddard Space Flight Center).

8 September 1998EARTH SYSTEM MONITOR
impedes the natural delta growth ofwetlands.
The Atchafalaya Sediment Deliveryproject centers on two distributarychannels, Natal Channel and Castille/Radcliffe Pass, located to the east of thenavigation channel. These two chan-nels represent pathways for suspendedsediment to flow into the more easternregions of the Atchafalaya Bay. Thesechannels became blocked partly as aresult of the movement of materialdredged from the Atchafalaya River fornavigation purposes.
Because coastal wetlands evolveslowly as a result of annual sedimentdeposition and organic accumulation, areduction in the volume of sedimentand frequency of deposition reducesdelta growth and marsh expansion andmay even cause a net erosion of newlycreated wetlands. The goal of these twoprojects was to enhance sediment deliv-ery throughout the delta, which in-volved the creation of new distributarychannels north and west of Big Islandand the reopening of two existing dis-tributary channels, Natal Channel andCastille/Radcliffe Pass to the east.
In addition to creating or reopen-ing channels, knowledge of delta ex-pansion within the Atchafalaya Baysuggested that strategic placement of
spoil at the point of channel bifurca-tion could create elevations whichwould be conducive to the establish-ment of wetland vegetation and wouldenhance long-term delta development.During flood events, water from thechannel would flow over this man-made bank and deposit sediment be-hind the spoil area due to the reducedvelocity of the water. Thus, strategicplacement of dredged material from the
dredging activity to establish east-westdistribution channels can also createlobe islands and wetlands, two com-mon characteristics of natural deltadevelopment and growth.
The dredge disposal requirementsof the project called for placement ofcreated lobe islands to elevation +3.0NGVD and contiguous wetlands behindthe islands at elevation of +1.5 NGVDto mimic the natural delta buildingprocess. Through a competitive process,two bids were received by the state withthe winning bid submitted by River/Road Construction, Inc. of Mandeville,LA, for the $7.5 million project.
Most of the cutterhead dredgingwas performed by the 108-foot dredgeKatrina (20" discharge, 2150 hp) withsupport from the 70-foot dredge NorthCarolina (20" discharge, 1125 hp).River/Road, Inc. has been pumpingabout 20,000 cubic yards/day depend-ing on sediment quality (Figure 2). Ma-jor containment diking (Figure 3) wasconstructed with the contract bucketdredge, Capt. Bufford Berry (8-yardbucket, 140' boom).
The Big Island project entails con-struction of several new distributarychannels having a combined length ofabout 36,750 feet, extending from theAtchafalaya River into the shallow wa-ters west of Big Island. About 3.3 mil-lion cubic yards of dredged materialwill be placed in a pattern to mimic
▲ Figure 2. Hydraulic dredge Katrina pumping material into containment area on BigIsland project site. (Photo courtesy of Dr. Erik Zobrist, NOAA Habitat Restoration.)
▲ Figure 3. Bucket dredge, Capt. Bufford Berry, constructing containment levee inAtchafalaya Sediment Delivery site. (Photo courtesy of Dr. Erik Zobrist, NOAA HabitatRestoration.)
Wetlands, from page 5

9September 1998 EARTH SYSTEM MONITOR
– continued on page 16
natural delta wetlands and create a sys-tem of distributary channels which willtransport water and sediments through-out the western reaches of the projectarea. Construction started in Marchand is expected to be completed bySeptember, 1998.
The Atchafalaya Sediment Deliveryproject, which was completed inMarch, 1998, reopened two distributarychannels having a combined length ofabout 12,400 feet, extending from theEast Pass channel of the AtchafalayaRiver, through Natal Channel andRadcliffe Pass, and into the shallowwaters east of the existing delta. About670,000 cubic yards of dredged materialwas deposited to create delta wetlandsas in the Big Island project.
Together, the projects will restorefreshwater and sediment delivery pro-cesses to the delta. Project constructionis creating over 900 acres of deltaic wet-lands through careful placement ofdredged sediment. Additionally, theprojects will re-establish the naturaldeltaic growth processes by creatingnew or reopening silted-in channels(Figure 4) throughout the delta andallowing water and sediment to flowthrough the delta. Natural deltagrowth, enhanced by the projects, isexpected to create more than 3,000more acres of wetlands habitat over thenext 20 years.
Already, marsh grass and othervegetation are growing on the newly
created lands. Alligators and numerousspecies of birds—including ducks, rose-ate spoonbills, black terns and Ameri-can egrets—have been observed usingthe new delta wetlands. Several speciesof fish also have been seen in watersadjacent to the new islands.
Federal funds provided by CWPPRAwere awarded by NOAA to the Louisi-ana DNR in 1994. Projects are cost-shared (85% federal, 15% state) forengineering and design, constructionand monitoring. The DNR awardedcontracts for engineering and design,
then construction, and will monitorpost-construction operations whileNMFS was responsible for meeting nu-merous regulatory requirements such ascultural resources, project permits, andenvironmental compliance with Stateand Federal law.
Engineering and design, by Brown,Cunningham & Gannuch, Inc., of Ba-ton Rouge, LA, was challenging due tothe proximity of the projects to thefederal navigation channel and locationwithin a state wildlife preserve. Thisrequired close coordination with theU.S. Army Corps of Engineers and theLouisiana Department of Wildlife andFisheries.
While the projects utilized stan-dard dredging techniques, they wereunique in their exacting dredged mate-rial placement requirements. The suc-cessful implementation of the projectsrequired the dredging contractor tofully understand the environmentalobjectives and the stringent design re-quirements necessary to achieve thebeneficial goals of the project. Engi-neering plans and specifications calledfor more than simple dredging. Forexample, containment areas (Figure 5)were designed with exacting elevationsand slopes which were necessary tosupport wetlands vegetation and wild-life. This required the contractor toschedule work to accommodate the
▲ Figure 4. Marsh buggy inside containment area moving sediment away from dis-charge pipe. (Photo courtesy of Dr. Erik Zobrist, NOAA Habitat Restoration.)
▲ Figure 5. Aerial view of the Big Island projects area. The three containment areascover approximately 200 acres of created wetlands. (Photo courtesy of Dr. Erik Zobrist,NOAA Habitat Restoration.)

10 September 1998EARTH SYSTEM MONITOR
Hydrographic - physical and chemical measurements from continuous samplinglowered instruments and bottle samples along 73 one-time sections and 65 repeatedlysampled sections and time series stations.
Bathymetry - high quality depth measurements along hydrographic survey cruise tracks.
Current meter - upper, mid, and deep ocean multi-instrument current meter moorings,some with additional parameters, from 39 sites.
Subsurface Floats - over 2,140 subsurface drifting floats which were tracked acousticallyor by satellite.
Surface drifting buoys - ocean surface velocity measured by over 4,300 surface driftingbuoys, some with atmospheric pressure sensors.
Acoustic Doppler Current Profiler (ADCP) - upper ocean currents measured by ship-mounted ADCP instruments while underway on over 200 cruises.
Expendable Bathythermograph (XBT) - upper ocean depth-temperature profiles (over 200thousand) measured along 80 WOCE XBT track-lines.
Surface meteorology - marine surface meteorological observations collected on over 150WOCE research cruises.
In situ sea level - sea level data derived from tide station records from 160 global sites.
Satellite - Global sea surface temperature data from the National Oceanic & AtmosphericAdministration (NOAA) Advanced Very High Resolution Radiometer.
Satellite - Global sea level data from the TOPEX/POSEIDON satellite.
▲ Table 1. Measurement systems in the WOCE Observation Program.
Oceans and the Earth’s climate:the World Ocean Circulation Experiment
CD-ROM set contains data from largest internationally coordinated global ocean program
National Oceanographic Data CenterNOAA/NESDISSSMC3, 3rd Floor1315 East-West HighwaySilver Spring, MD 20910E-mail: [email protected]
Douglas R. HamiltonNational Oceanographic Data CenterNOAA/NESDIS
Oceanographers from twenty-fivecountries around the globe are finish-ing work on what is the largest interna-tionally coordinated global oceanobservation program to date. From1990 to the present, the world’s oceanshave been observed, measured, sampledand monitored by instrumented ships,moored buoys, satellites, surface andsubsurface floats and tide stations. Thiscomprehensive observation programwas developed by the World OceanCirculation Experiment (WOCE)project to gain a better understandingof the world ocean and its relationshipto earth’s climate. The first release ofdata from this comprehensive program,“WOCE Global Data, Version 1”, isavailable from the National Oceano-graphic Data Center.
Climate changeExtremes of heat, storms, floods
and drought in different regions of theglobe have captured our attention inrecent years and added weight to theargument that our climate is changing.For many years, the ocean’s role inthese changes was unknown and as-sumed to be minor. As recently as theearly 1970s, oceanographers and me-teorologists were largely unaware of thetight link between ocean and atmo-sphere in El Niño/Southern Oscillation(ENSO) events. However, as new tropi-cal Pacific Ocean measurements re-vealed tantalizing glimpses oflarge-scale ocean-atmosphere interac-tions, it became obvious that there wasindeed a connection which needed tobe researched.
In 1983, the World Climate Re-search Program established two Scien-
tific Steering Groups (SSG) to developprograms for improving the predictabil-ity of ocean-atmosphere climate varia-tions. The Tropical Ocean GlobalAtmosphere (TOGA) SSG was set up tofocus on short term seasonal to inter-annual variability, and the WorldOcean Circulation Experiment (WOCE)SSG was given the task of researchingocean roles in climate variations overperiods of several decades to centuries.
The TOGA program was able tolimit ocean sampling to upper layers oftropical oceans, because seasonal-to-inter-annual oceanic variability is con-fined to those depths and latitudes.However, in order to understand andpredict decade-scale global climatevariations, the WOCE project designedan all-inclusive global ocean observa-tion and modeling program.
WOCE DataThe World Ocean Circulation Ex-
periment Science Steering Group set
two goals: (1) to develop models usefulfor predicting climate change and tocollect data necessary to test them, and(2) to determine the representativenessof the specific WOCE data sets for thelong-term behavior of the ocean, and tofind methods for determining longterm changes in the ocean circulation.
The first goal called for large-scaleprograms to measure global ocean cir-culation directly and indirectly. Obser-vation and data management plansdeveloped around several ocean mea-surement systems, listed in Table 1.WOCE observation plans were builtprimarily on existing measurementsystems; but a unique, new instrumentwhich was developed for WOCE willpermanently change how some quanti-ties are measured in future research.
The Autonomous Lagrangian Cir-culation Explorer (ALACE) is a free-floating instrument designed to seek apre-programmed depth, drift withocean currents at that depth, and pop

11September 1998 EARTH SYSTEM MONITOR
up periodically to report its position viasatellite. It proved to be successful andinexpensive, giving almost instant re-sults and lasting for years. Compared toearlier subsurface floats, which requiredacoustic tracking from at least threestations, the ALACE could be trackedsimply by analyzing reports from satel-lites.
Later versions of ALACE (termedPALACE for Profiling ALACE) weremodified to include temperature andconductivity sensors and memory tostore data gathered on its way to thesurface. Hundreds of PALACE floats arenow reporting on subsurface currents aswell as profiles of temperature and sa-linity. Drifter tracks and subsurfaceprofiles from NOAA’s Atlantic Circula-tion and Climate Experiment can befound online at http://www.aoml.noaa.gov/phod/acce/index.html.
WOCE data managementTo properly deal with the vast
amount of highly varied data, and en-sure quality data for ocean models,WOCE developed a data managementsystem of distributed Data AssemblyCenters (DACs) and Special AnalysisCenters (SACs). DACs were establishedfor most of the measurement systemslisted in Table 1, and are responsible fortracking data as it is collected and forgathering data from scientists and dis-tributing it to users.
SACs were established for the Hy-drographic Program and for SurfaceMeteorological Data. As data are madeavailable to SACs, special analyses andproducts are generated as an additionaldata quality review step, and to makeinterim results of WOCE available toresearchers and modelers. The WOCEData Information Unit maintains con-tact with DACs and SACs and acts as acentral information site for up-to-date,online reports of the status and avail-ability of all WOCE data.
The WOCE Archive, located at theU.S. National Oceanographic Data Cen-ter (NODC), will be the long-term re-pository for WOCE data and documen-tation, and ensures that WOCE data arefreely distributed through the system ofWorld Data Centers for Oceanography.
DACs and SACs are located in gov-ernment and academic research labora-tories throughout the world, and meetannually with the WOCE Data Products
Committee to review the status ofWOCE data collection and processing.Each maintains a web site with the lat-est information about its data, and pro-vides access to the data as well. The beststarting point for access to DAC andSAC sites is the Data Information Unitavailable online at http://www.cms.udel.edu/woce.
WOCE Global Data Version 1.0Eight years of WOCE program glo-
bal ocean observations were released bythe WOCE Data Products Committee atthe WOCE Conference (Halifax, N.S.)in May, 1998. Data, documentation,and products are contained in a set ofthirteen compact discs (CD-ROM)which are easily browsed with web-browser software. The discs include allWOCE data that were available in Janu-ary 1998.
Users are cautioned that many datasets have not yet been released byWOCE principal investigators, and arenot included in the Version 1.0 dataset. Release of Version 2.0 data isplanned for early 2000, and the finalversion is expected in 2002.
NOAA National Data Center roles inWOCE data management
The National Geophysical DataCenter in Boulder, Colorado is the DACfor bathymetry data. The NODC,jointly with other centers, supportswork of the Acoustic Doppler CurrentProfile DAC, the Sea Level DAC, andthe Upper Ocean Thermal (UOT) DAC.NODC maintains the Global Tempera-ture Salinity Profile Program database,in which all UOT DAC data and dataquality information are stored.
NODC’s principal role, as WOCEArchive, is to be a good steward of thedata. The WOCE program created whatis the largest and most varied globalocean data set ever generated by oneproject. WOCE data will be used as astandard “snapshot” of the world’soceans for decades to come, so it is im-perative that the data be stored in sucha way that it is preserved completelyand accurately for future uses. As thenation’s center with responsibility forstoring and distributing oceanographicdata, NODC has worked closely withthe WOCE Data Products Committee toensure smooth transfer of data anddocumentation to the center.
What's nextThe WOCE Project’s true benefits
will come from development of modelsto predict global climatic conditionsand regional climate change. TheAnalysis, Interpretation, Modeling, andSynthesis (AIMS) phase of WOCE hasbegun, and is using data collected dur-ing, and prior to, the WOCE observa-tion period. One of the challenges ofthis phase is to merge disparate datatypes into models which integrate thedata in a manner that is scientificallysound. Such work is already underwayat several institutes.
ReferencesInternational TOGA Project Office. TOGA -
Tropical Ocean Global Atmosphere Pro-gram. World Climate ResearchProgramme, 1995. Proceedings of theInternational Scientific Conference on theTropical Ocean Global Atmosphere (TOGA)Programme, WCRP-91, Vol. 1, WMO/TD-No. 717.
World Climate Research Programme, 1986.Scientific Plan for the World Ocean Circula-tion Experiment. WCRP Publication SeriesNo. 6, WMO/TD-No. 122.
WOCE International Project Office, 1997.WOCE Analysis, Interpretation, Modellingand Synthesis (AIMS): Strategy Document.WOCE Report No. 153/97.
WOCE International Project Office, 1997.WOCE Data Guide, 1997. WOCE ReportNo. 150/97.
WOCE, 1998. Abstracts for Talks and Posters atthe 1998 Conference of the World OceanCirculation Experiment, Ocean Circulationand Climate. Halifax, CA. Unpublished. ■

12 September 1998EARTH SYSTEM MONITOR
▲ Figure 1. GOES-8 image of the 1998 Florida wildfires. Note the large smoke plumes over the eastFlorida coastline.
The Commerce Department’s Na-tional Oceanic and Atmospheric Ad-ministration (NOAA) announced inJuly that one of NOAA’s weather satel-lites, GOES-9, was failing as it reachedthe end of its planned life, but that theGOES weather satellite data and imag-ery seen daily on TV weather forecastswould continue to flow without abreak. The smooth transition was dueto a decision to store a backup weathersatellite on orbit to quickly replace afailing one. NOAA’s GOES-10, thenation’s newest geostationary weathersatellite (which was put into a storageorbit and completed operational testingin June) was activated on July 9 in itsposition over the central United States(105° W).
GOES-10 replaced GOES-9 on July28, 1998. GOES-9 showed signs of near-term failure of its attitude control sys-tem in early July. “Both momentumwheels on GOES-9 exhibited problems,”said Kathleen Kelly, director of NOAA’sSatellite Operations Control Center.
“Momentum Wheel 2 failed and wasturned off in June. A few weeks later,Momentum Wheel 1 began experienc-ing extremely high current levels. Weneed at least one wheel in operation tomaintain pointing accuracy.” Once activation began, GOES-10 pro-vided useful data within 72 hours. Thesatellite was repositioned after consulta-tion with the National Weather Service.GOES-10 reached its final operationalstation of 135° W on August 21, 1998.GOES satellite images are best known totelevision viewers as the cloud imagesand movies that are broadcast on TVweather forecasts. “Having a GOES satellite stored onorbit ready to back up the other twoGOES satellites turned out to be an ex-cellent idea,” said Gerald Dittberner,NOAA’s GOES program manager. “It’sthe first time we had ever had a backupsatellite in place. Without such a satel-lite, we would have had to wait as muchas 12 to 15 months to get a launch timeslot. Now we can have GOES-10 trans-
NOAA’s GOES-10 replaces GOES-9
mitting data within 72hours after activation,meeting our programneeds without any lossin data continuity.”Both GOES-8 and
GOES-9 were the firstin a new series of satel-lites and had projectedplanned lifetimes ofthree years. GOES-8,launched four yearsand two months ago,continues to functionwith no significantchanges in the past 18months. GOES-9,launched in May 1995,had reached its pro-jected planned life. Theplanned mission lifefor GOES-10 is fiveyears. The next satellitein the series, GOES-L, isscheduled for launchin May 1999 and willbe stored on orbit.NOAA’s new GOES
series has produced anexcellent set of real-time weather data for
weather forecasters and researchers.Combined with data from Doppler ra-dars and automated surface observingsystems, these satellite data haveproved to be crucial in improvingweather forecasts and numerical mod-els. Better warnings of thunderstorms,winter storms, flash floods, hurricanes,and other severe weather help to savelives, preserve property, and benefitcommercial interests (Figure 1). NOAA’s National EnvironmentalSatellite, Data, and Information Servicefunds and operates the GOES series ofsatellites at the Satellite OperationsControl Center in Suitland, Md. NASA’sGoddard Space Flight Center managesthe design, development, and launch ofthe GOES spacecraft for NOAA.
—Pat VietsNOAA/NESDIS
4401 Suitland Road, FB4Suitland, MD 20233
andJeanne Kouhestani
NOAA/Office of the Under Secretary14th and Constitution, NWWashington, DC 20230 ■
13September 1998 EARTH SYSTEM MONITOR
The Marine Technology Society’s(MTS) annual conference celebrates the1998 International Year of the Ocean.Called the Ocean Community Confer-ence ’98, it will be held from November16 to 19 at the Baltimore ConventionCenter in Baltimore, Maryland. Dr. D.James Baker, Under Secretary of Com-merce for Oceans and Atmosphere, isthis year’s Conference Chair and Dr. W.Stanley Wilson, NOAA’s Deputy ChiefScientist, is the Conference Vice Chair.Captain Fred Klein, USN, is the Execu-tive Assistant. Additionally, 21 organi-zations, including five governmentcomponents with an ocean focus, areactively participating in the conference.
In order to focus on 1998 Interna-tional Year of the Ocean themes, theannual MTS conference format hasbeen changed to include two-hour the-matic plenary sessions each morningfeaturing some of the nation’s senior-most and highly accomplished marinescientists, engineers, educators, attor-neys, and managers. The Plenary Ses-sion on Tuesday the 16th is “TheGlobal Ocean: Influencing Weatherand Climate”; on Wednesday it is “TheCoastal Ocean: Balancing CompetingUse” (Figure 1); on Thursday it is “Eco-nomics: The Ocean and Business”; and
on Friday it is “Exploration in the Sea:The Ocean as a Frontier”.
The Plenary Sessions are followedby a two-hour break in the exhibit hallthat should allow attendees ample op-portunities to have lunch, visit morethan 130 exhibits, and be involved inspecial planned activities. There isan MTS Awards Luncheon onMonday at the Baltimore Confer-ence Center and a dinner onWednesday at the NationalAquarium, the centerpiece ofBaltimore’s famous Inner Harbor.
Each afternoon, there are“track” sessions from 1:00 PM to3:00 PM and from 3:30 to 5:30 PM innine different meeting rooms. Thetracks, or technical topics, include ap-plied ocean sciences; ocean measure-ments systems, marine resources; oceanand coastal engineering; data process-ing and management; communica-tions; maritime commerce andcharting; vehicles, platforms, and ad-vanced technology; marine policy, andeducation. The present count is 311individual 20-minute papers and two60-minute panel sessions
NOAA plans to have open houseson two of its coastal vessels, the 90’Rude and the 65’ Bay Hydrographer; both
Ocean Community Conference ’98
ships employ the latest hydrographictechnologies for nautical charting andsurveying. The Coast Guard plans tohave an open house on one of its new-est buoy tenders, the James Rankin, fea-turing the latest in station keeping andpositioning techniques. The Environ-mental Protection Agency will providethe Peter Anderson, an environmentalresearch platform. The conference plan-ners also expect visits by Army Corps ofEngineers and Navy vessels.
The Ocean Community Conference’98 promises something for everyoneand the new format should bringsharper focus and depth to the majormarine issues and opportunities. Forfurther information and registrationmaterials, call Ms. Vita Feuerstein at 1(800) 810-4333 in the U.S. or Canada,(732) 562-6826 outside the U.S. andCanada, Fax at (732) 981-1203, or e-mail at [email protected].
For those who cannot attend OCC’98, the proceedings can be purchasedfrom the MTS Headquarters Office inWashington, D.C. Please contact theMTS at (202) 775-5966 or Fax: (202)429-9417.
—Dr. Henry R. FreyTechnical Program Chairman, OCC’98
Director, National OceanographicData Center
SSMC3, 4th Floor1315 East-West HighwaySilver Spring, MD 20910
Phone: 301-713-3270 x200Fax: 301-713-3300
E-mail: [email protected] ■▲ Figure 1. Coastal ocean management issues are among the many topics that will beexamined during the Marine Technology Society’s Ocean Community Conference ’98.Information about the conference can be obtained through the NOAA home page at:http://www.publicaffairs.noaa.gov/MTS98.html.

14 September 1998EARTH SYSTEM MONITOR
▲ Figure 1. A “montage“ of antique marine images is presented by the NOAA CentralLibrary in a colorful 11” by 17” poster celebrating the 1998 Year of the Ocean. A colorversion may be viewed online at: http://www.lib.noaa.gov/docs/poster.html.
“Year of the Ocean” poster available from NOAA LibraryNOAA‘s Central Library has pro-
duced and is distributing an 11“ by 17“full-color poster (Figure 1) in support ofthe 1998 Year of the Ocean. Thebrightly colored image is a compositeof images of antique globes, an oldsailing vessel, and ocean waves, reflect-ing the NOAA Central Library’s uniquehistorical collections of manuscriptsand imagery. The overall colors aredominated by rich blues and ambers,and the poster is highly suitable forclassroom use.
Complimentary copies of thisposter can be obtained by contactingMs. Doria Grimes at:NOAA Central Library1315 East-West HighwaySSMC3, Suite 2000Silver Spring, MD 20910Phone: 301-713-2600 x142Fax: 301-713-4599E-mail: [email protected] ■
The National Climatic Data Centerand NASA/Goddard Space Flight Center(GSFC) have developed a prototype todemonstrate the functionality of theproposed NOAA/NASA long term (per-manent) archive for NASA’s Earth Ob-serving System (EOS) data. The proto-type is designed to demonstrate theprocesses involved in acquiring thedata and products, in limited interoper-ability with users, in working co-lo-cated with NASA, and in providingrapid access to data and products.
The Total Ozone Mapping Spec-trometer-Earth Probe (TOMS-EP) dataset and the Upper Atmosphere ResearchSatellite-Micro Limb Sounder (UARS-MLS) data are now available online.The NOAA Prototype Archive Facility atGSFC currently ingests, archives, andprovides access to the data and prod-ucts. NASA and other researchers canaccess the data and products from theNOAA facility. The entire process dem-onstrates the functionality of the longterm archive to receive and service dataand NASA Science Team’s productsfrom the Distributed Active ArchiveCenter (DAAC).
This demonstration fits the NOAAVirtual Data System architecture with a
NOAA facility at NASA GSFC and thedata being serviced from another loca-tion. There will be a six-month evalua-tion phase to ensure suitable access toand servicing of data and products tomeet the general user requirements ofthe U.S. Global Change Research Pro-gram (USGRP), NOAA, and EOS.
NOAA will provide online serviceto NASA as well as to NOAA users. Atthe end of the demonstration, a reportdetailing the transfer, archiving, andservicing functions will be prepared byNOAA and NASA. The report will evalu-ate baseline costs and system needsassociated with the archiving of theEOS data by NOAA.
The report will also evaluate thebenefits of the co-located archive facil-ity and the rapid availability of the EOSdata. The prototype will provide dataaccess to meet initial USGRP require-ments. The report will use the proto-type experience to reanalyze theseUSGRP requirements and the success ofthe prototype to fulfill those require-ments.
Additionally, projections for vari-ous levels of long term archive effortand associated costs will be refined byNOAA and NASA and presented as ad-
ditional costs, above baseline, for pro-viding enhanced data managementsupport services for the MTPE. TheUARS and TOMS data can be obtainedusing the prototype at:
http://www.ncdc.noaa.gov
and going to Satellite Resources> andthen Get/View Data.
—Wayne M. FaasNational Climatic Data Center
Acting Chief, Systems Development StaffFederal Plaza
151 Patton AveAsheville, NC 28801
Phone: 704-271-4296Fax: 704-271-4246
E-mail: [email protected] ■
NASA/NOAA Prototype Long-Term Archive operational

15September 1998 EARTH SYSTEM MONITOR
Data productsand services
CONTACT POINTS
National Climatic Data Center (NCDC)704-271-4800
Fax: 704-271-4876E-mail: Climate Services - [email protected] Satellite Services -
[email protected]: http://www.ncdc.noaa.gov/
National Geophysical Data Center (NGDC)303-497-6419
Fax: 303-497-6513E-mail: [email protected]
WWW: http://www.ngdc.noaa.gov/
National Oceanographic Data Center(NODC)
301-713-3277Fax: 301-713-3302
E-mail: [email protected]: http://www.nodc.noaa.gov
NOAA Environmental Services Data Directory
301-713-0572(Gerry Barton)
Fax: 301-713-1249E-mail: [email protected]
WWW: http://www.esdim.noaa.gov/#data-products
NOAA Central LibraryReference Services:
301-713-2600Fax: 301-713-4599
E-mail: [email protected]: http://www.lib.noaa.gov/
NOAA places information aboutFlorida wildfires online
Information on Florida’s unusualweather that set the stage for its ragingforest fires has been placed on the WorldWide Web by the Commerce Depart-ment’s National Oceanic and Atmo-spheric Administration (NOAA). The Website, developed by NOAA’s National Cli-matic Data Center, was unveiled by VicePresident Al Gore, who visited fire sites.
The Web site, titled “Florida WildFires and Climate Extremes,” explainshow Florida’s unusual weather led to thefires. The unusually wet mild winter inFlorida promoted abundant growth in theunderbrush. This weather was immedi-ately followed by a severe drought duringApril, May and June, which rapidly driedout the dense underbrush. This combina-tion—wet and mild in the winter, dry andhot in the summer—provided abundantfuel to the wildfires throughout Florida.
Details on recent abnormal weather,including temperature and precipitationas well as drought indices, are availableon the Web site. Links to related Websites, such as NOAA satellite imagery ofthe fires and the fire forecast, are pro-vided. The Web site can be reached at:http://www.ncdc.noaa.gov/ol/climate/research/1998/fla/florida.html.Contact: NCDC
NCDC provides climate change,extremes, and events WWW site
With the growing interest in climaticand weather extremes, the National Cli-matic Data Center (NCDC) now has aweb system on line which links to allNCDC web pages related to climatic ex-tremes, weather events, climate change,El Niño, natural disasters, and U.S. clima-tologies for extremes. The recent surge innews media, government, and individualinterest in these topics has led to numer-ous inquiries for data and information,and even the formation of a “Rapid Re-sponse” team at NCDC.
Users can go to a single web page(http://www. ncdc.noaa.gov/ol/climate/severe weather/severeweather.html) to findwhat NCDC has to offer online regardingthese topics. Within this system, users willfind a wealth of data, maps, images (e.g.,satellite, radar), and reports for eachtopic, such as El Niño, 1993-1998Weather Events, U.S. Tornadoes, Histori-cal Global Extremes, and other events.Contact: NCDC
Central Asian snow cover dataThe National Snow and Ice Data
Center (NSIDC) has recently released theCentral Asian Snow Cover from Hydrom-eteorological Surveys data. The data arebased upon observations made by per-sonnel throughout three river basins: theAmu Darya, Sir Darya, and Naryn. Theseobservations include end-of-month snowdepth, snow density and snow waterequivalent for snow points measuredfrom the ground. Only snow depth isincluded for additional snow points mea-sured from the air.
Temporal coverage varies for eachsnow point, with the longest stationrecord extending from 1932 through1990. Data were provided to NSIDC bythe State Hydrometeorological Service(Russian acronym SANIGMI) in Tashkent,Uzbekistan.Contact: NSIDC
NGDC releases WebBook of Natu-ral Hazards Resources
Paula Dunbar and Rich Fozzard of theNational Geophysical Data Center(NGDC) released a new and improvedNatural Hazards Data Resources Directorywith data resources organized by naturalhazard topic and lists of hazard-relatedorganizations. The new release uses theNGDC-developed “WebBook” tool forease of reading and chapter-basedsearching. The Directory is at http://www.ngdc.noaa.gov/seg/hazard/resource/.Contact: NGDC
GEBCO Grids for coastal regionsThe National Geophysical Data Cen-
ter (NGDC) provided the U.S. NavalOceanographic Office with a preliminaryversion of the U.S. West Coast CoastalRelief Model. The data will be used in thebeginning versions of the General Bathy-metric Chart of the Oceans (GEBCO)grids for coastal regions of the world.GEBCO has long produced bathymetriccontours of the world’s oceans, but gen-erally has not provided details for thecontinental shelves. Due to the increasedimportance of these regions, in terms ofclimate, commerce, and resources,GEBCO is undertaking the generation ofgridded relief models.
Initial grid size will be two arc min-utes of latitude and longitude. NGDC isgenerating a much more detailed threearc-second Coastal Relief Model for thecoastal United States. Therefore, the pre-liminary grids of the West Coast were theideal starting point for GEBCO gridding inthat region.Contact: NGDC
New snow data added to archivesA new data set of observed snowfall
extremes and derived return period statis-tics for 8718 Cooperative (COOP) stationsin the contiguous U.S. and Alaska hasbeen added to the National Climatic DataCenter’s (NCDC) holdings. Of these,7464 were identified as “current” stationsand were provided to the Federal Emer-gency Management Agency (FEMA) toaid in Federal snow disaster declarations.The four time frames/parameters are:one-day, two-day, and three-day extremesnowfall, and August-July seasonal totalsnowfall.Contact: NCDC

16 September 1998EARTH SYSTEM MONITOR
Address C
orrection Requested
OFFIC
IAL BU
SINESS
Penalty for Private Use $300
40
U.S. D
EPA
RT
MEN
T O
F CO
MM
ERC
EN
ation
al Ocean
ic and
Atm
osp
heric A
dm
inistratio
nPublication D
istribution Facility1315 East-W
est Highw
aySilver Sp
ring, MD
20910-3282A
TTN: Earth System
Monitor
▲ Figure 6. (Left to immediate right) Senator John Breaux, Sec. Jack Caldwell (LouisianaDNR) and Mr. Rolland Schmitten (Assistant Administrator for NOAA Fisheries) attendingproject dedication ceremony in the Atchafalaya Delta, July 1, 1998. (Photo courtesy ofDr. Erik Zobrist, NOAA Habitat Restoration.)
need for greater handling time and fre-quent disposal pipe movement, allwhich was included in the specifica-tions.
Distributary channels were designedat 45 degree angles to mimic features ofnatural deltas. Through close coordina-tion between the contractor and Louisi-ana DNR and NOAA Fisheries, theprojects are ahead of schedule andwithin budget.
Projects like these provide a chal-lenge to both the dredging industry andthe resource agencies that plan and de-sign projects to benefit wetland systemsby replicating and restoring natural pro-cesses. Such projects require agenciesplanning restoration projects to under-stand constraints and capabilities of thedredging industry, while requiringdredgers to fully understand the critical-ity of meeting exacting design standardsnecessary for successful wetland restora-tion. Ultimately, the success of dredgeprojects designed to enhance coastalwetlands depends on an open dialogueand educational process between groupsdesigning and constructing restorationprojects.
As demonstrated by the Breaux Actprojects (Figure 6) in the AtchafalayaRiver delta, coastal restoration providesan opportunity for the dredging indus-
try not only for significant work, butalso in becoming a partner in the effortsto restore and create wetlands along thenation’s coast.
AcknowledgementsThe Louisiana Department of Natural Re-
sources is recognized and thanked for the fullparticipation in the CWPPRA program and tobeing a critical part of the program’s success.The NMFS Southeast Regional Office, BatonRouge, is thanked for their extraordinary efforts,particularly that of Mr. Rickey Ruebsamen andRichard Hartman. The authors also thank Mr.Ike Mayer of Brown, Cunningham, Gannuch,Mr. Bruce Dyson of GOTECH, Inc., Dr. KevinBodge of Olsen Associates, Mr. Jens Lorenz andChris Rayer of River/Roads Construction, Inc.,and Mr. Greg Linscombe, Mike Carlos, and theother fine professionals of the Louisiana Depart-ment of Wildlife and Fisheries. ■
Wetlands, from page 9