earth science 104 earth system science itaylors/gs104/es104_lab... · earth system science i fall...
TRANSCRIPT

Earth Science 104
Earth System Science I Fall 2007
Laboratory Manual
Table of Contents Lab 1 – MODELS AND SYSTEMS Lab 2 – INVESTIGATING THE SOLAR SYSTEM Lab 3 – LIGHT AND WAVE TRAVEL Lab 4 – INTRODUCTION TO PLATE TECTONICS Lab 5 – EARTHQUAKES:
Epicenter Determination and Seismic Waves Lab 6 – PHYSICAL PROPERTIES OF MINERALS AND
MINERAL IDENTIFICATION Lab 7 – IGNEOUS ROCKS Lab 8 – VOLCANISM AND VOLCANIC LANDFORMS Lab 9 – INTRODUCTION TO SCIENTIFIC INQUIRY AND
DATA ANALYSIS Lab 10 – LENSES AND TELESCOPES: Additional Activities APPENDIX – TABLES FOR CONVERSIONS OF UNITS
1-1
ES 104 Laboratory # 1 MODELS AND SYSTEMS
Introduction
We use models to represent the natural world in which we reside. Throughout human history, models have also been used to represent the solar system. From our reality here on Earth, we take part in an Earth-Moon-Sun system. The relationship between their positions at various times determines some common phenomena such as seasons, moon phases, and day length. In this lab, you will use physical models to explore these relationships.
Goals and Objectives • Create scale models and make sketches that reasonably portray
observations of components of the Earth-Moon-Sun system • Use physical models to determine the reasons for the phases of the
moon, the seasons, and the length of the day
Useful websites
• http://home.hiwaay.net/~krcool/Astro/moon/moonphase
• http://www.ac.wwu.edu/~stephan/phases.html
• http://csep10.phys.utk.edu/astr161/lect/index.html
• http://www.astro.uiuc.edu/projects/data/Seasons/seasons.html

1-2 Name____________________________________
Lab day ______Lab Time_____________________
Pre-lab Questions – Complete these questions before coming to lab.
1. Define the following terms as related to systems:
A. Open System B. Closed System
2. Is Earth an open or closed system? Why?
3. What is the distance from Earth to the Moon? How long does it
take the Moon to revolve around Earth?
4. Define the following terms (draw diagrams to illustrate your answers):
A. Waxing moon
B. Waning moon
C. Full Moon
D. New Moon
5. What is the difference between “waning moon” and “third quarter phase”?
1-3
Part A - A Model of the Sun-Earth-Moon System Phases of the Moon
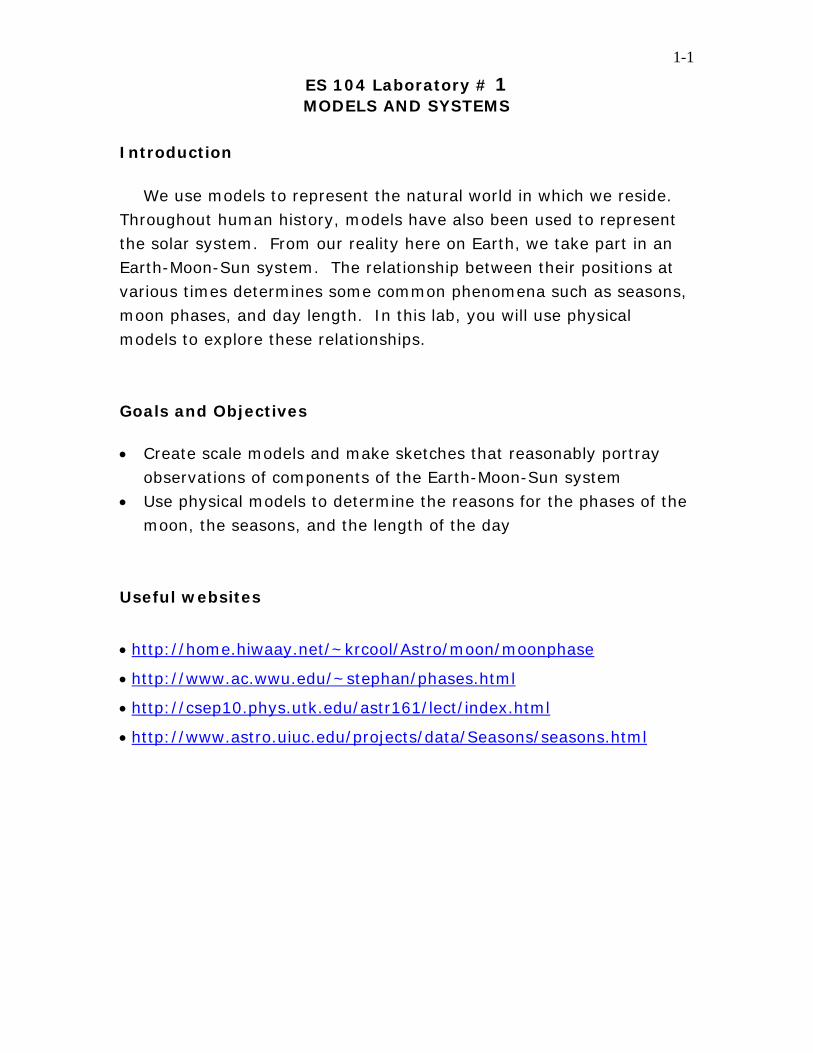
You will construct a physical model of the Sun-Earth-Moon system. Materials for your model will be at the appropriate activity station. The purpose of this model is to investigate the phases of the moon, which include new, first quarter, full, and third-quarter (or last-quarter). Refer to your textbook (Fig. 20.23, p. 568, Earth Science, Tarbuck and Lutgens, 11th ed.) to see how they appear in the sky. Use a small sphere affixed to a stick to model the moon. Figures 2, 4, 6 and 8 represent the view of the model as if you were far from Earth, but above the North Pole. A lamp acts as Sun. Position Moon, Earth and Sun (lamp) at the locations indicated in figures, placing Earth about half a meter (50 cm) from Sun. On Figure 2, blacken in the shadowed part of the moon.
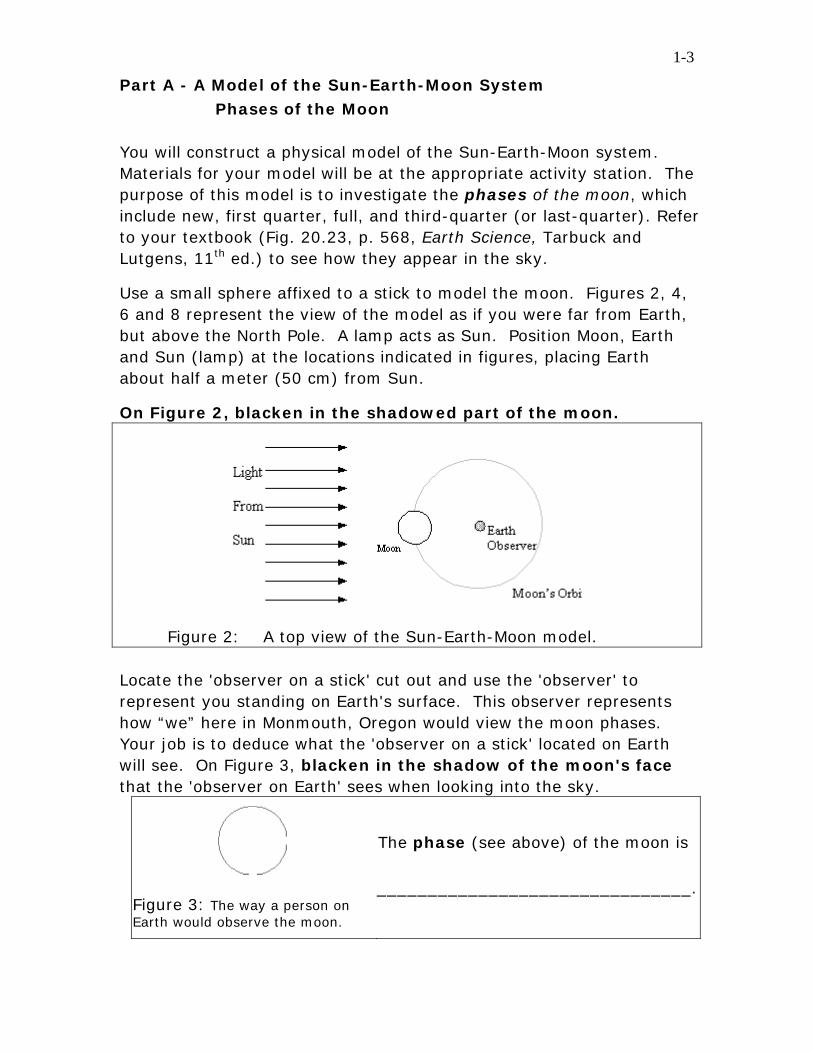
Figure 2: A top view of the Sun-Earth-Moon model. Locate the 'observer on a stick' cut out and use the 'observer' to represent you standing on Earth's surface. This observer represents how “we” here in Monmouth, Oregon would view the moon phases. Your job is to deduce what the 'observer on a stick' located on Earth will see. On Figure 3, blacken in the shadow of the moon's face that the 'observer on Earth' sees when looking into the sky.
Figure 3: The way a person on Earth would observe the moon.
The phase (see above) of the moon is
_______________________________.
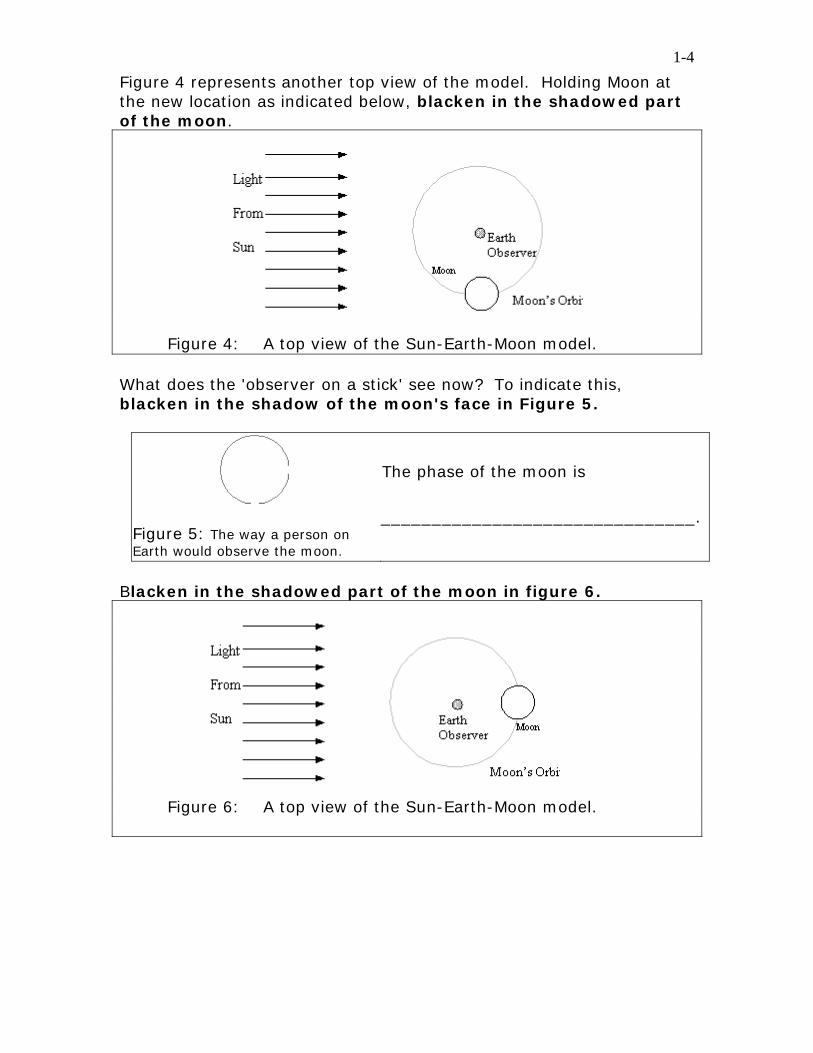
1-4 Figure 4 represents another top view of the model. Holding Moon at the new location as indicated below, blacken in the shadowed part of the moon.
Figure 4: A top view of the Sun-Earth-Moon model. What does the 'observer on a stick' see now? To indicate this, blacken in the shadow of the moon's face in Figure 5.
Figure 5: The way a person on Earth would observe the moon.
The phase of the moon is
_______________________________.
Blacken in the shadowed part of the moon in figure 6.
Figure 6: A top view of the Sun-Earth-Moon model.

1-5 Again, blacken in the shadow of the moon's face in Figure 7 when it is in the above position.
Figure 7: The way a person on Earth would observe the moon.
The phase of the moon is
_______________________________.
Once more blacken in the shadowed part of the moon when it is located as shown in Figure 8.
Figure 8: A top view of the Sun-Earth-Moon model.
When an observer looks into the sky, what will they see when the moon is located as it is in Figure 8? Indicate what they see in Figure 9, below.
Figure 9: The way a person on Earth would observe the moon.
The phase of the moon is
_______________________________.

1-6 Mental Exercise: Now construct drawings 3A, 5A, 7A, and 9A for an observer viewing Moon from the Southern Hemisphere (for example, from a position “down under” in Australia). To model this new frame of reference, take your observer on a stick and “walk” them down to Australia when Moon is in the locations shown in Figures 2, 4, 6, and 8. (Note the observer should now be “up-side-down.”). In the spaces provided below, draw the four corresponding Moon views for this new observer position.
Figure 3A: How a person on Earth in Australia would observe the moon.
The phase of the moon is
_______________________________.
Figure 5A: How a person on Earth in Australia would observe the moon.
The phase of the moon is
_______________________________.
Figure 7A: How a person on Earth in Australia would observe the moon.
The phase of the moon is
_______________________________.
Figure 9A: How a person on Earth in Australia would observe the moon.
The phase of the moon is
_______________________________.

1-7
Questions: 1. Assuming the Earth-Moon-Sun position is the same, does the phase of
the moon change when viewed from the Northern Hemisphere compared to the Southern Hemisphere? If we in Monmouth, Oregon view a first quarter moon phase, what phase will people in Australia view when they see the moon on the same evening? Consider whether Moon’s position with respect to Earth (Figures 2, 4, 6, and 8) is the same whether you are in Australia or Oregon.
2. What is the time in days between two successive full moons
(i.e., from one full moon to the next full moon)? 3. What is the time in days between a full moon and a new moon? 4. What is the orbital period of Moon around Earth (in days)? 5. How long does it take Moon to move around Sun (in days)? 6. If the full moon is on the western horizon, approximately what time of
day must it be? HINT: Where is Sun in relation to you when you are gazing westward at
a full Moon? The time of day will be ____________________________________. (Generally speaking, such as: mid-morning, sunset, dawn, noon, midnight, etc.)

1-8
Draw in and label the locations of the full moon and the new moon in Figure 10. Fill in the shadowed part of Moon in each case. (HINT: use
Figures 2 and 4 as a guide.) Label one curved arrow waning -- where Moon is getting closer to a new moon. Label the other curved arrow waxing -- where it is building up to a full moon.
Figure 10: A top view of the Sun-Earth-Moon model.
7. Write a brief explanation as to why we see the phases of the moon.
8. The color of material (rock and dust) that covers the moon is primarily
light colored. Suppose all of Moon’s material was black. Would we see moon phases? Explain.
9. Assume you are “camped” on Moon closest to Earth for a one-month stay.
Will you be able to see Earth? Will there be phases of Earth, as we see Moon phases? Explain. (HINT: use your observer and model.)

1-9
Part B – The Seasons
The Baroque composer Antonio Vivaldi wrote a pervasively familiar set of concertos called "The Seasons". Each of the set of four is devoted to one of the four seasons -- spring, summer, and autumn, winter. Concerto No. 1 mimics songs of birds, spring thunderstorms, and a spring zephyr. In the summer concerto, Vivaldi uses changes of meter (first 3/8 and later 4/4 time) to describe the exhaustion caused by the summer heat. Autumn, the season of harvest, Vivaldi uses the motifs of a tribute to Bacchus -- God of Wine -- via a feverish dance and The Hunt using the horns to herald the event. In Concerto No. 4, the frigid winds blow in an almost melody-less illustration.
The Venetians of Vivaldi's time all understood the effects and moods of the seasons, but how did they come about? In this activity, we look closely at an explanation.
First, we must dispel an old misconception. Figure 11 shows a sketch of Earth's orbit from a top view far above Sun. The orbit of Earth is not a perfect circle, it’s a 'squashed circle'; the orbit is slightly elliptical. However, the 'squashed-ness' of the orbit -- its eccentricity -- is greatly exaggerated in Figure 11. The common misconception is that when Earth is at point A (where it is closer to Sun) it is summer on Earth. If you have ever gone to South America or Australia in January (our winter), you would discover it is summer there! The misconception would have it summer in both the northern and southern hemispheres when Earth is closest.
Figure 11
The common misconception fails on another point. The orbit of our planet is so close to a perfect circle that you probably cannot draw a circle on paper more circular than Earth's orbit -- not even with a compass! The eccentricity of Earth's orbit is 0.0167. The eccentricity of perfectly circle is zero, whereas a 'flattened circle', flattened until it is just a line, has an eccentricity of one. The eccentricity of our orbit is much closer to zero than to one, nearly a perfect circle.

1-10
Activity 1: Investigate Figure 12, which shows Earth with incoming solar radiation. Earth’s radius is about 3884 miles.
50
50
Distance to sun is 93,000,000 miles
Equator
EARTH
Deg
rees
of L
atitu
de
0
20
20
This distance very small compared to distance to Sun
Inco
min
g R
adia
tion
Figure 12: Schematic representation of Earth-Sun system emphasizing input of solar radiation. Many people have the conception that the Polar Regions are cooler than the equator because they are further away and therefore the Sun’s energy is “weaker” when it strikes the Polar Regions. Let’s explore this reasoning.

1-11
1. Briefly speculate on why Earth heats up more at the equator than closer to the north or south poles. HINT: See Figure 12, and note the shaded bands of
incoming radiation at the equator (middle band), and in the mid latitudes (upper and lower
bands). 2. The Sun is 93,000,000 miles away from the equator. The radius of Earth
is a little less than 4000 miles. How much further (in percent) does the energy of Sun have to travel before reaching the polar region? Show your calculations.
3. How important do you think this added distance (4000 miles) is in
temperature between the poles and equator? Consider the value calculated in question 2 above, the percent difference in distance.
Now examine a model of Sun’s energy striking Earth. Use a light is positioned several inches away from the equator of a globe. With a piece of graph paper, measure the area of light striking the globe at the equator and at the polar region. 4. Are the two areas equal? 5. Now suggest a reason why the poles may be cooler than the equator
regions.
1-12
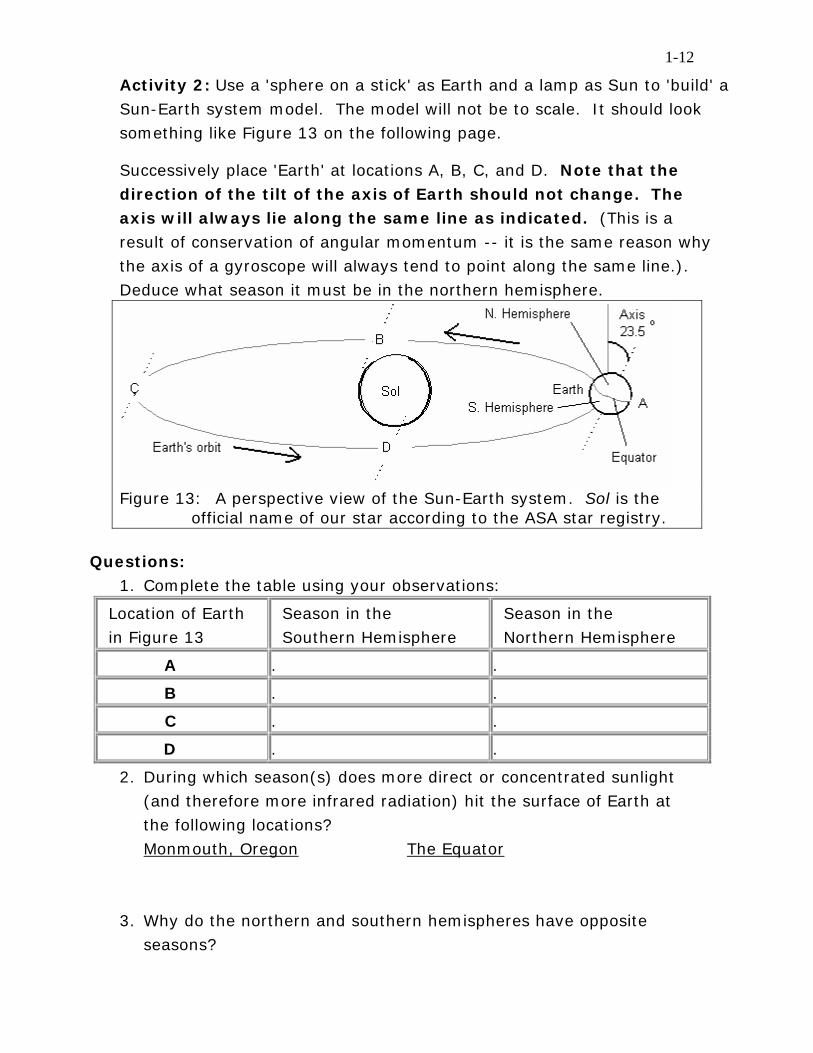
Activity 2: Use a 'sphere on a stick' as Earth and a lamp as Sun to 'build' a Sun-Earth system model. The model will not be to scale. It should look something like Figure 13 on the following page. Successively place 'Earth' at locations A, B, C, and D. Note that the direction of the tilt of the axis of Earth should not change. The axis will always lie along the same line as indicated. (This is a result of conservation of angular momentum -- it is the same reason why the axis of a gyroscope will always tend to point along the same line.). Deduce what season it must be in the northern hemisphere.
Figure 13: A perspective view of the Sun-Earth system. Sol is the
official name of our star according to the ASA star registry.
Questions: 1. Complete the table using your observations:
Location of Earth in Figure 13
Season in the Southern Hemisphere
Season in the Northern Hemisphere
A . .
B . .
C . .
D . .
2. During which season(s) does more direct or concentrated sunlight (and therefore more infrared radiation) hit the surface of Earth at the following locations? Monmouth, Oregon The Equator
3. Why do the northern and southern hemispheres have opposite seasons?
1-13
Activity 3: Examine the two models provided, Model A and Model B. Complete the table by answer the questions for each model.
MODEL A MODEL B
What does the model demonstrate?
List each part of the model, and indicate what it represents.
What is distorted or “misrepresented” in this model?
What are the limitations for this model? (What does it not show?)

1-14 Name____________________________________
Lab day ______Lab Time_____________________
POST-LAB ASSESSMENT No scientific hypotheses or models represent all aspects of a system with 100% accuracy. To make systems understandable, all scientific models and hypotheses make simplifying assumptions. These simplifying assumptions can often lead to shortcomings of a model. Consider the model of the Sun-Earth-Moon system that you used to understand the phases of Moon. 1. How often does this model predict that solar eclipse and lunar
eclipses should occur? 2. What simplifying assumption in our model results in this
erroneous prediction? 3. How could you revise the model to make its predictions of
eclipses more accurate? 4. Imagine that you want to power your home in Monmouth using
solar energy. In order for your solar panels to collect as much energy as possible, what direction should your solar panels face (north, south, east, or west)? __________________________ On the picture below, draw your house and the solar panels on it to justify your answer. If you lived in Australia, what side of your house should have the solar panels? _________________ Include the Australia house on the picture.
2-1
ES 104 Laboratory # 2 INVESTIGATING THE SOLAR SYSTEM
Introduction
We have sent unmanned spacecraft through the solar system, landed robot space probes on Mars, Venus, and the Moon, have landed people on the Moon, and have sophisticated telescopes to obtain data. We know that each planet and satellite (moon) has unique physical characteristics that set them apart from one another. We also know our solar system exhibits some regular patterns. During this laboratory you will try to discover some of these patterns. Much of the numerical data about our solar system, such as planetary size or distance from Sun, is so large that you will need to work with scale models. By studying planetary data we can compare and contrast conditions on other planets and their satellites (moons) to those of Earth. Goals and Objectives • Describe similarities and differences among planets of our solar
system • Create scale models and make sketches that reasonably portray
observations of components of the solar system • Create graphs to communicate and interpret data from a variety of
sources • Use internet resources which contain current information on the
solar system and cosmos Useful Websites • http://www.nineplanets.org • http://pds.jpl.nasa.gov/planets • http://photojournal.jpl.nasa.gov/index.html • http://www.noao.edu/

2-2
Name____________________________________
Lab day ______Lab Time_____________________
Pre-lab Questions – Complete these questions before coming to lab.
1. Define the Astronomical Unit (AU). 2. If the distance from Monmouth to Washington D.C. is 2870
miles, convert this distance to units of AUs. (Show calculations with units.)
3. List the planets in order of increasing distance from Sun.
4. What are the three types of materials that make up the planets?
5. Which planet is the largest in the solar system?
6. Which planet is covered in liquid water?
7. Which planet is the hottest planet?

2-3
Part A – Scale Model of The Solar System
An astronomical unit, AU, is the average distance Earth is from Sun. That distance is 93,000,000 miles, 8.3 light-minutes, or 150,000,000 kilometers. It is convenient to work with AUs because the real distances are in numbers that can be cumbersome to deal with. Table 1 below shows the mean distance of the planets from Sun (orbital distance) in AUs. Alternatively, you might find the orbital distances in terms of light-minutes more illuminating (pun intended). Choose which system of units you feel more comfortable with.
Your group will construct a scale model of the solar system based on average distance to Sun. Your model must fit in the hallway (54 meters long), the classroom, or outside (weather permitting). You must decide the scale you will use for your model. Additionally, place the satellites of each planet alongside their appropriate “host” planet.
Table 1: Solar System Data
Planet Radius of
Planet (Kilometers)
Mean Distance from Sun
(AU)
Radius of Planet
(millionths of AU)
Mean Distance from Sun
(Light-Minutes)
Mercury 2439 0.39 16 3.25
Venus 6052 0.72 40 6.00
Earth 6378 1.00 42 8.33
Mars 3393 1.52 23 12.6
Jupiter 71,492 5.20 477 43.3
Saturn 60,268 9.54 402 79.5
Uranus 25,559 19.20 170 160
Neptune 24,766 30.10 165 250
Pluto * 1137 39.40 8 328
Sun 696,000 N/A 4,640 N/A
*The IAU has changed the definition of "planet" so that Pluto no longer qualifies. There are now officially only eight planets in our solar system. Of course this change in terminology does not affect what's actually out there. It is much smaller than any of the official planets and now classified as a "dwarf planet". Pluto is smaller than seven of the solar system's moons (the Moon, Io, Europa, Ganymede, Callisto, Titan and Triton). http://www.nineplanets.org/ 9-7-2006
2-4
Questions: 1. What scale did you use for your distance? 2. What pattern did you notice about the spacing of the planets
from Sun? 3. Draw a sketch of your model (with spacing generally to scale)
below. 4. What general pattern did you notice about the relative sizes of
the planets? 5. Which planets have the greatest number of satellites (moons)?
Note that not all of the satellites in our solar system are shown. In fact new satellites are being discovered every few years.

2-5
Table 2: Planet Data Mercury Venus Earth Mars Jupiter Saturn Uranus Neptune Pluto*
Mass (x1024 kg)
0.3302 4.869 5.975 0.6419 1,898.6 568.46 86.83 102.43 0.0125
Radius (km) 2439 6052 6378 3393 71,492 60,268 25,559 24,766 1137
Mean Density (kg/m3)
5,427 5,204 5,520 3,933 1,326 687 1,318 1,638 2,050
Orbital Distance (106 km)
57.9 108.2 149.6 227.9 778.3 1427.0 2869.6 4496.6 5913.5
Orbital Period (in Earthdays)
87.969 224.7 365.25 686.98 4330.6 10,747 30,588 59,800 90,591
Rotational Period
(in hours) 1407.6 5832.5 23.934 24.62 9.92 10.5 17.24 16.11 153.3
Ave. Surface Temperature
(Kelvin) 440 737 288 210 165 134 76 72 50
Surface Pressure
10-15 bars
92 bars
1.014 bars
0.008 bars
>>100 bars
>>100 bars
>>100 bars
>>100 bars
3 micro-bars
Atmospheric Composition
98% He 2% H2
96.5% CO2, 3.5%
N2
78% N2,
21% O2, 1%
H2O
95.32% CO2, 2.7%
N2
90% H2, 10% He
96% H2, 3% He
83% H2, 15% He 2% CH4
80% H2, 19% He 1% CH4
methane & N2
Table 3: Density of Common Materials.
Material Density
Air 1.2 kg/m3
Water or Water-Ice 1000 kg/m3
Typical Rocks 3000 kg/m3
Metal at High Pressure 10,000 kg/m3
*see footnote page 2-3

2-6
Part B – Classifying the Planets
Study the solar system information in Table 2. The table provides information scientists believe to be true about the planets in the solar system based on the latest technology to help them. By looking carefully at the data in this table you should be able to find some patterns, similarities, and differences among the planets in our solar system. The following questions will assist you in thinking about what is considered a pattern, similarity, and difference. You should also look over Table 3 which contains density information and investigate densities of the air, water, rock, and lead ore samples (lead ore approximates the density metal at high pressure). Because all of the samples have the same volume, you can investigate the effect of density directly by picking each one up and comparing their masses. On the back of this sheet, make four tables: each table should contain all of the planets, and be based on a different property of the planets. Use the properties of the planets (in table 2) to group them into general categories. For example, using the property of density, you could place the planets into two groups, high density planets and low density planets. Or perhaps the density data suggests that low, medium and high density groupings are more appropriate. Let the data be your guide to the number and types of groups. (The tables should not be lists in an order, but divisions into groups of similar characteristics, based on the properties of the planets.)
Label each table with the title of the property used to construct it, and include column headings showing your method of grouping the planets. In the space below, write any general statements you can draw from your study of properties that could be cited as patterns in the solar system.

2-7
Questions: 1. Which planet would float in water? _______________________
(HINT: Less dense objects float in denser fluids.)
2. How long is a day on Jupiter? __________, (answer in Earth hours)
on Venus? ________________, on Mars? ________________
3. How many Earth years go by before one Mars year has passed? ___
Show work here.
4. Which two planets account for 90% of the total mass of all of the
planets? _______________________ and __________________________ 5. Which planet seems unusually hot, considering its distance from Sun? __________________________________ 6. By looking at the data in Table 2, suggest a reason for this
extreme high temperature. 7. Estimate the relative densities (from the mass) of the four samples
by picking them up. (Density = Mass/Volume and the samples chosen all have similar volumes). For each sample, note in the spaces below how many times larger or smaller the density is compared to water. a. Air seems to be ____________________ times less dense
than water. b. Rock seems to be ____________________ times more
dense than water. c. Metal at high pressure seems to be ____________________
times more dense than water. 8. How do your guesses compare to Table 3?

2-8
9. What estimates can you make about the bulk composition of each planet based upon its density? Table 3 provides information about the density of common materials found on Earth. Compare the density of metal, rock, water ice, and gas (in Table 3) to the mean density of each planet from Table 2. Rely on Tables 2 and 3; not other information.
(HINT: You can answer in terms of mostly metal, rock, ice, or gas; or combinations of these.)
Table 4:
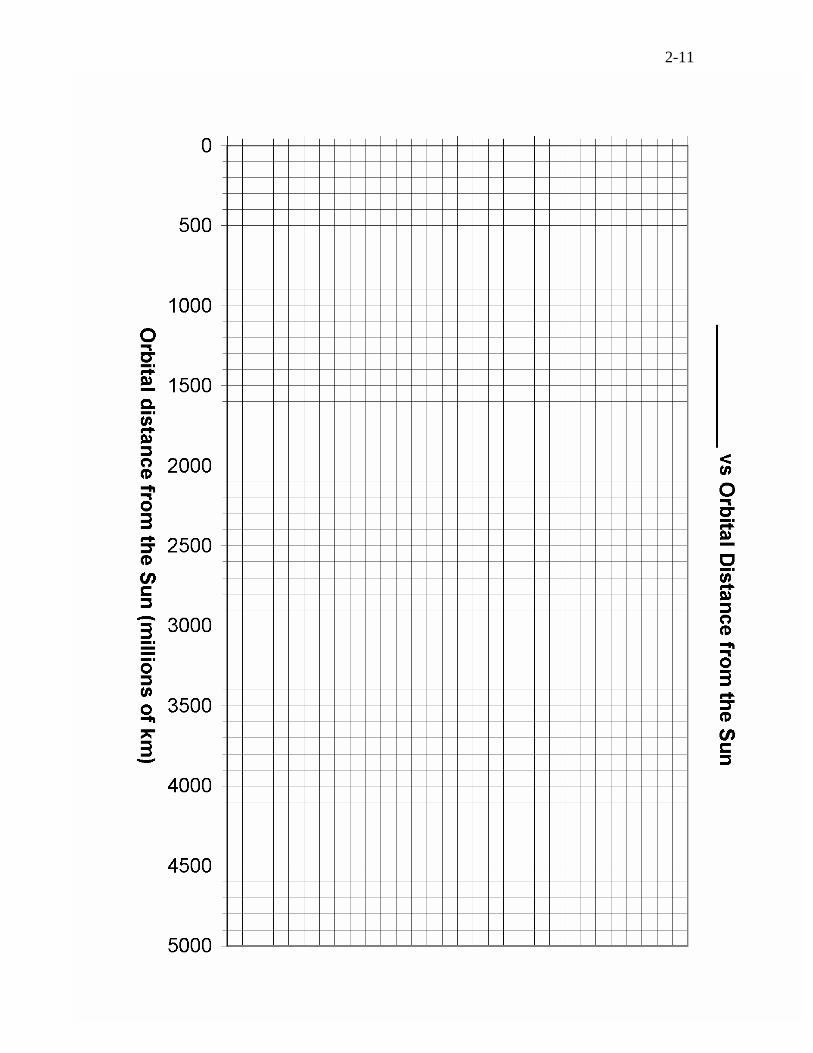
Part C – Graphing Planetary Data Sometimes graphs can give you a different perspective about data that reading a table cannot. In this activity you will graph selected data. You will graph one set from the list below. Graph paper is provided at the end of this lab, on pages 2-11 and 2-12. Activity: Each person in your group should make a different graph of one of the sets of data listed below. When you are completed, present your graph and your conclusions about your graph to the rest of the members of your group.
• Mean Density vs. Orbital Distance from Sun • Surface Temperature vs. Orbital Distance from Sun • Orbital Period vs. Orbital Distance from Sun • Rotational Period vs. Orbital Distance from Sun • Mass vs. Orbital Distance from Sun
Planet Deduced Composition
Mercury .
Venus .
Earth .
Mars .
Jupiter .
Saturn .
Uranus .
Neptune .

2-9
In the space below, report the title, presenter and results of each graph (the conclusions presented by your group member). Consider the following questions: What does each graph tell you? Is there a relationship between the two quantities being graphed? If a relationship exists, try to construct an explanation for the relationship. (These questions will require a long answer so feel free to use the back of the page, if you use all the space below.) Also, be sure to include your graph with your report. 1. Title: ___________________ Presenter: __________________ 2. Title: ___________________ Presenter: __________________ 3. Title: ___________________ Presenter: __________________ 4. Title: ___________________ Presenter: __________________

2-10
Name____________________________________
Lab day ______Lab Time_____________________
POST LAB ASSESSMENT 1. Consider the uniqueness of Earth compared to the other planets in our solar system. Make a table that identifies the characteristics Earth shares with other planets and characteristics that are unique to Earth.
Earth Characteristic
Planets that share this characteristic with Earth
Planets that are different in this characteristic
Mass
Density
Atmospheric composition
Another characteristic (write your choice)
2. In the past two labs, you have explored information in a number of ways: physical models, pictorial models (sketches/diagrams), data tables and graphs. Which did you find most useful in your investigations, and why do you think it was useful for you?
2-11

2-12

2-13
Additional Assignment: Solar System Investigation Information about the cosmos as well as understanding of the cosmos is changing at a very rapid pace. To incorporate the latest knowledge (facts), ideas, and theories about the universe, it is necessary to access the latest information available. There are many excellent internet sites available with current information which is updated regularly. You will be assigned a cosmic body or phenomena to be investigated using one or more of these internet sites. To access your information use an internet search engine of your choice and key in specific terms such as: astronomy and your assigned topic. Next week (lab meeting) you are required to turn in a 1-2 page PRINTOUT OF THE INFORMATION OBTAINED and give a 1-2 minute oral presentation to the lab-class covering the information. BE SURE TO FOCUS ON RECENT INFORMATION, but also include a summary of what is currently known about your assigned cosmic body. Note; occasionally two students will be assigned the same cosmic body…so be sure to touch base with your colleague so as not to repeat information during the oral talk. POSSIBLE COSMIC TOPICS Sun Mercury Venus Earth Mars Mars Rovers Jupiter Jupiter Moons Saturn Saturn Moons Uranus Uranus Moons
Neptune Neptune Moons Pluto Kuiper Belt Asteroids Comets Meteorites Stars Black Holes Galaxies Hubble Telescope _ Cassini Probe

3-1
ES 104 Laboratory # 3
LIGHT AND WAVE TRAVEL
Introduction We are here, but Sun and other stars are way out there. How do we
learn about them? The only way is through remote sensing. There are two categories of remote sensing. One is active -- we can go to Sun and planets with probes, such as Cassini or the Mars Expedition Rovers, which are very expensive. Or we can look passively at the information sent here from the objects in the distance. When you see a star or planet in the sky you might say ‘What a beautiful light in the heavens’. But what sorts of information can you uncover from that beautiful light? This week we explore the major aspects of how astronomers use light to explore strange new worlds. Goals and Objectives • Gain an understanding of what sorts of information astronomers
have available to them from the stars. • Become familiar with the role and importance of making
astronomical observations and how they are made. • Learn about some basic wave properties with regards to light and
various telescope designs. Useful Websites • http://www.lon-capa.org/~mmp/applist/Spectrum/s.htm • http://hea-
www.harvard.edu/~efortin/thesis/html/Spectroscopy.shtml • http://www.school-for-champions.com/science/sound.htm • http://imagers.gsfc.nasa.gov/ems/waves2.html • http://archive.ncsa.uiuc.edu/Cyberia/Bima/spectrum.html

3-2
Name____________________________________
Lab day ______Lab Time_____________________
Pre-lab Questions – Complete these questions before coming to lab.
Define the following terms and answer the questions: 1. Frequency 2. Wavelength 3. Period (in relation to waves, not geologic time!) 4. What is the speed of light in meters per second? 5. Write the equation for velocity as a function of distance and time.
Solve the equation for time as a function of distance and velocity. Solve the equation for distance as a function of time and velocity.
6. How far is Earth from Sun in miles? How far is Earth from Sun in
kilometers? 7. If you were traveling at the speed of light, how long would it take you
to get from Sun to Earth? (Show your calculations, with units.)

3-3
Part A – Waves Transfer Energy Electromagnetic energy or “light” can have many different wavelengths, some invisible to the eye. Heat is one of these invisible light waves. "Heat waves" are referred to as infrared waves. The heat lamp works this way: Electricity from the wall outlet heats up the lamp's filament, which causes the electrons in all the atoms of the filament to oscillate at many different rates of vibrations or frequencies. Each oscillating electron couples its vibrations to its surroundings in the form of oscillating electric and magnetic fields. These fields are self-creating, and leapfrog their way out into the room. This is, of course, the electromagnetic-magnetic wave we call light. Some of the frequencies of the waves emitted by the lamp are visible, but many more are infrared waves. These activities should convince you that waves transfer energy and illustrate the concept of coupled vibrations. The apparatus consists of two demonstrations. The first one is a heat lamp, and the second is a set of tuning forks. Activity 1: Heat Lamp Place your hand in front of the lamp. Describe what you feel. Activity 2: Tuning Forks Working with light waves isn't always easy, so sometimes we use other types of waves such as sound waves. Find two tuning forks of the same frequency. Pick up both forks holding them by the handle only. Listen to the forks to verify that they are quiet. Now strike one fork with the rubber hammer. Place the two forks close together, but not touching. Hold them with their tangs parallel about one fork's width away. After a few seconds, place the fork that you did not strike near your ear and listen again. Record your observations and consider the following questions in the spaces provided:
1. What did you hear?
2. What do you hear if you use two forks with different frequencies?
3. Why is a “dog whistle” inaudible to most humans?

3-4
Questions: 1. The Latin prefix infra means “below or beneath.” Knowing the meaning
of 'infra'… what is referred to as lower in the term infrared compared to visible light (red visible light in particular)?
2. When you placed your hand in front of the heat lamp, were you
convinced that infrared electromagnetic waves transfer energy from one place to another? In detail, how were the infrared waves detected by your hand?
3. Describe what happens to the mechanical energy of vibration of each
of the two tuning forks initially and after the few seconds you held them close to one another. How does the mechanical wave energy transfer from one fork to the other?
4. A so-called 'black light' is actually an ultraviolet light source. By
ultraviolet, we mean light of a wavelength just shorter than the visible part of the spectrum. Conjecture on how the 'black light' poster works. How is it we see green light from the poster when it is illuminated with invisible light?

3-5
Activity 3: Ultraviolet light You may have also noticed that your clothing, particularly white clothing, glows when illuminated by a black light (an ultraviolet light source). This is because detergent manufacturers put fluorescent chemicals in laundry detergents. To demonstrate this fact, shine the black light on the sample of laundry detergent. Why does including fluorescent chemicals in detergent make your clothes ‘whiter and brighter’? Part B – Speed of a Wave We can measure the speed of light the same way you might measure the speed of your car on those 'odometer test areas'. You measure the distance and the time it takes to go that distance. To get the speed, you divide the distance by the time. Unfortunately, measuring the speed of light this way is beyond our capabilities in this lab. Instead, we will do a similar experiment using sound waves. Activity: Speed of Sound You will use a computer-controlled black box containing a speaker and microphone. Sound waves (a series of pulses) will be generated by the computer and speaker. Each pulse will travel a known distance, reflect off a wall, and return to the black box. The microphone contained in the black box will record the arrival of each pulse. The time difference between when each pulse leaves the box and when it returns to the microphone is measured by the computer. The data is displayed in a table, and plotted on a graph. Step 1: Use the computer to measure the amount of time it takes a pulse to travel from the box, to the wall, and back to the microphone in the box. The average time (in seconds) for pulses to travel the round trip distance is shown at the bottom of the table on the computer screen. This time is: ____________ seconds.

3-6
Step 2: Measure the distance (in meters) between the microphone and the wall. Do this to within the nearest millimeter (0.001 meter). The distance between the box and the wall: ______________ meters. The 'round-trip distance' that each pulse travels: __________ meters. Step 3: From the definition of speed (speed = distance/time), compute the speed of the sound wave in air. (Show work below. Be sure to include units with your numbers.)
Your measured speed of the sound wave in air: ________ meters/second (At this time, write this value on your post-lab, question 1, also.)
Questions: 1. If the black box were turned around to point at the opposite wall, would
this “new” distance change the speed of sound? Would it go faster? Slower? Or no change? Explain your thoughts.
2. Verify your thoughts about question #1 by determining the speed
of sound for the reconfigured black box set-up “pointing to the opposite wall.” What value did you get? How close is it to the original speed you determined? Why might these numbers differ? What might be some possible sources of error?
3. What are the implications of the observation that light doesn't travel
instantaneously from the distant stars to our telescopes?

3-7
Part C – White Light and the Visible Light Spectrum Light from the stars and planets can contain a wealth of information about the object it came from. It is not so easy to look at starlight, so we will have to be creative. This station consists of several light sources and a set of spectroscopes. A spectroscope splits light into its visible component wavelengths and measures the wavelength of the light waves. Your job is to measure the wavelengths present in each light source. Activity 1: ROYGBIV Spectrum of incandescent tungsten lamp. The first source is an incandescent tungsten filament lamp. With your instructor’s help, use the spectroscope to view this source. You should see a full spectrum or range of visible wavelengths. Be sure to note that units in the spectroscopes are nanometers, and the wall charts are in angstroms. You will have to convert to compare these. Make observations of the incandescent filament lamp with the spectroscope. Record the range of wavelengths that comprise 'red light' in nanometers (billionths of meters). Repeat this for orange, yellow, green, blue, and violet.
Violet light __380____ to _________ nanometers Blue light _________ to _________ nanometers Green light _________ to _________ nanometers Yellow light _________ to _________ nanometers Orange light _________ to _________ nanometers Red light _________ to ___750___ nanometers
On the graph below, mark (in color) the appropriate ROYGBV wavelengths.
Spectrum
3000 3500 4000 4500 5000 5500 6000 6500 7000 7500 8000
Wavelength (angstroms)

3-8
Activity 2: Star Composition Astronomers learn a vast amount of information about a star from analyzing the electromagnetic spectrum that emits from it. Comparing a stars spectrum to the spectrum of known gases (as viewed on Earth in a laboratory) allows scientists to theorize about the stars compositional makeup. A star whose spectrum closely matches that of a hydrogen filled discharge lamp (as viewed in a lab) is, with a high degree of confidence, assumed to be composed of Hydrogen gas. In this activity you will be given two unknown “stars” (actually they are gas-filled discharge lamps), and you will have to compare their spectrum with known spectra and deduce the star’s composition.
PLEASE READ THE WARNING BELOW.
WARNINGS:
KEEP CLEAR OF THE LAMP WHEN IT IS OPERATING. THE HIGH
WATTAGE IS DANGEROUS.
TURN THESE LAMPS OFF UNLESS YOU ARE ACTUALLY USING THEM.
THE LAMPS HAVE A LIMITED LIFE. LEAVING DISCHARGE LAMPS when you are
not using them MAY RESULT IN DEDUCTION OF POINTS ON YOUR LAB! Alpha Star Turn on the discharge tube for Alpha Star (you are using the discharge tube as a model of an unknown star comprised of a single gaseous element). Make observations of the colors and placement of Alpha Star’s spectrum. Record your observations on the graph below. Be sure to carefully observe the number (wavelength) under the colored spectral line and place your “colored” line in the corresponding place on the graph.
Spectrum
3000 3500 4000 4500 5000 5500 6000 6500 7000 7500 8000
Wavelength (angstroms)
3-9
After drawing the spectrum of Alpha Star, compare it to the chart of spectrums from known gases on the classroom wall. What gas do you think Alpha Star is predominately made of? If there is more than one possibility, list them all. Explain your reasoning. How confident are you? Beta Star Turn on the discharge tube for Beta Star (you are using the discharge tube as a model of an unknown star comprised of a single gaseous element). As above, make observations of the colors and placement of Beta Star’s spectrum. Record your observations on the graph below. Be sure to carefully observe the number (wavelength) under the colored spectral line and place your “colored” line in the corresponding place on the graph. Be sure to maintain consistency with regards to where red is place (be it either at the right side or left side). After drawing the spectrum of Beta Star, compare it to the chart of spectrums from known gases. What gas do you think Beta Star is predominately made of? If there is more than one possibility list them all. Explain your reasoning. How confident are you?
Spectrum
3000 3500 4000 4500 5000 5500 6000 6500 7000 7500 8000
Wavelength (angstroms)
3-10
On the graph below, draw the spectrum of a third star, which is composed of a mixture of the gases of Alpha Star and Beta Star. Fluorescent Star: Observe the fluorescent lamp through the spectroscope. Carefully record Fluorescent Star’s spectrum on the graph below and compare it to the chart of known gases. What gas do you think is inside a fluorescent tube lamp? (Perhaps it is a mixture, while Alpha Star and Beta Star were each only one gas. If you think so, list more than one element, and explain why you think this.)
Spectrum
3000 3500 4000 4500 5000 5500 6000 6500 7000 7500 8000
Wavelength (angstroms)
Spectrum
3000 3500 4000 4500 5000 5500 6000 6500 7000 7500 8000
Wavelength (angstroms)
3-11
Activity 3: Compare the incandescent and fluorescent light sources. Note the wattage of each lamp. The wattage of the lamp tells you how much electrical power the lamp is consuming. Now visually compare their brightness. Why does the fluorescent lamp appear brighter than the lamp with the incandescent bulb? (HINT: Hold your hand next to each lamp.) Questions: 1. Did the different gases in the discharge tubes (Alpha and Beta Stars)
produce the same spectrum or a 'signature' spectrum different from each other?
A continuous spectrum is one in which all wavelengths are represented (an uninterrupted band of colors). A discrete spectrum is one that does not have all wavelengths represented; some wavelengths are missing. Your textbook described two types of discrete spectra: bright line emission spectrum and dark line absorption spectrum. Look at the spectrum of Sun on the poster from which you obtained the known spectrums of gases. Notice that the solar spectrum is missing discrete wavelengths. 2. What relationship do you notice between the missing wavelengths from
the solar spectrum and the discrete spectrums of the gases on the chart? 3. What does this tell you about the wavelengths at which gases emit and
absorb light? 4. Based on the solar absorption spectrum, identify at least two gases
present on Sun.

3-12
Name____________________________________
Lab day ______Lab Time_____________________ POST LAB ASSESSMENT 1. Imagine that you are a bat hunting insects in the night. Since it is
dark and your eyesight is awful, you use sound pulses (sonar) to locate your dinner instead of sight. Suppose you send out a sound pulse (a high-pitched squeak) and it reflects off a moth. Your brain measures the two-way travel time as 0.02 seconds. How far away is that tasty moth? You need to know the speed of sound; you measured it in Part B, page 3-6. Write the speed here: _________
Show your calculations of the distance to the moth, with units, in the area below. 2. What sorts of information do astronomers have available to them
from the stars? In what form does it come? 3. Suppose that someone gave you a sample of an unknown gas.
How might you go about identifying it using techniques learned in today’s lab?

4-1
ES 104 Laboratory # 4 INTRODUCTION TO PLATE TECTONICS
Introduction
The Theory of Plate Tectonics has revolutionized the science of Geology in the last 30 years. The theory states that the outer surface of Earth consists of 7 major lithospheric plates and numerous smaller ones, and these plates move around on a ductile layer referred to as the asthenosphere. The boundaries between the lithospheric plates, which are where they interact with one another, are characterized by distinctive topographic features and catastrophic geologic processes such as earthquakes and volcanism. Goals and Objectives • Introduce some of the basic ideas of Plate Tectonics • Study the Plate Tectonic setting of the western United States and
parts of the adjacent Pacific Ocean basin • Describe the relation between earthquakes, volcanoes, and plate
boundaries • Learn to use map scales to convert map measurements to real-world
distances Useful Websites • http://animations.geol.ucsb.edu/downloads.php • http://www.ucmp.berkeley.edu/geology/tectonics.html • http://vulcan.wr.usgs.gov/Glossary/PlateTectonics/Maps/
map_juan_de_fuca_ridge.html • http://vulcan.wr.usgs.gov/Glossary/PlateTectonics/Maps/
map_plate_tectonics_world.html • http://terra.chemeketa.edu/Faculty/fraa/geology/topics/tectonics/
photos/htmls/world-sea-floor2.html • http://terra.chemeketa.edu/Faculty/fraa/geology/topics/tectonics/
photos/htmls/pacific-sea-floor.html
4-2
Name____________________________________
Lab day ______Lab Time_____________________
Pre-lab Questions – Complete these questions before coming to lab.
Briefly define the following key words, drawing diagrams where necessary, and answer the questions. 1. Lithosphere
2. Asthenosphere 3. Divergent Plate Boundary 4. Convergent Plate Boundary 5. Transform Plate Boundary 6. At what type of plate boundary is Oregon located? 7. What type of plate boundary is found in southern California? 8. Sketch a cross-section of Earth, showing the internal structure.
Include inner core, outer core, lower mantle, upper mantle, asthenosphere, lithosphere, moho, oceanic crust, continental crust (you may need an inset for the relationship of the last few items).
4-3
Part A—The Earth’s Fractured Surface Map Examine the National Geographic map The Earth’s Fractured Surface, and answer the following questions: 1. What type of crust is present where most divergent plate margins
occur? 2. What areas have groups of active volcanoes? 3. If these are associated with plate boundaries, use the term that
describes the type of plate boundary. 4. Look at the Pacific Northwest area. What tectonic plates are there or
nearby which may affect that area? (There are several.) Describe the type of boundaries that exist between these plates. (One type for each pair of plates that touch one another.)
5. The margin of the Pacific Ocean basin is often referred to as the
“Ring of Fire”. What evidence is shown on the map to justify this name?
6. List some areas that have isolated active volcanoes.
4-4
Examine the Hawaiian Islands and surrounding area. Notice the alignment of the Hawaiian Islands and submerged seamounts of the Hawaiian Ridge extending to Midway Island and beyond. This linear string has an abrupt bend, and continues as the Emperor Seamounts to the Aleutian Trench. 7. What does the yellow circle with the arrow pointing to the northwest
represent? (The red triangle in the center is the symbol for an active volcano.) Also record the information this symbol gives about Hawaii.
8. How can this information help you understand the formation of the
Hawaiian Ridge? 9. Midway Island is the small island just north and slightly east of the ‘s’
of ‘Midway Is.’ on the map. The volcanic rocks on Midway Island are 27 million years old. Determine the rate in inches/year (rate = distance/time) and direction of plate motion of the Pacific Plate over the last 27 million years. (NOTE: Scale of map: 1 inch = 758 miles. Do not forget to convert miles to inches, and use all the zeroes instead of ‘million’ years.) Show your calculations with units.
10. Compare your calculated value to the map data about plate
movement at the Hawaiian hotspot. 11. If your finger nails grow about 7.5 mm a month, is the rate of
motion of the Pacific Plate comparable to this? (Like compared to how fast you can drive, or walk…)
4-5
12. Suiko Seamount (which is not labeled on the map) is located at 44.5o N, 170.3o W (approximately beneath the second "R" in the word "EMPEROR"), has yielded an age date of 65 million years. Based on the available age data and the distribution of the Hawaiian Islands chain and the Emperor Seamount chain, discuss how the movement of the Pacific Plate has changed direction through time. Is this change in motion consistent with other seamount chains in the Pacific Ocean? Explain.
Find the locations of the eruptions listed in “Notable Volcanic Eruptions of the 20th Century” (upper right corner of the chart). 13. At what type of plate boundary have the vast majority of the
volcanic eruptions in the 20th century occurred? 14. Consider the Iceland eruption of 1963. What two factors may
have contributed to this eruption? 15. Find earthquakes listed in “Notable Earthquakes of the 20th
Century”. Does there seem to be a relationship between the magnitude of a given earthquake and the type of plate boundary where it occurred? What is this relationship?

4-6
Part B – Living on the Edge Map Examine the National Geographic map entitled Living on the Edge and answer the following questions: 1. Study the earthquake patterns along the Cascadia Subduction Zone in N. California, Oregon, and Washington. Describe the area has had the largest number of earthquakes; area of the least? 2. In comparison to other subduction zones worldwide, the Cascadia Subduction Zone has a distinct lack of earthquakes. In fact, there has never been an instrumentally recorded earthquake on the boundary between the down-going Juan de Fuca plate and the overriding North America plate. What are two possible scenarios for motion between the Juan de Fuca and North America plates that would lead to a lack of earthquakes on the Cascadia Subduction Zone? 3. Read inset information on the map indicating that a large earthquake occurred in the geologic past along offshore Oregon. Are any of your reasons above consistent with this evidence? Explain. 4. Using The Earth’s Fractured Surface map, compare the Cascadia and Aleutian subduction zones and speculate on why they have such different earthquake activity. 5. Read the information on the map about the Cascade volcanoes. Would you consider the Cascades to be active volcanoes? Explain. 6. Locate Long Valley Caldera in eastern California, and suggest a reason why there have been such a large number of earthquakes in this region. (HINT: Note that Mt. St. Helens shows a similar cluster of earthquakes).

4-7
Part C – Studying the San Andreas Fault, California Study Figure 1 below, and answer the questions on the following page. Put arrows on Figure 1 along opposite sides of the San Andreas Fault to show the relative sense of movement along the San Andreas Fault. You may want to color the different units different colors to help you see their relationship to the fault movement. Figure 1: Generalized geologic map of central western California
showing the San Andreas Fault.
Q

4-8
1. What kind of plate boundary is the San Andreas Fault? 2. It is possible to estimate the average annual rate of movement along the San Andreas Fault by recognizing rocks older than the fault that have been offset by the fault. Note that Pliocene-Miocene (M) rocks have been cut and offset by the fault. These rocks have been dated as being 25 million years old. What is the average annual rate of fault movement in centimeters per year (cm/yr)? Show all your work, including units. 3. The average yearly rate of movement on the San Andreas Fault is very small. Does this mean that the residents of southern California are safe from earthquake damage caused by earthquakes on this fault? Explain. 4. An average movement of about 5 meters along the San Andreas Fault was associated with the 1906 San Francisco earthquake. Assuming that all of the displacement along the San Andreas Fault over the last 25 million years was produced by earthquakes with 5 meters of displacement, calculate the average recurrence interval (number of years between earthquakes) for these earthquakes. Show all your work, including units.
4-9
Name____________________________________
Lab day ______Lab Time_____________________
POST LAB ASSESSMENT
Today, we can directly measure motion of the plates using Global
Position System.
1. How does the plate motion rate measured using GPS differ from
the plate motion rates that you calculated using hotspot tracks?
2. What does the fact that the GPS rates and hotspot track rates
generally agree with each other tell you about plate motions over long
time periods?
3. Suppose Earth’s tectonic engine ground to a halt. What would be
the implications for the geologic phenomena that you examined in the
lab today? Be sure to justify your predictions fully.

5-1
ES 104 Laboratory # 5 EARTHQUAKES:
Epicenter Determination, Seismic Waves, and Hazards Introduction
Earthquakes are vibrations of Earth caused by large releases of energy that accompany volcanic eruptions, explosions, and movements of Earth's crust along fault lines. The earthquake vibrations are waves of energy that radiate through Earth away from the focus. These waves of energy can be recorded on a seismograph, which produces a recording called a seismogram. Seismographs record the two types of body waves: Primary waves (P-waves) and Secondary waves (S-waves). They also detect Surface waves called Love waves (L-waves) and Rayleigh waves (R-waves).
Travel-time curves are graphs that indicate how long it takes each type of seismic wave to travel a distance measured on Earth's surface. The difference between the S-wave arrival time and the P-wave arrival time corresponds to the distance of the seismograph station from the earthquake focus. This time difference can be converted easily into distance using the travel-time curves (Figure 2). Goals and Objectives • Learn to locate an earthquake epicenter using p-wave and s-wave
arrival time differences and travel time curves. • Know the essential components of a seismometer and how
seismometers record earthquakes. • Describe the relation between earthquakes, volcanoes, and plate
boundaries. • Understand earthquake-induced liquefaction and landslide hazards
and how they relate to site geology. Useful Websites • http://quake.wr.usgs.gov/info/1906/got_seismogram_lp.html • http://www.jclahr.com/science/earth_science/tabletop/earthshaking • http://www.sciencecourseware.org/VirtualEarthquake/
VQuakeExecute.html • http://staff.imsa.edu/science/geophysics/geosphere/tectonics/
seismogram.html

5-2
Name_____________________________________
Lab day ______Lab Time_____________________
Pre-lab Questions – Complete these questions before coming to lab.
Briefly define the following key words. 1. Earthquake 2. Primary Wave 3. Secondary Wave 4. Epicenter 5. Richter scale 6. Tsunami Question for Thought 7. How do earthquakes relate to plate tectonics?

5-3
Part A – Epicenter Determination The epicenter of an earthquake is the point on Earth's surface at or above the earthquake's focus. In this exercise, you will determine the location of the epicenter of an earthquake that was recorded on seismograms at three different locations (Figure 1).

5-4
Figure 2: Travel-time curves for P-waves, S-waves, and L-waves.

5-5
Figure 3: Travel-time graph to determine the distance to the epicenter.
S w
ave
arriv
al--
P w
ave
arriv
al
01234567
050
010
0015
0020
0025
0030
00
Dis
tanc
e (m
iles)
Time difference: S-P wave (minutes)

5-6
1. Estimate to the nearest tenth of a minute (NOT seconds), the times of the first arrival of the P-waves and S-waves at each station in Figure 1. Times show it arrived after 8 AM. Record this in Table 1, below Subtract P-wave arrival time from the S-wave arrival time to determine the difference in travel time of P-wave and S-wave in minutes and tenths of minutes.
Table 1: Arrival times at seismic stations
Location of seismic station
First P-wave Arrival (time as hour: minute.tenths)
First S-wave Arrival
(time as hour: minute.tenths)
Difference in travel time between S & P
Sitka, AK
Charlotte, NC
Honolulu, HI
2. Using the S-minus-P times and the travel-time curve (Figure 3),
estimate the distances from the focus that correspond to these values. Record these in Table 2, below.
Table 2: Distance of focus to seismic station
Location Distance (miles)
Sitka, AK
Charlotte, NC
Honolulu, HI
3. Find the earthquake's epicenter using the distances you just
obtained. a. Locate and mark the three seismic stations on the world map,
Figure 3 (page 5-7): Sitka, AK: 57° N latitude, 135° W longitude Charlotte, NC: 35° N latitude, 81° W longitude Honolulu, HI: 21° N latitude, 158° W longitude

5-7
Figure 4: Map of Earth, for use in plotting data and locating the
earthquake's epicenter.

5-8
b. Use a drafting compass to draw a circle around each seismic station. Make the radius of the circle equal to the distance between the station and the epicenter that you determined above. Use the scale for the world map to set this radius on the drafting compass. The circles you draw should intersect at one point, which is the epicenter. (If the three circles do not intersect at a unique point, choose a point equidistant between the three circles.) The location of the epicenter is:
Latitude __________Longitude ______________
4. What is the origin time of the earthquake? That is, at what time did the earthquake occur? Using data from a single station, and Figure 2 or 3 to find out how long it takes to arrive, and the distance determined from epicenter to quake. Note the station, and show your calculations.
5. What time would you estimate did the L-waves from this
earthquake begin to arrive at the Sitka station? (Use Figure 2)
5-9
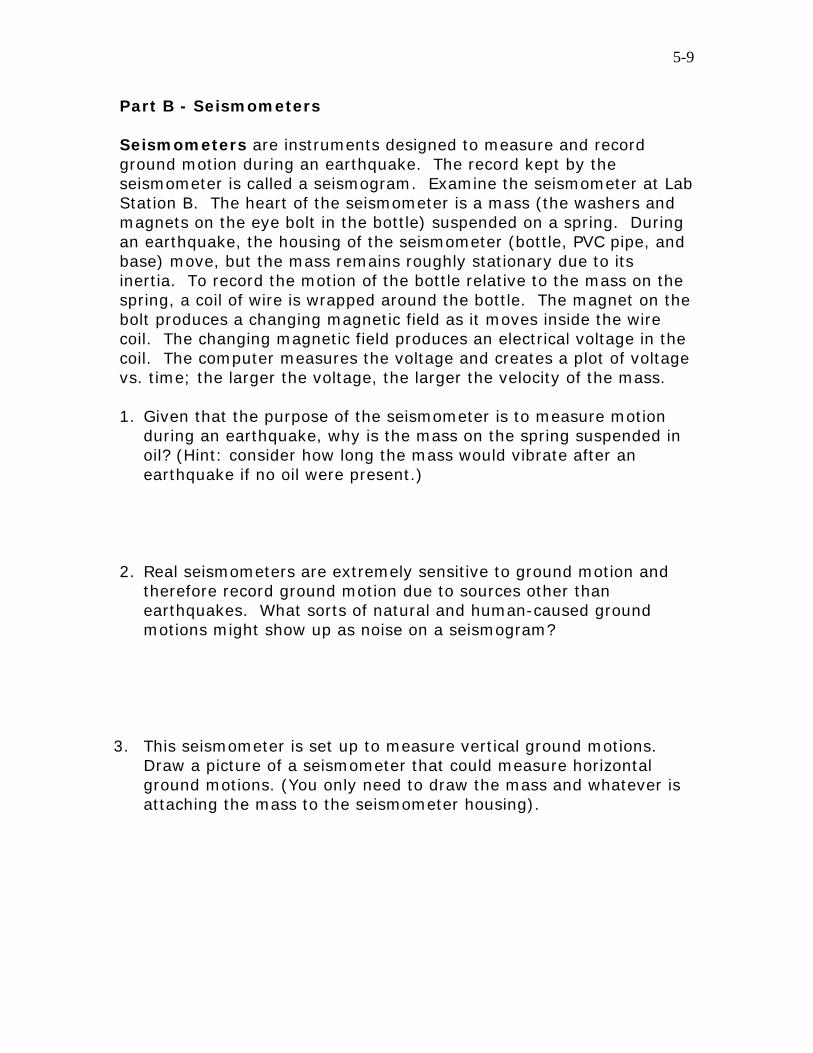
Part B - Seismometers Seismometers are instruments designed to measure and record ground motion during an earthquake. The record kept by the seismometer is called a seismogram. Examine the seismometer at Lab Station B. The heart of the seismometer is a mass (the washers and magnets on the eye bolt in the bottle) suspended on a spring. During an earthquake, the housing of the seismometer (bottle, PVC pipe, and base) move, but the mass remains roughly stationary due to its inertia. To record the motion of the bottle relative to the mass on the spring, a coil of wire is wrapped around the bottle. The magnet on the bolt produces a changing magnetic field as it moves inside the wire coil. The changing magnetic field produces an electrical voltage in the coil. The computer measures the voltage and creates a plot of voltage vs. time; the larger the voltage, the larger the velocity of the mass. 1. Given that the purpose of the seismometer is to measure motion
during an earthquake, why is the mass on the spring suspended in oil? (Hint: consider how long the mass would vibrate after an earthquake if no oil were present.)
2. Real seismometers are extremely sensitive to ground motion and
therefore record ground motion due to sources other than earthquakes. What sorts of natural and human-caused ground motions might show up as noise on a seismogram?
3. This seismometer is set up to measure vertical ground motions. Draw a picture of a seismometer that could measure horizontal ground motions. (You only need to draw the mass and whatever is attaching the mass to the seismometer housing).

5-10
Making Earthquakes You are going to simulate earthquakes and record them on this seismometer. To simulate the earthquakes, you will drop 0.2 kg and 1 kg masses onto the wooden squares attached to the plywood base. The differing masses correspond to earthquakes of different size. Energy from the mass hitting the table will travel down the plywood base as an elastic wave where the wave will move the seismometer. The seismometer will then make a record of its motions. During a real earthquake, energy released at the focus of the earthquake travels to distant seismometers through seismic waves. Directions 1. Do not mess with any of the electronics attached to the seismometer!!! 2. Use the menu command Experiment>Delete ALL data runs to delete all previous data runs on the computer. 3. Click Start to begin recording data from the seismometer. 4. Carefully drop the 1 kg mass from a height of 6.5 centimeters above the wooden block labeled 1. Use a ruler to measure the height precisely. The idea is to make all drops from the same height, to compare the effect of distance and magnitude on the seismogram. 5. Carefully drop the 1 kg mass from a height of 6.5 centimeters above the wooden block labeled 2. 6. Now repeat the drops at the two wooden blocks using the 0.2 kg mass. Be sure to keep the drop height at 6.5 centimeters. 7. Press Stop on the computer to stop recording data. 8. Adjust the horizontal and vertical scales on your seismogram so that all four earthquakes fit on the graph. Print your seismogram and label the 4 earthquakes with the mass dropped and the location of the earthquake.

5-11
Questions 1. Look at the seismogram that you made. How does the amplitude of
the ground motion recorded by the seismometer relate to the magnitude of the earthquake (or in this case, the size of the mass dropped)?
2. How does the amplitude of the ground motion recorded by the
seismometer depend on the distance to the earthquake epicenter for a given earthquake magnitude? Use this observation to explain why earthquake magnitude scales must correct for the distance from the seismometer to the earthquake epicenter to assign a magnitude to an earthquake using ground motion amplitudes recorded on a seismogram.
3. Compare the duration of strong shaking between the 1 kg
earthquake and the 0.2 kg earthquake. How does the duration of shaking relate to the earthquake magnitude? How do you think this affects the amount of damage that occurs to buildings during an earthquake?

5-12
Part C – Liquefaction During earthquakes, soils and sediments saturated with water can lose their shear strength and begin to act like a fluid. This process is called liquefaction. In this experiment, you will cause sand saturated with water to liquefy.
Directions 1. Remove the 1 kg mass from the sand-containing column if the
previous group has not already done so. If you cannot locate the 1 kg mass, it may be buried in the sand. Dig around until you find it.
2. Lift the column containing only water approximately 2 feet off the
tabletop. You should see water flow up through the bottom of the sand in the other column. Allow water to flow into sand-containing column until all of the sand is suspended in the water. This, by the way, is how quicksand forms!
3. Place the water-containing column back on the table. Watch as the
sand settles out of the water. This settling process causes the sand to be very loosely packed. Loose packing of sediment deposits increases the likelihood of liquefaction during an earthquake.
4. Once the water level in the sand-containing column has dropped to
the surface of the sand, gently place the 1 kg mass on the sand. The 1 kg mass represents a building constructed on loosely packed, water-saturated sediment.
5. To simulate an earthquake, strike the sand-containing column
sharply with the rubber mallet, aiming for the black X. Be careful not to hit the vertical plastic tubes on the outside of the column.

5-13
Questions
1. What happened to the 1 kg mass when you struck the column with the rubber mallet? Given this result, what sorts of hazards does liquefaction pose to buildings during an earthquake?
2. In order for liquefaction to take place during an earthquake, the soils and sediments need to be saturated with water. How do you think the depth to the water table relates to the liquefaction hazard in a particular location? (Note: the water table is the top of the zone of sediments in the subsurface that are completely saturated with water. If you drill a water-well in your backyard, you hope that your well will reach the water table.)
3. Based on your observations while preparing for the liquefaction experiment, in what types of locations do you think you would find loosely-packed, liquefaction-prone sediment deposits? Can you think of any towns or cities in Oregon that might be built on these types of sediment deposits?
4. Remove the 1 kg mass from the sand. Firmly tap the side of the sand-containing column several times while watching the sand closely. Place the mass back on the sand and strike the X on the side of the sand-containing column. What happened to the mass this time? Why?
5. Does this result suggest any ways that liquefaction prone building sites could be prepared before construction to reduce damage due to liquefaction during a future earthquake?
5-14
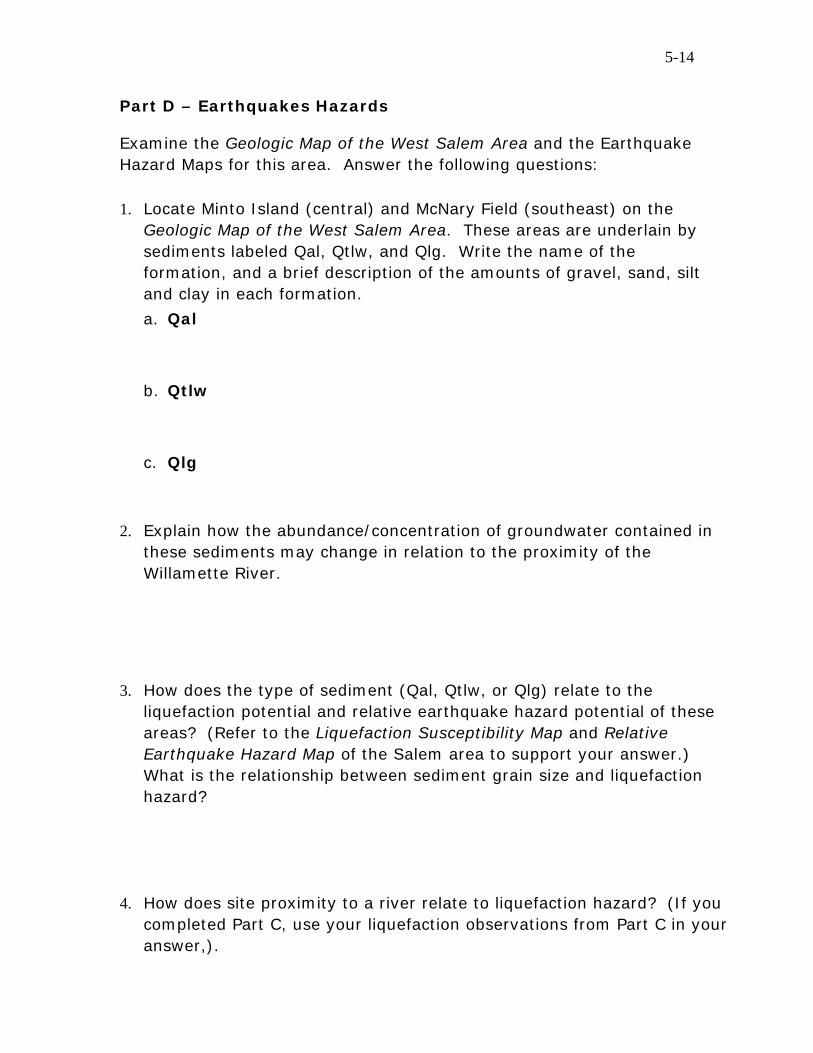
Part D – Earthquakes Hazards Examine the Geologic Map of the West Salem Area and the Earthquake Hazard Maps for this area. Answer the following questions:
1. Locate Minto Island (central) and McNary Field (southeast) on the
Geologic Map of the West Salem Area. These areas are underlain by sediments labeled Qal, Qtlw, and Qlg. Write the name of the formation, and a brief description of the amounts of gravel, sand, silt and clay in each formation.
a. Qal b. Qtlw c. Qlg
2. Explain how the abundance/concentration of groundwater contained in these sediments may change in relation to the proximity of the Willamette River.
3. How does the type of sediment (Qal, Qtlw, or Qlg) relate to the
liquefaction potential and relative earthquake hazard potential of these areas? (Refer to the Liquefaction Susceptibility Map and Relative Earthquake Hazard Map of the Salem area to support your answer.) What is the relationship between sediment grain size and liquefaction hazard?
4. How does site proximity to a river relate to liquefaction hazard? (If you
completed Part C, use your liquefaction observations from Part C in your answer,).

5-15
5. Locate portions of the Geologic Map of the West Salem Area which are underlain by Eocene-Oligocene sedimentary rocks (Toe). Would you build a beautiful new home overlooking the river in these areas? Why or why not? (Hint: Examine the susceptibility to earthquake damage in these areas and how this relates to the topography and geology from the Liquefaction Susceptibility Map, Landslide Susceptibility Map, and Relative Earthquake Hazard Map of the Salem area.).
6. Examine the Geologic Map of the West Salem Area. Locate Fairview
Hospital (Fairview Home on some maps) (southeast of McNary Field), West Salem and Marion Square Park (central), and the Salem Heights School and Morningside School (south central) on the map. Describe the geology and topography of each location in the table below.
Location
Geology (name of the rock units, and a short description of it)
Topography (steep slopes, gentle
slopes, or flat)
Ranking of Earthquake
Susceptibility
Fairview Hospital
West Salem
Salem Heights
7. Using the Relative Earthquake Hazard Map of the Salem area, rank each of
the above locations in order of decreasing susceptibility to damage from earthquakes. Then describe why each is or is not susceptible to damage. (Refer to Liquefaction Susceptibility Map and Landslide Susceptibility Map of the Salem area and your answer to question 3 to support your answer.)

5-16
Name____________________________________
Lab day ______Lab Time_____________________ POST LAB ASSESSMENT 1. The Global Positioning System consists of a network of satellites that send out signals that are picked up by GPS receivers, such as the models used for navigation by hikers or in cars. The GPS receivers have a database indicating the location of each satellite. The satellite sends a signal of the time of broadcast. To determine their position, the GPS receivers use the known locations of the satellites, the time signals the satellites send to the receiver, and the speed of radio waves. Explain how the GPS receiver calculates its position, and why it uses at least four satellite signals to determine its position. 2. In lab 4 and lab 5, you have learned a great deal about earthquakes and earthquake hazards. Using this information, explain all of the factors that should be considered in determining the earthquake hazard at a given building site.

6-1
ES 104: Laboratory # 6 PHYSICAL PROPERTIES OF MINERALS
AND MINERAL IDENTIFICATION Introduction
Minerals are naturally occurring, usually inorganic, solids that possess a definite chemical composition and a specific, orderly arrangement of atoms. This lab will help you to develop the ability to identify common minerals found at Earth's surface. Although there are literally thousands of minerals, the small number of the most common rock forming, ore, and industrial minerals studied here constitute a large part of Earth's crust. Identification is accomplished by testing and observing the physical properties studied in the first of part of this laboratory. The second part of the lab will focus on describing the physical properties of a mineral and on identifying minerals using the physical properties. Objectives • Recognize and describe the physical properties of minerals • Develop and use a mineral identification key to name minerals • Identify minerals using physical properties Useful Websites • http://mineral.galleries.com/minerals/property/physical.htm • http://www.rockhounds.com/rockshop/xtal/part2.html • http://geology.csupomona.edu/alert/mineral/shape.htm • http://mineral.galleries.com/minerals/cleavage.htm • http://webmineral.com/help/Luster.shtml
6-2
Name____________________________________
Lab day ______Lab Time_____________________
Pre-lab Questions – Complete these questions before coming to lab.
Briefly define the following key words. 1. Element
7. Density
2. Mineral
8. Hardness
3. Color
9. Cleavage
4. Streak
10. Fracture
5. Luster
11. Crystal form
6. Magnetism
12. Effervescence
1. How is density calculated? (Show formula with units.)
2. What is the difference between a silicate and non-silicate mineral?
Include some examples of each type of mineral.

6-3
Part A: Activities Focusing on Physical Properties Minerals exhibit certain diagnostic properties, called physical
properties, which can be tested and observed, thereby leading to the correct identification of the mineral. Many (but not all) of these properties are unique to a given mineral. One of the keys to identifying minerals is observing a combination of physical properties displayed by a mineral. You must be sure of the meaning of each of the physical properties. On the following pages, you will study these properties: luster, color, streak, heft, density, hardness, cleavage, fracture, crystal form, magnetism, and effervescence in dilute, cold hydrochloric acid (HCl).
STATION #1: Luster and Color
1. Study the various mineral specimens provided. How many specimens in the station 1 box can be grouped into each of the following luster types?
_________ Metallic _________ Nonmetallic-glassy
Describe Luster in your own words.
2. Study the mineral specimens of quartz (Sample #3) provided. What is the reason for the variety of colors that quartz exhibits? (HINT: Think about what a single drop of food coloring does to a glass of water.)
3. Is color a reliable physical property to help identify a given mineral specimen? Keep in mind your investigation in question 2 above. Explain your answer.

6-4
STATION #2: Other Physical Properties: Streak, Magnetism, and Effervescence 1. Describe in your own words:
Streak— Magnetism— Effervescence—
2. Examine the collection of samples provided and complete the data table by recording the following observations for each sample: Sample Number
Streak Magnetism Reaction to HCl
#1
#2
#13

6-5
STATION #3: Cleavage, Fracture, and Crystal Form Study the collection of single mineral samples. Several samples exhibit cleavage (#5, #6, and #13), one shows fracture (#3), and one demonstrates crystal form (#4). Cleavage and Fracture are related to how a mineral breaks apart. They are controlled by the internal atomic arrangement of the mineral. 1. Which, cleavage and fracture, is controlled by planes of weak
chemical bonding? 2. Briefly explain in relation to crystal structure of the atoms. Crystal Form is also controlled by the internal atomic structure but is not related to how a mineral breaks. Look at the crystal form shown by sample 4 with the magnifying lens. Sketch it. 3. What is Crystal Form?
Study the group of minerals demonstrating cleavage and complete the data table. For each, describe the cleavage in terms of the number of directions, or write ‘none’ if the mineral does not have cleavage, and determine the angle between them, if there is more than one direction of cleavage. Also, provide a simple sketch of the sample emphasizing the cleavage.
Sample Number
# of Direc-tions
Angle between cleavage planes (90º or not 90º)
Sketch showing cleavage angle
#3
#5
#6
#13

6-6
STATION #4: Density The density of a mineral can be estimated by hefting the mineral in your hand. Some minerals will feel heavier than others for a given sample volume. This is a subjective determination. For mineral identification, it is better to measure the mineral sample’s mass and volume and calculate the density. Density can be calculated with a high degree of accuracy (although your measurement may not seem so because you are using a relatively primitive method). The density of any substance is the mass per volume, shown by the equation: Density = Mass/Volume. Perhaps of greater importance, any person doing the determination should get the same answer: the answer is objective and not subjective. The concept that anyone doing the experiment should get the same answer is fundamental to science. Step 1: Find the mass of your specimen using the balance. Step 2: Determine the volume of the specimen by displacement of
water in a graduated cylinder. Step 3: Use the equation to determine the value of the density.
Specimen number
1) Mass of specimen
2)Volume of specimen
3) Density of specimen
Show work here (include units):
UNITS!!

6-7
1. If you have 2.65 grams of quartz (density = 2.65 g/cm3), what is the volume of the specimen, in cm3?
2. What volume of quartz would weigh 1 gram?
Use proportions. Show work here (include units). A term quite similar to density that is often used is specific gravity (S.G.). Specific gravity.is a unitless comparison of a material’s density to the density of water. Specific gravity can be thought of as the number of times the mineral is heavier than that volume of water. For example, if a mineral has a specific gravity of 3.47, it is 3.47 times heavier than if that same volume of water. Water has a specific gravity of 1.
1. If a substance had a specific gravity of 2.54, would it float or sink in water? Explain.
2. Is the specific gravity of ice greater or less than 1? How do you
know?
3. Is the specific gravity of oil greater or less than 1?

6-8
STATION #5: Hardness The following hardness guide is useful to bracket the hardness of an unknown sample.
Hardness Guide:
Hardness ‘Code’ Description
less than 2.5 <2.5 Mineral can be scratched by fingernail (H = 2.5).
2.5 to 3.5 2.5-3.5
Mineral cannot be scratched by fingernail (H = 2.5) and mineral cannot scratch penny (H = 3.5).
3.5 to 5.5 3.5-5.5
Mineral can scratch penny (H = 3.5) and cannot scratch glass (H = 5.5).
greater than 5.5 >5.5 Mineral can scratch glass (H = 5.5).
Determine the hardness for the small group of minerals provided and complete the data table.
Sample Hardness (use code from table above)
#3
#7
#13
#14
Describe how differences in hardness might be useful in mineral identification.

6-9
Part B: Activities focusing on Mineral Description and Mineral Identification Description
You are now ready to collect a complete set of data of the physical properties useful in mineral identification. Determine the physical properties of each sample and record your observations in the data table provided on the following page. Complete the table of specimen properties before continuing on to identify the minerals by name. This is more important than the name! Identification
Mineral identification is a process of elimination based on determinations of physical properties. In this activity, you will use an identification key for the minerals that you described above. To use a key to identify minerals, you will be given a series of choices about the properties of a mineral. For most of the identification process, the choices will be “either this or that”. Compare your determinations of mineral properties with the mineral identification tables in the following pages.
To identify the fifteen ‘unknown’ minerals, follow the divisions of the key tables: first choose the proper table by the luster of the mineral. Notice Table 2a is for identifying those minerals that have a metallic luster. Table 2b and 2c are for minerals that do not have metallic luster: Table 2b is for minerals that are light-colored, and 2c is for minerals that are dark colored. Each table for luster is divided into two sections: softer than glass, and harder than glass. These sections are further divided by the absence or presence of cleavage, and the characteristics of the cleavage if it is present.
After you have identified the minerals, you should concentrate on a small number (1-3) of properties for each mineral to help you remember how to identify it. These are considered “diagnostic properties” for that mineral. A particular mineral will have a set of properties that are diagnostic for it. Some properties that are diagnostic for certain minerals are of no significance for other minerals. This is especially true for color, or some special properties like magnetism or effervescence in hydrochloric acid.

6-10
Mineral Description Table
Sam
ple
#
Luster: Metallic/ glassy/dull
Hard
ness
Ran
ge co
de
pg. 6
-9
Cleavage: # of planes & angle of intersection. Crystal form (if it shows)
Stre
ak
Colo
r of it, o
r ‘n
one’ if H
>6
Color and Other properties (if present)
MINERAL NAME
1
2
3
4
5
6
7
8
9
10
11
12
13
14
15

6-11
Table 2a: Mineral Identification Key— Metallic Luster
Hardness Cleavage Diagnostic Physical Properties Mineral Name
Brass yellow color, tarnishes brown to green; greenish or brownish black streak; cubic or pyritohedron crystals common;
H = 6 – 6.5, SG=5.0
Pyrite FeS2
Pale brass yellow to whitish gold color; dark gray streak; radiating masses and “cockscombs:” common; H = 6 – 6.5, SG=4.9
Marcasite*
FeS2
Dark gray to black color, dark grey to black streak; magnetic; massive or “grainy”; may have ‘submetallic’ luster; H = 6, SG=5.2
Magnetite Fe3O4
Silver to gray to red-brown color, red-brown streak; often composed of glittery flakes; H=5-6.5, SG~5
Hematite Fe2O3
Har
der
than
gla
ss
Abse
nt
Grayish or dark brown to yellow-brown color; yellow-brown streak; H = 5 – 5.5, SG=4.4
Limonite*
Fe2O3 nH2O
Pres
ent Silver gray color, gray streak;
cubic cleavage (three directions at 90o), but may be distorted; H = 2.5 (cannot be scratched by fingernail); S.G. = 7.4 – 7.6
Galena PbS
Golden yellow color, tarnishes to purple; Greenish black to dark gray streak; H = 3.5 – 4, SG=4.2
Chalcopyrite* CuFeS2
Copper to dark brown color, tarnishes to green; copper streak; H = 2.5 3; S.G. = 8.8–8.9
Copper* Cu
Soft
er t
han
gla
ss
Abse
nt
Dark gray color; dark gray streaks; marks paper easily; greasy feel; H = 1; S.G. = 2.1-2.3
Graphite* C
* These minerals are not included with ES 104 lab specimens.

6-12
Table 2b: Mineral Identification Key— Nonmetallic Luster, Light Colored
Hard-ness
Cleav-age Diagnostic Physical Properties Mineral Name
White to pink color; two directions of cleavage at 90o; H=6, SG=2.55; subparallel banding (exsolution lamellae) may be present on cleavage faces
Potassium Feldspar † (Orthoclase) KAlSi3O4
Pres
ent
White to blue-gray color; two directions of cleavage at nearly 90o; H=6, SG=2.65; may have striations (parallel grooves) on cleavage faces
Plagioclase Feldspar
NaAlSi3O8 to CaAl2Si2O8
White, gray, or pink color; usually massive; may have hexagonal prism with pyramid crystals; transparent to translucent; glassy luster; conchoidal fracture; H=7, SG=2.65
Quartz SiO2
Har
der
than
gla
ss
Abse
nt
Olive green to yellow-green color; granular masses; grains glassy with conchoidal fracture; H=7: reduced by alteration, SG=3.3-4.4
Olivine (Fe,Mg)SiO4
Colorless, yellow, blue, green, or purple; four directions of cleavage (octahedral); transparent to translucent; H=4, SG=3.2
Fluorite* CaF2
White, gray, or pink color; three directions of cleavage not at 90o (rhombohedral); fizzes in dilute HCl if powdered; H=3.5–4, SG=2.85
Dolomite*
CaMg(CO3)2
Colorless, white, yellow, or gray; rhombohedral cleavage (three directions, not at 90o); fizzes in dilute HCl; H = 3, SG=2.72
Calcite CaCO3
Colorless, white or gray; cubic cleavage (three directions at 90o); salty taste; dissolves in water; H = 2.5, SG=2.1-2.3
Halite NaCl
Colorless, clear brownish or yellowish color; one direction of cleavage; usually thin, elastic, transparent to translucent sheets; H=2.5, SG=2.8
Muscovite(mica) KAl2(AlSi3O10)(OH)2
Pres
ent
Colorless to white; massive, or one good direction of cleavage (and two poor) forming thick; nonelastic, translucent sheets; H = 2, SG=2.3
Gypsum CaSO4 2H2O
Soft
er t
han
gla
ss
Ab-
sent White earthy masses resembling chalk; plastic and sticky when wet; H=1–1.5, SG=2.6
Kaolinite* Al4Si4O10(OH)8
*These minerals are not included with ES 104 lab specimens.
† Minerals important to formation of igneous rocks: study these carefully because they will be used to help identify igneous rocks in the next two labs.

6-13
Table 2c: Mineral ID Key—Nonmetallic Luster, Dark Colored Hard-ness
Cleav-age Diagnostic Physical Properties Mineral Name
Dark gray to blue-gray color; two directions of cleavage at ~90o; H = 6, SG=2.62-2.76; striations (parallel grooves) may be present on cleavage faces
Plagioclase Feldspar NaAlSi3O8 to CaAl2Si2O8
Black to dark green color; two directions of cleavage intersecting at 87o and 93 o; often massive in appearance; H = 5.5, SG=3.1-3.5
Augite (Pyroxene) Ca, Mg, Fe, Al Silicate Pr
esen
t
Black to dark green color; two directions of cleavage intersecting at 60 o and 120 o; often massive or splintery in appearance; H=5.5, SG= 3.0-3.3
Hornblende (Amphibole) Na, Ca, Mg, Fe, Al Silicate
Dark gray to smoky brown color; usually massive; transparent to translucent; glassy luster; conchoidal fracture; H = 7. SG=2.65
Quartz SiO2
Black to dark green or olive green color; granular masses; single grains are glassy with conchoidal fracture; H = 7, SG=3.27-4.37
Olivine (Fe,Mg)SiO2
Dark red to brownish-red color; translucent; often has smooth, parallel fractures resembling cleavage; H = 7, SG=3.5-4.3
Garnet* Fe, Mg, Ca, Al Silicate
Dark gray to black color, dark grey to black streak; magnetic; massive or “grainy”; may have ‘submetallic’ luster; H = 6, SG=5.2
Magnetite Fe3O4
Har
der
than
gla
ss
Abse
nt
Grayish to dark brown to yellow-brown color; yellow-brown streak; amorphous; opaque, earthy appearance ; H = 1.5–5.5, SG=4.37
Limonite* Fe2O3 nH2O
Dark brown to dark green color; one direction of cleavage; usually in thin, elastic, transparent to translucent sheets; H = 2.5–3, SG=2.95-3.0
Biotite (Mica) K(Mg,Fe)3AlSi3
O10(OH)2
Pres
ent
Dark green to green color; one direction of cleavage; usually in thin, opaque, curved sheets; often massive with greasy feel; H=2.5, SG=2.6-2.9
Chlorite* Mg, Fe, Al Hydrous silicate
Dull red color; reddish-brown streak; opaque, earthy appearance; H=1.5–5.5, SG=5.2
Hematite Fe2O3
Soft
er t
han
gla
ss
Abse
nt
Grayish or dark brown to yellow-brown color; yellow-brown streak; amorphous; opaque, earthy appearance; H = 1.5 – 5.5, SG=4.37
Limonite Fe2O3 nH2O
* These minerals are not included with ES 104 lab specimens. Minerals important to formation of igneous rocks

6-14
For your information...Mineral uses and some mineral facts: Barite principle source of barium and sulfate for chemical industry; used in
petroleum industry as drilling mud
Calcite used for manufacture of cement and lime for mortars, used as soil
conditioner, used as flux for smelting metallic ores, building
industry
Chalcopyrite important ore of copper; oxidized surfaces show iridescence.
Feldspars used in manufacture of porcelain; source of aluminum in glass
industry
Fluorite flux in making steel; used in chemical industry for hydrochloric
acid; high-grade ore is used in making optical equipment
Galena most important ore of lead; lead is used in batteries, in metal
products as an alloy, in glass making; used to be the principal
ingredient in paints. The Romans used lead for indoor plumbing,
which may have resulted in lead poisoning of the higher, classes
and contributed to the downfall of the Roman Empire.
Garnet semi-precious gemstone, used in abrasive products (sand paper)
Graphite this is the "lead" of pencils, also used in protective paints in
foundries, batteries, and electrodes; in fine powder form, it is
used as a lubricant
Gypsum plaster (wall board, sheet rock); used in Portland cement; soil
conditioner for fertilizer
Halite table salt; source of Na and Cl for the chemical industry
Hematite most important ore for steel making; used in pigments, some use
as gemstone
Kaolinite used for brick, paving brick, drain tile, ceramic products, and as
filler in glossy paper
Magnetite minor ore of iron
Olivine some used as gem (peridot); used in casting industry because of
refractory properties (means high melting temperature)
Quartz some use as gemstone; in sand form, used in mortar, concrete, as
flux, and for abrasive products. Artificial quartz is now used in
radios and for optical instruments (quartz permits both the
transmission and reception on a fixed frequency).
Sphalerite most important ore of zinc; galvanized metals are covered with
zinc to prevent rusting.
Talc used in manufacture of paint, paper, roofing materials, rubber,
cosmetic powders, and talcum powder; used as insulators in
electrical industry

6-15
Name____________________________________
Lab day ______Lab Time_____________________ POST-LAB ASSESSMENT 1. Describe the procedure you use for identifying a mineral and
arriving at its name. 2. Name the physical property that is described by each of the
following statements: a. Breaks along smooth planes:
__________________________________________ b. Scratches glass:
__________________________________________ c. A red-colored powder on unglazed porcelain:
__________________________________________ 3. Describe the shape and sketch a mineral that has three
directions of cleavage that intersect at 90°. 4. How many directions of cleavage do the feldspar minerals
(potassium feldspar and plagioclase) have? ________________________________
5. How would you tell the difference between a crystal face and a cleavage plane?
6. Which would tell you more about a mineral's identity: luster or
hardness? Why?

7-1
ES 104: Laboratory # 7 IGNEOUS ROCKS
Introduction
Igneous rocks form from the cooling and crystallization of molten
rock material. This can occur below the surface of Earth forming intrusive rocks (also called plutonic rocks) or on or above the surface as extrusive rocks (also called volcanic rocks). As a generalization, extrusive igneous rocks cool rapidly when compared with intrusive igneous rocks.
The rate of cooling has a profound influence the size of the crystal grains formed in the igneous rock, so the textures of igneous rocks tell us much about the rate of cooling of the rock and thus whether their origin is plutonic or volcanic. If cooling is slow, atoms have plenty of time to migrate to the growing nuclei of growing crystals, thereby enlarging these mineral grains. So, a longer cooling time results in larger crystal grains. Intrusive igneous rocks have coarse-grained textures, including pegmatitic (crystals larger than 10 mm). Because of their rapid cooling, extrusive igneous rocks generally have fine-grained textures, including porphyritic, glassy, and frothy.
In addition to texture, the mineral composition also determines the appropriate classification of an igneous rock. Determining composition of an igneous rock is not always easy, particularly because as the texture gets finer, the individual mineral grains become too small to be seen easily. In these cases, the color of a rock becomes helpful. As a general rule, dark rocks are typically mafic and light colored rocks are typically felsic. NOTE: be aware that there are a few important exceptions to this general rule.
Be sure to define the terms in italics in your notes. Objectives • Learn to recognize the major types of igneous rocks • Understand the significance of texture and composition in the
formation of igneous rocks Useful Websites • http://csmres.jmu.edu/geollab/Fichter/IgnRx/Ighome.html • http://seis.natsci.csulb.edu/basicgeo/IGNEOUS_TOUR.html • http://geology.csupomona.edu/alert/igneous/ignrxs.htm
7-2
Name____________________________________
Lab day ______Lab Time_____________________
Pre-lab Questions – Complete these questions before coming to lab.
1. What are the three main classes of rocks and how does each of
them form?
2. Draw and label a diagram of the rock cycle on the back of this
sheet. Be sure to show the three classes of rocks and how the relate with one another.
3. What is the difference between an extrusive and intrusive igneous
rock? 4. Define the following igneous rock terms:
a. Coarse grained
b. Fine grained
c. Porphyritic
d. Felsic
e. Mafic
f. Magma
g. Lava

7-3
Part A – Identification of Igneous Rocks Classification of igneous rocks is based on texture (grain size) and chemical composition (often related to color). Identify the rocks in the study set using the rock identification chart. Begin by describing the texture and color of the rock. You should be able to identify minerals present in the coarse-grained and porphyritic rocks. To identify visible mineral grains, use the same mineral identification procedures that you used in Lab 6. Fill in the identification table (Table 2) with your observations, then use the classification chart (Table 1) to assign correct names to the lab specimens. Do not copy information from table 1 on table 2 that you cannot see in the rocks.
Table 1: Igneous Rock Classification Table. See footnotes below for abbreviations
Chemical Composition
to right→
Felsic (light colored
except obsidian) Intermediate Mafic
(dark colored)
Ultramafic (green)
(light-colored exception)
Mineral content to right→ Texture
shown below
10-20%QUARTZ K-SPAR>PLAG <15% FERRO-MAGS†
NO QUARTZ PLAG> K-SPAR >20% FERROMAGS
NO QUARTZ NO K-SPAR SOME PLAG +>40% FERRO-MAGS
NO QUARTZ NO K-SPAR NO PLAG 100% FERROMAGS
Very coarse grained most grains > 10 mm in diameter
PEGMATITE DIORITE GABBRO PERIDOTITE
Medium and coarse grained (average grain size 1 – 10 mm in diameter)
GRANITE DIORITE GABBRO PERIDOTITE
Fine grained (average grain size < 1 mm in diameter)
RHYOLITE ANDESITE BASALT --
Porphyritic (large grains imbedded in fine grained matrix)
PORPHYRITIC RHYOLITE
PORHYRITIC ANDESITE
PORPHYRITIC BASALT
--
Glassy OBSIDIAN -- --
Frothy, foamy‡ PUMICE SCORIA †FERROMAGS = Ferromagnesian silicate minerals (biotite, hornblende, augite, olivine)
PLAG = Plagioclase Feldspar; K-SPAR = Potassium Feldspar ‡FROTHY or FOAMY rocks are mostly made of void space. They will have very low
densities and there will be no visible mineral crystals.

7-4
Table 2: Igneous Rock Description Table.
SAMPLE NUMBER
TEXTURE Chemical
Composition
Minerals
List name and % if
you can see them ROCK NAME
1
2
3
4
5
6
7
8
9
10
Only include information on this table that you can see in the rock specimens. Be sure your chemical composition is from Table 1, don’t just state color. Identify minerals by name and percent for the medium-grained, coarse-grained and porphyritic rocks.
7-5
Part B – Igneous Rocks Supplemental Questions Sample A: Observe the textural characteristics in an igneous rock with larger crystals in a fine-grained matrix. Examine Sample A and answer the following questions. 1. What is the term used to describe this texture? 2. Describe and identify the mineral that forms the larger crystals. 3. Identify the rock (use correct name from Table 1 on page 7-3). 4. Interpret the cooling history of this rock. Support your
interpretation with observations of the textural features in the sample. See your textbook for additional information.
Sample B: Observe the textural characteristics in a fine-grained igneous rock. Examine Sample B and answer the following questions. 1. Can you identify any of the minerals present in this sample? 2. What problem do you encounter when trying to identify
minerals in a fine-grained rock? 3. Identify the rock (use correct name from Table 1 on page 7-3). 4. Compare this Sample B with Sample A. List two features that
would help you distinguish these two rocks.

7-6
Sample C: Observe the textural characteristics in a coarse-grained igneous rock. Examine Sample C and answer the following questions. 1. Identify (name) the different mineral grains present in this rock.
Make a list of the minerals present, and give a brief description of each one (color, shape, cleavage, relative size).
2. Identify the rock (use correct name from Table 1 on page 7-3). 3. Describe the shape and relative size of the quartz grains. Can you
see crystal faces? Is it larger or smaller than the other minerals? 4. Describe the shape and size of the pink mineral grains. It may
be difficult to determine the extent of a single pink mineral grain. Since cleavage is consistent throughout a single mineral grain, you can use the extent of a flat, shiny cleavage surface to determine the boundaries and shape of the mineral grains.
5. Based on your observations, do you think the quartz crystallized
before or after the pink mineral? Explain. Where do the dark minerals fit into the crystallization sequence?
6. Using Bowen's Reaction Series, predict the first two minerals to be
consumed upon melting of this (Sample C) rock.

7-7
Name_____________________________________
Lab day ______Lab Time_____________________ POST-LAB ASSESSMENT 1. Describe the procedure you would follow to determine the name
of a specific igneous rock. 2. What factor determines the size of the crystals in igneous
rocks? 3. What general principles can be used to determine the order in
which mineral crystals form in a cooling magma? Consider the crystallization histories of rocks A and C (in part B) of this lab, and include some of your observations of these rocks in your answer.

8-1
ES 104: Laboratory # 8 VOLCANISM AND VOLCANIC LANDFORMS
Introduction
Volcanoes are classified into several major types depending on the size and shape of the landform. A shield volcano forms a gently sloping dome built of numerous highly fluid lava flows of basaltic composition. A composite volcano or stratovolcano forms a conical shaped mountain with steep sides composed of interbedded layers of viscous lava and pyroclastic material. The lavas in a composite volcano consist of andesite, dacite, and rhyolite. Pyroclastic refers to volcanic ash or any other airborne particles ejected from a volcano. Cinder cones are generally steep sided, conical shaped hills primarily composed of pyroclastic material with minor lava flows. The Cascade Range of the western United States contains all three volcanic forms.
During this lab, you will compare two very different volcanic areas – Hawaii and Mount St. Helens. You will make observations, accumulate a database, organize it into tabular form, and make direct comparisons. Objectives • Compare the morphology of two different types of volcanoes. • Determine the tectonic setting of two specific volcanoes. • Examine volcanic rock types in context of their volcano type. Useful Websites • http://hvo.wr.usgs.gov/ • http://www.soest.hawaii.edu/GG/HCV/kilauea.html • http://www.nps.gov/havo/ • http://vulcan.wr.usgs.gov/Volcanoes/Hawaii/framework.html • http://www.fs.fed.us/gpnf/mshnvm/ • http://vulcan.wr.usgs.gov/Volcanoes/MSH/ • http://pubs.usgs.gov/gip/msh//
8-2
Name_____________________________________
Lab day ______Lab Time_____________________
Pre-lab Questions – Complete these questions before coming to lab.
1. What are the differences between cinder cone volcanoes, shield
volcanoes, and stratovolcanoes? (see lab intro for information) 2. What type of volcano is Mt. Hood? How do you know? What
distinguishes it? 3. What is the difference between a pyroclastic volcanic deposit and a
lava flow? 4. What is the difference between volcanic ash and lapilli? 5. Define viscosity and explain how it relates to composition of lava
flows? 6. Do all volcanoes erupt in the same way and have the same shape?
Why or why not?
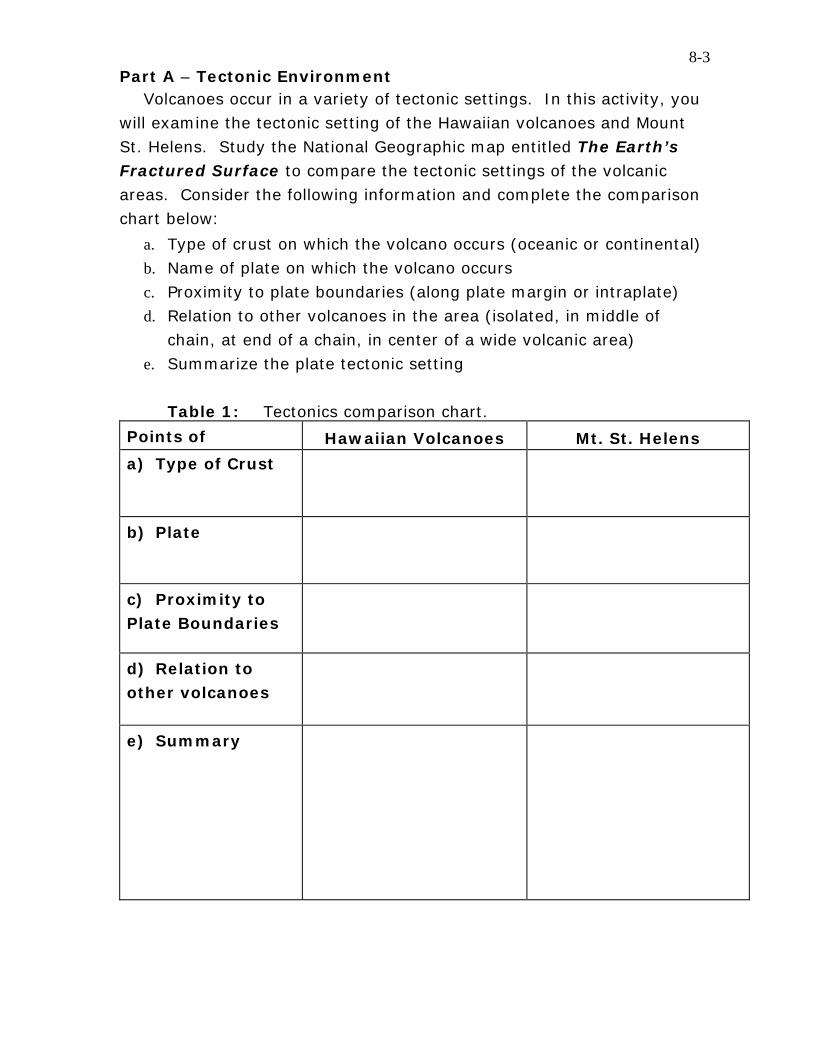
8-3
Part A – Tectonic Environment Volcanoes occur in a variety of tectonic settings. In this activity, you
will examine the tectonic setting of the Hawaiian volcanoes and Mount St. Helens. Study the National Geographic map entitled The Earth’s Fractured Surface to compare the tectonic settings of the volcanic areas. Consider the following information and complete the comparison chart below:
a. Type of crust on which the volcano occurs (oceanic or continental) b. Name of plate on which the volcano occurs c. Proximity to plate boundaries (along plate margin or intraplate) d. Relation to other volcanoes in the area (isolated, in middle of
chain, at end of a chain, in center of a wide volcanic area) e. Summarize the plate tectonic setting
Table 1: Tectonics comparison chart.
Points of Hawaiian Volcanoes Mt. St. Helens
a) Type of Crust
b) Plate
c) Proximity to Plate Boundaries
d) Relation to other volcanoes
e) Summary

8-4
Part B – Topography Volcanoes are classified based on their topographic expression. This activity focuses on the topography on Mauna Loa, on the island of Hawaii, and Mount St. Helens. Figure 2 shows topographic maps of each volcano drawn at the same scale. Construct topographic profiles of both volcanoes on Figure 1. (A-A' of Mount St. Helens, and B-B' of Mauna Loa). Place the peaks of the volcanoes near the center of the horizontal axis.
Figure 1: Grid for constructing topographic profiles.

8-5
(A) (B)
Figure 2: Topographic maps. (A) Mount St. Helens, Washington. (B) Mauna Loa, Hawaii.
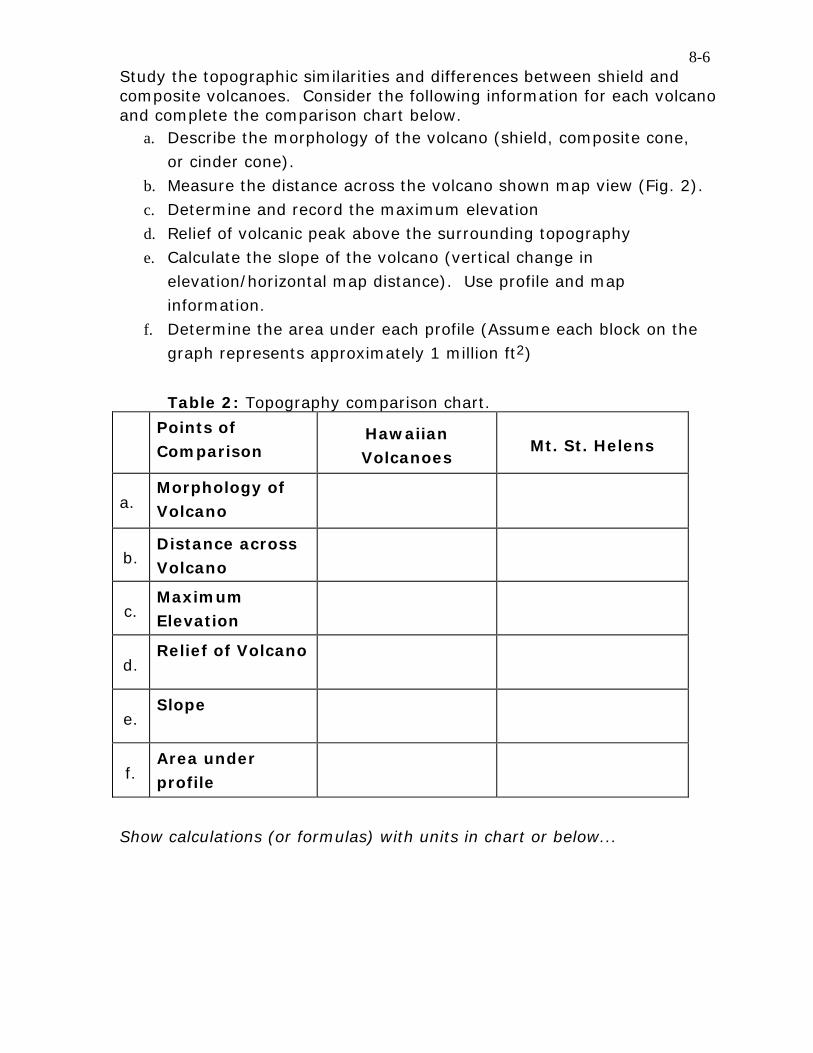
8-6
Study the topographic similarities and differences between shield and composite volcanoes. Consider the following information for each volcano and complete the comparison chart below.
a. Describe the morphology of the volcano (shield, composite cone, or cinder cone).
b. Measure the distance across the volcano shown map view (Fig. 2). c. Determine and record the maximum elevation d. Relief of volcanic peak above the surrounding topography e. Calculate the slope of the volcano (vertical change in
elevation/horizontal map distance). Use profile and map information.
f. Determine the area under each profile (Assume each block on the graph represents approximately 1 million ft2)
Table 2: Topography comparison chart.
Points of Comparison
Hawaiian Volcanoes
Mt. St. Helens
a. Morphology of Volcano
b. Distance across Volcano
c. Maximum Elevation
d. Relief of Volcano
e. Slope
f. Area under profile
Show calculations (or formulas) with units in chart or below...

8-7
Part C –Rock Types and Deposits
The different types of volcanoes produce different rock types and deposits. By studying the rock types and volcanic deposits, one can determine information about the volcano that produced them. Study examples of various samples from each type of volcano. Describe the samples in terms of texture and composition, provide the correct rock name, and interpret the origin of the samples.
Table 3: Sample comparison chart.
Sam
ple
Texture Composition Rock Name Origin
(volcano type)
#5
#6
#7
#9
Study the geologic maps of Kilauea and Mount St. Helens on the next page (8-8). Compare the following attributes of the volcanic deposits of Kilauea and Mount St. Helens and complete the comparison table (Table 4) on page 8-8.
a. Observed composition or compositional range for each volcano. b. Type and range of deposits produced. c. Apparent lava viscosity. d. Relative volume of deposits produced. e. Surface area affected by primary volcanic deposits. f. Inferred plumbing system (single conduit, fissures, or both)

8-8
Geologic map of Kilauea: Brown areas are lava flows formed since 1900. Black areas are pyroclastic deposits.
Geologic map of Mt. St Helens Deposits formed from 1980 eruption.
Figure 3: Simplified geologic maps showing volcanic deposits formed around Kilauea and Mount St. Helens since 1900.
Table 4: Volcanic rock types and deposits comparison chart.
Points of Hawaiian Volcanoes Mt. St. Helens
Observed Compositions
Type and Range of Deposits
Apparent Lava Viscosity
Relative volume of deposits
Surface area affected
Plumbing system

8-9
Name_____________________________________
Lab day ______Lab Time_____________________ POST LAB ASSESSMENT 1. Using differences in lava viscosity, explain why the diameter of
Mauna Loa is much larger than the diameter of Mount Saint Helens. 2. Explain the relationships of lava viscosity, lava composition, and
volcano morphology relative to one another. 3. Suppose 200 million years in the future, that the solidified magma
chambers beneath Mauna Loa and Mount Saint Helens became exposed at the surface by erosion. What rock(s) would most likely make up the Mauna Loa magma chamber? What rocks would the Mount Saint Helens magma chamber contain?

9-1
ES106 Lab Exercise # 9 Introduction to Scientific Inquiry and Data Analysis
Introduction Name: ____________ Lab day/time ______ Earth Science employs the scientific method via qualitative and quantitative observation, the collection of data, hypothesis formulation / testing, and hypothesis modification. This lab exercise provides a basic introduction to quantitative observation and analysis. Part 1 - Unit Conversion Using the attached metric and English measurement unit conversion tables, write in the conversions for the following units. 1 in = ________ cm 1 m = ________ ft 1 mi = ________ km Using these and other conversions, change the following values to the new units shown. SHOW ALL OF YOUR MATH WORK WITH UNITS IN THE SPACE PROVIDED, or you will not receive full credit for this assignment. 2.05 m = ________ cm 1.50 m = ________ mm 5.4 g = ________ mg 6.8 m = ________ km 4214.6 cm = ________ m 321.5 g = ________ kg 123.4 mi = ________ km 1234 km = ________ mi 126,765,000 ft = ________ km 1054 lb = ________ kg
2 x 10⁵ in = ________ mi 2 x 109 ft = ________ mi 72o C = ________ o F 8o F = ________ o C 0oC = ________ oF 212oF = ________ oC 5.7 x 1045 sec = ________ years 9.8 x 10²⁰ days = ________ years 2.0 x 1031 in = ________ km If 1 inch equals 2000 ft on a map; points A and B are 7.8 inches apart on the map. How far apart are points A and B on the ground in feet? in miles?

9-2
Part 2. Solving Equations For Part 2, you must SHOW THE FORMULA AND ALL OF YOUR MATH WORK WITH UNITS! The density of a substance is defined by it's mass divided by it's volume. The equation has the following form:
D = M / V where D is density in gm/cm3, M = mass in grams, and V is volume in cm3
1. You measure the mass of a substance as 2356 gm. Its volume is 534 cm3, calculate it's density in gm/cm3.
2. The density of a substance is 9.8 gm/cm3. If you had a volume of 3.8 cm3 of the substance, what would be the corresponding mass in grams? Hint: Use the units to properly set up the equation.
3. The density of a substance is 2.5 gm/cm3 and you possess 15.3 grams of that material. What will be its corresponding volume in cm3. Hint: Rearrange the density equation by solving for mass. Then calculate the volume.
The velocity of moving objects (for example your car while driving) is measure as a rate of motion, according to the following equation:
V = d / t where V is velocity (m/sec), d is distance (m), and t is time (sec).
4. You drive your car between two cities that are 123 miles apart. It takes you 4 hours to get there. Calculate your average velocity in mi/hr.
5. Using the velocity you calculated in 4 above, what was your velocity in m/sec? Hint: you will have to use a distance and a time conversion factor.
6. You are driving a car at a velocity of 10 m/sec for a distance of 12 km. How long did it take you to get there? Answer in hours.

9-3
Part 3. Introduction to Hypothesis Testing, Data Collection, and Analysis The scientific method involves observation, hypothesis formulation, data collection/analysis, and hypothesis testing. Let's use your lab class to introduce the basic concepts.
A. Observation - Make a qualitative (non-numeric) observation by examining all the individuals in your lab class and pay attention to their relative height and shoe size. Based on your observations, write a hypothesis that relates a person's height to their shoe size (i.e. how do you think they relate to one another, if at all?).
B. Data Collection - Now let's collect some data to test your hypothesis from "A" above. Using the meter sticks and other tools available in the lab, measure the height of 15 class mates (to the nearest hundreth of a meter) and their shoe length (to the nearest whole millimeter). Randomly select your subjects from the group. Fill in the data table below.
Person ID Height (nearest hundredth of meter) Shoe Length (nearest millimeter) 1 ____________ m _________________ mm 2 ____________ m _________________ mm 3 ____________ m _________________ mm 4 ____________ m _________________ mm 5 ____________ m _________________ mm 6 ____________ m _________________ mm 7 ____________ m _________________ mm 8 ____________ m _________________ mm 9 ____________ m _________________ mm 10 ____________ m _________________ mm 11 ____________ m _________________ mm 12 ____________ m _________________ mm 13 ____________ m _________________ mm 14 ____________ m _________________ mm 15 ____________ m _________________ mm

9-4
Graphical Analysis - Plot a "scatter graph" of the data collected with Shoe Length (mm) on the X-axis, and Height (m) on the Y-axis. A blank piece of graph paper is provided on the following page. Once you plot the points, do the following, and answer the questions at the end.
(i) Describe the overall shape or trend of the data points on the graph (for e.g. straight line pattern, curved line pattern, "shot gun" scatter pattern, etc.).
(ii) If there is a linear trend to the data, draw a "best-fit" line on the graph that appears to average the pattern of the data points.

9-5
Analytical Questions / Summary The general equation of a line has the form: Y = mX + B Where Y is the predicted value on the Y axis, X is the observed value on the X axis, B is the Y-intercept or the Y value at the point where the line intersects the Y axis. and m is the slope of the line.
Determining Slopes of Lines
Slope of any line on a graph = rise / run = (Y2 - Y1) / (X2 - X1) See below on left. Specifically, lines that are oriented like those shown on right have those types of slopes.
Positive Slope
Negative Slope
Zero Slope
Undefined Slope
1. Use your data plotted on the height-shoe size graph, determine the equation of the line that best fits the data. In the case of your equation, the Y value is Height, and the X value is Shoe Length. Your line equation will have the form: Height = m(Shoe Length) + B where Height = predicted height of individual,
Shoe Length = measured shoe length, m = slope of line on the graph, page 9-4 B = y intercept (where line crosses vertical axis) of line on the graph, page 9-4.

9-6
Step 1: Determine B--the Height value where your best fit line intersects the Y axis Step 2: Calculate m--the slope of the line using the rise/run formula on pg. 9-5 Step 3: Plug your B and m values from your graph on page 9-4 into the blanks of the equation below:
Height = ___ (Shoe Length) + ____
There! You have determined the equation of the linear relationship between height and shoe size for your class mates!
2. Ask several class mates whom you did not include in your graph their height and shoe size. Plug this data into your equation above and calculate their predicted height. See if their height is predicted accurately. How well does your equation predict the shoe size of your unknown participants? 3. Using your graph's ability to predict height and shoe size, comment on the viability of your original hypothesis (Page 9-4: part 3A observation). Does the data support it or reject it? Explain your answer. 4. What would you do to further test the validity of your hypothesis? What would happen if you collected height and shoe data from Brazilian class mates? Would the Brazilian data likely fall in the same data set or not? Discuss the strengths and limitations of your analytical ability to predict height and shoe size.

10-1
ES 104 Laboratory # 10 LENSES AND TELESCOPES
Lens and Image Characteristics
In this activity you are provided with two different lenses and you supply your powers of observation.
WARNING: HANDLE LENSES ONLY BY THEIR EDGES. PLACE LENSES
ONLY ON A SHEET OF PAPER TO PREVENT SCRATCHING. IMPROPER
HANDLING OF THE LENSES MAY RESULT IN DEDUCTION OF POINTS ON
YOUR LAB!
The curvature of the lens greatly affects the magnifying ability. Investigate the large curvature (the thin one) and small curvature lens (the thick one). (Here we refer to the curvature as how much the thickness changes
between the center and the edge of the lens. This is different from the radius of
curvature often quoted for lenses.) Focus a scene through the windows on the opposite wall. To do this hold a lens against the far wall facing the windows, then move the lens slowly away from the wall until you see an image form on the wall. This is illustrated in Figure 2. Note the distance from the image to the lens and the image's magnification in particular.
Figure 2: Lens-room configuration Describe the image that you see. In your description, use terms like somewhat magnified or greatly magnified, upright or upside-down.

10-2
The field of view is how much of a scene that can be imaged. If you can see more of a scene, the field of view is larger. Look at a piece of graph paper on the table through the small and large lens. Hold both lenses the same distance away; maybe 4 cm? Compare the field of views of the two lenses. Measure the focal length of the provided lenses. When an object is placed sufficiently far enough away to call it 'infinitely far away', the image will form at the location of the focal length of the lens. Choose an object very far away (>10 meters) such as objects outside the windows or a light bulb on the other side of the room. Hold the lens flat against the wall opposite your object (the wall needs to be light in color). Move the lens slowly away from the wall until an image of the object forms on the wall. Carefully measure the distance (in meters) from the lens to the wall. This is the focal length. Report the focal length in your report. Don't forget to measure both lenses. The focal length of the large curvature (the thin one) is ____ meters. The focal length of the small curvature (the thick one) is ___ meters. The diameter of the large curvature (the thin one) is _____ meters. The diameter of the small curvature (the thick one) is _____ meters. The f-number of a lens is (focal length in meters)/(diameter of lens in meters). A lens with an f-number of seven is written: f/7. Determine the f-number for the long and short curvature lenses. Please don't confuse f-number with the focal length. The f-number of the large curvature (the thin one) is ____ (no units). The f-number of the small curvature (the thick one) is ___ (no units).

10-3
Questions: 1. Deduce and relate the relationship between the curvature of a lens,
the magnification of the image it creates, and its focal length. 2. 3. 4. Which has the better field of view, a large curvature or a small
curvature lens? 5. 6. 7. 8. 9. 10. 11. What affects the field of view? 12. What is the relationship between the f-number and the field of view? 13. Why do National Geographic photographers use those really wide
lenses? 14. Suppose we have a lens that is 0.02 meters in diameter. We then,
using black tape, cover up the edges of the lens so that light can pass through only the inner 0.01 meters (in diameter). What happens to the f-number? Does it increase or decrease?

10-4
Telescopes
WARNING: TELESCOPES ARE EXPENSIVE PRECISION INSTRUMENTS. DON'T BUMP OR JAR THEM. DON'T TOUCH ANY GLASS OR
REFLECTIVE METAL SURFACES! IMPROPER HANDLING OF TELESCOPES MAY RESULT IN DEDUCTION OF POINTS ON YOUR LAB!
Being the Earth-dwelling creatures that we are, we don't always have the luxury of popping up into orbit every time we want too look at the stars (see the 'Observing The Night Sky' lecture activity). Below are descriptions of smaller, Earth-based telescopes.
The refracting astronomical telescope is made of two converging lenses (see Figure 3). Incoming parallel rays from a distant star are focused to an intermediate image. The eyepiece lens is then used to prepare the light to be viewed by your eye. Your eye's lens focuses the light onto the retina forming an image that your brain can interpret. Notice that since the intermediate image is inverted, the 'sky' will appear 'backwards'. The magnification of a telescope is large if the intermediate image is large and if this image is viewed through an eyepiece (magnifying glass) of large magnification. The magnification of a refracting astronomical telescope is the ratio of the focal length of the objective to the focal length of the eyepiece.
Figure 3: Diagram of a refracting astronomical
telescope.
For terrestrial purposes, such as looking for whales or spying on your neighbor, the inverted image of the refracting astronomical telescope is rather inconvenient. To produce an erect image is simply to insert, between the objective and the eyepiece, an erecting system, which inverts the intermediate image. The erecting system can be a simple converging lens (Figure 4), however the
Figure 4: Diagram of a refracting terrestrial telescope.

10-5
telescope becomes rather long (of the type favored by pirates).An erecting system that allows a shorter telescope is the combination of prisms shown in Figure 5 Binoculars are specified by both their magnification and objective diameter. Thus, a 7 X 35 binocular has magnification 7 and objective diameter 35 mm.
Figure 5: A cut away view of binoculars.
An alternative approach avoids the erecting system by using a diverging eyepiece, as in the Galilean telescope (Figure 6). Its advantage is that the distance between the lenses is actually less than a terrestrial telescope. However, the field of view is limited, so this technique is used in small, inexpensive opera glasses (but it was good enough to enable Galileo to discover four of Jupiter's moons).
Figure 6: Diagram of a Galilean telescope.
The preceding telescopes all use objective lenses (so-called refracting telescopes). Large diameter lenses, however, create numerous problems. A technique that avoids all these difficulties is to use a concave, focusing mirror as the objective (the so called primary mirror). A smaller, secondary mirror is normally used to enable you to look through the telescope without getting your head in the way of the incoming beam. There are a variety of such reflecting telescopes, a few of which are pictured in Figure 7. In the very large reflecting telescopes, the astronomer (or a detector) can actually sit at the focal point of the primary mirror. Figure 7a shows a Newtonian telescope, Figure 7b shows a Cassigrain telescope, and Figure 7c shows the Gregorian telescope. Each has their advantages and disadvantages.
Figure 7: Diagrams of reflecting telescopes.

10-6
A technique to avoid the weight and cost of a single large mirror is to use a number of smaller mirrors in concert. The light collected by each of the separate mirrors is focused to a common image. The mirrors' sensitive alignment is accomplished by means of laser beams that accurately detect each mirror's position, computers that rapidly calculate any required position change, and motors that continually realign the mirrors. The Multiple Mirror Telescope on Mount Hopkins, Arizona, has six 1.8-meter mirrors that combined have the light gathering ability of about one 4.5-meter mirror.
PLEASE BE CAREFUL AROUND TELESCOPES! Don't bump them or pick them up. Don't touch any glass or reflective metal surfaces!
Activity: Build your own telescope using the lenses and mounts. Choose only one. Here are some tips. The Refracting Astronomical Telescope: Use one of the 5cm focal length lenses as the eyepiece, and the 20 cm focal length lens as the objective, separated by about 25 cm, with the eyepiece close to your eye. It may help to brace your hand against something, say the window frame. Notice the orientation and size of the image and the field of view and compare them to those obtained with the Galilean telescope. With a third hand you can try inserting the other 5 cm focal length lens about 5 cm in front of the eyepiece as a field lens. The Galilean Telescope: Here use the -5 cm focal length (diverging) lens as the eyepiece, and the 20 cm focal length lens as the objective. The spacing between the lenses should be about 20 cm - 5 cm = 15 cm. It may help to brace your hand against something, say the window frame. Notice the orientation and size of the image and the field of view. Reverse the positions of the two lenses and look through them. Notice the large (wide) field of view, useful for a peephole in a door. (Of course, unless you live in a castle, you probably don't have doors 15 cm thick. Actual peepholes use shorter focal length lenses.)
Questions: Use the space below or an additional page to record your work. 1. Examine the telescopes and categorize them as to their type. For
each, draw a sketch and identify the objective (mirror or lens), the eyepiece, and any other important internal mirrors or lenses.
2. In a short paragraph, discuss this activity. Describe the telescopes you looked at and describe the one you built.

11-1
APPENDIX –Unit Conversions Multiply units in left column by number in table to obtain units at top of table column Table 1: Length conversion to metric units
Unit mm cm m km 1 millimeter 1 centimeter 1 meter 1 kilometer 1 inch 1 foot 1 yard 1 mile
1 10
1000 106 25.4 304.8 914.4
1.61x10⁶
0.1 1
100 105 2.54 30.48 91.44
1.61x10⁵
0.001 0.01
1 1000
0.0254 0.3048 0.9144
1.61x10³
10-6
0.00001 0.001
1 2.54x10⁻⁵ 3.05x10⁻⁴ 9.14x10⁻⁴ 1.6093
Table 2: Length conversion to English units
Unit inch feet yard mile 1 millimeter 1 centimeter 1 meter 1 kilometer 1 inch 1 foot 1 yard 1 mile
0.03937 0.3937 39.37 39,370
1 12 36
63,360
0.00328 0.0328 3.281 3281
0.0833 1 3
5280
0.00109 0.0109 1.094 1093.6 0.0278 0.333
1 1760
6.21x10⁻⁷ 6.21x10⁻⁶ 6.21x10⁻⁴
0.621 1.58x10⁻⁵ 1.89x10⁻⁴
5.68x10⁻⁴
1 Table 3: Area conversion to metric area units
Unit cm2 m2 km2 ha 1 sq. centimeter 1 sq. meter 1 sq. kilometer 1 hectare 1 sq. inch 1 sq. foot 1 sq. yard 1 sq. mile 1 acre
1 104 1010 108
6.452 929 8361
2.59x10¹⁰ 4.04x10⁷
0.0001 1
106 104
6.45x10⁻⁴ 0.0929 0.8361
2.59x10⁶ 4047
10-10 10-6 1
0.01 6.45x10⁻¹⁰
9.29x10⁻⁸ 8.36x10⁻⁷
2.59 4.047x10⁻³
10-8 10-4 100 1
6.45x10⁻⁸
9.29x10⁻⁶ 8.36x10⁻⁵
259 0.4047
Temperature Conversions : 3259 00 +⎟
⎠⎞
⎜⎝⎛ ×= CF ( )32
95 00 −= FC
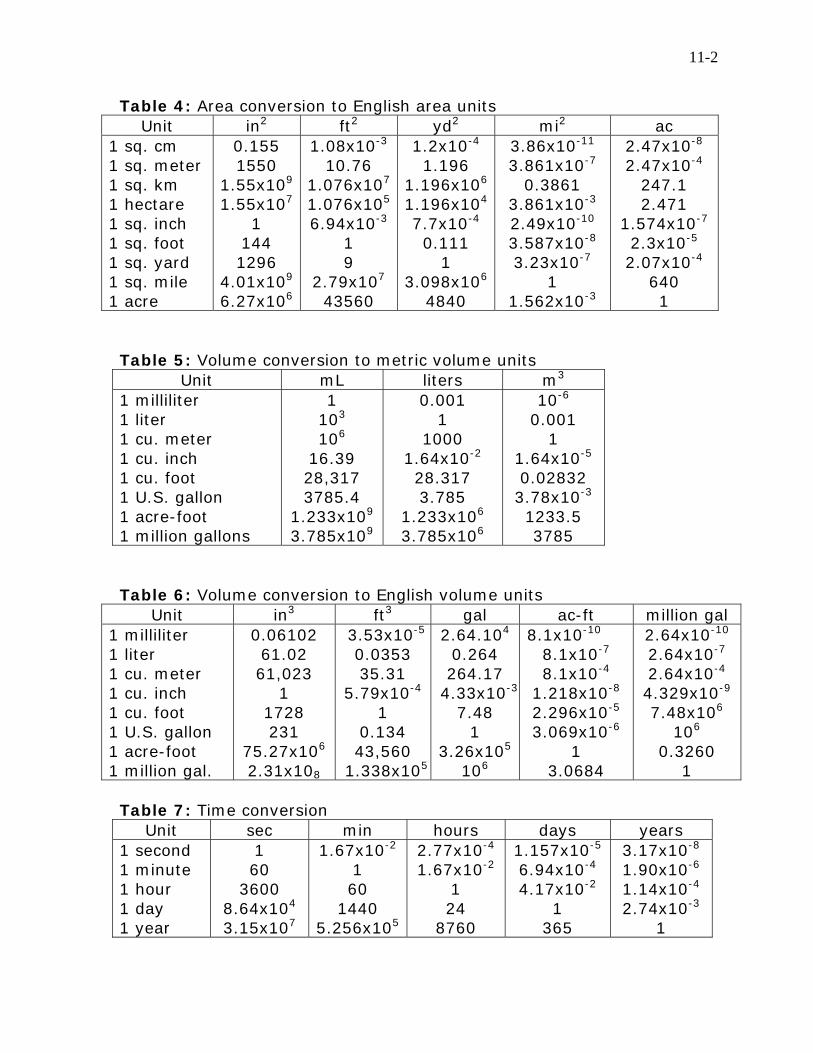
11-2
Table 4: Area conversion to English area units Unit in2 ft2 yd2 mi2 ac
1 sq. cm 1 sq. meter 1 sq. km 1 hectare 1 sq. inch 1 sq. foot 1 sq. yard 1 sq. mile 1 acre
0.155 1550
1.55x10⁹ 1.55x10⁷
1 144 1296
4.01x10⁹ 6.27x10⁶
1.08x10⁻³ 10.76
1.076x10⁷ 1.076x10⁵ 6.94x10⁻³
1 9
2.79x10⁷ 43560
1.2x10⁻⁴ 1.196
1.196x10⁶ 1.196x10⁴ 7.7x10⁻⁴ 0.111
1 3.098x10⁶
4840
3.86x10⁻¹¹ 3.861x10⁻⁷
0.3861 3.861x10⁻³ 2.49x10⁻¹⁰ 3.587x10⁻⁸ 3.23x10⁻⁷
1 1.562x10⁻³
2.47x10⁻⁸ 2.47x10⁻⁴
247.1 2.471
1.574x10⁻⁷ 2.3x10⁻⁵ 2.07x10⁻⁴
640 1
Table 5: Volume conversion to metric volume units
Unit mL liters m3 1 milliliter 1 liter 1 cu. meter 1 cu. inch 1 cu. foot 1 U.S. gallon 1 acre-foot 1 million gallons
1 103 106
16.39 28,317 3785.4
1.233x10⁹ 3.785x10⁹
0.001 1
1000 1.64x10⁻² 28.317 3.785
1.233x10⁶ 3.785x10⁶
10-6 0.001
1 1.64x10⁻⁵ 0.02832 3.78x10⁻³ 1233.5 3785
Table 6: Volume conversion to English volume units
Unit in3 ft3 gal ac-ft million gal 1 milliliter 1 liter 1 cu. meter 1 cu. inch 1 cu. foot 1 U.S. gallon 1 acre-foot 1 million gal.
0.06102 61.02 61,023
1 1728 231
75.27x10⁶ 2.31x10⁸
3.53x10⁻⁵ 0.0353 35.31
5.79x10⁻⁴ 1
0.134 43,560
1.338x10⁵
2.64.104 0.264 264.17
4.33x10⁻³
7.48 1
3.26x10⁵ 106
8.1x10⁻¹⁰ 8.1x10⁻⁷ 8.1x10⁻⁴
1.218x10⁻⁸ 2.296x10⁻⁵ 3.069x10⁻⁶
1 3.0684
2.64x10⁻¹⁰ 2.64x10⁻⁷ 2.64x10⁻⁴ 4.329x10⁻⁹ 7.48x10⁶
106 0.3260
1 Table 7: Time conversion
Unit sec min hours days years 1 second 1 minute 1 hour 1 day 1 year
1 60
3600 8.64x10⁴ 3.15x10⁷
1.67x10⁻² 1 60
1440 5.256x10⁵
2.77x10⁻⁴ 1.67x10⁻²
1 24
8760
1.157x10⁻⁵ 6.94x10⁻⁴ 4.17x10⁻²
1 365
3.17x10⁻⁸ 1.90x10⁻⁶ 1.14x10⁻⁴ 2.74x10⁻³
1