earnings release 2q09 - mz” | institutional...
TRANSCRIPT

Earnings Release
2Q09
2Q09 Earnings Release
July 22, 2009
Page 2 of 18
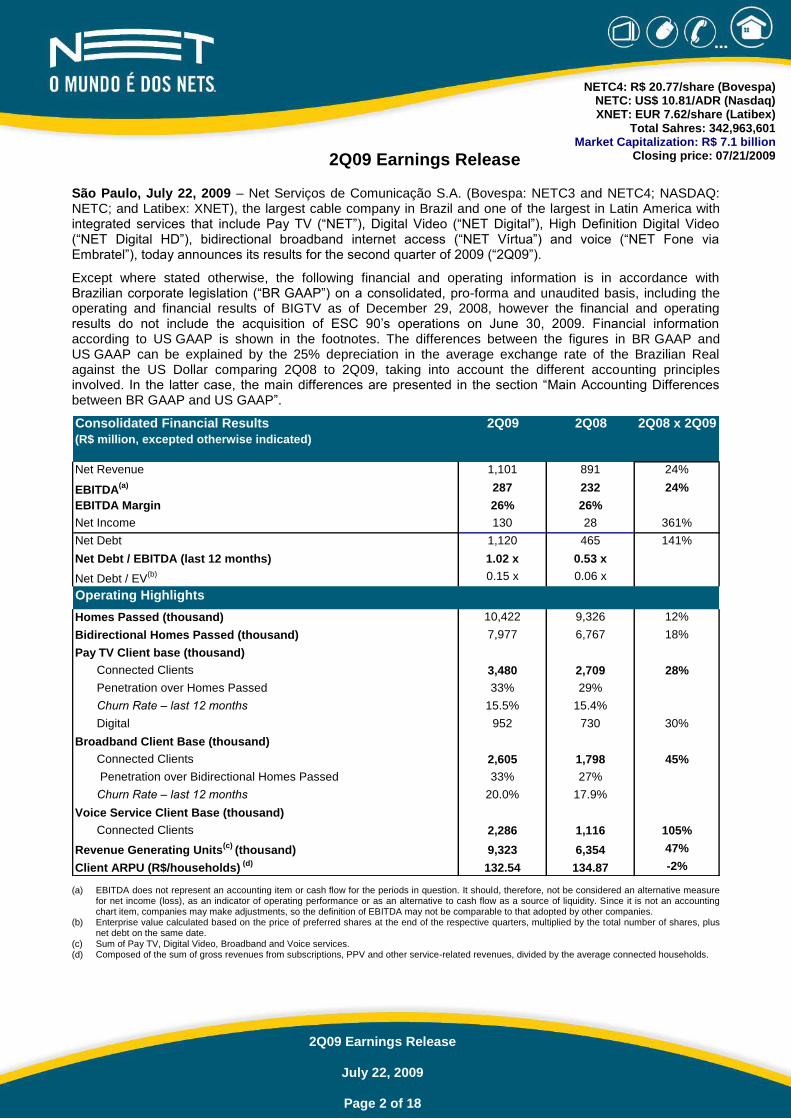
NETC4: R$ 20.77/share (Bovespa) NETC: US$ 10.81/ADR (Nasdaq) XNET: EUR 7.62/share (Latibex)
Total Sahres: 342,963,601 Market Capitalization: R$ 7.1 billion
Closing price: 07/21/2009
2Q09 Earnings Release
São Paulo, July 22, 2009 – Net Serviços de Comunicação S.A. (Bovespa: NETC3 and NETC4; NASDAQ: NETC; and Latibex: XNET), the largest cable company in Brazil and one of the largest in Latin America with integrated services that include Pay TV (“NET”), Digital Video (“NET Digital”), High Definition Digital Video (“NET Digital HD”), bidirectional broadband internet access (“NET Vírtua”) and voice (“NET Fone via Embratel”), today announces its results for the second quarter of 2009 (“2Q09”).
Except where stated otherwise, the following financial and operating information is in accordance with Brazilian corporate legislation (“BR GAAP”) on a consolidated, pro-forma and unaudited basis, including the operating and financial results of BIGTV as of December 29, 2008, however the financial and operating results do not include the acquisition of ESC 90’s operations on June 30, 2009. Financial information according to US GAAP is shown in the footnotes. The differences between the figures in BR GAAP and US GAAP can be explained by the 25% depreciation in the average exchange rate of the Brazilian Real against the US Dollar comparing 2Q08 to 2Q09, taking into account the different accounting principles involved. In the latter case, the main differences are presented in the section “Main Accounting Differences between BR GAAP and US GAAP”.
Consolidated Financial Results 2Q09 2Q08 2Q08 x 2Q09
(R$ million, excepted otherwise indicated)
Net Revenue 1,101 891 24%
EBITDA(a) 287 232 24%
EBITDA Margin 26% 26%
Net Income 130 28 361%
Net Debt 1,120 465 141%
Net Debt / EBITDA (last 12 months) 1.02 x 0.53 x
Net Debt / EV(b) 0.15 x 0.06 x
Operating Highlights
Homes Passed (thousand) 10,422 9,326 12%
Bidirectional Homes Passed (thousand) 7,977 6,767 18%
Pay TV Client base (thousand)
Connected Clients 3,480 2,709 28%
Penetration over Homes Passed 33% 29%
Churn Rate – last 12 months 15.5% 15.4%
Digital 952 730 30%
Broadband Client Base (thousand)
Connected Clients 2,605 1,798 45%
Penetration over Bidirectional Homes Passed 33% 27%
Churn Rate – last 12 months 20.0% 17.9%
Voice Service Client Base (thousand)
Connected Clients 2,286 1,116 105%
Revenue Generating Units(c)
(thousand) 9,323 6,354 47%
Client ARPU (R$/households) (d)
132.54 134.87 -2%
(a) EBITDA does not represent an accounting item or cash flow for the periods in question. It should, therefore, not be considered an alternative measure for net income (loss), as an indicator of operating performance or as an alternative to cash flow as a source of liquidity. Since it is not an accounting chart item, companies may make adjustments, so the definition of EBITDA may not be comparable to that adopted by other companies.
(b) Enterprise value calculated based on the price of preferred shares at the end of the respective quarters, multiplied by the total number of shares, plus net debt on the same date.
(c) Sum of Pay TV, Digital Video, Broadband and Voice services. (d) Composed of the sum of gross revenues from subscriptions, PPV and other service-related revenues, divided by the average connected households.

2Q09 Earnings Release
July 22, 2009
Page 3 of 18
EXECUTIVE SUMMARY
The results, consistent with the strategy of accelerated growth in the quarter, show that the Company has been able to overcome the challenges posed by the financial crisis, which has had little impact on the company’s performance. The low penetration of Net’s services in Brazilian households indicates the growth opportunity to be explored. And to sustain this growth, the company has invested, among other things, in network stability to improve the quality of the services provided. As a result of the continuous investments and network improvement, the service downtime rate, fell by an average of 32% in comparison with last year.
The Pay TV base closed the quarter with 3,480,000 clients, 28% up on the 2,709,000 in 2Q08. The Broadband base totaled 2,605,000 clients in 2Q09, 45% up on the 1,798,000 in 2Q08. The number of Fixed Line subscribers rose 105% over 2Q08, to 2,286,000 clients.
Net Revenue was R$ 1,101.1 million, a 24% increase over the R$ 891.1 million recorded in 2Q08. To a lesser extent, the consolidation of BIGTV also had a positive impact on revenue growth.
In 2Q09, Operating Costs stood at R$ 556.4 million, 33% higher than the R$ 418.9 million in 2Q08. As a percentage of net revenue, these costs climbed up from 47.0 % to 50.5%. The items that most contributed to the increase in costs were the increased bandwidth capacity contracted to serve broadband subscribers on account of the growth in the client base, growing usage of the bandwidth capacity by existing clients and increased subscriptions to higher-speed internet packages; the customer service center, which has been functioning according to more rigorous regulations since December 2008; and the programming costs due to the growth of the Pay TV base. In addition to these factors, there was an increase in Payroll and Benefits costs due to the increase in the number of employees and the collective bargaining agreement in July 2008.
Selling, General and Administrative Expenses totaled R$ 246.0 million in 2Q09, 6% up on the R$ 233.0 million in 2Q08, but falling as a percentage of net revenue, from 26.1% to 22.3%. Selling expenses increased by 28%, due to the growth in the number of sales staff and the higher commissions on sales on account of the increase in sales volume. As a percentage of net revenue, selling expenses rose from 10.3 % in 2Q08 to 10.7% in 2Q09. General and Administrative Expenses decreased by 4% in the quarter as the systems and support areas could support the company’s growth in a productive and efficient manner. As a percentage of net income, G&A expenses decreased from 14.5% to 11.2%.
EBITDA before Selling Expenses came to R$ 404.4 million in 2Q09, 25% higher than the R$ 323.3 million recorded in 2Q08. EBITDA Margin before Selling Expenses came to 37% in 2Q09, slightly higher than the 36% in 2Q08. EBITDA totaled R$ 286.8 million, 24% up on the R$ 231.8 million in 2Q08.
In 2Q09, Capex totaled R$ 250.5 million, 28% up year-on-year, mainly due to the acquisition of more node breaking equipment and the Real’s depreciation over the last twelve months, which increased the cost of imported equipment. Of the total investments, the variable portion corresponded to R$ 187.3 million, or 75%, and was mainly spent on acquiring equipment as well as on residential installations and node breakings. Maintenance and discretionary project Capex, which represented 25% of total investments, was mainly spent on improving the general infrastructure.
ESC 90
After obtaining authorization from ANATEL, the Brazilian telecommunications regulatory authority, on June 30, the Company acquired 100% interest in the companies operating in the Pay TV and Broadband Internet access segments.
ESC 90 operates in two cities in the state of Espírito Santo: Vitória and Vila Velha.
On June 30, 2009, ESC 90 had a Pay TV subscriber base of 30,000 and a broadband subscriber base of 25,000.
ESC 90’s cash and equivalents totaled R$ 0.8 million on June 30, 2009 and it did not have any financial debt on that date.

2Q09 Earnings Release
July 22, 2009
Page 4 of 18
OPERATING PERFORMANCE
The Company closed the quarter with 9,323,000 Revenue Generating Units (“RGUs”), a 47% increase year-on-year. This results from the growth of the client base of all the services offered by the company, especially telephone services. RGUs comprise the sum of pay TV, broadband, voice and digital video services.
Pay TV net additions totaled 133,000 new clients in the quarter. The subscriber base closed the quarter with 3,480,000 clients, a 28% increase over the 2,709,000 in 2Q08, thanks to the 24% organic growth and the 112,000 clients from the consolidation of BIGTV. The Digital Video base reached 952,000 clients, 30% up on 2Q08, representing a 27% penetration over the total pay TV base. The churn rate in the last 12 months was 15.5%, practically stable in comparison with the 15.4% in 2Q08.
In order to make the HD services popular, the Company launched NET Digital HD in June, complementing the high definition offering, which includes NET Digital HD Max, the first of its kind in Brazil. NET Digital HD includes a new decoder, which has an internal cable modem which, in addition to digital audio and a high definition image, allows advanced interactive applications and the possibility of additional services in the future.
Broadband net additions totaled 153,000 in 2Q09. The subscriber base totaled 2,605,000, a 45% increase over the 1,798,000 subscribers in 2Q08, thanks to the 41% organic growth and the 68,000 BIGTV subscribers. Accordingly, bidirectional household penetration reached 33% and, pay TV penetration, 75%. Last-12-month churn rate rose from 17.9% in 2Q08 to 20.0% in 2Q09.
Fixed Telephony net additions totaled 228,000 in the quarter. The number of Lines in Service closed the quarter at 2,286,000, a 105% year-on-year increase.
In the quarter, ARPU reached R$132.54, a 1.7% decrease, versus R$134.87 in the 2Q08, due to the growth in the NET Fone.com subscriber base and the dilutive effect of the BIGTV ARPU, which was R$ 95.98 in 2Q09. Excluding the effect of BIGTV, ARPU would have come to R$ 133.92, a slight year-on-year decrease of 0.7%. BIGTV’s reduced ARPU represents an opportunity for “NET” brand to be launched where BIGTV operated previously, adding new products to the current portfolio.
ANALYSIS OF CONSOLIDATED FINANCIAL RESULTS
1 Gross Revenue1
was R$ 1,463.4 million in the quarter, 26% up on the R$ 1,164.1 million in 2Q08, chiefly due to higher subscription revenue as a result of the increase in home connections and the sale of more products per client. BIGTV’s gross revenue in 2Q09 totaled R$37.8 million.
1.1 Subscription Revenue2 was 25% higher in the quarter, increasing from R$ 1,032.4 million in 2Q08 to
R$ 1,286.6 million in 2Q09, driven by the growth of the RGUs, the annual price increase on clients’ agreements based on the IGP-M inflation index and the consolidation of BIGTV. BIGTV’s subscription revenue totaled R$ 35.9 million in 2Q09. As a percentage of gross revenue, subscription revenue was 87.9% in 2Q09.
1.2 Hook-up Revenue3 rose 31%, from R$ 16.8 million in 2Q08 to R$ 22.0 million in 2Q09. This
increase was mainly due to the increase in subscriber additions and by the growth in subscription to products such as NET Digital HD Max, NET Seleção de Filmes and NET Fone.com.
1.3 Pay-per-view Revenue, “PPV”4, grew 28% on comparative basis, from R$ 16.1 million in 2Q08 to
R$ 20.6 million in 2Q09, The booking of PPV suppliers’ costs was changed in June 2008 and most are now on shared-revenue basis, net of costs. Said growth was mainly due to the 26% increase in the Sócio Premiere client base, the flagship PPV product.
1 In US GAAP, Gross Revenue increased by 0.5%, from de US$ 703.7 million in 2Q08 to US$ 706.9 million in 2Q09.
2 In US GAAP, Subscription Revenue fell by 0.3%, from US$ 624.0 million in 2Q08 to US$ 622.1 million in 2Q09.
3 In US GAAP, Hook-up Revenue fell by 1%, from de US$ 10.7 million in 2Q08 to US$ 10.6 million in 2Q09.
4 In US GAAP, PPV Revenue fell by 20%, from US$ 12.5 million in 2Q08 to US$ 10.0 million in 2Q09.

2Q09 Earnings Release
July 22, 2009
Page 5 of 18
1.4 Other Revenues5 rose from R$ 94.1 million in 2Q08 to R$ 134.2 million in 2Q09, representing a 43%
increase, mainly due to the growth in revenue from voice services, Embratel PME and Vivax Telecom.
2 Sales deductions6, including revenue taxes, stood at R$ 362.3 million in the quarter, 33% more than the
R$ 272.9 million in 2Q08, due to the growth in revenues in general. As a percentage of gross revenue, Sales Deductions rose from 23.4% in 2Q08 to 24.8% in 2Q09, due to the increase in broadband revenue, which has higher ICMS tax rates.
3 As a result of the above factors, Net Revenue7 ended the quarter at R$ 1,101.1 million, 24% higher than
the R$ 891.1 million in 2Q08.
4 Operating Costs8 totaled R$ 556.4 million in the quarter, 33% higher than the R$ 418.9 million in 2Q08.
As a percentage of net revenue, they moved up from 47.0% in 2Q08 to 50.5% in 2Q09. The main variations are due to the items below:
4.1 Programming and Royalties9 costs climbed 22% from R$ 205.9 million in 2Q08 to
R$ 251.5 million in 2Q09, chiefly due to the subscriber base growth and the annual contractual adjustment of prices by certain channels based on the IGP-M index. As a percentage of net revenue, Programming and Royalties costs declined from 23.1% in 2Q08 to 22.8% in 2Q09 due to the greater diversification of revenue sources. It is worth mentioning that the contracts with channels, including international providers, are denominated in Brazilian Reais.
4.2 Network Maintenance and Subscriber Costs10
in 2Q09 were R$ 48.0 million, versus R$ 38.5 million in 2Q08, a 25% increase, driven by the increased spending on posts rentals, both due to the increased number of posts rented and the contractual rent adjustment, increased network power consumption and the higher number of bidirectional homes, pushing up network maintenance spending. As a percentage of net revenue, these costs increased from 4.3% in 2Q08 to 4.4% in 2Q09.
4.3 Loyalty Marketing11
costs increased by 5%, from R$ 3.9 million in 2Q08 to R$ 4.1 million in 2Q09, due to the increase in printed program schedules caused by the growth in the subscriber base. As a percentage of net income, loyalty marketing costs remained stable at 0.4% year-on-year.
4.4 Payroll and Benefits12
increased 38%, from R$ 56.2 million in 2Q08 to R$ 77.3 million in 2Q09, mainly due to the 38% increase in number of employees and the collective bargaining agreement in July 2008. As a percentage of net revenue, these expenses moved up from 6.3% in 2Q08 to 7.0% in 2Q09.
4.5 Internet Access, Call Center and Other Costs13
were R$ 175.5 million, a 54% increase over the R$ 114.3 million in 2Q08, mainly due to the higher spending on bandwidth consumption resulting from the growth in the broadband client base and increased subscriptions to higher-speed packages. The increase in call center expenses as a result of the new regulations and the growth of the NET Combo subscriber base, which involves more complex customer service, also drove up costs. As a percentage of net revenue, these expenses rose from 12.8% in 2Q08 to 15.9% in 2Q09.
5 Selling, General and Administrative Expenses14
(SG&A) totaled R$ 246.0 million in the quarter, a 6%
increase over the R$ 233.0 million in 2Q08, the reasons being the following:
5.1 Selling Expenses15
were R$ 117.5 million in the quarter, a 28% increase over the R$ 91.5 million in 2Q08, due to the increase in the number of sales staff and in sales commissions on account of higher
5 In US GAAP, Other Revenues increased by 14%, from US$ 56.5 million in 2Q08 to US$ 64.2 million in 2Q09.
6 In US GAAP, Sales Deductions increased 6%, from US$ 165.0 million in 2Q08 to US$ 175.3 million in 2Q09.
7 In US GAAP, Net Revenue fell by 1%, from US$ 538.7 million in 2Q08 to US$ 531.6 million in 2Q09.
8 In US GAAP, Operating Costs increased 6%, from US$ 253.8 million 2Q08 to US$ 269.5 million in 2Q09.
9 In US GAAP, Programming and Royalties fell by 2%, from US$ 124.3 million in 2Q08 to US$ 121.6 million in 2Q09.
10 In US GAAP, Network Maintenance and Subscriber Costs increased 6%, from US$ 19.2 million in 2Q08 to US$ 20.3 million no 2Q09. 11
In US GAAP, Loyalty Marketing costs decreased by 16%, from US$ 2.4 million in 2Q08 to US$ 2.0 million in 2Q09. 12
In US GAAP, Payroll and Benefits increased 10%, from US$ 34.0 million in 2Q08 to US$ 37.4 million in 2Q09. 13
In US GAAP, Other Operating Expenses increased by 19%, from de US$ 73.9 million in 2Q08 to US$ 88.3 million in 2Q09. 14
In US GAAP, SG&A Expenses fell by 16%, from US$ 140.4 million in 2Q08 to US$ 118.0 million in 2Q09. 15
In US GAAP, Selling Expenses rose by 3%, from US$ 55.4 million in 2Q08 to US$56.8 in 2Q09.

2Q09 Earnings Release
July 22, 2009
Page 6 of 18
sales volumes. As a percentage of net revenue, selling expenses rose from 10.3% in 2Q08 to 10.7% in 2Q09.
5.2 General and Administrative Expenses16
decreased by 4%, from R$ 128.8 million in 2Q08 to R$ 123.4 million in 2Q09, as the systems and support areas could support the company’s growth in a productive and efficient manner. As a percentage of net revenue, G&A expenses decreased from 14.5% to 11.2%.
5.3 Other Administrative Expenses17
were R$ 5.1 million in 2Q09, versus R$ 12.7 million in 2Q08, chiefly due to the gains from the favorable court-of-last-resort verdict in relation to the tax claim for IPI (federal VAT) on imports.
6 Bad Debt Expenses18
were R$ 11.9 million in 2Q09, equivalent to 0.8% of net revenue, a very low percentage. The low bad debt level shows that the credit portfolio continues healthy despite the current economic scenario and the product offering targeted at lower-income clients.
7 EBITDA19
(Earnings Before Interest, Tax, Depreciation and Amortization) totaled R$ 286.8 million in the quarter, 24% higher than the R$ 231.8 million in 4Q07, with EBITDA margin being 26%. EBITDA before Selling Expenses totaled R$ 404.4 million in 2Q09, up 25% on the R$ 323.3 million in 2Q08. EBITDA margin before Selling Expenses was 37%, versus 36% in 2Q08.
8 Depreciation and Amortization20
expenses in 2Q09 totaled R$ 134.7 million, a 10% decline from the R$ 149.6 million in 2Q08. Pursuant to Law 11,638/07, residential installation expenses, which used to be amortized, are now depreciated, thereby increasing depreciation by 34%. On the other hand, pursuant to the same law, amortization fell by 83% due to the reclassification of residential installation costs as depreciation and the end of amortization of goodwill from future profitability of the subsidiaries.
9 EBIT21
(Earnings Before Interest and Taxes) closed the quarter at R$ 152.1 million, an 85% increase over the R$ 82.3 million in 2Q08.
NET FINANCIAL RESULT
(R$ thousand) 2Q09 1Q09 2Q08
Net Financial Result 25,572 (32,342) (8,797)
Monetary Indexation, net 916 (643) (1,204)
Gain (loss) on exchange rate, net 132,205 5,989 25,793
Financial expenses (127,179) (61,773) (53,600)
Financial income 19,629 24,084 20,214
Result from the sale of property and equipment 0 0 (2,812)
Other (non operating) 0 0 290
1 Net Financial Result was positive at R$ 25.6 million in 2Q09, versus an expense of R$ 8.8 million in 2Q08. This result is due to the following factors:
1.1 Net Monetary Indexation22
was a positive R$ 0.9 million in the quarter, versus a negative R$ 1.2 million in 2Q08, mainly due to the result of the monetary restatement of the provision for legal contingencies.
16 In US GAAP, General and Administrative Expenses fell by 24%, from US$ 77.6 million in 2Q08 to US$ 59.4 million in 2Q09.
17 In US GAAP, Other Administrative Expenses/ Revenue decreased 76%, from US$ 7.4 million in 2Q08 to US$ 1.8 million in 2Q09.
18 In US GAAP, Bad Debt expenses rose by 28%, from US$ 4.4 million in 2Q08 to US$ 5.7 million in 2Q09.
19 In US GAAP, EBITDA decreased 1%, from US$ 140.1 million in 2Q08 to US$ 138.5 million in 2Q09.
20 In US GAAP, Depreciation and Amortization decreased by 3%, from US$ 74.0 million in 2Q08 to US$ 71.6 million in 2Q09.
21 In US GAAP, EBIT rose by 2%, from US$ 64.5 million in 2Q08 to US$ 65.6 million in 2Q09.
22 In US GAAP, Net Monetary Indexation went from negative amount of US$ 0.8 thousand in 2Q08 to a positive amount of US$ 0.5 thousand in 2Q09.

2Q09 Earnings Release
July 22, 2009
Page 7 of 18
1.2 Net Foreign Exchange Variation23
was a gain of R$ 132.2 million in 2Q09, versus R$ 25.8 million in 2Q08. This increase is due to the financial gains on US dollar loans, especially those from Banco Inbursa raised in June 2008.
1.3 Financial Expenses24
were R$ 127.2 million, 137% more than the R$ 53.6 million in 2Q08, due to hedge operations to protect the interest on perpetual bonds and the Banco Inbursa loan, as well as equipment imports. In addition, there was the increase in interest expenses mainly resulting from the higher dollar rate on the foreign-currency loan.
1.4 Financial Income25
decreased 3% to R$ 19.6 million, versus R$ 20.2 million in 2Q08 due to the reduction in the average CDI, the index used to calculate interest on investments, in the period.
INCOME TAX AND NET INCOME
(R$ thousand) 2Q09 1Q09 2Q08
Income Tax and Social Contribution (47,881) (35,931) (42,803)
Current (40,311) (26,321) (26,708)
Deferred (7,570) (9,610) (16,095)
Constitution of Tax Loss Carryforward and and Temporary Differences (5,977) (8,017) (207)
Goodwill Amortization (1,593) (1,593) (15,888)
1 Income Tax and Social Contribution26
(current and deferred) in 2Q09 was R$ 47.9 million, versus R$ 42.8 million in 2Q08, due to the following reasons:
1.1 Current Income Tax and Social Contribution Tax totaled R$ 40.3 million, against R$ 26.7 million in 2Q08, a 51% increase, due to the growth in the operating income of the subsidiaries in the period. Note that according to Brazilian tax law, income tax should be calculated and paid by each of the operating subsidiaries, which causes a distortion in the tax calculation when it is done directly on consolidated results. Due to tax benefits on accrued losses, considering the current tax on taxable income, the effective average rate was 27% in 2Q09, versus a statutory tax rate of 34%.
1.2 Deferred Income Tax and Social Contribution Tax totaled R$ 7.6 million in 2Q09, against R$ 16.1 million 2Q08. This drop was due to the end of Globotel’s goodwill amortization at the end of 2008.
2 The Company closed the quarter with Net Income27
of R$ 129.8 million, versus R$ 28.2 million in 2Q08, driven mainly by the foreign exchange gains on the US dollar debt.
23 In US GAAP, Net Foreign Exchange Gain rose by 303%, from US$ 15.5 million in 2Q08 to US$ 62.5 million in 2Q09.
24 In US GAAP, Financial Expenses increased by 83%, from US$ 32.3 million in 2Q08 to US$ 59.0 million in 2Q09.
25 In US GAAP, Financial Income fell by 39%, from US$ 12.2 million in 2Q08 to US$ 7.5 million in 2Q09.
26 In US GAAP, Income Tax and Social Contribution went from US$ 31.8 million in 2Q08 to US$ 24.9 million in 2Q09.
27 In US GAAP, Net Income increased by 90,5%, from US$ 27.4 million in 2Q08 to US$ 52.2 million in 2Q09.

2Q09 Earnings Release
July 22, 2009
Page 8 of 18
LIQUIDITY, CAPITALIZATION AND DEBT
R$ Thousand 2Q09 1Q09 2Q08
Short Term Debt 68,227 99,332 35,644
Interests 16,448 54,846 8,748
Finame 51,779 44,486 26,896
Long Term Debt 1,589,089 1,700,920 1,396,439
Debentures 6th issuance 578,009 577,865 577,410
Perpetual Notes 292,740 347,280 234,574
Finame 161,031 145,807 96,075
CCB 170,000 170,000 170,000
Inbursa 387,309 459,968 318,380
Total Debt 1,657,316 1,800,252 1,432,082
Cash and Cash Equivalents 536,991 638,461 966,977
Net Debt 1,120,325 1,161,791 465,105
% of Total Debt Short Term 4% 6% 2%
% of Total Debt Long Term 96% 94% 98%
US dollar-denominated debt 693,029 833,109 560,310
% of Total Debt 41.8% 46.3% 39.1%
Brazilian real-denominated debt 964,287 967,143 871,772
% of Total Debt 58.2% 53.7% 60.9%
Gross Debt, which includes the principal and interest, closed the quarter at R$ 1,657.3 million, a 16% increase over 2Q08, due to the net debt of R$ 65 million raised through Finame in the past 12 months. The Brazilian Real’s depreciation against the US Dollar also increased the debt amount. Short-term debt accounts for only 4% of the total debt, showing that short-term refinancing risk is almost zero and that the Company can allocate most of its cash flow to investments needed to execute its accelerate growth strategy.
Cash, Cash Equivalents and Short-Term Investments decreased by 44% from R$ 967.0 million in 2Q08 to R$ 537.0 million in 2Q9, due to the acquisitions of ESC 90 on June 30, 2009 and BIGTV in December 2008. Excluding these effects, cash and cash equivalents would have increased by 4.3%, showing the solid and continuous cash generation from the operations.
Net Debt28
in 2Q09 totaled R$ 1,120.3 million, against R$ 465.1 million in 2Q08, a 141% increase. Loans to finance BIGTV acquisition drove up the Net Debt / EBITDA ratio from 0.53x in 2Q08 to 1.02x in 2Q09, considered acceptable by the Company.
The following table shows the evolution of the Company’s key financial indicators:
28 In US GAAP, Net Debt, which does not include the interest booked in the period, went from US$ 568.2 milion in 2Q08 to
US$ 290.9 million in 2Q09.
2Q09 Earnings Release
July 22, 2009
Page 9 of 18
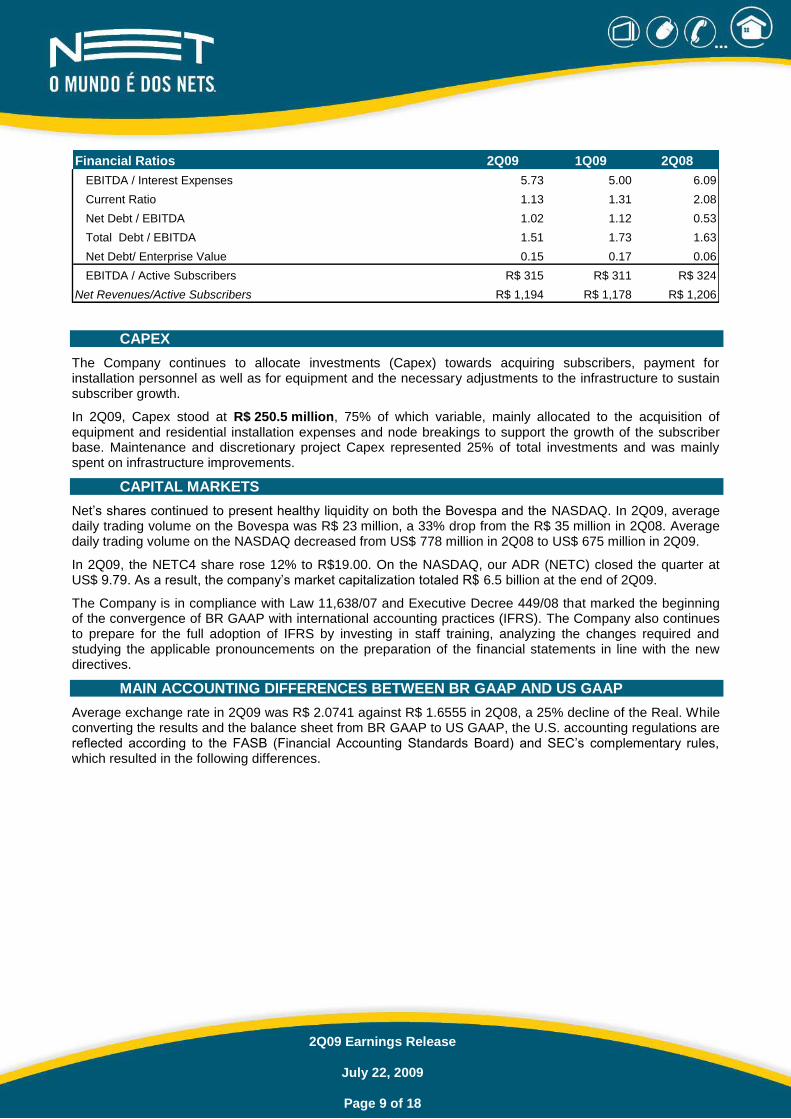
Financial Ratios 2Q09 1Q09 2Q08
EBITDA / Interest Expenses 5.73 5.00 6.09
Current Ratio 1.13 1.31 2.08
Net Debt / EBITDA 1.02 1.12 0.53
Total Debt / EBITDA 1.51 1.73 1.63
Net Debt/ Enterprise Value 0.15 0.17 0.06
EBITDA / Active Subscribers R$ 315 R$ 311 R$ 324
Net Revenues/Active Subscribers R$ 1,194 R$ 1,178 R$ 1,206
CAPEX
The Company continues to allocate investments (Capex) towards acquiring subscribers, payment for installation personnel as well as for equipment and the necessary adjustments to the infrastructure to sustain subscriber growth.
In 2Q09, Capex stood at R$ 250.5 million, 75% of which variable, mainly allocated to the acquisition of equipment and residential installation expenses and node breakings to support the growth of the subscriber base. Maintenance and discretionary project Capex represented 25% of total investments and was mainly spent on infrastructure improvements.
CAPITAL MARKETS
Net’s shares continued to present healthy liquidity on both the Bovespa and the NASDAQ. In 2Q09, average daily trading volume on the Bovespa was R$ 23 million, a 33% drop from the R$ 35 million in 2Q08. Average daily trading volume on the NASDAQ decreased from US$ 778 million in 2Q08 to US$ 675 million in 2Q09.
In 2Q09, the NETC4 share rose 12% to R$19.00. On the NASDAQ, our ADR (NETC) closed the quarter at US$ 9.79. As a result, the company’s market capitalization totaled R$ 6.5 billion at the end of 2Q09.
The Company is in compliance with Law 11,638/07 and Executive Decree 449/08 that marked the beginning of the convergence of BR GAAP with international accounting practices (IFRS). The Company also continues to prepare for the full adoption of IFRS by investing in staff training, analyzing the changes required and studying the applicable pronouncements on the preparation of the financial statements in line with the new directives.
MAIN ACCOUNTING DIFFERENCES BETWEEN BR GAAP AND US GAAP
Average exchange rate in 2Q09 was R$ 2.0741 against R$ 1.6555 in 2Q08, a 25% decline of the Real. While converting the results and the balance sheet from BR GAAP to US GAAP, the U.S. accounting regulations are reflected according to the FASB (Financial Accounting Standards Board) and SEC’s complementary rules, which resulted in the following differences.

2Q09 Earnings Release
July 22, 2009
Page 10 of 18
MAIN DIFFERENCES BETWEEN BR GAAP AND US GAAP 2Q09
EBITDA em BR GAAP (R$ million) 286.8
Adjustments that affected EBITDA in US GAAP (R$ million)
Hook-up fee 0.2
Subscribers sign-in costs (1.4)
Programming costs 0.5
Advanced expenses 0.2
Other 3.0
EBITDA in US GAAP (R$ million) 289.3
Difference in EBITDA (US GAAP - LS GAAP) 2.5
EBITDA in US GAAP (US$ million) 138.5
Net Income in BR GAAP (R$ million) 129.8
Adjustments that affected Net income in US GAAP (R$ million) -
EBITDA 2.5
Depreciation and Amortization (14.5)
Income tax and social contribuition (3.1)
Equity Accounting 0.3
Other (4.0)
Net Income in US GAAP (R$ million) 111.0
Difference in Net Income (US GAAP - BZ GAAP) (18.8)
Net income in US GAAP (US$ million) 52.2
Sum may not mach due to rounding
In US GAAP, Hook-up Revenue is deferred in accordance with SFAS 51 “Financial Reporting by Cable Television Companies” by the amount that exceeds client sign-in costs. If the difference is positive, this amount shall be booked and amortized according to the average period the subscriber remained as a client. As a result of loyalty packages, which can exempt clients from hook-up fees, the difference was negative in 2Q09 and the Company did not book any amount. However, due to the deferrals made in previous periods, an amount of R$ 0.2 million was recognized as the deferred hook-up revenue in this quarter, which is the reason for the higher revenue in US GAAP in comparison to BR GAAP in the quarter.
In US GAAP, the difference in costs resulting from the migration of outsourced Call Center systems was recognized in the 2007 results, whereas under BR GAAP these costs were deferred and are being amortized over 36 months. In 2Q09, revenue totaled R$ 0.2 million.
In US GAAP, Client Installation Costs are deferred in accordance with SFAS 51 and include installation materials, payroll and third-party installation services. In BR GAAP, in addition to the items considered in US GAAP, field telecommunications items and vehicle expenses are also deferred. Therefore, in US GAAP, this item was R$ 1.4 million lower than in the BR GAAP this quarter.
Previous negotiations of program contracts from December 2003 generated discounts conditioned on the settlement of these contracts. In BR GAAP, these discounts were already booked on the date the agreement was settled. In US GAAP, these discounts were deferred and are being booked according to the updated term of each agreement. Due to the booking of these discounts, Programming Costs in US GAAP were R$ 0.5 million lower than in BR GAAP in 2Q09.
As a result of the above-mentioned differences in accounting procedures, EBITDA in US GAAP was R$ 2.5 million higher than in BR GAAP, totaling R$ 289.3 million (US$ 138.5 million) in 2Q09.
Under US GAAP, goodwill from the acquisition of companies is not amortized and, in accordance with SFAS 142 “Goodwill and Intangible Assets”, is subject to an annual test to verify if the value of this goodwill is recoverable through future results. Under BR GAAP, said goodwill was no longer amortized as of December

2Q09 Earnings Release
July 22, 2009
Page 11 of 18
2008, pursuant to Law 11638 and is also subject to annual tests. Under US GAAP, it includes the amortization of the intangible assets booked at the acquisition of Vivax, Net Jundiaí and Net Criciúma. As a result, Depreciation and Amortization Expenses in US GAAP were R$ 14.5 million higher in 4Q08.
Under US GAAP, the effective income tax rate on the best income estimate for the current fiscal period is used to calculate the amount of income tax and social contribution due. Under BR GAAP, current and deferred taxes are calculated in accordance with the prevailing tax regulations. As a result, this expense was R$ 3.1 million higher in US GAAP.
Considering all these differences in accounting procedures, Net Income in US GAAP came to R$ 111.0 million (US$ 52.2 million) in 2Q09, against R$ 129.8 million under BR GAAP.

2Q09 Earnings Release
July 22, 2009
Page 12 of 18
UPCOMING EVENTS
1. Conference Call – 2Q09 Earnings Results
Date: July 22, 2009
BR GAAP (in Portuguese):
10:00 a.m. (Brasília time) Phone number: (11) 4688-6361
Code: NET
Replay until July 28, 2009: (11) 4688-6312
Code: 795
Live webcast at: http://ir.netservicos.com.br
BR GAAP (in English):
12:00 p.m. (Brasília time) Phone number: +1 (412) 858-4600
Code: Net Serviços de Comunicação
Replay until July 30, 2009: +1 (412) 317-0088
Replay code: 431697#
Live webcast at: http://ir.netservicos.com.br
2. Public Meetings
São Paulo – APIMEC Rio de Janeiro - APIMEC
Venue – Gran Hyatt São Paulo Venue – Sofitel Rio de Janeiro Copacabana
Av. Nações Unidas, 13.301 Av. Atlântica, 4240 – Nível E - Copacabana
Date: July 29, 2009 Date: July 30, 2009
Horário: 8:30 am (Brasília time) Horário: 08:30 am (Brasília time)
3. Scheduled Dates for Upcoming Results
(3Q09) October 20, 2009
The forward-looking statements contained in this document relating to business prospects, projections of operating and
financial results, and those related to the growth prospects of Net are merely estimates and, as such, are based
exclusively on the Management’s expectations about the future of the business. These forward-looking statements
depend, substantially, on changes in market conditions, performance of the Brazilian economy, the industry and
international markets and, therefore, are subject to change without prior notice. FINANCIAL STATEMENTS IN BR GAAP
– Pro Forma (Unaudited) FINANCIAL STATEMENTS IN US GAAP – Pro Forma (Unaudited)
2Q09 Earnings Release
July 22, 2009
Page 13 of 18
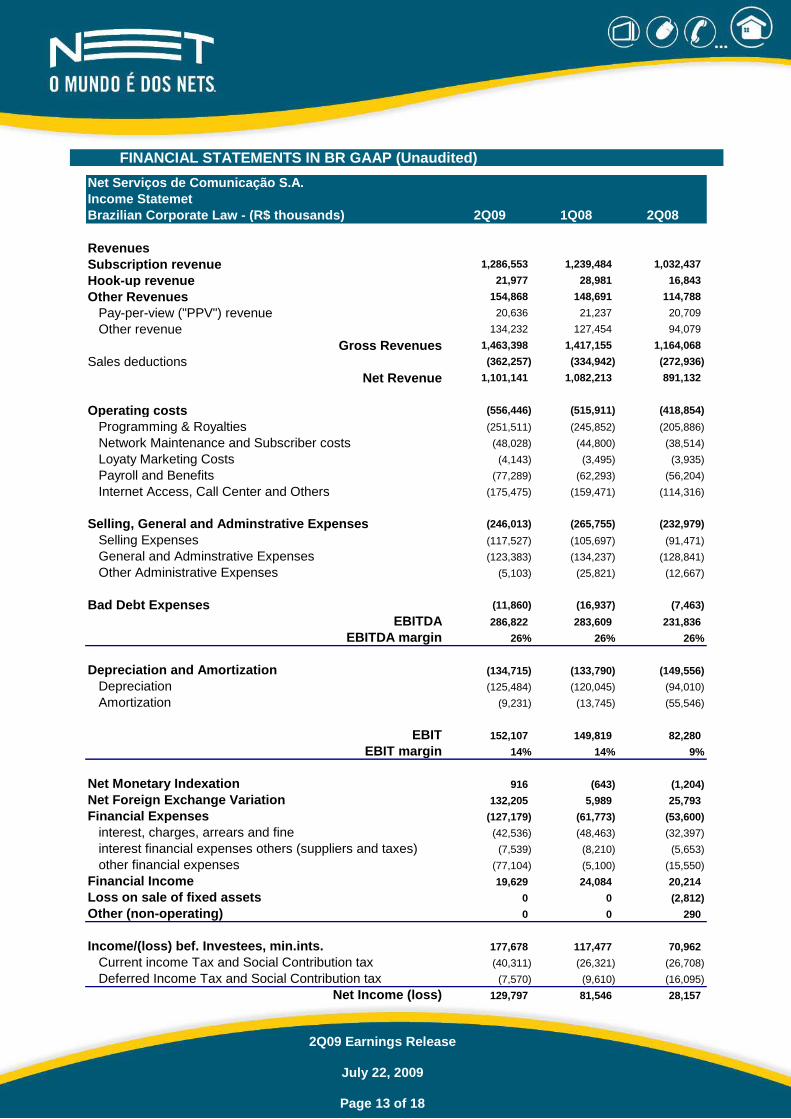
FINANCIAL STATEMENTS IN BR GAAP (Unaudited)
Net Serviços de Comunicação S.A.
Income Statemet
Brazilian Corporate Law - (R$ thousands) 2Q09 1Q08 2Q08
Revenues
Subscription revenue 1,286,553 1,239,484 1,032,437
Hook-up revenue 21,977 28,981 16,843
Other Revenues 154,868 148,691 114,788
Pay-per-view ("PPV") revenue 20,636 21,237 20,709
Other revenue 134,232 127,454 94,079
Gross Revenues 1,463,398 1,417,155 1,164,068
Sales deductions (362,257) (334,942) (272,936)
Net Revenue 1,101,141 1,082,213 891,132
Operating costs (556,446) (515,911) (418,854)
Programming & Royalties (251,511) (245,852) (205,886)
Network Maintenance and Subscriber costs (48,028) (44,800) (38,514)
Loyaty Marketing Costs (4,143) (3,495) (3,935)
Payroll and Benefits (77,289) (62,293) (56,204)
Internet Access, Call Center and Others (175,475) (159,471) (114,316)
Selling, General and Adminstrative Expenses (246,013) (265,755) (232,979)
Selling Expenses (117,527) (105,697) (91,471)
General and Adminstrative Expenses (123,383) (134,237) (128,841)
Other Administrative Expenses (5,103) (25,821) (12,667)
Bad Debt Expenses (11,860) (16,937) (7,463)
EBITDA 286,822 283,609 231,836
EBITDA margin 26% 26% 26%
Depreciation and Amortization (134,715) (133,790) (149,556)
Depreciation (125,484) (120,045) (94,010)
Amortization (9,231) (13,745) (55,546)
EBIT 152,107 149,819 82,280
EBIT margin 14% 14% 9%
Net Monetary Indexation 916 (643) (1,204)
Net Foreign Exchange Variation 132,205 5,989 25,793
Financial Expenses (127,179) (61,773) (53,600)
interest, charges, arrears and fine (42,536) (48,463) (32,397)
interest financial expenses others (suppliers and taxes) (7,539) (8,210) (5,653)
other financial expenses (77,104) (5,100) (15,550)
Financial Income 19,629 24,084 20,214
Loss on sale of fixed assets 0 0 (2,812)
Other (non-operating) 0 0 290
Income/(loss) bef. Investees, min.ints. 177,678 117,477 70,962
Current income Tax and Social Contribution tax (40,311) (26,321) (26,708)
Deferred Income Tax and Social Contribution tax (7,570) (9,610) (16,095)
Net Income (loss) 129,797 81,546 28,157

2Q09 Earnings Release
July 22, 2009
Page 14 of 18
NET Serviços de Comunicação S.A.
Consolidated Balance Sheet 2Q09 % 1Q08 % 2Q08 %
Brazilian Corporate Law (R$ thousand) - non-audited
Assets
Cash & cash equivalents 536,991 8.7% 638,461 10.6% 966,977 17.5%
Account receivable from subscriber - net 185,855 3.0% 172,603 2.9% 151,751 2.7%
Other receivables 29,486 0.5% 44,637 0.7% 73,433 1.3%
Income tax recoverable 98,002 1.6% 55,361 0.9% 56,884 1.0%
Deferred income tax 51,131 0.8% 42,604 0.7% 64,536 1.2%
Prepaid expenses 29,262 0.5% 26,686 0.4% 22,838 0.4%
Inventories 53,909 0.9% 57,739 1.0% 59,002 1.1%
Total Current Assets 984,634 16.0% 1,038,091 17.3% 1,395,422 25.2%
Investments 2,498 0.0% 2,711 0.0% 5,226 0.1%
Net Property & Diferred 4,776,079 77.6% 4,550,142 75.8% 3,733,094 67.4%
Other Assets 388,869 6.3% 413,054 6.9% 406,044 7.3%
Judicial Deposits 20,917 16.0% 23,627 0.4% 20,963 0.4%
Diferred taxes recoverable 363,487 5.9% 384,668 6.4% 381,071 6.9%
Other receivables 4,464 0.1% 4,759 0.1% 4,010 0.1%
Total Long-term Assets 5,167,446 84.0% 4,965,907 82.7% 4,144,364 74.8%
Total Assets 6,152,080 100.0% 6,003,998 100.0% 5,539,786 100.0%
Liabilities and Stockholders' Equity
Accounts payable to supliers and programmers 362,320 5.9% 374,452 6.2% 302,971 5.5%
Provision for payables 86,438 1.4% 30,267 0.5% 11,174 0.2%
Income tax payable 67,911 1.1% 27,227 0.5% 39,473 0.7%
Short-term debt 64,329 1.0% 75,406 1.3% 30,672 0.6%
Debentures 3,898 0.1% 23,926 0.4% 4,972 0.1%
Payroll accruals 14,768 0.2% 14,712 0.2% 11,658 0.2%
Other payable accounts 273,678 4.4% 244,204 4.1% 270,578 4.9%
Tax accruals 104,266 1.7% 105,354 1.8% 80,722 1.5%
Payroll provision 113,220 1.8% 88,787 1.5% 104,461 1.9%
Other debts 56,192 0.9% 50,062 0.8% 85,395 1.5%
Total Curret Liabilities 873,342 119.9% 790,194 13.2% 671,498 12.1%
Long-term debt 1,011,080 16.4% 1,123,055 18.7% 819,029 14.8%
Debentures 578,009 9.4% 577,865 9.6% 577,410 10.4%
Payroll and Benefits 30,822 0.5% 22,925 0.4% 11,825 0.2%
Taxes and contributions payable 6,374 0.1% 5,263 0.1% 4,401 0.1%
Provision for contingencies 689,144 11.2% 656,307 10.9% 597,472 10.8%
Future periods results 105,895 1.7% 100,523 1.7% 59,848 1.1%
Others Debts 2,674 0.0% 2,924 0.0% 0 0.0%
Total Long Term Liabilities 2,423,998 39.4% 2,488,861 41.5% 2,069,985 37.4%
Total Liabilities 3,297,340 53.6% 3,279,055 54.6% 2,741,483 49.5%
Capital Stock 5,599,320 91.0% 5,599,320 93.3% 5,540,346 100.0%
Goodwill reserves 153,168 2.5% 153,168 2.6% 212,142 3.8%
Accumulated Losses (2,897,748) -47.1% (3,027,545) -50.4% (2,954,185) -53.3%
Shareholders' Equity 2,854,740 46.4% 2,724,943 45.4% 2,798,303 50.5%
Liabilities and Stockholders´ Equity 6,152,080 194.5% 6,003,998 100.0% 5,539,786 100.0%
2Q09 Earnings Release
July 22, 2009
Page 15 of 18
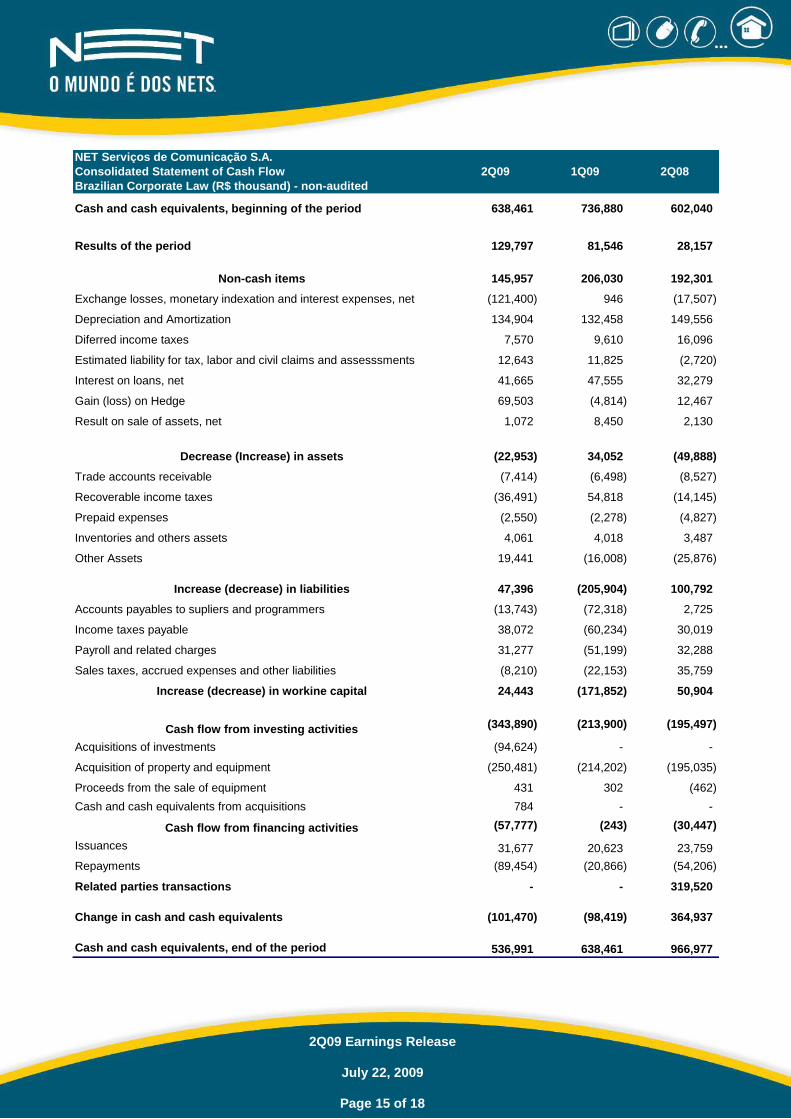
NET Serviços de Comunicação S.A.
Consolidated Statement of Cash Flow 2Q09 1Q09 2Q08
Brazilian Corporate Law (R$ thousand) - non-audited
Cash and cash equivalents, beginning of the period 638,461 736,880 602,040
Results of the period 129,797 81,546 28,157
Non-cash items 145,957 206,030 192,301
Exchange losses, monetary indexation and interest expenses, net (121,400) 946 (17,507)
Depreciation and Amortization 134,904 132,458 149,556
Diferred income taxes 7,570 9,610 16,096
Estimated liability for tax, labor and civil claims and assesssments 12,643 11,825 (2,720)
Interest on loans, net 41,665 47,555 32,279
Gain (loss) on Hedge 69,503 (4,814) 12,467
Result on sale of assets, net 1,072 8,450 2,130
Decrease (Increase) in assets (22,953) 34,052 (49,888)
Trade accounts receivable (7,414) (6,498) (8,527)
Recoverable income taxes (36,491) 54,818 (14,145)
Prepaid expenses (2,550) (2,278) (4,827)
Inventories and others assets 4,061 4,018 3,487
Other Assets 19,441 (16,008) (25,876)
Increase (decrease) in liabilities 47,396 (205,904) 100,792
Accounts payables to supliers and programmers (13,743) (72,318) 2,725
Income taxes payable 38,072 (60,234) 30,019
Payroll and related charges 31,277 (51,199) 32,288
Sales taxes, accrued expenses and other liabilities (8,210) (22,153) 35,759
Increase (decrease) in workine capital 24,443 (171,852) 50,904
Cash flow from investing activities (343,890) (213,900) (195,497)
Acquisitions of investments (94,624) - -
Acquisition of property and equipment (250,481) (214,202) (195,035)
Proceeds from the sale of equipment 431 302 (462)
Cash and cash equivalents from acquisitions 784 - -
Cash flow from financing activities (57,777) (243) (30,447)
Issuances 31,677 20,623 23,759
Repayments (89,454) (20,866) (54,206)
Related parties transactions - - 319,520
Change in cash and cash equivalents (101,470) (98,419) 364,937
Cash and cash equivalents, end of the period 536,991 638,461 966,977
2Q09 Earnings Release
July 22, 2009
Page 16 of 18
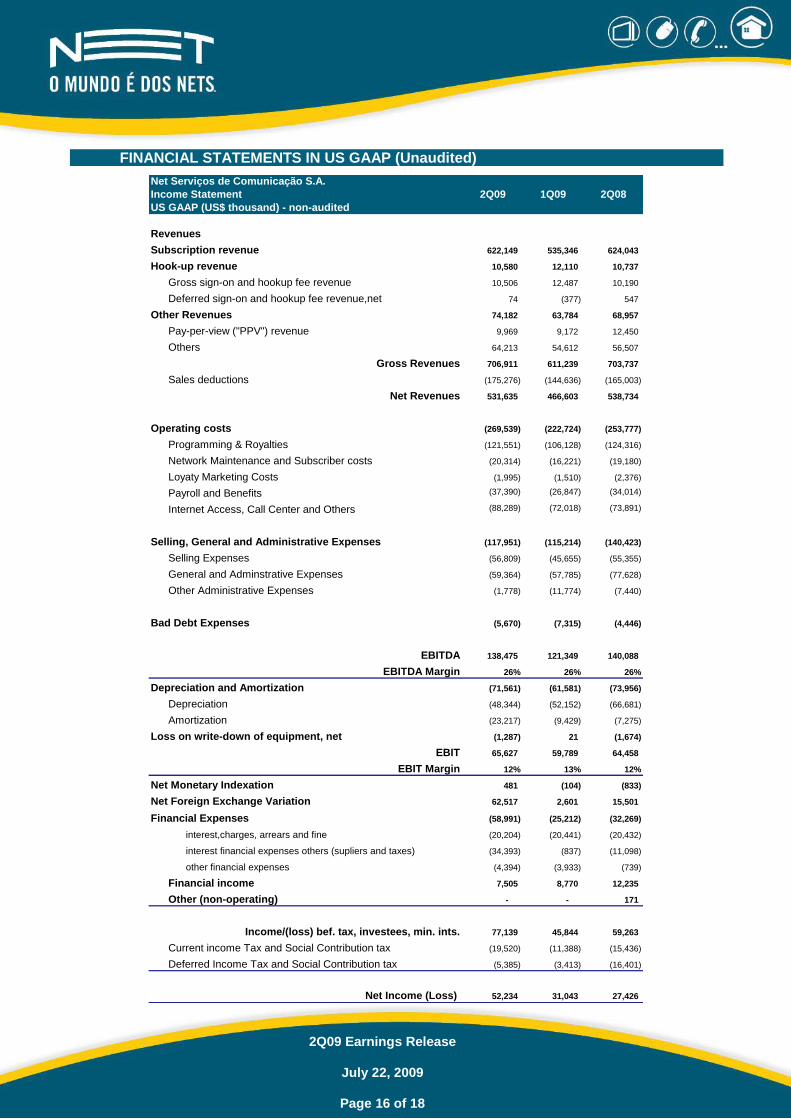
FINANCIAL STATEMENTS IN US GAAP (Unaudited)
Net Serviços de Comunicação S.A.
Income Statement 2Q09 1Q09 2Q08
US GAAP (US$ thousand) - non-audited
Revenues
Subscription revenue 622,149 535,346 624,043
Hook-up revenue 10,580 12,110 10,737
Gross sign-on and hookup fee revenue 10,506 12,487 10,190
Deferred sign-on and hookup fee revenue,net 74 (377) 547
Other Revenues 74,182 63,784 68,957
Pay-per-view ("PPV") revenue 9,969 9,172 12,450
Others 64,213 54,612 56,507
Gross Revenues 706,911 611,239 703,737
Sales deductions (175,276) (144,636) (165,003)
Net Revenues 531,635 466,603 538,734
Operating costs (269,539) (222,724) (253,777)
Programming & Royalties (121,551) (106,128) (124,316)
Network Maintenance and Subscriber costs (20,314) (16,221) (19,180)
Loyaty Marketing Costs (1,995) (1,510) (2,376)
Payroll and Benefits (37,390) (26,847) (34,014)
Internet Access, Call Center and Others (88,289) (72,018) (73,891)
Selling, General and Administrative Expenses (117,951) (115,214) (140,423)
Selling Expenses (56,809) (45,655) (55,355)
General and Adminstrative Expenses (59,364) (57,785) (77,628)
Other Administrative Expenses (1,778) (11,774) (7,440)
Bad Debt Expenses (5,670) (7,315) (4,446)
EBITDA 138,475 121,349 140,088
EBITDA Margin 26% 26% 26%
Depreciation and Amortization (71,561) (61,581) (73,956)
Depreciation (48,344) (52,152) (66,681)
Amortization (23,217) (9,429) (7,275)
Loss on write-down of equipment, net (1,287) 21 (1,674)
EBIT 65,627 59,789 64,458
EBIT Margin 12% 13% 12%
Net Monetary Indexation 481 (104) (833)
Net Foreign Exchange Variation 62,517 2,601 15,501
Financial Expenses (58,991) (25,212) (32,269)
interest,charges, arrears and fine (20,204) (20,441) (20,432)
interest financial expenses others (supliers and taxes) (34,393) (837) (11,098)
other financial expenses (4,394) (3,933) (739)
Financial income 7,505 8,770 12,235
Other (non-operating) - - 171
Income/(loss) bef. tax, investees, min. ints. 77,139 45,844 59,263
Current income Tax and Social Contribution tax (19,520) (11,388) (15,436)
Deferred Income Tax and Social Contribution tax (5,385) (3,413) (16,401)
Net Income (Loss) 52,234 31,043 27,426

2Q09 Earnings Release
July 22, 2009
Page 17 of 18
Net Serviços de Comunicação S.A.
Consolidated Balance Sheet 2Q09 % 1Q09 % 2Q08 %
US GAAP (US$ thousand) - non-audited
Assets
Cash & cash equivalents 275,154 8.0% 275,769 9.7% 607,436 16.0%
Short term investments 0 0.0% 0 0.0% 0 0.0%
Accounts receivable 207,806 6.1% 172,584 6.1% 244,638 6.4%
Inventories 27,623 0.8% 24,939 0.9% 37,064 1.0%
Other 7,308 0.2% 6,424 0.2% 6,440 0.2%
Income tax recoverable 50,216 1.5% 23,912 0.8% 35,734 0.9%
Deferred income tax 12,984 0.4% 7,118 0.3% 8,706 0.2%
Prepaid expenses 15,691 0.5% 12,385 0.4% 16,017 0.4%
Total current assets 596,782 17.4% 523,131 18.5% 956,035 25.2%
Goodwill on acquisition of subsidiaries 983,846 28.7% 817,785 28.9% 1,046,937 27.6%
Net property and equipment 1,343,128 39.2% 1,065,806 37.7% 1,204,717 31.8%
Other assets 505,772 14.7% 423,046 14.9% 585,755 15.4%
Judicial Deposits 59,651 1.7% 48,281 1.7% 99,619 2.6%
Deferred and recoverable taxes 73,729 2.1% 81,839 2.9% 147,422 3.9%
Intangible assets 367,458 10.7% 288,545 10.2% 328,908 8.7%
Other receivable 4,934 0.1% 4,381 0.2% 9,806 0.3%
Total Long-term assets 2,832,746 82.6% 2,306,637 81.5% 2,837,409 74.8%
Total assets 3,429,528 100.0% 2,829,768 100.0% 3,793,444 100.0%
Liabilities and Stockholders' Equity
Accounts payable to supliers and programmers 185,653 5.4% 161,737 5.7% 215,841 5.7%
Income taxes payable 33,969 1.0% 11,062 0.4% 23,781 0.6%
Current portion of long-term debt 26,532 0.8% 19,215 0.7% 16,896 0.4%
Interest payable 9,344 0.3% 24,822 0.9% 7,701 0.2%
Deferred Revenue 104,772 3.1% 85,177 3.0% 109,627 2.9%
Payroll and contributions payable 7,567 0.2% 6,356 0.2% 7,325 0.2%
Other payables and accruals 167,739 4.9% 104,938 3.7% 140,361 3.7%
Tax accruals 53,426 1.6% 45,505 1.6% 50,693 1.3%
Payroll provision 58,014 1.7% 38,350 1.4% 65,620 1.7%
Other debts 56,299 1.6% 21,082 0.7% 24,048 0.6%
Total Current Liabilities 535,576 15.6% 413,306 14.6% 521,532 13.7%
Long-term debt 519,620 15.2% 486,410 17.2% 517,143 13.6%
Debentures 297,192 8.7% 250,518 8.9% 364,344 9.6%
Deferred sign-on, hookup fee and programming benefit 61,425 1.8% 49,189 1.7% 44,465 1.2%
Taxes and payables and accruals 53,561 1.6% 38,715 1.4% 68,791 1.8%
Total long-term liabilities 931,798 27.2% 824,832 29.1% 994,743 26.2%
Provision for contigencies 385,361 11.2% 309,498 10.9% 413,736 10.9%
Capital stock - preffered and common shares 3,386,074 98.7% 3,386,074 119.7% 3,360,986 88.6%
Additional paid-in-capital 13,571 0.4% 13,571 0.5% 37,503 1.0%
Accumulated deficit (1,698,118) -49.5% (1,750,352) -61.9% (1,751,559) -46.2%
Accumulated other comprehensive loss, net (124,734) -3.6% (367,161) -13.0% 216,503 5.7%
Shareholders' equity 1,576,793 46.0% 1,282,132 45.3% 1,863,433 49.1%
Total Liabilities and Shareholders' Equity 3,429,528 100.0% 2,829,768 100.0% 3,793,444 100.0%

2Q09 Earnings Release
July 22, 2009
Page 18 of 18
Net Serviços de Comunicação S.A.
Consolidated Statement of Cash Flows 2Q09 1Q09 2Q08
US GAAP (US$ thousand) - non-audited
Cash and cash equivalents, beginning of the period 275,769 315,310 341,591
Results of the period 52,234 31,043 27,426
Non-cash items 79,229 94,683 108,689
Exchange losses, monetary indexation and interest expense, net (4,155) 18,847 16,332
Depreciation and amortization 71,561 61,581 73,956
Deferred income taxes 5,385 3,550 16,403
Estimated liability for tax, labor and civil claims and assessments 5,941 5,106 (1,655)
Deferred sign-on and hook-up fee revenue 71 496 56
Amortization of deferred revenues (353) (353) (891)
Purchase of short investments - - 2,814
Write off and disposal of assets, net 779 5,456 1,674
Decrease (Increase) in assets (14,256) 15,163 (39,999)
Trade accounts receivable (3,823) (2,782) (13,857)
Recoverable income taxes (17,867) 23,676 (6,611)
Prepaid expenses and other assets 7,434 (5,731) (19,531)
Increase (decrease) in liabilities 25,949 (90,848) 71,436
Accounts payable to suppliers and programmers (6,941) (31,077) 7,434
Income taxes payable 18,972 (26,050) 17,292
Payroll and related charges 14,731 (22,058) 26,492
Sales taxes, accrued expenses and other liabilities (813) (11,663) 20,218
Increase (decrease) in working capital 11,693 (75,685) 31,437
Cash flow from investing activities (167,862) (92,374) (118,201)
Advances to related companies 401 - -
Withdrawals of short-term investments (48,425) - -
Acquistion of property and equipment (120,058) (92,505) (117,939)
Proceeds from the sale of equipment 220 131 (262)
Cash flow from financing activities (28,180) (99) (18,773)
Issuances 15,442 8,905 14,400
Repayments (43,622) (9,004) (33,173)
Effect of exchange rate changes on cash 52,271 2,891 35,267
Change in cash and cash equivalents (615) (39,541) 265,845
Cash and cash equivalents, end of the period 275,154 275,769 607,436