earnings of fy2020/3 q3 - fujifilm · 2020-05-22 · performance of fy2020/3 q3 (9 months): main...
TRANSCRIPT

Earnings of FY2020/3 Q3
Feb. 06, 2020
FORWARD-LOOKING STATEMENTSForward looking statements such as those relating to earnings forecasts and other projections containedForward-looking statements, such as those relating to earnings forecasts and other projections contained in this material, are management’s current assumptions and beliefs based on currently available information. Such forward-looking statements are subject to a number of risks, uncertainties, and other factors. Accordingly, actual results may differ materially from those projected due to various factors.
Performance of FY2020/3 Q3 (9 Months): Main PointsPerformance of FY2020/3 Q3 (9 Months): Main Points
Performance Summary of Performance Summary of FY2020/3 Q3 (9 Months)FY2020/3 Q3 (9 Months)
Performance of FY2020/3 Q3 (9 Months): Main Points Performance of FY2020/3 Q3 (9 Months): Main Points
9 months result: Operating income decreased by 4.2% YoY,increased by 2 9% on a constant currency basisincreased by 2.9% on a constant-currency basis.
Net income attributable to FUJIFILM Holdings increased by 19.4% YoY,proceeding as planned for the full-year ROE target of 8%.
RRevenue Though the total revenue decreased due to a negative impact from the strong
yen, the economic slowdown in China, decline in the sales of the imagingbusiness and export to the U.S. and Europe in the document business, the
Performance by segment
(Compared to the previous fiscal
year)
business and export to the U.S. and Europe in the document business, thehealthcare business expanded driven by the medical systems business.
Operating income Healthcare increased due to increased sales in medical systems and
ti di iyear)
regenerative medicine. Document increased by improvements in profitability and a positive impact
from structural reforms. Imaging decreased due to lower sales.
Acquired Hitachi’s Diagnostic Imaging-related Business (Dec.18, 2019) Fuji Xerox announced the change of its corporate name to FUJIFILM
Business Innovation Corp on Apr 1 2021(Jan 6 2020)Special note
g g
2
Business Innovation Corp. on Apr.1, 2021(Jan. 6, 2020) Share buyback of up to 50 billion yen : 18.8 billion yen bought back as of
the end of January, 2020
Special note

Consolidated Performance Consolidated Performance of FY2020/3 Q3of FY2020/3 Q3Performance Summary of Performance Summary of FY2020/3 Q3 (9 Months)FY2020/3 Q3 (9 Months)
((Apr. 2019 Apr. 2019 –– Dec. 2019Dec. 2019))
(Billions of yen)
FY2019/3 FY2020/3 ChangeImpact of
exchange rateConstant-currency
basis
9M
1,799.8 1,728.4 (71.4) (38.8) (32.6)100.0% 100.0% -4.0% -1.8%
158 3 151 6 (6 7) (11 4) 4 7
Revenue
158.3 151.6 (6.7) (11.4) 4.78.8% 8.8% -4.2% +2.9%
154.6 166.5 11.9 22.3(10.4)Income before
Operating Income
8.6% 9.6% +7.7% +14.5%
101.1 120.7 19.6 26.85.6% 7.0% +19.4% +26.5%
(7.2)
Income Taxes
Net Income Attributable toFUJIFILM Holdings
〈Other factors of change (YoY) 〉Operating income
5.6% 7.0% 19.4% 26.5%
¥111 ¥109 (¥2)
Net Income Attributable toFUJIFILM Holdings per Share
E h US$/¥
¥57.80¥294.76¥236.96
3
--- Raw material prices: + ¥3.0 billion¥111 ¥109 (¥2)¥129 ¥121 (¥8)
Exchange US$/¥Rates €/¥
Consolidated Revenue and Operating Income byConsolidated Revenue and Operating Income by SegmentSegment
Performance Summary of Performance Summary of FY2020/3 Q3 (9 Months)FY2020/3 Q3 (9 Months)
Consolidated Revenue and Operating Income by Consolidated Revenue and Operating Income by SegmentSegment
(Billions of yen)
9MChange Impact ofRevenue
FY2019/3 FY2020/3
303.8 266.1 (37.7) (-12.4%) (9.7) (28.0) (-9.2%)
Healthcare 342.9 350.8 7.9 (+2.3%) (7.9) 15.8 (+4.6%)
Change Impact of exchange rate
Constant-currency basisRevenue
Imaging Solutions
758.9 741.2 (17.7) (-2.3%) (16.4) (1.3) (-0.2%)
737.1 721.1 (16.0) (-2.2%) (12.7) (3.3) (-0.5%)
1,799.8 1,728.4 (71.4) (-4.0%) (38.8) (32.6) (-1.8%)
Healthcare & MaterialSolutions
Document Solutions
Total , , ( ) ( ) ( )Note: After elimination of intersegment transactions
(Billions of yen)
9M
Operating Income Change Impact ofFY2019/3 FY2020/3
48.0 27.4 (20.6) (-42.8%) (4.0) (16.6) (-34.5%)
Healthcare 17.4 20.0 2.6 (+14.2%) (1.8) 4.4 (+24.6%)
Imaging Solutions
Operating Income Change Impact ofexchange rate
Constant-currency basis
( )
70.0 70.8 0.8 (+1.1%) (3.8) 4.6 (+6.5%)
66.9 80.5 13.6 (+20.3%) (3.7) 17.3 (+25.8%)
(26 6) (27 1) (0 5) 0 1 (0 6)Corporate Expenses &
Healthcare & MaterialSolutions
Document Solutions
4
(26.6) (27.1) (0.5) - 0.1 (0.6) -
158.3 151.6 (6.7) (-4.2%) (11.4) 4.7 (+2.9%)Total
Corporate Expenses &Eliminations

Summary by OperatingSummary by Operating SegmentSegment
Performance Summary of Performance Summary of FY2020/3 Q3 (9 Months)FY2020/3 Q3 (9 Months)
Summary by Operating Summary by Operating Segment Segment
Imaging SolutionsImaging Solutions(Billions of yen)
Revenue YoY Operating income YoYag g So ut o sag g So ut o s
・ In the photo imaging business, revenue decreased due to such factors as declined sales of photographic paper and inventory adjustments of instant photo systems at some U.S. retailers in the first half of the fiscal year In instant business sell-through at main retailers in Q3 increased compared
(37.7) (-12.4%) (20.6)266.1 (-42.8%)27.4
first half of the fiscal year. In instant business, sell through at main retailers in Q3 increased compared to the previous year, during year-end shopping season including Xmas. Sales expansion is aimed mainly with instax mini LiPlay, a hybrid instant camera launched in June 2019, and instax mini Linklaunched in October 2019.
・ In the electronic imaging business, the sales of entry-level mirrorless digital cameras decreased under severe market conditions. Sales expansion is aimed mainly with FUJIFILM X-Pro3, a flagship model launched in November 2019, and FUJIFILM X-T200 to be launched in this month.
・ In the optical device business, revenue decreased, reflecting a declined demand for various industrial use lenses such as on-vehicle lenses due to an economic slowdown in China. The line-up of new products is enhanced for business growth, including FUJIFILM PROJECTOR Z5000, and FUJINONUA107×8.4BESM AF, a 4K-compatible broadcast lens.UA107 8.4BESM AF, a 4K compatible broadcast lens.
Revenue decreased due to such factors as declined sales of instant photo systems and mirrorless digital cameras.
5
Operating income decreased due to the revenue decrease.
Summary by OperatingSummary by Operating SegmentSegment
Performance Summary of Performance Summary of FY2020/3 Q3 (9 Months)FY2020/3 Q3 (9 Months)
Healthcare & Material SolutionsHealthcare & Material Solutions
Summary by Operating Summary by Operating Segment Segment (Billions of yen)
( 2 3%)741 2
Revenue YoY
0 8 (+1 1%)(17 7) 70 8
Operating incomeYoY
・ The medical systems business enjoyed brisk sales in such areas as medical IT and endoscopes.In the bio CDMO business, M&A and expansion of facilities contributed to an increase in contract development and manufacturing of biopharmaceuticals.
(-2.3%)741.2 0.8 (+1.1%)(17.7) 70.8
p g pIn the regenerative medicine business, revenue increased due to strong sales of culture media by FUJIFILM Irvine Scientific.
・ In the display materials business, though revenue decreased mainly due to production adjustments of LCD l f OLCD panels, the sales of new products related to OLED showed steady growth.
・ In the electronic materials business, although the sales of advanced peripheral materials related to photolithography were affected by market conditions, sales remained solid for products such as color resist for image sensorscolor resist for image sensors.
・ In the recording media business, revenue increased due to strong sales of magnetic tapes for high volume data storage.
I th hi t b i l d d d t d li i th d d f i ti l t・ In the graphic systems business, sales decreased due to a decline in the demand for printing plates.
Though overall revenue decreased, healthcare increased driven by the medical systems bio CDMO and regenerative medicine business
6
the medical systems, bio CDMO and regenerative medicine business. Operating income increased by improved profitability in healthcare.
Summary by OperatingSummary by Operating SegmentSegment
Performance Summary of Performance Summary of FY2020/3 Q3 (9 Months)FY2020/3 Q3 (9 Months)
Document SolutionsDocument Solutions
Summary by Operating Summary by Operating Segment Segment (Billions of yen)
YoY Operating income YoYRevenueDocument SolutionsDocument Solutions
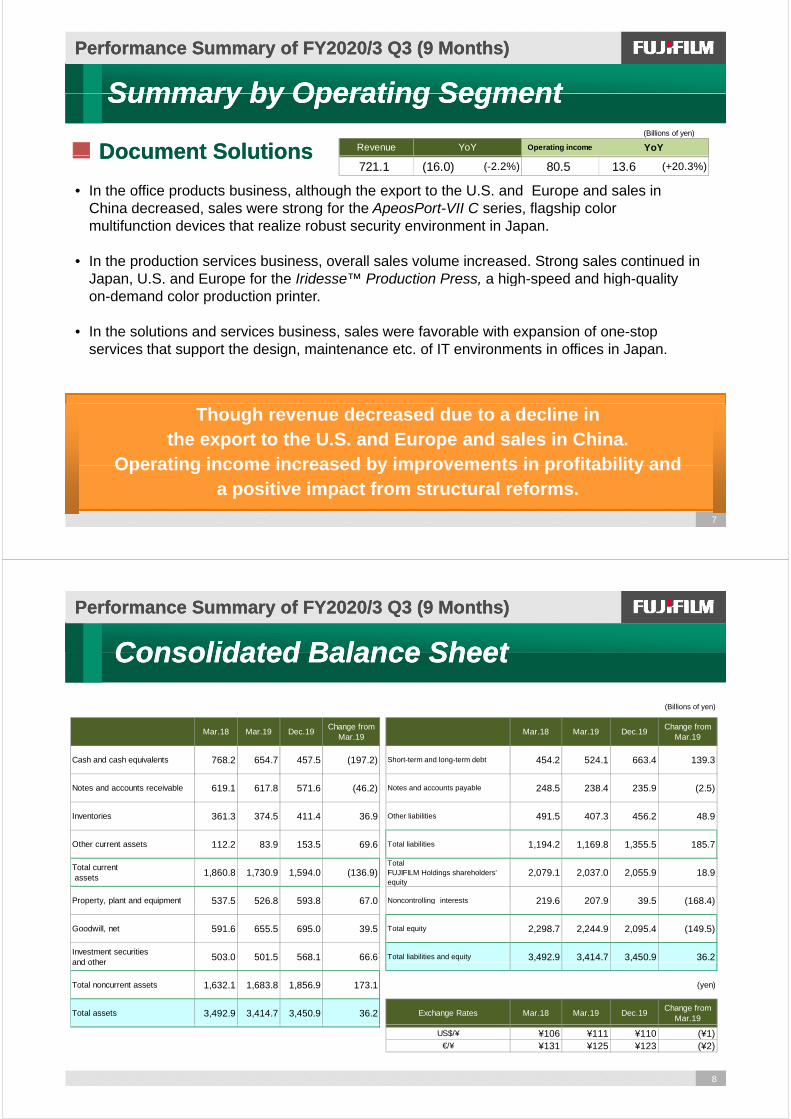
• In the office products business, although the export to the U.S. and Europe and sales in China decreased, sales were strong for the ApeosPort-VII C series, flagship color
13.6 (+20.3%)721.1 (16.0) (-2.2%) 80.5
multifunction devices that realize robust security environment in Japan.
• In the production services business, overall sales volume increased. Strong sales continued in Japan U S and Europe for the Iridesse™ Production Press a high-speed and high-qualityJapan, U.S. and Europe for the Iridesse Production Press, a high-speed and high-quality on-demand color production printer.
• In the solutions and services business, sales were favorable with expansion of one-stop services that support the design, maintenance etc. of IT environments in offices in Japan.
Though revenue decreased due to a decline in the export to the U.S. and Europe and sales in China.
Operating income increased by improvements in profitability and
7
Operating income increased by improvements in profitability and a positive impact from structural reforms.
Consolidated Balance SheetConsolidated Balance Sheet
Performance Summary of Performance Summary of FY2020/3 Q3 (9 Months)FY2020/3 Q3 (9 Months)
Consolidated Balance SheetConsolidated Balance Sheet
(Billions of yen)
Mar.18 Mar.19 Dec.19Change from
Mar.19Mar.18 Mar.19 Dec.19
Change fromMar.19
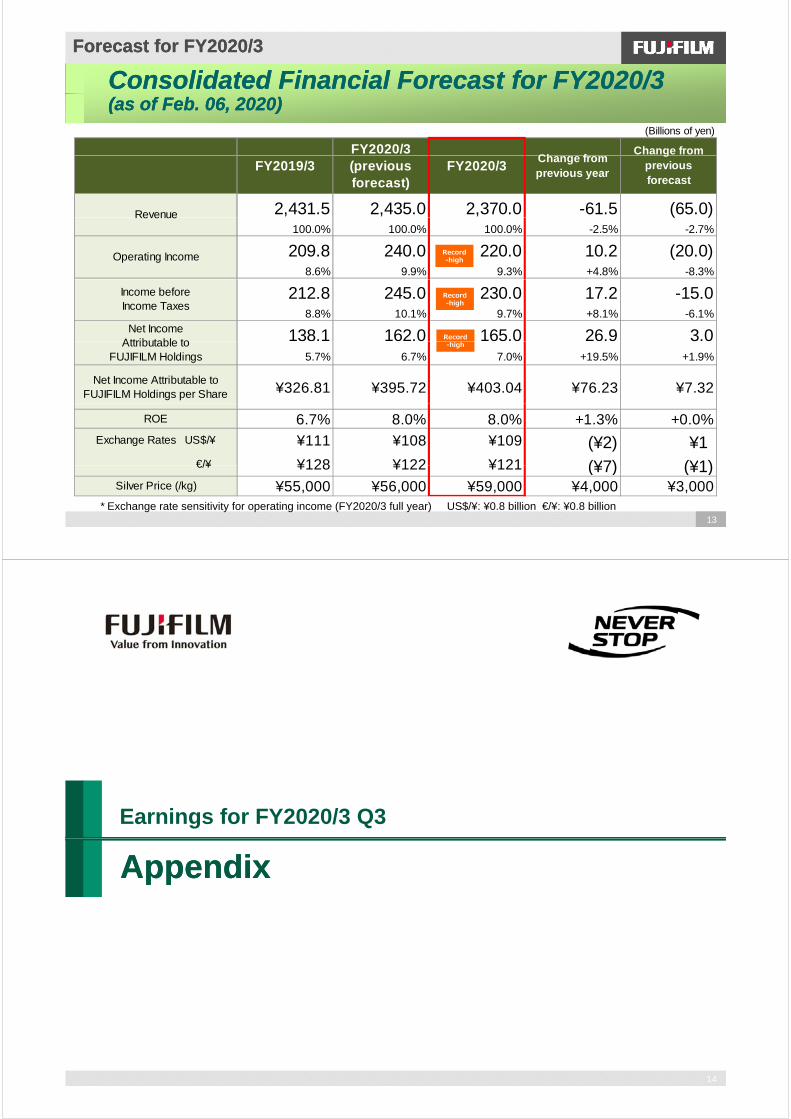
Cash and cash equivalents 768.2 654.7 457.5 (197.2) Short-term and long-term debt 454.2 524.1 663.4 139.3
Notes and accounts receivable 619.1 617.8 571.6 (46.2) Notes and accounts payable 248.5 238.4 235.9 (2.5)
Inventories 361.3 374.5 411.4 36.9 Other liabilities 491.5 407.3 456.2 48.9
Other current assets 112.2 83.9 153.5 69.6 Total liabilities 1,194.2 1,169.8 1,355.5 185.7
Total current assets
1,860.8 1,730.9 1,594.0 (136.9)TotalFUJIFILM Holdings shareholders'equity
2,079.1 2,037.0 2,055.9 18.9
Property plant and equipment 537 5 526 8 593 8 67 0 Noncontrolling interests 219 6 207 9 39 5 (168 4)Property, plant and equipment 537.5 526.8 593.8 67.0 Noncontrolling interests 219.6 207.9 39.5 (168.4)
Goodwill, net 591.6 655.5 695.0 39.5 Total equity 2,298.7 2,244.9 2,095.4 (149.5)
Investment securitiesand other
503.0 501.5 568.1 66.6 Total liabilities and equity 3,492.9 3,414.7 3,450.9 36.2and other
Total noncurrent assets 1,632.1 1,683.8 1,856.9 173.1 (yen)
Total assets 3,492.9 3,414.7 3,450.9 36.2 Exchange Rates Mar.18 Mar.19 Dec.19Change from
Mar.19
8
US$/¥ ¥106 ¥111 ¥110 (¥1)€/¥ ¥131 ¥125 ¥123 (¥2)

Cash FlowsCash Flows
Performance Summary of Performance Summary of FY2020/3 Q3 (9 Months)FY2020/3 Q3 (9 Months)
Cash FlowsCash Flows(Billions of yen)
FY2018/3 FY2019/3 FY2020/3C/F from operating activities
C/F from investing activities
Free cash flows
9M 9M 9M
Net income 133.9 114.4 133.5
Depreciation & amortization 95.3 95.6 91.8Change in notes and accounts
155 7 162 4
(Billions of yen)
(without acquisitions of businesses)Change in notes and accounts
receivable47.8 20.3 43.5
Change in inventories (35.1) (41.2) (38.2)Change in notes and accounts
payable - trade(30.6) (6.0) 6.5
Oth (55 6) (39 5) (74 7)155.7 143.6 162.4
88.1 82.3 69.6
Others (55.6) (39.5) (74.7)
C/F from operating activities 155.7 143.6 162.4
Capital expenditure (48.4) (47.1) (64.8)
Purchases of software (12.4) (13.7) (15.2)
Sales and purchases of marketableand investment securities
23.1 (13.8) (3.7)
Acquisitions of businesses (126.9) (84.3) (105.9)Others (6.8) (0.5) (12.8)
(171.4) (159.4)
(202.4)
FY2018/3 FY2019/3 FY2020/3
C/F from investing activities (171.4) (159.4) (202.4)
Free cash flows (15.7) (15.8) (40.0)
Free cash flows without acquisitions ofbusinesses and others *
88.1 82.3 69.6FY2018/3
9MFY2019/3
9MFY2020/3
9M
9
* After deduction of acquisitions of businesses, sales and purchases of marketable and investment securities.
businesses and others
Earnings for FY2020/3 Q3
Structural Reforms of Fuji XeroxStructural Reforms of Fuji Xerox
10

Structural Reforms of Fuji XeroxStructural Reforms of Fuji Xerox
Performance Summary of Performance Summary of FY2020/3 Q3 (9 Months)FY2020/3 Q3 (9 Months)
Structural Reforms of Fuji XeroxStructural Reforms of Fuji Xerox
(Billions of yen)
Structural reform
FY2018/3(Actual)
FY2019/3(Actual)
FY2020/3(Forecast)
FY2021/3(Forecast)
TOTAL
expenses etc. 70.0 16.1 10.0 2.0 98.1
Positive impact 0.0 31.0 18.0 6.0 55.0
FY2020/3Q1
(Actual)Full Year
Q2(Actual)
Q3(Actual)
9M(Actual)
Structural reformexpenses etc. 4.1 0.4 3.4 7.9 10.0
Positive impact 8.3 3.8 3.6 15.7 18.0
The structural reforms in Q3 (9 Months) FY2020/3proceeded as plannedproceeded as planned.
11
Earnings of FY2020/3 Q3
Forecast for FY2020/3
12
Consolidated Financial Forecast for Consolidated Financial Forecast for FY2020/3 FY2020/3
Forecast for Forecast for FY2020/3FY2020/3
(Billions of yen)
Change fromFY2020/3Ch f
(as of (as of Feb. 06, 2020)Feb. 06, 2020)
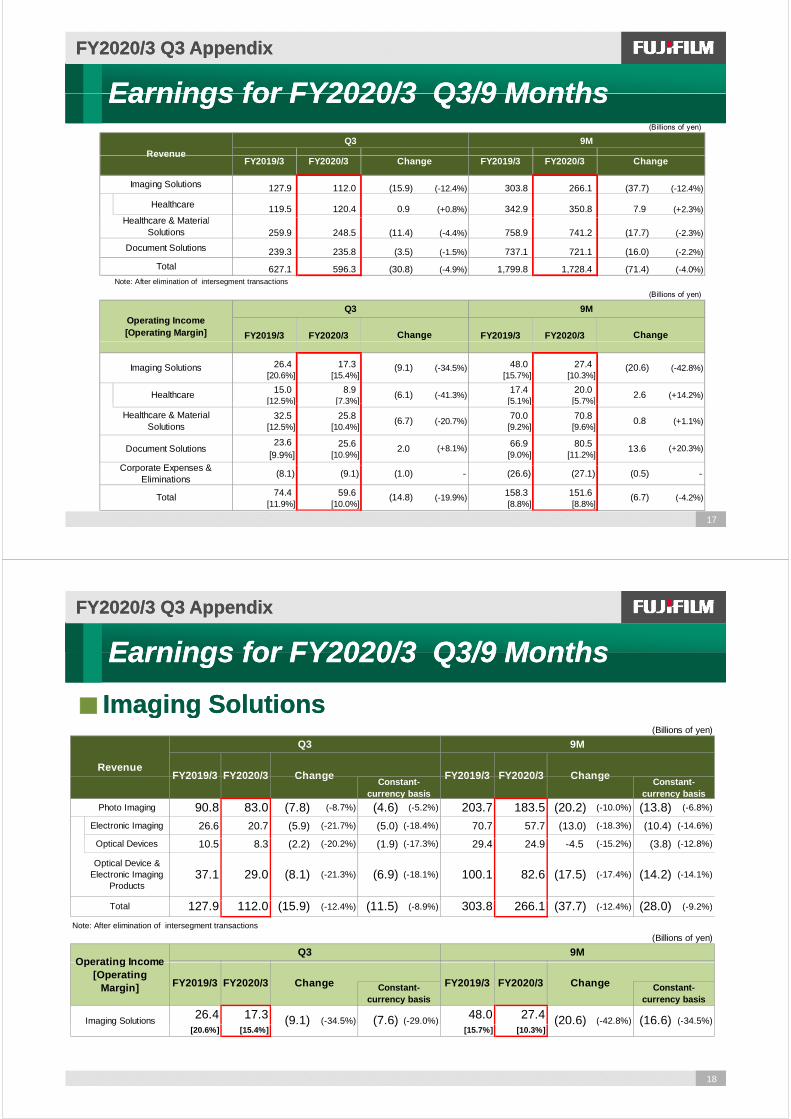
2,431.5 2,435.0 2,370.0 -61.5 (65.0)Revenue
gpreviousforecast
FY2020/3FY2019/3 (previousforecast)
Change fromprevious year
( )100.0% 100.0% 100.0% -2.5% -2.7%
209.8 240.0 220.0 10.2 (20.0)8.6% 9.9% 9.3% +4.8% -8.3%
Operating Income
Revenue
Record-high
212.8 245.0 230.0 17.2 -15.08.8% 10.1% 9.7% +8.1% -6.1%
138.1 162.0 165.0 26.9 3.0
Income beforeIncome Taxes
Net IncomeAttributable to
Record-high
Record
5.7% 6.7% 7.0% +19.5% +1.9%
¥326.81 ¥395.72 ¥403.04 ¥76.23 ¥7.32
Attributable toFUJIFILM Holdings
Net Income Attributable toFUJIFILM Holdings per Share
-high
6.7% 8.0% 8.0% +1.3% +0.0%
¥111 ¥108 ¥109 (¥2) ¥1¥128 ¥122 ¥121 (¥7) (¥1)
Exchange Rates US$/¥
€/¥
ROE
¥128 ¥122 ¥121 (¥7) (¥1)¥55,000 ¥56,000 ¥59,000 ¥4,000 ¥3,000
€/¥
Silver Price (/kg)
13
* Exchange rate sensitivity for operating income (FY2020/3 full year) US$/¥: ¥0.8 billion €/¥: ¥0.8 billion
Earnings for FY2020/3 Q3
AppendixAppendix
14

FY2020/3 Q3 AppendixFY2020/3 Q3 Appendix
Analysis of Operating Income ChangeAnalysis of Operating Income Change
170.0
(Against FY2019/3 Q3(Against FY2019/3 Q3 9Months) 9Months)
(Billions of yen)
+0.5160.0
-16.6
+15.1-11.4
+3.0-0.6
150.0
158.3
+1.6+1.7
140.0
151.6
130.0
120.0FY2019/3 Imaging Healthcare Document Structural Difference of FX Raw Others FY2020/3
0
Actual & Material
reformpositive
impact in Document
structuralreform
expenses inDocument
materialprice
Actual
15
FY2020/3 Q3 AppendixFY2020/3 Q3 Appendix
Earnings forEarnings for FY2020/3 Q3/9 MonthsFY2020/3 Q3/9 MonthsEarnings for Earnings for FY2020/3 Q3/9 MonthsFY2020/3 Q3/9 Months
(Billions of yen)
FY2019/3 FY2020/3 Change FY2019/3 FY2020/3 Change
Q3 9M
FY2019/3 FY2020/3 Change FY2019/3 FY2020/3 Change
627.1 596.3 (30.8) 1,799.8 1,728.4 (71.4)100.0% 100.0% -4.9% 100.0% 100.0% -4.0%
Revenue
74.4 59.6 (14.8) 158.3 151.6 (6.7)11.9% 10.0% -19.9% 8.8% 8.8% -4.2%
55 8 69 0 13 2 154 6 166 5 11 9Income before
Operating Income
55.8 69.0 13.2 154.6 166.5 11.98.9% 11.6% +23.8% 8.6% 9.6% +7.7%
35.6 59.6 24.0 101.1 120.7 19.65 7% 10 0% +67 4% 5 6% 7 0% +19 4%
Income before Income Taxes
Net Income Attributable toFUJIFILM Holdings 5.7% 10.0% +67.4% 5.6% 7.0% +19.4%
¥113 ¥109 (¥4) ¥111 ¥109 (¥2)¥129 ¥120 (¥9) ¥129 ¥121 (¥8)
Exchange US$/¥Rates €/¥
FUJIFILM Holdings
16
〈Other factors of change (Q3/9M YoY) 〉 Operating income --- Raw material prices: + ¥1.1 billion / + ¥3.0 billion
FY2020/3 Q3 AppendixFY2020/3 Q3 Appendix
Earnings forEarnings for FY2020/3 Q3/9 MonthsFY2020/3 Q3/9 MonthsEarnings for Earnings for FY2020/3 Q3/9 MonthsFY2020/3 Q3/9 Months(Billions of yen)
RevenueQ3 9M
FY2019/3 FY2020/3 FY2019/3 FY2020/3
127.9 112.0 (15.9) (-12.4%) 303.8 266.1 (37.7) (-12.4%)
Healthcare 119.5 120.4 0.9 (+0.8%) 342.9 350.8 7.9 (+2.3%)
Revenue
Imaging Solutions
H lth & M t i l
Change Change
259.9 248.5 (11.4) (-4.4%) 758.9 741.2 (17.7) (-2.3%)
239.3 235.8 (3.5) (-1.5%) 737.1 721.1 (16.0) (-2.2%)
627.1 596.3 (30.8) (-4.9%) 1,799.8 1,728.4 (71.4) (-4.0%)
Document Solutions
Total
Healthcare & MaterialSolutions
N t Aft li i ti f i t t t ti
(Billions of yen)
FY2019/3 FY2020/3 FY2019/3 FY2020/3
Q3
Note: After elimination of intersegment transactions
Operating Income[Operating Margin] ChangeChange
9M
26.4 17.3 48.0 27.4[20.6%] [15.4%] [15.7%] [10.3%]
15.0 8.9 17.4 20.0[12.5%] [7.3%] [5.1%] [5.7%]
Healthcare
Imaging Solutions (-34.5%)
2.6(-41.3%) (+14.2%)
(-42.8%)(9.1) (20.6)
(6.1)[12.5%] [7.3%] [5.1%] [5.7%]
32.5 25.8 70.0 70.8[12.5%] [10.4%] [9.2%] [9.6%]
23.6 25.6 66.9 80.5[9.9%] [10.9%] [9.0%] [11.2%]
(6.7)
C t E &
Document Solutions 2.0
Healthcare & MaterialSolutions
(+1.1%)(-20.7%) 0.8
13.6(+8.1%) (+20.3%)
17
(8.1) (9.1) (1.0) - (26.6) (27.1) (0.5) -
74.4 59.6 158.3 151.6[11.9%] [10.0%] [8.8%] [8.8%]
(14.8) (-19.9%)
Corporate Expenses &Eliminations
Total (6.7) (-4.2%)
FY2020/3 Q3 AppendixFY2020/3 Q3 Appendix
Earnings forEarnings for FY2020/3 Q3/9 MonthsFY2020/3 Q3/9 Months
Imaging SolutionsImaging Solutions
Earnings for Earnings for FY2020/3 Q3/9 MonthsFY2020/3 Q3/9 Months
g gg g(Billions of yen)
9MQ3
FY2020/3 ChangeChange FY2019/3Revenue
FY2019/3 FY2020/3
Photo Imaging 90.8 83.0 (7.8) (-8.7%) (4.6) (-5.2%) 203.7 183.5 (20.2) (-10.0%) (13.8) (-6.8%)
Electronic Imaging 26.6 20.7 (5.9) (-21.7%) (5.0) (-18.4%) 70.7 57.7 (13.0) (-18.3%) (10.4) (-14.6%)
Constant-currency basis
FY2020/3 ChangeConstant-
currency basis
Change FY2019/3FY2019/3 FY2020/3
Optical Devices 10.5 8.3 (2.2) (-20.2%) (1.9) (-17.3%) 29.4 24.9 -4.5 (-15.2%) (3.8) (-12.8%)
Optical Device &Electronic Imaging
Products37.1 29.0 (8.1) (-21.3%) (6.9) (-18.1%) 100.1 82.6 (17.5) (-17.4%) (14.2) (-14.1%)
127.9 112.0 (15.9) (-12.4%) (11.5) (-8.9%) 303.8 266.1 (37.7) (-12.4%) (28.0) (-9.2%)
Note: After elimination of intersegment transactions
(Billions of yen)
9MQ3
Total
Operating Income
26.4 17.3 48.0 27.4
Change Constant-currency basis
(7.6) (-29.0%)
Change
(-34.5%)(9.1)Imaging Solutions
Operating Income[Operating
Margin] FY2019/3 FY2020/3 Constant-currency basis
FY2019/3 FY2020/3
(16.6) (-34.5%)(20.6) (-42.8%)
18
[20.6%] [15.4%] [15.7%] [10.3%]( ) ( )( )( )g g ( ) ( )( ) ( )

Change in Quarterly Earnings byChange in Quarterly Earnings by SegmentSegment
FY2020/3 Q3 AppendixFY2020/3 Q3 Appendix
Change in Quarterly Earnings by Change in Quarterly Earnings by Segment Segment
Imaging SolutionsImaging Solutions (Billions of yen)Imaging SolutionsImaging Solutions (Billions of yen)
Revenue Operating Income
127.9
125.0
Photo Imaging90.8
112.0
26 4
30.0100.0
g g
ElectronicImaging Optical Device &
Electronic Imaging 83 0
83.1
74.679.5
26.4
20.075.0
(20.6%)
Operating Income for Imaging Solutions(O ti M i )
Optical Devices
Products53.8
46.9 53.6
83.0 17.3
10 0
50.0(15.4%)
(Operating Margin)
26.619.9 19.6
17.420.7
3.1
4.5 5.6
10.0
25.0
(3 7%)
(6.0%) (7.1%)
19
10.5 9.4 8.1 8.5 8.30.00.0
18.Q3 18.Q4 19.Q1 19.Q2 19.Q3
(3.7%)
FY2020/3 Q3 AppendixFY2020/3 Q3 Appendix
Earnings forEarnings for FY2020/3 Q3/9 MonthsFY2020/3 Q3/9 Months
Healthcare & Material SolutionsHealthcare & Material Solutions
Earnings for Earnings for FY2020/3 Q3/9 MonthsFY2020/3 Q3/9 Months
(Billions of yen)
119 5 120 4 0 9 3 7 342 9 350 8 7 9 15 8
9M
RevenueFY2019/3 Change
H l h
Q3
Change Constant-currencybasis
Constant-currencybasis
FY2020/3FY2020/3 FY2019/3
119.5 120.4 0.9 (+0.8%) 3.7 (+3.2%) 342.9 350.8 7.9 (+2.3%) 15.8 (+4.6%)
Display Materials 26.3 21.5 (4.8) (-18.4%) (4.8) (-18.4%) 77.0 67.7 (9.3) (-12.1%) (9.3) (-12.1%)
Industrial ProductsElectronic Materials
Fine Chemical46.7 44.7 (2.0) (-4.3%) (0.6) (-1.4%) 134.4 129.9 (4.5) (-3.3%) (1.5) (-1.1%)
Highly Functional
Healthcare
Highly FunctionalMaterials 73.0 66.2 (6.8) (-9.4%) (5.4) (-7.5%) 211.4 197.6 (13.8) (-6.5%) (10.8) (-5.1%)
9.2 9.2 0.0 (+0.1%) 0.4 (+4.2%) 27.2 32.4 5.2 (+19.0%) 6.0 (+21.9%)
57.8 52.5 (5.3) (-9.4%) (3.6) (-6.4%) 176.4 159.5 (16.9) (-9.6%) (12.2) (-7.0%)
0.4 0.2 (0.2) (0.2) 1.0 0.9 (0.1) (0.1)
Recording Media
Others
Graphic Systems/Inkjet
( ) ( ) ( ) ( )
259.9 248.5 (11.4) (-4.4%) (5.1) (-2.0%) 758.9 741.2 (17.7) (-2.3%) (1.3) (-0.2%)
Note: After elimination of intersegment transactions
(Billions of yen)
9MOperating Income
Total
Q3
15.0 8.9 17.4 20.0[12.5%] [7.3%] [5.1%] [5.7%]
32 5 25 8 70 0 70 8Healthcare & Material (6 7)
(6.1)
Ope at g co e[Operating Margin] FY2019/3
Healthcare
Constant-currencybasis
(-41.3%) (6.1) (-41.3%)
FY2020/3 Change
(5 8)
Change
(+14.2%)
Constant-currencybasis
4.4 (+24.6%)
FY2019/3 FY2020/3
2.6
0 8 4 6
20
32.5 25.8 70.0 70.8[12.5%] [10.4%] [9.2%] [9.6%]
Healthcare & MaterialSolutions (6.7) (-20.7%) (5.8) (-17.9%) 0.8 (+1.1%) 4.6 (+6.5%)

Change in Quarterly Earnings byChange in Quarterly Earnings by SegmentSegment
FY2020/3 Q3 AppendixFY2020/3 Q3 Appendix
Healthcare & Material SolutionsHealthcare & Material Solutions
Change in Quarterly Earnings by Change in Quarterly Earnings by Segment Segment
(Billions of yen)Revenue
Operating Income
259 9
280.1265.1
Display Materials
Healthcare
119.5 141.4
259.9
227.6
248.532.5
27.630.0
250.0
(12.5%)
Recording Media
Industrial ProductsElectronic MaterialsFine Chemical
104.1
126.3120.426.1
25.8
20.0150.0
200.0 (9.9%)
(9.9%)
(10.4%)
Graphic SystemsInkjet
Recording Media
Oth46.7 45.4
41.244.0
44.7
26.3 21.2
20.825.4
21.5
18.9
100.0
(8.3%)
Operating Income for Healthcare & Material
Others
57.8 60.3 51.5 55.5 52.5
9.2 11.69.7
13.5 9.2
41.210.0
50.0
21
Solutions(Operating Margin)0.00.0
18.Q3 18.Q4 19.Q1 19.Q2 19.Q3
FY2020/3 Q3 AppendixFY2020/3 Q3 Appendix
Earnings forEarnings for FY2020/3 Q3/9 MonthsFY2020/3 Q3/9 Months
Document SolutionsDocument Solutions
Earnings for Earnings for FY2020/3 Q3/9 MonthsFY2020/3 Q3/9 Months
(Billions of yen)
Revenue
9MQ3
Constant-currencyb i
Change Constant-currencyb i
FY2019/3 FY2020/3 ChangeFY2019/3FY2020/
3
Office Printers 31.5 29.0 (2.5) (-8.1%) (1.9) (-5.9%) 94.2 89.1 (5.1) (-5.4%) (4.0) (-4.2%)
139.3 133.4 (5.9) (-4.3%) (3.2) (-2.3%) 425.6 406.5 (19.1) (-4.5%) (12.9) (-3.0%)Office Products & Printers
basisbasis3
29.1 29.6 0.5 (+2.0%) 1.2 (+4.4%) 90.7 88.4 (2.3) (-2.5%) (0.4) (-0.4%)
60.0 65.2 5.2 (+8.8%) 6.4 (+10.8%) 184.3 201.8 17.5 (+9.5%) 21.1 (+11.5%)
10.9 7.6 (3.3) (2.8) 36.5 24.4 (12.1) (11.1)
Production Services
Solutions & Services
Others
239.3 235.8 (3.5) (-1.5%) 1.6 (+0.6%) 737.1 721.1 (16.0) (-2.2%) (3.3) (-0.5%)
Note: After elimination of intersegment transactions
(Billions of yen)
9M
Total
Q3 9M
23.6 25.6 66.9 80.5
Constant-currencybasis
ChangeFY2019/3FY2020/
3
17.3 (+25.8%)13.6 (+20.3%)
Operating Income[Operating Margin]
Document Solutions 2.9 (+12.2%)(+8.1%)2.0
FY2019/3FY2020/
3Change
Q3
Constant-currencybasis
22
[9.9%] [10.9%] [9.0%] [11.2%]

Change in Quarterly Earnings byChange in Quarterly Earnings by SegmentSegment
FY2020/3 Q3 AppendixFY2020/3 Q3 Appendix
Document SolutionsDocument Solutions (Billions of yen)
Change in Quarterly Earnings by Change in Quarterly Earnings by Segment Segment
268.5
252.2
Revenue Operating Income
143 5
239.3 233.1 235.8
40.0200.0 Office Products & Office Printers
139.3
143.5
133.7
139.4133.4
29.533.2
(11.0%)
(13.2%)
Office Products & Office Printers
Production Services
Solutions & Services
29.1
32.6
27.331.5
29.6
23.6 21.7
25.6
20.0100.0 (9.9%)(9.3%)
(10.9%)
Solutions & Services
Operating Income for Doc ment Sol tions
Others
60.076.9
62.5 74.1 65.2
Operating Income for Document Solutions(Operating Margin)
0.00.018.Q3 18.Q4 19.Q1 19.Q2 19.Q3
23
RevenueRevenue by Destinationby Destination
FY2020/3 Q3 AppendixFY2020/3 Q3 Appendix
Revenue Revenue by Destinationby Destination
(Billions of yen)
Ratio (%) Ratio (%)
FY2020/3 9MChange
FY2019/3 9M
40.3% 724.7 42.3% 730.5 5.8 (+0.8%)
19 6% 353 7 18 6% 322 9 (30 8) (-8 7%)
Japan
The Americas 19.6% 353.7 18.6% 322.9 (30.8) ( 8.7%)
13.2% 237.1 13.1% 225.9 (11.2) (-4.7%)Europe
The Americas
China 12.6% 226.0 12.1% 209.5 (16.5) (-7.3%)
Asia and others 26.9% 484.3 26.0% 449.1 (35.2) (-7.3%)
Overseas 59.7% 1,075.1 57.7% 997.9 (77.2) (-7.2%)
100 0% 1 799 8 100 0% 1 728 4 (71 4) ( 4 0%)C lid t d t t l
24
100.0% 1,799.8 100.0% 1,728.4 (71.4) (-4.0%)Consolidated total

CapitalCapital ExpenditureExpenditure Depreciation & AmortizationDepreciation & Amortization
FY2020/3 Q3 AppendixFY2020/3 Q3 Appendix
58.7
Capital Capital Expenditure, Expenditure, Depreciation & AmortizationDepreciation & AmortizationCapital Expenditure (9M) (Billions of yen)
Q3 Full year9 months
6.2 6.7
8.7
46.3 46.5 FY2018/3
FY2019/3
FY2020/3
FY2018/3
FY2019/3
FY2020/3
FY2018/3
FY2019/3
FY2020/3(forecast)
Imaging 2.4 1.6 2.9 6.2 6.7 8.7 9.4 10.6Healthcare & Material 10 2 11 2 14 6 27 3 30 0 41 2 42 7 50 5
11 9 7 9
27.3 30.041.2
Healthcare & Material 10.2 11.2 14.6 27.3 30.0 41.2 42.7 50.5Document 3.7 3.2 3.1 11.9 7.9 7.7 13.8 11.7Corporate 0.4 1.5 0.3 0.9 1.9 1.1 1.6 2.6
Capex * 16.7 17.5 20.9 46.3 46.5 58.7 67.5 75.4 90.0
95.3 95.691 8
11.9 7.9 7.7
FY2018/3
FY2019/3
FY2020/3
Depreciation & Amortization (9M)
Imaging 3.3 3.6 3.8 9.8 10.6 10.8 13.3 14.1Healthcare & Material 14.6 15.9 16.9 42.8 45.6 47.4 57.5 63.1Document 15.3 12.2 10.0 40.9 37.7 31.8 54.7 50.1Corporate 0.5 0.7 0.6 1.8 1.7 1.8 2.1 2.6
42.8 45.647.4
9.8 10.610.8
91.8 p 0.5 0.7 0.6 1.8 1.7 1.8 2.1 2.6
33.7 32.4 31.3 95.3 95.6 91.8 127.6 129.9 128.0
16.6 17.5 17.8 49.4 50.9 51.2 66.5 70.9 Depreciation *
Depreciation& Amortization
40.9 37.7 31.8
*Note : Figures do not include amounts for rental equipmenthandled by the Document Solutions segment and others.
Imaging
DocumentCorporate
Healthcare & Material
N t
FY2018/3
FY2019/3
FY2020/3
25
p
R&D Expenses SG&A ExpensesR&D Expenses SG&A Expenses
FY2020/3 Q3 AppendixFY2020/3 Q3 Appendix
R&D Expenses, SG&A ExpensesR&D Expenses, SG&A Expenses
(Billi f )
R&D Expenses (9M)
(Billions of yen)
FY2019/3 FY2020/3 FY2019/3 FY2020/3 FY2019/3FY2020/3(forecast)
Q3 9 months Full Year
115.8 118.0
Imaging 2.3 2.4 7.2 7.9 9.9
Healthcare &Material
15.9 16.6 50.9 51.4 69.850.9 51.4
7.2 7.9
Document 12.0 12.6 39.2 38.4 51.2
Corporate 6.1 6.7 18.5 20.3 25.2
R&D Expenses 36.3 38.3 115.8 118.0 156.1 155.039 2 38 4
50 9
5.8% 6.4% 6.4% 6.8% 6.4% 6.5%
156.8 151.6 480.3 453.5 631.6
<ratio to revenue>
SG&A Expenses18.5 20.3
39.2 38.4
ImagingHealthcare & Material
25.0% 25.4% 26.7% 26.2% 26.0% <ratio to revenue>FY2019/3 FY2020/3
26
DocumentCorporate

ExchangeExchange RatesRates Raw Material Prices and Number of EmployeesRaw Material Prices and Number of Employees
FY2020/3 Q3 AppendixFY2020/3 Q3 Appendix
Exchange Exchange Rates, Rates, Raw Material Prices, and Number of EmployeesRaw Material Prices, and Number of Employees
Exchange Rates (yen)Exchange Rates (yen)
Q1 Q2 Q3 9M Q4 Full year Q1 Q2 Q3 9M Full year(forecast)
US$/¥ 109 111 113 111 110 111 110 107 109 109 109
FY2020/3FY2019/3
US$/¥ 109 111 113 111 110 111 110 107 109 109 109
€/¥ 130 130 129 129 125 128 123 119 120 121 121
Raw Material Prices (Average) (¥1,000/kg)
Q1 Q2 Q3 9M Q4 Full year Q1 Q2 Q3 9M Full year(forecast)
FY2020/3FY2019/3
Silver 58 54 53 55 55 55 53 57 60 57 59
Number of EmployeesNumber of Employees2018.Dec 2019.Mar 2019.Jun 2019.Sep 2019.Dec
74,425 72,332 72,358 72,842 73,092Consolidated Total
27
Forecast for Forecast for FY2020/3FY2020/3
Consolidated Financial Forecast for Consolidated Financial Forecast for FY2020/3 FY2020/3 by by Segment Segment (as of (as of Feb. 06, 2020)Feb. 06, 2020)
(Billions of yen)
Revenue FY2019/3 FY2020/3Change from
previousFY2020/3
( i f t)Change from
i
386.9 370.0 350.0 (36.9) (-9.5%) (20.0)
Healthcare 484.3 520.0 505.0 20.7 (+4.3%) (15.0)
Revenue FY2019/3 FY2020/3
Imaging Solutions
previousforecast
(previous forecast) previous year
Material 554.7 545.0 530.0 (24.7) (-4.5%) (15.0)
1,039.0 1,065.0 1,035.0 (4.0) (-0.4%) (30.0)
1,005.6 1,000.0 985.0 (20.6) (-2.0%) (15.0)
Healthcare & MaterialSolutions
Document Solutions ( ) ( )
2,431.5 2,435.0 2,370.0 (61.5) (-2.5%) (65.0)Note: After elimination of intersegment transactions.
Total
Operating Income FY2019/3 FY2020/3Change from
previousFY2020/3
(pre io s forecast)Change from
i
51.1 40.0 35.0 (16.1) (-31.5%) (5.0)
Healthcare 33.3 48.0 43.0 9.7 (+29.1%) (5.0)
Imaging Solutions
p g pforecast
(previous forecast) previous year
Material 64.3 71.0 61.0 (3.3) (-5.1%) (10.0)
97.6 119.0 104.0 6.4 (+6.6%) (15.0)
96.4 119.0 119.0 22.6 (+23.4%) 0.0
Healthcare & MaterialSolutions
Document Solutions
28
(35.3) (38.0) (38.0) (2.7) - 0.0
209.8 240.0 220.0 10.2 (+4.8%) (20.0)Total
Corporate Expenses & Eliminations

Shareholder ReturnsShareholder Returns
Forecast for FY2020/3Forecast for FY2020/3
■DividendDividend for FY2020/3 is planned at ¥95 per share increased by ¥15 from the
Shareholder ReturnsShareholder Returns
¥95
Dividend for FY2020/3 is planned at ¥95 per share, increased by ¥15 from the previous fiscal year. The dividend increase is planned for 10 consecutive years.
¥70¥75
¥80
¥95
¥50
¥60 ¥65
¥70
¥25 ¥30
¥35 ¥40
FY'10/3 FY'11/3 FY'12/3 FY'13/3 FY'14/3 FY'15/3 FY'16/3 FY'17/3 FY'18/3 FY'19/3 FY'20/3(forecast)
29
PipelinePipeline (as of Feb 06 2020)(as of Feb 06 2020)
FY2020/3 Q3 AppendixFY2020/3 Q3 Appendix
Pipeline Pipeline (as of Feb. 06, 2020)(as of Feb. 06, 2020)
Development code
Therapeutic category Formulation Region Development stagecode
T-705Anti-influenza drug Oral
Japan Approved
U.S.A. PⅢ
Severe fever with thrombocytopenia syndrome virus drug Oral Japan PⅢ
T-3811 Quinolone synthetic antibacterial drug Oral China Approved
T-817MAAlzheimer's disease drug
Oral
U.S.A. PⅡ
Japan PⅡ
Europe PⅡ
Functional recovery after stroke (Promoting the effect of rehabilitation) Japan PⅡ
T-4288 New fluoroketolide antibacterial drug Oral JapanSubmitted an application for permission
FF-10501 Myelodysplastic syndrome drug OralJapan PⅠ
U.S.A. PⅡU.S.A. PⅡ
FF-10502 Advanced/recurrent solid cancer drug Injection U.S.A. PⅡ
FF-21101 Advanced/recurrent solid cancer drug (Armed antibody) Injection U.S.A. PⅡ
F-1311 Diagnostic drug for prostate cancer (Radiopharmaceuticals) Injection Japan PⅡ
Bio
FF-10101 Acute Myeloid Leukemia (AML) drug Oral U.S.A. PⅠ
F-1515 Anti-tumor (neuroendocrine tumors) drug (Radiopharmaceuticals) injection Japan PⅠ/Ⅱ
FF-10832 Advanced solid cancer drug (Gemcitabine liposome) Injection U.S.A. PⅠ
30303030
FF-10850 Advanced solid cancer drug (Topotecan liposome) Injection U.S.A. PⅠ
F-1614 Anti-tumor (pheochromocytoma) drug (Radiopharmaceuticals) Injection Japan PⅡ
T-2307 was licensed-out to Appili Therapeutics in November 2019.

AppendixAppendix
FY2020/3 Q3 AppendixFY2020/3 Q3 Appendix
AppendixAppendix
FUJIFILM HoldingsFUJIFILM Holdings -- Investor RelationsInvestor RelationsFUJIFILM Holdings FUJIFILM Holdings Investor RelationsInvestor Relationshttps://ir.fujifilm.com/en/investors.html
FUJIFILM HoldingsFUJIFILM Holdings IntegratedIntegrated ReportReport 20192019
IR Events MaterialsIR Events Materials
FUJIFILM Holdings FUJIFILM Holdings Integrated Integrated Report Report 20192019https://ir.fujifilm.com/en/investors/ir-materials/integrated-report.html
IR Events MaterialsIR Events Materialshttps://ir.fujifilm.com/en/investors/ir-materials/presentations.html
・ Business presentation materials-Jan. 2019 Business Presentation for Pharmaceuticals/Bio CDMO/Regenerative Medicine Business
Business Activities of FUJIFILM GroupBusiness Activities of FUJIFILM Group
-Feb. 2019 ESG Briefing-Nov. 2019 Bio CDMO Business Briefing
31
Business Activities of FUJIFILM GroupBusiness Activities of FUJIFILM Group
Global Branding Campaign: NEVER STOPGlobal Branding Campaign: NEVER STOP
https://ir.fujifilm.com/en/investors/value/business.html
Global Branding Campaign: NEVER STOPGlobal Branding Campaign: NEVER STOPhttps://brand.fujifilm.com/neverstop/en/
At F jifil ti l i ti tiAt Fujifilm, we are continuously innovating — creatingnew technologies, products and services that inspire
and excite people everywhere.Our goal is to empower the potential and expand
the horizons of tomorrow’s businesses and lifestyles.
Corporate Communication Office, Corporate Planning Div.
https://holdings.fujifilm.com/en