earnings management and deferred tax
TRANSCRIPT

This article was downloaded by: [University of Nebraska, Lincoln]On: 01 October 2013, At: 00:52Publisher: RoutledgeInforma Ltd Registered in England and Wales Registered Number: 1072954 Registered office:Mortimer House, 37-41 Mortimer Street, London W1T 3JH, UK
Accounting and Business ResearchPublication details, including instructions for authors and subscriptioninformation:http://www.tandfonline.com/loi/rabr20
Earnings management and deferred taxKevin Holland a & Richard H. G. Jackson ba School of Management and Business, University of Wales, Aberystwythb School of Business and Economics, University of ExeterPublished online: 28 Feb 2012.
To cite this article: Kevin Holland & Richard H. G. Jackson (2004) Earnings management and deferred tax,Accounting and Business Research, 34:2, 101-123, DOI: 10.1080/00014788.2004.9729956
To link to this article: http://dx.doi.org/10.1080/00014788.2004.9729956
PLEASE SCROLL DOWN FOR ARTICLE
Taylor & Francis makes every effort to ensure the accuracy of all the information (the “Content”)contained in the publications on our platform. However, Taylor & Francis, our agents, and ourlicensors make no representations or warranties whatsoever as to the accuracy, completeness, orsuitability for any purpose of the Content. Any opinions and views expressed in this publicationare the opinions and views of the authors, and are not the views of or endorsed by Taylor &Francis. The accuracy of the Content should not be relied upon and should be independentlyverified with primary sources of information. Taylor and Francis shall not be liable for anylosses, actions, claims, proceedings, demands, costs, expenses, damages, and other liabilitieswhatsoever or howsoever caused arising directly or indirectly in connection with, in relation to orarising out of the use of the Content.
This article may be used for research, teaching, and private study purposes. Any substantialor systematic reproduction, redistribution, reselling, loan, sub-licensing, systematic supply, ordistribution in any form to anyone is expressly forbidden. Terms & Conditions of access and usecan be found at http://www.tandfonline.com/page/terms-and-conditions
Accounting ond Buririrss Re.wnrcli, Vol. 34. No. 2. pp. IIII-123. 21104 101
Earnings management and deferred tax Kevin Holland and Richard H. G. Jackson*
Abstract-This study analyses the deferred tax provisions of firms during a period in which the firms' incentive to manage earnings may have been be particularly strong and in which firms made disclosures in relation to partial deferred tax provisions which revealed readily their under- or over-provision of deferred tax. Using a sample of 58 firms for the two years 1991 and 1992, the magnitude of the under- or over-provisions found is economically sig- nificant, amounting, on average, to around 20% of the maximum potential deferred tax liability and, more impor- tant, 9% of profit or loss before tax. This paper takes such under- and over-provision of deferred tax and investigates its relationship with a number of posited explanatory variables - as derived and developed from the earnings man- agement literature. In a multivariate setting it is found that the level of under-/over-provision is related to the fol- lowing characteristics: whether the firm is reporting a pre-tax loss or a pre-tax profit; the extent of adjustment to prior year tax; and the level of surplus advance corporation tax (ACT). These findings support a general profit- smoothing hypothesis, and the finding in relation to ACT suggests that firms take an overall view in determining the required level of provision in order to manage earnings, rather than concentrating upon particular line items. There is also weaker evidence of a relationship between the level of under-lover-provision and firms' levels of gear- ing and effective tax rates.
1. Introduction While recent disclosures concerning Enron and WorldCom provide stark evidence of the ability and willingness of managers to manipulate or mis- state financial accounting items, the academic lit- erature has not, until recently, shown earnings management to have had a significant effect on re- ported earnings (Dechow and Skinner, 2000). This failing has been attributed in part to methodologi- cal issues and also to a lack of focus on capital market incentives to manage earnings.
This paper makes three main contributions to the literature, using data for UK firms. First, in em- ploying a novel methodology, the results have the potential to corroborate and strengthen findings based on existing methodology. Second, the paper investigates earnings management by focussing upon deferred tax provisioning - an area of finan- cial accounting practice which is both relatively
* The authors are, respectively, Sir Julian Hodge Professor of accounting and finance at the School of Management and Business, University of Wales, Aberystwyth, and senior lec- turer in accounting and finance, School of Business and Economics, University of Exeter. The authors would like to thank John Cable, Dan S. Dhaliwal, Christi A Gleason, David Gwilliam, Lil Mils, Kaye J. Newberry, Jeffrey W Schatzberg, Bill Schwartz, seminar participants at the School of Management and Business, University of Wales, Aberystwyth, UK and the Department of Accounting, University of Arizona, USA, the Managing Editor (Ken Peasnell) and an anonymous reviewer for their helpful comments and suggestions; Wendy Beekes and Eira Stokes for their invaluable assistance in data collection; and the Centre for Business Performance, Institute of Chartered Accountants in England and Wales for their financial support. Correspondence should be addressed to Kevin Holland, School of Management and Business, Cledwyn Building, University of Wales, Aberystwyth SY23 3DD, Wales. E-mail [email protected]
The final version of this paper was accepted in October 2003.
complex and highly subjective, and in which, therefore, the opportunity to manage earnings is correspondingly heightened. Although the current UK financial reporting standard covering deferred taxation, Financial Reporting Standard 19: Deferred Tax' (FRS19) allows some discretion in arriving at the required deferred tax provision, the latitude now permissible is considerably less than that which was previously available under Statement of Standard Accounting Practice 15: Accounting for Deferred Tax2 (SSAPIS) -the pro- visions of which set the UK apart as a rare juris- diction in which partial provisioning was widely used.' Consequently, the paper focuses on provi- sions made under SSAPl5. The paper's third main contribution derives from the particular setting adopted, which allows for the testing of new hy- potheses relating to earnings management and the influence of tax reporting considerations that are still relevant post SSAP15.
The research design utilises information from published financial statements in order to identify the occurrence and extent of under- and over-pro- viding for deferred taxation. At any point there may be a difference between the amount of the de- ferred tax provision as computed on the basis of partial provision, and the 'maximum potential pro-
' FRS 19, Accounting Standards Board. Issued December 2000, effective in respect of years ending on or after 23 January 2002.
SSAPl5, Accounting Standards Committee, adopted by the Accounting Standards Board. Issued October 1978, re- vised May 1985, amended October and December 1992.
In contrast, for example, to the position in the United States, Japan, Australia, France, Germany, Italy and Canada (Choi, 1991); and in contrast, additionally, to the position in the Netherlands and Sweden (Archer et al., 1995).
Dow
nloa
ded
by [
Uni
vers
ity o
f N
ebra
ska,
Lin
coln
] at
00:
52 0
1 O
ctob
er 2
013

102
vision’ (i.e., computed on the full provision basis) - this difference being the so-called amount of ‘unprovided’ deferred tax. Under four assumptions (which are discussed in the later section upon re- search design and hypotheses), the unprovided de- ferred tax as at the beginning of the forecasting period should equal the maximum potential de- ferred liability subsequently disclosed at the end of the forecasting period. The Appendix demon- strates this relationship n~merically.~ Any excess (deficit) of unprovided deferred tax as at the be- ginning of the forecasting period over (under) the maximum potential deferred tax liability subse- quently disclosed at the end of the forecasting pe- riod can be interpreted as an under-provision (over-provision) as at the beginning of the fore- casting period. Thus, the researcher may derive a measure of undedover-provision from publicly available information. The paper links such undedover-provision with incentives to manage earnings, whilst recognising (and controlling for) the possibility that undedover-provisioning may, to some extent, result from forecasting error inde- pendent of earnings management. The relationship of undedover-provisioning with a number of firm- specific variables, posited to be indicative of propensity to manage earnings, is investigated - the variables employed being a combination of those used in previous studies and a number de- veloped in the context of this paper.
The analysis finds that the majority of firms over-provided for deferred tax during the period under review, on average by 9% of pre-tax profits in 1991, 8% in 1992. Of the sub-sample of firms which under-provided, the amounts of under-pro- vision represented 9% and 52% of pre-tax profits. Drawing correct inferences concerning earnings management incentives depends upon controlling for forecasting difficulty, and upon the appropri- ateness of the proxy employed in this respect. The choice of this proxy is considered in detail under Section 3.2. Having controlled for variation in the predictability of firms’ earnings, a proxy for fore- casting difficulty, relationships between the level of under- and over-provision and the following factors, consistent with an earnings management motivation, are found: whether the company re- ports a pre-tax profit or a pre-tax loss; the level of adjustment to prior year tax; and the level of sur- plus advance corporation tax (ACT). There is also weaker evidence of gearing and relative effective tax rate burdens being associated with the level of undedover-provision.
The remainder of the paper proceeds as follows: the next section covers prior research and account- ing for deferred tax; the third section sets out the research design and hypotheses; the fourth section presents and discusses results; and the final section summarises and concludes.
ACCOUNTING AND BUSINESS RESEARCH
2. Prior research and accounting for deferred taxation This section contains a discussion of the extant lit- erature upon earnings management in general; a discussion of the literature upon earnings manage- ment and deferred tax; and a summary of the fi- nancial accounting and reporting requirements in respect of deferred tax. The discussion of the gen- eral earnings management literature focuses on two issues: first, it summarises contrasting ap- proaches to the detection and quantification of earnings management, and motivates the approach adopted in this paper; and second, it sets out the various settings and motivations for earnings man- agement which have been examined in recent re- search, thereby providing a context for the development of hypotheses in the next section.
2.1. Methodological approaches in the study of earnings management
Three distinct approaches are seen within the earnings management literature (McNichols, 2000).5 Initial studies focused on decomposing ob- served total accruals6 into their non-discretionary (unmanaged) and discretionary (managed) ele- ments. Most studies in this area are related to the Jones (1991) time-series model,’ which, despite its popularity, has methodological limitations. Dechow et al. (1995) evaluate various models in- cluding the Jones and modified Jones models. Although all the models they considered produce reasonably well-specified tests, the authors con- clude that the power of the tests is relatively low. Similarly, Young (1999) assessed the relative per- formance of a number of alternative models and concluded that the level of measurement error in decomposing total accruals is significant.8 Testing
The Appendix uses the example of accelerated capital al- lowances, but the relationship demonstrated holds for a wider variety (and mix) of timing differences.
In the light of recent extensive surveys and discussions of the earnings management literature, this section focuses only on those studies relevant to the approach adopted in this paper. Readers requiring a wider discussion of research design issues are referred to Dechow and Skinner (2000), McNichols (2000) and Beaver (2002).
The definition of total accruals, varying across a range of studies, has included all of the following: total accruals in- cluding or excluding depreciation; total accruals including or excluding long term accruals; and working capital accruals. ’ The basic methodology is to regress a measure of total ac- cruals as dependent variable upon independent variables de- signed to control for non-discretionary income/expense items, thereby allowing extraction of a measure of discretionary ac- cruals. Developments of this method include cross-sectional and time series approaches.
Young (1999) also tests a number of suggestions for im- proving specification, including the use of additional regres- sors to control for sources of non-discretionary accruals, e.g., cash-flow growth, fixed asset intensity and average fixed asset life.
Dow
nloa
ded
by [
Uni
vers
ity o
f N
ebra
ska,
Lin
coln
] at
00:
52 0
1 O
ctob
er 2
013

Vol. 34. No. 2. 2004
various models in a cross-sectional form, Peasnell et al. (2000a) corroborate US findings regarding model specification. They conclude, in addition, that the most appropriate model in terms of power is setting specific.
Partly in response to the foregoing general con- cerns, a second approach has developed in which investigation is focused upon specific line items rather than on examination of total accrual^.^ In fo- cusing on specific profit and loss items which, by design, are those of the more subjective areas of in- come determination, this second approach provides a setting in which the expectation of detection of earnings management is higher. This approach has the additional advantage that, in using item-specif- ic variables, the precision with which the unman- aged or non-discretionary variables are measured is increased (Beaver, 2002). The variety of profit and loss items examined by this approach is discussed in the next sub-section. The approach, however, al- beit focused on the more subjective areas of finan- cial reporting, does not of itself necessarily result in examination of settings where incentives to man- age earnings are the strongest.
A third approach addresses this concern by con- centrating upon settings where ex ante there ap- pear to be strong incentives to meet ‘critical’ or ‘target’ earnings figures. This approach is motivat- ed by the belief that clearer insights concerning in- centives to manage earnings will be obtained by examining firms’ behaviour in particular contexts. The influence of capital markets on firms’ per- formance and, increasingly, on levels of manageri- al remuneration provides settings where strong incentives to manage earnings may be anticipated (Dechow and Skinner, 2000). Studies in this area adopt a common approach in focusing on the dis- tribution of earnings around a target level of prof- it, whether that target be the previous period’s level of profit, zero profit, or the level of analysts’ forecasts. The research is based on an expectation, absent earnings management, of unbiased distribu- tions of firm-reported profits around any particular level of earnings. Consequently, the method is not dependent upon first distilling non-discretionary from total accruals. It does not, however, offer in- sights concerning the mechanisms by which the desired level of earnings is achieved.
2.2. Settings for study of earnings management Investigation was initially upon incentives to
manage earnings as implied by the costly contract- ing literature (Watts and Zimmerman, 1978).1° The focus of these studies is upon contractual settings between firms’ managers and suppliers of debt (leverage hypothesis), and between managers and shareholders in respect of the supply of manage- ment services (bonus plan hypothesis); and also
103
firms’ managers and the state (size hypothesis). While early hypotheses centred on accounting policy choice, subsequent work investigated earn- ings management within a given set of accounting policies. For example, evidence of earnings man- agement has been detected in the following set- tings (or with the following motivations): high leverage and close proximity to debt covenant violations (DeFond and Jiambalvo, 1994); to in- crease accounting based management compensa- tion (Guidry et al., 1999); and circumvention or reduction in the impact of regulation (Collins et al., 1995).
The specific line items which have been exam- ined include bank loan provisions (Liu et al., 1997), insurers’ claim loss provisions (Beaver and McNichols, 1998) and deferred tax valuation al- lowances (Visvanathan, 1998, Miller and Skinner, 1998, and Bauman et al., 2001).1’ In the UK, a re- cent paper upon the valuation relevance of partial provisioning finds evidence which is indicative of earnings management and calls for further re- search upon this issue (Citron, 2001). This view is supported by anecdotal UK evidence found in Curtis (1995), which posits the deferred tax provi- sion as being determined in order to achieve a de- sired effective tax rate.
Studies based on capital market incentives have found evidence of earnings management which appears to be motivated by firms attempting to avoid reporting a loss or a year on year earnings decline (Burgstahler and Dichev, 1997, and Burgstahler, 1997); mitigating the extent of ex- treme financial performance (Guay et al., 1996); smoothing around a target income figure (DeFond and Park, 1997, and Young, 1998); attempting to meet market expectations as proxied by analysts’ forecastsI2 (Degeorge et al., 1999); and increasing earnings in anticipation of a share issue (Rangan, 1998, and Teoh et al., 1998). While the evidence appears compelling, it does not consider the mech- anisms by which capital market considerations in-
While the initial focus on total accruals has been super- seded in studies attempting to discover the extent of earnings management, it is still, however, an appropriate vehicle for ex- amining, for example, the moderating role of governance structures, etc. on the level of earnings management (and in which context it would be inappropriate to focus on a single line item or on a limited number of line items). For a discus- sion of the methodological issues and approaches see Peasnell et al. (2000a).
lo For a full discussion of the costly contracting based earn- ings management research see Healy and Wahlen (1999).
’I Since the valuation allowances issue is specific to the US, it is not considered in detail in this paper. For a review of the associated literature see Bauman et al. (2001).
I 2 It is a moot point as to what or whom is being managed - upon the implicit and explicit contracts between earnings or analysts?
Dow
nloa
ded
by [
Uni
vers
ity o
f N
ebra
ska,
Lin
coln
] at
00:
52 0
1 O
ctob
er 2
013
104 ACCOUNTING AND BUSINESS RESEARCH
fluence firms to managing earnings.
2.3. Accounting f o r deferred taxation In the period under review, UK firms were re-
quired under the provisions of SSAP15 to provide under the liability method to the extent that it was ‘probable that a liability or asset will crystallise’ (SSAP15, para. 25).13 In determining the required provision, firms were required to net off the various effects of each timing difference and only consider the overall position. The Appendix to the SSAP (SSAP15, Appendix, para. 4) states in general that in estimating likely reversals, the forecasting ‘peri- od may be relatively short - say three to five years’. An additional consideration is the SSAP’s provi- sions concerning the interaction between ACT and deferred tax: the deferred tax chargehedit could be influenced by an associated write back/off of ACT
when it is deemed that surplus ACT could be set off against future corporate tax liabilities. l 4
SSAP 15 has now been superseded by FRS19. This standard requires, inter alia, that deferred tax be computed on a full provision basis where pro- vision is required,15 rather than on the partial pro- vision basis formerly required by the SSAP. This prescription as to computation basis would appear, ceteris paribus, to be likely to reduce the opportu- nity for earnings management via the deferred tax charge. Deferred tax, however, remains a relative- ly complex area of accounting: the new standard allows, indeed requires, firms to form expectations concerning their future, apply judgment and make choices in accounting for deferred tax. The im- pacts of adoption of FRS19, including any impact upon earnings management via the deferred tax charge, would appear to be an important area for future research.
l 3 As a result, however, of a 1992 amendment relating to pensions and other post-retirement benefits, firms could use the ‘same recognition criteria for the deferred tax implica- tion of pensions and other post-retirement benefits as in ac- counting for those obligations to provide those benefits’ (SSAP 15, para. 12A). i.e., use of a full provision basis was an option.
l4 Under the UK imputation system of taxation during the period under review, when a company paid a dividend, ad- vance corporation tax (ACT) equal to the product of the lower rate of income tax and the gross dividend was due to the Inland Revenue. Shareholders received the net dividend, equal to the gross dividend less ACT paid (i.e., a net divi- dend plus an imputed tax credit, the sum of which equalled the gross dividend). The ACT represented a prepayment of corporation tax by the company, available for offset against the company’s assessed corporation tax liability for the pe- riod. This offset, however, was limited to the amount of ACT which would have been payable had the company paid a gross dividend equal to its taxable profits for the period. This restriction could lead to firms having ‘surplus’ ACT for a period, for which the required accounting treatment was either carry forward as a tax asset for relief against future periods’ mainstream corporation tax liabilities, if such offset was reasonably expected; or, if the ACT was deemed ir- recoverable, write off through the taxation line in the profit and loss account. ACT written off could, however, be writ- ten back in subsequent periods if its availability for offset against mainstream corporation tax liability was estab- lished. The requirement that ACT be paid in respect of div- idend payments by companies was removed with effect from 6 April 1999, although shareholders are still deemed to receive net dividends with an associated tax credit.
I s The standard is also explicit in its prohibitions as to the types of timing difference upon which deferred tax may not be provided.
I h Since length of forecasting period, not disclosed in fi- nancial statements nor otherwise publicly available, dictates the number of future periods for which expected net timing differences need be considered.
Inevitable in the sense that, given no change in regula- tion and no further action by the firm, the timing difference in respect of each item will necessarily reverse. For exam- ple. reversal of an excess of capital allowances over book depreciation in respect of an asset is inevitable, but crys- tallisation of a held over gain on an asset is not inevitable (in as much as crystallisation is contingent, inter aha, upon sale of the asset).
3. Research design and hypotheses 3.1, Measurement of earnings management under the partial provision basis
Under four assumptions (which follow), the un- provided deferred tax as at any balance sheet date would equal the maximum potential deferred tax at the end of the forecasting period, since the net tim- ing differences assessed at the beginning of the forecasting period as being unlikely to reverse in that period (and only those timing differences) would be left to reverse in subsequent periods. The four assumptions required are: (i) a neutral, bias- free accounting and computation system; (ii) length of forecasting period for deferred tax calculation purposes,16 (iii) perfect foresight at the beginning of the forecasting period; and (iv) provision be made only in respect of timing differences whose reversal is inevitable,I7 i.e., excluding those related to tax on rolled-over or held-over chargeable gains, tax on potential remittances of overseas income, and trading losses or surplus ACT in excess of the maximum amounts which may be off-set. The fourth assumption may be handled by suitable sam- ple selection. With the first three assumptions and with suitable sample selection, therefore:
M P , - P, = MP,,,
where MP, and P, are, respectively, the maximum potential deferred tax and the amount of deferred tax actually provided at time t , and x is the length of the forecasting period. In expression (l) , a deferred tax provision (profit and loss account debit, balance sheet credit) is treated as a positive quantity. This convention carries to expressions (2) and ( 3 ) .
In the real world of potential bias and uncertain- ty, the amount of deferred tax unprovided at time t in excess of the maximum potential deferred tax as at the end of the forecasting period constitutes an
Dow
nloa
ded
by [
Uni
vers
ity o
f N
ebra
ska,
Lin
coln
] at
00:
52 0
1 O
ctob
er 2
013

Vol. 34. No. 2. 2004
under-provision of deferred tax at time t (and the reverse would represent an over-provision):
i (2)
MP, - P, > MP,,! - underprovision ut time t MP, - P, = MP,,, 3 no under or overprovision at time t MP, - P, =z MP,,, - overprovision ut time t
In the following analyses the dependent variable, PD, (provisioning difference at time t ) , is under (over) provision expressed as a percentage of the maximum potential deferred tax liability as at time t .'* This variable must be bounded below by the amount provided expressed as a percentage of the maximum potential deferred tax liability (to en- sure that any excess of originating timing differ- ences over reversals during the forecasting period cannot erroneously inflate the measure of over- provision - since such excess cannot be recognised for financial accounting purposes); and there must be control for the possibility that the maximum potential deferred tax at the end of the forecasting period is, in fact, a debit (thereby ensuring that under-provision plus the actual provision at time t is limited by the maximum potential deferred tax liability at time t ) :
I05
the amount of underlover-provisioning which re- sults from inaccurate forecasting. In the following analysis, therefore, there must be a control for FE. This is achieved by adoption of a control variable, as discussed in Section 3.2.
ifMP,,, < 0 I (3)
The second subscript, x, on PD represents the length of the forecasting period. Increasing positive (negative) values of PD represent higher levels of under (over) provision at time t relative to the max- imum potential deferred tax liability at that time.
We also define a mean of this variable over a forecasting period of x years, to generate an alter- native, aggregate dependent variable as follows:
These variables may be computed readily by ref- erence to figures disclosed in published financial statements.
The dependent variable PD19 is designed to cap- ture earnings management via deferred taxation. In this context intentionality is key, and the possibili- ty that undedover-provisioning is, to some extent, due to inaccurate forecasting (e.g. of capital expen- diture) must be taken into account. The assumption of perfect foresight, therefore, may not be main- tained, and we write:
P D = EM f FE ( 5 ) where EM represents the amount of undedover- provisioning due to earnings management, and FE
3.2. Hypotheses The following alternative hypotheses are de-
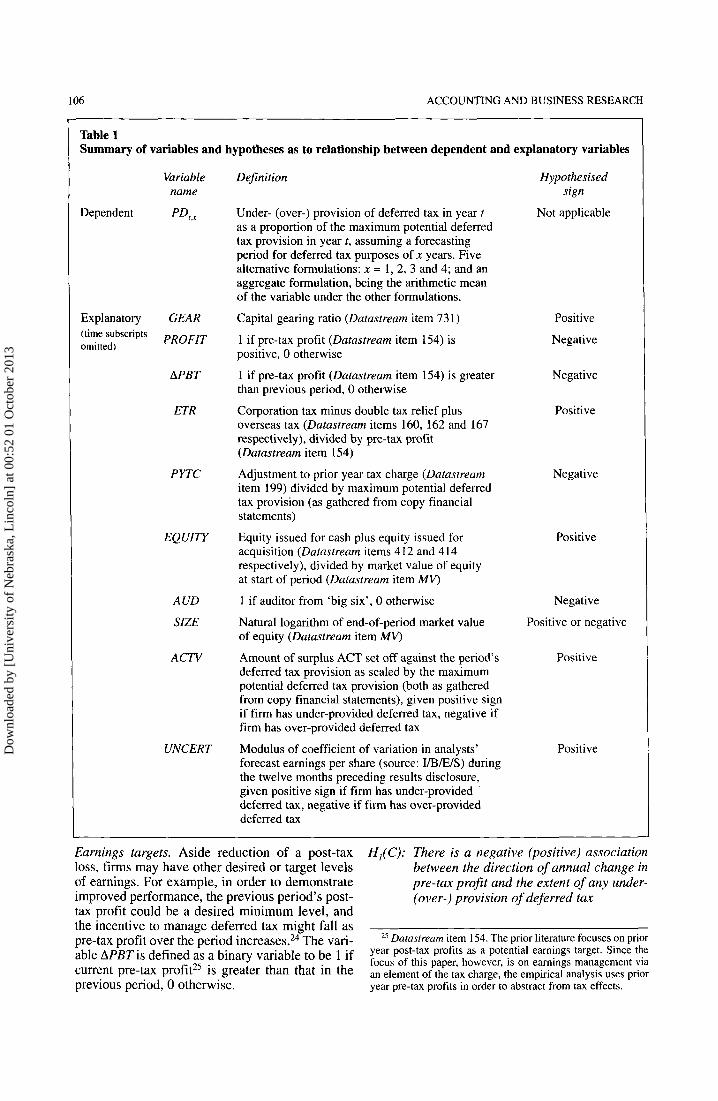
signed to investigate any association between earnings management and a number of posited ex- planatory variables.20 In each case, a brief expla- nation of the hypothesised relationship is given, along with a definition of the relevant explanatory variable.2' Table 1 summarises these variables, definitions and hypotheses.
Gearing. Reduction of the amount of taxation ex- pensed by under-providing deferred tax would re- sult in an improvement in a firm's apparent ability to service its existing level of debt and its ability to attract additional debt on favourable terms. At ex- treme levels of gearing, deliberate under providing could avoid the breach of loan convents. The vari- able GEAR is defined as the firm's capital gearing ratio.22
H,(A): There is a positive (negative) association between level of gearing and the extent of any under- (over-) provision of deferred tax
ProjitabiZity. A firm might attempt to reduce a pre- tax loss by under-providing deferred tax. When a firm is reporting a pre-tax profit this incentive may not exist, and could be replaced by an incentive to reduce profits (i.e., to smooth profits). The variable PROFIT, designed to capture a firm's profit status, is defined as a binary variable to be 1 if the firm's pre-tax profit23 is positive, 0 otherwise.
H,(B): There is a negative (positive) association between prof t status and the extent of any under- (over-) provision of deferred tax
l 8 This variable may capture not only earnings management, but also, potentially, lack of perfect foresight at the beginning of the forecasting period. In the analysis which follows, a proxy for lack of perfect foresight and forecasting error is in- corporated as a control variable (alternative proxies being em- ployed to test results sensitivity in this respect).
l 9 Subscripts omitted for the remainder of Section 3. I . ?"As against the null hypothesis of no relationship in each case.
For ease of reading, variable names are cited in this sec- tion without time subscripts.
?z Dntustream item 73 I . l3 Datustream item 154. 24 Investors' expectations concerning the level of earnings
could be a strong target. It is not possible, however, to formu- late a suitable test variable in this respect since the available proxies are based on earnings after tunation. See for example, the YB/E/S definition of earnings per share. A univariate analysis, however, based on the level of under-/over-provision and a measure of the difference between the mean of analysts' EPS forecasts and reported after tax earnings, is reported in the next section.
Dow
nloa
ded
by [
Uni
vers
ity o
f N
ebra
ska,
Lin
coln
] at
00:
52 0
1 O
ctob
er 2
013
106 ACCOUNTING AND BUSINESS RESEARCH
Table 1 Summary of variables and hypotheses as to relationship between dependent and explanatory variables
Variable name
Dependent PD, ,
Explanatory GEAR (time subscripts omitted) PROFIT
APBT
ETR
PYTC
EQUITY
ACID
SIZE
ACTV
UNCERT
Definition
Under- (over-) provision of deferred tax in year t as a proportion of the maximum potential deferred tax provision in year t , assuming a forecasting period for deferred tax purposes of x years. Five alternative formulations: x = 1, 2, 3 and 4; and an aggregate formulation, being the arithmetic mean of the variable under the other formulations.
Capital gearing ratio (Datastream item 73 1)
1 if pre-tax profit (Datastream item 154) is positive, 0 otherwise
1 if pre-tax profit (Datastream item 154) is greater than previous period, 0 otherwise
Corporation tax minus double tax relief plus overseas tax (Datastream items 160, 162 and 167 respectively), divided by pre-tax profit (Datastream item 154)
Adjustment to prior year tax charge (Datastream item 199) divided by maximum potential deferred tax provision (as gathered from copy financial statements)
Equity issued for cash plus equity issued for acquisition (Datastream items 412 and 414 respectively), divided by market value of equity at start of period (Datastream item MV)
1 if auditor from ‘big six’, 0 otherwise
Natural logarithm of end-of-period market value of equity (Datastream item MV)
Amount of surplus ACT set off against the period’s deferred tax provision as scaled by the maximum potential deferred tax provision (both as gathered from copy financial statements), given positive sign if firm has under-provided deferred tax, negative if firm has over-provided deferred tax
Modulus of coefficient of variation in analysts’ forecast earnings per share (source: IIBEIS) during the twelve months preceding results disclosure, given positive sign if firm has under-provided deferred tax, negative if firm has over-provided deferred tax
Hypo thesised sign
Not applicable
Positive
Negative
Negative
Positive
Negative
Positive
Negative
Positive or negative
Positive
Positive
Earnings targets. Aside reduction of a post-tax loss, firms may have other desired or target levels of earnings. For example, in order to demonstrate improved performance, the previous period’s post- tax profit could be a desired minimum level, and the incentive to manage deferred tax might fall as pre-tax profit over the period increases.24 The vari- able APBT is defined as a binary variable to be 1 if current pre-tax profit25 is greater than that in the previous period, 0 otherwise.
H,(C): There is a negative (positive) association between the direction of annual change in pre-tax p r o j t and the extent of any under- (over-) provision of deferred tax
25 Datastream item 154. The prior literature focuses on prior year post-tax profits as a potential earnings target. Since the focus of this paper, however, is on earnings management via an element of the tax charge, the empirical analysis uses prior year pre-tax profits in order to abstract from tax effects.
Dow
nloa
ded
by [
Uni
vers
ity o
f N
ebra
ska,
Lin
coln
] at
00:
52 0
1 O
ctob
er 2
013
Vol. 34. No. 2. 2004
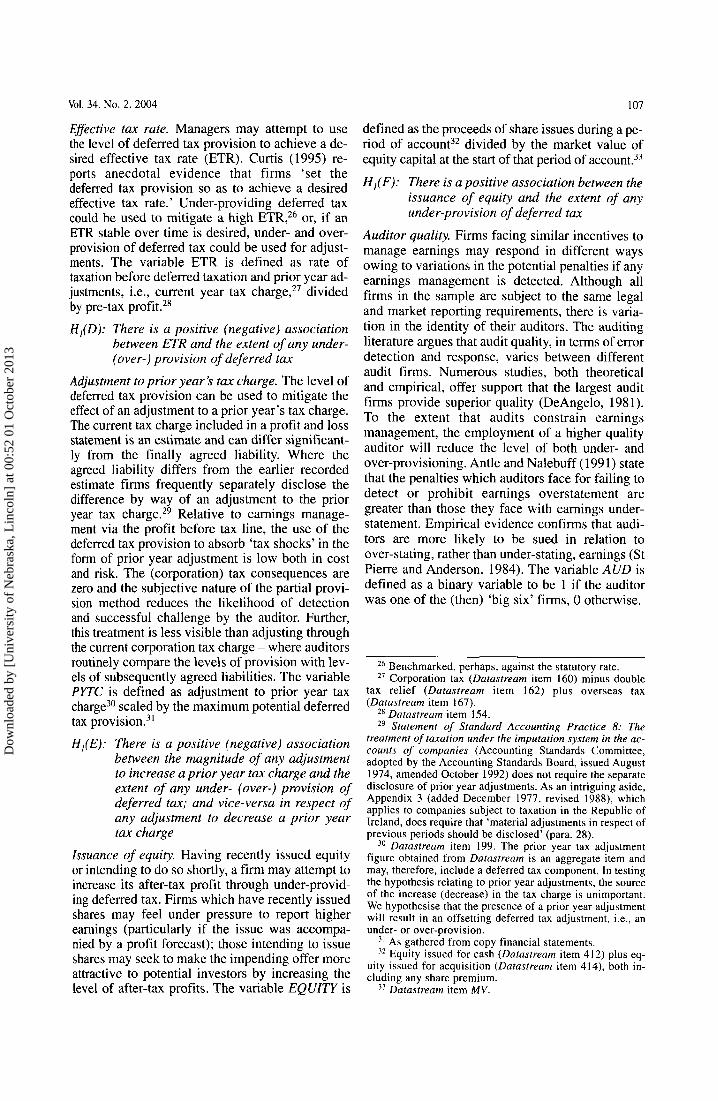
Effective tax rate. Managers may attempt to use the level of deferred tax provision to achieve a de- sired effective tax rate (ETR). Curtis (1995) re- ports anecdotal evidence that firms ‘set the deferred tax provision so as to achieve a desired effective tax rate.’ Under-providing deferred tax could be used to mitigate a high ETR,26 or, if an ETR stable over time is desired, under- and over- provision of deferred tax could be used for adjust- ments. The variable ETR is defined as rate of taxation before deferred taxation and prior year ad- justments, i.e., current year tax charge,27 divided by pre-tax profit.28
H,(D): There is a positive (negative) association between ETR and the extent of any under- (over-) urovision o f deferred tax
107
defined as the proceeds of share issues during a pe- riod of account32 divided by the market value of equity capital at the start of that period of account.33
H,(F): There is a positive association between the issuance of equity and the extent of any under-provision of deferred tax
Auditor quality. Firms facing similar incentives to manage earnings may respond in different ways owing to variations in the potential penalties if any earnings management is detected. Although all firms in the sample are subject to the same legal and market reporting requirements, there is varia- tion in the identity of their auditors. The auditing literature argues that audit quality, in terms of error detection and response, varies between different
I _ “ “ audit firms. Numerous studies, both theoretical
deferred tax provision can be used to mitigate the firms provide superior quality (DeAngelo, 1981). effect of an adjustment to a prior year’s tax charge. To the extent that audits constrain earnings The current tax charge included in a profit and loss management, the employment of a higher quality statement is an estimate and can differ significant- auditor will reduce the level of both under- and ly from the finally agreed liability. Where the over-provisioning. Antle and Nalebuff (1991) state agreed liability differs from the earlier recorded that the penalties which auditors face for failing to estimate firms frequently separately disclose the detect or prohibit earnings overstatement are difference by way of an adjustment to the prior year tax charge.29 Relative to earnings manage- greater than those they face with earnings under-
via the profit before tax line, the use of the statement. Empirical evidence confirms that audi- deferred tax provision to absorb ‘tax shocks’ in the tors are more likely to be sued in relation to form of prior year is low both in cost over-stating, rather than under-stating, earnings (St and risk. The (corporation) tax consequences are Pierre and Anderson, 1984). The variable AUD is
defined as a binary variable to be 1 if the auditor sion method reduces the likelihood of detection was one of the (then) ‘big six’ firms, 0 otherwise. and successful challenge by the auditor. Further, this treatment is less visible than adjusting through the current corporation tax charge - where auditors routinely compare the levels of provision with lev- els of subsequently agreed liabilities. The variable PYTC is defined as adjustment to prior year tax charge30 scaled by the maximum potential deferred tax pro~is ion.~’
Adjustment to prior years tax charge* The level Of and empirical, offer support that the largest audit
and the subjective nature of the partial
26 Benchmarked, perhaps, against the statutory rate. *’ Corporation tax (Datastream item 160) minus double tax relief (Datastream item 162) plus overseas tax
( D $ t ~ ~ s ~ e ~ i t ~ \ 5 4 , 29 Statement of Standard Accounting Practice 8: The
treatment of taxation under the imputation system in the ac- counts of companies (Accounting Standards Committee, adopted by the Accounting Standards Board, issued August 1974, amended October 1992) does not require the separate disclosure of prior year adjustments. As an intriguing aside, Appendix 3 (added December 1977, revised 1988), which applies to companies subject to taxation in the Republic of Ireland, does require that ‘material adjustments in respect of previous periods should be disclosed’ (para. 28) .
3o Datastream item 199. The prior year tax adjustment figure obtained from Datastream is an aggregate item and may, therefore, include a deferred tax component. In testing the hypothesis relating to prior year adjustments, the source of the increase (decrease) in the tax charge is unimportant. We hypothesise that the presence of a prior year adjustment will result in an offsetting deferred tax adjustment, i.e., an under- or over-provision.
There is a positive (negative) association between the magnitude O f any to increase a prior year tax charge and the extent of any under- (over-) provision of deferred tax,. and vice-versa in respect of any adjustment to decrease a prior year tax charge
Issuance of equity. Having recently issued equity or intending to do so shortly, a firm may attempt to increase its after-tax profit through under-provid- ing deferred tax. which have recently issued shares may feel under pressure to report higher earnings (particularly if the issue was accompa- nied by a profit forecast); those intending to issue shares may seek to make the impending Offer more attractive to potential investors by increasing the level of after-tax profits. The variable EQUITY is
31 As gathered from copy financial statements. 32 Equity issued for cash (Datastream item 412) plus eq-
uity issued for acquisition (Datastream item 414), both in- cluding any share premium.
33 Datastream item M V .
Dow
nloa
ded
by [
Uni
vers
ity o
f N
ebra
ska,
Lin
coln
] at
00:
52 0
1 O
ctob
er 2
013

108 ACCOUNTING AND BUSINESS RESEARCH
H , ( G ) : There is u negative association between auditor quality and the extent of any under-provision of deferred tax
forecast earnings per share”’ for the year under re- view (following Baron and Stuerke, 1998), given positive sign for firms which under-provide de-
Firm size. A firm’s size may influence its willing- ness to manage earnings: large firms may have a higher political visibility and, therefore, have a greater incentive to reduce profitability in an at- tempt to reduce the likelihood and effect of politi- cal intervention (Watts and Zimmerman, 1978). Empirical studies of earnings management support this view (for example, Peasnell et al., 2000b). With specific regard to deferred tax, a counter-ar- gument, based on anecdotal evidence, exists: in order to minimise compliance costs with SSAPl5, small firms may provide in full thereby avoiding the exercise of estimating reversals. The variable SIZE is defined to be the natural logarithm of end- of-period market value of eq~ i ty . ’~
H,(H) : There is an association between firm size and the extent of any under- or over-provi- sion of deferred tax
Advance corporation tax. The ultimate profit and loss effect of under- or over-providing deferred tax is dependent upon the amount of advance corpora- tion tax (ACT) available to be set off against the provision. In the absence of surplus ACT, there is a direct pound-for-pound relationship between a change in the level of deferred tax provision and the resulting tax charge. When a firm has surplus ACT, however, the effect of under- or over-provid- ing deferred tax may be ‘dampened’, since change in the level of deferred tax charge creates a pro- portional change in the maximum permissible ACT off-set. It is, therefore, necessary to control for ACT in testing the above hypotheses. The vari- able ACTV is defined to be the amount of surplus ACT set off against the period’s deferred tax pro- vision as scaled by the maximum potential de- ferred tax provision,’s given positive sign for firms which under-provide deferred tax, and negative for those which over-provide deferred tax.
H,{I) : There is a positive association between the existence of surplus ACT and the extent of any under- or over-provision of deferred tax.
Finally, as discussed above, in testing these hy- potheses there must be a control for uncertainty in forecasting since the under- or over-providing for deferred tax may occur simply as a result of un- certainty and errors in forecasting events and not as a result of deliberate management induced bias. In formulating an appropriate control variable, i t is important to attempt to reflect the difficulty which management face in making accurate forecasts, i.e., a measure of variability in expectations, rather than variability in outcomes, would seem best.
The initial control variable,’6 UNCERT, is de- fined to be the coefficient of variation in analysts’
ferred tax, and negative for those which over-pro- vide deferred tax. The use of analysts’ forecasts is motivated by the following link between capital expenditure and accounting earnings.
To the extent that capital markets are allocatively efficient, capital should be available to the poten- tially more profitable user in preference to the less profitable user. Consistent with this expectation, Welch and Wessels (2000) find that stock returns are a significant factor in explaining cross-sectional variation in levels of capital expenditure.38 If ac- counting earnings and stock returns are linked, as suggested by an extensive empirical literature dat- ing back to Ball and Brown (1 968), then uncertain- ty over future accounting earnings transmit into uncertainty over stock returns, in turn implying un- certainty over levels of future capital expenditure. The exact nature of the relationship and the strength of the linkages will depend in part on the extent to which stock returns lead accounting earnings.
3.3. Data collection and sample selection Ernst & Young (2001)39 states that the forecast
period projection for deferred tax calculation pur- poses ‘. . . will obviously become less reliable the further into the future it goes, and the period which may be forecast with a reasonable degree of accu- racy may be no more than two years.’; and the original SSAPl5 cited ‘normally three years’ con- cerning the forecasting period. The longer the forecasting period, ceteris paribus, the greater the opportunity to engage in un-penalised earnings management, given the greater the opportunity to disguise (or spuriously defend) such activity in terms of ‘forecasting problems’. Therefore, it was desired to measure PD,, with respect to a forecast- ing period, x, ranging from one year to four years. It was further desired to be able to perform analy- sis based on PD,,, at two successive year-ends. Thus, complete deferred tax data was required in respect of six successive years for each firm.
An initial sample of every one in three firms was drawn from the list of firms quoted on the London stock exchange as at 31 December 1992 (exclud- ing financial firms), yielding 361 firms.30 The need
34 Dorustreurn item MV. j5 Both as gathered from copy financial statements.
Subsequent sensitivity analysis employs two alternative control measures.
j7 As supplied by IIBIEIS. 3K These authors also find change in levels of cash to be a
3y And earlier editions. Page 1,685 in the 2001 edition. significant factor.
Source of list of quoted firms: Quuliry of Markers; Compunies Book 1992, published by The International Stock Exchange of the United Kingdom and the Republic of Ireland. London.
Dow
nloa
ded
by [
Uni
vers
ity o
f N
ebra
ska,
Lin
coln
] at
00:
52 0
1 O
ctob
er 2
013

Vol. 34. No. 2. 2004 109
Table 2 Sample selection and screening process (number of firms)
One in three firms quoted on the LSE as at 3 1 December 1992
Of which, copy 1992 financial statements provided
Of which, copy financial statements 1993-1996 provided (initial sample)
Less firms with: (i) tax on rolled-over or held-over chargeable gains; (ii) tax on potential remittances of overseas income; or (iii) trading losses or surplus ACT in excess of the maximum amounts offsetable
Less firms which provided deferred tax in full
Final sample 58
36 1
316
147
(65)
(24)
to obtain six years of data required an earlier rather than a later start date. The years 1990 and 1991 were chosen because these were both years of rel- atively poor economic conditions. 1990 was the only year in the decade to experience a real fall in GDP (-1.20%), while 1991 experienced the lowest increase in GDP for the same period (0.002%). The likelihood of earnings management was con- sidered to be higher under such conditions. In the absence of the required deferred tax information being available in a machine-readable form, a re- quest for a copy of the 1992 financial statements was made of each of these 361 selected firms. Financial statements were received from 3 16 firms, and in the four subsequent years a similar request were made to each of these 3 16. The result was an initial sample of 147 firms, for which com- plete deferred tax data for the two periods 1991-1995 and 1992-1996 had been collected.4’
A screening process then removed all firms that had provided in respect of any of the following de- ferred tax items in either 1991 or 1992: (i) tax on rolled-over or held-over chargeable gains; (ii) tax on potential remittances of overseas income; or (iii) trading losses or surplus ACT in excess of the maximum amounts o f f~e tab le .~~ The result was to produce a sample of 82 firms with deferred tax li- abilities relating only to the following items: capi- tal allowances and other short term timing differences, trading losses and ACT. The final step was to exclude those firms which had provided de- ferred tax in full in either of 1991 or 1992, or which had maximum potential deferred tax asset balances. The final sample consisted of 58 firms. The sample selection and screening process is summarised in Table 2.
3.4. Empirical models
and 1992: The following model was estimated for t = 1991
In this model, to be termed the ‘aggregated model’, the dependent variable is the aggregated variable as defined in expression (4), with x = 4, i.e., the mean of four under / overprovision vari- ables, as calculated according to expression (3) as- suming a one-year, a two-year, a three-year and a four-year forecasting period.
The following model was estimated for t = 1991 and 1992, and for forecasting period one year, two years, three years and four years:
(7) P11, , = a, + p, ,(;!AH, + p 2 , PROFIT, + p, ,MBT, + p, ,ETR, + p,,PYT(‘, + P,,EL)llIrn, + p, ,AlIL) , + p,,SIZE, + Pg,ACTV, +p,,,UNCER7; + E ,
In this model, to be termed the ‘disaggregated model’, the dependent variable is as defined in ex- pression (3), with x being, successively (for each of 1991 and 1992) one year, two years, three years and four years.
In each case, the a are model-specific intercepts; the /3 are model-specific slope coefficients; and the E are model-specific stochastic error terms.
In all cases the models were estimated using or- dinary least squares estimation, and also, for rea- sons explained in the next section, using two alternative ‘robust’ estimators (being an iteratively re-weighted least squares (IRLS) estimator and a bounded influence estimator). The estimations were performed on SHAZAM Professional Edition Version 9.0 (2001) and STATA INTERCOOLED Version 7.0 (2001).
41 The reduction to 147 firms was due to take-overs, failures and other de-listing events, and to changes at the firm level in the form of disclosure that rendered the data incompatible over time in a number of cases.
42 This screening was necessary owing both to the method- ological assumption set out in an earlier section, and to incon- sistency in disclosure relating to the screened items.
Dow
nloa
ded
by [
Uni
vers
ity o
f N
ebra
ska,
Lin
coln
] at
00:
52 0
1 O
ctob
er 2
013

110 ACCOUNTING AND BUSINESS RESEARCH ~~
Table 3 Non-parametric correlation between alternative formulations of the dependent variable Spearman’s rho; N = 58 (all significant at the 1% level, one-tailed test)
Table 3.1 - 1991
pDl 99 I ,4 1 .ooo 0.87 1 0.93 1 0.932 0.922 pD199 I , I 1 .ooo 0.862 0.749 0.703 pD1991,2 1 .ooo 0.868 0.834 pD1991 .3 1 .ooo 0.902
pDl 99 I .4 ‘ D l 99 I , I pD199 I .2 pD1991,3 pD1991 ,4
pD1991,4 1 .ooo Table 3.2 - 1992
pD1992.4 1 .ooo 0.85 1 0.935 0.977 0.939 pD1992,1 1 .ooo 0.797 0.779 0.745 pD1992,2 1 .om 0.911 0.866 pD1992,3 1 .ooo 0.9 15
pD1992,4 pD1992,1 pD1992,2 pD1992,3 pD1992,4
p D 1992.4 1 .ooo Variables: PD,,, - Under (over) provision of deferred tax in year t as a proportion of the maximum potential deferred tax provision in year t , assuming a forecasting period for deferred tax purposes of x years. Five alternative formulations: x = 1, 2, 3 and 4; and an aggregate formulation, being the arithmetic mean of the variable under the other formulations.
4. Results 4. I . Descriptive statistics and univariate analyses
The correlations between PT,,,, ,,, PD,,,, , ,, PD1991,2, PD,,,,,3 and PD,,,,,, are set out in Table 3. Given the high levels of skewness and / or kur- tosis present in some of the variables, the reported pair-wise correlations are based upon a non-para- metric measure (Spearman’s As anticipat- ed, the alternative formulations of the dependent variable are highly correlated. Similarly for the 1992 dependent variable. Table 4 shows summary statis- tics upon the variables, and Table 5 the pair-wise correlations coefficients for the continuous vari- ables. In each table, 1991 and 1992 statistics are shown separately. The negative relationship between market value and variation in analysts’ forecasts supports the use of the latter variable as a proxy for uncertainty. Fama and French’s (1992) results were interpreted as indicating that firm risk decreases with firm size, a result consistent with the above relationship. To the extent that the degree of varia- tion in analysts’ forecasts is a function of the num- ber of analysts making forecasts, then the inclusion of a size variable in our model has the additional effect of controlling for the positive relationship between firm size and number of analysts. The cor- relation analysis suggests that potentially high lev- els of multicollinearity should not be a feature of the data set (and subsequent multivariate analysis using condition indices supports this contention). The absence in either 199 1 or 1992 of a significant correlation coefficient between the absolute value
of the dependent variable and the uncertainty con- trol variable, coefficient of variation in analyst’s forecasts, is addressed in the discussion of the mul- tivariate results and is subject to robustness tests.
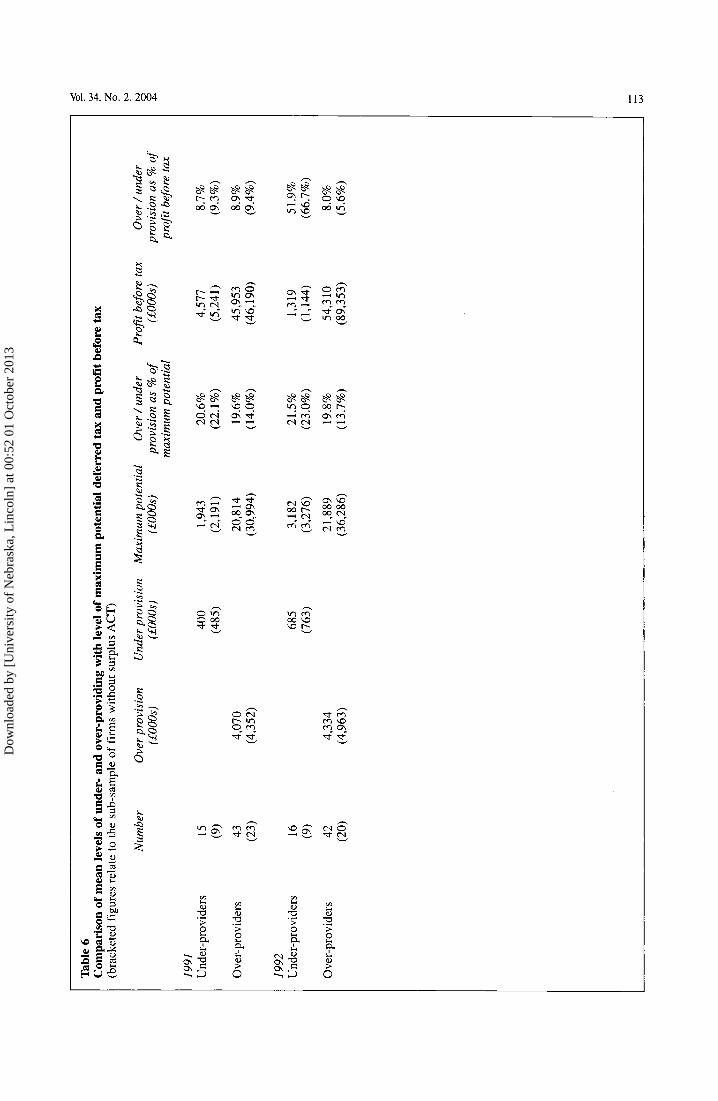
In both years, the majority of firms over-provide deferred tax (43 in 1991 and 42 in 1992). Table 6 summarises levels of under and over-provisioning for the sample. In interpreting the table and the fol- lowing commentary, it is important to appreciate that the unbracketed figures represent the mean in- come effect before the dampening effect of any write off or write back of ACT,‘’‘’ while the brack- eted amounts represent the corresponding values for the sample excluding all firms with surplus ACT. The mean amount of under-provision by the 15 (9) and 16 (9) under-providing firms 1991 and 1992 is E0.4m (E0.5m) and E0.7m (E0.8m) respec- tively. This represents 20.6% (22.1%) and 21.5% (23.0%) respectively of the related mean maxi- mum potential deferred tax liabilities of &1.9m (E2.2m) and &3.2m (E3.3m). Among the over-pro- viding firms, the mean amount over-provided in 1991 and 1992 amounted to &4.1m (E4.4m) and
43 The issue of non-normality in a multivariate setting is addressed later in the paper.
The impact (if any) of ACT is firm specific and, whilst in a multivariate setting the level of ACT set off is included as an explanatory variable, in an analysis of the aggregate level of under- and over-provision it is not possible to adjust for the impact of ACT. In order to do so, identification of individual firms’ ACT capacity - requiring a division between UK and non-UK taxable profits - would be necessary.
Dow
nloa
ded
by [
Uni
vers
ity o
f N
ebra
ska,
Lin
coln
] at
00:
52 0
1 O
ctob
er 2
013

Vol. 34. No. 2. 2004 1 1 1
Table 4 Summary statistics upon variables (N=58 for each variable in each year)
Minimum Maximum Mean SD Skewness Kurtosis
1991 Alternative pDl 99 I .4 -86.10 65.47 -15.17 35.62 -0.07 -0.19
of the pD1991 .2 -100.00 72.73 -18.13 35.35 -0.10 0.29 dependent pD I99 I ,3 -80.89 94.84 -12.92 37.53 0.45 0.58 variable pD I99 I ,4 - 100.00 100.00 -8.53 45.53 0.38 0.09
Independent GEAR 0.00 126.20 29.92 20.09 1.88 7.99 variables PROFIT 0.00 1 .oo 0.90
APBT 0.00 1 .oo 0.47 ETR 0.00 0.50 0.28 0.11 -0.78 1.01 PYTC -0.25 1.97 0.10 0.30 4.58 25.65 EQUITY 0.00 0.64 0.06 0.14 2.95 9.14 A UD 0.00 1 .oo 0.76 SIZE 1.31 9.10 4.45 a.b 1.65 0.35 0.03 ACTVC 0.00 0.62 0.09 0.15 1.96 3.53 UNCERF 0.00 96.84 17.28 2 1.06 2.37 5.64
formulations PD199,, I -84.99 97.24 -21.08 36.05 0.32 0.88
1992 Alternative m,992,4 -100.00 formulations PD,,,,,, -100.00 of the pD1992,2 -100.00 dependent pD1992,3 -100.00 variable p D 1992.4 -100.00
Independent GEAR variables PROFIT
APBT ETR PYTC EQUITY AUD SIZE A C W C UNCERF
0.00 0.00 0.00
-0.90 -0.12 0.00 0.00 1.58 0.00 0.00
85.29 76.47
100.00 100.00 100.00
123.75 1 .oo 1 .oo 0.54 3.09 0.37 1 .oo 9.17 0.70
138.83
-16.02 -24.00 -16.48 -1 1.82 -1 1.77
40.24 36.97 4 1.24 49.01 45.70
29.42 0.88 0.52 0.23 0.16 0.03 0.76 4.64 a,b
0.10 15.79
2 1.65
0.19 0.47 0.07
1.59 0.15
25.05
0.26 -0.10 0.28 0.00 0.60 0.63 0.53 -0.23 0.57 0.44
1.59 5.13
-3.64 20.77 5.01 28.59 2.96 9.06
0.25 0.11 2.03 4.90 3.85 15.59
Notes: a difference between 1991 and 1992 distributions significant at 1% level (Wilcoxon signed rank test)
difference in means between 1991 and 1992 significant at 1% level (t-test) summary statistics upon the absolute values of ACTV and UNCERT
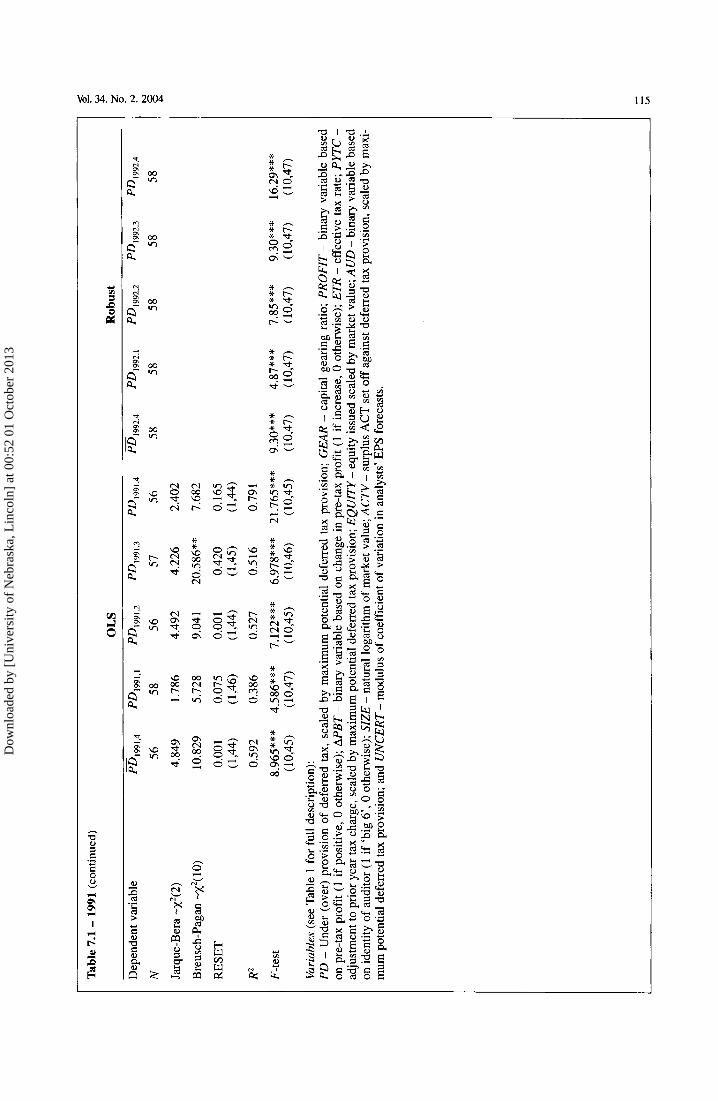
Variables (see Table 1 for full description): PD - Under (over) provision of deferred tax, scaled by maximum potential deferred tax provision; GEAR - capital gearing ratio; PROFIT - binary variable based on pre-tax profit (1 if positive, 0 otherwise); APBT - binary variable based on change in pre-tax profit (1 if increase, 0 otherwise); ETR - effective tax rate; PYTC - adjustment to prior year tax charge, scaled by maximum potential deferred tax provision; EQUITY - equity issued scaled by market value; AUD - binary variable based on identity of auditor (1 if ‘big 6’, 0 otherwise); SIZE - natural logarithm of market value; ACTV - surplus ACT set off against deferred tax provision, scaled by maximum potential deferred tax provision; and UNCERT - modulus of coefficient of variation in analysts’ EPS forecasts.
Dow
nloa
ded
by [
Uni
vers
ity o
f N
ebra
ska,
Lin
coln
] at
00:
52 0
1 O
ctob
er 2
013

112 ACCOUNTING AND BUSINESS RESEARCH
Table 5 Pair-wise correlation coefficients between variables: Spearman’s rho 5%, 2.5% and 1% levels of significance denoted by *, ** and *** respectively; one or two-tailed tests as ap- propriate; reported correlation coefficients between the dependent variable and each of ACTV and UNCERT are as calculated using the absolute value of each of these, since ACT and uncertainty each contribute to both under- and over-provisioning
Table 5.1 - 1991
m1991,4 1 .oo 0.15 GEAR 1 .oo ETR PYTC EQUITY SIZE ACTV UNCERT
m199,,4 GEAR
Table 5.2 - 1992 pD1992.4 GEAR
m1992,4 1 .oo 0.11 GEAR 1 .oo ETR PYTC EQUITY SIZE ACTV UNCERT
ETR
0.02 0.00 1 .oo
ETR
-0.03 -0.22
1 .oo
PYTC EQUITY SIZE
0.23 -0.07 0.05 0.19 0.13 -0.18 1.00 -0.12 -0.24
1.00 -0.12 1 .oo
-0.02 -0.10 -0.17
PYTC EQUITY SIZE
0.14 -0.36*** -0.17 0.20 -0.23 0.10 0.30** 0.13 -0.13 1.00 -0.13 -0.25
1 .oo 0.08 1 .oo
ACTV UNCERT
0.29** 0.07 0.32*** 0.17 0.02 0.05 0.07 -0.07
-0.14 0.28 * -0.11 -0.39 ***
1 .oo 0.42 *** 1 .oo
ACTV UNCERT
0.24* 0.10 -0.03 0.09 -0.01 0.08
-0.09 -0.12 -0.01 -0.20
1 .oo
0.18 0.26 *
1 .oo 0.43 ***
Variables (see Table 1 for full description): P D - Under (over) provision of deferred tax, scaled by maximum potential deferred tax provision; GEAR - capital gearing ratio; PROFIT - binary variable based on pre-tax profit (1 if positive, 0 otherwise); APBT - binary variable based on change in pre-tax profit (1 if increase, 0 otherwise); ETR - effective tax rate; PYTC - adjustment to prior year tax charge, scaled by maximum potential deferred tax provision; EQUITY - equity issued scaled by market value; A U D - binary variable based on identity of auditor (1 if ‘big 6’, 0 otherwise); SIZE - natural logarithm of market value; ACTV - surplus ACT set off against deferred tax provision, scaled by maximum potential deferred tax provision; and UNCERT - modulus of coefficient of variation in analysts’ EPS forecasts.
&4.3m (E5.Om) respectively, by the 43 (23) and 42 (20) firms concerned. These amounts represent 19.61% (14.0%) and 21.5% (23.0%) of the mean
45 We thank a referee for suggesting this possible explana- tion.
46 An analysis of GDP forecasts and realised outcomes could give an indication to the degree of unexpectedness in changes in the level of GDP during the forecast periods. Using data published by the National Institute of Economic and Social Research in the National Institute Economic Review (various years) the realised levels of real GDP in 1992, 1993, 1994 and 1995 are similar to, although consistently lower than, the levels for each of those years as forecast in 1991 (ac- tual from index base of 100: 100.07, 102.38, 106.92 and 109.85; and forecast: 102.1, 104.65, 107.48 and 110.49 re- spectively). In contrast, the forecasts made in 1992 are consis- tently exceeded by the realised levels (actual: 102.31, 106.84, 109.77 and 112.62; and forecast: 102.0, 104.55, 106.64 and 108.56). This difference in the accuracy of the 1991 and 1992 based GDP forecasts is not, however, apparent in a material in- crease in the frequency or level of over providing in 1992 rel- ative to 1991 (see Table 6).
maximum potential deferred tax liabilities of &20.8m (&3 1 .Om) and &21.9m (&36.3m) in the two years. An alternative view of the level of under- /over-providing is by reference to mean level of profits. The level of over-provision represented 8.9% (9.4%) and 8% (5.6%) of the net profit be- fore tax for 1991 and 1992 respectively. The per- centages for the under-providing firms were 8.7% (9.3%) and 5 1.9% (66.7%). On average, the levels of under- and over-provision are significant in an economic sense when measured against both the maximum potential deferred tax provision and, more importantly, the level of pre-tax profit. The preponderance of over-providing might represent firms generally under estimating future levels of capital expenditure. Independent of earnings man- agement, this could result if firms were unduly pessimistic about the state of the economy during the forecast period.45 In the absence of individual firm planned and actual capital expenditure levels
Dow
nloa
ded
by [
Uni
vers
ity o
f N
ebra
ska,
Lin
coln
] at
00:
52 0
1 O
ctob
er 2
013
Tab
le 6
C
ompa
riso
n of
mea
n le
vels
of
unde
r- a
nd o
ver-
prov
idin
g with
leve
l of m
axim
um p
oten
tial
def
erre
d ta
x an
d pr
ofit
befo
re tax
(bra
cket
ed fi
gure
s re
late
to th
e su
b-sa
mpl
e of
firm
s w
ithou
t sur
plus
AC
T)
Num
ber
Ove
r pro
visi
on
Und
er pr
ovis
ion
Max
imum
pot
entia
l O
ver /
und
er
Prof
it be
fore
tax
(fOO
0s)
(f00
0s)
(fOO
0s)
prov
isio
n as
% o
f (f
000s
) m
axim
um p
oten
tial
1991
U
nder
-pro
vide
rs
15
(9)
Ove
r-pr
ovid
ers
43
(23)
1992
U
nder
-pro
vide
rs
16
(9)
Ove
r-pr
ovid
ers
42
(20)
4,07
0 (4
,352
)
4,33
4 (4
,963
)
400
1,94
3 20
.6%
4,
577
(485
) (2
,191
) (2
2.1 %
) (5
,241
)
20,8
14
19.6
%
45,9
53
(30,
994)
(1
4.0%
) (4
6,19
0)
685
3,18
2 21
.5%
1,
319
(763
) (3
,276
) (2
3.0%
) (1
,144
)
21,8
89
19.8
%
54,3
10
(36,
286)
(1
3.7%
) (8
9,35
3)
Ove
r / u
nder
pr
ovis
ion
as %
of
prof
it be
fore
tax
8.7%
(9
.3%
)
8.9%
(9
.4%
)
5 1.9
%
(66.
7%)
8.0%
(5
.6%
)
W
P
2:
?
P
N
0
0
P - - W
Dow
nloa
ded
by [
Uni
vers
ity o
f N
ebra
ska,
Lin
coln
] at
00:
52 0
1 O
ctob
er 2
013

Tab
le 7
O
LS
and
robu
st m
ultiv
aria
te re
gres
sion
resu
lts
(5%
, 2.5
% a
nd 1
% le
vels
of s
igni
fican
ce de
note
d by
*, *
* and
***
resp
ectiv
ely;
one
or tw
o-ta
iled
test
s as
app
ropr
iate
)
Tab
le 7
.1 - 19
91
PDr =
+
P1,
iGEA
Ri +
P2,
QRO
FIT,
+ P
,,P'B
Tr +
P4,
$TR
i +
B,,Q
rrC
, + P
,PQ
uIT
Yi +
P7.
PuD
r +
P,J
IZE
i + P
9,P
cTV
i +
P,o
,,UN
CE
RT~
+
~t
r = 1
991;
five
diff
eren
t for
mul
atio
ns of
the
depe
nden
t var
iabl
e (s
ee T
able
1 an
d Se
ctio
n 3.
1)
OL
S R
obus
t
Dep
ende
nt v
aria
ble
pD19
91,4
pD
1991
.1
pD19
91.2
pD
1991
,3
pD19
91,4
pD
1992
,4
pD19
92,1
pD
1992
,2
pD19
92,3
pD
1992
,4
GE
AR
PRO
FIT
MB
T
ETR
PYTC
EQU
ITY
AU
D
SIZE
AC
TV
UN
CERT
Con
stan
t, a
0.26
8 -0
.076
0.
248
0.45
2 0.
279
0.25
6 0.
025
0.18
1 0.
509
0.30
9 (1
.381
) (-
0.31
2)
(1.2
02)
(2.4
41**
*)
(1.6
57)
(1.2
2)
(0.1
0)
(0.9
6)
(2.4
1***
) (1
.63)
-50.
450
-40.
319
-24.
476
-31.
006
-55.
580
-50.
767
-38.
499
-34.
416
-41.
529
-53.
699
(-3.
445*
**)(
-2.5
78**
*)
(-1.8
20*)
(-
2.00
2*)
(4.5
41**
*) (-
3.27
***)
(-
2.39
**)
(-2.
75**
*)
(-2.
69**
*)
(-3.
83**
*)
7.07
9 6.
657
5.49
9 6.
121
3.46
4 6.
157
4.98
9 14
.337
4.
339
3.11
5 (0
.958
) (0
.754
) (0
.717
) (0
.970
) (0
.538
) (0
.76)
(0
.55)
(2
.05*
) (0
.5 1)
(0
.43)
-1.6
178
-10.
522
14.2
28
18.6
49
12.7
56
7.28
6 -1
8.82
2 32
.167
1 28
.334
20
.367
(-
0.04
9)
(-0.2
53)
(0.4
18)
(0.6
52)
(0.4
33)
(0.2
0)
(-0.
44)
(1.0
1)
(0.7
3)
(0.6
0)
-37.
036
-32.
229
43.9
31
-30.
756
-50.
073
-39.
823
-35.
948
-48.
567
-32.
308
-5 1
.746
(-
3.47
8**
*) (-
2.44
6***
) (-
4.02
7** *
) (-5
.1 1
7* **
) (-5
.38
1 ** *
) (-3
.4 1
** *)
(-2.
65 *
**)
(4.7
9***
) (-2
.74*
* *)
(-
4.87
***)
-54.
949
9.40
2 3.
446
-16.
461
-81.
817
-55.
631
-8.1
315
60.3
78
-31.
692
-87.
131
(-2.
084*
*)
(0.2
89)
(0.1
31)
(-0.5
07)
(-3.
535*
**)
(-1.
98*)
(-
0.24
) (2
.46*
**)
(-1.
06)
(-3.2
9***
)
-0.0
48
-2.6
62
-5.5
28
-4.8
24
2.10
2 -3
.465
-1
6.98
3 -1
3.64
0 -4
.999
4.
261
(-0.
006)
(-
0.27
4)
(-0.
638)
(-
0.59
4)
(0.2
78)
(-0.
41)
(-1.
70*)
(-
1.80
*)
(-0.
56)
(0.5
2)
-0.7
97
I .70
9 0.
165
-1.7
45
-1.5
68
-1.2
15
0.3 1
1 -0
.266
-2
.762
-1
.849
(-
0.39
9)
(0.6
92)
(0.0
81)
(-0.9
12)
(-0.
905)
(-0
.56)
(0
.12)
(-
0.14
) (-1
.23)
(-0
.93)
93.0
81
63.7
97
87.7
30
106.
48
119.
59
102.
536
82.3
74
76.6
935
117.
418
118.
031
(4.7
57**
*) (
2.40
4***
) (4
.426
***)
(5.
984*
**)
(6.8
83**
*)
(4.8
3***
) (3
.02*
**)
(4.1
6***
) (4
.98*
**)
(5.9
3***
)
0.36
5 0.
426
0.29
1 0.
343
0.69
6 0.
319
0.32
3 -0
.049
0.
402
0.69
9 (2
.475
***)
(2.
657*
**)
(2.0
44**
) (3
.216
***)
(5.
719*
**)
(1.9
7*)
(1.9
6*)
(-0.
37)
(2.7
3**)
(5
.02*
**)
37.2
82
20.2
65
5.16
7 17
.704
49
.893
43
.959
41
.742
3 14
.229
33
.253
46
.897
(2
.263
*)
(1.0
40)
(0.3
19)
(0.8
80)
(3.5
22**
*)
(2.5
4)
(2.0
8*)
(0.9
5)
(1.9
0)
(2.9
1***
)
Dow
nloa
ded
by [
Uni
vers
ity o
f N
ebra
ska,
Lin
coln
] at
00:
52 0
1 O
ctob
er 2
013
Tab
le 7
.1 -
1991
(con
tinue
d)
OL
S R
obus
t
Dep
ende
nt v
aria
ble
pD19
91,4
pD
,99,
,l
pD19
91,2
pD
,991
.3
pD,9
91,4
pD
,992
,4
pD,9
92,1
pD
1992
.2
pD19
92.3
pD
1992
.4
N 56
58
56
57
56
58
58
58
58
58
Jarq
ue-B
era
-x2(
2)
4.84
9 1.
786
4.49
2 4.
226
2.40
2
Bre
usch
-Pag
an -x
2( 10
) 10
.829
5.
728
9.04
1 20
.586
**
7.68
2
RES
ET
0.00
1 0.
075
0.00
1 0.
420
0.16
5 ( 1
,441
( 1
,461
( 1
,441
( 1
,451
( 1
,44)
R
2
0.59
2 0.
386
0.52
7 0.
516
0.79
1
F-te
st
8.96
5***
4.
586*
**
7.12
2***
6.
978*
**
21.7
65**
* 9.
30**
* 4.
87**
* 7.
85**
* 9.
30**
* 16
.29*
**
(10,
454
(10,
47)
(10,
45)
(10,
46)
(10,
45)
(10,
47)
(10,
47)
(10,
47)
(10,
47)
(10,
47)
Var
iabl
es (s
ee T
able
1 fo
r ful
l des
crip
tion)
: P
D - U
nder
(ov
er) p
rovi
sion
of
defe
rred
tax,
sca
led
by m
axim
um p
oten
tial d
efer
red
tax
prov
isio
n; G
EAR - c
apita
l gea
ring
ratio
; PRO
FIT - b
inar
y va
riabl
e ba
sed
on p
re-ta
x pr
ofit
(1 if
pos
itive
, 0 o
ther
wis
e); A
PBT - b
inar
y va
riabl
e ba
sed
on c
hang
e in
pre
-tax
prof
it (1
if i
ncre
ase,
0 o
ther
wis
e); E
TR - e
ffec
tive
tax
rate
; PYT
C -
adju
stm
ent t
o pr
ior y
ear t
ax c
harg
e, sc
aled
by m
axim
um p
oten
tial d
efer
red
tax
prov
isio
n; E
QU
ITY - eq
uity
issu
ed s
cale
d by
mar
ket v
alue
; AU
D - b
inar
y va
riabl
e bas
ed
on id
entit
y of
aud
itor (
1 if
‘big
6’,
0 ot
herw
ise)
; SIZ
E - n
atur
al lo
garit
hm of
mar
ket v
alue
; AC
TV
- su
rplu
s AC
T se
t off
agai
nst d
efer
red
tax
prov
isio
n, sc
aled
by
max
i- m
um p
oten
tial d
efer
red
tax
prov
isio
n; an
d U
NCE
RT - m
odul
us o
f coe
ffic
ient
of v
aria
tion
in a
naly
sts’
EPS
fore
cast
s.
Dow
nloa
ded
by [
Uni
vers
ity o
f N
ebra
ska,
Lin
coln
] at
00:
52 0
1 O
ctob
er 2
013

Tabl
e 7
(con
tinue
d)
Tab
le 7
.2 -
1992
(v
aria
ble d
efin
ition
s as
per T
able
7.1
)
PD
t=
+ P
l,tG
EARt
+ P
2.Q
RO
FIT
, +
P,,@
'BTr
+
P4,F
TR
1 + P
,.QyT
c, +
P,F
Qu
IT
Yt+
P7,
P'D
t +
P~,
rsIz
Et + P
9.P
CTV
t +
P,,,
'NCE
RTt
+ E
, r =
199
2; fi
ve d
iffer
ent f
orm
ulat
ions
of t
he d
epen
dent
var
iabl
e (s
ee T
able
1 a
nd S
ectio
n 3.
1)
OL
S R
obus
t
Dep
ende
nt v
aria
ble
pD,9
92,4
pD
,992
.,
pD,9
92,2
pD
,992
,S
pD,9
92.4
pD
1992
,4
pD,9
92,1
pD
,992
.2
pD19
92,S
pD
1992
.4
GE
AR
0.
3 19
0.23
8 0.
319
0.48
1 0.
089
0.32
9 0.
209
0.41
2 0.
339
0.01
1 (1
.451
) (1
.075
) (1
.512
) (1
.872
*)
(0.3
90)
(1.4
4)
(0.9
1)
(1.7
9*)
(1.3
2)
(0.0
4)
PRO
FIT
-22.
064
1.15
6 -3
5.49
6 -3
2.64
4 -6
2.43
6 -1
6.39
1 -0
.682
-3
5.80
0 -3
9.37
8 -3
6.01
6 (-1
.286
) (0
.067
) (-2
.178
"")
(-1.
633)
(-
3.50
2***
) (-
0.93
) (-0
.04)
(-
2.08
**)
(-1.9
6*)
(-1.9
3")
APB
T -1
.766
-6
.211
-1
4.02
2 -4
.537
-6
.694
-1
.134
-7
.345
-1
1.72
6 -1
1.36
0 -9
.188
(-
0.19
4)
(-0.
664)
(-
1.57
7)
(-0.4
25)
(-0.
703)
(-0
.12)
(-0
.76)
(-
1.24
) (-1
.06)
(-
0.92
)
ETR
28.0
09
9.69
7 46
.910
33
.941
56
.936
25
.478
12
.555
44
.405
54
.941
34
.688
(0
.995
) (0
.344
) (1
.740
*)
(1.0
32)
(1.9
42*)
(0
.87)
(0
.43)
(1
.57)
(1
.66)
(1
.13)
PYTC
-2
3.35
2 -2
3.81
9 -2
1.21
8 -2
8.92
0 -2
9.99
2 -1
7.46
3 -2
2.09
1 -5
2.08
6 -2
7.50
3 -2
4.84
5 (-
2.59
4***
) (-2
.628
***)
(-2.
465*
**)
(-2.
753*
**) (
-3.2
04**
*)
(-1.
87*)
(-
2.36
***)
(-2
.89*
**)
(-2.
60**
*)
(-2.5
3***
)
EQU
ITY
-22.
337
-18.
478
-37.
518
-58.
888
-0.3
85
-48.
148
-27.
018
44.7
07
-36.
034
-7.7
40
(-0.
389)
(-
0.3
19)
(-0,
683)
(-
0.87
7)
(-0.
006)
(-0
.81)
(-
0.45
) (-0
.77)
(-
0.53
) (-0
.12)
A U
D
2.87
2 -1
.873
-4
.423
-3
.883
4.
313
-8.9
42
-8.1
14
-3.7
05
4.48
9 -0
.110
(0
.274
) (-0
.178
) (-
0.44
3)
(-0.3
18)
(0
.395
) (-0
.82)
(-
0.74
) (-
0.35
) (0
.37)
(-0
.01)
SIZE
-2
.636
-2
.558
-3
.649
-5
.052
-1
.441
-4
.190
-2
.877
-4
.443
-3
.389
-0
.981
(-0
.961
) (-
0.92
9)
(-1.
391)
(-
1.57
3)
(-0.
508)
(-1
.47)
(-1
.01)
(-1
.59)
(-1
.05)
(-0
.33)
ACTV
80
.967
10
1.81
15
5.68
14
9.35
12
2.82
12
2.67
8 10
7.77
3 13
6.59
7 14
2.15
9 11
5.53
8 (3
.951
***)
(3.
887"
"")
(5.8
57**
*) (
5.02
4***
) (4
.816
***)
(4
.65*
**)
(3.9
8***
) (4
.84*
**)
(5.0
5***
) (4
.32*
**)
(3.1
97**
*) (
2.69
4***
) (2
.178
**)
(2.3
21**
*) (
2.60
3***
) (2
.93*
**)
(2.5
8***
) (2
.13*
**)
(2.0
5**)
(2
.68*
**)
Con
stan
t, a
6.84
7 -2
.457
41
.847
41
.687
47
.948
0 30
.484
11
.095
43
.548
34
.013
34
.623
(0
.357
) (-0
.122
) (2
.248
*)
(1.8
66)
(2.3
97**
) (1
.54)
(0
.53)
(2
.22)
(1
.51)
(1
.65)
UN
CE
RT
0.32
6 0.
409
0.3 1
4 0.
403
0.40
4 0.
449
0.40
6 0.
322
0.35
8 0.
437
Dow
nloa
ded
by [
Uni
vers
ity o
f N
ebra
ska,
Lin
coln
] at
00:
52 0
1 O
ctob
er 2
013

Tab
le 7
.2 - 19
92 (c
ontin
ued)
O
LS
Rob
ust
Dep
ende
nt v
aria
ble
pD,9
92,4
pD
,992
,1
pD19
92,2
pD
1992
,3
pD19
92,4
pD
1992
,4
pD19
92.1
pD
1992
,2
pD19
92,3
pD
1992
,4
N
58
58
58
58
58
58
58
5711
0'"
58
58
Jarq
ue-B
era
-x2(
2)
2.01
6 4.
77 1
1.
232
1.41
2 1.
348
Bre
usch
-Pag
an -x
2( 10)
12
.808
3.
663
10.1
58
16.2
96
12.7
03
RES
ET
2.12
5 6.
82**
2.
976
0.19
3 0.
075
( 1,4
6)
( 1,4
61
( 1,4
61
( 1,4
61
( 1,4
61
, R2
0.44
2 0.
328
0.51
3 0.
486
0.53
1
F-te
st
5.51
3***
3.
782*
**
6.99
7***
6.
395*
**
7.45
4***
6.
23**
* 3.
74**
* 6.
23**
* 5.
70**
* 5.
13**
* (1
0,47
) (1
0,47
) (1
0,47
) (1
0,47
) (1
0,47
) (1
0,47
) (1
0,47
) (1
0,46
) (1
0,47
) (1
0,47
)
Not
e: T
he s
ampl
e si
ze is
redu
ced
to 5
7 be
caus
e an
initi
al s
tep
of t
he IR
LS p
roce
dure
is to
cal
cula
te th
e C
ook'
s sta
tistic
for a
ll ob
serv
atio
ns a
nd e
xclu
de th
ose
whi
ch a
re
deem
ed to
be
over
ly in
fluen
tial (
i.e.,
for w
hich
the
Coo
k's s
tatis
tic is
mor
e th
an o
ne).
Dow
nloa
ded
by [
Uni
vers
ity o
f N
ebra
ska,
Lin
coln
] at
00:
52 0
1 O
ctob
er 2
013
118
for each year in the forecasting period, it is not possible to control for the degree of undedover- provision attributable to unexpected levels of eco- nomic growth. Analysis of forecast and realised levels of GDP suggests that any tendency to under estimate future levels of capital expenditure does not derive from uncertainty over the general level of economic activity.46 Such a broad analysis can- not rule out firm or industry specific factors.
Cross-tabulation analyses (not reported) suggests that there is no relationship between audit firm quality and the level andor frequency of under- /over-provision in either 1991 or 1992.47 Similarly, no significant differences are found when compar- ing the level and frequency of under-provision and over-provision between firms reporting an increase in profits as against those reporting a loss, or be- tween those issuing equity versus non-issuers.
In order to assess the potential influence of analysts’ forecasts on the level of earnings manage- ment, an analysis was performed on a sample com- prising firms without surplus ACT. Of the 33 such firms in 1991, 1 1 reported earnings per share in ex- cess of the mean analysts’ forecast. In 1992, eight out of 30 such firms similarly exceeded expecta- tions. In the absence of under-providing, four of those firms would have failed to the forecast in 199 1, and two firms would similarly have failed in 1992. There is, therefore, some evidence that some of the firms exceeded the analysts’ expectations by under providing. This finding, however, must be qualified by the absence of a general relationship between the level of under- /over-provision on a per share basis and the difference between reported EPS and mean analyst forecast EPS (results not reported).
4.2. Multivariate results Table 7 sets out the results of estimation of the
aggregated model (6) and the disaggregated mod- els (7) using both OLS and IRLS robust estima- t o r ~ . ~ ~ Table 7.1 covers 1991, and Table 7.2 1992.
Initial OLS estimations using the full sample of 58 firms suffered from significant levels of non- normality in the distribution of the residuals for 199 1 .49 Consequently, the reported OLS results are based on an iterative process designed to result in estimated models which do not appear to violate the assumption of normality in the residuals: the observation associated with the largest absolute residual was removed, the model re-estimated, and so forth until the Jarque-Bera statistic ceased to be significant at the 5% level. For the aggregated model, this process resulted in the removal of two firms for 1991 (none for 1992).
Additional diagnostic tests were performed, as- sessing multicollinearity, and testing for the pres- ence of model misspecification, heteroskedasticity and influential observations. The level of multi- collinearity amongst the independent variables ap-
ACCOUNTING AND BUSINESS RESEARCH
pears to be acceptable: in all cases, the highest condition index for each set of independent vari- ables is less than the suggested critical level of 10 (Belsley et al., 1980).50 The Ramsey reset test was employed in order to assess model misspecifica- tion. Test statistics based on squared, cubed and fourth power transformations were estimated, al- though, in the interests of economy, only those based on the squared transformation are reported in Table 7. The test statistics are not significant at the 5% level, with the exception of the 1991 dis- aggregated model using a three-year forecast hori- zon, the 1992 aggregated model, and the 1992 disaggregated model using a one-year forecast h~r i zon .~ ’ Overall, therefore, there is little evi- dence to suggest the models are mis-specified. The degree of heteroskedasticity was assessed using the Breusch-Pagan test. With the exception of the 1991 disaggregated model based on a three-year horizon, the test statistics were not significant at the 5% level. In the exceptional case, the reported t-statistics are corrected using the White (1980) ad ju~ tmen t .~~
Analysis of the aggregated OLS models based on the sample of 58 firms identified a number of observations as being ‘influential’ using the DFITS criteria (Belsley et al., 1980).53 The combi- nation of non-normality and influential observa- tions is an appropriate setting in which to employ robust estimation techniques. Two such techniques were employed: an iteratively re-weighted least
~~ ~ ~
47 In each of I99 1 and 1992,76% of sample firms were au- dited by ‘big 6’ audit firms.
48 In the interests of economy, the results from only one of the robust estimators employed are reported - those from IRLS. The results of the bounded-influence estimator indicate that the reported OLS results are not driven by the presence of influential observations (see subsequent discussion). All the significant coefficients reported under the OLS estimations re- tain their statistical significance under bounded influence esti- mation, with two exceptions - those being GEAR in the 1991 estimation of the disaggregated model using a three year fore- casting period, and EQUI7Yin the 1991 estimation of the ag- gregated model. The discussion of results in Section 4.2 is restricted to reporting upon and comparing the results of OLS and IRLS estimation.
49 As indicated by a Jarque-Bera test statistic of 7.098 for the 199 1 aggregated model.
Indeed, the highest condition index had values 2.924 (1991) and 2.814 (1992).
s 1 Where the Fstatistic values are 6.196 (3,43), 4.312 (3,44) and 5.214 (l,46) respectively, all significant at the 1% level.
s2 Although the Breusch-Pagan (1979) test is a large sample test and when used on ‘small samples’ can be ‘liberal’, the largest test statistic, with the exception of the three referred to above is, 11.385 (10 d.f.) - significant at 32%. Any liberal ten- dencies of the test in a small sample test would, therefore, not appear to be sufficient to change the conclusion that the level of heteroskedasticity is not serious.
53 In 1991 and 1992, nine and two observations respective- ly had absolute values of the DFITS statistic in excess of the critical value of 0.816 - the critical value being determined as 2 x d z , where p = number of regressors and n = number of observations (Belsley et al., 1980).
Dow
nloa
ded
by [
Uni
vers
ity o
f N
ebra
ska,
Lin
coln
] at
00:
52 0
1 O
ctob
er 2
013

Vol. 34. No. 2. 2004
squares (IRLS) estimator (Hamilton, 1991); and a bounded-influence estimator (Goldstein, 199 1). The IRLS estimator is less sensitive than OLS to violations of the normality assumption arising from influential or outlying observations of the de- pendent variable, whilst the bounded-influence es- timator has the effect of reducing the impact of outlying or influential observations of the inde- pendent variables.
In the aggregated models, the profit coefficient is of the hypothesised negative sign in both 1991 and 1992 and, although statistically significant at the 1% level in 1991, it is marginally insignificant in 1992. In the sets of disaggregated models, how- ever, the coefficient is significant in all cases for 1991, and in two (three when using IRLS estima- tion) of the four cases in 1992. The relationship is consistent with a smoothing process: income-in- creasing (-reducing) earnings management is asso- ciated with a pre-tax loss (profit).54 An alternative explanation, which cannot be discounted, is that, relative to profit making firms, loss-making firms systematically over forecast future levels of capital expenditure when determining the required level of deferred tax provision.
A similar smoothing process seen to be associat- ed with the level of adjustments to prior year tax charges. Decreases (increases) in income resulting from such adjustments are associated with in- come-increasing (-decreasing) earnings manage- ment. The relationship is consistent across both years. In the aggregated models, the coefficient is of the hypothesised negative sign in both 1991 and 1992, statistically significant at the 1 % level. When estimated in the disaggregated models, the coefficient is significant at the 1% level in all four cases in 1991 all of the four cases in 1992. This re- lationship is consistent with firms which anticipate a future potential adjustment to prior year tax, in particular an additional charge, incorporating its likely effect in the current year’s deferred tax charge. The incentive in so doing is to avoid recording explicitly the likely adjustment as a tax charge adjustment, since this could weaken the firm’s negotiating position with the tax authorities. If a liability is subsequently determined, then it is recorded in the tax charge, and a corresponding transfer made from the deferred tax provision - re- sulting in a zero net effect in the tax charge of the period in which the final liability is agreed.
There is weak evidence of a relationship between earnings management and the level of gearing. In the aggregated models the relationship is consistent- ly positive as hypothesised - though not statistically significant in either 1991 or 1992. In the disaggre- gated models the coefficient is significant at the 1 % level in one case out of four in both 1991 and 1992.
There is no evidence of a systematic relationship between the direction of annual change in profit
119
and the dependent variable in the aggregated mod- els. In the disaggregated models, the relevant coef- ficient is statistically significant in only one instance (in 1991), and generally lacks consistency as concerns the direction of any association. The coefficient is positive in all four cases in 199 1, and negative in all four cases in 1992.
The effective tax rate variable coefficient is gen- erally of the hypothesised positive sign. The only occurrences of a negative sign are in the aggregat- ed model and one of the disaggregated models for 1991. In two cases in 1992 the coefficient is statis- tically significant (both at the 5% level), lending some support to the hypothesised smoothing role of deferred tax in arriving at the provision for the overall corporate tax charge. There is one observa- tion of a negative ETR (during 1992). When this is controlled for using a dummy variable, the previ- ously insignificant ETR coefficients do not take on significance (at generally accepted levels), howev- er, in one of the two cases mentioned above, the ETR coefficient ceases to be significant at a gen- erally acceptable level.
The relationship between the equity variable and the dependent variable is counter to expectations. The coefficient is negative in the aggregate models for both 1991 and 1992, significant at the 2.5% level in 1991 (5% in the case of IRLS estimation). Similarly, in the disaggregated models the coeffi- cient is negative in the majority of cases and is sta- tistically significant at the 1 % level in one case for 1991 (two cases under IRLS estimation). This im- plies that firms over provide deferred tax in the year of an equity issue. This might result from firms being more cautious as a result of expectations of increased levels and / or intensity of market scruti- ny surrounding and following a capital issue. Such behaviour, however, would be contrary to the find- ing of increased earnings management at the time of IPOs (Teoh et al., 1998). It is possible that earnings management precedes the issuance of equity and that a lagged explanatory variable is appropriate. As a further test, therefore, the 1991 models were re-estimated with a one year lagged equity variable. Although the resulting estimated coefficient is pos- itive in the aggregated model and in three of the four disaggregated models, it is not statistically signifi- cant at generally accepted levels in any of them.
There is mixed evidence as to a relationship be- tween audit firm quality and the level of earnings management. In the aggregated models the auditor variable had the anticipated negative sign only in 1991, but was not statistically significant. Likewise, insignificant were the positive signed
54 When the binary profit independent variable is replaced by a continuous variable measuring profitability (pre-tax prof- it or loss as a percentage of sales) there is only very limited ev- idence of a significant relationship.
Dow
nloa
ded
by [
Uni
vers
ity o
f N
ebra
ska,
Lin
coln
] at
00:
52 0
1 O
ctob
er 2
013

120 ACCOUNTING AND BUSINESS RESEARCH
coefficients estimated in the 1992 models. The co- implications of writing off surplus ACT: firms in- efficient was, however, of the anticipated sign and crease their capacity to offset ACT by over-provid- statistically significant in two of the 1991 disag- ing deferred tax, thereby reducing the likelihood of gregated models under the IRLS estimation. As an having to write off ACT. This interpretation is sug- alternative test of the auditor quality hypothesis, gestive that the writing off of surplus ACT through the models were re-estimated using the absolute the current tax charge is a strong negative signal value of the appropriate dependent variable. This about the level of future profitability and dividends. would be an appropriate formulation if auditors Under both OLS and IRLS estimation, the un- face a symmetrical loss function in respect of certainty control variable is positive and signifi- under- and over-provision. The results, not report- cant over both years in all cases but one. As ed separately, do not indicate a statistically signif- reported in the univariate analyses, however, the icant relationship in any of the models - though in variable’s correlation with the absolute value of all cases the relevant coefficient has a negative the dependent variable is not statistically signifi- sign, lending weak support to the initial hypothesis. cant. Its significance in a multivariate setting,
Though there is a lack of generally acceptable therefore, may be in part due to the need for it to levels of statistical significance in respect of the take a positive sign when the firm concerned is coefficient for the firm size variable in either 199 1 under-providing, and a negative sign when the or 1992, the coefficient is negative in all but two firm is over-providing. To the extent that this vari- cases in the disaggregated models (or all but one able fails to control fully for uncertainty and the when using IRLS estimation), and in all cases of other independent variables do proxy for uncer- the aggregated model. The lack of significance in tainty, then the estimated coefficients may be bi- respect of firm size, however, ought to be inter- ased (Maddala, 2001). Although there is no reason preted with caution. The data screening process re- to suspect that the other independent variables are, moved a number of the larger, more complex firms in fact, correlated with uncertainty, the models with the result that the full range of firm sizes is have been re-estimated, excluding from the sample not represented in the sample.55 all firms that be considered to be ‘marginal’ over-
The most consistent result is the positive relation- or under-providers (and whose under- or over-pro- ship between the level of ACT and the dependent vision may, therefore, be inaccurately ascribed to variable in all of the models: in every case it is sig- earnings management). When firms whose under- nificant at the 1% level. This lends support to the a- or over-provision, as measured by the independent gument that firms recognise and take into account variable, is within the range +5% are excluded on the dampening effect of surplus ACT when deter- the basis that the scale of their under- or over-pro- mining the level of earnings management required vision falls within a reasonable margin of error, then to achieve a desired net result. Of firms which the distribution of under- and over-providers is as under-provide, the greater the amount of ACT set follows: in 199 1 the number of under-providers - off the higher the level of under-provision. This is as calculated by expression (4) - falls to 12 and the consistent with the impact of deferred tax under- number of over-providers is reduced to 30. Provision reducing the Capacity to Offset ACT and Similarly, in 1992, the number of under-providers thereby resulting in an increase in the tax charge is reduced to 14, and the number of over-providers from the write-off of surplus ACT that can no longer to 30. When the models are re-estimated, the re- be set off. In order to achieve a given net reduction sults are qualitatively the Same as reported above, in the tax charge, a greater level of under-provision with the following exceptions where significance is required in the Presence Of SUrPlUS ACT than is of the coefficient(s) is lost: under OLS estimation, required in the absence of surplus ACT. Similarly, the equity variable in the 199 1 aggregated model, for those firms which over-provide, the level Of OVer-prOViSiOn increases with the level Of ACT Set off. BY Over-PfOviding, the tax charge is increased, but it is simultaneously reduced by the avoidance (or reduction in the level of) ACT required to be Written Off. Therefore, a higher OVer-prOViSiOn iS re- quired in the Presence of SUrPlUS ACT in ode r to achieve a given reduction in after tax earnings. This result iS COnSiStent with the weaker evidence SUr- rounding the influence Of the level Of effective tax rate, in that firms look at the overall effects on prof-
the profit and gearing variables in the 1991 disag- gregated model based on a three-year horizon, and the profit variable in the 1992 disaggregated model based on a two-year horizon; and under robust es- timation, the equity variable in both the 1991 ag- gregated mode] and the 199 1 disaggregated model based on a two-year horizon, the auditor variable in the 199 1 disaggregated model based on both a one and a two-year horizon, the direction of profit change variable in the 1991 disaggregated model
its (in this instance, on tax charge), rather than on ss A comparison of the maximum firm value in the initial
and final (screened) samples shows this to be the case: in 199 1 the values were &\2,452m and 28,968m respectively; in 1992,
the effect On sing1e line tionship in respect of over-providing firms, an alter-
Regarding the
native motivation concerns the potential signalling E l 8.8 12m and &9,S86m.
Dow
nloa
ded
by [
Uni
vers
ity o
f N
ebra
ska,
Lin
coln
] at
00:
52 0
1 O
ctob
er 2
013
Vol. 34. No. 2. 2004
based on a two-year horizon, the adjustment to prior year tax variable in the 1991 disaggregated model based on a three-year horizon, and the prof- it variable in the disaggregated model for 1992 based on both a two-year and a three-year horizon.
As a further assessment of the sensitivity of the reported results to the proxy for forecasting uncer- tainty, two alternative measures were employed: the coefficient of variation of the level of net cap- ital expend i t~ re ,~~ and the coefficient of variation of the level of sales57 (both as measured over the maximum, four-year planning horizon). While these measures have limitations (for example, observed variations in capital expenditure may have been in- tentional, and the formal linkage between varia- tions in planned capital expenditure and sales is unknown) the exercise is useful in assessing ro- bustness. Results based on these two alternative control variables are not qualitatively different from those based on the analysts’ forecast derived variable and, therefore, are not reported separate- I Y . ~ * Overall, this additional analysis suggests that the reported results are not driven significantly by failure fully to capture uncertainty.
In summary, there is strong evidence of an asso- ciation between levels of over- (under-) provision and profit status, level of adjustment to prior year tax and presence of surplus ACT. There is weaker evidence of an association with the levels of gear- ing and effective tax burden.
121
transparent to the market, there is a potential wel- fare loss. The findings of this paper, however, taken in isolation, should not be used as an argument for increased limitation of managerial discretion in the determination of financial accounting estimates. In the specific setting of deferred taxation, indeed, there is evidence that the exercise of managerial discretion can result in value-relevant information, which would otherwise remain private and within the firm, being publicly disclosed (Citron, 2001).
This study has limitations: the difficulty in con- trolling for forecasting uncertainty with precision; relatively small sample size resulting from the in- ability of the model of required provisions to deal with timing differences other than those relating to capital allowances and other short-term differ- ences (for example relating to interest and general provision^);^^ and, while a variety of results have been provided based on varying length of forecast horizon, the implicit assumption in estimating each model that all firms use the same period over which to estimate reversals. Given these limita- tions, care should be exercised in attempting to generalise the results.
The paper makes a number of contributions to the literature. In particular, the estimation of levels of potential earnings management uses, primarily, publicly available data and, therefore, avoids some of the limiting issues relating to existing method- ologies. The paper develops a number of new hy- potheses in relation to earnings management, in particular the influence of adjustment to prior year tax and current effective tax burdens, and the im- pact of and interaction with related accounting items, in this case ACT. The results relating to ACT support the view that firms engaging in earn- ings management focus on the overall net effect, rather than viewing each potential item in isola- tion. In focusing in a single profit and loss state-
5. Summary and conclusions This paper finds evidence of systematic differ- ences between actual and required levels of de- ferred tax provision. The amounts involved are economically significant. In the most conservative of settings, that of firms without surplus ACT, the mean amount of under-provision represents 9.3% and 66.7% of pre-tax profits in 1991 and 1992 re- spectively. Comparable figures for those firms over-providing are 9.4% and 5.6%. Surprisingly, in the light of recent events, the majority of firms in the study over- rather than under-provided; and in each formulation of the focal dependent vari- able, its mean represented an over-provision.
Detected levels of under- and over-provision can result from a combination of earnings management and forecasting error. After controlling for uncer- tainty (proxied by cross-sectional variations in the predictability of firms’ future earnings and, alterna- tively, by variations in capital expenditure and sales), there is support for some of the hypothesised earnings management incentives and influencers. In particular, there is evidence to support incentives and influencers concerning profit status, level of adjustment to prior year tax, and ACT. There is also evidence, albeit weaker, of incentives related to gearing and effective tax burden.
To the extent that earnings management is not
56 Datastream items 1024 and 1025. s7 Datastream item 104. s8 As compared with the reported results, the differences re-
sulting consistently from both alternative control variables can be summarised as follows: 1991 - GEAR is not significant at 5% level in the aggregated model under robust estimation, PROFIT is not significant at 5% in the disaggregated model using a three-year forecasting period under robust estimation, EQUITY is not significant at the 5 % in the aggregated model under either OLS or robust estimation, and ACJD is not signif- icant at 5% level in the disaggregated model using a two-year forecasting period under robust estimation; 1992 - GEAR is not significant at 5% level in the disaggregated model using a two-year forecasting period under robust estimation; but APBT is significant in the same model. The general conver- gence in the results is to be expected given significant corre- lations amongst the three control variables.
sy Albeit this may speak for the power of the methodology used in this study, since the sample constraint may well have resulted in the elimination of a number of larger, more com- plex firms, where, for example, capital market incentives to manage earnings may have been strong (thus making it hard- er to detect the hypothesised associations).
Dow
nloa
ded
by [
Uni
vers
ity o
f N
ebra
ska,
Lin
coln
] at
00:
52 0
1 O
ctob
er 2
013
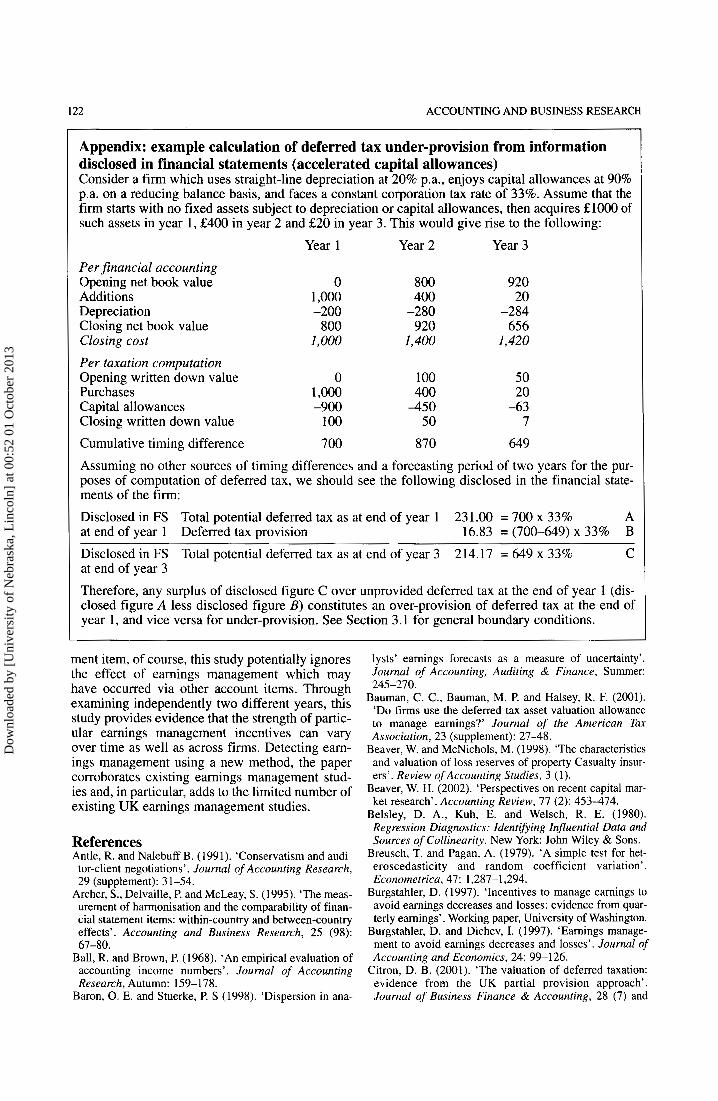
122 ACCOUNTING AND BUSINESS RESEARCH
Appendix: example calculation of deferred tax under-provision from information disclosed in financial statements (accelerated capital allowances) Consider a firm which uses straight-line depreciation at 20% p.a., enjoys capital allowances at 90% p.a. on a reducing balance basis, and faces a constant corporation tax rate of 33%. Assume that the firm starts with no fixed assets subject to depreciation or capital allowances, then acquires El000 of such assets in year 1,5400 in year 2 and 520 in year 3. This would give rise to the following:
Year 1 Year 2 Year 3 Per financial accounting Opening net book value 0 800 920 Additions 1,000 400 20 Depreciation -200 -280 -284 Closing net book value 800 920 656 Closing cost 1,000 1,400 1,420 Per taxation computation Opening written down value 0 100 50 Purchases 1,000 400 20
Closing written down value 100 50 7 Capital allowances -900 4 5 0 -63
Cumulative timing difference 700 870 649 Assuming no other sources of timing differences and a forecasting period of two years for the pur- poses of computation of deferred tax, we should see the following disclosed in the financial state- ments of the firm:
Disclosed in FS A at end of year 1 Deferred tax provision 16.83 = (700-649) x 33% B Disclosed in FS C at end of year 3
Therefore, any surplus of disclosed figure C over unprovided deferred tax at the end of year 1 (dis- closed figure A less disclosed figure B ) constitutes an over-provision of deferred tax at the end of year 1, and vice versa for under-provision. See Section 3.1 for general boundary conditions.
Total potential deferred tax as at end of year 1
Total potential deferred tax as at end of year 3
231.00 = 700 x 33%
214.17 = 649 x 33%
ment item, of course, this study potentially ignores the effect of earnings management which may have occurred via other account items. Through examining independently two different years, this study provides evidence that the strength of partic- ular earnings management incentives can vary over time as well as across firms. Detecting earn- ings management using a new method, the paper corroborates existing earnings management stud- ies and, in particular, adds to the limited number of existing UK earnings management studies.
References Antle, R. and Nalebuff B. (1991). ‘Conservatism and audi- tor-client negotiations’. Journal of Accounting Research, 29 (supplement): 31-54.
Archer, S., Delvaille, P. and McLeay, S. (1995). ‘The meas- urement of harmonisation and the comparability of finan- cial statement items: within-country and between-country effects’. Accounting and Business Research, 25 (98):
Ball, R. and Brown, P. (1968). ‘An empirical evaluation of accounting income numbers’. Journal of Accounting Research, Autumn: 159-178.
Baron, 0. E. and Stuerke, P. S (1998). ‘Dispersion in ana-
67-80.
lysts’ earnings forecasts as a measure of uncertainty’. Journal of Accounting, Auditing & Finance, Summer:
Bauman, C. C., Bauman, M. P. and Halsey, R. F. (2001). ‘Do firms use the deferred tax asset valuation allowance to manage earnings?’ Journal of the American Tax Association, 23 (supplement): 27-48.
Beaver, W. and McNichols, M. (1998). ‘The characteristics and valuation of loss reserves of property Casualty insur- ers’. Review ofAccounting Studies, 3 (1).
Beaver, W. H. (2002). ‘Perspectives on recent capital mar- ket research’. Accounting Review, 77 (2): 453-474.
Belsley, D. A., Kuh, E. and Welsch, R. E. ( 1980). Regression Diagnostics: Identifying Influential Data and Sources of Collinearity. New York: John Wiley & Sons.
Breusch, T. and Pagan, A. (1979). ‘A simple test for het- eroscedasticity and random coefficient variation’. Econometrica, 47: 1,287-1,294.
Burgstahler, D. (1997). ‘Incentives to manage earnings to avoid earnings decreases and losses: evidence from quar- terly earnings’. Working paper, University of Washington.
Burgstahler, D. and Dichev, I. (1997). ‘Earnings manage- ment to avoid earnings decreases and losses’. Journal oJ Accounting and Economics, 24: 99-126.
Citron, D. B. (2001). ‘The valuation of deferred taxation: evidence from the UK partial provision approach’. Journal of Business Finance & Accounting, 28 (7) and
245-270.
Dow
nloa
ded
by [
Uni
vers
ity o
f N
ebra
ska,
Lin
coln
] at
00:
52 0
1 O
ctob
er 2
013
Vol. 34. No. 2. 2004
(8): 821-852. Choi, F. D. S. (1991). Handbook of International Accounting. John Wiley & Sons
Collins, J., Shackelford, D. and Wahlen, J. (1995). ‘Bank differences in the co-ordination of regulatory capital, earnings and taxes’. Journal of Accounting Research, 33
Curtis. M. (1995). ‘Should SSAP15 rest in peace?’ Accountancy, November.
DeAngelo, L. (1981). ‘Auditor size and audit quality’. Journal of Accounting and Economics, 3: 189-199.
Dechow, P. M., Sloan, R. and Sweeney, A. (1995). ‘Detecting earnings management’. The Accounting Review, 70: 193-226.
Dechow, P. M. and Skinner, D. J. (2000). ‘Earnings man- agement: reconciling the views of accounting, academics, practitioners, and regulators’. Accounting Horizons, 14 (2) June: 235-250.
DeFond, M. L. and Jiambalvo, J. (1994). ‘Debt covenant effects and the manipulation of accruals’. Journal of Accounting and Economics, 17 (January): 145-176.
DeFond, M. and Park C. (1997). ‘Smoothing income in an- ticipation of future earnings’. Journal of Accounting and Economics, 23: 115-139.
Degeorge, F., Patel, J. and Zeckhauser, R. (1999). ‘Earnings management to exceed thresholds’. Journal of Business, 72: 1-33.
Ernst & Young. (2001). UK and International GAAP (7th ed.). Eds. Wilson, A., Davies, M., Curtis, M. and Wilkinson-Riddle, G. Butterworths Tolley.
Fama, E. F. and French, K. (1992). ‘The cross-section of expected stock returns’. Journal of Finance, 47 (2): 421465.
Goldstein, R. (1991). ‘One step Welsch bounded-influence estimator’. Stata Technical Bulletin STB2. Reprinted in Stata Technical Bulletin Reprints, 1 (1992): 176.
Guay, W. A., Kothari, S. P. and Watts, R. L. (1996). ‘A mar- ket-based evaluation of discretionary-accrual models’. Journal of Accounting Research, 34 (supplement): 83-105.
Guidry, F., Leone, A. and Rock, S. (1999). ‘Earnings-based bonus plans and earnings management by business unit managers’. Journal of Accounting and Economics, 26: 113-142.
Hamilton, L. C. (1991). ‘How robust is robust regression?’ Stata Technical Bulletin, 2: 21-26.
Healy, P. M. and Wahlen, J. M. (1999). ‘A review of the earnings management literature and its implications for standard setting’. Accounting Horizons, 13 (4), December: 365-383.
Jones, J. J. (1991). ‘Earnings management during import relief investigations’. Journal of Accounting Research,
(2): 262-291.
29: 193-228.
123
Liu, C., Ryan, S. and Wahlen, J. (1997). ‘Differential valu- ation implications of loan loss provisions across Banks and fiscal quarters’. The Accounting Review, January:
Maddala, G. M. (2001). Introduction to Econometric (3rd ed.). Wiley, Europe.
McNichols M. (2000). ‘Research design issues in earnings management studies’. Journal of Accounting and Public Policy, 19 (4-5): 313-345.
Miller, G. S., and Skinner, D. J. (1998). ‘Determinants of the valuation allowances for deferred tax assets under SFAS No. 109’. The Accounting Review, 73(2): 213-233.
National Institute of Economic and Social Research (vari- ous years). National Institute Economic Review, London.
Peasnell, K. V., Pope, P. F. and Young, S. (2000a). ‘Detecting earnings management using cross-sectional abnormal ac- cruals models’. Accounting and Business Research, 30 (4): 3 13-326.
Peasnell, K. V., Pope, P. F. and Young, S. (2000b). ‘Accrual management to meet earnings targets: UK evidence pre- and post-Cadbury’ . British Accounting Review, 32 (4), December: 4 15-445.
Rangan, S. (1998). ‘Earnings management and the per- formance of seasoned equity offerings’. Journal of Financial Economics, 50: 101-122.
St. Pierre, K. and Anderson, J. A. (1984). ‘An analysis of the factors associated with lawsuits against public ac- countants’. The Accounting Review, 59: 242-263.
Teoh S. H., Welch, I., and Wong T.J. (1998). ‘Earnings management and the long-run market performance of ini- tial public offerings’. Journal of Finance, LIIL (6): 1,935-1,974.
Visvanathan, G. (1998). ‘Deferred tax valuation al- lowances and earnings management’. The Journal of Financial Statement Analysis, 3: 6 1 5 .
Watts, R. L. and Zimmerman, J. L. (1978). ‘Towards a pos- itive theory of the determination of accounting standards’. The Accounting Review, 53 (January): 112-134.
Welch, I. and Wessels, D. (2000). ‘The cross-sectional de- terminants of corporate capital expenditures: a multina- tional comparison’. Schmalenbach Business Review, 52:
White, H. (1980). ‘A heteroskedasticity-consistent covari- ance matrix estimator and a direct test for heteroskedas- ticity’. Econometrica, 48 (4): 817-838.
Young, S., (1998). ‘The determinants of managerial ac- counting policy choice: further evidence for the UK’. Accounting and Business Research, 28 (2): 133-143.
Young, S. (1999). ‘Systematic measurement error in the es- timation of discretionary accruals: an evaluation of alter- native modelling procedures’. Journal of Business Finance and Accounting, 26 (7 & 8): 833-862.
133-146.
103-1 36.
Dow
nloa
ded
by [
Uni
vers
ity o
f N
ebra
ska,
Lin
coln
] at
00:
52 0
1 O
ctob
er 2
013