earnings conference call fourth quarter 2007 january 28, 2008
TRANSCRIPT

Earnings Conference Call
Fourth Quarter 2007
January 28, 2008

2
Cautionary Statements And Risk Factors That May Affect Future Results
Any statements made herein about future operating results or other future events are forward-looking statements under the Safe Harbor Provisions of the Private Securities Litigation Reform Act of 1995. These forward-looking statements may include, for example, statements regarding anticipated future financial and operating performance and results, including estimates for growth. Actual results may differ materially from such forward-looking statements. A discussion of factors that could cause actual results or events to vary is contained in the Appendix and in our SEC filings.

3
2007: An Excellent Year• Another excellent year for FPL Group – Adjusted earnings growth of ~16%
– Adjusted results above high end of original expectations
• FPL Energy – Adjusted earnings growth of ~21%– New project additions– Improvement in merchant asset contributions– Wholesale marketing
• Florida Power & Light – Earnings growth of ~4%– Revenue challenges– Mostly offset by excellent cost management– Turkey Point 5 in service ahead of schedule, under budget
• Well positioned for the future– FPL Energy:
• 8-10 GW wind program on track• Newer projects (solar, transmission)• Recent asset additions (Point Beach)
– FPL:• Incremental generation expansion continues• Advanced metering initiative• Storm Secure®
• Despite soft economic conditions, maintaining earnings outlook1
– 2008E: $3.83 to $3.93– 2009E: $4.15 to $4.35– 2006-2012 average adjusted EPS growth: ≥10%
Note: The 2008 and 2009 adjusted earnings expectations are valid as of January 28, 2008 and should be viewed in conjunction with FPL Group’s Cautionary Statements contained in the Appendix to this presentation. See Appendix for reconciliation of GAAP to adjusted amounts.1Assumes normal weather and operating conditions. Excludes the cumulative effect of adopting new accounting standards and the mark-to-market effect of non-qualifying hedges, neither of which can be determined at this time.

4
0706
$0.56
EPS
See Appendix for reconciliation of GAAP to adjusted amounts
$0.67$224$268
GAAP Adjusted
0706
$0.63
$254
0706 0706
Net Income($ millions)
EPSNet Income($ millions)
FPL Group ResultsFourth Quarter
$0.71
$282

5
0706
$3.27
EPS
See Appendix for reconciliation of GAAP to adjusted amounts
$3.23$1,312$1,281
GAAP Adjusted
0706
$3.04$1,203
0706 0706
Net Income($ millions)
EPSNet Income($ millions)
FPL Group ResultsFull Year
$3.48$1,398

6
Florida Power & Light – Overview
• 2006 items affect comparisons – $27 million storm cost disallowance– $19 million benefit from favorable weather
• Modest growth in a challenging environment
• Revenue growth headwinds– Slowing customer growth, particularly at year end– Lower-than-expected usage– Partially offset by Turkey Point 5 addition
• O&M increases but better than expected

7
Florida Power & Light – Long-term Initiatives
• West County Energy Center– Two, identical 1,220 MW gas facilities– In service dates: Unit 1: 2009; Unit 2: 2010– Approximately $1.3B capital
• Nuclear expansion outlined– ~ 400 MW in uprates planned for 2011-2012; approved in
December (approximately $1.8B capital)– Need petition filed for new nuclear; decision in March (~2,200
to 3,040 MW; $12B+ capital)
• Advanced Metering Initiative (AMI)– 2007: 50,000 meters installed– 2008: additional 50,000 meters to be installed– Approximately $500M capital
• Governor Crist’s climate change initiatives
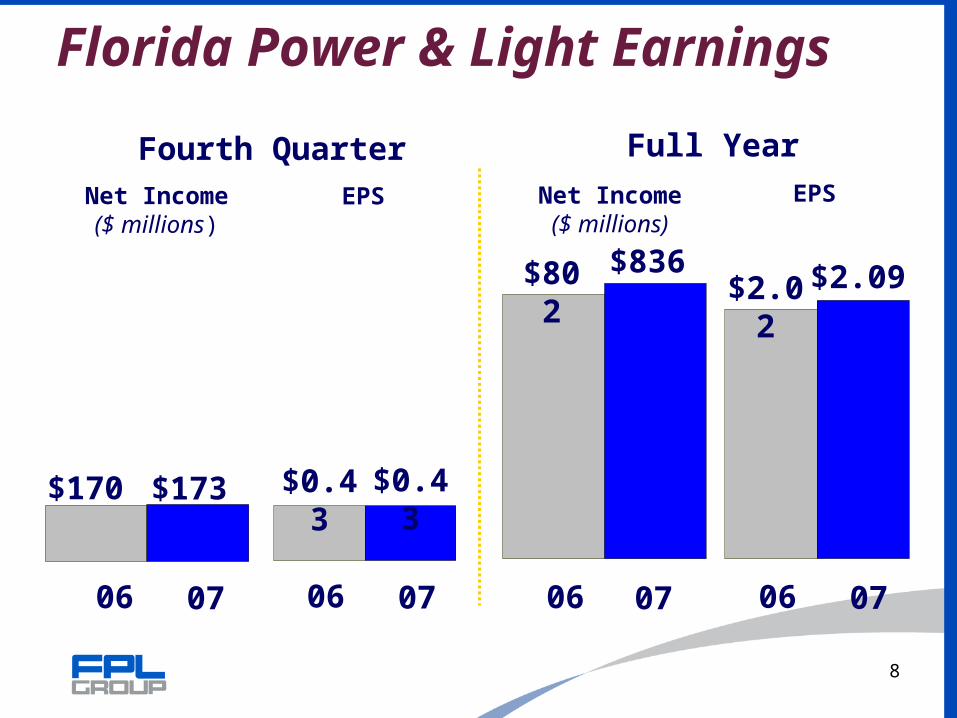
8
0706
$0.43
EPS
$0.43$173$170
Fourth Quarter Full Year
0706
$2.02$802
0706 0706
Net Income($ millions)
EPSNet Income($ millions)
Florida Power & Light Earnings
$2.09$836

9
Growth in Customer AccountsFourth Quarter Comparisons1
(thousands)
1 Change in average number of customer accounts from prior period
Full Year Comparisons1
(thousands)
10797
88 87
04 05 06 07
94101 95
64
04 05 06 07

10
Retail Sales at FPL
Fourth Quarter
1.5% customer growth
2.6% usage growthdue to weather
(1.0)% underlying usage growth, mix, and other
3.1% kWh sales growth
Full Year
2.0% customer growth
(0.8)% usage growthdue to weather
0.4% underlying usage growth, mix, and other
1.6% kWh sales growth

11
FPL - New Service Accounts and FL Housing Starts
Source: University of Florida; National Bureau of Economic Research
Housing Starts & Customer Growth1976 to 2007
0
20
40
60
80
100
120
140
160
1976
1977
1978
1979
1980
1981
1982
1983
1984
1985
1986
1987
1988
1989
1990
1991
1992
1993
1994
1995
1996
1997
1998
1999
2000
2001
2002
2003
2004
2005
2006
2007
(th
ou
sa
nd
s)
Recession FPL Total Housing Starts FPL Annual Total Customer Growth

12
FPL O&M($ millions)
$350 $380
Fourth Quarter Full Year
$1,374 $1,454
0706 0706
Figures include amounts that are recovered through cost recovery clauses which have no impact on net income

13
FPL Depreciation($ millions)
$199 $197
Fourth Quarter Full Year
$787 $773
0706 0706
Figures include amounts that are recovered through cost recovery clauses which have no impact on net income
14
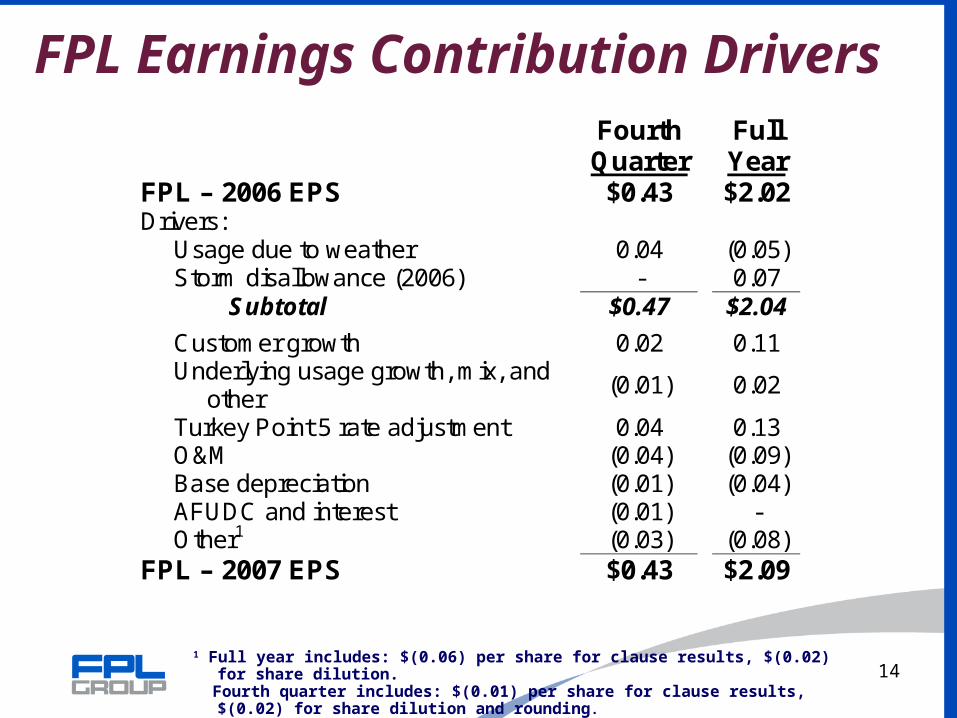
FPL Earnings Contribution Drivers
1 Full year includes: $(0.06) per share for clause results, $(0.02) for share dilution. Fourth quarter includes: $(0.01) per share for clause results, $(0.02) for share
dilution and rounding.
Fourth Quarter
Full Year
FPL – 2006 EPS $0.43 $2.02 Drivers:
Usage due to weather 0.04 (0.05) Storm disallowance (2006) - 0.07
Subtotal $0.47 $2.04
Customer growth 0.02 0.11 Underlying usage growth, mix, and
other (0.01)
0.02
Turkey Point 5 rate adjustment 0.04 0.13 O&M (0.04) (0.09) Base depreciation (0.01) (0.04) AFUDC and interest (0.01) - Other1 (0.03) (0.08)
FPL – 2007 EPS $0.43 $2.09

15
FPL Energy - Overview• Another excellent year
– Financial comparisons stronger than they appear– Roll-off of older hedges at higher prices– New project additions and existing fleet– Marketing and trading, especially full requirements– Very good fleet performance
• Well positioned for future growth– Favorable price environment remains– Well hedged for 2008 and 2009– Wind development program on track
• 8-10 GW over 2007-2012 time period• ≥700 MW in construction currently (>1,100 MW in
2008)– Point Beach acquisition

16
0706
$0.18
EPS
$0.37
$72
$148
GAAP Adjusted
0706
$0.33$133
0706 0706
Net Income($ millions)
EPSNet Income($ millions)
FPL Energy Results Fourth Quarter
$130$0.33
See Appendix for reconciliation of GAAP to adjusted amounts.

17
0706
$1.35
EPS
$1.54$540
$610
GAAP Adjusted
0706
$1.31
$518
0706 0706
Net Income($ millions)
EPSNet Income($ millions)
FPL Energy Results Full Year
$626
$1.56
See Appendix for reconciliation of GAAP to adjusted amounts.
18
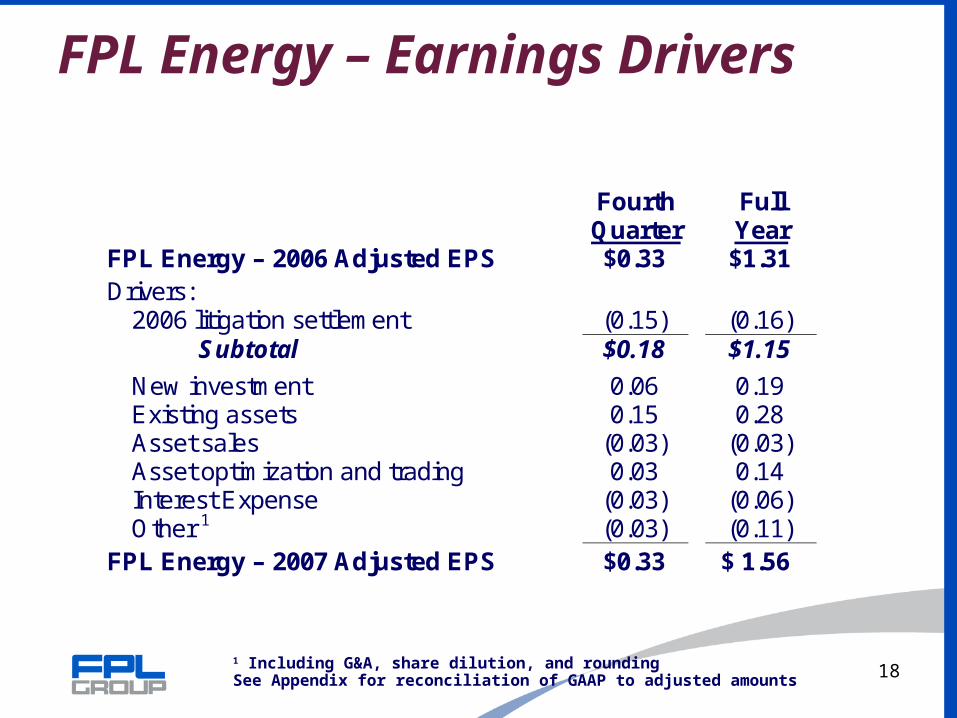
FPL Energy – Earnings Drivers
1 Including G&A, share dilution, and rounding See Appendix for reconciliation of GAAP to adjusted amounts
Fourth Quarter
Full Year
FPL Energy – 2006 Adjusted EPS $0.33 $1.31 Drivers:
2006 litigation settlement (0.15) (0.16) Subtotal $0.18 $1.15
New investment 0.06 0.19 Existing assets 0.15 0.28 Asset sales (0.03) (0.03) Asset optimization and trading 0.03 0.14 Interest Expense (0.03) (0.06) Other 1 (0.03) (0.11) FPL Energy – 2007 Adjusted EPS $0.33 $ 1.56

19
Market Conditions – An Update$
/MM
btu
NYMEX Gas Calendar Strips 2008-2017
$5.00
$5.50
$6.00
$6.50
$7.00
$7.50
$8.00
$8.50
$9.00
2008 2009 2010 2011 2012 2013 2014 2015 2016 2017
12/31/2006 9/28/2007 12/31/2007

20
Leading Wind Energy Business: Growth and Value
• 5,000+ MW today, growing to 12,000 MW+
• Largest U.S. developer again in 2007
• Adjusted EBITDA expectations:
• 30-40% of FPL Energy adjusted earnings contribution
• December 2007 differential partnership transaction adds new means to support continued growth
2008 2009
$900 – 1,000M $1,200 – 1,400M
50-55% EBITDA
45-50% equivalent EBITDA value of PTCs
of which:

21
Earnings Per Share ContributionsFourth Quarter
GAAP 06 07 Change FPL $0.43 $ 0.43 $0.00
FPL Energy 0.37 0.18 (0.19)
Corporate and Other (0.13) (0.05) 0.08
Total $0.67 $ 0.56 $(0.11) Adjusted 06 07 Change FPL $0.43 $ 0.43 $0.00
FPL Energy 0.33 0.33 0.00
Corporate and Other (0.13) (0.05) 0.08
Total $0.63 $ 0.71 $ 0.08
See Appendix for reconciliation of GAAP to adjusted amounts.

22
Earnings Per Share ContributionsFull Year
GAAP 06 07 Change FPL $2.02 $ 2.09 $0.07
FPL Energy 1.54 1.35 (0.19)
Corporate and Other (0.33) (0.17) 0.16
Total $3.23 $ 3.27 $0.04 Adjusted 06 07 Change FPL $2.02 $ 2.09 $0.07
FPL Energy 1.31 1.56 0.25
Corporate and Other (0.29) (0.17) 0.12
Total $3.04 $ 3.48 $ 0.44
See Appendix for reconciliation of GAAP to adjusted amounts.
23
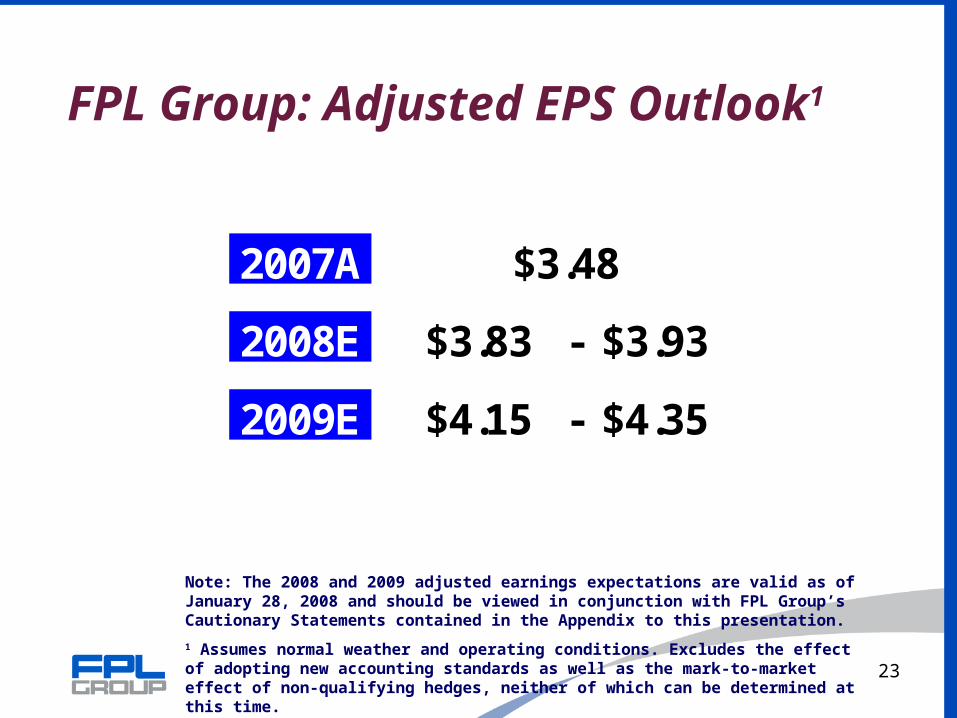
FPL Group: Adjusted EPS Outlook1
Note: The 2008 and 2009 adjusted earnings expectations are valid as of January 28, 2008 and should be viewed in conjunction with FPL Group’s Cautionary Statements contained in the Appendix to this presentation.
1 Assumes normal weather and operating conditions. Excludes the effect of adopting new accounting standards as well as the mark-to-market effect of non-qualifying hedges, neither of which can be determined at this time.
2007A
2008E $3.83 - $3.93
2009E $4.15 - $4.35
$3.48

Q&A Session

Appendix
26
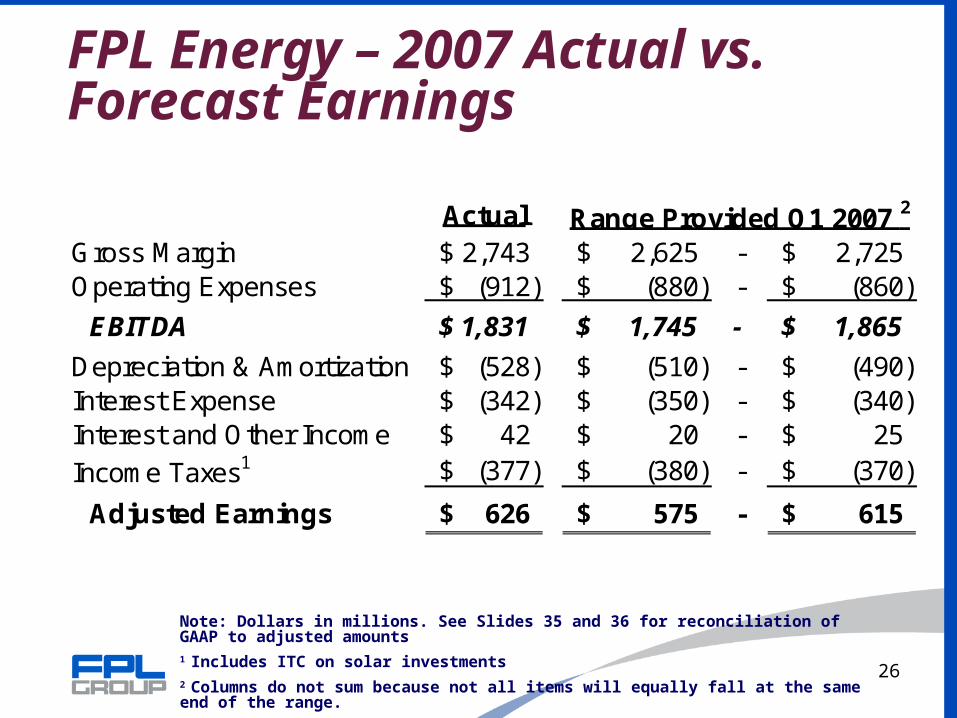
FPL Energy – 2007 Actual vs. Forecast Earnings
Note: Dollars in millions. See Slides 35 and 36 for reconciliation of GAAP to adjusted amounts1 Includes ITC on solar investments2 Columns do not sum because not all items will equally fall at the same end of the range.
ActualGross Margin 2,743$ 2,625$ - 2,725$ Operating Expenses (912)$ (880)$ - (860)$
EBITDA 1,831$ 1,745$ - 1,865$
Depreciation & Amortization (528)$ (510)$ - (490)$ Interest Expense (342)$ (350)$ - (340)$ Interest and Other Income 42$ 20$ - 25$
Income Taxes1 (377)$ (380)$ - (370)$
Adjusted Earnings 626$ 575$ - 615$
Range Provided Q1 2007 2
27
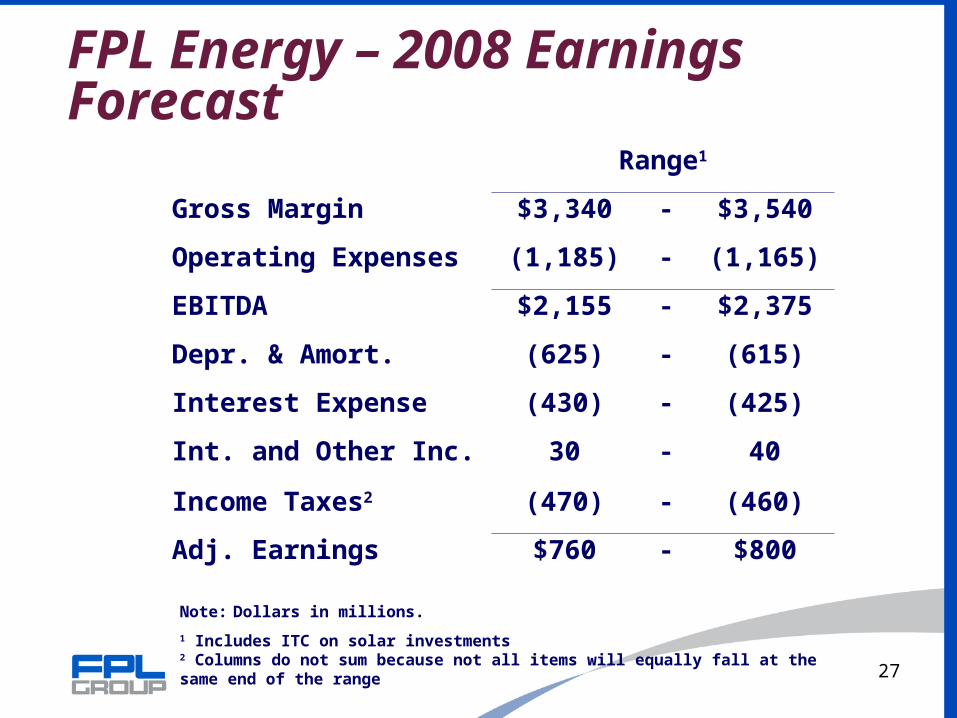
FPL Energy – 2008 Earnings Forecast
Range1
Gross Margin $3,340 - $3,540
Operating Expenses (1,185) - (1,165)
EBITDA $2,155 - $2,375
Depr. & Amort. (625) - (615)
Interest Expense (430) - (425)
Int. and Other Inc. 30 - 40
Income Taxes2 (470) - (460)
Adj. Earnings $760 - $800
Note: Dollars in millions.
1 Includes ITC on solar investments2 Columns do not sum because not all items will equally fall at the same end of the range
28
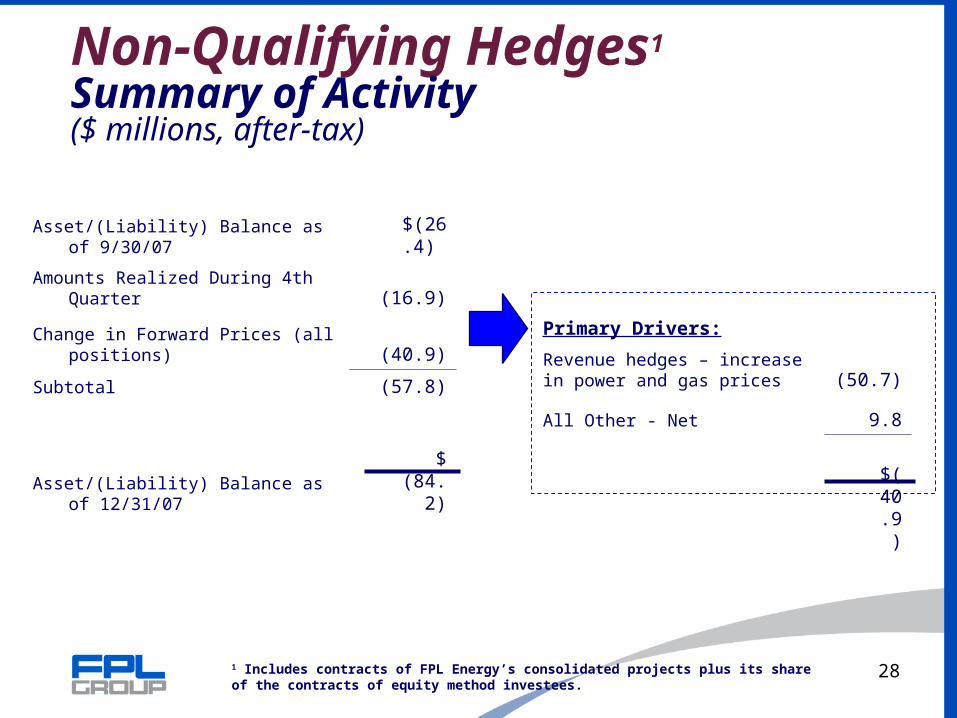
Non-Qualifying Hedges1
Summary of Activity ($ millions, after-tax)
Asset/(Liability) Balance as of 9/30/07 $(26.4)
Amounts Realized During 4th Quarter (16.9)
Change in Forward Prices (all positions) (40.9)
Subtotal (57.8)
Asset/(Liability) Balance as of 12/31/07 $ (84.2)
Primary Drivers:
Revenue hedges – increase in power and gas prices (50.7)
All Other - Net 9.8
$(40.9)
1 Includes contracts of FPL Energy’s consolidated projects plus its share of the contracts of equity method investees.
29
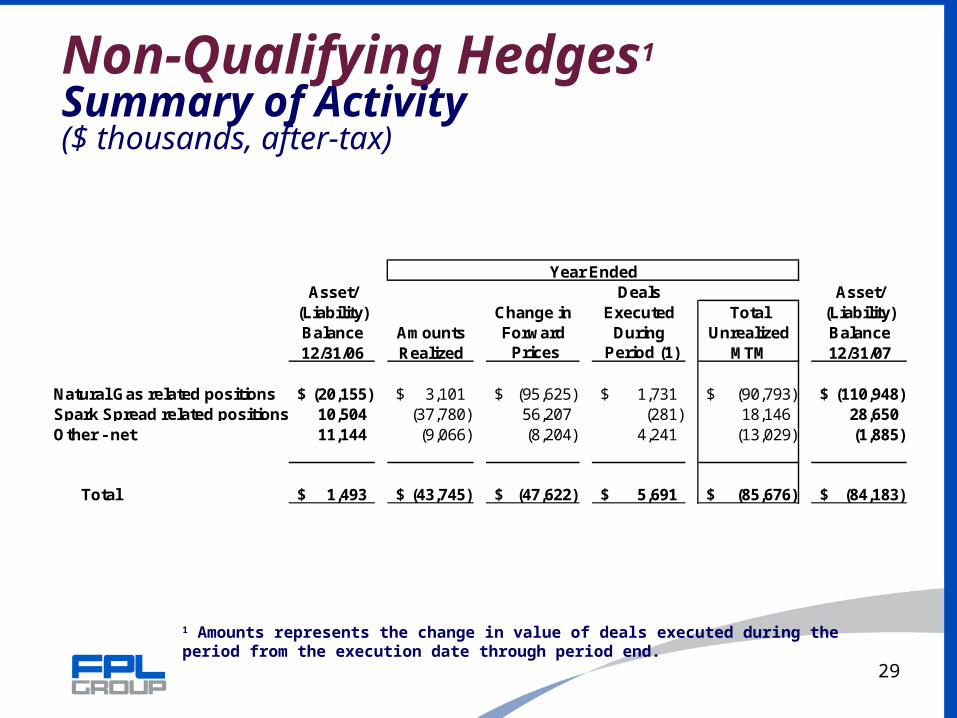
Non-Qualifying Hedges1
Summary of Activity ($ thousands, after-tax)
1 Amounts represents the change in value of deals executed during the period from the execution date through period end.
Year EndedAsset/ Deals Asset/
(Liability) Change in Executed Total (Liability)Balance Amounts Forward During Unrealized Balance12/31/06 Realized Prices Period (1) MTM 12/31/07
Natural Gas related positions (20,155)$ 3,101$ (95,625)$ 1,731$ (90,793)$ (110,948)$ Spark Spread related positions 10,504 (37,780) 56,207 (281) 18,146 28,650 Other - net 11,144 (9,066) (8,204) 4,241 (13,029) (1,885)
Total 1,493$ (43,745)$ (47,622)$ 5,691$ (85,676)$ (84,183)$
30
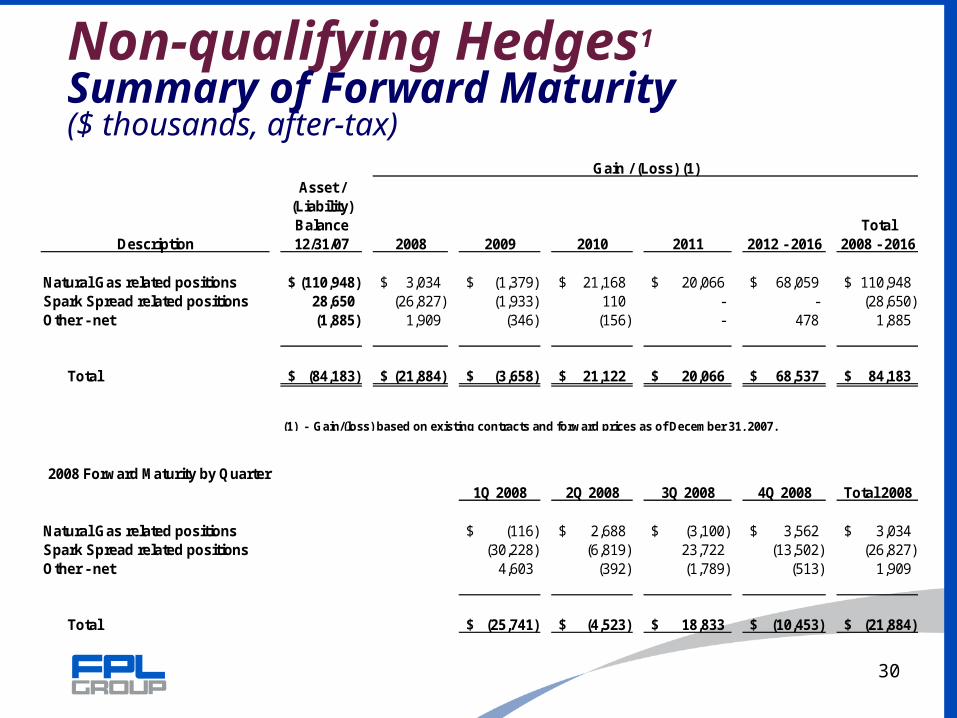
Non-qualifying Hedges1
Summary of Forward Maturity ($ thousands, after-tax)
Gain / (Loss) (1)Asset /
(Liability)Balance Total
Description 12/31/07 2008 2009 2010 2011 2012 - 2016 2008 - 2016
Natural Gas related positions (110,948)$ 3,034$ (1,379)$ 21,168$ 20,066$ 68,059$ 110,948$ Spark Spread related positions 28,650 (26,827) (1,933) 110 - - (28,650) Other - net (1,885) 1,909 (346) (156) - 478 1,885
Total (84,183)$ (21,884)$ (3,658)$ 21,122$ 20,066$ 68,537$ 84,183$
(1) - Gain/(loss) based on existing contracts and forward prices as of December 31, 2007.
2008 Forward Maturity by Quarter1Q 2008 2Q 2008 3Q 2008 4Q 2008 Total 2008
Natural Gas related positions (116)$ 2,688$ (3,100)$ 3,562$ 3,034$ Spark Spread related positions (30,228) (6,819) 23,722 (13,502) (26,827) Other - net 4,603 (392) (1,789) (513) 1,909
Total (25,741)$ (4,523)$ 18,833$ (10,453)$ (21,884)$

31
FPL Energy Wind IndexYear-End Index, Rolling 3 year, current portfolio1
1 Average wind speed for the period from those reference towers chosen to represent FPL Energy’s portfolio -weighted index based on FPL Energy’s portfolio as of 12/31/07.
100 = long-term historic annual weighted mean
94 98 100
05 06 07

32
Bridging Reference Tower Wind Speed to Earnings Impact¹
±1 in the annual portfolio wind index for2008 equates to ± 3 to 4 cents/share1
2009 equates to ± 4 to 5 cents/share1
1 Sets aside uncertainties that can cause actual performance to deviate from that predicted solely by using the wind data from the selected reference towers. 2008 impact based on FPLE’s portfolio as of 12/31/07 plus expected wind project completions in 2008. 2009 impact based on FPLE’s portfolio as of 12/31/07 plus expected wind project completions in 2008/2009. The earnings per share impact is based on a normal distribution around annual wind index values. This relationship should not be applied to quarterly or monthly wind index values due to seasonality of the wind resource and the increased variability associated with shorter observation periods.
Reference Tower Wind Speed
Hub Height Wind Speed
Theoretical Wind Turbine Output
Actual Wind Turbine Output
Earnings Per Share Contribution
Correlation Factor Effect (Reference Tower to Site)
Wind Shear Derivation (Convert Lower Level Measured Wind to Predicted)
Air Density Assumption
Turbine Specific Performance (Power Curve)
Availability
Reliability
Curtailments
Wake Effects
Power Price Paid By Buyer

33
Regional Long Term Wind Reference Locations
The map depicts the 27 ASOS met tower locations that “best” represent FPLE’s production weighted portfolio on December 31, 2007. The following Sydney, NE is a recent addition following the installation of turbines at Peetz, and the wind farm at Mower, MN has been re-assigned from Mason City, IA to Rochester, MN.
Walla Walla
ConcordLivermore
BakersfieldLancaster
Palm Springs
Winkler
Midland AbileneLubbock
Clovis
Gage
Clinton
Evanston
Pierre
Bismarck
Jamestown
Pipestone
Mason City Lone Rock
Johnstown
Scranton
Garden City
Sydney
Rochester
GrandForks
SanAngelo
States with FPL Energy Plant Operations
FPL Energy main office

34
FPL Energy MWs and Regional Reference Towers Fourth Quarter
Reference towers were selected for their proximity to FPL Energy’s wind assets.FPL Energy wind portfolio as of 12/31/07Portfolio weights defined expected annual production
Reference PointAssociated Net
MWs
Long-Term Avg. Wind
Speed (m/s)
2006Avg. Wind
Speed (m/s)2006 Wind
Speed Index
Long-Term 4Q Avg Wind
Speed (m/s)
4Q2006Avg. Wind
Speed (m/s)
4Q2006Wind Speed
Index
4Q2007Avg. Wind
Speed (m/s)
4Q2007Wind Speed
IndexAbilene.TX 849.5 4.95 4.94 99.9 4.80 4.92 102.5 5.46 113.7Midland.TX 595.6 4.87 4.69 96.2 4.51 4.36 96.6 4.75 105.3Sidney.NE 400.5 5.35 5.50 102.8 5.45 5.49 100.6 6.49 119.1
SanAngelo.TX 364.0 4.23 4.34 102.6 4.07 4.20 103.3 4.43 108.8WallaWalla.WA 324.9 3.74 3.72 99.6 3.49 3.45 98.7 3.94 112.9
Bismarck.ND 148.1 4.24 4.27 100.8 4.05 4.07 100.5 4.25 105.0Clovis.NM 204.0 5.20 5.32 102.2 5.24 5.25 100.3 6.07 116.0Clinton.OK 147.0 5.72 5.86 102.3 5.77 6.00 104.0 6.79 117.6
Concord.CA 162.0 3.66 3.20 87.4 2.69 2.29 85.0 2.32 86.4GrandForks.ND 118.5 4.66 4.42 94.8 4.76 4.80 101.0 4.59 96.6
Livermore.CA 256.8 3.36 2.77 82.4 2.61 2.14 82.0 2.22 85.1MasonCity.IA 139.0 5.06 5.09 100.6 5.28 5.16 97.7 5.95 112.8
GardenCity.KS 112.2 5.53 5.51 99.6 5.37 5.16 96.2 6.06 112.8Johnstow n.PA 130.4 4.22 4.15 98.5 4.58 4.26 93.0 4.81 105.2Pipestone.MN 129.7 4.21 3.75 89.1 4.34 3.66 84.5 5.36 123.7Evanston.WY 144.0 4.60 4.24 92.4 4.54 4.23 93.3 5.33 117.4Rochester.MN 98.9 5.23 5.10 97.6 5.55 5.31 95.6 6.35 114.3
Lubbock.TX 84.0 5.37 5.40 100.4 5.09 5.15 101.2 5.55 109.1Gage.OK 102.0 5.16 5.26 102.1 4.90 5.08 103.6 5.58 113.9
PalmSprings.CA 97.5 3.45 3.03 87.7 2.90 2.58 88.9 2.72 93.9Lancaster.CA 101.1 4.96 4.91 99.0 3.84 4.27 111.3 4.49 117.0
Jamestow n.ND 61.5 5.05 4.98 98.5 5.28 5.29 100.2 5.30 100.4Bakersfield.CA 77.0 2.72 2.66 97.9 2.20 2.13 96.9 2.14 97.4
Scranton.PA 64.5 3.04 2.97 97.9 3.00 2.89 96.5 2.81 93.6Pierre.SD 40.5 4.98 4.93 98.9 4.88 4.69 96.2 5.22 106.9
Winkler.TX 68.3 4.22 4.20 99.4 3.79 3.78 99.7 4.00 105.8LoneRock.WI 30.0 3.38 3.16 93.5 3.49 3.30 94.6 3.39 97.1
WAv.2007 5051.5 97.8 98.0 109.5
35
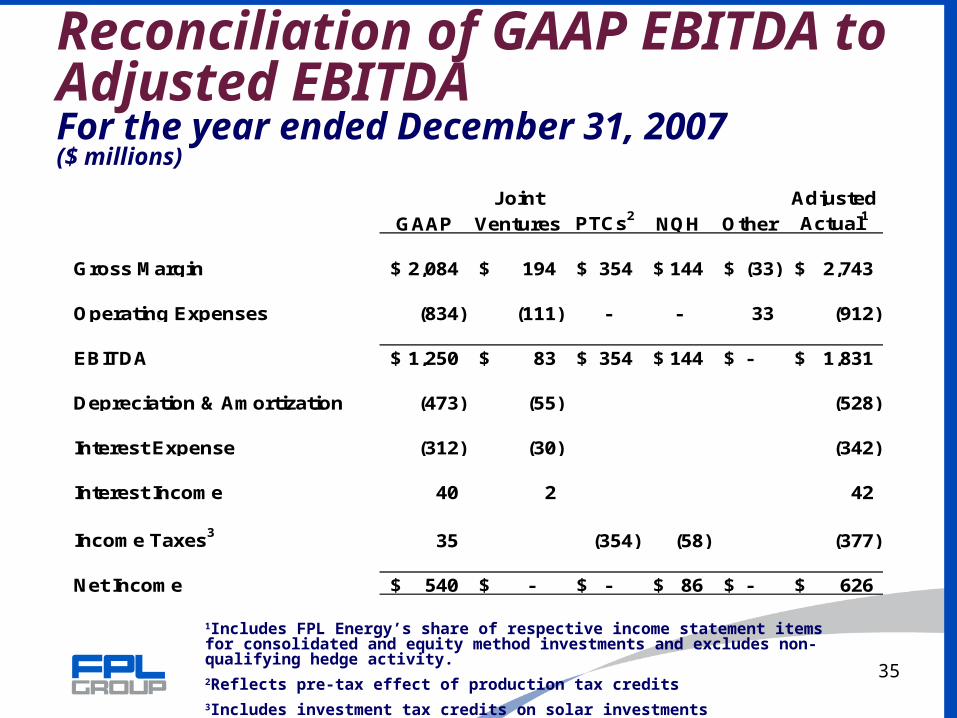
Reconciliation of GAAP EBITDA to Adjusted EBITDAFor the year ended December 31, 2007($ millions)
1Includes FPL Energy’s share of respective income statement items for consolidated and equity method investments and excludes non-qualifying hedge activity.2Reflects pre-tax effect of production tax credits3Includes investment tax credits on solar investments
Joint Adjusted
GAAP Ventures PTCs2 NQH Other Actual1
Gross Margin 2,084$ 194$ 354$ 144$ (33)$ 2,743$
Operating Expenses (834) (111) - - 33 (912)
EBITDA 1,250$ 83$ 354$ 144$ -$ 1,831$
Depreciation & Amortization (473) (55) (528)
Interest Expense (312) (30) (342)
Interest Income 40 2 42
Income Taxes3 35 (354) (58) (377)
Net Income 540$ -$ -$ 86$ -$ 626$

36
Reconciliation of Adjusted EBITDA to GAAP Cash Flow from OperationsFor the year ended December 31, 2007($ millions)
1Includes FPL Energy’s share of respective income statement items for consolidated and equity method investments and excludes non-qualifying hedge activity.2Reflects pre-tax effect of production tax credits3Includes investment tax credits on solar investments
Adjusted EBITDA 1,831$
Adjustments to reconcile Adjusted EBITDAto GAAP Cash Flow from Operations:
Consolidated interest expense, net of interest income (272)$ Differential between equity and earnings and adjusted EBITDA of joint ventures (151) Distributions from joint ventures 175 Income Taxes, net of tax credits (88) Fuel amortization 72 Changes in working capital 21 Changes in other assets and liabilities (66) Other, net (6)
Cash Flow from Operations 1,516$

37
Reconciliation of GAAP Net Income to Adjusted EarningsThree Months Ended December 31, 2007
Florida Power Corporate &
(millions, except per share amounts) & Light FPL Energy Other FPL Group, Inc.
Net Income (Loss) 173$ 72$ (21)$ 224$
Adjustments, net of income taxes:
Net unrealized mark-to-market (gains) losses associated
w ith non-qualifying hedges 58 58
Adjusted Earnings (Loss) 173$ 130$ (21)$ 282$
Earnings (Loss) Per Share (assuming dilution) 0.43$ 0.18$ (0.05)$ 0.56$
Net unrealized mark-to-market (gains) losses associated
w ith non-qualifying hedges 0.15 0.15 Adjusted Earnings (Loss) Per Share 0.43$ 0.33$ (0.05)$ 0.71$
38
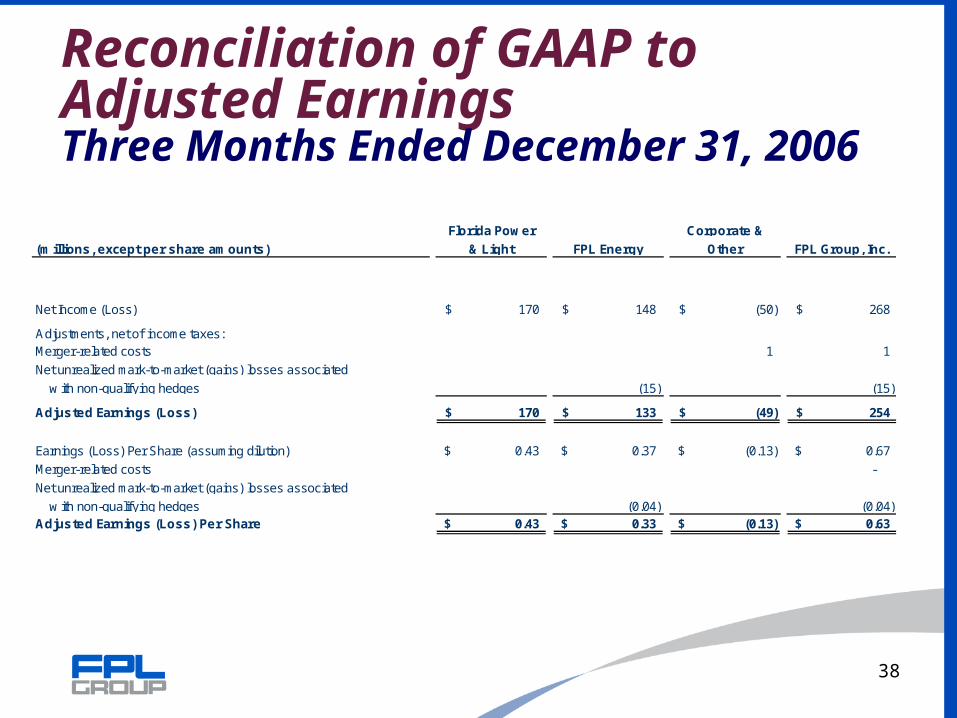
Reconciliation of GAAP to Adjusted EarningsThree Months Ended December 31, 2006
Florida Power Corporate &
(millions, except per share amounts) & Light FPL Energy Other FPL Group, Inc.
Net Income (Loss) 170$ 148$ (50)$ 268$
Adjustments, net of income taxes:Merger-related costs 1 1
Net unrealized mark-to-market (gains) losses associated
w ith non-qualifying hedges (15) (15)
Adjusted Earnings (Loss) 170$ 133$ (49)$ 254$
Earnings (Loss) Per Share (assuming dilution) 0.43$ 0.37$ (0.13)$ 0.67$
Merger-related costs -
Net unrealized mark-to-market (gains) losses associated
w ith non-qualifying hedges (0.04) (0.04) Adjusted Earnings (Loss) Per Share 0.43$ 0.33$ (0.13)$ 0.63$
39
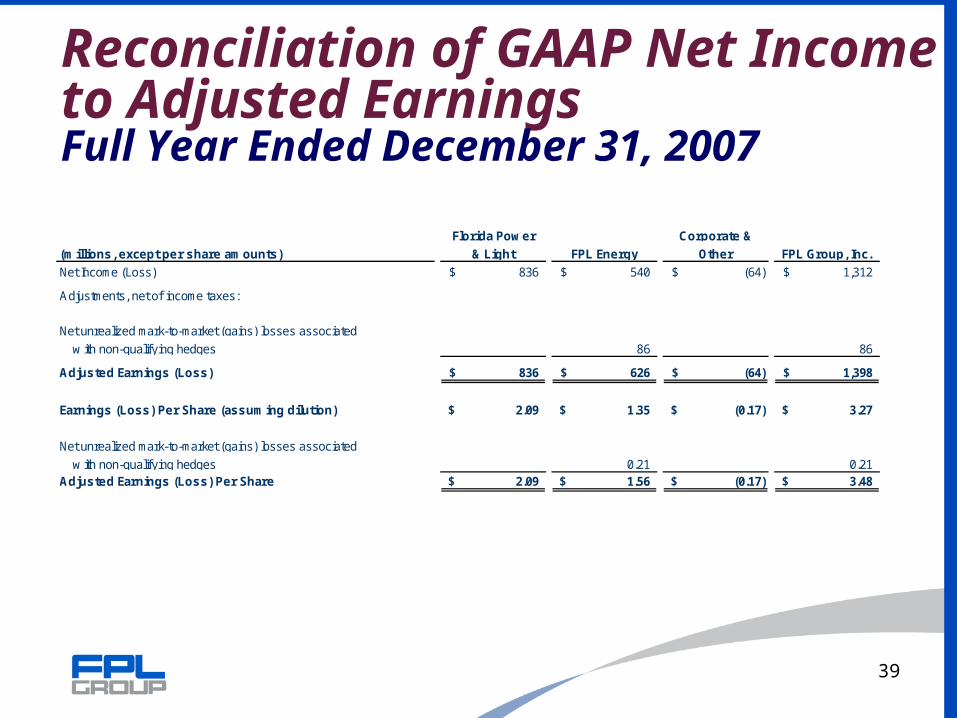
Reconciliation of GAAP Net Income to Adjusted EarningsFull Year Ended December 31, 2007
Florida Power Corporate &
(millions, except per share amounts) & Light FPL Energy Other FPL Group, Inc.
Net Income (Loss) 836$ 540$ (64)$ 1,312$
Adjustments, net of income taxes:
Net unrealized mark-to-market (gains) losses associated
w ith non-qualifying hedges 86 86
Adjusted Earnings (Loss) 836$ 626$ (64)$ 1,398$
Earnings (Loss) Per Share (assuming dilution) 2.09$ 1.35$ (0.17)$ 3.27$
Net unrealized mark-to-market (gains) losses associated
w ith non-qualifying hedges 0.21 0.21 Adjusted Earnings (Loss) Per Share 2.09$ 1.56$ (0.17)$ 3.48$

40
Reconciliation of GAAP to Adjusted EarningsFull Year Ended December 31, 2006
Florida Power Corporate &
(millions, except per share amounts) & Light FPL Energy Other FPL Group, Inc.
Net Income (Loss) 802$ 610$ (131)$ 1,281$
Adjustments, net of income taxes:Merger-related costs 14 14
Net unrealized mark-to-market (gains) losses associated
w ith non-qualifying hedges (92) (92)
Adjusted Earnings (Loss) 802$ 518$ (117)$ 1,203$
Earnings (Loss) Per Share (assuming dilution) 2.02$ 1.54$ (0.33)$ 3.23$
Merger-related costs 0.04 0.04
Net unrealized mark-to-market (gains) losses associated
w ith non-qualifying hedges (0.23) (0.23) Adjusted Earnings (Loss) Per Share 2.02$ 1.31$ (0.29)$ 3.04$

41
Cautionary Statements And Risk Factors That May Affect Future Results
In connection with the safe harbor provisions of the Private Securities Litigation Reform Act of 1995 (Reform Act), FPL Group, Inc. (FPL Group) and Florida Power & Light Company (FPL) are hereby providing cautionary statements identifying important factors that could cause FPL Group's or FPL's actual results to differ materially from those projected in forward-looking statements (as such term is defined in the Reform Act) made by or on behalf of FPL Group and FPL in this presentation, on their respective websites, in response to questions or otherwise. Any statements that express, or involve discussions as to, expectations, beliefs, plans, objectives, assumptions or future events or performance (often, but not always, through the use of words or phrases such as will likely result, are expected to, will continue, is anticipated, believe, could, estimated, may, plan, potential, projection, target, outlook) are not statements of historical facts and may be forward-looking. Forward-looking statements involve estimates, assumptions and uncertainties. Accordingly, any such statements are qualified in their entirety by reference to, and are accompanied by, the following important factors (in addition to any assumptions and other factors referred to specifically in connection with such forward-looking statements) that could cause FPL Group's or FPL's actual results to differ materially from those contained in forward-looking statements made by or on behalf of FPL Group and FPL.
Any forward-looking statement speaks only as of the date on which such statement is made, and FPL Group and FPL undertake no obligation to update any forward-looking statement to reflect events or circumstances, including unanticipated events, after the date on which such statement is made. New factors emerge from time to time and it is not possible for management to predict all of such factors, nor can it assess the impact of each such factor on the business or the extent to which any factor, or combination of factors, may cause actual results to differ materially from those contained in any forward-looking statement.
The following are some important factors that could have a significant impact on FPL Group's and FPL's operations and financial results, and could cause FPL Group's and FPL's actual results or outcomes to differ materially from those discussed in the forward-looking statements:
FPL Group and FPL are subject to complex laws and regulations and to changes in laws and regulations as well as changing governmental policies and regulatory actions, including initiatives regarding deregulation and restructuring of the energy industry and environmental matters including, but not limited to, matters relating to the effects of climate change. FPL holds franchise agreements with local municipalities and counties, and must renegotiate expiring agreements. These factors may have a negative impact on the business and results of operations of FPL Group and FPL.
•FPL Group and FPL are subject to complex laws and regulations, and to changes in laws or regulations, including the Public Utility Regulatory Policies Act of 1978, as amended, the Public Utility Holding Company Act of 2005, the Federal Power Act, the Atomic Energy Act of 1954, as amended, the Energy Policy Act of 2005 (2005 Energy Act) and certain sections of the Florida statutes relating to public utilities, changing governmental policies and regulatory actions, including those of the Federal Energy Regulatory Commission (FERC), the Florida Public Service Commission (FPSC) and the legislatures and utility commissions of other states in which FPL Group has operations, and the Nuclear Regulatory Commission (NRC), with respect to, among other things, allowed rates of return, industry and rate structure, operation of nuclear power facilities, operation and construction of plant facilities, operation and construction of transmission facilities, acquisition, disposal, depreciation and amortization of assets and facilities, recovery of fuel and purchased power costs, decommissioning costs, return on common equity and equity ratio limits, and present or prospective wholesale and retail competition (including but not limited to retail wheeling and transmission costs). The FPSC has the authority to disallow recovery by FPL of any and all costs that it considers excessive or imprudently incurred. The regulatory process generally restricts FPL's ability to grow earnings and does not provide any assurance as to achievement of earnings levels.
FPL Group and FPL are subject to extensive federal, state and local environmental statutes as well as the effect of changes in or additions to applicable statutes, rules and regulations relating to air quality, water quality, climate change, waste management, wildlife mortality, natural resources and health and safety that could, among other things, restrict or limit the output of certain facilities or the use of certain fuels required for the production of electricity and/or require additional pollution control equipment and otherwise increase costs. There are significant capital, operating and other costs associated with compliance with these environmental statutes, rules and regulations, and those costs could be even more significant in the future.
42
FPL Group and FPL operate in a changing market environment influenced by various legislative and regulatory initiatives regarding deregulation, regulation or restructuring of the energy industry, including deregulation or restructuring of the production and sale of electricity. FPL Group and its subsidiaries will need to adapt to these changes and may face increasing competitive pressure.
•FPL Group's and FPL's results of operations could be affected by FPL's ability to renegotiate franchise agreements with municipalities and counties in Florida.
The operation and maintenance of power generation facilities, including nuclear facilities, involve significant risks that could adversely affect the results of operations and financial condition of FPL Group and FPL.
The operation and maintenance of power generation facilities involve many risks, including, but not limited to, start up risks, breakdown or failure of equipment, transmission lines or pipelines, the inability to properly manage or mitigate known equipment defects throughout our generation fleets unless and until such defects are remediated, use of new technology, the dependence on a specific fuel source, including the supply and transportation of fuel, or the impact of unusual or adverse weather conditions (including natural disasters such as hurricanes), as well as the risk of performance below expected or contracted levels of output or efficiency. This could result in lost revenues and/or increased expenses, including, but not limited to, the requirement to purchase power in the market at potentially higher prices to meet contractual obligations. Insurance, warranties or performance guarantees may not cover any or all of the lost revenues or increased expenses, including the cost of replacement power. In addition to these risks, FPL Group's and FPL's nuclear units face certain risks that are unique to the nuclear industry including, but not limited to, the ability to store and/or dispose of spent nuclear fuel and the potential payment of significant retrospective insurance premiums, as well as additional regulatory actions up to and including shutdown of the units stemming from public safety concerns, whether at FPL Group's and FPL's plants, or at the plants of other nuclear operators. Breakdown or failure of an operating facility of FPL Energy may prevent the facility from performing under applicable power sales agreements which, in certain situations, could result in termination of the agreement or incurring a liability for liquidated damages.
The construction of, and capital improvements to, power generation facilities involve substantial risks. Should construction or capital improvement efforts be unsuccessful, the results of operations and financial condition of FPL Group and FPL could be adversely affected.
•FPL Group's and FPL's ability to successfully and timely complete their power generation facilities currently under construction, those projects yet to begin construction or capital improvements to existing facilities within established budgets is contingent upon many variables and subject to substantial risks. Should any such efforts be unsuccessful, FPL Group and FPL could be subject to additional costs, termination payments under committed contracts, and/or the write-off of their investment in the project or improvement.
The use of derivative contracts by FPL Group and FPL in the normal course of business could result in financial losses that negatively impact the results of operations of FPL Group and FPL.
FPL Group and FPL use derivative instruments, such as swaps, options and forwards to manage their commodity and financial market risks. FPL Group provides full energy and capacity requirements services and engages in trading activities. FPL Group could recognize financial losses as a result of volatility in the market values of these contracts, or if a counterparty fails to perform. In the absence of actively quoted market prices and pricing information from external sources, the valuation of these derivative instruments involves management's judgment or use of estimates. As a result, changes in the underlying assumptions or use of alternative valuation methods could affect the reported fair value of these contracts. In addition, FPL's use of such instruments could be subject to prudency challenges and if found imprudent, cost recovery could be disallowed by the FPSC.
FPL Group's competitive energy business is subject to risks, many of which are beyond the control of FPL Group, that may reduce the revenues and adversely impact the results of operations and financial condition of FPL Group.

43
•There are other risks associated with FPL Group's competitive energy business. In addition to risks discussed elsewhere, risk factors specifically affecting FPL Energy's success in competitive wholesale markets include the ability to efficiently develop and operate generating assets, the successful and timely completion of project restructuring activities, maintenance of the qualifying facility status of certain projects, the price and supply of fuel (including transportation), transmission constraints, competition from new sources of generation, excess generation capacity and demand for power. There can be significant volatility in market prices for fuel and electricity, and there are other financial, counterparty and market risks that are beyond the control of FPL Energy. FPL Energy's inability or failure to effectively hedge its assets or positions against changes in commodity prices, interest rates, counterparty credit risk or other risk measures could significantly impair FPL Group's future financial results. In keeping with industry trends, a portion of FPL Energy's power generation facilities operate wholly or partially without long-term power purchase agreements. As a result, power from these facilities is sold on the spot market or on a short-term contractual basis, which may affect the volatility of FPL Group's financial results. In addition, FPL Energy's business depends upon transmission facilities owned and operated by others; if transmission is disrupted or capacity is inadequate or unavailable, FPL Energy's ability to sell and deliver its wholesale power may be limited.
FPL Group's ability to successfully identify, complete and integrate acquisitions is subject to significant risks, including the effect of increased competition for acquisitions resulting from the consolidation of the power industry.
•FPL Group is likely to encounter significant competition for acquisition opportunities that may become available as a result of the consolidation of the power industry, in general, as well as the passage of the 2005 Energy Act. In addition, FPL Group may be unable to identify attractive acquisition opportunities at favorable prices and to successfully and timely complete and integrate them.
Because FPL Group and FPL rely on access to capital markets, the inability to maintain current credit ratings and access capital markets on favorable terms may limit the ability of FPL Group and FPL to grow their businesses and would likely increase interest costs.
FPL Group and FPL rely on access to capital markets as a significant source of liquidity for capital requirements not satisfied by operating cash flows. The inability of FPL Group, FPL Group Capital Inc and FPL to maintain their current credit ratings could affect their ability to raise capital on favorable terms, particularly during times of uncertainty in the capital markets, which, in turn, could impact FPL Group's and FPL's ability to grow their businesses and would likely increase their interest costs.
Customer growth in FPL's service area affects FPL Group's and FPL’s results of operations.
FPL Group's and FPL’s results of operations are affected by the growth in customer accounts in FPL's service area. Customer growth can be affected by population growth as well as economic factors in Florida, including job and income growth, housing starts and new home prices. Customer growth directly influences the demand for electricity and the need for additional power generation and power delivery facilities at FPL.
Weather affects FPL Group's and FPL's results of operations.
FPL Group's and FPL's results of operations are affected by changes in the weather. Weather conditions directly influence the demand for electricity and natural gas and affect the price of energy commodities, and can affect the production of electricity at wind and hydro-powered facilities. FPL Group's and FPL's results of operations can be affected by the impact of severe weather which can be destructive, causing outages and/or property damage, may affect fuel supply, and could require additional costs to be incurred. At FPL, recovery of these costs is subject to FPSC approval.
FPL Group and FPL are subject to costs and other effects of legal proceedings as well as changes in or additions to applicable tax laws, rates or policies, rates of inflation, accounting standards, securities laws and corporate governance requirements.
•FPL Group and FPL are subject to costs and other effects of legal and administrative proceedings, settlements, investigations and claims, as well as the effect of new, or changes in, tax laws, rates or policies, rates of inflation, accounting standards, securities laws and corporate governance requirements.

44
Threats of terrorism and catastrophic events that could result from terrorism may impact the operations of FPL Group and FPL in unpredictable ways.
FPL Group and FPL are subject to direct and indirect effects of terrorist threats and activities. Generation and transmission facilities, in general, have been identified as potential targets. The effects of terrorist threats and activities include, among other things, terrorist actions or responses to such actions or threats, the inability to generate, purchase or transmit power, the risk of a significant slowdown in growth or a decline in the U.S. economy, delay in economic recovery in the U.S., and the increased cost and adequacy of security and insurance.
The ability of FPL Group and FPL to obtain insurance and the terms of any available insurance coverage could be affected by national, state or local events and company-specific events.
FPL Group's and FPL's ability to obtain insurance, and the cost of and coverage provided by such insurance, could be affected by national, state or local events as well as company-specific events.
FPL Group and FPL are subject to employee workforce factors that could affect the businesses and financial condition of FPL Group and FPL.
FPL Group and FPL are subject to employee workforce factors, including loss or retirement of key executives, availability of qualified personnel, collective bargaining agreements with union employees and work stoppage that could affect the businesses and financial condition of FPL Group and FPL.
The risks described herein are not the only risks facing FPL Group and FPL. Additional risks and uncertainties not currently known to FPL Group or FPL, or that are currently deemed to be immaterial, also may materially adversely affect FPL Group's or FPL's business, financial condition and/or future operating results.
