earned value analysis - eva
TRANSCRIPT

I
AACE International 1265 Suncrest Towne Centre Drive Morgantown, WV 26505‐1876 USA. Technical Paper for CCC Examination A Technical Paper is submitted to AACEI in partial fulfillment of the requirements for recognition as Certified Cost Consultant.
Earned Value Analysis – EVA
A Project Management Tool
Ahmed Bin Ali Bamasdoos
Candidate Constituent Number 66828 (Exam Calendar 8th March, 2012)
Date: 2nd January, 2012

Earned Value Analysis ‐ EVA
II
Table of Contents
List of Tables & Figures………………………………….………………………………………………………………..……III
Abstract…………………………………………..…………………………………………….........................................IV
1. Introduction…………………………………………………………………………………………………….……..……....1
2. EVM History, Rewards & Recognitions………………………………………………………..……………….……2
3. EVM Objectives…………………………………………………………………………………………….…………….……3
4. What is EVM .......................................................................................................................3
5. Why use EVM......................................................................................................................3
6. EVM Advantages & Disadvantages………………………….……………………………………….……………….4
7. Earned Value Analysis EVA Presentation, Definitions & Explanation
7.1. EVM Definitions……………………………………………………………………….……………………………..……….5
7.2. Earned Value Analysis (EVA)……………………………………………………………………………..……………..5
7.3. EVA Terminology……………………………………………………………………………………………………………..6
7.4. EVA Formulas & Interpretation………………………………………………………………………………………..7
7.5. EVA Key Dimension & Other Elements……………………………………………………………………………..8
7.5.1 Planned Value (PV)……………………………………………………………………………………………………………8
7.5.2 Earned Value (EV)……………………………………………………………………………………………………………..9
7.5.3 Actual Cost (AC)…………………………………………………………………………………………………………………10
7.5.4 Schedule Variance (SV)…………………………………………………………………………………………………....11
7.5.5 Cost Variance (CV)…………………………………………………………………………………………………………….12
7.5.6 Schedule Performance Index (SPI)…………………………………………………………………………………...12
7.5.7 Cost Performance Index (CPI)…………………………………………………………………………………………..13
7.5.8 Budget at Completion (BAC) …………………………………………………………….……………………………...13

Earned Value Analysis ‐ EVA
III
7.5.9 Estimate at Completion (EAC)…………………………………………………………………………….……………..13
7.5.10 Estimate to Completion (ETC)………………………………………………………………………….….…………….14
7.5.11 Variance at Completion (VAC)……………………………………………………………………….………………….15
8. Illustrative explanation of Earned Value Analysis……………………………………….…….…….………....15
8.1 Calculation of Variations (SV & CV)…………………………………………………………………….……………………16
8.2 Calculation of Variations % (SV % & CV %)……………………………………………………….……………….…….16
8.3 Calculation of Index (SPI & CPI)…………………………………………………………………………………………......17
8.4 Calculation of Forecast (EAC, BAC, ETC, VAC & TCPI)………………………………………..……………………..18
9. Earned Value Analysis (EVA) Graphical Presentation
9.1. EVA “ Unde Budget & Behind Schedule”. ………………………………………………………….…….…………..19
9.2. EVA “Over Budget & Behind Schedule”………………………………………………………………….….…………..20
9.3. EVA “Under Budget & Ahead Schedule”………………………………………………………………….….…………20
9.4. EVA “Over Budget & Ahead Schedule”………………………………………………………………………….…….…21
10. Conclusion……………………………………………………………………………………………………………….……..22
11. Summary………………………………………………………………………………………………………………….……..23
12. Bibliography & References……………………………………………………………………………………….……..24

Earned Value Analysis ‐ EVA
IV
List of Tables
Table 1.1: Earned Value Analysis Terminology…………………………………………………………………..………6
Table 1.2: Earned Value Analysis Formulas & Interpretation………………………………………………………7
Table 2.1: EVA KEY DIMENSION (PV, EV & AC) table for a project ABC………………………………….…. 15
Table 2.2: Calculation of Variations (Schedule Variance & Cost Variance) for Project ABC………...16
Table 2.3: Calculation of Index (SPI & CPI) for Project ABC…………………………………………………….….17
Table 2.4: Calculation of Forecast (EAC, BAC, ETC, VAC & TCPI) for Project ABC…………….…………..18
List of Figures
Figure 1.1: Cumulative PV Curve for Project XYZ…………………………………………………………….……..9
Figure 1.2: Cumulative PV vs. EV Curves for Project XYZ………………………………………………………..10
Figure 1.3: Cumulative PV vs. EV vs. AC Curves for Project XYZ……………………………………………..11
Figure 2.1: Cumulative Curves for PV, EV, AC & EAC. (Under Budget & Behind Schedule)………19
Figure 2.2: Cumulative Curves for PV, EV, AC & EAC. (Over Budget & Behind Schedule)………...20
Figure 2.3: Cumulative Curves for PV, EV, AC & EAC. (Under Budget & Ahead Schedule)……….20
Figure 2.4: Cumulative Curves for PV, EV, AC & EAC. (Over Budget & Ahead Schedule)………….21

Earned Value Analysis ‐ EVA
V
Abstract
“Earned Value Management (EVM)” helps the project team to measure project performance. It is a
systematic project management process used to find variances in projects based on the comparison of
worked performed and work planned. EVM is used on the cost and schedule control and can be very
useful in project forecasting. The project baseline is an essential component of EVM and serves as a
references point for all EVM related activities.
Earned Value Analysis is a best method of calculation to integrates cost,
schedule and scope and can be used to forecast future performance and project completion dates. It
is an “early warning” program / project management tool that enable project team to identify and
control the problems before they become insurmountable, it allows projects to be managed better –
on time, on budget.
Key Words: (Earned Value Analysis), (Project Control), (Project Management)

Earned Value Analysis ‐ EVA
1
1. Introduction
“Earned Value Management (EVM)” is a program management technique that used “work in
progress” to indicate what will happened to work in the future. EVM is an enhancement over
traditional accounting progress measure. Traditional methods focus on planned accomplishment
(expenditure) and actual cost. Earned Value Analysis goes one step further and examines actual
accomplishment. This gives to project team a greater insight into potential risk areas. With clearer
picture, project team can create risk mitigation plans based on the actual cost, schedule and technical
progress of the work, it is an “early warning” program/project management tool that enables
managers to identify and control problems before they become insurmountable. It allows projects to
be managed better – on time on budget. EVM System is not a specific system or tool set, but rather, a
set of guidelines that guide a company’s management control system.

Earned Value Analysis ‐ EVA
2
2. EVM History, Reward & Recognition
Ref: DoD USA, “Earned Value Management Implementation” Guide Oct, 2006”, Signed by “KEITH D. ERNST” Director Defense Contract Management Agency).
According to the NASA headquarters library, the first version of Earned Value Management was
developed by the Department of Defense (DoD) USA in 1967, to established the Cost/Schedule
Control System Criteria (C/SCSC) to standardize contractor requirements for reporting cost and
schedule performance on major contracts. Since 2005, EVM has been a part of general federal project
risk management. Today EVM is a mandatory requirement of the US government. The Office of
Management and Budget (OMB). Promotes use of EVM as a preferred performance‐based
management system to manage software projects. EVM is also used in the private sector by
companies in a variety of industries, consulting firms and educational establishments.
Some of the most well known organizations practicing EVM are:
• NASA
• Project Management Institute (PMI)
• Society of Cost Estimating and Analysis
• Federal Acquisition Institute
• Acquisition Management (UK)
Based on reports of the General Accounting Office (GAO) in August 1996 a memorandum of
understanding concerning common cost and schedule management for acquisitions was signed by
Australia, Canada, and the Unites States. This gives international recognition to EVM worldwide. The
NASA Office of Chief Engineer is sponsoring an “Earned Value Management AVM Award of
Excellence” to present at the NASA PM Challenge Conference.

Earned Value Analysis ‐ EVA
3
3. EVM Objective
The Main objective for EVM is tool to “measuring a project’s progress at any given point in time,
forecasting it’s a completion date and final cost”, and analyzing variances in the schedule and budget
as the project proceeds. It compares the planned amount of work with what has actually been
completed, to determine if the cost, schedule, and work accomplished are progressing in accordance
with the plan. As work is completed, it is considered as “Earned”.
4. What is Earned Value Management (EVM)?
• Earned Value Management (EVM) is an incremental methodology for measuring project
performance by determining cost and schedule performance of a project by comparing
“planned” worked with “accomplished” work in terms of the dollar value assigned to the work,
and determining the need to recommend corrective actions.
• EVM is a “Management Tool” which provides a snapshot of project performance at a point in
time. And compares where the project is now with previous work accomplished and where the
project was planned to be. And also it serves as an “early warning” system to detect deficient
or endangered progress.
5. Why use Earned Value Management (EVM)?
• When you manage project performance by just comparing planned to actual results, you could
easily be on time but overspend according to your plan.

Earned Value Analysis ‐ EVA
4
• Using EVM is a better method because it integrates cost, time and work done and can be used
to forecast future performance and project completion dates and costs.
• Earned value analysis results should be a major part of project reporting.
• EVM is the basis for course correction and will lead to new forecasted completion cost, change
requests and other items that will need to communicate.
• EVM provides an accurate picture of contract status and supports mutual goals of contractors
and customer.
6. EVM Advantages & Disadvantages:
S.No. Descriptions EVM Advantages EVM Disadvantages
1 VARIANCE ANALYSIS
Shows Current Status in term of Cost & Schedule.
Time consuming and requires experienced effort to measure and analyze the performance.
2 FORECASTING It enables predictions of cost at completion and completion date.
It depends on reliable measurements that can be difficult to achieve for some cost types.
3 EFFICIENCY
Provides performance indices identifying area under of ever performing and enquiring corrective action.
Past performance is not necessarily an indication of future performance.
4 ESTIMATING ACCURACY
Provides feedback of the actual performance against the baseline estimates
It does not take into account risks and uncertainties
5 DECESIONS Provides triggers for escalating problems and helps in taking sudden decisions.
It Requires a compatible cost tracking system and it will be never 100% accurate. So sometimes decision can take wrongly.

Earned Value Analysis ‐ EVA
5
7. Earned Value Analysis Definitions, Presentation & Explanation
7.1 Earned Value Definitions: (Ref: “Projectsmart.co.uk” By Duncan Haughty, PMP)
NASA defines it as, "An integrated management control system for assessing, understanding
and quantifying what a contractor or field activity is achieving with program dollars. EVM
provides project management with objective, accurate and timely data for effective decision
making."
Englert and Associates, Inc define it as, "A method for measuring project performance. It
compares the amount of work that was planned with what was actually accomplished to
determine if cost and schedule performance is as planned."
7.2 Earned Value Analysis (EVA)
Earned Value Analysis is an industry standard method of measuring a project’s progress at any
given point in time, forecasting its completion date and final cost, and analyzing variances in
the schedule and budget as the project proceeds. It compare the planned amount of work with
has actually been completed, to determine if the cost, schedule and work accomplished are
progressing in accordance with the plan. As work is complete, it is considered as “Earned”.

Earned Value Analysis ‐ EVA
6
7.3 Earned Value Analysis Terminology – Table 1.1 (Ref: “PMI PMstudy Targeting Success” PMstudy.com)
Acronym Term Description PV Planned Value The authorized budget assigned to the schedule
work to be accomplished for a schedule activity or WBS component.
(BCWS) (Budget Cost of Work Scheduled)
EV Earned Value The value of work performed expressed in terms of the approved budget assigned to that work for a schedule activity or WBS component.
(BCWP) (Budget Cost of Work Performed)
AC Actual Cost (Actual Budget
Work Performed) Actual Cost of work completed that is incurred and recorded
SV Schedule Variance A measure of the schedule performance on a project. (Negative SV: Behind the Schedule) (Positive SV: Ahead of schedule)
CV Cost Variance A measure of the cost performance on a project. (Negative CV: Over Budget) (Positive CV: Under Budget)
CPI Cost Performance Index A measure of cost efficiency on a project. The value got for 1 $ of actual cost
SPI Schedule Performance Index A measure of schedule efficiency on a project. Progress as a % of Planned Progress
EAC Estimate at Completion The expected total cost when the defined scope of work will be completed.
1. Original estimated assumptions no longer valid 2. Current variance are a typical, similar variances will not occur in the future 3. Current variances are typical, Similar variances may occur in future 4. EAC taking both CPI and SPI into account
BAC Budget at Completion Budget for the whole project
ETC Estimate to Completion From a particular point in time, how much more time is required to complete the project
VAC Variance at Completion Over or Under Budget
TCPI To Complete Performance
Index The work remaining divided by the funds remaining,
1. Equation Expressed in terms of EAC:
2. Equation Expressed in terms of BAC:

Earned Value Analysis ‐ EVA
7
7.4 Earned Value Analysis Formulas & Interpretation – Table 1.2 (Ref: “PMI PMstudy Targeting Success” PMstudy.com)
Acronym Formula Analysis PV
What is the estimated value of the work planned to be done? (BCWS)
EV
What is the estimated value of the work actually accomplished? (BCWP)
AC What is the actual cost incurred?
SV EV – PV NEGATIVE is behind the Schedule (or) POSITIVE is ahead the Schedule.
CV EV – AC NEGATIVE is over the budget (or) POSITIVE is under the budget.
CPI EV/AC = BAC/EAC LESS THAN 1.0 is over the budget (or) GREATER THAN 1.0 is under the budget.
SPI EV/PV LESS THAN 1.0 is behind the Schedule (or) GREATER THAN 1.0 is ahead the Schedule.
EAC
Note: There are many ways to calculate EAC
AC + ETC Actually Cost plus new estimate cost for remaining work. Used when original estimate was fundamentally flawed.
AC + BAC – EV Actual cost plus remaining budget. Used when current variances are atypical.
AC + {(BAC ‐ EV)/CPI} OR BAC/CPI Actual cost plus remaining budget modified by performance. Used when current variances are atypical.
AC + {(BAC ‐ EV)/(CPI*SPI) Actual cost plus remaining budget modified by performance. While both taken into account CPI & SPI
BAC EAC * CPI How much did you BUDGET for the TOTAL PROJECT
ETC EAC – AC How much more will the project Cost?
VAC BAC – EAC How much over budget will we be at the end of project?
TCPI
PROJECTED VALUE LESS THAN 1.0 is Over the Budget (or) PROJECTED VALUE GREATER THAN 1.0 is Under the Budget.
(BAC‐EV) / (EAC ‐ AC)
(BAC‐EV) / (BAC ‐ AC)

Earned Value Analysis ‐ EVA
8
7.5 Earned Value Analysis Key Dimensions
EVA develops and monitors three key dimensions for each work package and control account:
7.5.1 BCWS = Planned Value (PV)
7.5.2 BCWP = Earned Value (EV)
7.5.3 ACWP = Actual Cost (AC)
As of first quarter of year 2002 there is shifting in using the below terms as above.
7.5.1 Budgeted Cost of Work Schedule (BCWS)
7.5.2 Budgeted Cost of Work Performed (BCWP)
7.5.3 Actual Cost of Work Performed (ACWP)
7.5.1 Planned Value (PV) or (BCWS) (Ref: “PMI PMBOK GUIDE” Fourth Edition)
Planned value (PV) is the authorized budget assigned to the work to be accomplished for
an activity or work breakdown structure component. It includes the detailed authorized
work, plus the budget for such authorized work, allocated by phase over the life of the
project. The total of the PV is sometimes referred to as the performance measurement
baseline (PMB). The total PV for the project is also known as Budget at Completion (BAC).
Planned Value is usually charted showing the cumulative resources budgeted across the
project schedule. Figure 1.1 shows the Planned Value S‐curve for Project XYZ.

Earned Value Analysis ‐ EVA
9
1040
64
96
134
176
220236
256 268284
300
0
50
100
150
200
250
300
350
Jan‐11 Feb‐11 Mar‐11 Apr‐11 May‐11 Jun‐11 Jul‐11 Aug‐11 Sep‐11 Oct‐11 Nov‐11 Dec‐11
P…
Figure 1.1 ‐ Cumulative Planned Value for Project XYZ.
7.5.2 Earned Value (EV) or (BCWP) (Ref: “PMI PMBOK GUIDE” Fourth Edition)
Earned value (EV) is the value of work performed expressed in terms of the approved
budget assigned to the work for an activity or work breakdown structure component. It is
the authorized work that has been completed, plus the authorized budget for such
completed work. The EV being measured must be related to the PV baseline (PMB), and
the EV measured cannot be greater than the authorized PV budget for a component. The
term EV is often used to describe the percentage completion of a project. Project
Managers monitor EV, both incrementally to determine current status and cumulatively to
determine the long term performance trends. Figure 2.2 Shows the Earned Value for the
project XYZ at the month of July 2011 mark, and indicates that less work executed than
planned has been accomplished.
Duration in Months
PROJECT XYZ – Planned Value
Data Date

Earned Value Analysis ‐ EVA
10
10
4064
96
134
176
220236
256268
284300
176
0
50
100
150
200
250
300
350
Jan‐11 Feb‐11 Mar‐11 Apr‐11 May‐11 Jun‐11 Jul‐11 Aug‐11 Sep‐11 Oct‐11 Nov‐11 Dec‐11
PV
EV
Figure 1.2 ‐ Cumulative Planned Value and Earned Value for Project XYZ.
7.5.3 Actual Cost (AC) or (ACWP) (Ref: “PMI PMBOK GUIDE” Fourth Edition)
Actual Cost (AC) is the total cost actually incurred and recorded in accomplishing work
performed for an activity or work breakdown structure component. It is the total cost
incurred in accomplishing the work that the EV measured. The AV has to correspond in
definition to whatever was budgeted for in the PV and measured in the EV. (e.g. direct
hours only, direct costs only, or all costs including indirect costs). The AC will have no upper
limit; whatever is spend to achieve the EV will be measured. Figure 1.3 shows the Actual
Cost for Project XYZ at the month of July, 2011 mark, and indicates that the organization
has spent less than it planned to spend, to achieve the work performed to date but it is
more than work executed.
Duration in Months
PROJECT XYZ – Planned Value & Earned Value
Data Date

Earned Value Analysis ‐ EVA
11
1040
64
96
134
176
220236
256 268284
300
176200
0
50
100
150
200
250
300
350
Jan‐11 Feb‐11 Mar‐11 Apr‐11 May‐11 Jun‐11 Jul‐11 Aug‐11 Sep‐11 Oct‐11 Nov‐11 Dec‐11
PV
EV
Figure 1.3 ‐ Cumulative Planned Value and Earned Value for Project XYZ.
7.5.4 Schedule Variance (SV) (Ref: “PMI PMBOK GUIDE” Fourth Edition)
Schedule Variance (SV) is a measured of schedule performance on a project. It is equal to
the earned value (EV) minus the planned value (PV). The EVM schedule variance is a useful
metric in that it can indicate a project falling behind its baseline schedule. The EVM
schedule variance will ultimately equal zero when the project is completed because all the
planned values will have been earned. EVM SVs are best used in conjunction with critical
path methodology (CPM) scheduling and risk management. Equation: SV = EV – PV
Duration in Months
PROJECT XYZ – Planned & Earned Values & Actual Cost
Data Date

Earned Value Analysis ‐ EVA
12
7.5.5 Cost Variance (CV) (Ref: “PMI PMBOK GUIDE” Fourth Edition)
Cost Variance (CV) is a measured of cost performance on a project. It is equal to the earned
value (EV) minus the actual cost (AC). The cost variance at the end of the project will be the
difference between the budget at completion (BAC) and the actual amount spent. The EVM
CV is particularly critical because it indicates the relationship of physical performance to
the costs spent. Any negative EVM CV is often non‐recoverable to the project.
Equation: CV = EV ‐ AC
The SV and CV can be converted to efficiency indicators to reflect the cost and schedule
performance of any project for comparison against all other projects or within a portfolio
of projects. The variances and indices are useful for determining project status and
providing a basis for estimating project cost and schedule outcome.
7.5.6 Schedule Performance Index (SPI) (Ref: “PMI PMBOK GUIDE” Fourth Edition)
Schedule Performance Index (SPI) is a measure of progress achieved compared to progress
planned on a project. It is sometimes used in conjunction with the cost performance index
(CPI) to forecast the final project completion estimates. An SPI value less than 1.0 indicates
less work was completed than was planned, An SPI greater than 1.0 indicates that more
work was completed than was planned. Since the SPI measure all project work, the
performance on the critical path must also be analyzed to determine whether the project

Earned Value Analysis ‐ EVA
13
will finish ahead of or behind its planned finish date. The SPI is equal to the ration of the EV
to the PV. Equation: SPI = EV / PV.
7.5.7 Cost Performance Index (CPI) (Ref: “PMI PMBOK GUIDE” Fourth Edition)
Cost Performance Index (CPI) is a measure of the value of work completed compared to
the actual cost or progress made on the project. It is considered the most critical EVM
metric and measure the cost efficiency for the work complete. A CPI value less than 1.0
indicates a cost overran for work completed. A CPI value greater than 1.0 indicates a cost
under run of performance to date. The CPI is equal to the ratio of the EV to the AC.
Equation: CPI = EV/AC.
7.5.8 Budget at Completion (BAC)
Budget at Completion (BAC) is the sum of the entire budget value that has been previously
established for the work to be performed on a project, or on components within a project
such as schedule activity or WBS component. The budget at completion also called as the
total planned value of the project.
Equation: BAC = EAC * CPI
7.5.9 Estimate at Completion (EAC)
Estimate at Completion (EAC) is an input output device that is used to measure the
expected total cost of a particular schedule activity, a WBS component or of the project as
a whole. It is a forecast of most likely total project costs based on project performance and

Earned Value Analysis ‐ EVA
14
risk quantification. At the start of the project BAC and EAC will be equal. EAC will vary from
BAC only when AC varies from PV. Most common forecasting techniques are some of:
7.5.9.1 EAC = Actual cost to date plus new estimate for all remaining work. This
approach is most often used when past performance shows that the original
estimating assumptions were fundamentally flawed, or they are no longer
relevant to a change in conditions.
7.5.9.2 EAC = Actual Cost to date plus remaining budget. This approach is most
often used when current variances are seen as atypical and the project
management team expectations are that similar variance will not occur in the
future.
7.5.9.3 EAC = Actual Cost to date plus the remaining budget modified by a
performance factor, Often the cumulative cost performance index (CPI). This
approach is most often used when current variances are seen as typical of
future variances
7.5.9.4 EAC = BAC modified by performance factor, cumulative cost performance
index (CPI). This approach is most often used when no variances from BAC
have occurred.
7.5.10 Estimate to Complete (ETC)
Estimate to Complete the difference between Estimate at Completion (EAC) and Actual
Cost (AC), this is the estimated additional cost to complete the project form any given
time. Equation: ETC = EAC – AC

Earned Value Analysis ‐ EVA
15
7.5.11 Variance at Completion (VAC)
The difference between Budget at Completion (BAC) and Estimate at Completion (EAC).
This is the dollar value by which the project will over or under the budget.
Equation: VAC = BAC – EAC
8 Illustrative explanation of Earned Value Analysis.
The information given below for Project ABC cumulative PV, EV & AC and project duration is 12 months.
Earned Value Analysis (PV, EV & AC) for Project ABC “As of July, 2011 – Table 2.1
DESCRIPTION Jan‐11
Feb‐11
Mar‐11
Apr‐11
May‐11
Jun‐11
Jul‐11
Aug‐11
Sep‐11
Oct‐11
Nov‐11
Dec‐11
DIM
ENSIONS Planned Value(PV) 10 50 114 210 344 520 740 980 1,236 1,504 1,788 2,000
Earned Value (EV) 8 45 110 200 310 490 610
Actual Cost (AC) 11 48 112 205 320 505 650
Planned Value (PV) = 2,000
Earend Value (EV) = 610
Actual Cost (AC) = 650
EVA Data Date = July, 2011

Earned Value Analysis ‐ EVA
16
8.1 Calucuation of Variations:
a. Scheduel Variance (SV) = Earned Value ‐ Planned Value (AV ‐ PV)
b. Cost Variance (CV) = Earned Value ‐ Actual Cost (EV ‐ AC)
Earned Value Analysis (SV & CV) for Project ABC “As of July, 2011 – Table 2.2
DESCRIPTION Formula Jul‐11
VARIATIONS
Schedule Variance (SV)
=610‐740 ‐130
Cost Variance (CV) =610‐650 ‐40
8.2 Calcualation of Varinces %:
a. Schedule Variance SV% = SV/PV = ‐130/740 = 18% Behind the Schedule.
b. Cost Variance CV% = CV/EV = ‐40/610 = 7% Overrun
The above table 2.2 shows a clear picture of the actual status of the work done and cost. Currently
shows the schedule variance of $‐130. It was sheduled to be completed $740 of work, and have only
completed for $610. In addition, the work that was completed for $610 has cost more than we had
planned $650, creating a cost variance of $‐40. It means project is running “Behind the Schedule by
18% & Over the Budget by 7%”.

Earned Value Analysis ‐ EVA
17
8.3 Calucuation of Index:
a. Scheduel Performance Index (SPI) = Earned Value/Planned Value (EV/ PV)
b. Cost Performance Index (CPI) = Earned Value/Actual Cost (EV/AC)
Earned Value Analysis (SPI & CPI) for Project ABC “As of July, 2011 – Table 2.3
DESCRIPTION Formula Jul‐11
INDEX
Schedule Performance Index (SPI) =610/740 0.82
Cost Performance Index (CPI) =610/650 0.94
The Above table 2.3 shows a clear index for actual wok done status based on time and cost. Currently
SPI is 0.82. as it is less than 1.0 means the project is running “Behind the Schedule”. In addition, the
CPI is 0.94. as it is also less than 1.0 means the project running “Over the Budget”.
8.4 Calucuation of Forecast:
a. Estimate at Completion (EAC) = AC + {(BAC ‐ EV)/(CPI*SPI)
b. Budget at Completion (BAC) = EAC * CPI
c. Estimate to Complete (ETC) = EAC – AC
d. Variance at Completion (VAC) = BAC – EAC
e. Total Complete Performance Index (TCPI) = (BAC‐EV) / (EAC ‐ AC)

Earned Value Analysis ‐ EVA
18
Earned Value Analysis (EAC, BAC, ETC, VAC & TCPI) for Project ABC “As of July, 2011) – Table 2.4
DESCRIPTION Formula Jul‐11
FORE
CAST
Estimate at Completion (EAC) =650+(2000‐610)/(0.94*0.82) 2,447
Budget at Completion (BAC) =2,447*0.94 2,296
Estimate to Complete (ETC) =2,477‐650 1,797
Variance at Completion (VAC) =2,296‐2,447 ‐151
Total Complete Performance Index (TCPI) =(2,296/610)/(2,447‐650) 0.94
The above table 2.4 currently it shows the following:
a. “Estimate at Completion” shows $2,447, where as it was scheduled based on time and cost to
be completed the work for $2,000.
b. The “Budget at Completion” shows $2,296 where as it was budgeted based on time & cost to
be compelted the work for $2,000.
c. The “Estimate to Complete” shows as follows:
• Cost Based: $1,797 is the projected cost for future work to be executed.
• Time Based: (BAC/SPI)/(BAC/12) = 14.5 Months will be total project duration.
d. The “Variance at Completion” shows $‐151 as over budgeted at end of project.
e. The “Total Complete Performance Index” shows 0.94. as it is less than 1.0 this proejct will be
overbudget at end fo the project.
Based on the above calculations, Project ABC will be cost $2,447 & 14.5 Months to complete.
Earned Value Analysis ‐ EVA
19
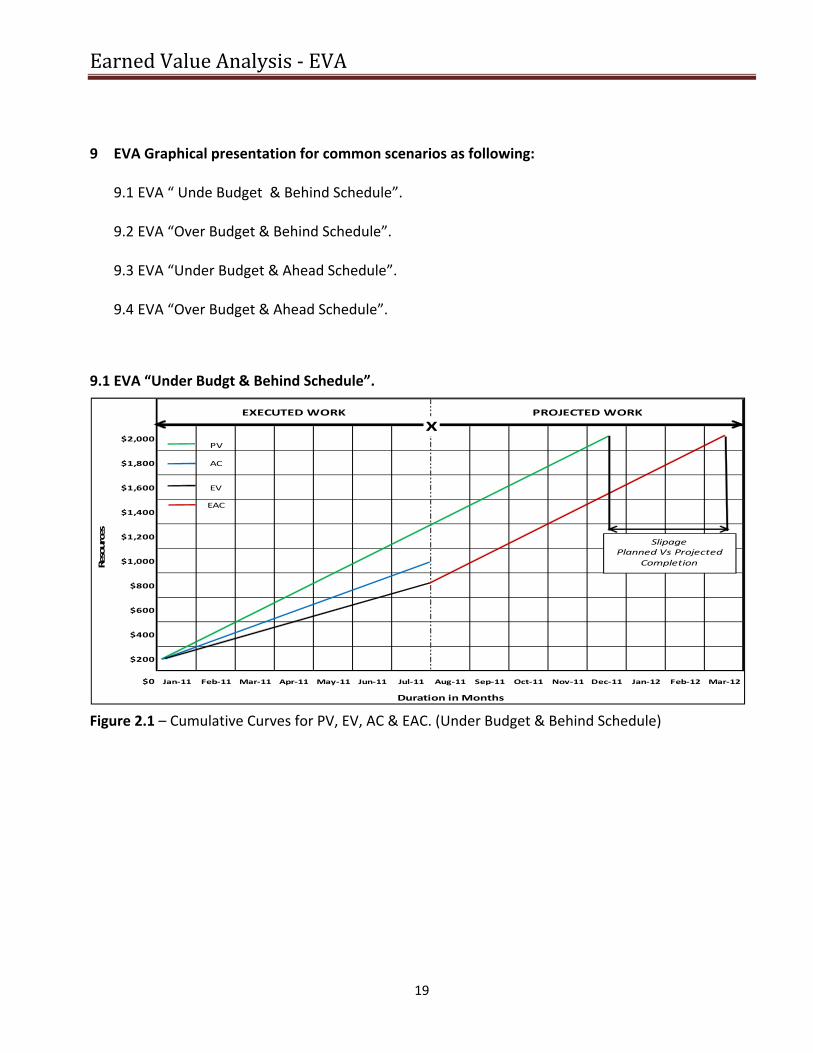
9 EVA Graphical presentation for common scenarios as following:
9.1 EVA “ Unde Budget & Behind Schedule”.
9.2 EVA “Over Budget & Behind Schedule”.
9.3 EVA “Under Budget & Ahead Schedule”.
9.4 EVA “Over Budget & Ahead Schedule”.
9.1 EVA “Under Budgt & Behind Schedule”.
Figure 2.1 – Cumulative Curves for PV, EV, AC & EAC. (Under Budget & Behind Schedule)
$2,000PV
$1,800 AC
$1,600 EV
$1,400EAC
$1,200
$1,000
$800
$600
$400
$200
$0 Jan‐11 Feb‐11 Mar‐11 Apr‐11 May‐11 Jun‐11 Jul‐11 Aug‐11 Sep‐11 Oct‐11 Nov‐11 Dec‐11 Jan‐12 Feb‐12 Mar‐12
Resources
EXECUTED WORK PROJECTED WORK
Duration in Months
X
SlipagePlanned Vs Projected
Completion

Earned Value Analysis ‐ EVA
20
9.2 EVA “Over Budget & Behind Schedule”.
Figure 2.2 – Cumulative Curves for PV, EV, AC & EAC. (Over Budget & Behind Schedule)
9.3 EVA “Under Budget & Ahead Schedule”.
Figure 2.3 – Cumulative Curves for PV, EV, AC & EAC. (Under Budget & Ahead Schedule)
$2,500PV
$2,200 AC
$2,000 EV
$1,800EAC
$1,600
$1,400
$1,200
$1,000
$800
$600
$400
$200
‐ Jan‐11 Feb‐11 Mar‐11 Apr‐11 May‐11 Jun‐11 Jul‐11 Aug‐11 Sep‐11 Oct‐11 Nov‐11 Dec‐11 Jan‐12 Feb‐12 Mar‐12
Duration in Months
Resources
Completion Variation
EXECUTED WORK PROJECTED WORK
X
Cost Variation
$2,000PV
$1,800 AC
$1,600 EV
$1,400EAC
$1,200
$1,000
$800
$600
$400
$200
$0 Jan‐11 Feb‐11 Mar‐11 Apr‐11 May‐11 Jun‐11 Jul‐11 Aug‐11 Sep‐11 Oct‐11 Nov‐11 Dec‐11
EXECUTED WORK PROJECTED WORK
Duration in Months
X
Cost Variation

Earned Value Analysis ‐ EVA
21
9.4 EVA “Over Budget & Ahead Schedule”.
Figure 2.4 – Cumulative Curves for PV, EV, AC & EAC. (Over Budget & Ahead Schedule)
Explaination:
In the above figures commonly represented the curves as follows:
• Green curve shown as Planned Value (PV) form the project start to finish dates
• Blue curve showsn as Actual Cost (AC) from the project start to data date end of July, 2011.
• Black cuve shown as Earned Value (EV) from the project start to data date end of july, 2011.
• Red Curve shown as Esimate at Completeion (EAC) future forecast from the data date to end of
project
• Figure 2.1: Total cost of the project will be equal to BAC & Behind the Schedule & its variances.
• Figure 2.2: Total cost of the project will be more than BAC & Behind the Schedule & its variances.
• Figure 2.3: Total cost of the project will be equal to BAC & ahead the Schedule & its variances.
• Figure 2.4: Total cost of the project will be more than BAC & ahead the schedule & its variances.
___________________________________________________________________________________
$2,500PV
$2,200 AC
$2,000 EV
$1,800EAC
$1,600
$1,400
$1,200
$1,000
$800
$600
$400
$200
$0 Jan‐11 Feb‐11 Mar‐11 Apr‐11 May‐11 Jun‐11 Jul‐11 Aug‐11 Sep‐11 Oct‐11 Nov‐11 Dec‐11
EXECUTED WORK PROJECTED WORK
Resources
Completion Variation
Duration in Months
X
Cost Variation

Earned Value Analysis ‐ EVA
22
10. Conclusion:
The simple analysis methods described in the paper illustrate one beneficial use of earned value data,
evaluating the reasonableness of the contractors’s Estmate at Completeion. EVA is a better mthod of
ptorgram/project management beacause it intigrates cost and schedule, can be used to forecast
future performace and prject compelteion dates. It is an “early warning” program/project
management tool that enables managers to identifly and control problems before they become
insurmountable. It allwos projects to be amanged better on tme, on budtget.
The cost management report prepared from arned value data can provide project managers with
valuable insight into cost and scheduel status of their project. When used properly, the variances and
performances indices can help a manager focus attention on merging probleums. The cost
management reprot is not a financail reprot, it’s a tool for proejct managers.
Earned Value Analysis ‐ EVA
23
11. Summary:
The Eearned Value Analysis is a management tool to measure the current performance of any project
in terms of “Cost & Schedule”. And also it helps in forecasting the remaining work in terms of “Cost &
Schedule”. EVA is a usefull tool to the risk management, it shows the current variances and gives
“early warning” to the project managers for the future risks and also helps in taking prompt and
accurate decessions to execute the remaining the work “under the budget & behind the schedule” or
“On time & On Budget”. Its three key dimension are Planned Value, Earned Value & Actual Cost shows
current status of the project by comparing PV v/s EV v/s AC. Hence EVA gives the right direction to
the project manageres to manage the project and meets the dealines in terms of “Cost & Schedule”.

Earned Value Analysis ‐ EVA
24
12. Bibliography / References
1. Department of Defense. “Earned Value Management Implementation” Guide Oct, 2006 Signed by “KEITH D. ERNST” Director Defense Contract Management Agency, by DoD USA
2. Practice standard for EARNED VALUE MANAGEMENT ISBN:1‐930699‐42‐5 Published by: PMI Inc. Four Campus Boulevard, Newtown Square, Pennsylvania USA. www.pmi.org
3. A Guide to the “Project Management Body of Knowledge” (PMBOK Guide) 4th Edition, ISBN: 978‐1‐933890‐51‐7 Published by: PMI Inc. Fourteen Campus Boulevard, Newtown Square, Pennsylvania USA.
4. PMstudy Targeting Success ‐Project Cost management Guide to Mathematical Question, Published by: PMI Inc. www.pmstudy.com
5. Projectsmart.co.uk “ Earned Value Management Explained” Date of visit (9th Dec, 2011)
6. Earned Value Management, U.S.A Government NASA Date of visit (9th Dec, 2011)
7. “http://project‐management‐knowledge.com Date of visit (20th Dec, 2011)
8. “http://en.wikipedia.org/wiki/Earned_value_management Date of visit (25th Dec, 2011)