earlywarningsignalsinplantdiseaseoutbreaks arxiv:1802 ... ·...
TRANSCRIPT
Early warning signals in plant disease outbreaks
S. Orozco-Fuentesa, G. Griffithsa, M. J. Holmesb, R. Ettelaieb, J. Smithb, A. W. Baggaleya and N. G. Parkera
aSchool of Mathematics, Statistics and Physics, Newcastle University, Newcastle upon Tyne, NE1 7RU, UK
bSchool of Food Science and Nutrition, University of Leeds, Leeds, LS2 9JT, UK
Abstract
Infectious disease outbreaks in plants threaten ecosystems, agricultural crops and food trade. Currently, severalfungal diseases are affecting forests worldwide, posing a major risk to tree species, habitats and consequently ecosys-tem decay. Prediction and control of disease spread are difficult, mainly due to the complexity of the interactionbetween individual components involved. In this work, we introduce a lattice-based epidemic model coupled with astochastic process that mimics, in a very simplified way, the interaction between the hosts and pathogen. We studiedthe disease spread by measuring the propagation velocity of the pathogen on the susceptible hosts. Our quantitativeresults indicate the occurrence of a critical transition between two stable phases: local confinement and an extendedepiphytotic outbreak that depends on the density of the susceptible individuals. Quantitative predictions of epiphy-totics are performed using the framework early-warning indicators for impending regime shifts, widely applied ondynamical systems. These signals forecast successfully the outcome of the critical shift between the two stable phasesbefore the system enters the epiphytotic regime. Our study demonstrates that early-warning indicators could be usefulfor the prediction of forest disease epidemics through mathematical and computational models suited to more specificpathogen-host-environmental interactions. Our results may also be useful to identify a suitable planting density toslow down disease spread and in the future, design highly resilient forests.
Keywords:Plant–pathogen interactions, Lattice model, Tree disease, Early-warning signals, Disease triangle, Plant pathology
1. Introduction
Invasive non-indigenous pathogens and vectors such as fungi, bacteria and insects pose a serious threat to treesand forest health worldwide. The recent and well-publicised outbreak of the ash dieback fungus (Hymenoscyphuspseudoalbidus) and emerald ash borer (Agrilus planipennis) risks the survival of the ash tree (Fraxinus excelsior) inthe UK, one of the most abundant trees in small woodlands and high forests across the country (Maskell et al., 2013;Forest Research, 2016). At the same time, this fungus, threatens the ash tree extinction across the European continent(Mitchell et al., 2014; Thomas, 2016; Gross et al., 2013). The larch tree disease, caused by the fungus Phytoph-thora ramorum (P. ramorum), continues to spread through conifer forests in both Scotland and Wales, changing thelandscape and forcing the Forestry Commission to fell thousands of hectares of trees to slow down the spread of thedisease (Forestry Commission, 2018a).
Historically, these events cause catastrophic ecological, economic and social impact, and motivate a detailedunderstanding of the mechanisms that underlie the epidemics, from which strategies to manage and prevent futureoccurrences can be developed systematically (Harwood et al., 2010). The propagation of these infectious agents tothe susceptible trees depends on a plethora of biological, geographical, climatic and anthropological factors. In theliterature, several spatial models have been developed for forests diseases, that consider specific factors aiding thedispersal of invasive pests, such as vectors (insects, humans) or economical activities like the international plant tradeand timber industry (Macnadbay et al., 2004; Alfinito et al., 2016; Harwood et al., 2010). However, these models,specifically designed to account for large geographical areas of natural forests, are very complex and require a largeamount of input data to predict the disease spread.
Accepted in Ecological Modelling (09 November 2018) DOI: 0.1016/j.ecolmodel.2018.11.003
arX
iv:1
802.
0756
2v2
[q-
bio.
PE]
14
Dec
201
8

Figure 1: Woodland patches located in the Mabie Forest near Dumfries and Galloway, UK. (a) Monocultures of coniferous forests outlinedaccording to the interpreted forest type (IFT) accounted in the National Forest Inventory Scotland 2016 (white dotted lines): I, young trees; II andV conifer trees; III and VII, felled area; IV, bare area and VI, grassland. Trees were planted at intervals of 2-3 m. (b) Coniferous forests withpatches of trees infected with P. ramorum (red outline). The IFTs showed are I, felled trees; II, conifer trees, III, young trees and IV, broadleavedtrees. Maps are showed in latitude/longitude coordinates and were obtained with QGIS 2.18 ’Las Palmas’, using c©2018 Google Satellite datasets.To account for the interpreted forest types we used the National Forest Inventories from Scotland (2016) (Forestry Commission, 2018b). Imageanalysis was done with ImageJ (Schneider et al., 2012).
The forests in the United Kingdom and several parts of Europe have been reshaped continually since the mid-Holocene due to anthropogenic factors (Kaplan et al., 2009). During the last centuries, the timber industry has left acharacteristic homogeneous pattern in the woodland patches: forests managed for timber are usually planted in linesor curved lines. These patterns allow an efficient management and an even access to sunlight and nutrients; with alltrees in the plantations being even-aged monocultures of conifer or broadleaved forests (Forestry Commission, 2017),see figure 1(left). However, the homogeneity in the trees diminishes the resilience of the forests to several threats,including forest diseases (Rist and Moen, 2013). Examples of this can be observed in the current outbreak of P.ramorum spreading in the Mabie Forest in Scotland, see figure 1(right), which consists mainly of coniferous forestswith trees planted at the same time between 2-3 m of each other.
Mathematical modelling provides a powerful approach to understand, predict and counter-act disease propagation(Bate et al., 2016; Macpherson et al., 2017) with the advantage of fine-tuning the model to take into account specificattributes found in the forests. In this work we have developed an individual-based model in which trees are repre-sented explicitly alongside their susceptibility to disease and infectious status, to account for disease spread in termsof the tree density, a basic forest measurement calculated in the field. Our model is similar in nature to the forest firesand percolation lattice models widely investigated in the literature in which transmission occurs upon direct contact(Bak et al., 1990; Beer and Enting, 1990; Grassberger, 1993) and there is only spatial stochasticity. However, toconsider the effect of a simultaneous presence of both spatial and temporal stochasticity we introduced a probabilityof transmission for the trees to catch the disease, which is not considered in the former models.
Early-warning indicators for abrupt changes in the behaviour of complex systems, group a set of statistical proper-ties measured on parameters that change in unique ways before the occurrence of a catastrophic shift, (also known inthe literature as tipping point or critical transition), which occurs when a system switches abruptly between alternateequilibria (Scheffer et al., 2009; Scheffer, 2009). These indicators are generic and suitable for application across manysystem types, even when the underlying system dynamics are poorly understood (Carpenter and Brock; Scheffer et al.,2009; Morales et al., 2015).
In ecosystems, early-warning methods have been used to predict the occurrence of desertification processes (Cor-rado et al., 2014), animal extinction in deteriorating environments (Drake and Griffen, 2010), behaviour of aquaticecosystems (Gsell et al., 2016), and have been applied on climate models for the simulation of dieback on the Amazonrainforest (Boulton et al., 2013). Most recently, their applicability as an effective model to monitor tree mortality hasbeen highlighted in (Rogers et al.) through satellite data. Therefore, their usefulness to predict changes on degra-
2

dation processes for biological systems has increased in the literature during the last decade (Carpenter and Brock;Scheffer et al., 2009; Dakos et al., 2012; Litzow and Hunsicker, 2016; Ratajczak et al.). The main purpose behindthese indicators is their effectiveness to identify properties in an ecological system that would change significantly asit approaches a tipping point between different stable states. However, this idea has been applied only to a handful ofecological problems due to the unavailability of data sets, (Gsell et al., 2016; Litzow and Hunsicker, 2016; Ratajczaket al.).
Following this premise, our interest lies in analysing the dynamics of disease outbreaks under the scope of classicalearly-warning techniques using the tree density as a state variable. This suggests applying the universality class andscaling exponents—which have been widely studied in the literature (Bunde and Havlin, 1996; Stauffer and Aharony,2003)—to the prediction and detection of the transition from the progression of the disease to an epiphytotic outbreak.
The structure of the paper is as follows. In §2, we propose a simplified model of a forest, in terms of susceptible,infected or removed individuals (SIR model) which exhibits a phase transition above a percolation threshold (Grass-berger, 1993; Clar et al., 1996; Bunde and Havlin, 1996). In §3, we show the results of the simulations in which, wequantify the propagation velocity of the infection. Then, we obtain the phase diagram of the contained-to-outbreakphases of the system and study the behaviour of relevant parameters. Finally, in §4 we discuss the meaning andimplications of our findings.
2. Materials and methods
We model a forest as a regular square lattice of dimensions L × L where L = 500, see Fig. 2(a-b). The forestlandscape is flat and there is only one type of vegetation, with the initial occupation of trees following a Bernoulli trialaccording to a binomial distribution with mean ρL2, in which each trial has two possible outcomes a tree or an emptyspace. Forest patches with monocultures of trees with the same age that fullfill these characteristics can be found inseveral regions in Scotland, UK, see figure 2(c), in which the trees planted every 2-3 m are infected with P. ramorum.
Following this, in our model, each site can exist in one of four states: susceptible (S ), infected (I), removed(R) and empty (∅). Susceptible individuals correspond to a single or several trees distributed randomly which canbecome infected. An infected site, represents a patch of vegetation that has acquired a terminal disease, a removedsite corresponds to the space left by the infected site after the vegetation dies, and empty sites correspond to regionsin the landscape where no susceptible vegetation can grow, see figure 2(a-b). The location of the forest patches isconstant in time, such that vegetation sites (either S , I or R) are randomly distributed with a density ρ.
Once a site in the S category acquires an infection, its status is changed to I and a numerical label η is attached toit. η increases with time at a constant pace, ranging from −T to 0. Whereupon at η = 0, the tree at the site dies and isremoved, i.e., its status is changed to R. Henceforth, T corresponds to the infectious period, that is, the time in whichan infected tree can transmit the infection.
After a tree is infected, it has a probability β of transmitting the disease to a neighbouring susceptible site duringthe infectious period. In epidemiological terms, the probability β is denoted as the transmissibility of the pathogen,and it is defined as the probability per unit time that an S site acquires the infection from a neighbouring I site.Therefore, for a healthy tree with n infected neighbours, the probability of remaining unaffected at each time step isgiven by 1 − (1 − β)n. For simplicity, the neighbourhood is defined by the first four nearest neighbours in the lattice,i.e., a von Neumann neighbourhood.
We consider the limit in which the disease spreads in a much smaller time-scale than the growth of the susceptiblespecies. Moreover, after a patch of forest has died, there exists the possibility of invasion from another species ofplant, a phenomenon which has been observed in grass-woodland transitions (Abades et al.). As a consequence, it isunlikely that the woodland site regains susceptibility, and thus, we neglect any regenerative process in the simulations.
The parameters β and T regulate the evolution of the disease and both are relevant in the model; sampling froma suitable distribution for each parameter would allow to model levels of disease tolerance to the pathogen for eachtree, since it has been identified that some plants exhibit little damage despite a high level presence of the pathogen(Gross et al., 2013).
For simplicity, in our simulations, we consider uniform values for β and T . This implies that we are free to set thetime-scale by fixing a value for either variable. The time evolution of the landscape is carried out in discrete unitarytime intervals. Therefore, by setting T = 10, a unitary time interval corresponds to 0.1T . This leaves the averagevegetation density, ρ, and the transmissibility of the pathogen, β, as the two free parameters.
3
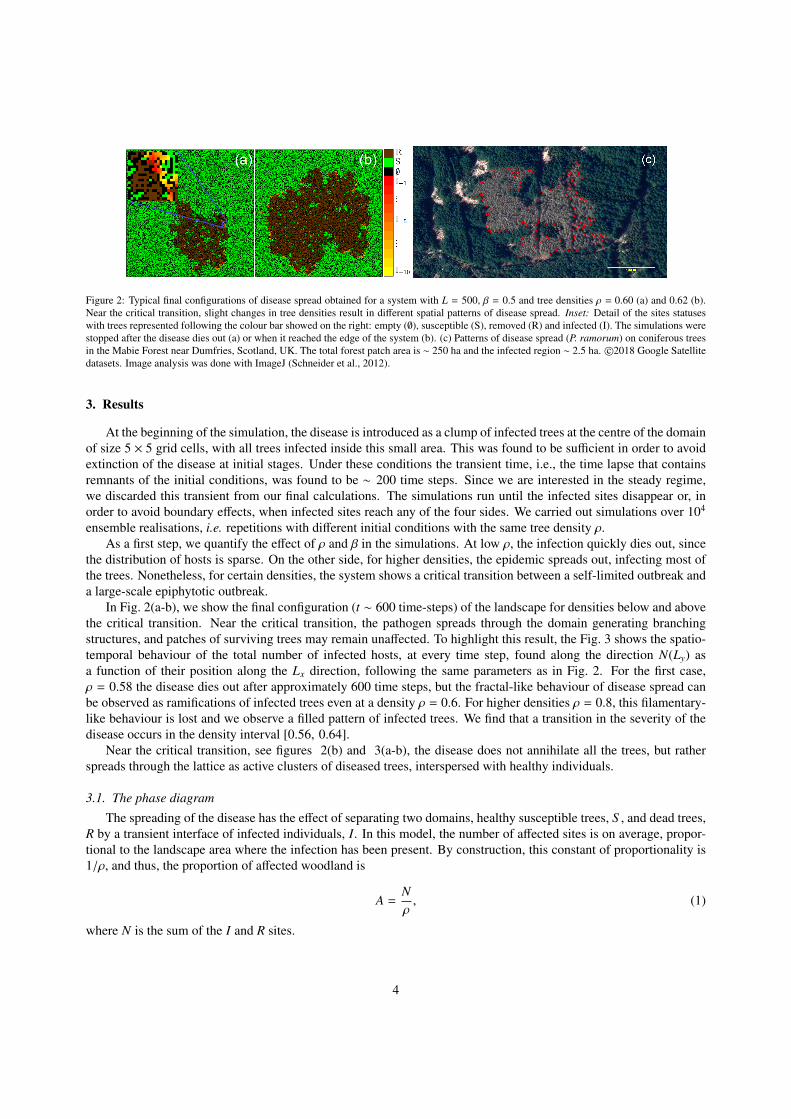
Figure 2: Typical final configurations of disease spread obtained for a system with L = 500, β = 0.5 and tree densities ρ = 0.60 (a) and 0.62 (b).Near the critical transition, slight changes in tree densities result in different spatial patterns of disease spread. Inset: Detail of the sites statuseswith trees represented following the colour bar showed on the right: empty (∅), susceptible (S), removed (R) and infected (I). The simulations werestopped after the disease dies out (a) or when it reached the edge of the system (b). (c) Patterns of disease spread (P. ramorum) on coniferous treesin the Mabie Forest near Dumfries, Scotland, UK. The total forest patch area is ∼ 250 ha and the infected region ∼ 2.5 ha. c©2018 Google Satellitedatasets. Image analysis was done with ImageJ (Schneider et al., 2012).
3. Results
At the beginning of the simulation, the disease is introduced as a clump of infected trees at the centre of the domainof size 5 × 5 grid cells, with all trees infected inside this small area. This was found to be sufficient in order to avoidextinction of the disease at initial stages. Under these conditions the transient time, i.e., the time lapse that containsremnants of the initial conditions, was found to be ∼ 200 time steps. Since we are interested in the steady regime,we discarded this transient from our final calculations. The simulations run until the infected sites disappear or, inorder to avoid boundary effects, when infected sites reach any of the four sides. We carried out simulations over 104
ensemble realisations, i.e. repetitions with different initial conditions with the same tree density ρ.As a first step, we quantify the effect of ρ and β in the simulations. At low ρ, the infection quickly dies out, since
the distribution of hosts is sparse. On the other side, for higher densities, the epidemic spreads out, infecting most ofthe trees. Nonetheless, for certain densities, the system shows a critical transition between a self-limited outbreak anda large-scale epiphytotic outbreak.
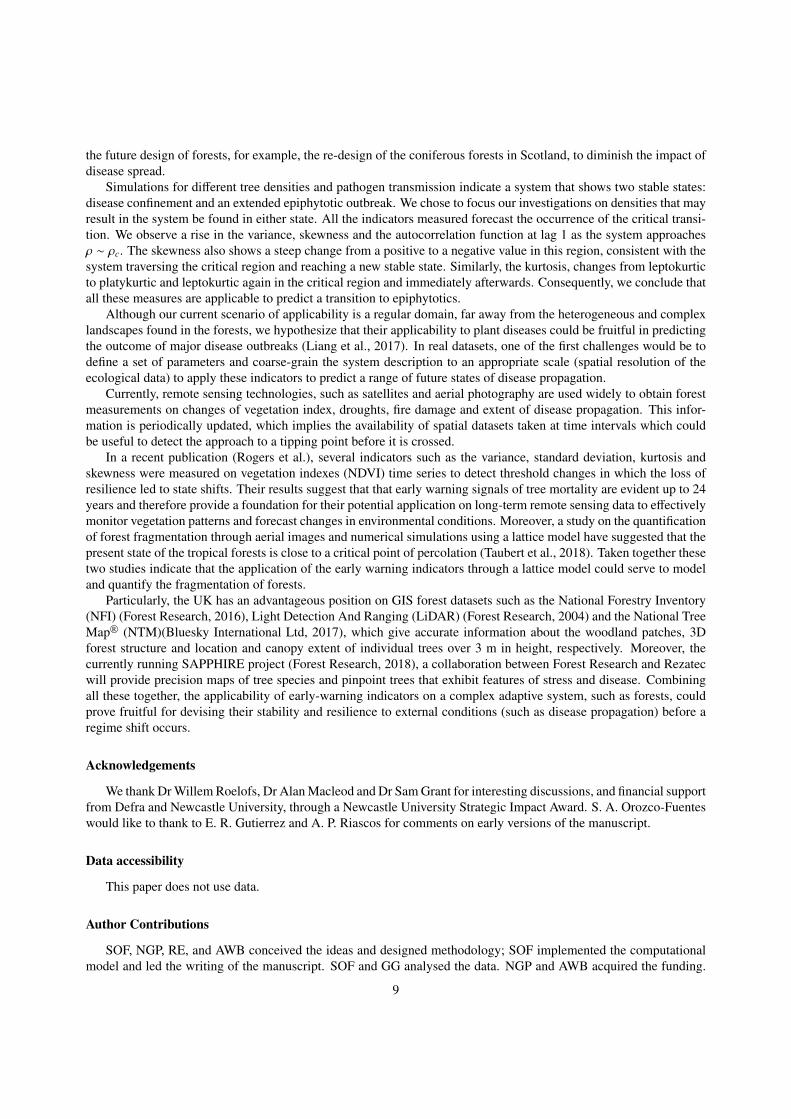
In Fig. 2(a-b), we show the final configuration (t ∼ 600 time-steps) of the landscape for densities below and abovethe critical transition. Near the critical transition, the pathogen spreads through the domain generating branchingstructures, and patches of surviving trees may remain unaffected. To highlight this result, the Fig. 3 shows the spatio-temporal behaviour of the total number of infected hosts, at every time step, found along the direction N(Ly) asa function of their position along the Lx direction, following the same parameters as in Fig. 2. For the first case,ρ = 0.58 the disease dies out after approximately 600 time steps, but the fractal-like behaviour of disease spread canbe observed as ramifications of infected trees even at a density ρ = 0.6. For higher densities ρ = 0.8, this filamentary-like behaviour is lost and we observe a filled pattern of infected trees. We find that a transition in the severity of thedisease occurs in the density interval [0.56, 0.64].
Near the critical transition, see figures 2(b) and 3(a-b), the disease does not annihilate all the trees, but ratherspreads through the lattice as active clusters of diseased trees, interspersed with healthy individuals.
3.1. The phase diagram
The spreading of the disease has the effect of separating two domains, healthy susceptible trees, S , and dead trees,R by a transient interface of infected individuals, I. In this model, the number of affected sites is on average, propor-tional to the landscape area where the infection has been present. By construction, this constant of proportionality is1/ρ, and thus, the proportion of affected woodland is
A =Nρ, (1)
where N is the sum of the I and R sites.
4

Figure 3: Spatio-temporal behaviour of the number of infected trees N(Ly) along the height of the channel as a function of their location along thewidth of the domain for the following tree densities ρ: (a) 0.58, (b) 0.60 and (c) 0.80. The colour bar shows the number of infected trees per linealong Ly. The first two cases (a-b) correspond to values in the critical region ρ ≈ ρc and although the disease is spreading through the domain isnot annihilating all susceptible hosts, since there are green sites interspersed with diseased trees. For ρ = 0.8 the number of infected individualsincreases.
To quantify the observed dynamics in this system we calculated the spread dynamics of the disease through thelattice via the effective1 velocity v of the pathogen. On this basis of Eq. 1, a characteristic length-scale, R = N1/2,measures of the radial extent of the disease. Thus, the rate of propagation of the disease in the domain is measuredthrough the velocity v, defined as the change in R, i.e.,
v(t) = N1/2(t) − N1/2(t − 1). (2)
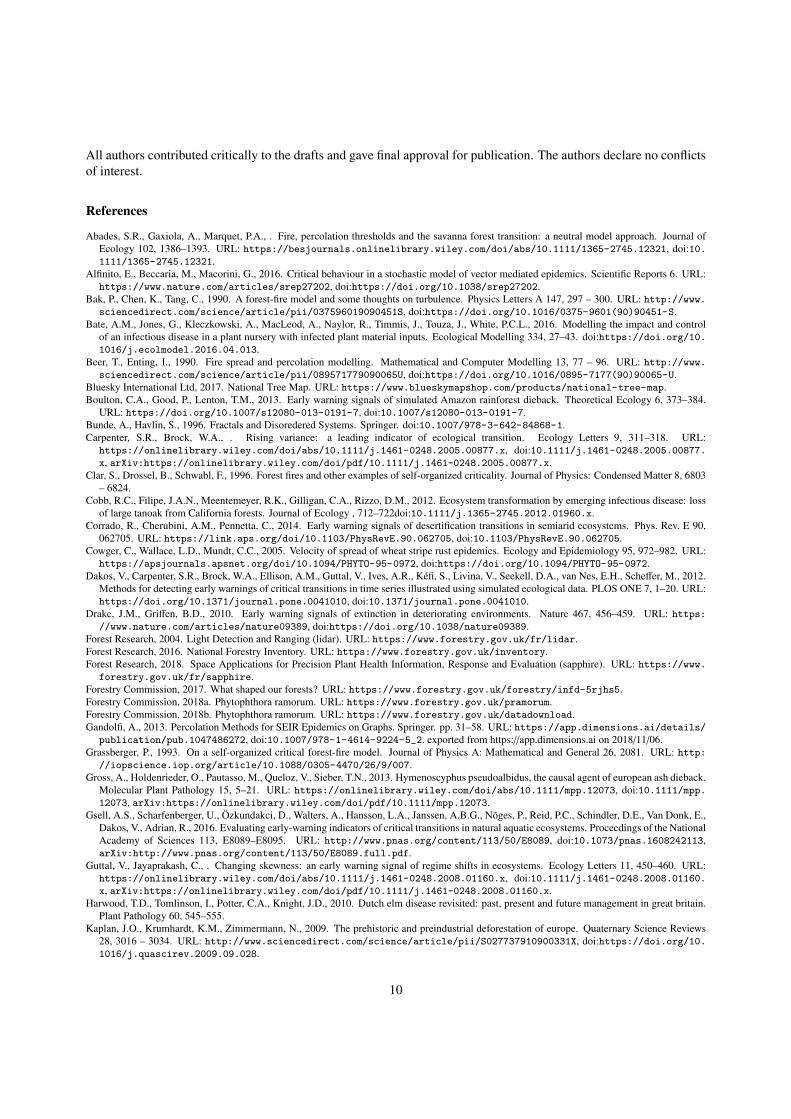
Therefore, Eq. 2 measures the spreading velocity in terms of the area of infected trees in the domain. The time seriesof v is shown in Fig. 4(a-c); we will show that the stochasticity observed in these time series gives valuable informationabout the underlying dynamics when analysed in the framework of early warning indicators for critical transitions.
From the time series for the velocity, we obtain the time average of the velocity v. Figure 4(d) shows severalprobability distribution functions, F(v), obtained from all realisations, for densities ρ = 0.58 (1), 0.59 (2), 0.595 (3),0.6 (4) and 0.62 (5). For ρ < ρc, the distribution shows a maximum for v ∼ 0.01, see curve for ρ = 0.58. As the treedensity increases, and approaches the critical value, ρ = 0.595 and ρ = 0.6, F(v) shows clearly that the system canbe found in either two states, one for v ≈ 0, which corresponds to local disease confinement and another for v , 0,or epiphytotic outbreak. Figure 4(e) shows a zoom-in around the local maxima for ρ = 0.595 and 0.6. As the densityincreases, e.g., ρ = 0.62, the probability distribution function shows a single maximum for v ≈ 0.23.
After taking the ensemble averages we obtain the mean propagation velocity 〈v〉 as a function of the tree densityρ and various values of the transmission probability β. We identify from these results a critical density that separatesthe non-spreading to spreading phase of the disease. The existence of a critical density at ρc implies the existenceof a spatially connected or spanning cluster of trees for disease spread. From these results, we conclude that thiscritical density ρc, is similar in nature to the critical percolation threshold observed in percolation theory (Stauffer and
1We use the term “effective” to emphasize that strictly the velocity cannot be defined in this way close to the critical density since the spanningcluster of diseased trees becomes fractal. It can be rigorously shown that the velocity with which the disease front propagates is given in 2D asv ∼ ξ1−d f /d` ∼ (p − pc)0.16, with ξ denoting the correlation length, d f and d` the fractal and graph dimensions respectively, (Bunde and Havlin,1996). However, Eq. 2 provides a convenient measure of the rate of spread of the infection, through the epidemic extent or area, which is usuallymonitored through observational data, (Cowger et al., 2005; Mundt et al., 2013).
5

0
0.1(a) 0.58
0
0.1
0.2(b) 0.60
00.10.20.30.4
100 200 300 400 500
(c) 0.62
vv
v
time
0
10
20
30
40
50
60
0 0.05 0.1 0.15 0.2 0.25 0.3
(d)
02468
0 0.02 0.04
(d)
(e)
F(v)
v
(1)(2)(3)(4)(5)
Figure 4: (a-c) Time series for the propagation velocity v(t) for the following values of tree densities: (a) ρ = 0.58, (b) ρ = 0.60 and (c) ρ = 0.62.Three samples are showed for each density. The velocity increases as ρ is increased. (d) Probability distribution function F(v) for the time averagedvelocity v obtained from 104 simulations, for densities ρ: (1) 0.58, (2) 0.59, (3) 0.595, (4) 0.6 and (5) 0.62. (e) Inset showing the For all casesL = 500 and β = 0.5.
0
0.1
0.2
0.3
0.4
0.5
0.6
0.7
0.8
0.9
0.4 0.5 0.6 0.7 0.8 0.9
ρ < ρc ρ > ρc
β 〈v〉
〈v〉
ρ
0.1
0.2
0.3
0.4
0.5
0.6
0.7
0.8
0.9
1
ρ ≈ ρc
(a)
0.4 0.5 0.6 0.7 0.8 0.9ρ
0.1
0.2
0.3
0.4
0.5
0.6
0.7
0.8
0.9
1
β
0
0.1
0.2
0.3
0.4
0.5
0.6
0.7
0.8(b)
Con�nement
Epiphytotic
Figure 5: (a) Propagation velocity 〈v〉 for the spread of a pathogen inside a grid with dimensions L = 500 as a function of tree density ρ and diseasetransmissibility β, following a Von Neumann neighbourhood. A shift between two stable states: infection confinement and an extended epiphytoticoutbreak, occurs for ρ ≈ ρc. A shaded region is showed for ρ ∼ ρc, associated with the black dotted line highlighting the results for β = 0.5. (b)Phase space diagram for the pathogen dispersal on the grid, indicating region of disease containment and epiphytotics.
Aharony, 2003; Gandolfi, 2013; Saberi, 2015), since our computational model only involves a slight modification ofthe former.
In Fig. 5, we observe that the sole effect of the transmission probability β = [0.1, 1] is a displacement of thecritical point towards lower values of ρ. For low disease transmissibility, the density of trees has to be high to have aspanning cluster through the domain. As β increases, there is a chance of infecting more trees per infectious period(T) and consequently this cluster occurs at lower densities. Therefore, T, acting conjointly with β define the limitingvalue ρc. As β is increased, the critical transition should tend to the percolation threshold reported in the literature,ρc → 0.592746 (Stauffer and Aharony, 2003). However, since we are working on a finite-size domain, we expect thatthe critical transition is broadened relative to the result above for infinite-sized domains; in Fig. 5(a) we highlight thisas a shaded region that divides density values according to a region where the critical shift occurs in our simulations(the black dotted line highlights the result for β = 0.5).
3.2. Catastrophic shifts in forest diseaseA fundamental emergent property observed in systems near criticality is their capacity to extend over scales
comparable to the size of the whole system at long times. Near the critical threshold, short-range interactions lead tothe emergence of long-range correlations and the behaviour of the system changes abruptly between two alternative
6

0
0.01
0.02
0.03
0.04
ρ < ρc ρ > ρc
(a)−3
−2
−1
0
1
2ρ < ρc ρ > ρc
(b)
0
5
10
15
20
25
30
0.4 0.5 0.6 0.7 0.8 0.9
(c)
0.6
0.7
0.8
0.9
1
0.4 0.5 0.6 0.7 0.8 0.9
(d)
Var
ianc
e
ρ ≈ ρc
Skew
ness
ρ ≈ ρc
Kur
tosi
s
ρ
AC
F(l
ag1)
ρ
Figure 6: Ensemble behaviour for the metric-based indicators measured for the propagation velocity v of disease spread in the domain (L =
500, β = 0.5). Temporal variance (a), kurtosis (b), skewness (c) and autocorrelation function at lag τ = 1, as a function of the tree density ρ. Threeregimes are shown, with the shaded area corresponding to ρ ≈ ρc.
stable states, in this case, local containment and epiphytotics. The occurrence of this shift depends only on thelocal structure, in our case the density of susceptible hosts. Near the critical transition this system exhibits scaleinvariance, self-similarity and fractal properties. From the non-stationarity of the time series showed in Fig. 4(a-c) wecan analyse the underlying dynamics through metric-based indicators proposed in the literature for the identificationof early-warning signals: variance, skewness, kurtosis and autocorrelation function at lag 1 (Carpenter and Brock;Dakos et al., 2012; Morales et al., 2015).
Our goal is to predict the occurrence of a transition between disease containment and epiphytotics using the theoryof catastrophic shifts, which in principle could be useful for the prediction of densities at which disease will spread inforests.
We quantify the stochastic variability of v(t) from time series obtained for an ensemble of systems evolving forfixed β = 0.5 on a domain of size L = 500. Our interest was to study the variability in the spreading velocity asthe density of trees crosses the critical region. From the probability distribution functions for 〈v〉, we obtained theensemble behaviour of the following statistical measures: variance (a), kurtosis (b), skewness (c) and autocorrelationfunction at lag 1 (d), see Fig. 6.
The variance, in Fig. 6(a), shows a rise around the critical point, the increase of this quantity is maximal, and itsbehaviour is different before the transition occurs, for ρ < ρc and after it has happened, ρ > ρc. The square-root of thevariance, the standard deviation, is maximal at the critical transition, which for this finite-size system is ρmax = 0.61.Therefore, this quantity is useful as an indicator for the prediction of a shift between the disease confinement andepidemics.
The skewness, defined as the third moment of the distribution, quantifies the asymmetry of fluctuations in the timeseries. It is a useful measure for the prediction of the catastrophic shift since its value changes before and after thetransition, depending on whether the system settles down to an alternative state in which the disease propagation islarger or smaller than in the current state, (Guttal and Jayaprakash; Dakos et al., 2012; Kefi et al., 2014). Our resultsclearly show both an increase and further decrease in the skewness, see Fig. 6(b). For ρ < ρc the skewness is positiveand rises up as we approach the critical region. For ρ ∼ ρc, it decreases abruptly and changes sign, becoming negative,
7

i. e., the probability distribution is left-skewed. For higher density of trees, we drive the system away from the criticalregion, the skewness changes again, and becomes less negative until it settles near zero (≈ −0.5). Notably, the risein skewness observed at ρ ∼ 0.57, associated with an increase in the nonlinearities of the time series, predicts theoutcome of the tipping point. Moreover, this parameter identifies the tree densities for which the system is found ineither disease confinement (Skewness ≈ 1) and epiphytotics (Skewness ∼ 0).
Strong perturbations can drive the state of a system to reach extreme values close to a transition. Therefore, theprobability distribution function of the propagation velocity may show a rise in the kurtosis before the transition isreached. Figure 6(c) shows the plot of this quantity obtained in our simulations. The distribution shows two peaks: alocal maximum that corresponds to kurtosis values of 7.4 for ρ ≈ 0.57, and a global maximum with kurtosis of 18.3for ρ ≈ 0.64. This indicates that, as the system approaches and exits the critical region, the distribution becomes morestrongly peaked, than the reference normal distribution, which has a kurtosis of 3 (blue continuous line), and thus, isleptokurtic. This is consistent with an increased presence of rare values in the propagation velocity. Interestingly, forvalues closer to the critical point, i. e., ρ = 0.59, the kurtosis is 2.4, which is equivalent to a flattened or platykurticdistribution. We conclude that the kurtosis is a good indicator to detect the outcome of the transition.
The temporal autocorrelation function (ACF) measures the spectral properties and changes in the correlationstructure, “memory”, of the time series (Dakos et al., 2012). In a general way, the τth order ACF is defined accordinglyas,
ACF(τ) =
∑nt=τ+1(vt − v)(vt−τ − v)∑n
t=1(vt − v)2 . (3)
Following equation 3, we measured the temporal autocorrelation function at lag 1 (τ = 1) in our simulations. Severaldynamical systems have shown a slow recovery from small perturbations as they approach the critical transition,phenomenon termed in the literature as “critical slowing down”. These systems show an increase in the short-termmemory of time series which can be detected through an increase of the autocorrelation function at lag 1.
Figure 6(d) show the values for the temporal autocorrelation function at lag 1 measured for the time series of thevelocity as a function of the tree density ρ. For ρ < ρc, this quantity increases linearly as we increase the tree densityand reaches a maximum threshold inside the critical region for ρ ≥ 0.6. This is an indication that the system hasbecome increasingly similar between consecutive observations. Since, for ρ < ρc there is a fast increase on the ACF,this is useful for the prediction of the outcome of the critical shift in the system.
4. Discussion
The most important question during risk assessment for a forest disease is how pathogens will spread on thelandscape, both to predict the occurrence of an epiphytotic outbreak and to assist in designing interventions to counterthe onset and progression of the disease. In a real-life scenario, the dispersal of these diseases is complex, mainly dueto the multiple geographical and environmental factors affecting the disease spread.
Lattice-based epidemic models have been used previously in the literature to study temporal and spatial fluctua-tions on the prevalence of epidemic diseases in terms of the minimum tree density for an epidemic to occur (Rhodesand Anderson, 1996, 1997). The sessility of trees makes lattice modelling of plant diseases more attainable throughcomputational simulations. Works on disease propagation using this framework coupled with historical, geographicaland weather information have been used to predict the spread of pathogens through forests on a large scale (Xu et al.;Meentemeyer et al., 2010; Potter et al., 2011; Cobb et al., 2012). These models certainly capture some of the fea-tures of previous epiphytotics, and coupling them to the framework of early-warning indicators for detecting criticaltransitions could be useful for designing strategies against disease spread.
The following characteristics need to be fulfilled for an epidemic to occur: (i) a critical number of susceptiblehosts, (ii) an aggressive phenotype of the pathogen with a high transmissibility rate and (iii) suitable environmentalconditions for the pathogen survival. In this paper, we chose to study the effect of the two first factors using ageneric stochastic model of epidemic spread on a lattice with a von Neumann neighbourhood. Our model does notincorporate a sophisticated computational description of the system; however it is useful, as a first approximation,for the application of the framework of early warning signals, used widely on complex systems, to reach a newunderstanding in plant disease epidemics. This could aid in the identification of an optimal planting tree density for
8
the future design of forests, for example, the re-design of the coniferous forests in Scotland, to diminish the impact ofdisease spread.
Simulations for different tree densities and pathogen transmission indicate a system that shows two stable states:disease confinement and an extended epiphytotic outbreak. We chose to focus our investigations on densities that mayresult in the system be found in either state. All the indicators measured forecast the occurrence of the critical transi-tion. We observe a rise in the variance, skewness and the autocorrelation function at lag 1 as the system approachesρ ∼ ρc. The skewness also shows a steep change from a positive to a negative value in this region, consistent with thesystem traversing the critical region and reaching a new stable state. Similarly, the kurtosis, changes from leptokurticto platykurtic and leptokurtic again in the critical region and immediately afterwards. Consequently, we conclude thatall these measures are applicable to predict a transition to epiphytotics.
Although our current scenario of applicability is a regular domain, far away from the heterogeneous and complexlandscapes found in the forests, we hypothesize that their applicability to plant diseases could be fruitful in predictingthe outcome of major disease outbreaks (Liang et al., 2017). In real datasets, one of the first challenges would be todefine a set of parameters and coarse-grain the system description to an appropriate scale (spatial resolution of theecological data) to apply these indicators to predict a range of future states of disease propagation.
Currently, remote sensing technologies, such as satellites and aerial photography are used widely to obtain forestmeasurements on changes of vegetation index, droughts, fire damage and extent of disease propagation. This infor-mation is periodically updated, which implies the availability of spatial datasets taken at time intervals which couldbe useful to detect the approach to a tipping point before it is crossed.
In a recent publication (Rogers et al.), several indicators such as the variance, standard deviation, kurtosis andskewness were measured on vegetation indexes (NDVI) time series to detect threshold changes in which the loss ofresilience led to state shifts. Their results suggest that that early warning signals of tree mortality are evident up to 24years and therefore provide a foundation for their potential application on long-term remote sensing data to effectivelymonitor vegetation patterns and forecast changes in environmental conditions. Moreover, a study on the quantificationof forest fragmentation through aerial images and numerical simulations using a lattice model have suggested that thepresent state of the tropical forests is close to a critical point of percolation (Taubert et al., 2018). Taken together thesetwo studies indicate that the application of the early warning indicators through a lattice model could serve to modeland quantify the fragmentation of forests.
Particularly, the UK has an advantageous position on GIS forest datasets such as the National Forestry Inventory(NFI) (Forest Research, 2016), Light Detection And Ranging (LiDAR) (Forest Research, 2004) and the National TreeMap R© (NTM)(Bluesky International Ltd, 2017), which give accurate information about the woodland patches, 3Dforest structure and location and canopy extent of individual trees over 3 m in height, respectively. Moreover, thecurrently running SAPPHIRE project (Forest Research, 2018), a collaboration between Forest Research and Rezatecwill provide precision maps of tree species and pinpoint trees that exhibit features of stress and disease. Combiningall these together, the applicability of early-warning indicators on a complex adaptive system, such as forests, couldprove fruitful for devising their stability and resilience to external conditions (such as disease propagation) before aregime shift occurs.
Acknowledgements
We thank Dr Willem Roelofs, Dr Alan Macleod and Dr Sam Grant for interesting discussions, and financial supportfrom Defra and Newcastle University, through a Newcastle University Strategic Impact Award. S. A. Orozco-Fuenteswould like to thank to E. R. Gutierrez and A. P. Riascos for comments on early versions of the manuscript.
Data accessibility
This paper does not use data.
Author Contributions
SOF, NGP, RE, and AWB conceived the ideas and designed methodology; SOF implemented the computationalmodel and led the writing of the manuscript. SOF and GG analysed the data. NGP and AWB acquired the funding.
9
All authors contributed critically to the drafts and gave final approval for publication. The authors declare no conflictsof interest.
References
Abades, S.R., Gaxiola, A., Marquet, P.A., . Fire, percolation thresholds and the savanna forest transition: a neutral model approach. Journal ofEcology 102, 1386–1393. URL: https://besjournals.onlinelibrary.wiley.com/doi/abs/10.1111/1365-2745.12321, doi:10.1111/1365-2745.12321.
Alfinito, E., Beccaria, M., Macorini, G., 2016. Critical behaviour in a stochastic model of vector mediated epidemics. Scientific Reports 6. URL:https://www.nature.com/articles/srep27202, doi:https://doi.org/10.1038/srep27202.
Bak, P., Chen, K., Tang, C., 1990. A forest-fire model and some thoughts on turbulence. Physics Letters A 147, 297 – 300. URL: http://www.sciencedirect.com/science/article/pii/037596019090451S, doi:https://doi.org/10.1016/0375-9601(90)90451-S.
Bate, A.M., Jones, G., Kleczkowski, A., MacLeod, A., Naylor, R., Timmis, J., Touza, J., White, P.C.L., 2016. Modelling the impact and controlof an infectious disease in a plant nursery with infected plant material inputs. Ecological Modelling 334, 27–43. doi:https://doi.org/10.1016/j.ecolmodel.2016.04.013.
Beer, T., Enting, I., 1990. Fire spread and percolation modelling. Mathematical and Computer Modelling 13, 77 – 96. URL: http://www.sciencedirect.com/science/article/pii/089571779090065U, doi:https://doi.org/10.1016/0895-7177(90)90065-U.
Bluesky International Ltd, 2017. National Tree Map. URL: https://www.blueskymapshop.com/products/national-tree-map.Boulton, C.A., Good, P., Lenton, T.M., 2013. Early warning signals of simulated Amazon rainforest dieback. Theoretical Ecology 6, 373–384.
URL: https://doi.org/10.1007/s12080-013-0191-7, doi:10.1007/s12080-013-0191-7.Bunde, A., Havlin, S., 1996. Fractals and Disoredered Systems. Springer. doi:10.1007/978-3-642-84868-1.Carpenter, S.R., Brock, W.A., . Rising variance: a leading indicator of ecological transition. Ecology Letters 9, 311–318. URL:
https://onlinelibrary.wiley.com/doi/abs/10.1111/j.1461-0248.2005.00877.x, doi:10.1111/j.1461-0248.2005.00877.x, arXiv:https://onlinelibrary.wiley.com/doi/pdf/10.1111/j.1461-0248.2005.00877.x.
Clar, S., Drossel, B., Schwabl, F., 1996. Forest fires and other examples of self-organized criticality. Journal of Physics: Condensed Matter 8, 6803– 6824.
Cobb, R.C., Filipe, J.A.N., Meentemeyer, R.K., Gilligan, C.A., Rizzo, D.M., 2012. Ecosystem transformation by emerging infectious disease: lossof large tanoak from California forests. Journal of Ecology , 712–722doi:10.1111/j.1365-2745.2012.01960.x.
Corrado, R., Cherubini, A.M., Pennetta, C., 2014. Early warning signals of desertification transitions in semiarid ecosystems. Phys. Rev. E 90,062705. URL: https://link.aps.org/doi/10.1103/PhysRevE.90.062705, doi:10.1103/PhysRevE.90.062705.
Cowger, C., Wallace, L.D., Mundt, C.C., 2005. Velocity of spread of wheat stripe rust epidemics. Ecology and Epidemiology 95, 972–982. URL:https://apsjournals.apsnet.org/doi/10.1094/PHYTO-95-0972, doi:https://doi.org/10.1094/PHYTO-95-0972.
Dakos, V., Carpenter, S.R., Brock, W.A., Ellison, A.M., Guttal, V., Ives, A.R., Kefi, S., Livina, V., Seekell, D.A., van Nes, E.H., Scheffer, M., 2012.Methods for detecting early warnings of critical transitions in time series illustrated using simulated ecological data. PLOS ONE 7, 1–20. URL:https://doi.org/10.1371/journal.pone.0041010, doi:10.1371/journal.pone.0041010.
Drake, J.M., Griffen, B.D., 2010. Early warning signals of extinction in deteriorating environments. Nature 467, 456–459. URL: https://www.nature.com/articles/nature09389, doi:https://doi.org/10.1038/nature09389.
Forest Research, 2004. Light Detection and Ranging (lidar). URL: https://www.forestry.gov.uk/fr/lidar.Forest Research, 2016. National Forestry Inventory. URL: https://www.forestry.gov.uk/inventory.Forest Research, 2018. Space Applications for Precision Plant Health Information, Response and Evaluation (sapphire). URL: https://www.
forestry.gov.uk/fr/sapphire.Forestry Commission, 2017. What shaped our forests? URL: https://www.forestry.gov.uk/forestry/infd-5rjhs5.Forestry Commission, 2018a. Phytophthora ramorum. URL: https://www.forestry.gov.uk/pramorum.Forestry Commission, 2018b. Phytophthora ramorum. URL: https://www.forestry.gov.uk/datadownload.Gandolfi, A., 2013. Percolation Methods for SEIR Epidemics on Graphs. Springer. pp. 31–58. URL: https://app.dimensions.ai/details/
publication/pub.1047486272, doi:10.1007/978-1-4614-9224-5_2. exported from https://app.dimensions.ai on 2018/11/06.Grassberger, P., 1993. On a self-organized critical forest-fire model. Journal of Physics A: Mathematical and General 26, 2081. URL: http:
//iopscience.iop.org/article/10.1088/0305-4470/26/9/007.Gross, A., Holdenrieder, O., Pautasso, M., Queloz, V., Sieber, T.N., 2013. Hymenoscyphus pseudoalbidus, the causal agent of european ash dieback.
Molecular Plant Pathology 15, 5–21. URL: https://onlinelibrary.wiley.com/doi/abs/10.1111/mpp.12073, doi:10.1111/mpp.12073, arXiv:https://onlinelibrary.wiley.com/doi/pdf/10.1111/mpp.12073.
Gsell, A.S., Scharfenberger, U., Ozkundakci, D., Walters, A., Hansson, L.A., Janssen, A.B.G., Noges, P., Reid, P.C., Schindler, D.E., Van Donk, E.,Dakos, V., Adrian, R., 2016. Evaluating early-warning indicators of critical transitions in natural aquatic ecosystems. Proceedings of the NationalAcademy of Sciences 113, E8089–E8095. URL: http://www.pnas.org/content/113/50/E8089, doi:10.1073/pnas.1608242113,arXiv:http://www.pnas.org/content/113/50/E8089.full.pdf.
Guttal, V., Jayaprakash, C., . Changing skewness: an early warning signal of regime shifts in ecosystems. Ecology Letters 11, 450–460. URL:https://onlinelibrary.wiley.com/doi/abs/10.1111/j.1461-0248.2008.01160.x, doi:10.1111/j.1461-0248.2008.01160.x, arXiv:https://onlinelibrary.wiley.com/doi/pdf/10.1111/j.1461-0248.2008.01160.x.
Harwood, T.D., Tomlinson, I., Potter, C.A., Knight, J.D., 2010. Dutch elm disease revisited: past, present and future management in great britain.Plant Pathology 60, 545–555.
Kaplan, J.O., Krumhardt, K.M., Zimmermann, N., 2009. The prehistoric and preindustrial deforestation of europe. Quaternary Science Reviews28, 3016 – 3034. URL: http://www.sciencedirect.com/science/article/pii/S027737910900331X, doi:https://doi.org/10.1016/j.quascirev.2009.09.028.
10

Kefi, S., Guttal, V., Brock, W.A., Carpenter, S.R., Ellison, A.M., Livina, V.N., Seekell, D.A., Scheffer, M., van Nes, E.H., Dakos, V., 2014. Earlywarning signals of ecological transitions: Methods for spatial patterns. PLOS ONE 9, 1–13. URL: https://journals.plos.org/plosone/article?id=10.1371/journal.pone.0092097, doi:10.1371/journal.pone.0092097.
Liang, L., Li, X., Huang, Y., Qin, Y., Huang, H., 2017. Integrating remote sensing, gis and dynamic models for landscape-level simulation of forestinsect disturbance. Ecological Modelling 354, 1–10. doi:https://doi.org/10.1016/j.ecolmodel.2017.03.007.
Litzow, M.A., Hunsicker, M.E., 2016. Early warning signals, nonlinearity, and signs of hysteresis in real ecosystems. Ecosphere 7. URL:https://esajournals.onlinelibrary.wiley.com/doi/full/10.1002/ecs2.1614, doi:10.1002/ecs2.1614.
Macnadbay, E., Bezerra, R., Fulco, U., Lyra, M., Argolo, C., 2004. Critical behavior of a vector-mediated propagation of an epidemic process.Physica A: Statistical Mechanics and its Applications 342, 249 – 255. URL: http://www.sciencedirect.com/science/article/pii/S0378437104005059, doi:https://doi.org/10.1016/j.physa.2004.04.085.
Macpherson, M.F., Kleczkowski, A., Healey, J.R., Quine, C.P., Hanley, N., 2017. The effects of invasive pests and pathogens on strategies forforest diversification. Ecological Modelling 350, 87–99. doi:https://doi.org/10.1016/j.ecolmodel.2017.02.003.
Maskell, L., Henrys, P., Norton, L., Smart, S., Wood, C., 2013. Distribution of ash trees (Fraxinus excelsior) in countryside survey data. CountrySide Survey , 1–20URL: www.countrysidesurvey.org.uk.
Meentemeyer, R.K., Cunniffe, N.J., Cook, A.R., Filipe, J.A.N., Hunter, R.D., Rizzo, D.M., Gilligan, C.A., 2010. Epidemiological modeling ofinvasion in heterogeneous landscapes: spread of sudden oak death in california (1990-2030). Ecosphere 2, 1–24.
Mitchell, R., Beaton, J., Bellamy, P., Broome, A., Chetcuti, J., Eaton, S., Ellis, C., Gimona, A., Harmer, R., Hester, A., Hewison, R., Hodgetts, N.,Iason, G., Kerr, G., Littlewood, N., Newey, S., Potts, J., Pozsgai, G., Ray, D., Sim, D., Stockan, J., Taylor, A., Woodward, S., 2014. Ash diebackin the uk: A review of the ecological and conservation implications and potential management options. Biological Conservation 175, 95 – 109.URL: http://www.sciencedirect.com/science/article/pii/S0006320714001700, doi:https://doi.org/10.1016/j.biocon.2014.04.019.
Morales, I.O., Landa, E., Angeles, C.C., Toledo, J.C., Rivera, A.L., Temis, J.M., Frank, A., 2015. Behavior of early warnings near the criticaltemperature in the two-dimensional ising model. PLOS ONE 10, 1–20. URL: https://doi.org/10.1371/journal.pone.0130751,doi:10.1371/journal.pone.0130751.
Mundt, C.C., Wallace, L.D., Allen, T.W., Hollier, C.A., Kemerait, R.C., Sikora, E.J., 2013. Initial epidemic area is strongly associated with theyearly extent of soybean rust spread in north america. Biol. Invasions 15, 1431–1438.
Potter, C., Harwood, T., Knight, J., Tomlinson, I., 2011. Learning from history, predicting the future: the UK dutch elm disease outbreak in relationto contemporary tree disease threats. Philosophical Transactions of the Royal Society B 366, 1966–1974.
Ratajczak, Z., D’Odorico, P., Nippert, J.B., Collins, S.L., Brunsell, N.A., Ravi, S., . Changes in spatial vari-ance during a grassland to shrubland state transition. Journal of Ecology 105, 750–760. URL: https://
besjournals.onlinelibrary.wiley.com/doi/abs/10.1111/1365-2745.12696, doi:10.1111/1365-2745.12696,arXiv:https://besjournals.onlinelibrary.wiley.com/doi/pdf/10.1111/1365-2745.12696.
Rhodes, C., Anderson, R., 1996. Dynamics in a lattice epidemic model. Physics Letters A 210, 183 – 188. URL: http://www.sciencedirect.com/science/article/pii/S0375960196800077, doi:https://doi.org/10.1016/S0375-9601(96)80007-7.
Rhodes, C., Anderson, R., 1997. Epidemic thresholds and vaccination in a lattice model of disease spread. Theoretical Population Biology 52,101 – 118. URL: http://www.sciencedirect.com/science/article/pii/S004058099791323X, doi:https://doi.org/10.1006/tpbi.1997.1323.
Rist, L., Moen, J., 2013. Sustainability in forest management and a new role for resilience thinking. Forest Ecology and Management 310.doi:http://dx.doi.org/10.1038/ncomms2632.
Rogers, B.M., Solvik, K., Hogg, E.H., Ju, J., Masek, J.G., Michaelian, M., Berner, L.T., Goetz, S.J., . Detect-ing early warning signals of tree mortality in boreal north america using multiscale satellite data. Global Change Bi-ology 24, 2284–2304. URL: https://onlinelibrary.wiley.com/doi/abs/10.1111/gcb.14107, doi:10.1111/gcb.14107,arXiv:https://onlinelibrary.wiley.com/doi/pdf/10.1111/gcb.14107.
Saberi, A.A., 2015. Recent advances in percolation theory and its applications. Physics Reports 578, 1 – 32. URL: http://www.sciencedirect.com/science/article/pii/S0370157315002008, doi:https://doi.org/10.1016/j.physrep.2015.03.003. recent advances in per-colation theory and its applications.
Scheffer, M., 2009. Critical Transitions in Nature and Society. Princeton University Press.Scheffer, M., Bascompte, J., Brock, W.A., Brovkin, V., Carpenter, S.R., Dakos, V., Held, H., van Nes, E.H., Rietkerk, M., Sugihara, G., 2009.
Early-warning signals for critical transitions. Nature 461.Schneider, C., Rasband, W., Eliceiri, K., 2012. Nih image to imagej: 25 years of image analysis. Nature Methods , 671–675URL: https:
//www.nature.com/articles/nmeth.2089.Stauffer, D., Aharony, A., 2003. Introduction to Percolation Theory. Revised ed., Taylor & Francis.Taubert, F., Fischer, R., Groeneveld, J., Lehmann, S., Muller, M.S., Rodig, E., Wiegand, T., Huth, A., 2018. Global patterns of tropical forest
fragmentation. Nature , 519–522URL: https://www.nature.com/articles/nature25508.Thomas, P.A., 2016. Biological flora of the British Isles: Fraxinus excelsior. Journal of Ecology 104, 1158–1209.Xu, X., Harwood, T.D., Pautasso, M., Jeger, M.J., . Spatio-temporal analysis of an invasive plant pathogen
(phytophthora ramorum) in england and wales. Ecography 32, 504–516. URL: https://onlinelibrary.
wiley.com/doi/abs/10.1111/j.1600-0587.2008.05597.x, doi:10.1111/j.1600-0587.2008.05597.x,arXiv:https://onlinelibrary.wiley.com/doi/pdf/10.1111/j.1600-0587.2008.05597.x.
11