early screening diagnostic aid for heart disease …811547/fulltext01.pdfearly screening diagnostic...
TRANSCRIPT

DEGREE PROJECT, IN , FIRST LEVELCOMPUTER SCIENCESTOCKHOLM, SWEDEN 2015
Early screening diagnostic aid forheart disease using data miningAN EVALUATION USING PATIENT DATA THATCAN BE OBTAINED WITHOUT MEDICALEQUIPMENT
ANNA OLSSON AND DENISE NORDLÖF
KTH ROYAL INSTITUTE OF TECHNOLOGY
CSC SCHOOL

Early screening diagnostic aid for heart diseaseusing data mining
An evaluation using patient data that can be obtained without medical equipment
ANNA OLSSONDENISE NORDLÖF
Degree Project in Computer Science, DD143XSupervisor: Pawel HermanExaminer: Örjan Ekeberg
CSC, KTH 2015-05

Abstract
Heart disease is the leading cause of death in the world. Being able to conduct anearly screening diagnosis of heart disease at home, could potentially be a tool toreduce the amount of people who lose their lives to the disease in the future.
This report aims at investigating if an early screening diagnostic aid using noattributes requiring advanced medical equipment to be measured can be created,that acquires the same level of accuracy as previous data sets and studies. A litera-ture study of medical background, patient data sets and attributes, as well as datamining was conducted. A unique home data set consisting of attributes that can beobtained from home was created and data mining experiments were run in WEKA,using classification algorithms Naive-Bayes and Decision Trees.
The results are compared to the Cleveland data set in regards to accuracy. Thestudy shows that the home data set does not deliver the same accuracy level as theCleveland data set. The idea that similar accuracy can be obtained for the di�erentsets has not been disproven and more exhaustive research is encouraged.
ReferatTidig screening för att upptäcka hjärt- ochkärlsjukdomar med hjälp av datautvinning
Hjärt- och kärlsjukdomar är den främsta dödsorsaken i värl-den. Ett viktigt verktyg för att reducera antalet människorsom förlorar sina liv i sjukdomen skulle kunna vara möjlig-heten att genomföra en tidig sållningsundersökning i hem-met.
Rapporten har som främsta mål att undersöka huruvi-da det går att skapa ett tidigt sållningsundersökningsverk-tyg lämpat för hemmabruk som kan uppnå samma pre-cision som tidigare experiment som tagit hänsyn till at-tribut som kräver avancerad medicinsk utrustning för attmätas. En litteraturstudie genomfördes för medicinsk bak-grund, datauppsättningar av patienter och deras attributsamt datautvinning. Utifrån de attribut som går att erhål-la utan avancerad medicinsk utrustning skapades en da-tauppsättning. På denna datauppsättning samt Cleveland-datauppsätnningen kördes med hjälp av datautvinnings-mjukvaran WEKA, två klassificeringsalgoritmer, Naive-Bayesoch Decision Trees.
Med hjälp av classifiers skapade av WEKA jämfördesprecisionen för de olika klassificeringsalgoritmerna på tvåolika datauppsättningar. Studien visar att datauppsättning-en för hemmabruk inte levererar samma precision som Cleveland-datauppsättningen (den datauppsättningen med attributsom måste uppmätas med medicinsk utrustning). Tesen attlikvärdiga resultat går att uppnå är dock inte motbevisadoch fler, mer uttömmande experiment uppmuntras.

Contents
Glossary . . . . . . . . . . . . . . . . . . . . . . . . . . . . . . . . . . . . . 1
1 Introduction 31.1 Project plan . . . . . . . . . . . . . . . . . . . . . . . . . . . . . . . . 4
2 Background 72.1 Medical background . . . . . . . . . . . . . . . . . . . . . . . . . . . 7
2.1.1 Evidence-based . . . . . . . . . . . . . . . . . . . . . . . . . . 72.1.2 Echocardiography . . . . . . . . . . . . . . . . . . . . . . . . 82.1.3 Other techniques . . . . . . . . . . . . . . . . . . . . . . . . . 8
2.2 Data mining . . . . . . . . . . . . . . . . . . . . . . . . . . . . . . . . 82.2.1 Decision Trees . . . . . . . . . . . . . . . . . . . . . . . . . . 92.2.2 Naive Bayesian classification . . . . . . . . . . . . . . . . . . 9
2.3 State-of-the-art . . . . . . . . . . . . . . . . . . . . . . . . . . . . . . 92.3.1 Screening . . . . . . . . . . . . . . . . . . . . . . . . . . . . . 92.3.2 Mobile applications . . . . . . . . . . . . . . . . . . . . . . . . 102.3.3 Data mining . . . . . . . . . . . . . . . . . . . . . . . . . . . 10
2.4 Possible problems with self-diagnosis . . . . . . . . . . . . . . . . . . 10
3 Methods 113.1 Original data - Heart disease database . . . . . . . . . . . . . . . . . 113.2 Cleveland data set . . . . . . . . . . . . . . . . . . . . . . . . . . . . 113.3 Home data set . . . . . . . . . . . . . . . . . . . . . . . . . . . . . . 12
3.3.1 Choosing attributes for home data set . . . . . . . . . . . . . 123.3.2 Irrelevant data for home data set . . . . . . . . . . . . . . . . 123.3.3 Home data set attributes . . . . . . . . . . . . . . . . . . . . 13
3.4 Data sets used . . . . . . . . . . . . . . . . . . . . . . . . . . . . . . 133.4.1 Data set descriptions . . . . . . . . . . . . . . . . . . . . . . . 14
3.5 WEKA . . . . . . . . . . . . . . . . . . . . . . . . . . . . . . . . . . 143.6 Input data files in WEKA . . . . . . . . . . . . . . . . . . . . . . . . 15
3.6.1 Corrupt patient data . . . . . . . . . . . . . . . . . . . . . . . 153.6.2 Creating ar� file in WEKA . . . . . . . . . . . . . . . . . . . 15
3.7 Evaluation in WEKA . . . . . . . . . . . . . . . . . . . . . . . . . . 153.7.1 10-fold cross validation . . . . . . . . . . . . . . . . . . . . . . 15

3.7.2 Classifiers . . . . . . . . . . . . . . . . . . . . . . . . . . . . . 153.8 Analyzing results . . . . . . . . . . . . . . . . . . . . . . . . . . . . . 16
4 Results 174.1 Comparison between Cleveland data set and original Cleveland data
set . . . . . . . . . . . . . . . . . . . . . . . . . . . . . . . . . . . . . 174.2 All results . . . . . . . . . . . . . . . . . . . . . . . . . . . . . . . . . 184.3 CCI comparison . . . . . . . . . . . . . . . . . . . . . . . . . . . . . 204.4 ROC Area Results . . . . . . . . . . . . . . . . . . . . . . . . . . . . 21
5 Discussion 23
6 Conclusions 27
Bibliography 29
Appendices 31
A Heart disease data set attributes 33

CONTENTS
GlossaryData mining The unified name for all tools/procedures that can be used when
searching for relationships and trends in large amounts of data.
Decision Trees A support tool using a tree-like model of decisions and their con-sequences, often used in data mining. Can be used to represent an algorithm.
Naive Bayesian classification A classification algorithm using a version of Bayestheorem with strong independence assumptions between the features.
Classifier A probabilistic classifier can, given a sample input, predict a probabilitydistribution. A classifier is created using a classification algorithm.
Heart disease Also known as Cardiovascular disease, include all diseases that in-volve the heart or blood vessels.
Cardiology/cardiologist Cardiology is the branch of medicine specialized in alldisorders of the heart. A cardiologist is a physician who specializes in cardi-ology.
Attribute A property of an entity of some kind. In this report refers to measuredvalues of the patients.
1
Chapter 1
Introduction
The topic of this report is the automatisation in the diagnosing of heart disease.More specifically, the possibility of diagnosing a patient without having to interactwith another human.
Heart disease is the leading cause of death globally [23,28]. Heart disease is alsothe disease with the largest disease burden, topping the charts of DALY (disability-adjusted life years) [29] and YLL (years of life lost) [30] in the latest global estimatesby The World Health Organization (WHO). WHO also sees no decline in deathscaused by heart disease in the future. A recent study predicts heart disease to stillbe the leading global cause of death in 2030 [27].
The underlying cause for heart disease is atherosclerosis (loss of flexibility andsti�ening of the arteries due to accumulation of white blood cells). Atherosclerosisdevelops over a long period of time and is generally in an advanced form whensymptoms start to appear. Acute heart disease symptoms usually occur withoutprior warning and often has a fatal outcome before medical treatment can be of-fered. Addressing risk factors has shown to reduce mortality in both diagnosedand undiagnosed patients [26] and 90% of heart diseases are considered to be pre-ventable [21]. This indicates that it is important to diagnose a patient early, suchthat actions against the disease can be taken preemptively.
The possibility for a patient to screen themselves for heart disease at home couldincrease the amount of people who discover the disease or the risk of disease at anearly stage, and therefore have the possibility to treat or monitor the disease. Thiscould possibly make a huge positive impact on a lot of peoples lives.
Automatisation as a tool for diagnosing diseases is an area within the medicalfield that has been discussed and researched for decades. An aspect that is stilllargely untouched in this area, is the possibility of developing and expanding thefield of application of automatisation from being a tool for professional use in med-
3

CHAPTER 1. INTRODUCTION
ical facilities, to being used as a diagnostic aid and tool for the common man. Aninitial diagnosis at home could disburden hospitals and other medical facilities interms of time, costs, workload and also reduce fatality rates. This report is thereforeintended to evaluate the possibility of being able to conduct an early stage analysisof risks of heart disease without patients having to visit a hospital or interact withanother human.
There are a lot of comparisons between di�erent methods and algorithms meantto analyze and diagnose heart disease. These comparisons are all intended for aprofessional surrounding, with a lot of medical equipment required to obtain thedata sets used in the algorithms.
To explore this question, a data set solely consisting of the patient data (thepatient data in the data set is hereinafter referred to as "Attributes") that is possibleto produce “at home” has been evaluated. These attributes were extracted from adata set found in the database of the University of California [2]. The whole setconsists of 76 di�erent attributes. 14 of these attributes have been deemed the mostrelevant for diagnosing heart disease in earlier experiments and are therefore mostoften referenced to when performing analysis of accuracy between algorithms in ex-isting reports. These attributes also represent some of the most common risk factorsto look at in classical screening [17]. The 14 attribute set is called the Clevelanddata set. The home data set that has been created for this report consist of age, sex,blood pressure and other attributes that can be measured “at home”. Attributesthat has not been taken into consideration are for example cholesterol values andother tests that require a blood sample analysis or other advanced procedures andtechniques.
To explore the possibility of diagnosing at home with these simple attributesthis report uses two di�erent algorithms for data mining - Decision Trees and NaiveBayesian classification. This because of the promising results these algorithms haveproduced in earlier experiments. 99.2% accuracy for Decision Trees and 96.5 % forNaive-Bayes [34,35].
Problem statement“Using Decision Trees and Naive-Bayesian classification, is it possible to create
a early screening diagnostic aid for heart disease using a set of data that has beenrestricted to consisting of only medical information that can be obtained withoutadvanced medical equipment(e.g. no blood samples)? If so, how e�ective is it?”
1.1 Project planUsing Decision Trees and Naive-Bayesian classification:
Identify suitable attributes for the study.
4

1.1. PROJECT PLAN
Create a classifier using the Cleveland data set.
Create a classifier using the “extractable-at-home” subset.
Create a classifier using the whole database from which the data sets are extracted.
Perform a comparative evaluation between the classifiers.
Compare the robustness (reliability and potential weaknesses) of the two classi-fiers.
Discuss whether or not, based on the results from the classifiers, if it is possible todraw any conclusions regarding the future of automated diagnosing withoutmedical equipment. If possible, draw conclusions.
5

Chapter 2
Background
This section aims at introducing the notions, concepts and techniques which are usedin this study. This section includes both medical background as well as coveringdata mining and the tools needed to implement it.
2.1 Medical background
There are several di�erent tools for diagnosing heart disease, most are di�erentways of analyzing major signs and symptoms or using visualisation techniques. Thedi�erent visualisation techniques are state-of-the-art methods. The major signsassociated with heart disease are chest discomfort, dyspnea, fatigue, edema, palpi-tations and fainting. Other smaller signs include coughing, coughing blood, limp-ing, limb pain, indigestion, belching and skin discoloration. In most cases, carefulattention to the specific characteristics of chest discomfort can narrow down thediagnosis [19, p. 95-96].
2.1.1 Evidence-based
Evidence-based diagnosing is the oldest technique in heart disease diagnosis. Theevidence justifying correlation between history and physical examination with heartdisease has most rigorously been established for heart failure, valvular heart diseaseand coronary artery disease.
Looking at ambulatory patients, there are nine base elements. Three historyelements and six physical. The history based ones are shortness of breath afterone flight of stairs (dyspnea), shortness of breath when in rest (orthopnea), severeshortness of breath and coughing commonly occuring at night (paroxysmal noc-turnal dyspnea). The physical ones are displaced apex beat, irregularly irregularpulse, heart murmur suggestive of mitral regurgitation, heart rate greater than 60beats/min and elevated jugular venous pressure [19, p. 95].
7

CHAPTER 2. BACKGROUND
2.1.2 Echocardiography
Echocardiography uses ultrasound to create images of the heart. Echocardiographyis one of the most widely used diagnostic tests in the heart disease field. It providesimmediate clinically relevant information at a low cost [19, p. 179] and has recentlybeen made available to non-cardiologists to perform echocardiography tests with asmall portable machine [12].
2.1.3 Other techniques
Besides the most common evidence-based diagnosing and echocardiography tech-niques there are some other non-invasive techniques like electrocardiography [19,p. 114], chest radiography [19, p. 261], magnetic resonance imaging [19, p. 320],arteriography and intracoronary imaging [19, p. 392], nuclear cardiology [19, p. 271]and computed tomography [19, p. 341]. These are all imaging techniques. Invasivetechniques include catheterization [19, p. 364] and exercise testing [19, p. 155].
2.2 Data mining
Data mining is the unified name for all tools that can be used when searching forrelationships and trends in large amounts of data, mainly used on data showingno such trends when judged by the human eye. The purpose of data mining isto be able to extract information from and make sense of large amounts of infor-mation [4]. The statistically significant relationships between data points that areextracted with data mining, often referenced as a classifier and will be from now onin this report, can be applied to new data and the chance of each outcome can beextracted.
The classifier is built using a set of training data. Training data is informa-tion with an already known outcome for the intended research. Larger amounts ofdata create more credible classifiers. After the classifier has been defined, it is ofutmost importance that it is applied to data that was not a part of the trainingdata. The evaluation could otherwise result in incorrectly high accuracy for theclassifier [5]. An example of training data could be a database containing patientsand their medical records. The patients all have the same information recordedand not just sporadic information. The patients also have a yes/no diagnosis for aspecific disease, e.g. heart disease.
There is a vast sea of di�erent techniques and algorithms used in data mining,so a challenge in this report is to choose the most suitable one for a specific purpose.This report uses the two algorithms that have been most successful in earlier studiesin the field of diagnosing heart disease; Decision Trees(99.2% accuracy) and Naive-Bayes classification (96.5% accuracy) [34,35].
8

2.3. STATE-OF-THE-ART
2.2.1 Decision TreesDecision Trees is a technique very commonly used within data mining. The idea isto create a set of rules which can predict a specific question variable based on a setof input data. A Decision Tree consists of vertices and edges. The edges symbolize aroad or a decision leading to the next vertice, possibly a pendant vertice (a pendantvertice is the vertice from which there are no further edges to travel), which couldrepresent the next question or statement. [9]
When using Decision Trees in data mining, each inner domain vertice corre-sponds to a data point in the data set with each edge from the inner verticesrunning out to a pendant vertice representing one of the possible values for thatdata point. Each vertice labeled with some kind of probability. The most commonway for Decision Trees to handle training data is to split the training data set intosubsets according to the specified algorithms preferences. The process is called top-down induction of Decision Trees and is recursively repeated until the algorithmdeems there is no longer anything to achieve by continuing the process [32].
J48 algorithm
J48 is an open source Java implementation of the C4.5 algorithm, used in the datamining software WEKA [11]. The C4.5 algorithm is an extension to the ID3 algo-rithm and is used to initialize a Decision Trees that can be used for classification [31].This is the initialization algorithm used for all Decision Trees tests in this report.
2.2.2 Naive Bayesian classificationBayesian classification is used in data mining in a similar fashion to Decision Treesand is able to predict the probability of class membership. Bayesian classification isbased on Bayes Theorem and is most commonly used in machine learning. There areseveral di�erent versions of Bayesian classification where Naive-Bayes is the mostcommon. It has been, and still is a very popular method to use when implementingspam filters and other types of text categorization [15].
2.3 State-of-the-art
2.3.1 ScreeningScreening is a debated topic. There is no existing consensus on whether screeningfor heart disease actually helps patients detect and manage their diseases as muchas it frightens and ushers people to take unnecessary tests and hollow out hospitalresources in vain. The general recommendation is to avoid screening if the patientshows no symptoms [6, 24].
9

CHAPTER 2. BACKGROUND
Screening for heart disease means going through the same process as when try-ing to diagnose a patient, but is done before the patient has shown any symptoms.The screening process puts focus on the easily measured risk factors such as bloodpressure, cholesterol, weight, sex and age [19, p. 95-96].
2.3.2 Mobile applicationsThere are several applications for mobile phones meant to help the user keep track ofthe most common risk factors for heart disease (e.g. blood pressure, cholesterol val-ues, stress, etc.). Generally they help the patient keep track of their values [14,16],there are also applications that help you measure blood pressure [18]. Some appli-cations give a go at screening for heart disease [7]. None of these applications arerecognized or recommended by the medical community.
2.3.3 Data miningBesides Naive Bayesian classification and Decision Trees, there are several experi-ments using other versions of data mining such as fuzzy logic [3] and neural net-works [1]. Two of the most commonly used methods but with no found reportshowing the same level of accuracy as for Naive Bayesian classification and DecisionTrees in the field of heart disease.
2.4 Possible problems with self-diagnosisSo far no studies within heart disease diagnosing or screening have been deemed se-cure enough to be embraced by the medical community. Self-diagnosis is very likelyto result in errors and potentially escalate into a dangerous situation where a patientreceives a wrong treatment. Generally all institutions with power in the matter, likegovernments, patient care organizations and medical sta� strongly discourages theuse of self-diagnosing because of the potential danger [20, 25, 36]. Trained doctorsare also discouraged from engaging in self-diagnosing because of the tendencies formistakes [10].
In self-diagnosis, it is common for the patient to not understand their own symp-toms. Psychiatric problems are especially hard to miss and it is common for thepatient to believe they have worse symptoms than they actually have [22].
Self-diagnosis is especially dangerous if it is possible for the patient to obtainnon-prescriptive medicine to treat the disease they believe they have. For example,trying to regulate your blood pressure without the help of a professional, could leadto extreme repercussions for the patient’s health [8, 33].
10

Chapter 3
Methods
The following sections present the methods used in this study. These sectionsinclude a detailed description of how data and data sets were chosen, used andanalyzed. This chapter also covers how data mining was implemented in WEKAand how results were analyzed.
3.1 Original data - Heart disease databaseThe original data is fetched from the "Heart disease" database found in the databaseof the University of California [2]. The set consists of 303 instances (patients) and76 attributes. Complete list of attributes can be found in Appendix A.
3.2 Cleveland data setAll previously published reports and tests that have been conducted within this areauses not all of the 76 attributes found in the Heart disease database. Instead, a sub-set known as the Cleveland data set, has been chosen to represent the Heart diseasedatabase. The Cleveland data set consists of 14 attributes, including the attributenum. Num is the “goal” attribute, measuring and distinguishing the presence orabsence of heart disease in the patient. The other attributes are some of the mostcommon risk factors used in classical evidence-based heart disease diagnosis [17].
The 14 attributes included in the Cleveland data set are:
1. Age
2. Gender
3. Chest pain type
4. Blood pressure when resting
5. Cholesterol
11
CHAPTER 3. METHODS
6. Blood sugar when fasting
7. Electrocardiographic results when resting
8. Maximum heart rate
9. Exercise induced angina
10. ST depression induced by exercise relative to rest
11. The slope of the peak exercise for the ST depression segment
12. Number of major vessels colored by flouroscopy
13. Heart status (Normal, defect)
14. Predicted status (Yes/No heart disease)
3.3 Home data setSince the goal of this report is to explore whether a data set solely consisting of theattributes that are possible to produce “at home” can be used to conduct an earlystage analysis of risks of heart disease, such a data set of attributes was created.This data set consists of ten attributes that are possible to retain from a non-medicalfacility.
3.3.1 Choosing attributes for home data setWhen choosing the attributes that are possible to retain at home, an analysis ofthe 76 attributes was conducted. For each attribute, the following questions wereinvestigated: What is this attribute? What does it measure? How is it measured?What tools are required for measurement? With this information acquired, anassessment was done using “common sense”.
3.3.2 Irrelevant data for home data setIn the first stage of choosing attributes for the home data set, more than the finalten attributes were chosen. Once testing was started, it was realized that several ofthese attributes did not contribute to the results for various reasons and they weretherefore removed.
Smokers (smoke) - The original Heart database contains an attribute statingwhether the patients were smokers or non-smokers. All patients, however, have thisattribute assigned as "-9", which is the value placed for not known information.Some patients had information regarding their smoking habits (other attributes) -clearly showing that they were smokers. Despite this, because of the insecurity ofthe data, this attribute was removed from the home data set.
12

3.4. DATA SETS USED
Chest pain value (ca) - Chest pain value is an attribute that measureswhat type of chest pain the patient is experiencing. The attributes has four valuesrepresenting four types of chest pain: typical angina, atypical angina, non-anginal,asymptomatic. When looking at the data set, all instances consisted of value 1,typical angina. Although this is relevant to note, this attribute did not need to berepresented in our data set, as it would not a�ect the results.
History of diabetes - History of diabetes is an attribute that measures ifthe patient has a family history of diabetes. When looking at the data set, all in-stances were represented with “-9”, signifying that the attribute values were missing.Therefore, this attribute was removed from the home data set.
3.3.3 Home data set attributesThe final home data set consists of ten attributes:
1. Age
2. Sex
3. Blood pressure when resting
4. Family history of coronary artery disease
5. Duration of exercise test in minutes
6. Maximum heart rate
7. Resting heart rate
8. Resting blood pressure
9. Exercise induced angina
10. Predicted status (Yes/No heart disease)
3.4 Data sets usedWhen generating results in WEKA, several data sets were chosen to run tests on. InFigure 3.1, a table with these data sets can be viewed. The table also demonstrateshow many and which attributes are included in each data set.
13

CHAPTER 3. METHODS
Figure 3.1. Data sets used in this report and what attributes are included in eachdata set
3.4.1 Data set descriptionsFixed attributes - The data set fixed attributes consists of four attributes
that have set values. These attributes are age, sex and family history.
Measurable attributes - The data set Measurable attributes consists onlyof attributes that need to be measured. These seven attributes include resting bloodpressure, duration of exercise test in minutes, maximum heart rate achieved, restingheart rate, resting blood pressure, and exercise induced angina.
Easily measured attributes - The data set Easily measured attributes con-sists of attributes that are most likely to provide an accurate result. Thereforeattributes that require exercising were removed, being that there is a risk thatthese tests could be conducted incorrectly. This data set consists of seven attributes:age, sex, resting blood pressure, family history, resting heart rate, and resting bloodpressure.
3.5 WEKAWaikato Environment for Knowledge Analysis (WEKA) is an open-source softwarewritten in Java developed by the University of Waikato in New Zealand [13]. Itis a machine learning software that has many pre-written algorithms, making itpossible to use these algorithms without having to implement any algorithm codefrom scratch. WEKA has support for both Decision Trees and Naive Bayesianclassification and is the software used to implement these algorithms in this report.
14
3.6. INPUT DATA FILES IN WEKA
3.6 Input data files in WEKAWEKA requires that the input data file is either a .csv file or .ar� file. To createthis we extracted the original Heart Disease database data file (consisting of all 76attributes) from the Heart Disease website and converted it into a csv-file.
3.6.1 Corrupt patient dataThe original data set found in the original Heart Disease database, originally had303 instances(patients). When opening the data file, 21 of these consisted of severalcorrupt values in their attributes and they were therefore removed from the set.
3.6.2 Creating ar� file in WEKAWhen opening the csv-file in WEKA, all 76 attributes were present. All ten at-tributes from the home data set were chosen and the rest deleted.
Attribute types In order to generate correct results, all attributes must bethe right type; either nominal or numerical. When opening the file in WEKA,all attributes had automatically been assigned to be numerical. In order to testthe data set, using both Naive-Bayes and J48 algorithm, the “goal” attribute (inthis case, num) that the tests will run on, must be a nominal type. Therefore, allattributes were assigned a type before any tests were run. Once this was done, thehome data set was saved as an ar�-file.
3.7 Evaluation in WEKA3.7.1 10-fold cross validationFor training and testing the data sets, 10-fold cross validation was used. 10-foldcross validation divides the data set into 10 parts. Nine parts are then chosen ochused for training and the 10th part is used for testing. This is then repeated, usinganother part as the testing piece. Each data part is used once for testing and ninetimes for training. This is then repeated ten times, with a new part being the test-ing piece. An average result is generated from the ten runs.
10-fold cross validation was chosen to be able to avoid overfitting. Overfittingis when random error or noise is observed instead of the underlying relationships.This creates errors in the results. Overfitting often occurs because there is a lackof training data, usually because the data set is small.
3.7.2 ClassifiersWhen running tests in WEKA, a classifier must be chosen. The tests in this reportwas run with two di�erent classifiers, Naive-Bayes and J48 (Decision Trees). Each
15
CHAPTER 3. METHODS
data set that was tested in WEKA, was tested twice, once for each classifier.
Parameter tuning is commonly used with machine learning algorithms. In thisreport, parameter tuning has been excluded. The reason for this is to eliminatethe amount of factors that have an a�ect on the results of this report, so that ananalysis of the results can be conducted as accurately as possible.
3.8 Analyzing resultsWhen running tests in WEKA, classifier output is generated [13]. Several valuesand parameters are observable, below are the nine outputs analyzed in this report:
CCI - CCI stands for Correctly Classified Instances and is the foremost param-eter in which data has been compared in this report. CCI represents the percentageof patients that have been correctly diagnosed, both with and without heart disease.
Kappa - Kappa measures the agreement of prediction with the true class. Itcalculates the di�erence between the prediction with the observed agreement withthat expected by chance. The kappa statistic value is a value between 0-1. A valuegreater than 0 means that the classifier is better than chance.
TP Average - Average of all patients who have been correctly diagnosed.
FP Average - Average of all patients who have been incorrectly diagnosed.
TP Healthy - True positive. The patient has been correctly diagnosed ashealthy (not having heart disease).
FP Healthy - False positive. The patient has been falsely diagnosed ashealthy (actually has heart disease).
TP Heart disease - True positive. The patient has been correctly diagnosedwith heart disease.
FP Heart disease - False positive. The patient has been falsely diagnosedwith heart disease (is actually healthy).
ROC Area - ROC Area is the area under the ROC curve. ROC curve showshow well a classifier is at distinguishing between positive and negative instances.ROC area can be used to evaluate the quality of the classifier and its ability toseparate positive and negative instances. ROC Area can be a value between 0.5and 1, 1 being an optimal classifier and 0.5 being comparable with chance.
16
Chapter 4
Results
The following sections present the results of this study, gathered according to meth-ods described in the previous chapter.
4.1 Comparison between Cleveland data set and originalCleveland data set
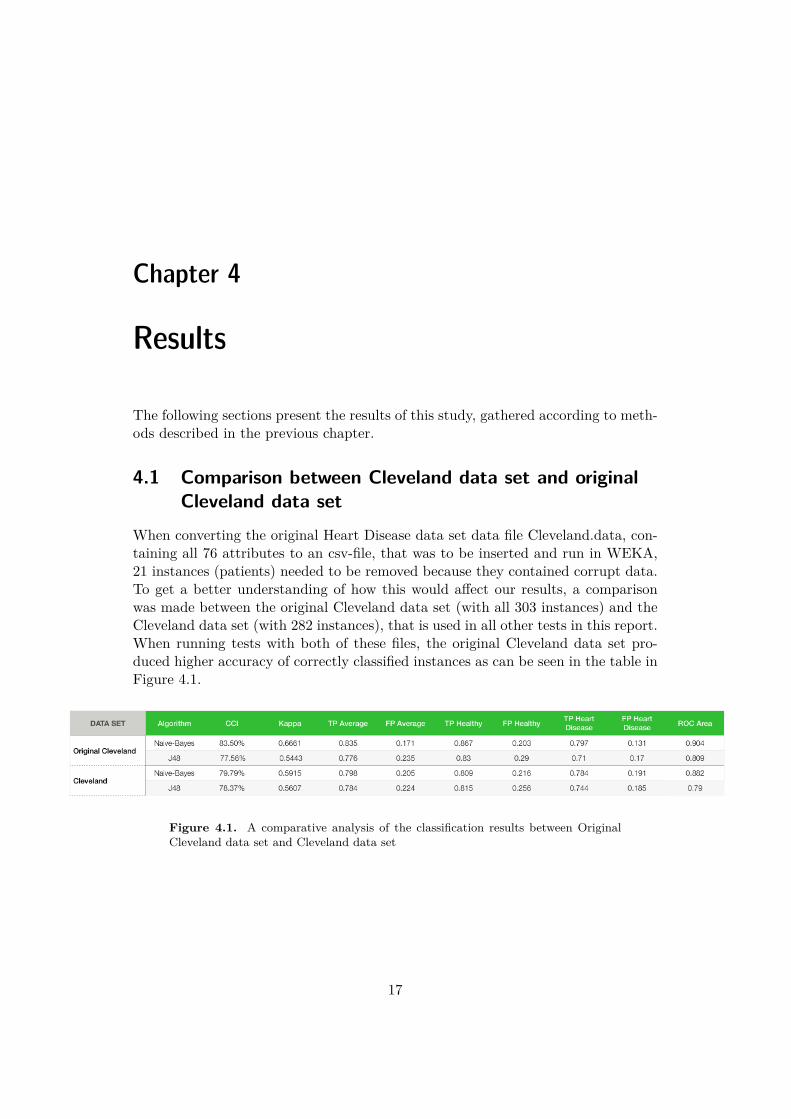
When converting the original Heart Disease data set data file Cleveland.data, con-taining all 76 attributes to an csv-file, that was to be inserted and run in WEKA,21 instances (patients) needed to be removed because they contained corrupt data.To get a better understanding of how this would a�ect our results, a comparisonwas made between the original Cleveland data set (with all 303 instances) and theCleveland data set (with 282 instances), that is used in all other tests in this report.When running tests with both of these files, the original Cleveland data set pro-duced higher accuracy of correctly classified instances as can be seen in the table inFigure 4.1.
Figure 4.1. A comparative analysis of the classification results between OriginalCleveland data set and Cleveland data set
17

CHAPTER 4. RESULTS
4.2 All resultsOn the next page, Figure 4.2 shows a table with all the results that have beengenerated through data-mining testing in WEKA and from this study. Each row(later divided into two rows) represents each data set and its results. Each data setis represented with two rows, one for each of the classifiers: Naive-Bayes and J48.For a detailed description of the parameters measured, see section 3.7.
18

4.2. ALL RESULTS
Figu
re4.
2.A
llre
sults
19

CHAPTER 4. RESULTS
4.3 CCI comparisonFigure 4.3 demonstrates a comparison between the eight di�erent data sets in termsof CCI, Correctly Classified Instances. Each data set has been represented with twobars, one for each of the classifiers: Naive-Bayes and J48. Each bar in the figurerepresents the percentage of patients who have been correctly diagnosed for a specificdata set and classifier.
Figure 4.3. A comparative analysis of the CCI results between the di�erent datasets tested on
20
4.4. ROC AREA RESULTS
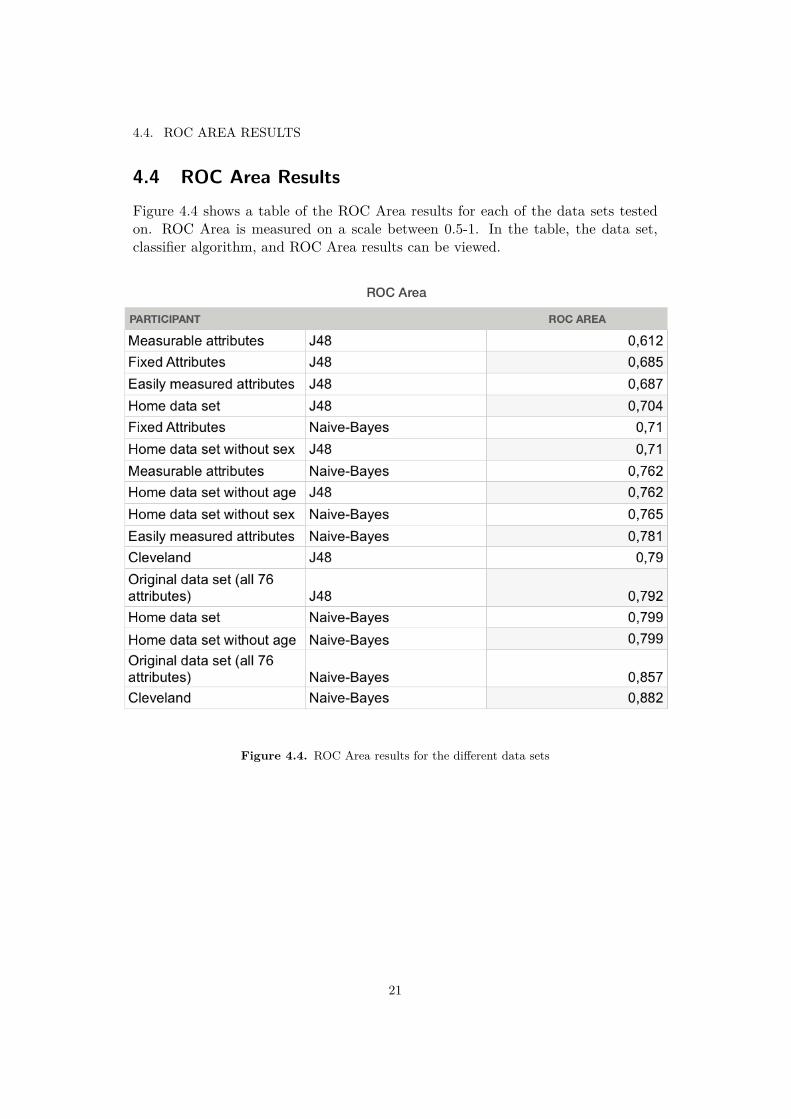
4.4 ROC Area ResultsFigure 4.4 shows a table of the ROC Area results for each of the data sets testedon. ROC Area is measured on a scale between 0.5-1. In the table, the data set,classifier algorithm, and ROC Area results can be viewed.
Figure 4.4. ROC Area results for the di�erent data sets
21

Chapter 5
Discussion
When analyzing our results, we can draw the conclusion that the results are in-conclusive and therefore no concrete conclusions can be drawn. There are severalobservations that can be made, but there is not enough consistency in the resultsto be able to draw conclusions. For every observation that can be drawn from ourresults, there are also exceptions. In this discussion, both our observations as wellas the reasons why we got inconclusive results will be discussed. Furthermore, thefuture for self-diagnosing will be discussed.
Having a look at the results, it becomes apparent that the goal to produce aclassifier for early screening at home that produces the same level of accuracy asprevious experiments was unsuccessful. The Cleveland data set with Naive-Bayesclassifier has an accuracy of 79.9% and with J48 it is 78.37%. The home data setprovides an accuracy of 73.4% (for Naive-Bayes) and all other subsets deliver anaccuracy between 66.67-73.4%.
A correlation between accuracy and the amount of attributes used in the cre-ation of the classifier was found. In general, more attributes give greater accuracy,with an interesting exception. The home data set without sex provided higher ac-curacy than the home data set. There is a di�erence in accuracy with over 2%.
The complete original database with 76 attributes was the data set that camethe closest to competing with outcome of the Cleveland data set. The Clevelanddata set delivered better accuracy, but only with a slim margin (+0.71%). Thisindicating that the Cleveland data set is an optimal set of attributes to consider,hence supporting why it has been chosen to represent the original database in pre-vious reports.
When analyzing the generated results, another aspect that should be discussedare the classifier algorithms, Naive-Bayes and J48. Naive-Bayes and J48 do notdeliver the same results. In all cases but one, the Naive-Bayes classifier outdoes the
23

CHAPTER 5. DISCUSSION
J48 in terms of accuracy. When looking at previous reports and experiments, J48outperformed Naive-Bayes. This makes us question the accuracy of the results inour report. It could be that Naive-Bayes has an advantage when handling smalleramounts of data, while J48 has an advantage when handling larger amounts of data.When looking at Figure ROC AREA, the home data set and the di�erent subsetshave results between 0.612-0.799 in terms of ROC Area. An optimal/perfect clas-sifier will score 1 on this test, so this does not make our results look any morepromising.
When trying to analyze why we got inconclusive result, the lack of patient datais definitely a leading factor. The only significant di�erence between the earlierexperiments in previous reports and this report was that they had access to threetimes as many patients. A possible conclusion could be that a larger amount ofpatients would make the classifiers increase in accuracy. Being that we had a smallset of data, there is definitely a possibility that we experienced overfitting whengenerating our results. That the classifiers measured noise instead of the underly-ing relationships. This could have a�ected our results in a negative way.
One of the largest mistakes we made in this experiment was not analyzing theinitial Heart Disease database at an early stage. There were three main problemswith the data sets used in this report. The first being that the database was verysmall to begin with. In addition to this, several patients needed to be removed, dueto corrupt data, making the database even smaller. This also initiated the problemof being able to compare our results to previous reports, since we were no longerworking with the exact same data set. As can be seen in Figure 4.1, the established,original Cleveland data set outperformed our own created Cleveland data set. Thisof course, also makes our results questionable. The third problem with the data,that a�ected our results, was the fact that several attributes intended to be includedin the Home data set, needed to be removed, since they had no measurements at all.
With results of about 70% accuracy for the home data set versus around 80% ac-curacy for the Cleveland data set, the future does not seem bright for home diagnosisat first. With 80% definitely not being accurate enough to actually implement inmedical care, 70% sounds even worse. Such a low accuracy would most likely causeharm and put unnecessary pressure on hospitals by enabling incorrect self-diagnosis.
Considering that 80% is the accuracy that would be achieved in a lab with accessto advanced medical equipment, looking at the loss of 10% actually seems prettyinteresting. If the loss of accuracy when looking at the Cleveland data set in thisexperiment is due to a lack of patients alone, and an accuracy of 99.2% as in ear-lier experiments could be achieved simply by introducing more patients, considerthe premise that the 10% di�erence between the Cleveland data set and the Homedata set is constant. That would mean that an accuracy of at least 89% could beachievable for the Home data set. This suddenly makes the experiments results
24
more interesting.
The experiment should therefore be replicated with at least three times theamount of patients to evaluate whether it is possible to achieve an accuracy ofaround 90% using the Home data set.
There is already a market in place for small, not very advanced diagnosing andmeasuring tools for heart disease. If an application on a mobile device could saywith 90% accuracy if a person su�ers from heart disease or not this could be thedetermining factor that pushes a patient who ignore early symptoms to go see aprofessional. What the classifiers lose in accuracy, they make up for in costs andavailability. A major problem with such an application would be the high amountof False Positive diagnosis (people without heart disease being diagnosed as havingit) and the increased pressure this could put on hospitals. If the classifiers could beapplied to a crowd sourced database of patient information, that could help withboth lack of patients and overfitting to a small data pool.
25

Chapter 6
Conclusions
It is not possible to draw any concrete conclusions from the results of this reportdue to inconclusive results. The thesis of being able to create an early screeningdiagnostic aid with only attributes a patient can extract without advanced medicalequipment can therefore neither be proven nor disproven. The results are inconclu-sive due to the risk of overfitting, a lack of attributes and a too small amount ofpatients. The factor with greatest impact on the experiment was the lack of patientdata.
Although no concrete conclusions can be drawn, the results and observationsgenerated in this report encourage discussion and more exhaustive research withinthe field to further investigate this question. It seems plausible that if the datamining techniques from this study were to be applied to a patient database withat least three times as many patients, the accuracy would be positively impacted.From this study, we see potential for home screening becoming a common tool usedto help decrease the fatality rate due to heart disease in the future.
27
Bibliography
[1] Qeethara Kadhim Al-Shayea. Artificial neural networks in medical diagnosis.International Journal of Computer Science Issues, 8(2):150–154, 2011.
[2] M.D ; Matthias Pfisterer M.D ; Robert Detrano M.D. Ph.D Andras Janosi,M.D ; William Steinbrunn. Heart disease data set. 1988. fetched from UCIMachine Learning Repository.
[3] A.Q. Ansari and N.K. Gupta. Automated diagnosis of coronary heart dis-ease using neuro-fuzzy integrated system. In Information and CommunicationTechnologies (WICT), 2011 World Congress on, pages 1379–1384, Dec 2011.
[4] Nature Biotechnology. Data mining. Nature Biotechnology, 18:237–238, 2000.
[5] Ester ; Holmes John Bull, Larry ; Bernadó-Mansilla. Learning Classifier Sys-tems in Data Mining. Springer Berlin Heidelberg, 2008.
[6] Roger Chou and . Cardiac screening with electrocardiography, stress echocar-diography, or myocardial perfusion imaging: Advice for high-value care fromthe american college of physicianscardiac screening in low-risk adults. Annalsof Internal Medicine, 162(6):438–447, 2015.
[7] Marshfield Clinic. Heart health mobile. mobile application for iOS version1.2.6, 2013.
[8] Peter Conrad. The medicalization of society: On the transformation of humanconditions into treatable disorders. JHU Press, 2008.
[9] Ding-Zhu Du and Ker-I Ko. Decision Trees, pages 145–193. John Wiley &Sons, Inc., 2000.
[10] PhD Elin Olaug Rosvold, MD. Doctor, don’t treat thyself. 162, September2004.
[11] Eibe Frank. Class j48, Open Java class, May 2015.
[12] Håvard Dalen;Bjørn Olav Haugen;Torbjørn Graven. Feasibility and clinicalimplementation of hand-held echocardiography. Expert Rev Cardiovasc Ther.,11:49–54, 2013.
29

BIBLIOGRAPHY
[13] Mark Hall;Eibe Frank;Geo�rey Holmes;Bernhard Pfahringer;Peter Reute-mann;Ian H. The weka data mining software: An update. SIGKDD Explo-rations, 11, 2009.
[14] Azumio Inc. Stress check pro by azumio. mobile application for iOS version1.2, 2012.
[15] K Ming Leung. Naive bayesian classifier. Polytechnic University Departmentof Computer Science/Finance and Risk Engineering, 2007.
[16] Taconic System LLC. Blood pressure monitor - family lite. mobile applicationfor iOS version 3.0.7, 2014.
[17] Judith Mackay, George A Mensah, et al. The atlas of heart disease and stroke.The atlas of heart disease and stroke, 2004.
[18] MacroPinch. Cardiograph. mobile application for Android 2014.
[19] D.L. Mann, D.P. Zipes, P. Libby, and R.O. Bonow. Braunwald’s Heart Disease:A Textbook of Cardiovascular Medicine. Elsevier Health Sciences, 2014.
[20] Barry J Maron, Richard A Friedman, Paul Kligfield, Benjamin D Levine, SamiViskin, Bernard R Chaitman, Peter M Okin, J Philip Saul, Lisa Salberg,George F Van Hare, et al. Assessment of the 12-lead ecg as a screening testfor detection of cardiovascular disease in healthy general populations of youngpeople (12–25 years of age) a scientific statement from the american heart asso-ciation and the american college of cardiology. Circulation, 130(15):1303–1334,2014.
[21] C Alex ; Gidding Samuel S Mcgill, Henry C ; Mcmahan. Preventing heartdisease in the 21st century: implications of the pathobiological determinantsof atherosclerosis in youth (pday) study. 2008.
[22] Srini Pillay M.D. The dangers of self diagnosis - how self diagnosing can leadyou down the wrong path. Debunking Myths of the Mind, May 2010.
[23] P.; Norrving B.; World Health Organization; World Heart Federation; WorldStroke Organization Mendis, S.; Puska. Global atlas on cardiovascular diseaseprevention and control. 2011.
[24] Virginia A. Moyer and . Screening for coronary heart disease with electro-cardiography: U.s. preventive services task force recommendation statement.Annals of Internal Medicine, 157(7):512–518, 2012.
[25] Virginia A. Moyer and . Screening for coronary heart disease with electro-cardiography: U.s. preventive services task force recommendation statement.Annals of Internal Medicine, 157(7):512–518, 2012.
30

BIBLIOGRAPHY
[26] World Health Organization. Prevention of cardiovascular disease guidelines forassessment and management of cardiovascular risk. 2007.
[27] World Health Organization. World health organization projections of causes ofdeath, 2015 and 2030. July 2013.
[28] World Health Organization. World health organization cause-specific mortalityestimates for 2000-2012. June 2014.
[29] World Health Organization. World health organization estimates of cause-specific disability-adjusted life year for 2000-2012. June 2014.
[30] World Health Organization. World health organization estimates of years oflife lost 2000-2012. June 2014.
[31] Ross Quinlan. C4.5: Programs for Machine Learning. Morgan KaufmannPublishers, San Mateo, CA, 1993.
[32] Oded Rokach, Lior ; Maimon. Data Mining with Decision Trees : Theory andApplications. World Scientific, 2007.
[33] Maria E. Ruiz. Risk of self-medication practices. Curent Drug Safety, 5(4):315–323, 2010.
[34] Mai Shouman, Tim Turner, and Rob Stocker. Using decision tree for diagnosingheart disease patients. pages 23–30, 2011.
[35] Jyoti Soni, Ujma Ansari, Dipesh Sharma, and Sunita Soni. Article: Predictivedata mining for medical diagnosis: An overview of heart disease prediction.International Journal of Computer Applications, 17(8):43–48, March 2011. Fulltext available.
[36] Rhoads JM. Stoudemire A. Cardiac screening with electrocardiography, stressechocardiography, or myocardial perfusion imaging: Advice for high-value carefrom the american college of physicianscardiac screening in low-risk adults.Annals of Internal Medicine, 162(6):438–447, 2015.
31

Appendix A
Heart disease data set attributes
This appendix lists all 76 attributes found in the Heart Disease data set. Completeattribute documentation: [2]
1. id: patient identification number
2. ccf: social security number (I replaced this with a dummy value of 0)
3. age: age in years
4. sex: sex (1 = male; 0 = female)
5. painloc: chest pain location (1 = substernal; 0 = otherwise)
6. painexer (1 = provoked by exertion; 0 = otherwise)
7. relrest (1 = relieved after rest; 0 = otherwise)
8. pncaden (sum of 5, 6, and 7)
9. cp: chest pain type
• Value 1: typical angina• Value 2: atypical angina• Value 3: non-anginal pain• Value 4: asymptomatic
10. trestbps: resting blood pressure (in mm Hg on admission to the hospital)
11. htn
12. chol: serum cholestoral in mg/dl
13. smoke: I believe this is 1 = yes; 0 = no (is or is not a smoker)
14. cigs (cigarettes per day)
33

APPENDIX A. HEART DISEASE DATA SET ATTRIBUTES
15. years (number of years as a smoker)
16. fbs: (fasting blood sugar > 120 mg/dl) (1 = true; 0 = false)
17. dm (1 = history of diabetes; 0 = no such history)
18. famhist: family history of coronary artery disease (1 = yes; 0 = no)
19. restecg: resting electrocardiographic results
• Value 0: normal• Value 1: having ST-T wave abnormality (T wave inversions and/or ST
elevation or depression of > 0.05 mV)• Value 2: showing probable or definite left ventricular hypertrophy by
Estes’ criteria
20. ekgmo (month of exercise ECG reading)
21. ekgday(day of exercise ECG reading)
22. ekgyr (year of exercise ECG reading)
23. dig (digitalis used furing exercise ECG: 1 = yes; 0 = no)
24. prop (Beta blocker used during exercise ECG: 1 = yes; 0 = no)
25. nitr (nitrates used during exercise ECG: 1 = yes; 0 = no)
26. pro (calcium channel blocker used during exercise ECG: 1 = yes; 0 = no)
27. diuretic (diuretic used used during exercise ECG: 1 = yes; 0 = no)
28. proto: exercise protocol
• 1 = Bruce• 2 = Kottus• 3 = McHenry• 4 = fast Balke• 5 = Balke• 6 = Noughton• 7 = bike 150 kpa min/min (Not sure if "kpa min/min" is what was
written!)• 8 = bike 125 kpa min/min• 9 = bike 100 kpa min/min• 10 = bike 75 kpa min/min
34

• 11 = bike 50 kpa min/min• 12 = arm ergometer
29. thaldur: duration of exercise test in minutes
30. thaltime: time when ST measure depression was noted
31. met: mets achieved
32. thalach: maximum heart rate achieved
33. thalrest: resting heart rate
34. tpeakbps: peak exercise blood pressure (first of 2 parts)
35. tpeakbpd: peak exercise blood pressure (second of 2 parts)
36. dummy
37. trestbpd: resting blood pressure
38. exang: exercise induced angina (1 = yes; 0 = no)
39. xhypo: (1 = yes; 0 = no)
40. oldpeak = ST depression induced by exercise relative to rest
41. slope: the slope of the peak exercise ST segment
• Value 1: upsloping• Value 2: flat• Value 3: downsloping
42. rldv5: height at rest
43. rldv5e: height at peak exercise
44. ca: number of major vessels (0-3) colored by flourosopy
45. restckm: irrelevant
46. exerckm: irrelevant
47. restef: rest raidonuclid (sp?) ejection fraction
48. restwm: rest wall (sp?) motion abnormality
• 0 = none• 1 = mild or moderate• 2 = moderate or severe
35

APPENDIX A. HEART DISEASE DATA SET ATTRIBUTES
• 3 = akinesis or dyskmem (sp?)
49. exeref: exercise radinalid (sp?) ejection fraction
50. exerwm: exercise wall (sp?) motion
51. thal: 3 = normal; 6 = fixed defect; 7 = reversable defect
52. thalsev: not used
53. thalpul: not used
54. earlobe: not used
55. cmo: month of cardiac cath (sp?) (perhaps "call")
56. cday: day of cardiac cath (sp?)
57. cyr: year of cardiac cath (sp?)
58. num: diagnosis of heart disease (angiographic disease status)
• Value 0: < 50• Value 0: < 50• Value 1: > 50
(in any major vessel: attributes 59 through 68 are vessels)
59. lmt
60. ladprox
61. laddist
62. diag
63. cxmain
64. ramus
65. om1
66. om2
67. rcaprox
68. rcadist
69. lvx1: not used
70. lvx2: not used
36

71. lvx3: not used
72. lvx4: not used
73. lvf: not used
74. cathef: not used
75. junk: not used
76. name: last name of patient (I replaced this with the dummy string "name")
37

www.kth.se