early-return-to-work programs : an exploratory study of
TRANSCRIPT

Portland State University Portland State University
PDXScholar PDXScholar
Dissertations and Theses Dissertations and Theses
1992
Early-return-to-work programs : an exploratory study Early-return-to-work programs : an exploratory study
of the effects of program policies and practices on of the effects of program policies and practices on
organizational outcomes organizational outcomes
Lorrie L. Riat Portland State University
Follow this and additional works at: https://pdxscholar.library.pdx.edu/open_access_etds
Part of the Psychology Commons
Let us know how access to this document benefits you.
Recommended Citation Recommended Citation Riat, Lorrie L., "Early-return-to-work programs : an exploratory study of the effects of program policies and practices on organizational outcomes" (1992). Dissertations and Theses. Paper 4423. https://doi.org/10.15760/etd.6301
This Thesis is brought to you for free and open access. It has been accepted for inclusion in Dissertations and Theses by an authorized administrator of PDXScholar. Please contact us if we can make this document more accessible: [email protected].

AN ABSTRACT OF THE THESIS OF Lorrie L. Riat for the
Master of Science in Psychology presented July 1, 1992.
Title: Early-Return-to-Work Programs: An Exploratory
Study of the Effects of Program Policies and
Practices on Organizational Outcomes.
APPROVED BY THE MEMBERS OF THE THESIS COMMITTEE:
Nancy A. Perri ;~hair '
David F. Wrench
Laurie A. Skokan
Nancy J. ChaoT
Early-return-to-work (ERTW) programs for injured
workers are a relatively new development. While it is
widely believed that such programs are the primary means of
controlling workers' compensation costs after an injury has
~~~~~-------------------''

2
occurred, little research has been done on how these
programs accomplish that end. This thesis is an exploratory
examination of the factors involved in ERTW programs and the
relationship between components of ERTW programs for injured
workers and organizational outcomes, specifically the cost
of medical care and wage reimbursement associated with
workers' compensation claims.
To examine the above relationship, 202 organizations in
Portland, Oregon were surveyed by telephone about their
policies and practices pertinent to injured workers.
Outcome data on each organization was then obtained from the
State of Oregon Bureau of Labor and Industries.
Exploratory factor analysis revealed five factors from
the survey data - a non-ERTW approach, organizations'
perceptions of ERTW, extent of ERTW, communication about the
ERTW program, and written formalization for dealing with
injured employees. This solution accounted for 47.22% of
the total variance. Confirmatory factor analysis on a
holdout sample revealed that the initial structure was quite
stable, but added an additional factor - that of using
regular wage for light duty positions. However, follow-up
analyses, using covariance structural modeling suggested two
additional factors, each of which had only one variable
loading on it. They were an early-return-to-work (ERTW)
factor and a regular wage factor. Confirmatory factor
analysis fit indices for that model were as follows:
X~ (122) = 245.55 (p. = 0.000), Goodness of Fit Index=
0.808, Adjusted Goodness of Fit Index= 0.731, and Root
Mean Square Residual= 0.166).
When data from the state of Oregon Bureau of Labor and
Industries was added, two additional factors were found.
3
The first was identified as the people statistics factor,
which involved variables dealing with the number of
currently open claims, the number of non-disabling claims
for the year, and the number of reopened claims. The second
factor was identified as the dollars cost factor. The
variables that loaded on it were the median cost of medical
claims and the median cost of wage reimbursement.
Regression analyses were conducted to examine
ability to predict the change in median medical and wage
reimbursement costs from 1985 to 1990. Results
suggested that all of the variables together had a
significant ability to predict the change in median
medical costs (R~ = 0.296, p. = 0.003) and that the
variables related to the extent of the ERTW program
factor, organizations' perceptions of ERTW factor, and
regular wage factor was offered were able to predict a
significant amount of variance in the change in median
medical costs.
All of the variables together also had a significant
ability to predict the change in median wage
reimbursement costs over time (R~ = 0.243, p. = 0.032).
However, none of the groups of variables associated with the
factors was able to significantly predict the change in
·.~-
median wage reimbursement costs over time.
Also examined were organizations' preferences in
programs and policies for both those organiza_tions with
the best performance (in terms of both medical and wage
reimbursement workers' compensation costs) over time and
organizations with the worst performance over time
(again, in terms of both medical and wage reimbursement
workers' compensation costs).
l
4

EARLY-RETURN-TO-WORK PROGRAMS: AN EXPLORATORY STUDY OF
THE EFFECTS OF PROGRAM POLICIES AND PRACTICES
ON ORGANIZATIONAL OUTCOMES
by
LORRIE L. RIAT
A thesis submitted in partial fulfillment of the requirements for the degree of
MASTER OF SCIENCE in
PSYCHOLOGY
Portland State University 1992

-~----
TO THE OFFICE OF GRADUATE STUDIES:
The members of the Committee approve the thesis of
Lorrie L. Riat presented July 1, 1992.
David F. Wrench
Laurie A. Skokan
Rockwobd Reid
v
APPROVED:
Cord B. Sengstake, Chair, Department of Psychology
C. William Savery, Interim V~ Provost for Graduate Studies and Research
I 1 t
l l 1 J!
l ·~
~ ;~

r
DEDICATION
This thesis is dedicated to Steven W. Riat who has
been incredibly patient and supportive throughout the
insanity of graduate school as well as to my parents,
Carol and Dennis Larson, who have always encouraged and
supported my efforts to obtain an education.

TABLE OF CONTENTS
PAGE
LIST OF TABLES . . . . . • . . . • . . . . . . . . . . . . v
INTRODUCTION . • . 1
Background . 1
The Workers' Compensation System • • 3
The Insurers • 6
The Worker • . • 6
The Employer . . • • • 8
Return-to-Work . . • • 10
Early-Return-to-Work (ERTW) Programs . . • • 1 1
Research Structure and Goals . . . • 14
METHOD . . • . . . • 16
Subjects . . • • 16
Materials. • • • 16
Procedure. . .19
RESULTS •..•••.. .20
Descriptive Statistics . • • 2 0
Exploratory Factor Analysis .. . . • . 22
Confirmatory Factor Analysis Process/Indices .28
Confirmatory Factor Analysis without State Variables .••.•..•...•.....•• 30
Confirmatory Factor Analysis with State Variables ••...•.....•..•...• 31

·-----------------~~~-
Multiple Regression.
A Comparison of High versus Low Performing Organizations (In Terms of Workers' Compensation Costs)
DISCUSSION
Descriptive Findings .
Exploratory Factor Analysis Findings
Confirmatory Factor Analysis Findings.
Regression Findings.
Findings on the Comparison of High versus Low Performing Organizations.
Limitations of this Study.
Problems with the Survey Instrument.
Recommendations for Further Research .
Recommendations for Organizations.
REFERENCES • .
APPENDIX .
l.V
PAGE
.33
.38
.69
.69
.71
• • 7 4
.76
.78
.79
.80
.83
.86
.88
~90

r
TABLE
I
LIST OF TABLES
PAGE
Descriptive Statistics for the Survey
Questions . • • . . . 45
II Simple Correlations between Survey
Questions . . • • • • 48
III Simple Correlations between the Survey
Questions and the Organizational
Outcome Variables . . . . . . . . . . . . 51
IV Rotated Factor Pattern for Five-Factor
Solution. . . . . . . . . . . . . . . . . 52
v Statistics for Rotated Factor Pattern for
Five-Factor Solution ......•.•.. 54
VI Inter-Factor Correlations for the Rotated
Solution ........•.•...... 55
VII Simple Correlations between the Survey
VIII
Questions and the Change in Medical
Costs and the Change in Wage
Reimbursement Costs
Results of Regression to Predict Change in
Medical Costs from 1985 to 1990, Using
All Program Components.
• • 56
. 57

r
TABLE
IX Results of Regression to Predict Change in
Medical Costs from 1985 to 1990, Using
the Variables that Make Up Each
Factor.
X Results of Regression to Predict Change in
Wage Reimbursement Costs from 1985 to
1990, Using All Program Components.
XI Results of Regression to Predict Change in
Wage Reimbursement Costs from 1985 to
1990, Using the Variables that Make Up
Each Factor ...
XII A Comparison of High versus Low Performing
Organizations on Wage Reimbursement
Costs .
XIII A Comparison of High versus Low Performing
Organizations on Medical Costs.
vi
PAGE
. 58
. 60
. 61
. 63
. 66
._,
J a ii :I i ,; 'I ~I ft .,
" ii li

INTRODUCTION
Early-return-to-work (ERTW) programs are recognized as
the primary means of controlling workers' compensation costs
once an injury has occurred. Such programs have been shown
to be beneficial to all parties involved - the worker, the
employer, and the insurer. However, because these programs
are relatively new, no research has been done to examine the
relationships of the different components of ERTW programs
on organizational outcomes such as average medical costs and
average cost of wage reimbursement per claim. This thesis
uses exploratory and confirmatory factor analysis and
regression analyses to explore these questions.
BACKGROUND
Workers' compensation legislation was created on a
state-by-state basis between the years 1911 and 1949 to
provide income, medical care, and rehabilitation assistance
without regard to fault to workers who are injured in the
course of performing their jobs. While the need for such
programs is obvious, the form which they should take is
difficult to determine.
After 50 - 80 years of existence, there is little doubt
current systems are experiencing very serious problems
nationwide. Richard Fein, acting president of the National

2 Council of Compensation Insurance, has stated that the
current workers' compensation system will either be replaced
by an improved system or will fall into ruin (Brown, 1990).
William Bolton, CEO of an independent insurance brokerage in
California, believes that in many states, the workers'
compensation system is so ineffective it's actually
detrimental to workers. James Ellenberger, assistant
director of Occupational Safety, Health, and Social Security
for the AFL-CIO takes a slightly more conservative position.
He expresses the opinion that unless substantial
improvements occur shortly, at the very least, a Federal law
mandating minimum standards may be necessary (Sheridan,
1990) •
Employers have begun to recognize that controlling the
cost of their workers' compensation claims is vital to the
financial health of their organizations. In addition, there
is now greater recognition that losing a trained, skilled
employee, even temporarily, creates organizational costs
such as those incurred in training a replacement, lost
productivity, and decreased morale of other employees.
Employees who are injured on the job face a number of
obstacles in using workers' compensation. Financial
compensation for disabling injuries is largely unstan
dardized, often has not kept pace with the rising cost of
living, and in too many cases, is obtained only after long
legal battles. Rehabilitation services are not always
available who could benefit from them and often come too

long after onset of disability to provide optimum outcomes.
Obtaining benefits is usually dependent on an ability to
make one's way through a bureaucratic maze.
systems are inadequate and difficult to use.
In short, the
THE WORKERS' COMPENSATION SYSTEM
3
Workers' Compensation legislation was designed to
provide medical care, rehabilitation, and income assistance
to workers who have been injured on the job or stricken with
an occupationally related disease. Most systems are based
on two types of claims - temporary disability and permanent
disability. Benefits for temporarily disabling injury
claims provide a weekly income based on the amount of wages
earned on the job, as well as medical care and, where
appropriate, rehabilitation assistance. In these cases, it
is expected that the employee will recover and return to
work. Benefits for a permanently disabling injury usually
include medical care and some form of monetary settlement.
In cases where the injury is considered to have caused
permanent total disability, the injured worker is not ever
expected to return to work, but benefits may be provided for
life or for some pre-determined shorter period of time
(based on the type of injury) and depending on the specific
legislation. Injured employees may also be classified as
having a partial permanent disability. In these instances,
the individual is expected to be left with some permanent
loss of functioning, but is still expected to be able to

·-------4
work (although not necessarily in his/her previous
position). Again, income assistance, medical care, and
(sometimes) rehabilitation are provided. In the case of a
job-related fatality, limited assistance with burial costs
is generally provided and dependents of the deceased receive
some form of financial support or settlement.
National statistics support the idea that serious
problems exist within the workers' compensation systems.
For example, in 1989 the combined ratio of payout to premium
was 120.1%, meaning that for every premium dollar collected,
workers compensation insurers paid $1.20 in benefits and
associated costs. Each year, 569,000 new cases enter the
workers' compensation system. Nearly half of those injured
workers will never return to work and another 10% will take
3 years to go back to work (Engle Beam, 1987). These
statistics suggest that the demands on the system will
continue to grow.
Oregon is no exception. The state is burdened with a
workers' compensation system which has resulted in some of
the highest costs in the country (in 1988, Oregon employers
paid the eighth highest workers' compensation premiums in
the nation, according to the Oregon Department of Insurance
and Finance) while doing an ever-poorer job of helping
injured workers return to work (Mapes, 1990) and is now
experiencing "universal criticism" (Mapes, 1990, p. Bl).
Herbert Aschkenasy, board chairman of SAIF Corp., calls
Oregon's workers' compensation system "scandalous" (Mapes,

,...
p. A24) and adds that "It's not only expensive, it's not
even effective." (Mapes, 1990, p. A24). Workers in this
state have the highest rate of total claims in the country
over 15 per 100 workers (Mapes, 1990). Recent statistics
indicate that the number of permanent, partial disability
cases is increasing (these make up a large portion of the
most expensive cases). A record percentage of workers are
saying that their injuries have left them permanently
damaged, and the average amount of time off the job has
increased from just 10 years ago (Mapes, 1990). For
example, in 1988, there were 43,660 claims closed with an
average of 87 lost days per case and an average total cost
5
of $8,371.00 per claim (statistics from Oregon Department of
Insurance and Finance). A comparison of Oregon's Workers'
Compensation System with that of Wisconsin's (which has been
called "the envy of other states" by Sen. Jerome Van
Sistine, chair of the Wisconsin Legislature's Committee on
Labor, Business Insurance, Veterans and Military Affairs,
according to Mapes [1990, p. B4]) gives a clearer picture of
what can be accomplished. In 1988, Oregon's system covered
1,099,900 workers, had 153,137 claims and paid out $578.4
million (Oregon Department of Insurance and Finance, 1990).
On the other hand, in the same year, Wisconsin's system
covered 2,121,104 workers, had 76,917 claims and paid out
$209 million (State of Wisconsin, 1990 as cited by Mapes,
1990). Because of the severe problems being experienced by
the Oregon workers' compensation system, Ex-Governor Neil
! ii i
l I

Goldshmidt convened a committee of labor and business,
hoping that without representatives of the legal, medical,
and insurance communities, some agreement on reforms could
finally be reached.
The effects of an ineffective workers' compensation
system are felt by everyone involved - insurers, employers,
injured workers, and their families.
THE INSURERS
6
Insurers obviously cannot survive indefinitely when
they are experiencing combined ratios at or above 100%. If
this trend continues, the number of firms who are willing
and able to offer workers' compensation insurance will
decline drastically. Some firms may choose to withdraw from
the workers' compensation market and concentrate on other
markets while others that focus soley on offering workers'
compensation insurance may cease to exist altogether.
THE WORKER
Injured employees also suffer when they are unable to
return to work quickly. Many experience financial
difficulty due to loss of income, but other consequences
may be even more harmful. In our society, adults are
defined in large part by the work they do. When injured
employees lose their working identity and are forced to
replace it with some form of a ''disabled person" identity,
they are likely to experience emotional stress. Kelvin

.. 7
(1981) suggests that the loss of the work role that is quite
frequently an integral part of peoples' values, self-image
and life-structure, can be a threat to psychological health.
Furthermore, the label "disabled person" carries with it a
very low status in this society. Hood and Downs (1985)
state that returning disabled persons to activity can
increase both self-esteem and prestige and help to mitigate
the adverse impact of any lasting disability.
Besides the injured worker, the family is also likely
to suffer as a result of prolonged homebound recuperation
periods (or permanent inability to work). The stress
involved in such a major change in lifestyle will likely
affect each member of the family system in some way. For
example, Verslyus (1980) states that even very stable
families may experience distress as a result of disability
related unemployment.
There is also some possibility that an injured employee
may develop some form of "disability dependence". Hood and
Downs (1985) state that the processes for determining
eligibility for disability benefits tends to support
dependence on the system. Walker (1989) reported a small
but consistent number of cases, which he called "perpetual
patients", who are off work for significantly longer periods
of time than others with similar injuries. He attributed
the cause to psychological problems. Taylor (1989), on the
basis of his review of research involving return to work
after back surgery, concluded that among the primary

I
determinants for return in these cases is the ''renewal of
psychological determination to become productive" (p. 85).
He discusses a deconditioning syndrome which results from a
tendency for back-injured workers to be overly cautious
about protecting their backs. Hanson-Mayer (1984) suggests
that psychological factors which contribute to "worker's
disability syndrome" are best dealt with early in the
recovery process. In a sample of 200 English workers'
compensation claimants, Cornes, Bechel, and Aitken (1986)
report that there was some suspicion of psychological
reasons for failure to return to work in 13% of their
sample.
THE EMPLOYER
8
Employers also absorb some of the high cost of the
workers' compensation system. Due to skyrocketing costs,
workers' compensation insurance has recently become a major
part of the cost of doing business. Because an
organization's yearly premiums are computed in part on the
basis of past claims costs, every dollar paid out because of
an injury to one of their employees will cost them money in
the future. By 1987, national workers' compensation costs
had soared to $120 billion (Lucas, 1987), including both
those costs paid by companies, and those paid by the
government. Premiums have been climbing steadily.
According to the U.S. Social Security Administration,
premiums have risen from a total of 22.2 billion dollars in

9
1980 to a total of 34.1 billion dollars in 1986. Despite
skyrocketing increases in premiums, workers' compensation
insurers have been experiencing losses (Brown, 1990).
Because of this trend, insurers have been ever more cautious
about what companies they choose to insure. Mapes (1990)
reported that SAIF was attempting to turn around their
financial situation in part by dropping many of the small
businesses that they previously insured and that many of
those businesses can not afford to obtain workers'
compensation coverage elsewhere. This means that the
availability and cost of workers' compensation insurance is
in some cases making the difference between an ongoing
business and a business that no longer exists.
The current workers' compensation system creates other
problems for employers. When an employee who has the
capacity to return to their previous position does not do
so, the cost of hiring and training a replacement may run
into thousands of dollars. Another less recognized
consequence of unnecessarily losing an employee to an injury
comes in the form of a likely blow to other employees'
morale if they perceive that the organization does not care
about its individual employees. One approach to these
situations involves modifying the position to accommodate
the employee's physical limitations. Another partial
solution is to put disabled employees in other positions
within the company, where they can put knowledge learned in
their previous position to use. This is likely to result in

....
10
some cost saving to the employer, as well as to provide an
employment solution to a partially disabled person who would
likely have difficulty obtaining a new job.
RETURN-TO-WORK
There are a number of reasons for the distressed state
of workers' compensation systems. Engle Beam (1987)
provides a useful discussion of this topic. She reports
that the system often discourages disabled workers from
returning to work. (Livneh [1982] concurs with this
statement, reporting that disabled workers who could return
to work are often prevented or delayed from doing so.) The
percentage of injured workers who will eventually go back to
work is not particularly high. Of the 569,000 workers who
incur some form of disability each year due to a physical
injury while working, almost half will never return to work.
Another 10 percent of those workers will not return to work
for three years. In addition, the current workers'
compensation system frequently requires disabled workers to
prove that they are unable to work, whether they wish to be
employed or not. Employers' attitudes toward disabled
employees have not generally been helpful. Employees who
sense that their employer will not be pleased to have them
back when they are unable to perform their previous duties
fully are less likely to return to work. These factors work
together to encourage the development of a dependency
orientation in the worker. Hanson-Mayer (1984) calls this

':'"
"workers' disability syndrome", and reports that this
psychological state may become the primary obstacle
preventing the worker from returning to work. Once that
orientation has developed, the likelihood that an employee
will return to work is decreased substantially.
11
Research by the state of Oregon supports the importance
of returning to work as soon as possible after the
occurrence of an injury. Findings indicate that after six
months off work, an employee has only a 50% chance of
returning to work while after one year off work, chances of
returning to work drop to less than 10% (Oregon Department
of Insurance and Finance, 1989). In their review of the
return-to-work literature, Hood and Downs (1985) state that
evidence indicates that establishing return to work
objectives as early as possible in injured workers' recovery
processes helps more workers return to work sooner and more
often to their previous jobs.
EARLY-RETURN-TO-WORK (ERTW) PROGRAMS
As organizations have watched the cost of their
worker's compensation insurance rise dramatically, and as
insurers have begun experiencing serious losses, both
parties have begun to search for ways to control these
costs. Two methods have been identified. First, companies
can work to prevent injuries before they occur through
safety/risk management programs. Second, once an injury has
occurred, a company can take a proactive approach to keeping

12
the cost of that specific injury low through ERTW programs.
SAIF (1990) reports that an average of $3500 is saved after
an employee is placed in an ERTW program. The best strategy
for an organization involves implementing both types.
However, ERTW programs and their effects on organizational
outcomes will be the topic of this research project.
ERTW programs involve the use of several strategies to
cut the cost of current injuries (and in the long run, to
lower the cost of worker's compensation premiums). These
are as follows:
1) Stay in contact with injured workers as they
recover to let them know that the company cares about their
progress and wants them back (some care needs to be taken
not to use an adversarial approach)
2) Identify or create light duty jobs so that injured
workers can, with their doctors' approval, return to work in
jobs that fit their current physical capabilities, rather
than waiting until the injured employee is 100% recovered
(which may take much longer, and in the case of permanently
disabling injuries, will never occur)
3) Analyze and record the specific physical demands of
each job in the organization. This information helps the
treating physician make decision about readiness for light
duty work and about when the employee's physical capacity
tolerances will allow them to return to their previous jobs
4) Provide monetary incentives for an injured employee
to return to work early. This strategy suggests that the

~
13
injured employee should be able to earn more than their
workers'compensation payments by working at least part time.
5) In addition, it is believed that such programs
also help to reduce fraudulent claims because the pay-off
for "faking" an injury is removed - the would-be vacationer
is still required to work.
Case studies strongly suggest that these programs are
an effective way to decrease workers'compensation costs.
For example, Burlington Northern developed an aggressive
ERTW program and reported being able to cut the number of
employees who were unable to return to work due to
disability in half over a 21 month period (Lucas, 1987).
Alcoa created a program which involved bringing injured
employees back to work at the point that they are able to do
some job at some level. They report saving more than 20
percent of their expected 1983 workers compensation
premiums (Wardrop, 1984). One unidentified Oregon company
experienced dramatic benefits after instituting an ERTW
program and other loss prevention measures. During the
previous two-year period, they had experienced 35 claims
which generated over 2,400 days of lost time and had a total
claims cost of over $330,000. A year later, they had only
one time loss claim with a total cost of $5,000 (SAIF,
1990). Consolidated Freightways also reported significant
improvements in both the number of time loss injuries and in
the frequency of injuries after beginning their ERTW
program. In 1986, their Illinois plant had 120 injuries, 66

of which resulted in lost time. In 1987, with program
implemented, they had just over 70 injuries with only 44
resulting in lost time. And by August of 1988, they had
experienced approximately 50 injuries with just 21 cases
resulting in time loss.
14
Other researchers have examined the benefits of ERTW
for the involved employees. (See Hood and Downs, 1985 for a
comprehensive review of this literature.) They concluded
that early intervention strategies not only reduce the
cost of disabilities but also have the ability to reduce
both the physical and psychosocial suffering of the injured
worker. SAIF has found that injured workers who return to
work via an ERTW program actually recover from their
injuries more quickly (SAIF, 6/90). This finding is likely
due to the fact that modified work serves as a "work
hardening" process which, when well conceived, may provide
excellent therapy for the injury. This data suggests that
ERTW programs are a win-win solution for dealing with on the
job injuries.
RESEARCH STRUCTURE AND GOALS
Because the concept of ERTW is quite new, little
research has been done on it, either in terms of the
underlying factors involved or in terms of the effects of
various organizational policies and practices on
organizational outcomes (i.e. number of open claims, number
of non-disabling claims, number of reopened claims, and

111-----------------~~
15
average medical and wage replacement cost of claims). This
research examined the underlying structure of ERTW and the
effect of variation in ERTW programs' policies and practices
on those organizational outcomes. To accomplish this,
organizations in the Portland Metropolitan area were
contacted by phone and surveyed regarding their policies and
practices on returning injured employees to work and the
Oregon Bureau of Labor and Industries provided outcome data
for the surveyed organizations.
The goals of this study were as follows:
1) Create a preliminary model describing the structure
of ERTW programs (based on corollary data)
2) Discover which components of ERTW programs make for
effective programs by examining the ability of the presence
or absence of the various components to predict a decrease
in organizational outcome variables over time (when adjusted
for inflation)
3) Examine differences in the components of ERTW
programs between organizations with the best performance in
controlling workers' compensation medical and wage
reimbursement costs over time.
.[
'f
~
~r
l
METHOD
SUBJECTS
Subjects were 202 organizations from Washington,
Multnomah, and Yamhill counties, generally with at least 50
employees (although there were a few exceptions to this).
No attempt was made to draw a representative sample from
across the range of industries, but instead, the
emphasis was on surveying organizations whose employees
experience injuries with at least some regularity. The
only industry which was nearly eliminated based on this
criteria was that of Finance, Insurance, and Real
Estate. This approach was chosen as the research focus
required injury data. Twenty-nine of the organizations
were also surveyed previously during the pre-testing
phase of the questionnaire.
MATERIALS
A list of companies in the Oregon Tri-County area with
over 50 employees was obtained from the Oregon Bureau of
Labor and Industries. The listing contained information on
employer name, address, identification number, and
approximate number of employees, broken down by type of
industry. This list was used to choose those organizations

17
who dealt with workers' compensation that at least
occasionally answered their phone (rather than leaving it
forwarded to voice-mail continuously), they had some history
of on-the-job injuries, and they were willing to participate
in the survey.
In addition, a brief list of companies (approximately
12) with ERTW programs was obtained from SAIF Corp. It was
used to contact a number of companies who are known to have
in place ERTW programs. A few of those companies had
slightly fewer than 50 employees.
The return to work survey used in the study asks 19
questions about the organization's policies and practices
regarding workers who have been injured on the job as well
as 3 questions about organizational characteristics (see
Appendix A). An additional question was included to try to
assess the rate of injury. However, that data was not
analyzed as a large number of organizations were reluctant
to discuss those figures and it was believed that most of
those who were willing to discuss them were not able to
provide accurate data.
The questionnaire was pre-tested on 50 organizations.
Modifications were made based on the results of the pretest
and an interview with a ERTW expert at SAIF Corporation.
The current version of the questionnaire was modified to
to include:
l) a question about the proportion of employees who's
jobs are covered by light duty alternatives when they have

18
been injured,
2) a 1 to 5 scale assessment of the organization's
dedication to the use of ERTW and/or modified or light duty
work,
3) a question regarding whether the employees sign a
form stating that they understand and accept the ERTW policy
and the responsibilities it gives them,
4) a question assessing the amount of training
organizational members have had in the use of ERTW
procedures.
Response results were excellent and showed the survey
to be easily comprehensible to the respondents. Fewer
than 10 organizations declined to participate.
Data on dependent variables was obtained from the State
of Oregon Department of Labor and Industries for 1990
and 1985. Information on the following variables was used:
1) number of non-disabling injuries 2) median medical cost for closed claims 3) median wage reimbursement cost for closed claims 4) number of open claims 5) number of reopened claims
The median was used as an indicator of organizational
outcomes because the data do not produce a normal
distribution, but are subject to extreme outliers, which is
to be expected when some of the financial settlements are
determined by the outcome of court cases and when
settlements for injury types which do not have a pre-
determined settlement amount can vary widely from case to
case. One drawback of these outcome variables is that

each of those that involves looking at the "number of ... "
has a confound with organizational size.
19
Attempts to obtain information on the average number of
days lost per injury, on the number of disabling claims, and
on the medical and wage reimbursement costs of disabling
claims from the organizations themselves resulted in data of
questionnable reliability/validity. For that reason, no
analyses were done on that data.
PROCEDURE
Organizations were surveyed by telephone.
Respondents held a wide variety of positions within
their respective organizations - these positions included
risk analysis, safety specialist, occupational health nurse,
office manager, organizational manager, early-return-to-work
specialist, and the person who dealt with the workers'
compensation paperwork. Dependent variable data from the
Oregon Bureau of Labor and Industries was obtained on each
of the companies who participated in the survey. The two
sets of data were then combined for analysis. The set of
202 cases was randomly divided into two separate files, one
to be used for the exploratory analysis, and one to be used
for the confirmatory analysis. This was done by assigning
all of the even-numbered cases to one file and all of the
odd-numbered cases to another file.

....
RESULTS
DESCRIPTIVE STATISTICS
Descriptive statistics that characterize the sample of
202 organizations are presented below:
1) The mean number of employees in the organizations
surveyed was 879.33 with a standard deviation of 1,662.6.
This variable was not normally distributed; the maximum
number of employees was 10,000 and the minimum was 20. The
median number of employees in the surveyed organizations was
247.5.
2) Twenty-four percent of the organizations reported
being self-insured, 26 percent reported that their workers'
compensation insurer was Liberty, and 17 percent reported
SAIF as their workers compensation insurer. Two percent of
survey respondents did not know who the organization's
workers' compensation insurer was. The remaining 31 percent
of respondents reported being insured by a wide variety of
insurance companies.
3) Forty-seven percent of the organizations reported
having at least some union members. Of those reporting some
union membership, the mean percentage of union employees was
75.2% and the standard deviation was 27.6.
Descriptive statistics for the questions in the survey

21
are presented in Table I. Simple correlations between the
survey variables are presented in Table II (these were used
only for descriptive purposed, not for interpretation).
Both of these tables are based on an N of 172. These data
are from the organizations for which matching variables from
the Oregon records were available.
Descriptive statistics on the data obtained from the
State of Oregon Bureau of Labor and Industries (for 1990)
are as follows:
1) Number of reopened cases had a mean of 0.42 and a
standard deviation of 0.99. The minimum number of reopened
cases was 0 and the maximum was 6. There was very little
variance in this variable - over 75% of the organizations
had no reopened cases.
2) Number of non-disabling claims for 1990 had a mean
of 8.38 and a standard deviation of 15.74. The minimum
number of non-disabling claims was 0 and the maximum was
125.
3) Number of open claims had a mean of 2.22 and a
standard deviation of 4.90. The minimum number of open
claims was 0 and the maximum was 47.
4) Median cost of medical claims had a mean of
$2,014.12 and a standard deviation of $3,199.61. The
minimum was $0 and the maximum was $25,897.
5) Median cost of wage reimbursement payments had a
mean of $1,301.69 and a standard deviation of $2,872.97.
The minimum was $13 and the maximum was $32,292.

22
The simple correlations between the survey questions
and the outcome variables (from the State of Oregon, Bureau
of Labor and Industries) are given in Table III. Three of
the survey questions had significant (positive) correlations
with the number of open claims organizations had. They were
whether the organization had a written return-to-work
policy, whether they tell their new employees about their
ERTW program, and the amount of training people in the
organization had on ERTW programs. The number of non
disabling claims had significant (positive) correlations
with four survey questions. Those variables were whether
the organization had a written return-to-work policy, the
amount of training people in the organization had obtained
on ERTW programs, the percentage of injuries in which ERTW
is used, and the level of dedication to the ERTW program.
The number of reopened claims had three survey variables
that were significantly related - whether the organization
had a written return-to-work program was positively
correlated with it as was the amount of ERTW training.
These correlations were not in the expected direction.
However, offering regular wage to employees on light duty
was negatively correlated with reopen claims.
EXPLORATORY FACTOR ANALYSIS
To begin, the 202 cases were divided into two groups by
putting all cases with even identification numbers in one
file and all cases with odd identification numbers in
another file. All exploratory work was done on one set.
Then the second set of data was used to confirm the final
models found in the exploratory analyses.
23
Because no strong hypotheses about which variables were
related existed, an exploratory factor analysis was done on
the data from the survey to look for underlying common
factors. Table II presents the simple correlations between
the survey questions. Eigenvalues from principal components
factor analysis along with the eigenvalues greater than one
rule-of-thumb suggested keeping eight factors. The scree
plot was inconclusive, suggesting either three, four or five
factors. Research by Tucker, Koopman, and Lynn (1969) using
Monte Carlo simulation suggests that the scree plot
information yields consistently better results than the
eigenvalues greater than one rule. Based on those research
findings and on the inconclusive results of the scree plot
on the number of factors to retain, three different
principal axis factor analyses with Harris Kaiser rotations
were done, retaining three, four, and five factors. These
were then examined for interpretability to determine which
solution should be retained, as suggested by Hakstian,
Rogers, and Catell (1982). The five-factor solution
provided the most meaningful interpretation (Table IV
presents the rotated factor pattern). The five-factor
solution accounted for 47.22 percent of the total variance.
Table V gives the proportion of common variance and the
proportion of total variance explained by each factor.
24
The variables that loaded on Factor one involved the amount
of training members of the organization had received on ERTW
programs, whether or not the organization paid its light
duty employees their regular wage, whether or not the
organization regularly contacted the medical care provider
to discuss the prognossis, and whether or not the organization
worked with the injured employee to help them return to
work. After examining the make-up of all of the other
factors, this factor was interpreted as the non-ERTW
approach to dealing with injured workers. This approach
appears to be more less positively proactive than the ERTW
approach. Factor one is characterized by companies that
train their employees in light duty programs, do not offer
regular wage, call the medical provider, and work with the
injured employee to get him/her back to work. Also
important are the variables that do not load on this factor.
Percent of cases in which light duty is used, written
descriptions of physical load for various positions, level
of dedication to ERTW, having the employee call the
organization while off work, and telling current employees
about their ERTW are all examples of variables with near
zero loadings. These are all action components of an ERTW
program, whereas the variables that do load on this factor
are passive components which do not by themselves constitute
an ERTW program.
Factor two characterizes organizations that have an
ERTW program in which the employee's supervisor is involved

~
25
in the decision-making process and who make the employees'
supervisor responsible for assuring that the employee does
not exceed the physical limitations prescribed by the
physician. This factor was interpreted as organizations'
perceptions of ERTW programs. When organizations say they
have an ERTW program, they also frequently report involving
supervisors in decision making and making them responsible
for assuring that the injured employee does not exceed the
physician's prescribed physical limitations. Other
variables that had loadings above 0.35 on this factor were
the amount of training people in the organization had
received on ERTW, whether the organization used regular
wage, and the extent to which the organization had written
descriptions of the physical demands of each position.
However, each of these variables loaded more highly on some
other factor. This suggests that while these three
variables play some role in organizations' perceptions of
ERTW programs, these variables are more strongly associated
with some other factor.
Organizations that score high on factor three did not
prefer to wait until the employee was completely recovered
before returning them to work, use light duty, and tend to
use light duty in a high percentage of injury cases, require
the injured employee to call them regularly while off work,
and tend to have a high level of dedication to the ERTW
program. (Level of dedication to the ERTW program was
assessed by the survey respondent on a scale of 1 to 5,
where 5 indicated ''extremely dedicated".) This factor was
interpreted as the extent of implementation of the ERTW
program.
factor.
It accounted for more variance than any other
26
Factor four is characterized by organizations who tell
their new employees about the existence of their ERTW
program, who make current employees aware of their program
before they experience an on-the-job injury, who require
their employees to sign a form stating that they agree to
abide by the ERTW program, and who had positive
relationships with the medical providers caring for their
injured employees. This factor was interpreted as
organizational communication regarding ERTW.
Factor five involved organizations with written
policies for returning their injured employees to work, with
written ERTW programs, and with detailed written
descriptions of the physical demands of their positions.
This factor was interpreted as the written formalization for
dealing with injured workers, which can exist whether or not
an organization has chosen an ERTW approach.
Inter-factor correlations were high (see Table VI),
ranging from 0.28 to 0.66. This confirms that the decision
to use a rotation that allows the factors to be highly
correlated was appropriate. Further examination of the
inter-factor correlations supports the interpretations of
the factors. The strongest relationship between factors
involves the organizations' perception of ERTW programs
... .
&#iJ

27
(Factor 2) and the extent of ERTW program (Factor 3). There
is also a strong relationship between communication of the
ERTW program (Factor 4) and the extent of written
formalization of programs (Factor 5). The relationships
between the extent of ERTW program (Factor 3) and
communication (Factor 4) and the extent of written
formalization (Factor 5) are moderate, as would be expected
(because the breakdown of the factors suggests that an
organization can have an extensive ERTW program, but still
have relatively low levels of communication and written
formaliztion for it and because organizations who do not use
the ERTW approach can still choose to have written
formalization of their program). The relationship between
non-ERTW approach (Factor 1) and the extent of program
(Factor 3) is only moderate, suggesting that these two
factors may represent alternative ways of dealing with
injured employees, where Factor 1 is made up of those
organizations who do not embrace the ERTW approach (who use
ERTW rather superficially) and Factor 3 is made up of those
organizations who do embrace the ERTW approach. The
moderate relationship likely arises from those that are
ambivalent about the approach and those who are in the
process of moving from one paradigm to the other (based on
information obtained during the survey process, it seems
that an ERTW program is not something an organization either
has or does not have, but instead is something that evolves
over time) •
... ______________ ~.~!!!'!'!·~Ill!!!.~ .• ·""~· ...... ~- ....... ,~~
l
J' )
ii

28
CONFIRMATORY FACTOR ANALYSIS PROCESS/INDICES
To further examine the underlying (latent) variables
from the ERTW survey, additional work was done using
confirmatory factor analysis. This process involves an
examination of how well the hypothesized relationships
between the latent and measured variables fit the data. To
do this, the model is tested by examining the measures of
fit. Then non-significant paths are deleted and significant
paths not formerly in the model are added (within
theoretical constraints).
There are two types of measures of fit which are used
to examine how well the data fit the model in covariance
structure modeling. The "overall" measures of fit give the
researcher an idea of how well the entire model fits the
data. They are described below, along with the commonly
accepted level, although the acceptable levels can change
somewhat from discipline to discipline (Bollen, 1989):
1) X - a test of the null hypothesis that the model
fits the data. It is desirable to minimize X as part of
the fitting process. However, because it is extremely
sensitive to sample size, it is highly likely that this
measure of fit will tell the researcher to reject the null
hypothesis. One rough indicator can be obtained by dividing
the chi-square statistic by the degrees of freedom. A
ratio of three to one or less is desirable.
2) Goodness of Fit Index (GFI) - examines the
29
difference between the predicted and observed data matrices.
It varies between 0 and 1, with fit improving as a value of
1 is approached. Values above .85 are acceptable fit of the
data to the model. This indicator of fit cannot be compared
from one model to another because it is affected by the
degrees of freedom (which vary from one model to another).
3) Adjusted Goodness of Fit Index (AGFI) - The AGFI
is adjusted for the degrees of freedom in the model. Again,
it varies from 0 to 1, where a higher number indicates
better fit. Values above .80 are considered good fit of the
model to the data. This indicator can be used to compare
results across models.
4) Root Mean Square Residual (RMSR) - The RMSR is
the average difference of the observed data matrix and the
corresponding predicted matrix. It can easily be
interpreted in terms of correlation matrices, where it is
the average residual between the predicted and observed
correlations. In this case, RMSR varies from 0 to 1, and
residuals of less than 0.10 are considered acceptable.
The second type of fit measures are detailed measures
of fit which allow the researcher to examine the fit of a
specific part of the model to the data. They are as
follows:
l) Modification Indices - These indices describe how
much the fit of the model would improved by adding a
directional or correlational path in the model. The size is
i interpreted according to the size of the overall chi square
L

30
statistic - if that path were added, the chi square would
drop by the amount of the modification index).
2) t-values - One t-value is computed for each "free
parameter" (or path) specified in the model. These test the ~
null hypothesis that the free parameter is not significantly
different from zero. T-values greater than two signify a
significant path in the model.
CONFIRMATORY FACTOR ANALYSIS WITHOUT STATE VARIABLES
Since the initial goal of the study was to develop a
structural model of ERTW components and their effectiveness, I
when the confirmatory factor analysis was conducted, two "I
additional factors were created. The first five factors
were those revealed in the exploratory factor analysis.
However, survey respondents' responses to the question about
whether the organization had an ERTW program was pulled from
Factor two to create a sixth single-indicator Factor. It
was believed that this variable should be predictive of the
organizations' policies and practices relating to injured
workers, rather than a component of the program. Regular
wage was pulled from Factor one to create the seventh
single-indicator Factor. It was expected that this
financial variable may relate differently to the dollar
outcome variables than the rest of Factor 1.
The LISREL statistical package was used to do the
confirmatory factor analysis. The analysis of the seven
factor model (with just the data from the survey variables)

31
confirmed on the hold-out sample. Measures of fit were as
follows:
1) x (122) = 245.55 ' p. = 0.000. 2) Goodness of Fit Index = 0.808 3) Adjusted Goodness of Fit= 0.731 4) Root Mean Square Residual= 0.166 5) Maximum Modification Index = 32.89 6) Several t-values were not significant.
The t-value for the loading of relationship with
doctors on the communication factor was 1.882. This is not
surprising, as data on this variable was available for only
a few organizations. The t-value for the relationship
between the light duty variable and the extent of
implementation of ERTW factor was 1.386 and the t-value for
the relationship between the variable which involved having
the off-work employee call the company and the extent of
implementation factor was 1.048. The measures of fit are
just short of what is generally considered acceptable fit of
the model to the data. Examination of the modification
indices did not suggest any logical modifications for the
model.
CONFIRMATORY FACTOR ANALYSIS WITH STATE VARIABLES
Using the initial sample, a second confirmatory factor
analysis was conducted for a nine factor model. It included
the seven previous factors plus two factors dealing with the
outcome measures from the state data. A dollars factor with
median medical costs and median wage reirnbursernernt costs as
indicators was hypothesized for the first outcome. The
32
second outcome factor was hypothesized as a people
statistics factor with the variables relating to the number
of reopened workers' compensation cases, the number of non-
disabling claims, and the number of open cases, as
indicators.
The fit indices for the nine-factor measurement model
on the original sample were as follows:
l) x (227) = 273.79 (p = 0.018) 2) Goodness of fit index = 0.833 3) Adjusted goodness of fit index is 0.779 4) Root mean square residual is 0.081
The largest modification index was 9.69 and all t-
values were significant. While the overall fit of the model
is not quite as good as desired, the detailed measures of
fit do not suggest any changes that could be made to
substantially improve the fit of the model (that is, all
variables are loading highly on their respective
factors). These indices may be elevated because the
first five factors were identified using this sample.
This nine-factor model was then confirmed on the
holdout sample to examine stability. The results were as
follows:
1) x (227) = 333.7 (p. = 0.000) 2) Goodness of Fit Index= 0.804 3) Adjusted Goodness of Fit Index= 0.740 4) Root Mean Square Residual = 0.098 5) The largest modification index was 22.78. 6) All t-values were significant except that for
the relationship between the relationship with doctors
variable and the communication factor. Again, this is not
surprising because of the small amount of data available

for this variable.
An attempt was also made to find a structural
model (which would identify the relationships between
the constructs) to fit the data. However, because it
did not work out well (quite possibly for reasons
discussed later in the paper), those efforts are not
detailed herein.
MULTIPLE REGRESSION
33
One of the major questions associated with ERTW
programs is whether such programs actually reduce
organizations' workers'compensation costs over time. To
begin to answer this question, regression analysis was done
on 176 organizations for which both 1985 and 1990 data was
available. The goal of this analysis was to examine the
extent to which the variation in organizations' programs and
policies can predict:
1) A decrease in median medical costs per injury
between 1985 and 1990 (when adjusted for inflation) and
2) A decrease in median wage reimbursement payments
between 1985 and 1990 (when adjusted for inflation).
Therefore, the regression equations were designed to
try to predict the following:
1990$ - 1985$ + cumulative inflation adjustments.
To estimate the inflation adjustment, the following
sources were used:

l) To estimate the rate of inflation in medical
costs, the annual percent of change in total medical care
services from the Consumer Price Index (1992) was used.
Their data was taken from U.S. Bureau of Labor Statistics,
1991 and unpublished data. The resulting cumulative
adjustment for the five year period between 1985 and 1990
was 43.28 percent.
34
2) To estimate the rate of inflation in wages two
sources were used. For the years of 1985 to 1989, the U.S.
Department of Labor, Bureau of Labor and Statistics (1991)
was consulted. This source breaks down the percent change
in average annual pay by state, so data for the state of
Oregon was used. The resulting cumulative inflation for the
four year period was 13.9 percent. Because this source did
not yet have data available for 1990, another source had to
be used to estimate the inflationary change in wages for
that year. The U.S. Department of Commerce, Economics and
Statistics Administration, Bureau of Economic Analysis
(1991) was consulted. This source did not offer precisely
equivalent data. What it did offer was a graph depicting
the percent change in private sector wages for 1989-1990.
The graph depicts approximately a 4.4 percent change for
that time period. Combining this figure with that cited
previously brings the total adjustment for wages for the
five year period to 18.3 percent.
Descriptive statistics for the newly created variables
were as follows:
fl j
35
1) Change in median medical costs (adjusted for
inflation) had a mean increase of $1,454.75 and a standard
deviation of $3,346.63. The minimum adjusted change in
median medical costs from 1985 to 1990 was a decrease of
$11,196 and the maximum was an increase of $25,578.
2) Change in median wage reimbursement costs (adjusted
for inflation) had a mean increase of $388.41 and a standard
deviation of $3,486.50. The minimum change in the adjusted
median medical costs from 1985 to 1990 was a decrease of
$21,135 and the maximum was an increase of $31,317.
3) The correlation between these above two variables
was 0.734 (p. = 0.0001).
The simple correlations between the survey questions
and the change in median medical costs and the change in
median wage reimbursement costs are reported in Table VII.
Only three variables were significantly related to change in
median wage reimbursement costs over time. These
correlations suggest that organizations with ERTW programs
lowered their wage reimbursement costs, organizations that
preferred to wait until the injured employee was fully
recovered before returning him/her to work had higher wage
reimbursement costs and that higher levels of dedication to
ERTW resulted in lower wage reimbursement costs.
Six variables were significantly related to change in
the median medical costs of workers' compensation claims
(see Table VII). These included the three variables that
were significantly related to wage reimbursement costs -
·------

,.\I
36
whether the organization had an ERTW program, whether the
organization preferred to wait until the injured employee
was fully recovered to return them to work, and the level of
dedication to the ERTW program which were related to medical
costs in the same manner they were related to wage
reimbursement costs. In addition, increasing supervisory
involvement in ERTW decision for their supervisees, making
the injured employee's supervisor responsible for assuring
that s/he does not exceed the physicians prescribed
limitations, and using an injured employees' regular wage
when they are working in a light-duty position were all
strategies which were associated with lower medical costs.
(All three of these variables had negative correlations with
the change in median medical costs).
The results of the regression to predict the change in
workers' compensation medical costs revealed that all of the
program variables together could significantly predict a
substantial amount of the variance - R = 0.296, p. = 0.003
and adjusted R = 0.172. (See Table VIII for information on
each variable). Three of the variables had regression
coefficients which were significant, meaning that their
unique contribution to predicting the outcome was
significant. Those variables were whether or not the
organization used regular wage for employees on light duty
(p. = 0.008), extent to which the physical load of positions
was written in detail (p. = 0.036) and the level of
dedication the survey respondent perceived others in the

37
organization to have to the light duty program (p. = 0.009).
All three were related to a better change medical costs over
time.
Also examined were the ability of the variables
comprising each factor to predict the change in medical
costs over time (adjusted for inflation). Seperate analyses
{as opposed to hierarchical) were done, as the researcher
was interested in the individual ability of each factor to
account for the variance in change over time. Significant
results were obtained for the following factors:
l) Extent of program (R = 0.089, p. = 0.018) in
which the percent of cases in which light duty is used and
the level of dedication to ERTW both had significant
regression coefficients
2) Whether or not regular wage is offered (R =
0.033, p. = 0.027) which has regular wage while on light
duty as its single indicator
3) Organizations' perceptions of ERTW (R = 0.047, p.
= 0.026) in which neither variable (level of supervisor's
involvement in decision-making and making someone
responsible for assuring that the injured employee does not ·
exceed the doctor's prescribed physical limitations) was in
itself significant, but the overall factor is. Apparently,
neither variable contributes enough unique ability to
predict change significantly, but their joint effect was •
See Table IX for detailed results of these regression
analyses.

38
The results of the regression to try to predict change
in workers' compensation wage reimbursement costs revealed
that all of the program variables together could
significantly predict a portion of the variance in that
variable - R = 0.243, p. = 032 and adjusted R =
0.110. See Table X for information on 39 each of the
variables. The variables that contributed significantly
to the model were wether or not the organization had a
written return-to-work policy (p. = 049) and whether or
not regular wage was given to employees on light duty
(p. = 0.003). Having a written policy and using regular
wage were both related to better performance on change
in wage reimbursement costs over time. None of the
factors could significantly predict the change in wage
reimbursement costs from 1985 to 1990. The only
variable that had a t-value of significance involved the
extent to which the organization had written
descriptions of the physical load demands in their
various positions.
A COMPARISON OF HIGH VERSUS LOW PERFORMING ORGANIZATIONS (IN TERMS OF WORKERS' COMPENSATION COSTS)
To further examine those features of return-to-work
programs and policies that affect workers' compensation
costs, the organizations that fell into the top and bottom
quartiles for medical costs and for wage reimbursement costs
were separated out for comparison of the features of their

39
programs.
The range of the 41 organizations with the worst
performance on the change in median wage reimbursement costs
(median 1990 wage reimbursement costs - median 1985 wage
reimbursement costs + cumulative inflation adjustment) was
from an increase of $25,567.67 to $1,627.97. Of the 41
organizations with the best performance on the change in
median wage reimbursement costs, the range was from an
increase of $330 to a decrease of $11,195.60. Based on the
binomial test (which examines a single groups' tendency to
do one thing over another, not the differences between the
best and worst performing groups) at the 0.05 level of
significance, a comparison of the components of ERTW
programs for the firms in the upper quartile and the same
comparison for firms in the lower quartiles revealed some
interesting differences between them (see Table XII):
1) While both the best and worst performing
organizations were significantly more likely to report that
they had an ERTW program than they were to report that they
did not have such a program, organizations with the best
performance records on the change in median wage
reimbursement costs were also significantly more likely to
report that they used light duty in 75-100% of the eligible
cases of injury and that their organization was "extremely
dedicated" to the use of ERTW. No trend was found for the
worst performers.
2) Poor performers on the change in median wage

40
reimbursement costs were significantly less likely to have a
written ERTW program than they were to not have a written
program. They were also somewhat less likely to tell new
employees about their ERTW program (significant at the 0.10
level of probability). The best performers did not show
significant trends in any direction on either of these
variables.
3) Both the best and the worst performers had
significant tendencies to usually or always involve the
injured employee's supervisor in decisionmaking about ERTW
and to have someone (almost always the supervisor) be
responsible for making sure that the injured employee did
not exceed his/her doctor's prescribed physical limitations.
4) Organizations with the best performance on the
change in median wage reimbursement costs were significantly
more likely to use the employees regular wage for
light/modified duty than to use some other (lower) wage.
Organizations with the worst performance did not exhibit a
significant trend in either direction. In addition, there
were a number of variables on which there were significant
trends in the same direction for both the best and the worst
performing organizations. This includes the following:
both types of organizations were more likely to report
having an ERTW program than they were to report not having
one and to prefer to bring the injured employee back before
they are fully recovered, both types of organizations were
more likely to involve the supervisors than to not involve

41
them, and both types were likely to make the supervisors
responsible for assuring that the injured employee on light
duty followed the doctor's prescribed physical limitations.
Both the best and worst performing organizations were more
likely to have the employee call them while out on injury
than to not require such communication, were more likely to
call the doctors than to not call them, and were more likely
to work with the injured worker than to not work with them.
None of the chi-square tests for differences between
the best and worst performing organizations were significant
at the 0.01 level (none even made significance at the 0.05
level). This finding is consistent with the failure of any
of the regressions to be able to predict this variable. It
is not surprising that the chi-square tests are not
significant. It is not necessarily expected that the best
and worst performers do opposite things. It may be that the
best performers are consistent while the worst performers
are variable or that the best performers are flexible while
the worst performers are more rigid.
Of the 41 organizations with the worst performance on
the change in median medical costs (median 1990 medical
costs - median 1985 medical costs + cumulative inflation
adjustment), the scores ranged from an increase of
$31,317.32 to $789.70. Of the 41 organizations with the
best performance on the change in median medical costs, the
scores ranged from an increase of $161.56 to a decrease of
$12,1135.50. Based on the binomial test at the 0.05 level
42
of significance (again, this test examines a single groups
tendency to choose one approach over another, not the
difference between the best and worst performing
organizations' approaches), a comparison of the components
of ERTW programs for the firms in the upper and the same
comparison for the firms in the lower quartiles revealed
some interesting differences between them (see Table XIII):
l) While both the best and worst performing
organizations were significantly more likely to report that
they had an ERTW program than they were to report that they
did not have such a program, organizations with the best
performance records on the change in median wage
reimbursement costs were also significantly more likely to
report that they used light duty in 50% or more of the
eligible cases of injury while those organizations in the
worst performing group did not show this trend. The best
performing organizations were also significantly more likely
to report that their organizations had a dedication level to
ERTW of 4 or 5 (where 5 ="extremely dedicated), whereas the
worst performing organizations showed this tendency only at
the 0.10 level of significance.
2) Poor performers on the change in median medical
costs variable were somewhat more likely to not tell new
employees about their ERTW programs (significant at the 0.10
level of probability) than they were to tell them. Good
performers did not have a significant trend in either
direction on this variable.
43
3) Both the best and the worst performers had
significant tendencies to usually or always involve the
injured employee's supervisory in decision-making about ERTW
and to have someone (almost always the supervisor) be
responsible for making sure that the injured employee did
not exceed his/her doctor's prescribed physical limitations.
4) Organizations with the best performance on the
change in median wage reimbursement costs were significantly
more likely to use the employees regular wage for
light/modified duty than to use some other (lower) wage.
Organizations with the worst performance did not exhibit a
significant trend in either direction. Again, there were a
number of variables for which both the best and worst
performing organizations had significant trends in the same
direction. As with the best and worst performers on the
wage reimbursement variable, like trends included being more
likely to have an ERTW program than to not have one, a
preference for bringing injured employees back to work
before they are fully recovered, a preference for involving
supervisors in decision making, and for making supervisors
responsible for assuring that the injured employee does not
exceed the doctors' prescribed physical limitations. As is
the case with the wage reimbusement variable, like trends
were also shown for asking the injured employee to call the
organization while off work, working with the injured worker
more often than not, preferring to call the doctors, and
preferring to work with the injured worker. None of the

44
chi-square tests for differences between the best and worst
performing organizations were significant at the 0.01 level.
Only organizations' reports of their relationships with
doctors was significant at the 0.05 level, with the best
performing organizations reporting both more incidences of
good and bad relationships with doctors. This suggests that
the best performing organizations are more aware of their
relationships with the medical community and of the
importance of those relationships.
Interestingly, while there were 41 organizations in
each quartile, only 19 of those were in the best-performing
quartile for change in median medical costs and median wage
reimbursement costs and only 21 were in the bottom quartile
for change in median medical costs and median wage
reimbursement costs. This finding suggests that there may
be separate steps that can be taken to improve
organizational performance on these two cost factors for
workers' compensation, although the comparison findings
discussed previously did not show great differences between
the change in wage reimbursement costs and the change in
medical costs.
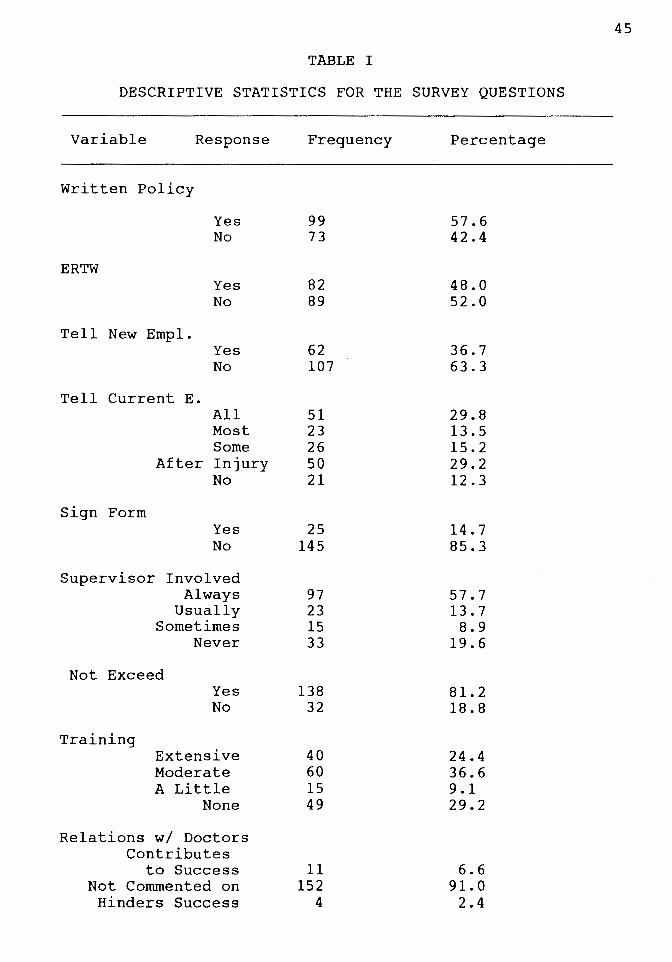
TABLE I
DESCRIPTIVE STATISTICS FOR THE SURVEY QUESTIONS
Variable Response
Written Policy
ERTW
Yes No
Yes No
Tell New Empl. Yes No
Tell Current E.
Sign Form
All Most Some
After Injury No
Yes No
Supervisor Involved Always
Usually Sometimes
Never
Not Exceed
Training
Yes No
Extensive Moderate A Little
None
Relations w/ Doctors Contributes
to Success Not Commented on
Hinders Success
Frequency
99 73
82 89
62 107
51 23 26 50 21
25 145
97 23 15 33
138 32
40 60 15 49
11 152
4
Percentage
57.6 42.4
48.0 52.0
36.7 63.3
29.8 13.5 15.2 29.2 12.3
14.7 85.3
57.7 13.7 8.9
19.6
81. 2 18.8
24.4 36.6 9.1 29.2
6.6 91.0 2.4
45
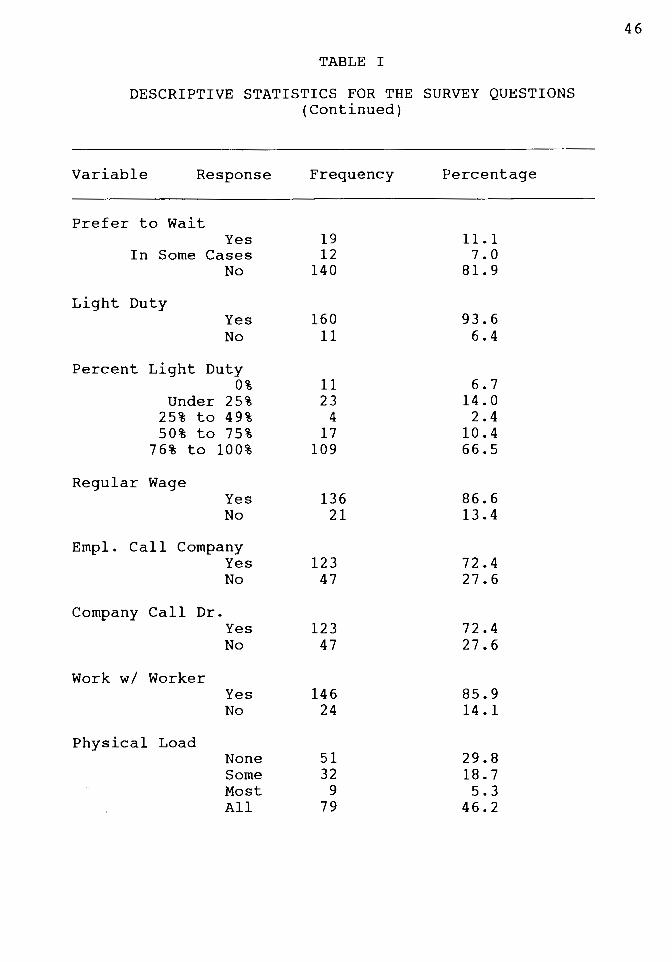
TABLE I
DESCRIPTIVE STATISTICS FOR THE SURVEY QUESTIONS (Continued)
Variable Response Frequency Percentage
Prefer to Wait Yes 19 11. 1
In Some Cases 12 7.0 No 140 81. 9
Light Duty Yes 160 93.6 No 11 6.4
Percent Light Duty 0% 11 6.7
Under 25% 23 14.0 25% to 49% 4 2.4 50% to 75% 17 10.4
76% to 100% 109 66.5
Regular Wage Yes 136 86.6 No 21 13.4
Empl. Call Company Yes 123 72.4 No 47 27.6
Company Call Dr. Yes 123 72.4 No 47 27.6
Work w/ Worker Yes 146 85.9 No 24 14.1
Physical Load None 51 29.8 Some 32 18.7 Most 9 5.3 All 79 46.2
46

TABLE I
DESCRIPTIVE STATISTICS FOR THE SURVEY QUESTIONS (Continued)
Variable Response Frequency Percentage
Dedication 0 14 8.2 1 2 1. 2 2 3 1. 8 3 16 9.4 4 29 17.0 5 107 62.6
(where 5 = extremely dedicated)
47
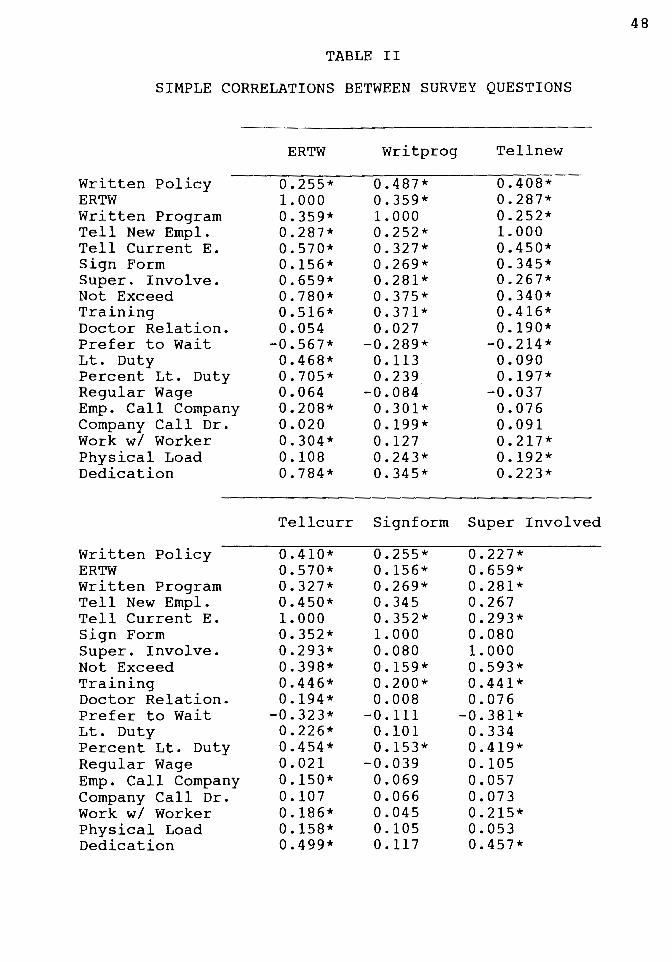
TABLE II
SIMPLE CORRELATIONS BETWEEN SURVEY QUESTIONS
Written Policy ERTW Written Program Tell New Empl. Tell Current E. Sign Form Super. Involve. Not Exceed Training Doctor Relation. Prefer to Wait Lt. Duty Percent Lt. Duty Regular Wage Emp. Call Company Company Call Dr. Work w/ Worker Physical Load Dedication
Written Policy ERTW Written Program Tell New Empl. Tell Current E. Sign Form Super. Involve. Not Exceed Training Doctor Relation. Prefer to Wait Lt. Duty Percent Lt. Duty Regular Wage Emp. Call Company Company Call Dr. Work w/ Worker Physical Load Dedication
ERTW
0.255* 1. 000 0.359* 0.287* 0.570* 0.156* 0.659* 0.780* 0.516* 0.054
-0.567* 0.468* 0.705* 0.064 0.208* 0.020 0.304* 0.108 0.784*
Writprog
0.487* 0.359* 1. 000 0.252* 0.327* 0.269* 0.281* 0.375* 0.371* 0.027
-0.289* 0.113 0.239
-0.084 0.301* 0.199* 0.127 0.243* 0.345*
Tell new
0.408* 0.287* 0.252* 1. 000 0.450* 0.345* 0.267* 0.340* 0.416* 0.190*
-0.214* 0.090 0.197*
-0.037 0.076 0.091 0.217* 0.192* 0.223*
Tellcurr Signform Super Involved
0.410* 0.570* 0.327* 0.450* 1.000 0.352* 0.293* 0.398* 0.446* 0.194*
-0.323* 0.226* 0.454* 0.021 0.150* 0.107 0.186* 0.158* 0.499*
0.255* 0.156* 0.269* 0.345 0.352* 1. 000 0.080 0.159* 0.200* 0.008
-0.111 0.101 0.153*
-0.039 0.069 0.066 0.045 0.105 0.117
0.227* 0.659* 0.281* 0.267 0.293* 0.080 1. 000 0.593* 0.441* 0.076
-0.381* 0.334 0.419* 0.105 0.057 0.073 0.215* 0.053 0.457*
48

TABLE II
SIMPLE CORRELATIONS BETWEEN SURVEY QUESTIONS (Continued)
Not Exceed
Training Dr.
Written Policy ERTW Written Program Tell New Empl. Tell Current E. Sign Form Super. Involve. Not Exceed Training Doctor Relation Prefer to Wait Lt. Duty % Lt. Duty Regular Wage Emp. Call Company Company Call Dr. Work w/ Worker Physical Load Dedication
0.263* 0.780* 0.375* 0.340* 0.398* 0.159* 0.593* 1. 000 0.386* 0.068
-0.477* 0.374* 0.487* 0.073 0.152* 0.118 0.299* 0.103 0.656*
Pref er To Wait
Written Policy -0.126 ERTW -0.567* Written Program -0.289* Tell New Empl. -0.214* Tell Current E. -0.323* Sign Form -0.111 Super. Involve. -0.381* Not Exceed -0.477* Training -0.338*
0.297* 0.516* 0.371* 0.416* 0.446* 0.200* 0.441* 0.386* 1.000 0.091
-0.338* 0.251* 0.439*
-0.097 0.047 0.278* 0.301 0.124 0.419*
Lt. Duty
0.001 0.468* 0.113 0.090 0.226* 0.001 0.334* 0.374* 0.251* 0.017
%Lt. Duty
0.189* 0.705* 0.239* 0.197* 0.454* 0.153* 0.419* 0.487* 0.439* 0.074 Doctor Relation -0.095
Prefer to Wait 1.000 Lt. Duty -0.204* % Lt. Duty -0.531* Regular Wage 0.034 Emp. Call Co. -0.162* Company Call Dr.-0.146 Work w/ Worker -0.035 Physical Load -0.057 Dedication -0.595*
-0.204* 1. 000 0.281* 0.018 0.266* 0.193* 0.279* 0.256* 0.499*
-0.532* 0.281* 1.000 0.071 0.189* 0.236* 0.174* 0.051 0.726*
Relations
0.082 0.054 0.027 0.190* 0.194* 0.008 0.080 0.068 0.091 1. 000
-0.095 0.017 0.074 0. 121
-0.002 0.123 0.049 0.063 0.069
Reg. Wage
-0.026 0.064
-0.083 -0.037
0.021 -0.039
0.105 0.073*
Emp. Call Co.
0.090 0.208* 0.301* 0.076 0.150* 0.070 0.057 0.152* 0.047 -0.097
0.121 0.034 0.018 0.071 1.000
-0.002
-0.056 -0.008
0.036 -0.147
0.027
-0.162* 0.266* 0.189*
-0.056 1. 000 0.115 0.079 0.169* 0.230*
49

TABLE II
SIMPLE CORRELATIONS BETWEEN SURVEY QUESTIONS (Continued)
Co. Work w/ Call Dr. Worker
Written Policy 0.020 ERTW 0.200* Written Program 0.091 Tell New Empl. 0.181* Tell Current E. 0.107 Sign Form 0.066 Super. Involve. 0.073 Not Exceed 0.118* Training 0.278* Doctor Relation. 0.124 Prefer to Wait -0.145 Lt. Duty 0.193* Percent Lt. Duty 0.236* Regular Wage -0.008 Emp. Call Company 0.115 Company Call Dr. 1.000 Work w/ Worker 0.300* Physical Load 0.170* Dedication 0.243*
0.172* 0.304* 0.127 0.217* 0.186* 0.045 0.215* 0.299* 0.301* 0.049
-0.035 0.279* 0.174* 0.036 0.079 0.296* 1.000 0.263* 0.292*
Physical Load
0.324* 0.108 0.243* 0.192* 0.158* 0.105 0.053 0.103 0.124 0.063
-0.057 0.256* 0.051
-0.147 0.169* 0.170* 0.263* 1.000 0.128
Note: * - r is significant at the 0.05 level.
Dedication
0.190* 0.784* 0.345* 0.223* 0.500* 0.117 0.457* 0.656* 0.419* 0.068
-0.595* 0.499* 0.726* 0.027 0.230* 0.243* 0.292* 0.128 1. 000
** - organizations w/o ERTW were not asked about their level of dedication to ERTW program.
50

TABLE III
SIMPLE CORRELATIONS BETWEEN THE SURVEY QUESTIONS AND THE ORGANIZATIONAL OUTCOME VARIABLES
Survey Open Non-Disabling Reopen Question Claims Claims Claims
-Written Policy 0.179* 0.205* 0.118 ERTW 0.091 0.117 0.098 Written Program 0.115 0.101 0.151* Tell New Empl. 0.152* 0.104 0.121 Tell Current E. 0.042 0.046 -0.065 Sign Form -0.092 -0.080 -0.104 Super. Involve. 0.097 0.062 0.052 Not Exceed 0.105 0.100 0.077 Training 0.165* 0.177* 0.191* Dr. Relations 0.054 0.033 0.022 Prefer to Wait -0.086 -0.121 -0.129 Lt. Duty 0.050 0.052 0.083 % Lt. Duty 0.136 0.179* 0.087 Regular Wage -0.095 -0.059 -0.178* Call Company -0.076 -0.067 0.006 Company Call 0.097 0.131 0.085 Work w/ Worker 0.108 0.084 0.112 Physical Load 0.138 0.139 0.072 Dedication 0.113 0.148* 0.056
Note: * - r is significant at the 0.05 level.
51

52
TABLE IV
ROTATED FACTOR PATTERN FOR FIVE-FACTOR SOLUTION
Variable
Written Policy ERTW Written Program Tell New Empl. Tell Current E. Sign Form Super. Involve. Not Exceed Training Doctor Relation. Pref er to Wait Lt. Duty Percent Lt. Duty Regular Wage Emp. Call Company Company Call Dr. Work w/ Worker Physical Load Dedication
Non-ERTW Approach
-0.131 -0.080
0.133 0.088
-0.004 -0.082
0.156 -0.157
0.539* 0.023
-0.032 0.105 0.017
-0.393* -0.029
0.579* 0.419* 0.048
-0.048
Orgs' Perception
of ERTW
0.138 0.644*
-0.022 0.045 0.055
-0.281 0.867* 0.674* 0.363
-0.143 -0.122 -0.145
0.183 0.358
-0.247 -0.164
0.197 0.403 0.055
Extent of Implementation
-0.163 0.347 0.067
-0.084 0.204 0.100
-0.131 0.220
-0.215 0.033
-0.571* 0.781* 0.684*
-0.040 0.494* 0.205
-0.033 0.216 0.927*
Communica -ti on
0.095 0.072
-0.123 0.768* 0.485* 0.498*
-0.100 0.046 0.092 0.474*
-0.041 -0.089 -0.057
0.195 -0.226
0.119 -0.037
0.009 0.078
NOTE: * - These variables were considered to load on that factor for the purposes of interpretation.

TABLE IV
ROTATED FACTOR PATTERN FOR FIVE-FACTOR SOLUTION (Continued)
Variables
Written Policy ERTW Written Program Tell New Employ. Tell Current E. Sign Form Super. Involve. Not Exceed Training Doctor Relation. Prefer to Wait Lt. Duty Percent Lt. Duty Regular Wage Call Company Company Call Work w/ Worker Physical Load Dedication
Extent of Communica
tion
0.749* 0.053 0.685*
-0.053 0.199 0.260 0.054 0.045 0.257
-0.191 -0.041 -0.094
0.039 -0.236
0.174 -0.257 -0.125
0.414* -0.073
NOTE: * - These variables were considered to load on that factor for the purposes of interpretation, with the exception of ERTW, which was made into its own factor.
53

TABLE V
STATISTICS FOR ROTATED FACTOR PATTERN FOR FIVE-FACTOR SOLUTION
Fl F2 F3 F4
Eigenvalues 5.601 1. 516 0.946 0.733
Variance Accounted for:
Common
Total
0.241 0.464 0.491 0.310
(variance explained by each ignoring others/final communality estimate)
0. 114 0.219 0.232 0.146
F5
0.639
0.324
0.153
(variance explained by each ignoring other/# variables)
54

Fl
F2
F3
F4
F5
TABLE VI
INTER-FACTOR CORRELATIONS FOR THE ROTATED SOLUTION
Fl
1.00
0.35
0.46
0.35
0.28
F2
1. 00
0.67
0.43
0.45
F3
1.00
0.37
0.39
F4
1. 00
0.55
F5
1. 00
55

TABLE VII
SIMPLE CORRELATIONS BETWEEN THE SURVEY QUESTIONS AND THE CHANGE IN MEDICAL COSTS AND THE CHANGE
IN WAGE REIMBURSEMENT COSTS
Survey Change in Change in Wage Questions Medical $ Reimbursement $
-
Written Policy -0.042 -0.010 ERTW -0.225* -0.209* Written Program -0.010 -0.069 Tell New Empl. -0.055 -0.071 Tell Current E. -0.042 -0.095 Sign Form -0.043 -0.025 Super. Involved -0.175* -0.135 Not Exceed -0.206* -0.148 Training -0.096 -0.096 Doctor Relation. -0.026 -0.013 Prefer to Wait 0.249* 0.189* Lt. Duty -0.002 -0.005 Percent Lt. Duty -0.030 -0.003 Regular Wage -0.181* -0.138 Call Company 0.016 0.041 Company Call 0.053 0.015 Work w/ Worker 0.014 0.025 Physical Load 0.143 0.096 Dedication -0.252* -0.221*
Note: * - r is significant at the 0.05 level.
56

TABLE VIII
RESULTS OF REGRESSION TO PREDICT CHANGE IN MEDICAL COSTS FROM 1985 TO 1990, USING ALL PROGRAM COMPONENTS
Variable Parameter Estimate
Intercept 4224.46 Writ. Pol. 57.74 Program Writ. -224.19 Tell New Emp. -79.86 Tell Current E. 131.58 Sign Form -673.79 Supervis. Inv. -320.17 Not Exceed Phys-253.00 Training 160.83 Rel. w/ Doctors 127.55
·Prefer to Wait 986.47 Light Duty -159.08 % Lt. Duty 398.64 Regular Wage -2099.54 Call Company 551.50 Company Call 86.32 Work w/ Worker 1187.78 Physical Load 471.55 Dedication -952.80
T-value
2.647 -0.089 -0.350 -0.134
0.587 -0.923 -1.177 -0.277
0.566 -0.166
1. 915 -0.169
1. 295 -2.723
0.896 0.117 1. 504 2.120
-2.661
Prob. > ITI
0.009 0.929 0.727 0.894 0.558 0.358 0.242 0.782 0.573 0.868 0.058 0.866 0.198 0.008* 0.387 0.907 0.136 0.036* 0.009*
Notes: R = 0.296, Adj. R = 0.172. F (18, 102) = 2.387, p. = 0.003. * - Parameter estimate is significant at the 0.05 level.
57
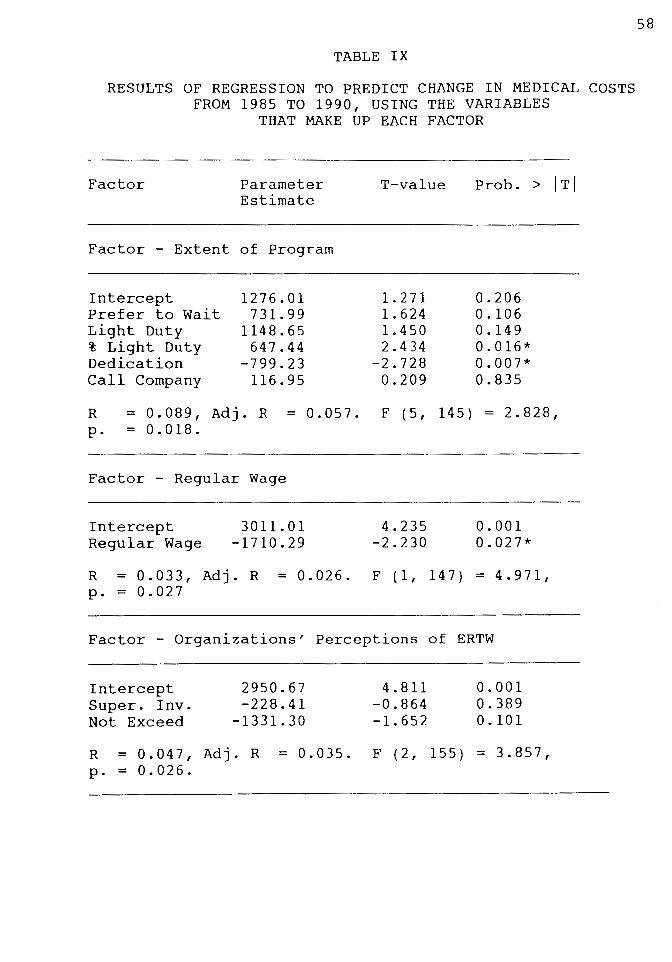
TABLE IX
RESULTS OF REGRESSION TO PREDICT CHANGE IN MEDICAL COSTS FROM 1985 TO 1990, USING THE VARIABLES
THAT MAKE UP EACH FACTOR
Factor Parameter Estimate
Factor - Extent of Program
Intercept Prefer to Wait Light Duty % Light Duty Dedication Call Company
1276.01 731.99
1148.65 647.44
-799.23 116.95
T-value
1. 271 1. 624 1. 450 2.434
-2.728 0.209
Prob. > ITI
0.206 0.106 0.149 0.016* 0.007* 0.835
R = 0 . 0 8 9 I Adj . R = 0 . 0 5 7 . F ( 5 I 14 5 ) = 2 . 8 2 8 I p. = 0.018.
Factor - Regular Wage
Intercept Regular Wage
3011.01 -1710.29
4.235 -2.230
0.001 0.027*
R = 0.033, Adj. R = 0.026. F (1, 147) = 4.971, p. = 0.027
Factor - Organizations' Perceptions of ERTW
Intercept Super. Inv. Not Exceed
2950.67 -228.41
-1331.30
4.811 -0.864 -1. 652
0.001 0.389 0.101
R = 0.047, Adj. R = 0.035. F (2, 155) = 3.857, p. = 0.026.
58

TABLE IX
RESULTS OF REGRESSION TO PREDICT CHANGE IN MEDICAL COSTS FROM 1985 TO 1990, USING THE VARIABLES
THAT MAKE UP EACH FACTOR
Factor
(Continued)
Parameter Estimate
T-value
Factor - Extent of Written Program
Intercept Written Pol. Written Prog. Physical Load
1087.71 -162.26 -867.12
469.88
2.268 -0.258 -1.430
2.311
Prob. > ITI
0.025 0.797 0.155 0.221
R = 0.043, Adj. R = 0.024. F (3, 156) = 2.320, p. = 0.078.
Factor - Communication
Intercept 1662.78 Tell Curr. Emp. -47.74 Sign Form -210.96 Relation. w/Docs -127.30 Tell New Emp. -380.03
3.308 -0.218 -0.246 -0.135 -0.584
0.001 0.828 0.806 0.893 0.560
R = 0.006, Adj. R = -0.021. F (4, 148) = 0.236, p. = 0.918.
Factor - Non-ERTW Approach
Intercept Training Company Call Work w/ Worker
1224.57 -372.57
636.57 397.70
1. 579 -0.1434
0.877 0.512
0.1166 0.154 0.382 0.609
R = 0.017, Adj. R = -0.003. F (3, 148) = 0.853, p. = 0.467.
59
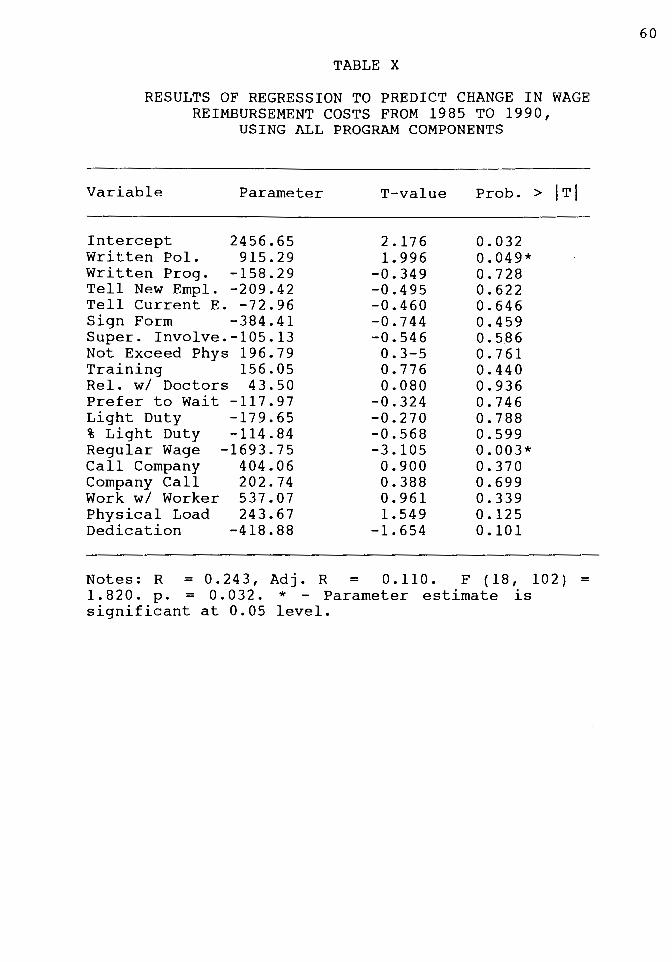
TABLE X
RESULTS OF REGRESSION TO PREDICT CHANGE IN WAGE REIMBURSEMENT COSTS FROM 1985 TO 1990,
USING ALL PROGRAM COMPONENTS
Variable Parameter
Intercept 2456.65 Written Pol. 915.29 Written Prog. -158.29 Tell New Empl. -209.42 Tell Current E. -72.96 Sign Form -384.41 Super. Involve.-105.13 Not Exceed Phys 196.79 Training 156.05 Rel. w/ Doctors 43.50 Prefer to Wait -117.97 Light Duty -179.65 % Light Duty -114.84 Regular Wage -1693.75 Call Company 404.06 Company Call 202.74 Work w/ Worker 537.07 Physical Load 243.67 Dedication -418.88
T-value
2.176 1. 996
-0.349 -0.495 -0.460 -0.744 -0.546 0.3-5 0.776 0.080
-0.324 -0.270 -0.568 -3.105
0.900 0.388 0.961 1. 549
-1. 654
Prob. > ITI
0.032 0.049* 0.728 0.622 0.646 0.459 0.586 0.761 0.440 0.936 0.746 0.788 0.599 0.003* 0.370 0.699 0.339 0.125 0.101
Notes: R = 0.243, Adj. R = 0.110. F (18, 102) = 1.820. p. = 0.032. * - Parameter estimate is significant at 0.05 level.
60

TABLE XI
RESULTS OF REGRESSION TO PREDICT CHANGE IN WAGE REIMBURSEMENT COSTS FROM 1985 TO 1990, USING
THE VARIABLES THAT MAKE UP EACH FACTOR
Factor Parameter Estimate
Factor - Regular Wage
Intercept Regular Wage
1591. 78 -1245.83
T-value
2.334 -1.693
Prob. > ITI
0.021 0.093
R = 0.019, Adj. R = 0.013. F (1, 147) = 2.867, p. = 0.093.
Factor - Extent of Program
Intercept Prefer to Wait Light Duty % Light Duty Call Company Dedication
388.14 198.54 540.45 370.79 174.30
-495.67
0.435 0.496 0.767 1. 568 0.350
-1.903
0.664 0.621 0.444 0.119 0.727 0.059
R = 0.033, Adj. R = 0.001. F (5, 145) = 0.994, p. = 0.424.
Factor - Organizations' Perceptions of ERTW
Intercept 1576.11 Super. Involve. -217.32 Not Exceed -933.09
2.404 -0.769 -1.083
0.017 0.443 0.281
R = 0.026, Adj. R = 0.013. F (2, 155) = 2.052, p. = 0.132.
61

I l
TABLE XI
RESULTS OF REGRESSION TO PREDICT CHANGE IN WAGE REIMBURSEMENT COSTS FROM 1985 TO 1990, USING
THE VARIABLES THAT MAKE UP EACH FACTOR (Continued)
Factor Parameter Estimate
T-value
Factor - Extent of Written Program
Intercept Written Pol. Written Prog. Physical Load
167.29 18.48
-694.97 310.10
0.326 0.027
-1. 069 1. 423
Prob. > ITI
0.745 0.978 0.287 0.157
R = 0 . 0 18 , Adj . R = - 0 . 0 0 1 . F ( 3 , 15 6 ) = 0 . 9 7 3 , P· = 0.407.
Factor - Communication
Intercept Tell New Emp. Tell Current E. Sign Form Rel. w/ Doctors
979.94 -377.91 -235.39
225.30 79.83
1. 84 7 -0.551 -1.019
0.249 0.080
0.067 0.583 0.310 0.804 0.936
R = 0.014, Adj. R = -0.013. F (4, 148) = 0.529, p. = 0.715.
Factor - Non-ERTW Approach
Intercept Training Company Call Work w/ Worker
324.37 -387.07
282.70 532.82
0.399 -1. 421
0.371 0.655
0.691 0.158 0.711 0.514
R = 0.014, Adj. R = -0.006. F (3, 148) = 0.716, p. = 0.544.
62
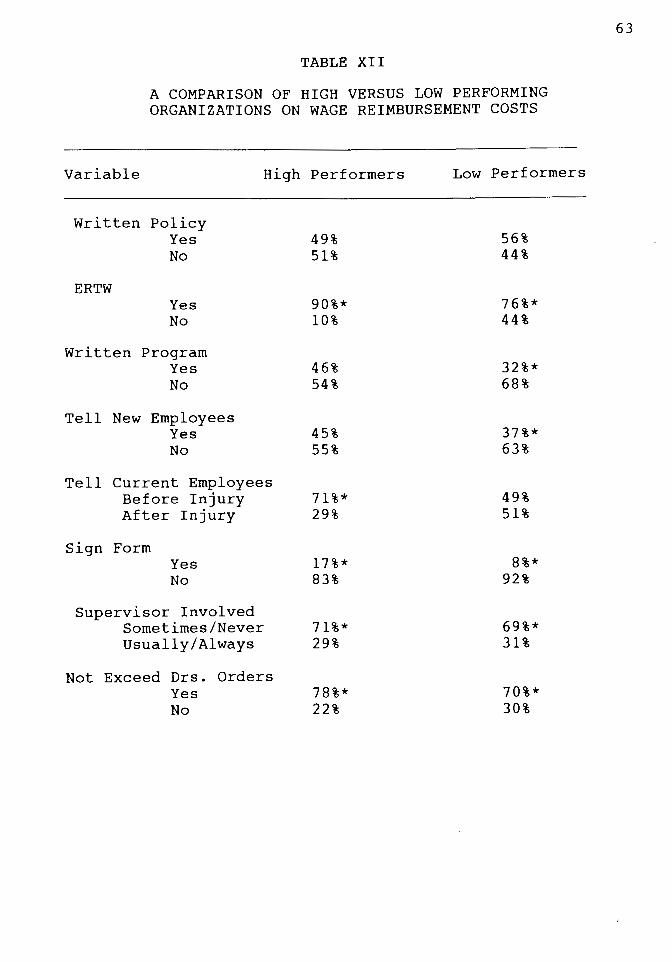
TABLE XII
A COMPARISON OF HIGH VERSUS LOW PERFORMING ORGANIZATIONS ON WAGE REIMBURSEMENT COSTS
Variable High Performers Low Performers
Written Policy Yes 49% 56% No 51% 44%
ERTW Yes 90%* 76%* No 10% 44%
Written Program Yes 46% 32%* No 54% 68%
Tell New Employees Yes 45% 37%* No 55% 63%
Tell Current Employees Before Injury 71%* 49% After Injury 29% 51%
Sign Form Yes 17%* 8%* No 83% 92%
Supervisor Involved Sometimes/Never 71%* 69%* Usually/Always 29% 31%
Not Exceed Drs. Orders Yes 78%* 70%* No 22% 30%
63

TABLE XII
A COMPARISON OF HIGH VERSUS LOW PERFORMING ORGANIZATIONS ON WAGE REIMBURSEMENT COSTS
(Continued)
Variable High Performers Low Performers
Training Moderate/Extensive 69%* 51% A Little/None 31% 49%
Relationships w/ Drs. Positive 15%* 5%* No Comment 83% 95% Negative 2% 0%
Prefer to Wait At Least Sometimes 22%* 30%* No 78% 70%
Use Light Duty Yes 95%* 90%* No 5% 10%
% Cases Lt. Duty Used 76 - 100% 70%* 45% 75% or less 25% 42% 0% 5% 13%
Use Regular Wage Yes 89%* 71% No 11% 29%
Empl. Must Call Co. Yes 73%* 74%* No 27% 26%
Co. Calls Dr. Yes 78%* 71%* No 22% 29%
Work w/ Injured Worker Yes 88%* 80%* No 12% 20%
Physical Load Written Most/All 49% 63%* Some/None 51% 37%
64

Variable
TABLE XII
A COMPARISON OF HIGH VERSUS LOW PERFORMING ORGANIZATIONS ON WAGE REIMBURSEMENT COSTS
(Continued)
High Performers Low Performers
Level of Dedication 5, 4 83%*
10% 7%
63%* 8%
17% 3, 2, 1 No Program
Note - * = significant trend at the 0.05 level.
65

TABLE XIII
A COMPARISON OF HIGH VERSUS LOW PERFORMING ORGANIZATIONS ON MEDICAL COSTS
Variable High Performers Low Performers
Written Policy Yes 56% 61% No 44% 39%
ERTW Yes 90%* 85%* No 10% 15%
Written Program Yes 59% 45% No 41% 55%
Tell New Employees Yes 39% 39% No 61% 61%
Tell Current Employees Before Injury 66% 70%* After Injury 34% 30%
Sign Form Yes 15%* 12%* No 85% 88%
Supervisor Involved Sometimes/Never 32%* 28%* Usually/Always 68% 72%
Not Exceed Drs. Orders Yes 83%* 75%* No 17% 25%
66
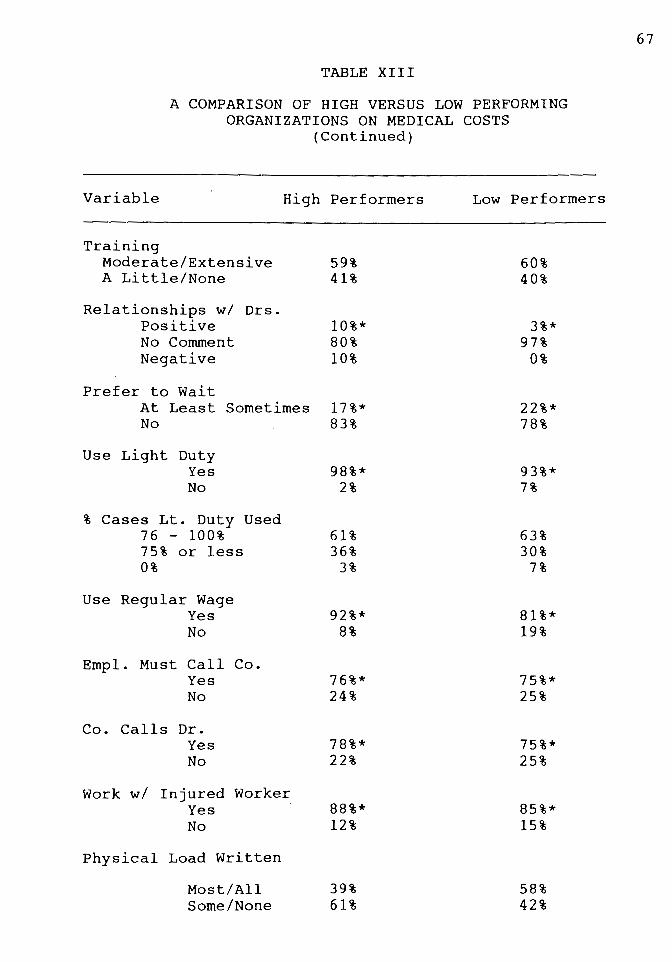
TABLE XIII
A COMPARISON OF HIGH VERSUS LOW PERFORMING ORGANIZATIONS ON MEDICAL COSTS
(Continued)
Variable High Performers
Training Moderate/Extensive 59% A Little/None 41%
Relationships w/ Drs. Positive No Comment Negative
Prefer to Wait At Least Sometimes No
Use Light Duty Yes No
% Cases Lt. Duty Used 76 - 100% 75% or less 0%
Use Regular Wage Yes No
Empl. Must Call Co. Yes No
Co. Calls Dr. Yes No
Work w/ Injured Worker Yes No
Physical Load Written
Most/All Some/None
10%* 80% 10%
17%* 83%
98%* 2%
61% 36%
3%
92%* 8%
76%* 24%
78%* 22%
88%* 12%
39% 61%
Low Performers
60% 40%
3%* 97%
0%
22%* 78%
93%* 7%
63% 30%
7%
81%* 19%
75%* 25%
75%* 25%
85%* 15%
58% 42%
67
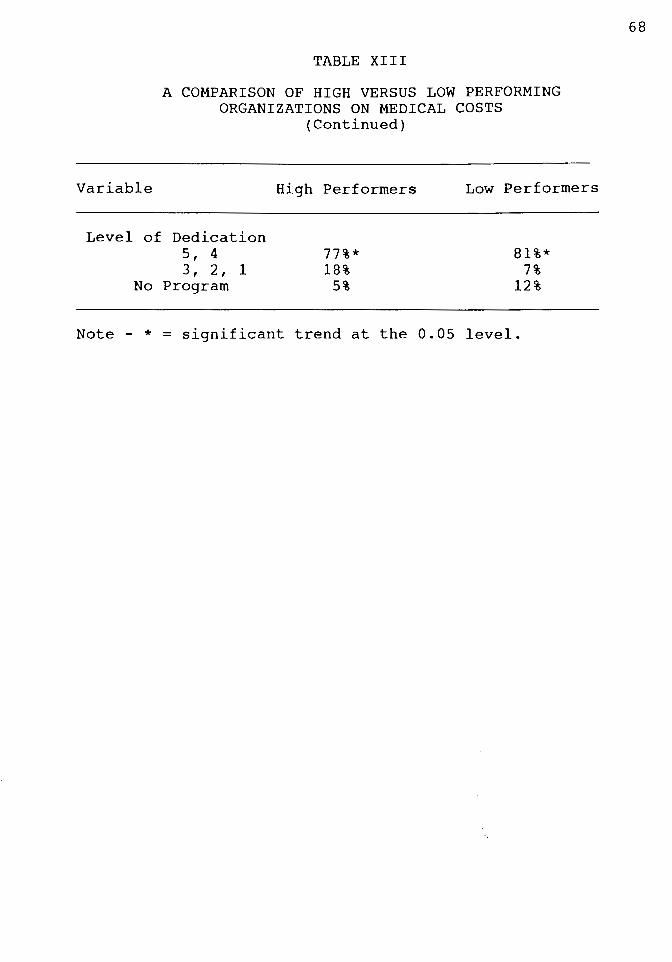
TABLE XIII
A COMPARISON OF HIGH VERSUS LOW PERFORMING ORGANIZATIONS ON MEDICAL COSTS
(Continued)
Variable
Level of Dedication 5' 4 3' 2' 1
No Program
High Performers
77%* 18%
5%
Low Performers
81%* 7%
12%
Note - * = significant trend at the 0.05 level.
68

DISCUSSION
Because of the exploratory nature of this
research project, the following findings must be viewed
as tentative. However, the lack of previous research in
this area also means that the findings discussed here
can provide a much needed source of direction for
further research on ERTW programs.
DESCRIPTIVE FINDINGS
The survey revealed that of those firms with over 50
employees in the Portland Metropolitan area (which were
selected because they had at least a reasonable likelihood
of having some on-the-job injuries), almost half reported
having an ERTW program, and nearly all reported using light
duty at least some of the time. Of those organizations who
sometimes use light duty for injured employees, well over
two thirds use it for 76% to 100% of eligible injuries. In
addition, 79% of respondents rated their organization's
level of dedication to their ERTW program as a 4 or 5 on a
scale of 1 to 5, where 5 was "extremely dedicated". These
findings strongly suggest that ERTW programs have become a
widely accepted way of doing business.
However, a substantial portion of the organizations
surveyed (18%), reported that they would prefer to wait

70
until the injured employee was completely recovered before
returning that person to work in at least some cases. Not
all of these organizations explained their reasons for this
preference, but for those who did, it frequently involved
fear of reinjury, fear of liability, or not having
productive positions to put the injured employee in.
Additionally, 21% of the organizations use light duty or
modified work for less than 25% of the eligible cases.
Further, 14% reported that they do not work with the injured
employee to help get them back to work. Almost one third of
the organizations reported that no one had any training on
ERTW programs. The above findings suggest that there is
still a good-sized minority of organizations who are not
using ERTW programs very much, and would likely benefit from
education about the advantages of such programs.
The survey also revealed some information about how
ERTW programs are being designed in the organizations that
have chosen to embrace them. Two of the most popular
features involve working with the injured employees to help
them return to work and assigning the supervisors the
responsibility to assure that the injured employees do not
exceed their doctor's prescribed limitations in physical
activity. Having the employee contact the company regularly
while off work was also a frequent feature, although some
respondents reported that while it was a requirement, it was
not regularly enforced. An equally popular approach
involved having someone contact the medical provider to

l i j: '
71
ascertain the status of the injured employee and in some
cases to encourage the doctor to consider light duty or
modified work as an option. One ERTW option which seems to
be greatly under-utilized is that of having the employees
sign a form stating that they understand and accept the ERTW
program. Only a small minority of the organizations with
ERTW programs use this strategy, despite the fact that it is
highly recommended by SAIF, and has the ability to carry
legal power and can help the organization to control
fraudulent claims. Another somewhat under utilized approach
involves analysis and written documentation of the physical
load demands of various positions in an organization.
Almost one-third of the survey respondents reported that
their organization did not use this tactic. The major
benefit is that it can help the attending physician to
understand the demands of a position and accurately assess
the injured employee's readiness for it. This applies
whether light duty is used or not. A few firms reported
using videotape technology to give the physician a complete
understanding of exactly what a light or modified duty
position would involve. Those who reported using this
approach felt that it was extremely effective.
EXPLORATORY FACTOR ANALYSIS FINDINGS
The outcome of the factor analysis provided some of the
most interesting results. Factor analysis of data collected
in the survey resulted in a five factor solution. Factor
·.o.-~ ,, .. f•;--

72
one involved organizations that took a non-ERTW approach to
dealing with injured employees. The activities which loaded
on this factor were 1) working with the injured employee to
get them back to work, 2) calling the medical provider to
determine when the injured employee would be able to return
to work, 3) lowering the employees wage if they did light
duty or modified work, and 4) obtaining training about ERTW.
(However, the regular wage variable did not load on this
factor in the confirmatory factor analysis, but instead
broke out into a single-indicator factor). Because none of
these activities involve active ERTW, this factor was
interpreted as an approach to dealing with injured workers
that largely does not include ERTW. While training on ERTW
may seem to be an active approach (and may assist an
organization in an organizations' attempts to implement an
ERTW program), it is not evidence of any active commitment
to the ERTW approach.
Factor two involved organizations' perceptions of ERTW
programs. The activities that loaded highly on this factor
involved 1) reporting that the organization has an ERTW
program, 2) involving the injured employees supervisor in
ERTW decisions, and 3) making the supervisor responsible for
assuring that the doctors' prescribed physical limitations
were adhered to by the injured employee. Several other
variables also had high loadings on this factor, but had
higher loadings on another factor. These activities likely
play a role in organizations' perceptions of ERTW programs,
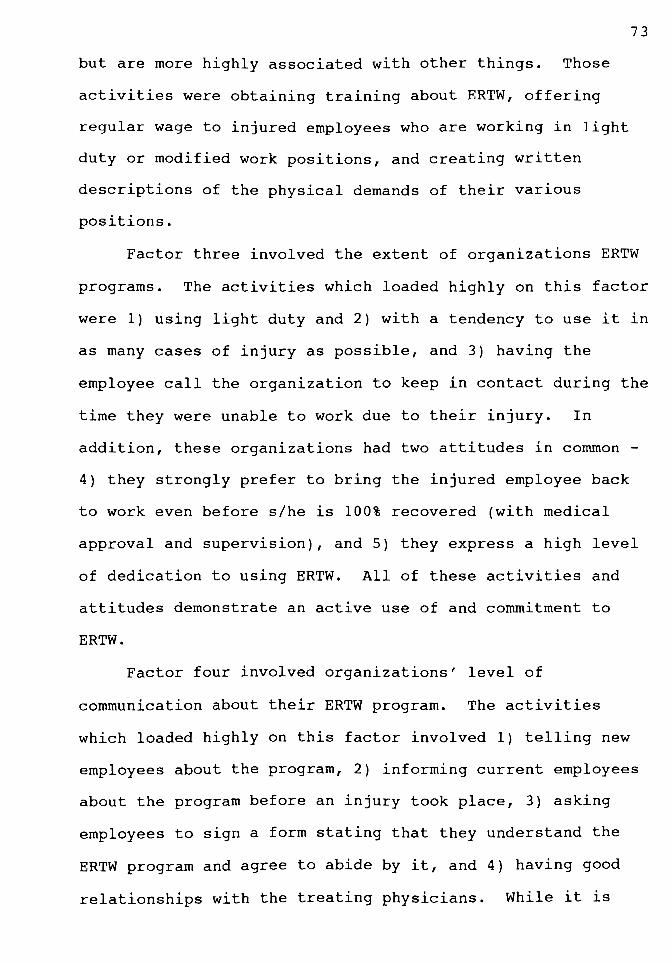
but are more highly associated with other things. Those
activities were obtaining training about ERTW, offering
regular wage to injured employees who are working in light
duty or modified work positions, and creating written
descriptions of the physical demands of their various
positions.
73
Factor three involved the extent of organizations ERTW
programs. The activities which loaded highly on this factor
were l) using light duty and 2) with a tendency to use it in
as many cases of injury as possible, and 3) having the
employee call the organization to keep in contact during the
time they were unable to work due to their injury. In
addition, these organizations had two attitudes in common -
4) they strongly prefer to bring the injured employee back
to work even before s/he is 100% recovered (with medical
approval and supervision), and 5) they express a high level
of dedication to using ERTW. All of these activities and
attitudes demonstrate an active use of and commitment to
ERTW.
Factor four involved organizations' level of
communication about their ERTW program. The activities
which loaded highly on this factor involved 1) telling new
employees about the program, 2) informing current employees
about the program before an injury took place, 3) asking
employees to sign a form stating that they understand the
ERTW program and agree to abide by it, and 4) having good
relationships with the treating physicians. While it is
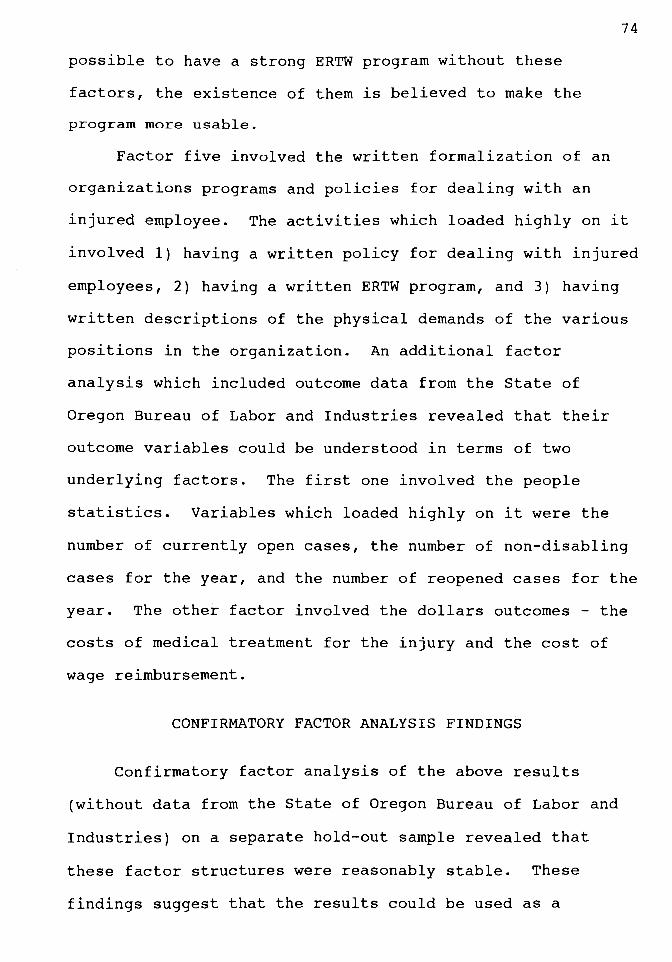
possible to have a strong ERTW program without these
factors, the existence of them is believed to make the
program more usable.
74
Factor five involved the written formalization of an
organizations programs and policies for dealing with an
injured employee. The activities which loaded highly on it
involved 1) having a written policy for dealing with injured
employees, 2) having a written ERTW program, and 3) having
written descriptions of the physical demands of the various
positions in the organization. An additional factor
analysis which included outcome data from the State of
Oregon Bureau of Labor and Industries revealed that their
outcome variables could be understood in terms of two
underlying factors. The first one involved the people
statistics. Variables which loaded highly on it were the
number of currently open cases, the number of non-disabling
cases for the year, and the number of reopened cases for the
year. The other factor involved the dollars outcomes - the
costs of medical treatment for the injury and the cost of
wage reimbursement.
CONFIRMATORY FACTOR ANALYSIS FINDINGS
Confirmatory factor analysis of the above results
(without data from the State of Oregon Bureau of Labor and
Industries) on a separate hold-out sample revealed that
these factor structures were reasonably stable. These
findings suggest that the results could be used as a

starting point in future research, providing a model for
understanding the factors that make up ERTW programs.
75
Confirmatory factor analysis was also done for the nine
factor model. Two additional single-indicator factors were
hypothesized - they involved the ERTW program variable and
the regular wage variable. The data from the State of
Oregon Bureau of Labor and Industries was also used. Two
factors, the first involving people statistics regarding
workers' compensation and the second involving dollars
outcomes of workers' compensation claims. The findings of
this analysis were quite stable, indicating that the nine
factor model may provide future researchers with an strong
base from which to move forward. This model not only
provides an outline of the factors that make up ERTW
programs, but also offers an understanding of the factors
that make up organizational outcomes. However, it does not
of fer an understanding of where outcome variables such as
average days lost per claim and number and costs of
disabling claims may fit with other outcome variables.
Future work in the structural modeling arena should
include the identified factors. However, more variation is
needed to give the ERTW program and policy variables
stronger predictive power. It may also be useful to move to
a nonparametric approach to modeling the effect of ERTW
programs and policies on organizational workers'
compensation outcomes. In addition, future researchers
should strive to obtain data on the average number of days

76
lost per injury and on the number of permanently disabling
claims. The inclusion of these variables will give a model
the opportunity to examine a larger universe of outcomes and
may be the variables for which ERTW programs have the
greatest effect.
REGRESSION FINDINGS
The results of the regression analysis suggest that the
components of the programs which this survey examined do
have a moderate ability to predict change in workers'
compensation medical costs over a five-year period. The
variables that contributed significantly to the model were
using regular wage for employees on light duty, having
written descriptions of the physical demands of the various
job positions, and having a high level of dedication to the
ERTW program. Each of these variables was associated with
better performance on the change in medical costs over time.
This analysis sheds some light on one of the most serious
critisisms of ERTW - the concern that the use of ERTW may
cause reinjury to the injured worker. Because the analysis
does not reveal any relationship between using ERTW and
increased medical costs, it does not support these concerns.
In fact, the relationship between ERTW and decreasing
medical costs suggest that ERTW may be healthier for the
injured employee than staying home during recovery.
All of the variables together also had a significant
ability to predict the change in wage reimbursement costs

77
over time. The variables that contributed significantly to
the model were having a written return-to-work policy and
using regular wage for employees on light duty. Both of
these variables were associated with better performance on
the change in medical costs over time.
The survey variables that had significant, simple
correlations with the change in medical costs and wage
reimbursement costs over the five year period from 1985 to
1990 also give some indication about to which components of
ERTW programs might be especially important. Several
variables were significantly related to change in medical
costs over time. Those respondents who reported that their
organizations preferred to wait until the injured employee
was fully recovered to return them to work had significantly
higher medical costs, which may result because most or all
of the physical improvement needed for the worker to reach
full performance level occurred under direct medical
supervision, not through work hardening done while doing
doctor-approved light duty or modified work.
Althernatively, these findings may be a result of the
psychological benefits of staying active in the workforce.
Those organizations who used ERTW and paid regular wage to
employees while they were on light duty, those who were more
dedicated to their ERTW programs, and those who involved the
supervisor in decision making had lower medical costs than
those who did not do the above things. Only two variables
had significant, simple correlations with the change in
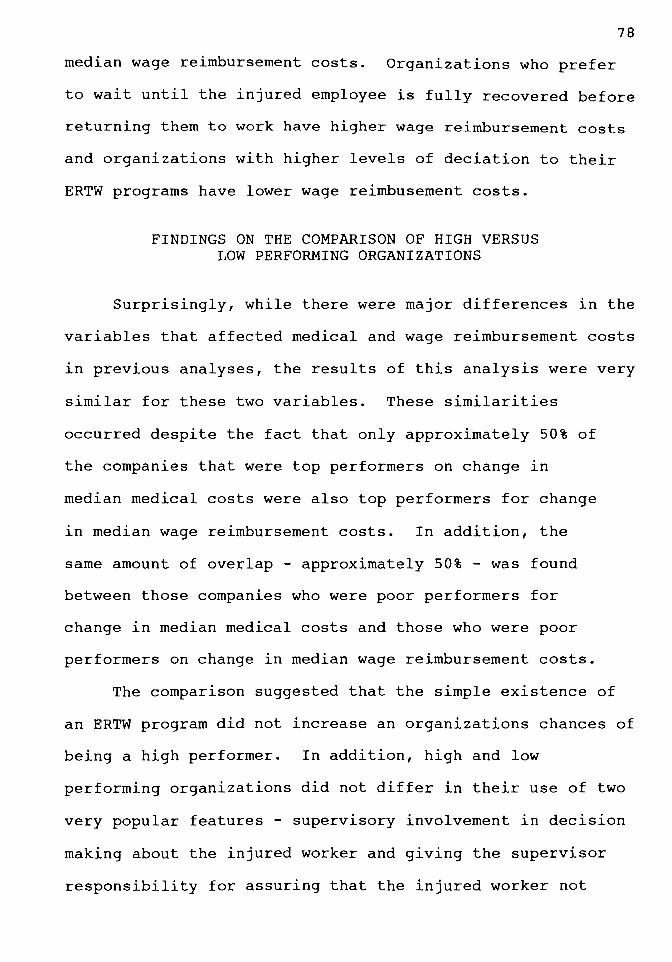
78
median wage reimbursement costs. Organizations who prefer
to wait until the injured employee is fully recovered before
returning them to work have higher wage reimbursement costs
and organizations with higher levels of deciation to their
ERTW programs have lower wage reimbusement costs.
FINDINGS ON THE COMPARISON OF HIGH VERSUS LOW PERFORMING ORGANIZATIONS
Surprisingly, while there were major differences in the
variables that affected medical and wage reimbursement costs
in previous analyses, the results of this analysis were very
similar for these two variables. These similarities
occurred despite the fact that only approximately 50% of
the companies that were top performers on change in
median medical costs were also top performers for change
in median wage reimbursement costs. In addition, the
same amount of overlap - approximately 50% - was found
between those companies who were poor performers for
change in median medical costs and those who were poor
performers on change in median wage reimbursement costs.
The comparison suggested that the simple existence of
an ERTW program did not increase an organizations chances of
being a high performer. In addition, high and low
performing organizations did not differ in their use of two
very popular features - supervisory involvement in decision
making about the injured worker and giving the supervisor
responsibility for assuring that the injured worker not

79
exceed the doctors' prescribed physical limitations.
However, high performers on both variables used light duty
more often and were more dedicated to their ERTW program.
High-performing organizations also preferred to pay regular
wage when employees were on light duty rather than applying
some other wage to light duty hours. Poor-performing
organizations tended to prefer not to tell their new
employees about their ERTW program and those who showed the
worst performance on change in wage reimbursement costs
tended to prefer not to put their ERTW programs in writing.
Overall, high performing organizations appear to have a
higher level of commitment to their ERTW programs.
LIMITATIONS OF THIS STUDY
There are a number of limitations of this study. First,
it is based on correlations, not on any form of experimental
intervention, which means that no causal conclusions can be
reached based on the results. Second, the inability to
obtain data on the state of organizations' programs and
policies five years ago means that we are simply operating
on the assumption that their programs and policies have
improved (from the point of view of ERTW) during that time.
Third, the inability to obtain data from the State of Oregon
on the average number of days lost per claim for each
organization and on the number of permanently disabling
injuries and their associated costs drastically limits the
ability to draw conclusions on the effectiveness of

L
80
organizations policies and practices. Finally, this study
may lack statistical power. There were few organizations
that were using all components of ERTW programs or who had
truly complete programs in effect. These are the
organizations for which the greatest change in costs should
be found. A larger sample size with stratified sampling
based on program completeness would improve the power of the
study.
PROBLEMS WITH THE SURVEY INSTRUMENT
In assessing the percentage of injuries in which ERTW
was used by an organization, we created four categories
instead of using the actual estimated percentage. This was
done in case some survey respondents had difficulty
estimating this number and would be more able to estimate it
in terms of broad ranges. However, it is possible that this
method of treating the data seriously undermined the
predictive strength of this variable. It also drastically
decreased the scale variation, which forces a larger amount
of error into the model when attempting to predict variation
in variables (such as the medical and wage reimbursement
costs) with much larger scales. In addition, the wording of
this question "What proportion of the employees have light
duty or modified work available?" - needs to be refined.
The idea behind it was to assess the proportion of cases in
which light duty was used in comparison to the proportion of
cases in which it could have been used. The wording used

L
81
frequently required some explanation and the question was
generally answered in terms of the percentage of injuries in
which ERTW was used. Changing the scales might also help
normalize the distribution of responses.
The scale for assessing the level of dedication to the
organization's ERTW program also needs to be improved. It
might be worthwhile to ask separate questions about the
level of dedication among top managers and the level of
dedication among supervisors. It would also be useful to
broaden the scale, either by expanding it to at least a 1 to
10 scale and providing specified anchors for each point, or
by using an estimate of the percentage of each group that is
dedicated to the program. Alternatively, the percentage of
people with no, low, medium, high, and very high levels of
dedication could be assessed.
Another question which could be made more specific is
that assessing the level of training on ERTW programs.
There are at least three distinct groups of people who are
of interest here. They are top managers, supervisors, and
those people who administer the workers' compensation
program. The level of training each group has had should be
assessed separately to examine the separate effects of
training at different organizational levels on the outcome
variables. In addition, the effectiveness of different
sources of training could be assessed, as training can
come from insurers, medical care providers, the State of
Oregon, rehabilitation facilities, and so on.

L
82
Because the possible importance of the organizations'
relationships with the treating physicians was not
anticipated, no question specifically addressed that topic.
Instead, it was an issue that was raised by a number of
organizations in a general question on whether there was
anything else that they felt was important. If we had
assessed each organization's relationship with the treating
physicians, we would have obtained a better indication of
the importance of this variable. A four or five point scale
should be created for this variable, with a response
category for those organizations who have no relationship
with the treating physicians and a response category for
those organizations whose relationships with the treating
physicians vary widely. While it is not possible to be
certain of the importance or meaning of this variable,
preliminary indications suggest that poor (and sometimes
adversarial) relationships tend to occur when the care
providers are not educated about the concept and benefits of
ERTW while good relationships tend to occur when the care
providers are very familiar with the physical demands of the
positions in the organizations and the way in which the
organization treats the injured employee.
Yet another survey issue which came up during this
research is that those organizations which say that they do
not have an ERTW program may still use light duty or
modified work for at least some portion of their injured
workers. This means that to have or not have an ERTW

83
program does not completely distinguish between users and
non-users of the major mechanism of ERTW programs. However,
it is not known what meaningful differences exist between
the two approaches.
One variable of ERTW programs which was not included in
the survey was that of whether the organization used only
modified positions or was willing to "make up" positions to
be able to provide light duty. For those organizations who
do not have many ERTW modified positions, the acceptance of
"make-work" may be an important factor in their ability to
use ERTW as often as is optimal. Another variable which
might provide interesting data is whether the organization
has any difficulty getting injured employees to return to
their regular jobs. Several organizations mentioned
experiencing this problem, and it could potentially affect
their wage reimbursement costs.
RECOMMENDATIONS FOR FURTHER RESEARCH
Further research should include using the average
number of days lost per injury as an outcome variable. This
is vital, as it is the variable which is most likely to be
directly affected by ERTW programs. It will likely serve as
a medicating variable between the percent of cases in which
light duty is used and the median wage reimbusement costs.
A second concern with the outcome variables used in this
study was the confound between size of organization and the
"number of .•. " variables. This concern could be addressed
J_
84
by partialling out organizational size. It will also be
important for future research to examine permanently
disabling injuries since this category of injuries often
results in either large settlements or long-term payments.
On the questionnaire side of the research, any future
modeling efforts should not be done with such limited scales
- the process of gathering information on the programs and
policies relating to injured workers must incorporate scales
with the largest possible (meaningful) variance. It may
also be necessary to move to a nonparametric approach to
deal more effectively with the non-normal variable
distributions, although larger, more accurate scales and
larger sample sizes may normalize the distributions
somewhat. Additional modifications to the questionnaire
that may prove fruitful involve examining the accuracy of
organizations' perceptions of their level of dedication to
their ERTW programs in relation to their actual level of
sophistication. General observations from the telephone
surveys suggest that those organizations with poor programs
tend to over-rate their organizations level of dedication,
while organizations with good programs tend to be quite
realistic about their level of dedication. Examining the
level of dedication to various components of the ERTW
program may be a useful approach to examining this question.
In addition, an index of organizations' sophistication level
in using ERTW would need to be created. Unfortunately, the
exploratory research accomplished in this study does not yet

L
85
provide sufficient knowledge to enable a reasonable index to
be created.
The ideal research method for studying the effect of
ERTW programs would utilize a longitudinal design with data
collected on the organizations' policies and practices at
more than one point in time. Changes in programs and
policies over time could then be related to changes in the
outcomes experienced by the organizations.
Finally, becuase the variables examined were only able
to account for a moderate amount of variance in the change
in either medical or wage reimbusement costs over time, it
will be important to examine other variables which may
affect these outcomes. There are several variables which
may prove to offer some explanatory power. One of these is
the effect of the employee who may serve as a mediating
variable between the organization's culture and outcome
variables or as a separate variable in itself. Another
variable that should be examined is the organization'safety
program which may affect not only the number of injuries,
but also the severity of those injuries.
The prevalence of the role of regular wage in all of
the analyises suggest a need to better understand what
affects this variable and what may be affected by it. It is
possible that the decision regarding regular wage may be an
indicator of a cluster of things involving managerial
approach.

l
86
RECOMMENDATIONS FOR ORGANIZATIONS
The following recommendations are based on the findings
discussed above. However, because the research is
exploratory, they should only be used as guidelines, not
hard and fast rules. There were several variables that
appear to be particularly important in terms of
organizational outcomes based on both the regression
analysis and the binomial analysis. They are using regular
wage for employees who are injured but are doing light duty
or modified work, using ERTW in as large a percentage of
cases as possible (with doctors' approval), and increasing
the level of dedication to the ERTW program. The apparent
effect of using regular wage, as opposed to some lower wage
for light duty hours worked may be due to motivational
effects - that is, an employee who is still experiencing
some level of pain and disability may work harder to
overcome those things when s/he has the opportunity to
maintain their usual standard of living. The importance of
the percentage of cases in which light duty is used is not
surprising. An ERTW program will likely have a cumulative
effect based on the number of cases in which it is applied.
It may also have a positive effect on employees morale if
they see it being used regularly. In addition, consistent
use of ERTW is likely to work as a deterrent to those few
employees who might otherwise file fraudulent claims. The
importance of the level of dedication variable suggests that

L
87
those persons interviewed in the survey - the people who
knew the most about how the organization dealt with injured
workers were handled in an organization - understand their
organizations' level of dedication with some level of
accuracy. This conclusion was reached during the phone
interviews when the researcher noted that respondents from
organizations with sophisticated ERTW programs tended to
make estimates of dedication consistent with her own
informal estimate, while respondents from organizations with
unsophisticated ERTW programs tended to rate their
organizations much higher than her informal rating. It may
therefore be useful to involve those people in any planning
on how to increase the level of dedication within the
organization.
In addition, no component was found to be harmful to
the organizational outcomes studied, which suggests that
adding any component should not produce adverse effects on
organizational outcomes.

L
REFERENCES
Bollen, K. (1989). Structural Equations with Latent Variables. NY, NY: Wiley and Sons.
Brown, G. (1990, April 9). Outlook gloomy for workers comp. Journal of Commerce ~ Commercial, 384, 9A.
Hakstian, A. R., Rogers, W. T., & Catell, R. B. (1982). Some notes on the number of factors problem. Multivariate Behavioral Research, 1.I, 193-219.
Hansen-Mayer, T. (1984). The worker's disability syndrome. Journal of Rehabilitation, 50, 50-54.
Hood, L., & Downs, J. (1985). Return-to-work: ~ literature review. (Report No. TMF - P003 - 5). Topeka, KS: The Menniger Foundation.
Kelvin, P. (1981). Work as a source of identity: The implications of unemployment. British Journal of Guidance ~Counseling, ~' 2-11.
Livneh, H. (1982). On the origins of negative attitudes toward people with disabilities. Rehabilitation Literature,!]_, 338-347).
Lucas, S. (1987). Putting a lid on Disability Costs. Management Solutions, 11_, 16 - 19.
Mapes, J. (1990, January 7). Workers' compensation: A system in pain. The Sunday Oregonian, pp. Al, A24.
SAIF Corporation. (1990). Early return to work programs get workers up and running. Compnews, January/February, p. 1-2.
SAIF Corporation (1990, June). Helping you reduce your workers' compensation claim costs: Early returnto-work programs. Brochure R322.
Treelsen, R. (1989). Cutting workers' compensation costs: Return to work programs for injured workers. Presented at the American Trucking Association Regional Safety Meeting, Sparks, Nevada, May 2, 1989.

89
U.S. Social Security Administration. (1987). Annual Statistical Supplement to the Social Security Bulletin.
Versluys, H. P. (1980). Physical rehabilitation and family dynamics. Rehabilitation Literature, ~' 58-65.
Wardrop, R. (1984). Curing your company's health care headaches. Nation's Business, Jan, 50-51.
U.S. Department of Commerce, Economics and Statistics Administration, Bureau of Economic Analysis. (1991, July). Local area personal income 1984-1989, .2.
U.S. Bureau of Labor Statistics. detailed Report.
(1991, January). CPI
U.S. Department of Labor, Bureau of Labor Statistics. (1991, November). Employment and Wages, Annual Averages, 1990, 38, 83. Bulletin 2393.
llll__~~~--------------------------........... ~

r1
XION:!IddV

ML
Return To Work Policy Questionnaire
Hi. My name is Lorrie Riat. I'm doing a survey under the direction of Dr. Nancy Perrin at Portland State University. We're interested in looking at different types of return to work programs for injured workers. Could you answer a few questions for us?
91
Company Name~~~~~~~~~~~~~~~~~~~~~~~~~
Number of employees~~~~- W/C Insurer ~~~~~~~~~~
Official Job Title Is Co. Unionized ~~~~~~~~
Number of Lost Time Injuries in Last Year ~~~~~~~~~
Average Time Lost Due to Injury ~~~~~~~~~~~~~~
1. Do you presently have a written return-to-work policy?
Yes No
2. Do you presently have an early-return-to-work program?
Yes No (IF NO, GO TO 11)
For those WITH early return to work programs:
3. Do you have a written procedure describing who takes what steps and when in the process of getting an injured employee back to work?
Yes No
4. Is there a mechanism within your company for informing people when they're hired about your earlyreturn-to-work program?
Yes No
5. Is there a mechanism within your company for informing current employees about your early-return-towork program?
All are Informed Most are Informed Only Some are Aware Usually Find Out After an Injury

6. Are your employees required to sign a form indicating that they understand and accept your earlyreturn-to-work policy?
Yes No
7. Are line supervisors involved in early-return-towork decisions for employees they supervise?
Always Usually Sometimes Never
92
8. Is there someone who makes sure that an employee on modified work does not exceed the physical limitations set by their doctor?
Yes No
9. Has anyone in your organization received any training, either formal or informal, on early-return-to work-programs?
Extensive Moderate A little None
10. Are there any other components of your early-returnto-work program that you feel either contribute to or hinder the success of the program? Yes No (If yes, describe)
11. Does the organization prefer to wait until the injured employee is fully recovered before returning them to work?
Yes Sometimes No
12. Does the organization provide light duty or modified work for the injured worker?
Yes No (If NO, GO TO 15)
13. In what percentage of the cases of injury (excluding minor injuries) is light duty or modified work used?
A. Under 25% B. 25% to 49% c. 50% to 75% D. 76% to 100%
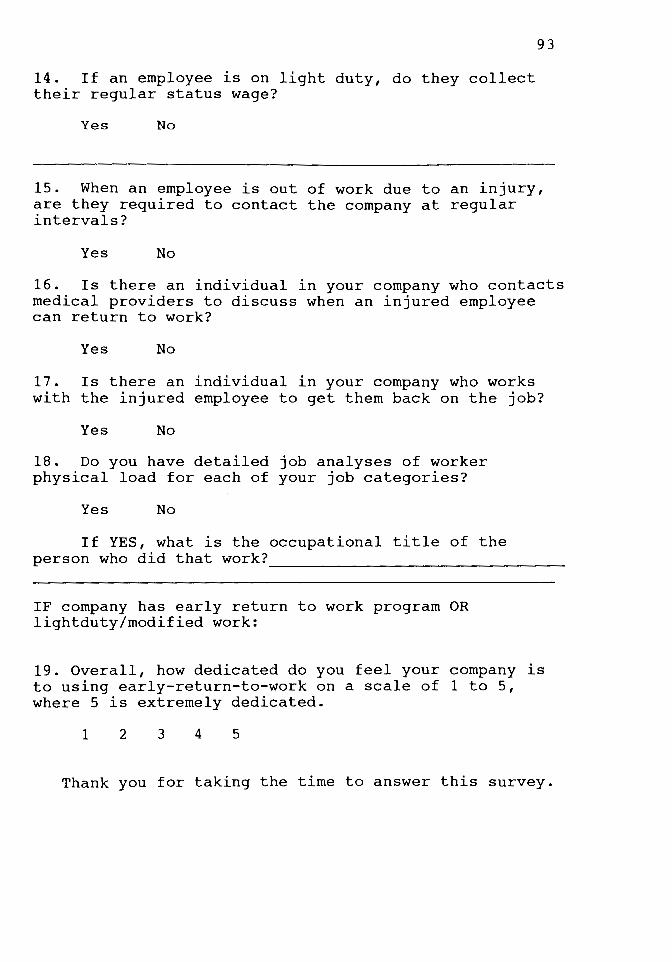
14. If an employee is on light duty, do they collect their regular status wage?
Yes No
93
15. When an employee is out of work due to an injury, are they required to contact the company at regular intervals?
Yes No
16. Is there an individual in your company who contacts medical providers to discuss when an injured employee can return to work?
Yes No
17. Is there an individual in your company who works with the injured employee to get them back on the job?
Yes No
18. Do you have detailed job analyses of worker physical load for each of your job categories?
Yes No
If YES, what is the occupational title of the person who did that work?~~~~~~~~~~~~~~~~~
IF company has early return to work program OR lightduty/modified work:
19. Overall, how dedicated do you feel your company is to using early-return-to-work on a scale of 1 to 5, where 5 is extremely dedicated.
1 2 3 4 5
Thank you for taking the time to answer this survey.