early results from the cosmic/ formosat-3 mission · early results from the cosmic/ formosat-3...
TRANSCRIPT

Early Results from the COSMIC/FORMOSAT-3 Mission
Bill KuoUCAR COSMIC Project
FORMOSAT-3

COSMIC (Constellation Observing System for Meteorology, Ionosphere and Climate)
6 Satellites was launched:01:40 UTC 15 April 2006
Three instruments:GPS receiver, TIP, Tri-band beacon
Weather + Space Weather dataGlobal observations of:
Pressure, Temperature, HumidityRefractivityIonospheric Electron DensityIonospheric Scintillation
Demonstrate quasi-operational GPS limb sounding with global coverage in near-real time
Climate Monitoring

The velocity of GPS relative to LEO must be estimated to ~0.2 mm/sec (velocity of GPS is ~3 km/sec and velocity of LEO is ~7 km/sec) to determine precise temperature profiles
The LEO tracks the GPS phase while the signal is occulted to determine the Doppler
QuickTime™ and aTIFF (LZW) decompressorare needed to see this picture.
LEO
vleo
vGPS
Tangent point

The velocity of GPS relative to LEO must be estimated to ~0.2 mm/sec (20 ppb) to determine precise temperature profiles
The LEO tracks the GPS phase while the signal is occulted to determine the Doppler
QuickTime™ and aTIFF (LZW) decompressorare needed to see this picture.
LEO
vleo
vGPS
Tangent point

COSMIC launch picture provided by Orbital Sciences Corporation
• All six satellites stacked and launched on a Minotaur rocket
• Initial orbit altitude ~500 km; inclination ~72°
• Will be maneuvered into six different orbital planes for optimal global coverage (at ~800 km altitude)
• All satellites are in good health and providing initial data
Launch on April 14, 2006, Vandenberg AFB, CA

COSMIC satellite status

Processed COSMIC data since launch

COSMIC Sounding Penetration (Day 239, 2006)
90% of COSMIC soundings can penetrate to below 1 km, and can be used to measure boundary layer height and moisture.

Precision of COSMIC GPS RO Measurements

Vertical profiles of “dry”temperature (black and red lines) lines) from two independent receivers on separate COSMIC satellites (FM-1 and FM-4) at 00:07 UTC April 23, 2006, eight days after launch. The satellites satellites were about 5 seconds apart, which corresponds to a distance separation at the tangent tangent point of about 1.5 km. The latitude and longitude of the the soundings are 20.4°S and 95.4°W.
00:07 UTC 23 April 2006,
eight days after launch

Deviation of the two GPS RO soundings separated by less than 10 km

Precision of GPS RO soundings
Comparison of PPMT by Region
0
0.1
0.2
0.3
0.4
0.5
0.6
0 50 100 150 200 250 300
Tangent Point Separation Distance (km)PPMT Tropics PPMT South MidLatitde PPMT South Polar PPMT North MidLatitude PPMT North Polar
PPMT = Precision Parameter of Middle Troposphere, which is the mean absolute differences in the 10-20 km layer
0.02% difference in refractivity, which is equivalent of 0.05 C in temperature

Detection of Tropical Boundary Layer

Two techniques are being tested to estimate PBL top or top ofconvective cloud layer:
1) Using sharp gradients of mean humidity via gradientsof retrieved bending angle and refractivity profiles
2) Using signal fluctuations (scintillation) of recorded signal asmeasures of clear-air turbulence and cloud-forced convective mixing.
World-wide distribution of this interface contains information onthe state of the lower troposphere and is predicted by regional and global models.
Monitoring PBL depth by GPS Radio Occultations

Examples of retrieved bending angle and refractivity profiles inthe presence of a sharp boundary (ABL top) at ~ 2 km altitude
Bending angle profiles are scanned with 0.5 km window and theheight of the maximum change (for bending angle) and the change inslope (for refractivity) is estimated for each profile.

Zonal distribution of the heights of maximum bending angle lapse (>10-2 rad) within 0.5 km height (color scale shows the bending angle lapse rate)
for 23 Sept. to 3 Oct. 2006 BAlapse(rad)
latitude (deg)
altit
ude
(km
)
latitude (deg)
latitude (deg)
BA > 2 x 10⁻² rad
All soundings
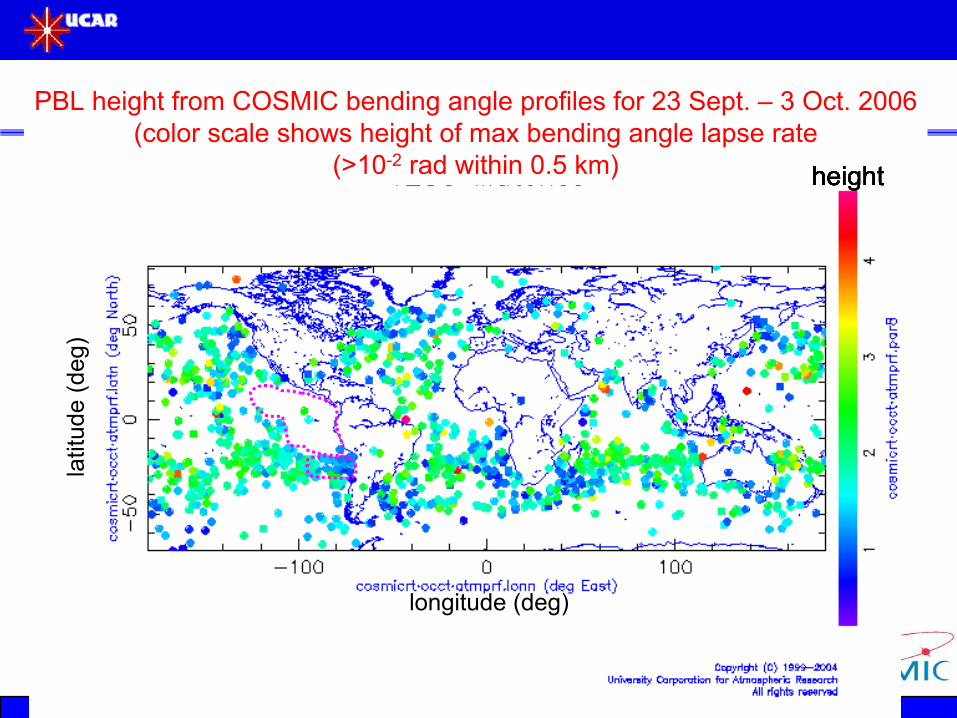
PBL height from COSMIC bending angle profiles for 23 Sept. – 3 Oct. 2006(color scale shows height of max bending angle lapse rate
(>10-2 rad within 0.5 km) height
longitude (deg)
latit
ude
(deg
)
heightheightheightheight

Equator
15 S
30 S
15 N
30 N

Assimilation of COSMIC at ECMWF: Preliminary results
Sean Healy
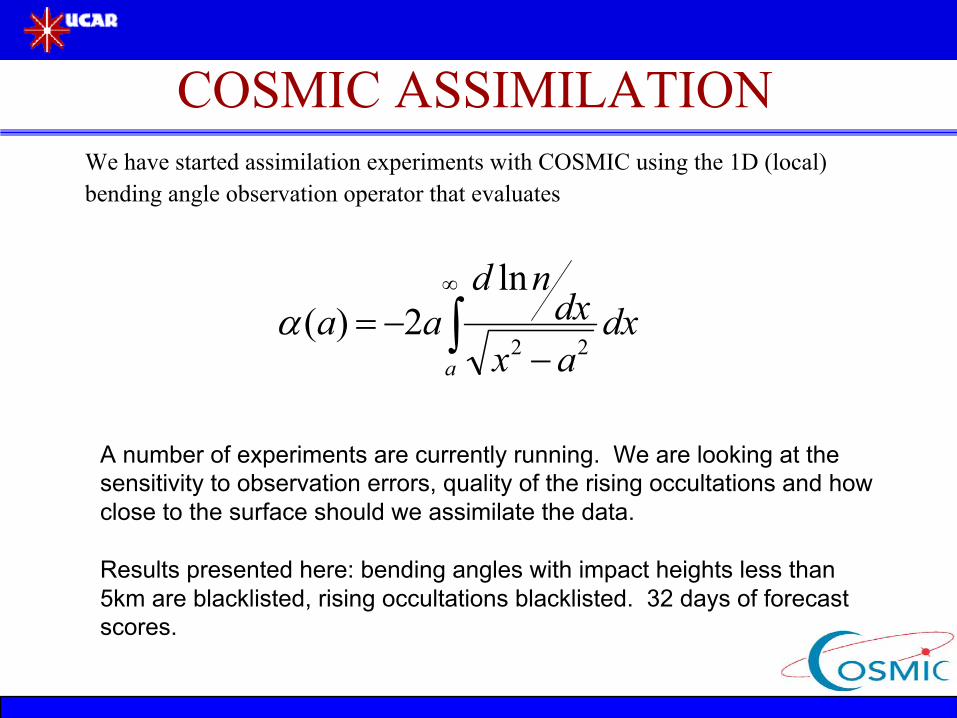
COSMIC ASSIMILATIONWe have started assimilation experiments with COSMIC using the 1D (local)bending angle observation operator that evaluates
∫∞
−−=
a
dxaxdx
ndaa
22
ln2)(α
A number of experiments are currently running. We are looking at the sensitivity to observation errors, quality of the rising occultations and howclose to the surface should we assimilate the data.
Results presented here: bending angles with impact heights less than 5km are blacklisted, rising occultations blacklisted. 32 days of forecast scores.

Vertical profile of the COSMIC “O-B” and “O-A” bending angle mean and standard deviation departure statistics, normalized by the assumed observation errors
(so that departures should be of order unity)
O-B = BlackO-A = Red
The departures shown here are for COSMIC-4, but similar results are obtained for the 5 other satellites.
The bias in the tropics near 18 km is related to a model bias.
The standard deviation of the O-B departures near 40 km are typically 3 microradians. Overall, the quality of the bending angles looks very good!
NH
TR
SH

Some promising forecast scores in the stratosphere. EG, verification against
radiosonde at 100 hPa. Red = COSMIC experiment.
The results in the NH are new. We had not seen improvements in NH with CHAMP. Note that the improvements are generally statistically significant at the 5% level.
NH
TR
SH

Summary■ We have started assimilation experiments with COSMIC.
■ The bending angle departure statistics suggest that the data is very good quality. All satellites have comparable statistics.
■ Assimilating the data cleans up some known model problems in Antarctica and near the tropical tropopause.
■ Forecast scores in the stratosphere encouraging. First positive impact in the NH (100hPa).
■ Still some work required in the troposphere.

Using COSMIC refractivity profiles in an evaluation of Antarctic forecast models
Kevin W. ManningNCAR / ESSL / MMM
Ying-Hua KuoUCAR / UOP / COSMICNCAR / ESSL / MMM
– AMPS is funded by the National Science Foundation


V erification of AMPS (Antarctic Mesoscale Prediction System)
Antarctic is a data poor region of the world.
With 11 days of COSMIC operation, we collect several thousands GPS RO soundings. This provides a great opportunity for model verification.
Results are provided by
Kevin Manning (NCAR/MMM)

0.5 km – InitializationMM5 WRF Refractivity % error

0.5 km – Animation through 120 hrsMM5 WRF Refractivity % error

0.5 km – Fcst hour 120MM5 WRF Refractivity % error

Low-level error statistics show influence of sea-ice representation:
Blue = sea ice; Green = open water

LowerLatitudes
Southern Ocean
PolarPlateau
5.0
10.0
15.0
Z (km)
Refractivity RMSELowerLatitudes( > -50° )
SouthernOcean
PolarPlateau
Animation throughForecast hour 120
(MM5 – GreenWRF – Red)

Conclusions – what COSMIC has revealed about AMPS NWP
■ MM5 Polar modifications are important, and should be adapted into WRF■ WRF “free-troposphere” forecasts are superior to MM5■ Sea-ice treatment is deficient in the models
– MM5 polar modifications show some improvement, but both models have a clear “warm” bias.
■ Initial conditions need attention– Background Error Covariance?
■ The model shows excessive moisture in the subtropical region (as refractivity forecasts are showing positive bias with time).

Conclusions – utility of COSMIC for Antarctic analysis
■ COSMIC dataset is extremely valuable for examining model behaviours– With only a month or so of data, we see clear signals of model strengths and
weaknesses that we really have had no way of seeing before
■ COSMIC will be extremely useful in evaluating changes and improvements to the WRF AMPS system

Impact of COSMIC on Hurricane Ernesto (2006)

HurricanHurrican Ernesto:Ernesto:
Formed: 24 August 2006Formed: 24 August 2006
Reached Hurricane strength: 27 AugustReached Hurricane strength: 27 August
Dissipated: 1 September 2006Dissipated: 1 September 2006
15:50 UTC 27 August 200615:50 UTC 27 August 2006
Picture taken by MODIS, 250 m Picture taken by MODIS, 250 m resolutionresolution
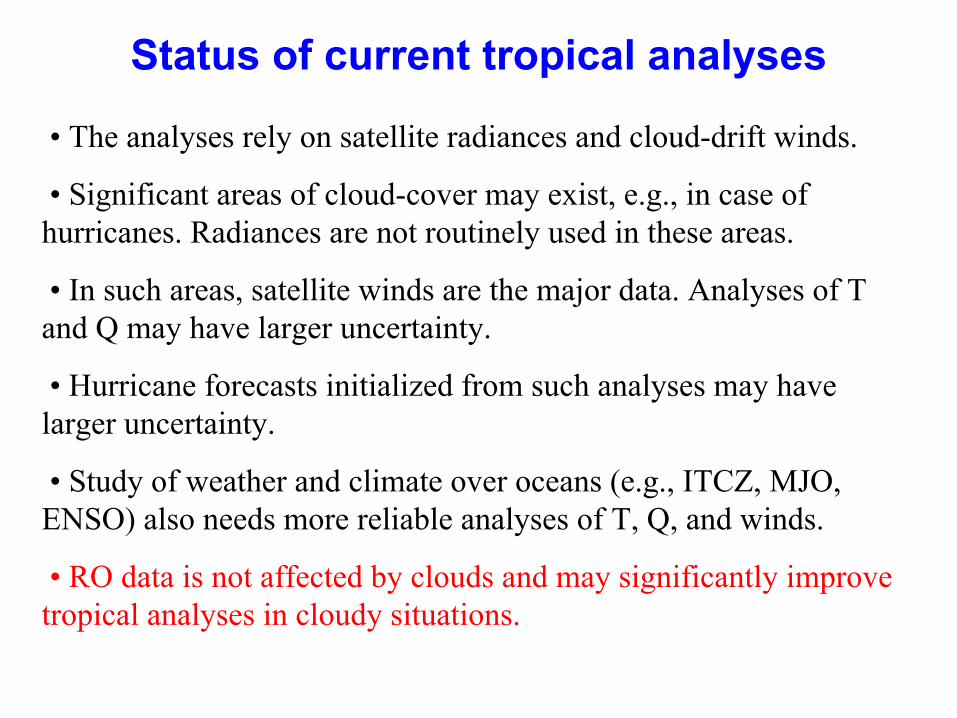
Status of current tropical analyses
• The analyses rely on satellite radiances and cloud-drift winds.
• Significant areas of cloud-cover may exist, e.g., in case of hurricanes. Radiances are not routinely used in these areas.
• In such areas, satellite winds are the major data. Analyses of T and Q may have larger uncertainty.
• Hurricane forecasts initialized from such analyses may have larger uncertainty.
• Study of weather and climate over oceans (e.g., ITCZ, MJO, ENSO) also needs more reliable analyses of T, Q, and winds.
• RO data is not affected by clouds and may significantly improve tropical analyses in cloudy situations.

Location of the RO refractivity profiles(Aug 16-31, 2006)
QC: RO data with differences from the forecasts more than 8 times the observation error are rejected. Almost all (425) of the RO data are assimilated.

The experiments
• CTRL run: Assimilate satellite cloud drift winds only.
• GPS run: Assimilate satellite cloud winds + RO refractivity assimilated using the non-local operator.
• GPS2km run: Same as GPS run but assimilate only RO data above 2km.
• WRF ensemble data assimilation system at 36 km resolutionwith 36 ensemble members is used.
• Continuously 6 hour cycle assimilation.
• Analyses and 6-h forecasts are verified to the dropsondes and radiosondes, which are withheld from the assimilations.

Sounds used for Verification(Aug 16-31, 2006)
The sounds include most dropsondes and a few radiosondes

Green dots:
Best Track
Analyses of surface pressure and wind
Impact on analyses of Hurricane Ernesto (2006)(GPS run)

Analyses of surface pressure and wind
Green dots:
Best Track
Impact on analyses of Hurricane Ernesto (2006)(CTRL run)

Analyses of surface pressure and wind
Green dots:
Best Track
Impact on analyses of Hurricane Ernesto (2006)(GPS2km run)

One week into assimilation One week into assimilation -- 00 UTC 22 August00 UTC 22 August
ControlControl GPSGPS

Ten days into assimilation Ten days into assimilation -- 00 UTC 26 August00 UTC 26 August
GPSGPSControlControl

Theta_eTheta_e cross cross sectionsection
For 22, 24, For 22, 24, 26 Aug 200626 Aug 2006

Conclusion
• The RO data has improved analyses of moisture in the lower troposphere over tropical oceans.
• The RO improved analyses of the hurricane Ernesto’s genesis through providing more favorable environment for the easterly wave to develop into a tropical cyclone.
• The RO data below 2km has useful information and positive impact on the analyses of the hurricane’s genesis.
The ensemble data assimilation system is available on www.image.ucar.edu/DAReS

Impact of a few key COSMIC soundings at the right place

Forecast experiments■ No GPS: initialized from AVN/GFS analysis at 2006-08-23-06Z
■ GPS all: assimilate all 15 GPS profiles at 2006-08-23-06Z, followed by a 5-day forecast
■ GPS 1 : only assimilate 1 GPS profile at 2006-08-23-06Z, followed by a 5-day forecast

Low-level moisture change by assimilating GPS
GPS all GPS 1
Assimilate this sounding only

2006-08-23-12Z (06h forecast)
Sat. IR No GPS
GPS all GPS 1

2006-08-24-00Z (18h forecast)
Sat. IR No GPS
GPS all GPS 1

2006-08-24-12Z (30h forecast)
Sat. IR No GPS
GPS all GPS 1

2006-08-25-00Z (42h forecast)
Sat. IR No GPS
GPS all GPS 1

2006-08-25-12Z (54h forecast)
Sat. IR No GPS
GPS all GPS 1
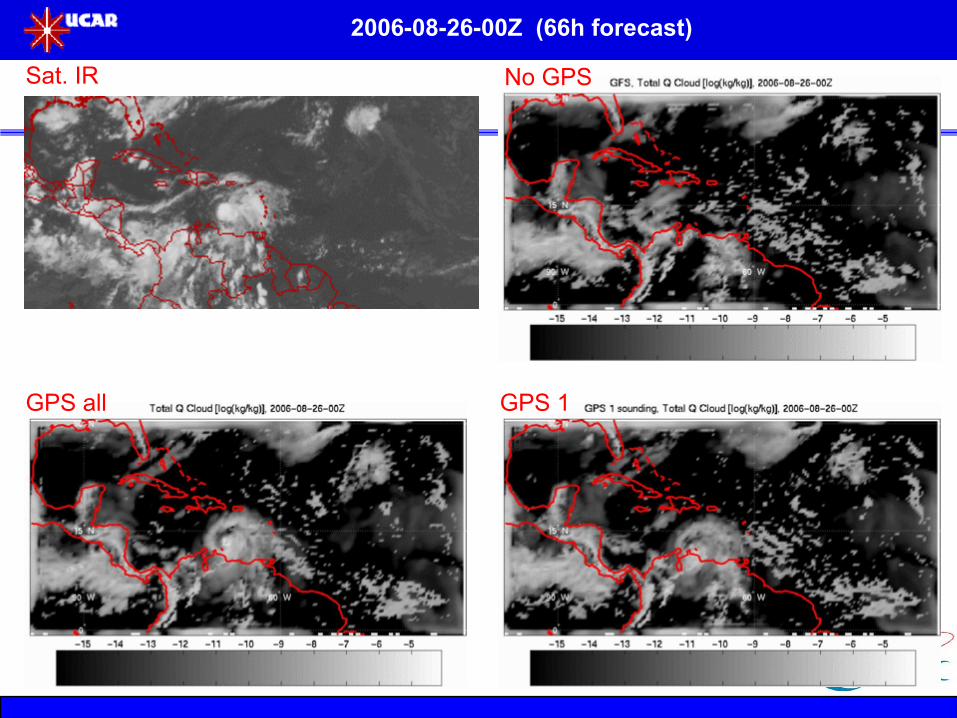
2006-08-26-00Z (66h forecast)
Sat. IR No GPS
GPS all GPS 1

2006-08-26-12Z (78h forecast)
Sat. IR No GPS
GPS all GPS 1

2006-08-27-00Z (90h forecast)
Sat. IR No GPS
GPS all GPS 1

2006-08-27-12Z (102h forecast)
Sat. IR No GPS
GPS all GPS 1

COSMIC sounding distribution in a day

A COSMIC Education Module
A joint effort by COMET and COSMIC.
It covers:
- Basics of GPS radio occultation science
- Applications to weather, climate, and ionosphere
- COSMIC Mission description
http://www.meted.ucar.edu/COSMIC/

http://www.cosmic.ucar.edu
* Select the 'Sign Up ' link under COSMIC
•Accept data use agreement
* Enter information: Name, Address, email, user_id,Password, planned use of data
• An email will be sent within 2-3 business days to indicateaccess has been granted.
COSMIC Data Access
More than 270 users have already registered

Space Weather

Ionospheric profiles availability

Total Electron Content availability
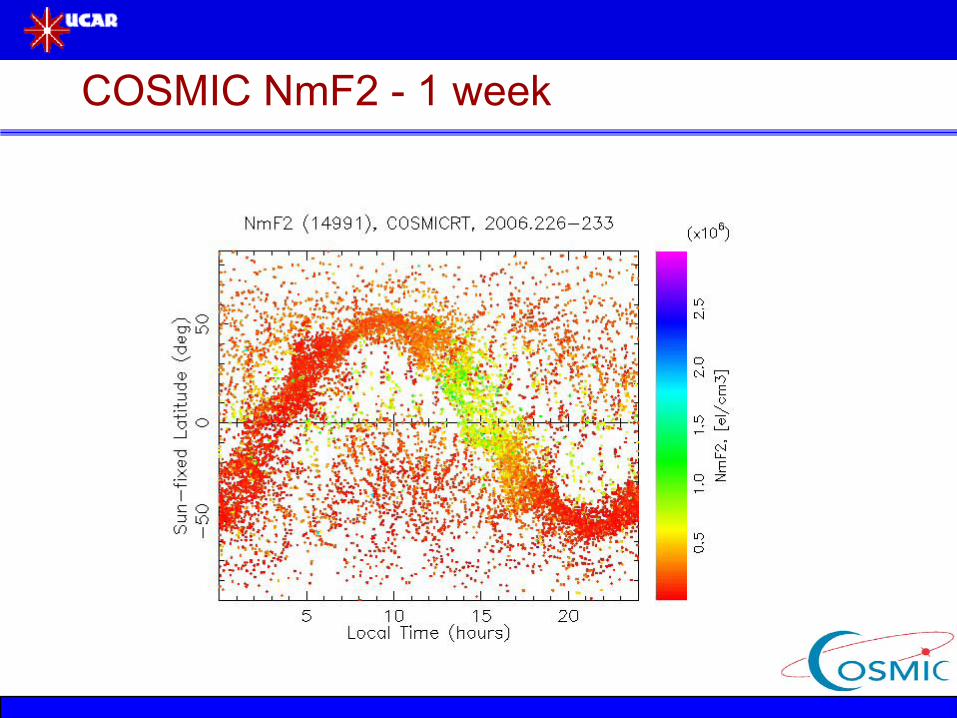
COSMIC NmF2 - 1 week

Comparison of NmF2 and HmF2 between COSMIC and GAIM during Apr. 21-28, 2006
Good agreement of NmF2 between COSMIC and GAIM;
Higher peak heights from GAIM than those from COSMIC
From presentation by Zhen Zeng, NCAR/HAO

Comparison of Ne(h) between COSMIC (red), Ionosondes(green)and TIEGCM (black) on Aug. 17 - 21nd
COSMIC agree well with ionosonde obs, especially the HmF2;
Vertical structures from COSMIC coincide well with TIEGCM in the mid-lat, but not in the tropics.
TIEGCM shows a bit higher HmF2 compared with obs.

COSMIC agree well with ionosonde observations;
Global map of NmF2 revealed from COSMIC is well represented by TIEGCM model, though TIEGCM shows higher peak density in the low latitude.
Maps of NmF2 for:
COSMIC (dots), Ionosondes (stars), TIEGCM (contour)
From presentation by Zhen Zeng, NCAR/HAO

RED = COSMIC satBLUE = GPS sat
Formosat-3/COSMIC Observations of Scintillations
From presentation by Chin S. Lin, AFRL

TIP 135.6-nm passes 14 Sep 2006 FM1 FM3 FM6 0-24 UT (2100 LT)
From presentation by Clayton Coker, NRL