early co emission estimates for 2013 based on monthly
TRANSCRIPT

Annual Report
Berlin, December 2014
Anke Herold
Lukas Emele
Graham Anderson
Margarethe Scheffler
Early CO2 emission estimates for 2013
based on monthly energy data

Disclaimer
The views expressed in this study represent only the views of Öko-Institut and the
authors and not those of Eurostat or any other organization.

Öko-Institut Early CO2 emissions from energy for the year 2013
3
Contents
1 Introduction and background ............................................................................................. 9
2 Methodological approach for early CO2 estimates ........................................................ 10
2.1 Methodological approach for calculating CO2 reference approach emissions based
on Eurostat monthly data ........................................................................................................ 10
2.1.1 Method to calculate early CO2 emission estimates ................................................... 10
2.1.2 Allocation of fuels from monthly data ....................................................................... 11
2.1.3 Conversion factors used in the calculation ............................................................... 12
2.1.4 Use of energy units for aggregate fuel categories .................................................... 13
2.1.5 Data sources ............................................................................................................. 13
3 Data evaluation .................................................................................................................. 15
3.1 Evaluation of monthly Eurostat fuel consumption data .......................................................... 15
3.1.1 Data tool, quality assurance and quality control ..................................................... 15
3.1.2 Completeness of monthly Eurostat energy data for the year 2013 ........................... 15
3.1.3 Completeness: Reporting of international bunkers (for marine and
aviation) .................................................................................................................... 16
3.1.4 Outliers in monthly Eurostat energy data for the year 2013 .................................... 19
3.1.5 Reporting of biofuels ................................................................................................ 21
3.2 Comparison of monthly Eurostat energy data with annual data ............................................. 23
3.2.1 Liquid fuels ............................................................................................................... 23
3.2.2 Solid fuels ................................................................................................................. 25
3.2.3 Gaseous fuels ............................................................................................................ 28
3.2.4 Detailed differences for individual Member States in the comparison of
monthly and annual Eurostat data ............................................................................ 30
3.3 Comparison of Eurostat data with CRF data .......................................................................... 36
3.3.1 Liquid fuels ............................................................................................................... 37
3.3.2 Solid fuels ................................................................................................................. 39
3.3.3 Gaseous fuels ............................................................................................................ 41
3.3.4 Detailed differences for individual Member States comparing CRF
inventory data and annual Eurostat data ................................................................. 43
3.4 Comparison of monthly Eurostat data with early national statistics ...................................... 44
4 Early CO2 estimates for the year 2013 ............................................................................. 46
4.1 Data improvements to correct trend changes of monthly Eurostat data ................................. 46
4.1.1 Corrections for 2012 monthly data to estimate 2013 CO2 emissions ....................... 46
4.1.2 Calculation in physical units or energy units ........................................................... 47
4.1.3 Results for corrected trend changes ......................................................................... 49
4.1.4 Corrections applied to Eurostat monthly data 2012 and 2013 ................................. 50
4.2 Results for 2013 ...................................................................................................................... 50
5 Comparison of previous early CO2 estimates with final CO2 emissions in
Member States’ GHG inventories ..................................................................................... 55

Öko-Institut Early CO2 emissions from energy for the year 2013
4
5.1 Results of comparisons between early CO2 estimates for the years 2009 to 2012
with final inventory data ......................................................................................................... 55
5.2 Impact of inventory recalculations ......................................................................................... 58
5.3 Analysis of large differences at Member States level ............................................................. 61
5.3.1 Belgium ..................................................................................................................... 61
5.3.2 Estonia ...................................................................................................................... 62
5.3.3 Greece....................................................................................................................... 63
5.3.4 Slovakia .................................................................................................................... 64
6 Conclusions and recommendations................................................................................ 65
6.1 Approach to calculate early CO2 estimates ............................................................................. 65
6.2 Priorities by Member State ..................................................................................................... 67
7 References ......................................................................................................................... 71
8 Annex .................................................................................................................................. 73
8.1 Data tables .............................................................................................................................. 73
8.2 Gaps and zero values .............................................................................................................. 96
8.3 Comparison of monthly Eurostat data with early national statistics ....................................... 99
8.3.1 Liquid fuels ............................................................................................................... 99
8.3.2 Solid fuels ............................................................................................................... 100
8.3.3 Natural Gas ............................................................................................................ 102
8.4 Tables with refinements for 2012 for calculating 2013 early estimates................................ 103
8.5 The IPCC reference approach calculation ............................................................................ 105

Öko-Institut Early CO2 emissions from energy for the year 2013
5
List of Tables
Table 2-1 Fuel categories in IPCC Reference Approach and monthly
Eurostat data ................................................................................... 12
Table 3-1 International bunker fuels missing in the 2012 monthly data ............ 17
Table 3-2 Underreporting of international bunker fuels in the 2012
monthly data .................................................................................... 18
Table 3-3 Outliers in the monthly fuel data for the reporting year 2013 ............ 19
Table 3-4 Consumption of gasoline and gas/diesel oil including biofuels
in monthly Eurostat data for the reporting year 2013 ....................... 22
Table 3-5 Difference between monthly and annual liquid fuel data,
2008-2012 ....................................................................................... 24
Table 3-6 Difference between monthly and annual solid fuel data,
2008-2012 ....................................................................................... 26
Table 3-7 Difference between monthly and annual natural gas data,
2008-2012 ....................................................................................... 29
Table 3-8 Differences for Member States in the comparison of monthly
and annual Eurostat 2012 data (gross inland consumption) ............ 31
Table 3-9 Difference in liquid fuel consumption between CRF and
annual Eurostat data, 2008-2012 ..................................................... 38
Table 3-10 Difference in solid fuel consumption between CRF and
annual Eurostat data, 2008-2012 ..................................................... 40
Table 3-11 Difference between natural gas consumption in CRF and
annual Eurostat data, 2008-2012 ..................................................... 42
Table 3-12 Differences for individual Member States arising from the
comparison of CRF data with annual Eurostat data for 2012 ........... 43
Table 3-13 Comparison of trend changes for fuel categories between
Eurostat aggregated monthly data and early national
statistics for the years 2013/2012 for individual Member
States .............................................................................................. 45
Table 4-1 Solid fuel consumption for 2012 and 2013 in kt and TJ for
Finland ............................................................................................ 48
Table 4-2 Solid fuel consumption for 2012 and 2013 in kt and TJ for
Hungary ........................................................................................... 48
Table 4-3 Comparison of trend changes and differences from revised
Eurostat monthly 2012 data and early national statistics for
the year 2013/2012 for individual Member States ............................ 49
Öko-Institut Early CO2 emissions from energy for the year 2013
6
Table 4-4 Calculation of trend changes for the aggregated fuel
categories, 2013/2012 ..................................................................... 51
Table 4-5 Calculation of early CO2 emissions for the year 2013 ...................... 52
Table 5-1 Overview of closeness of early CO2 estimates to final
inventory emissions ......................................................................... 55
Table 5-2 Comparison of early CO2 emission estimates with final
inventory CO2 emissions (CRF table 1A(b)) for 2009, 2010,
2011 and 2012 based on original monthly Eurostat data
(except 2012), without taking into account recalculations ................ 57
Table 5-3 CO2 estimates for the year 2011 by comparing the original
inventory data (2013 submission) and the recalculated data
(2014 submission) ........................................................................... 59
Table 5-4 Impact of inventory recalculations for uncertainties of early
estimates of CO2 estimates ............................................................. 60
Table 5-5 Differences between cumulated fuel consumption in monthly
data and CRF data for Belgium for the years 2008–2012 ................ 61
Table 5-6 Annual trend changes for consumption in aggregated fuel
categories for Belgium for the years 2008–2013 based on
monthly Eurostat data, annual Eurostat data and CRF data ............ 61
Table 5-7 Differences between cumulated fuel consumption in monthly
data fuel consumption and CRF data for Estonia for the
years 2008–2012 ............................................................................. 62
Table 5-8 Annual trend changes for consumption of aggregate fuel
categories for Estonia for the years 2008–2012 based on
monthly Eurostat data, annual Eurostat data and CRF data ............ 63
Table 5-9 Differences between cumulated fuel consumption in monthly
data and CRF data for Greece for the years 2008–2012 ................. 63
Table 5-10 Annual trend changes for consumption of aggregate fuel
categories for Greece for the years 2008–2012 based on
monthly Eurostat data, annual Eurostat data and CRF data ............ 64
Table 6-1 Overview of closeness of early CO2 estimates to final
inventory emissions ......................................................................... 66
Table 6-2 Priority list of liquid fuel data quality issues by Member State .......... 68
Table 6-3 Priority list of solid fuel data quality issues by Member State ........... 69
Table 6-4 Priority list of natural gas fuel data quality issues by Member
State ................................................................................................ 70
Table 8-1 Differences between annual and monthly Eurostat data for
fuel consumption ............................................................................. 74

Öko-Institut Early CO2 emissions from energy for the year 2013
7
Table 8-2 Net Calorific Values used for the purposes of converting
CRF data in physical units ............................................................... 80
Table 8-3 Comparison of calculation approaches of trend changes for
CO2 emissions with different ways of converting the units ............... 83
Table 8-4 Trend changes of aggregate fuel categories – comparison
between Eurostat monthly, Early national statistics, Eurostat
annual and CRF data ...................................................................... 84
Table 8-5 Comparison of Eurostat annual fuel consumption data with
inventory CRF data .......................................................................... 90
Table 8-6 List of gaps for individual months examined in the monthly
fuel data for the year 2013 ............................................................... 96
Table 8-7 List of zero values for individual months identified in the
monthly fuel data for the year 2013 ................................................. 97
Table 8-8 EE, consumption of selected liquid fuels from different data
sources ............................................................................................ 99
Table 8-9 LV, Hard Coal consumption from Eurostat monthly data and
early national statistics for the years 2012 and 2013 ..................... 101
Table 8-10 NL, Hard coal consumption from Eurostat monthly data and
early national statistics................................................................... 101
Table 8-11 SI, total solid fuel consumption from Eurostat monthly data
and early national statistics ............................................................ 102
Table 8-12 Natural gas consumption in Bulgaria, Denmark, Sweden and
Slovenia from different data sources.............................................. 102
Table 8-13 Updated monthly 2012 data as available in April 2014 and
differences to data available in April 2013...................................... 103
Table 8-14 Correction of monthly Eurostat data 2012 with annual
Eurostat data 2012 ........................................................................ 103

Öko-Institut Early CO2 emissions from energy for the year 2013
8
List of Abbreviations
CHP Combined Heating and Power
CO2 Carbon dioxide
CRF Common Reporting Format - a set of standardised spread sheet
data tables containing mainly numerical information and submitted
electronically. These form one component of annual inventory
submissions to the EU and the UNFCCC.
CV Calorific value
DECC Department of Energy and Climate Change (UK)
ETS Emission Trading Scheme
EU European Union
GCV Gross calorific value
Gg gigagram = 109 g = 1kt (kiloton) = 1000 tons
GHG greenhouse gas
IPCC Intergovernmental Panel on Climate Change
LPG Liquefied petroleum gas
MS Member State
NCV Net calorific value
NIR National inventory report
QA/QC Quality assurance and quality control
pp Percentage points
UNFCCC United Nations Framework Convention on Climate Change

Öko-Institut Early CO2 emissions from energy for the year 2013
9
1 Introduction and background
In order to improve the timeliness of the EU carbon dioxide emissions data, Eurostat
initiated an action four years ago called “Early Estimates of CO2 Emissions”, which
aims to provide first estimates of CO2 emissions from energy use (combustion of fossil
fuels) only four to five months after the reference year (instead of the current 16
months). These first estimates are based on a harmonised methodology and monthly
energy statistics already available through the Energy Statistics Regulation. This
information is particularly relevant because CO2 emissions from fossil fuel combustion
make up nearly 80% of the total emissions and, on average, around 80% of the annual
change in EU greenhouse gas emissions.
The first objective of this project is to test whether the trend method developed to
estimate early CO2 emissions continues to produce valuable results based on the use
of monthly energy data. For this purpose, early estimates at T+4 months were
calculated in April 2014 for the year 2013. This is about one year earlier than official
submissions of inventory data by Member States to the UNFCCC. In addition, the early
CO2 estimates calculated in 2013 for the year 2012 will be compared with final
inventory submissions for 2012.
The second objective of this project is to analyse the quality level of monthly Eurostat
energy data compared to annual Eurostat data and to energy data used by Member
States for the inventory estimation. Based on this comparison it will be concluded
whether the quality of these data improved compared to data for the years 2008-2011
and in which areas substantial deviations continue to occur.
This report includes a description of the methodological approach used, the data
evaluation of the monthly data for the years 2008 – 2012 and a detailed analysis for
2012, the calculation of early CO2 emissions from fuel combustion for the year 2013
and a comparison of the early estimates calculated in 2013 (for 2012) with the final
inventory data submitted recently to the UNFCCC (also for 2012).

Öko-Institut Early CO2 emissions from energy for the year 2013
10
2 Methodological approach for early CO2 estimates
2.1 Methodological approach for calculating CO2 reference approach emissions based on Eurostat monthly data
2.1.1 Method to calculate early CO2 emission estimates
The method used to calculate early CO2 estimates is based on the reported IPCC
reference approach for the emissions of EU Member States and uses up-to-date
Eurostat monthly data on fuel use.
The approach used is based on the trend changes of the fuel consumption for
aggregated fuel categories (liquid fuels, solid fuels and gaseous fuels) of monthly
Eurostat data for the years 2009, 2010, 2011, 2012 and 2013. The trend changes of
2010/2009, 2011/2010, 2012/2011 and 2013/2012 are applied to the CO2 emissions of
the same aggregate fuel categories of the latest available reported year in Member
States’ Greenhouse Gas (GHG) inventories as reported in the Common Reporting
Format (CRF)1 reference approach table 1.A.(b) (Equation 1). 2
The first step in this method calculates the percentage change in the consumption of
fossil fuels over the last two years for solid, liquid and gaseous fuels for each Member
State on the basis of monthly energy data.
In the second step the percentage changes are applied to the published CO2 fuel
combustion emissions for the most recent year available, as reported by Member
States to the UNFCCC as part of their GHG inventories in CRF table 1.A (b), which is
the reference approach calculation of CO2 emissions. A more detailed description of
the IPCC reference approach method is included in Annex 8.5.
The calculations are conducted for each fossil fuel group, for each Member State,
constructing early CO2 estimates for the respective year. The sum of Member States’
CO2 emissions then represents the EU-27 and, since 2013, the EU-28 early CO2
emission estimate for the energy sector.
In the national GHG inventories a second bottom-up approach – called the sectoral
approach – is calculated for CO2 emissions from fuel combustion; however no early
statistics at EU level are available that can approximate this sectoral approach three to
four months after the previous year. This is due to missing energy consumption data. In
line with UNFCCC inventory reporting guidelines, differences between the reference
approach and the sectoral approach to calculate CO2 emissions from fuel combustion
should be lower than 2 %; if differences are larger, they need to be explained in the
1 Common Reporting Format - a set of standardised spread sheet data tables containing
mainly numerical information and submitted electronically. These form one component of annual inventory submissions to the EU and the UNFCCC.
2
http://unfccc.int/national_reports/annex_i_ghg_inventories/national_inventories_submissions/items/8108.php

Öko-Institut Early CO2 emissions from energy for the year 2013
11
national inventory report. An outline of the differences that can arise between the two
approaches is included in Annex 8.5.
2.1.2 Allocation of fuels from monthly data
The approach requires an accurate correspondence of fuel categories between
Eurostat monthly data, Eurostat annual data and the inventory data reported in the
CRF table 1.A.(b) in the GHG inventory. Table 2-1 shows the allocation of fuels
included in monthly energy data to the fuel types in the reference approach as required
in the inventory submission under the UNFCCC.
The following fuels are not provided in Eurostat monthly data at the level of
disaggregation required by the IPCC reference approach:
Orimulsion is not reported separately in the monthly Eurostat data, but included
under ‘Other hydrocarbons’.
Shale oil is not reported separately in the monthly Eurostat data, but included under
‘Other hydrocarbons’.
Bitumen and lubricants are not reported individually, but are included under ‘Other
products’.
Hard coal is reported as an aggregate category in monthly Eurostat data covering
anthracite, coking coal, other bituminous coal and sub-bituminous coal.
Oil shale and oil sands are reported under “Lignite”.
Monthly Eurostat data do not include fossil waste whereas the new Eurostat
database for annual data will include the fossil waste as a separate category.
Equation 1
yearreviouspthe incategoryfuelrespectivehetinemissionsCOE
yearprevioustheinfuels id/gaseoussolid/liquof nconsumptio
fuels id/gaseoussolid/liquof nconsumptio
1A(b) table approach referenceinemissionsCOE
with
EEEE
21Y
CO2 ...,
-1Y
id/gaseoussolid/liquC
Y
id/gaseoussolid/liquC
2Y
CO2
1Y
CO2 gaseous,1Y
gaseousC
Y
gaseousC1Y
CO2 liquid,1Y
liquidC
Y
liquidC1Y
CO2 solid,1Y
solidC
Y
solidCY
CO2

Öko-Institut Early CO2 emissions from energy for the year 2013
12
Table 2-1 Fuel categories in IPCC Reference Approach and monthly Eurostat data
IPCC fuel categories Eurostat fuel nomenclature
Liquid Primary Crude Oil Crude Oil
Fossil Fuels Orimulsion Other hydrocarbons
Natural Gas Liquids Natural Gas Liquids
Secondary Gasoline (Motor Gasoline,
Aviation Gasoline, Jet Gasoline)
Motor Gasoline - Biogasoline + Aviation
Gasoline + Gasoline Jet Fuel
Fuels Jet Kerosene Kerosene Jet Fuel
Other Kerosene Other Kerosene
Shale Oil Other hydrocarbons
Gas / Diesel Oil Transport Diesel - Biodiesel + Heating and
Other Gasoil
Residual Fuel Oil Total fuel oil
Liquefied Petroleum Gas (LPG) Liquefied Petroleum Gas (LPG)
Ethane Ethane
Naphtha Naphtha
Bitumen Other products
Lubricants Other products
Petroleum Coke Petroleum Coke
Refinery Feedstocks Refinery Feedstocks
Other Oil (Refinery Gas, Paraffin
Waxes, White Spirit, Other)
Other products (Paraffin Waxes, White Spirit,
Other)
Other Liquid Fossil
Solid Primary
Anthracite (if data for Anthracite
are not available separately,
include with Other Bituminous
Coal)
Hard coal
Fossil Fuels Coking Coal Hard coal
Other Bituminous Coal Hard coal
Sub-bituminous Coal Hard coal
Lignite Lignite
Oil Shale Lignite
Peat Peat
Secondary BKB (Brown coal/peat briquettes)
and Patent Fuel BKB, Patent fuels
Fuels Coke Oven/Gas Coke (Coke) Coke
Other Solid Fuels
Gaseous Fossil Natural Gas (Dry) Natural Gas (Dry)
Other Gaseous Fuels
2.1.3 Conversion factors used in the calculation
Eurostat data provide liquid and solid fuel consumption in physical units while natural
gas is reported in energy units. The data provided in the reference approach in the
CRF table are partly available in physical units, but for 11 of 28 Member States only
data in energy units (TJ) (Czech Republic, Germany, Denmark, Hungary, Italy,
Lithuania, Latvia, Netherlands, Portugal, Romania, Sweden) were available in the CRF
table 1.A(b). For these Member States, CRF data were converted to physical units to
allow for the comparison with Eurostat monthly and annual fuel consumption data. The
Net Calorific Values (NCVs) used for this purpose were taken from Member States’
national inventory reports as submitted in 2014 under the UNFCCC. The values used
are documented in Table 8-2 in Annex 8.1.

Öko-Institut Early CO2 emissions from energy for the year 2013
13
Data for natural gas are provided in Eurostat data in TJ based on GCVs, whereas the
reference approach data are provided in TJ based on NCVs. For the comparison of
Eurostat data with CRF data, therefore, Eurostat data was multiplied with the factor 0.9
to convert to TJ NCV.
2.1.4 Use of energy units for aggregate fuel categories
The annual trend change between 2013 and 2012 used to calculate early CO2
estimates was calculated based on Eurostat monthly data in physical units. For some
Member States that do not report consumption data in physical units, a conversion step
from energy units to physical units is necessary for the comparison of CRF data with
Eurostat data in this approach. A modified approach was also tested in which, as a first
step, Eurostat fuel consumption data were converted from physical units into energy
units (TJ) for all Member States. In a second step, the trend changes relative to the
previous year were calculated based on the fuel consumption in energy units.
However, for most countries the results for the CO2 emissions were very similar. The
results of this test are documented in Annex 8.1, Table 8-3. Therefore, the simpler
approach based on Eurostat data in physical units was maintained for the final CO2
estimates for the year 2013, because this approach requires fewer conversion steps
that would introduce additional uncertainties.
2.1.5 Data sources
To test whether reliable early CO2 estimates can be calculated with monthly Eurostat
data as available 4 months after the reference year, different data sources are needed.
To calculate early CO2 emissions, three different data sources are used:
1) Monthly Eurostat data 2012 (as available in April 2013)
2) Monthly Eurostat data 2013 (as available in April 2014)
3) CRF Inventory data for CO2 emissions based on the reference approach (Table
1.A.b) as reported to UNFCCC for the year 2012 (as available on 15th April 2014).
To assess the quality of the early CO2 estimates for the year 2012, the following data
sources are compared.
1) Early CO2 estimates for the year 2012 (estimated in April 2013 with monthly
Eurostat data)
2) CRF Inventory data for CO2 emissions based on the reference approach (Table
1.A.b) as reported to UNFCCC for the year 2012 (as available on 15th April 2014).
If the difference between the two approaches is less than +/- 2%, no further analysis is
needed. Where differences of the early CO2 estimates for the year 2012 calculated with
monthly Eurostat data 2012 and 2011 and CRF inventory data 2012 exceed +/-2%, a
more detailed analysis is carried out. Large differences can be due to:
1) Quality of monthly Eurostat data for 2011 (available in April 2012)

Öko-Institut Early CO2 emissions from energy for the year 2013
14
2) Quality of monthly Eurostat data for 2012 (available in April 2013) or changed
reporting of monthly Eurostat data for 2012 in comparison to the reporting of 2011
data
3) Recalculations in the CRF inventory for CO2 emissions based on the reference
approach for the year 2011 (as available on 15th April 2014) (see Chapter 5.2).
For calculating early CO2 estimates using the trend changes, the reporting of the two
years needs to be consistent. Changes such as improvements in reporting will of
course affect the time series trends. Thus, any changes in the reporting between the
years lead to differences in the trend changes and affect the results of the early CO2
estimates.
As the 2012 monthly Eurostat data (available in April 2013) are relevant for the
calculation of the 2013 early CO2 estimates, the quality of the monthly Eurostat data for
the year 2012 is analysed by comparing the monthly Eurostat data 2012 with:
1) Annual Eurostat data 2012 (as available in April 2014)
2) CRF Inventory data on fuel consumption as reported to UNFCCC for the year 2012
(as available on 15th April 2014).
If this comparison shows large inconsistencies for single fuel categories in some
countries, these errors in the monthly Eurostat data 2012 (as available in April 2013)
can be corrected to achieve more reliable results for the early CO2 estimates 2013.
This can be carried out by using:
1) Revised monthly Eurostat data 2012 (as available in April 2014 for those countries
that provided new monthly data) or
2) Annual Eurostat data 2012 (available in April 2014) if no revised monthly Eurostat
data for the year 2012 are available.
As there are only few data sources available that provide data as soon as 4 months
after the reference year, the quality of the 2013 monthly data is analysed in terms of
completeness, outliers and gaps as well as by comparing the trend changes of monthly
Eurostat data and early national statistics for the year 2013/2012:
Early national statistics 2013/2012 (as available in April 2014).
In cases where there are large inconsistencies between the trend changes of monthly
Eurostat data and early national statistics, corrections can be applied to obtain better
results for 2013 CO2 estimates (see Chapter 4.1).

Öko-Institut Early CO2 emissions from energy for the year 2013
15
3 Data evaluation
3.1 Evaluation of monthly Eurostat fuel consumption data
3.1.1 Data tool, quality assurance and quality control
For consistency and comparability the project this year builds on work from previous
years and makes use of the same data ‘tool’ - a set of Excel spreadsheets that hold
and manipulate monthly and annual energy and emissions data. The data used is
drawn from CRF table 1.A(b) on the IPCC reference approach for emissions from fuel
combustion as reported in the 2014 GHG inventory submissions (for reference year
2012) to the UNFCCC and on Eurostat monthly data on fuel consumption from the
Eurostat database as of April 2014 (for reference year 2013).
Monthly energy data are imported from the raw data files (as extracted from Eurostat's
production database) and analysed with standard Excel features and functions such as
Pivot tables, conditional formatting, filters and formula. Pivot tables are used to view
and analyse the data in a convenient monthly table with rows for Member States and
fuel activity.
The spreadsheet tool is subject to quality control practices whereby each member of
our team independently reviews the work of others and verifies data flows, calculations
and results.
3.1.2 Completeness of monthly Eurostat energy data for the year 2013
The analysis of data gaps was based on a pivot table with formulas and conditional
formatting configured to identify possible gaps. These results were then assessed for
plausibility based on our own expert opinion. The first part of the analysis on the
monthly data set was to identify missing data (no values). The analysis was conducted
on the monthly data of the 28 Member States for six flows (primary production, total
imports, stock change, total exports, international marine bunkers and deliveries to
international aviation) and 33 fuels. While not all the fuel categories are directly
relevant for the calculation of CO2 early estimates, it was however assumed useful to
apply the search for data gaps to the complete fuel list provided, independently of the
use in the early emissions calculations.
The resulting list of data gaps, included as Table 8-6, was further examined by
Eurostat, with the consensus that only few data gaps were filled. The data gaps for
natural gas exports in January 2013 identified for Slovakia and Slovenia, and missing
data on natural gas in November and December for the Czech Republic were filled with
updated Eurostat data.
For Ireland, peat consumption data (beyond the consumption in power plants) was not
reported in the Eurostat monthly database for the years 2011, 2012 and 2013 for
confidentiality reasons. This led to highly improbable early CO2 estimates for Ireland
due to the absence of this important fuel in the Irish energy balance (underreporting).
Therefore, for Ireland the reported peat deliveries to main activity producer power
plants were used for the estimation and it was assumed that this consumption is about

Öko-Institut Early CO2 emissions from energy for the year 2013
16
70 % of the total peat consumption in 2013. This ratio was derived from past years
(2008-2012) for which peat consumption is available from annual data. Thus, the
assumption used to gap fill the Irish peat consumption data is fully consistent with the
final annual data. The peat consumption in power plants represents 70 % of the total
inland peat consumption. We continue to use this ratio also for 2014 monthly data.
A second part of the completeness analysis was carried out to identify possible
incongruous zero (0) values. ''Zero” values in single months were identified where the
annual total was not zero and exceeded a threshold of 100 tonnes. This analysis step
aims at identifying potential missing values in single months.
The results from this analysis were inspected so that instances of plausible zero values
could manually be excluded. For example, in Denmark and Ireland there are some
“zero” values for gas imports over the summer months due to low demand for heating
purposes in these months. The same pattern can be observed in preceding years.
There are similar seasonal patterns for peat production, imports and exports in Estonia,
Finland, Latvia and Lithuania where production does not occur over winter months.
Such regular intermittency in fuel consumption was not identified as a data gap in the
analysis. A certain degree of intermittency can be expected for some fuel flows and
means that the verification of energy data will always involve some expert opinion. For
completeness, Table 8-7 in the Annex includes the results that were not manually
excluded by the procedures outlined above. According to this analysis no further issues
have been identified. All zeros appeared for fuel categories with very small amounts in
production, imports and exports, so that a zero seems plausible in all cases.
3.1.3 Completeness: Reporting of international bunkers (for marine and
aviation)
Consumption of international bunker fuels is one area for which several Member States
report much lower quantities or no consumption at all in monthly Eurostat data. The
non-reporting of international bunker fuels in a country’s monthly data has the effect
that the combined monthly total fuel consumption in the reference approach calculation
is higher than in the annual total. This is because international bunker fuels are
subtracted from each country’s total fuel consumption for internal consumption.
In 2012 international bunker fuels are consistently not reported for single fuel
categories in the monthly data by Austria, Estonia, Finland, the United Kingdom and
Slovakia, as indicated in Table 3-1 below.
The importance of international bunker fuels varies across Member States. For the
United Kingdom, international bunker fuels account for 19 % of the total liquid fuel
consumption and the missing bunker fuels accounts for 96 % of the difference between
annual and monthly liquid fuel consumption.
For Finland the difference between annual and monthly international bunker fuel data
for Gas/Diesel Oil and Residual Fuel Oil has varied over the years. The missing
quantities in 2012 amount to 31 % of the differences in total liquid fuel consumption.
However, international bunker fuels are not that important in Finland and the missing

Öko-Institut Early CO2 emissions from energy for the year 2013
17
share of liquid fuels due to the lack of international bunkers for Gas/Diesel Oil and
Residual Fuel Oil in monthly data is low (2 %).
For Austria the gaps in the monthly data for international bunker fuels account for 52 %
of the total differences between monthly and annual liquid fuel consumption. Thus, in
the countries listed in the table below, the difference can be explained to a substantial
part by the non-reporting of international bunker fuels in monthly data. However,
international bunker fuels only represent a share of 6 % of annual consumption of liquid
fuels. For Slovakia, the gaps in international bunker fuels are less relevant in relation to
the total consumption of liquid fuels.
Table 3-1 International bunker fuels missing in the 2012 monthly data
Member States
Fuel types
International bunkers
quantities in annual data
2012
International bunkers
quantities in monthly
data 2012
Total difference between
annual and monthly data
for international
bunkers
Total difference between
annual and monthly data for total liquid
fuels
Share of difference for bunker
fuels relative to total
difference
Share of international bunkers
in total liquid fuels
Kt kt % %
Austria Kerosene - Jet fuels
659 - 659 1,263 52% 6%
Slovakia Kerosene - Jet fuels
36 - 36 -209 -17% 1%
Finland
Total 124 - 124 406 31% 2%
Gas / Diesel Oil 42 - 42 -
Residual Fuel Oil
82 - 82 -
United Kingdom
Kerosene - Jet fuels
10,547 - 10,547 11,003 96% 19%
Besides the complete omission of international bunker fuels, considerable
underestimation of international bunker fuels also occurs in monthly data compared to
annual data, which is presented in Table 3-2.
Significantly lower consumption of international bunker fuels in monthly data compared
to annual data occurs for Denmark, Estonia, France, Luxembourg, Malta and Portugal.
Estonia provided data on international bunkers in 2012, but only in the revised monthly
report for the month December 2012. International bunkers are not reported for the
other months of the year 2012. Thus, the reported consumption of Kerosene - Jet
Fuels, Gas/Diesel Oil, and Residual Fuel Oil in monthly data was much lower than in
the annual data. The total quantities of international bunker fuels missing in the monthly
data for Estonia represent large quantities in relation to the total liquid fuel consumption
(96 %). This leads to large differences of 73 % between total liquid fuel consumption in
monthly and annual data.
For Malta the total quantities of international bunker fuels missing in the monthly data
are also large in relation to the total liquid fuel consumption. For Malta, the reporting of
Öko-Institut Early CO2 emissions from energy for the year 2013
18
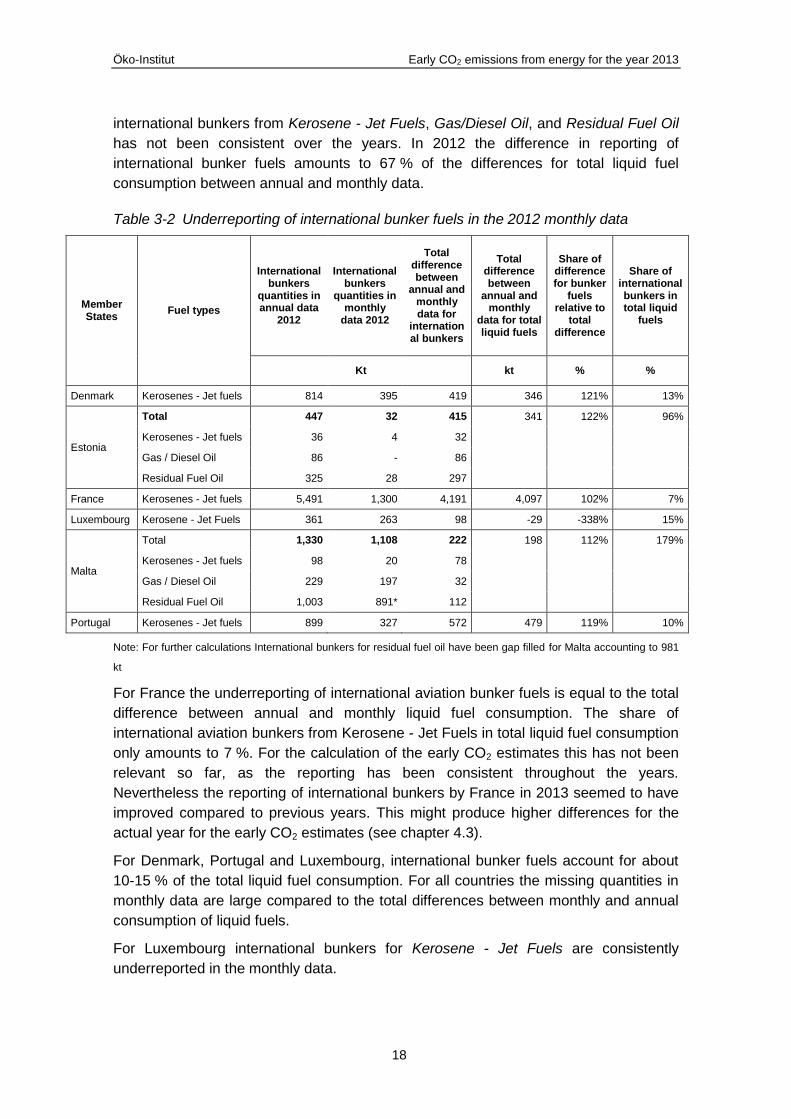
international bunkers from Kerosene - Jet Fuels, Gas/Diesel Oil, and Residual Fuel Oil
has not been consistent over the years. In 2012 the difference in reporting of
international bunker fuels amounts to 67 % of the differences for total liquid fuel
consumption between annual and monthly data.
Table 3-2 Underreporting of international bunker fuels in the 2012 monthly data
Member States
Fuel types
International bunkers
quantities in annual data
2012
International bunkers
quantities in monthly
data 2012
Total difference between
annual and monthly data for
international bunkers
Total difference between
annual and monthly
data for total liquid fuels
Share of difference for bunker
fuels relative to
total difference
Share of international bunkers in total liquid
fuels
Kt kt % %
Denmark Kerosenes - Jet fuels 814 395 419 346 121% 13%
Estonia
Total 447 32 415 341 122% 96%
Kerosenes - Jet fuels 36 4 32
Gas / Diesel Oil 86 - 86
Residual Fuel Oil 325 28 297
France Kerosenes - Jet fuels 5,491 1,300 4,191 4,097 102% 7%
Luxembourg Kerosene - Jet Fuels 361 263 98 -29 -338% 15%
Malta
Total 1,330 1,108 222 198 112% 179%
Kerosenes - Jet fuels 98 20 78
Gas / Diesel Oil 229 197 32
Residual Fuel Oil 1,003 891* 112
Portugal Kerosenes - Jet fuels 899 327 572 479 119% 10%
Note: For further calculations International bunkers for residual fuel oil have been gap filled for Malta accounting to 981
kt
For France the underreporting of international aviation bunker fuels is equal to the total
difference between annual and monthly liquid fuel consumption. The share of
international aviation bunkers from Kerosene - Jet Fuels in total liquid fuel consumption
only amounts to 7 %. For the calculation of the early CO2 estimates this has not been
relevant so far, as the reporting has been consistent throughout the years.
Nevertheless the reporting of international bunkers by France in 2013 seemed to have
improved compared to previous years. This might produce higher differences for the
actual year for the early CO2 estimates (see chapter 4.3).
For Denmark, Portugal and Luxembourg, international bunker fuels account for about
10-15 % of the total liquid fuel consumption. For all countries the missing quantities in
monthly data are large compared to the total differences between monthly and annual
consumption of liquid fuels.
For Luxembourg international bunkers for Kerosene - Jet Fuels are consistently
underreported in the monthly data.

Öko-Institut Early CO2 emissions from energy for the year 2013
19
For Portugal the reporting of international aviation bunkers contributes a large part to
the difference between annual and monthly data for total liquid fuels. International
aviation bunkers (Kerosene - Jet Fuels) make up a share of 10% in total liquid fuel
consumption. For Portugal, the amounts of Kerosene - Jet Fuels are consistently
underreported in the monthly data for all the years analysed so far.
For Slovakia the missing data on monthly consumption of international aviation bunkers
has only a very limited effect as these fuels only contribute 1% of the total liquid fuel
consumption in 2012.
3.1.4 Outliers in monthly Eurostat energy data for the year 2013
Outliers were initially identified as monthly values deviating more than 3 standard
deviations from the median over the year. Records with months with more than two
missing values or zero values were ignored as these cases were already evaluated in
the gap analysis.
This method of outlier detection showed many outliers for the stock change flows.
These have also been ignored as stock changes typically fluctuate to a larger extent
than other flows. Even without considering stock change flows, this approach still
returned many records that may represent to some extent expected or normal variation
of data. The right hand column of Table 3-3 shows the outliers as a fraction of the total
of the other months in the year. This list only shows those records where the outlier
was greater than 10 % of the annual total (excluding the outlier).
Of course, outliers could be valid data and for this reason the results were also
inspected visually, with plausible flow patterns identified and excluded. From a
quantitative perspective the outliers as documented in Table 3-3 should be further
considered as they may represent more significant issues.
Table 3-3 Outliers in the monthly fuel data for the reporting year 2013
Member States
Fuel category Flows Month Outlier Value (kt)
1
Range in other
months (kt)1
% of total
2
Results of follow-up
Belgium Coke Oven Coke Imports August 19 0 - 11 50% Correct value confirmed with MS
Belgium Coke Oven Coke Exports February 76 17 - 34 27% Correct value confirmed with MS C
Belgium Natural gas Exports March 131935 69015 - 98874 15% Correct value confirmed with MS
Czech Republic
Lignite/Brown Coal Imports June 112 4 - 48 58% No follow-up due to low amounts
Denmark Gas/Diesel oil Bunkers August 31 19 - 24 13% No follow-up due to low amounts

Öko-Institut Early CO2 emissions from energy for the year 2013
20
Member States
Fuel category Flows Month Outlier Value (kt)
1
Range in other
months (kt)1
% of total
2
Results of follow-up
Ireland Motor Gasoline Imports February 178 48 - 86 29% Correct value confirmed with MS
Greece Fuel Oil - Low Sulphur Exports March 43 3 - 15 41% No follow-up due to low amounts
Spain Naphta Exports January 217 12 - 48 68% Correct value confirmed with MS
Spain Fuel Oil - Low Sulphur Exports August 118 1 - 61 70% Correct value confirmed with MS
Spain Other Petroleum Products Imports July 242 21 - 127 42% Correct value confirmed with MS
France Other Kerosene Exports October 18 2 - 9 38% No follow-up due to low amounts
France Crude, NGLs, feedstocks, additives/oxygenates & hydrocarbons (blended bio components)
Exports April 62 3 - 28 53% No follow-up due to low amounts
Italy Coke Oven Coke Exports November 51 14 - 23 27% Correct value confirmed with original questionnaire
Hungary Lignite/Brown Coal Exports October 91 0 - 51 64% No follow-up due to low amounts
Hungary Fuel Oil - Low Sulphur Exports February 20 1 - 7 67% No follow-up due to low amounts
Netherlands Other Kerosene Imports April 68 4 - 28 43% No follow-up due to low amounts
Slovakia Natural gas Primary production
March 867 194 - 395 26% Correct value confirmed with MS
United Kingdom
Petroleum Coke Imports February 244 9 - 100 48% Correct value confirmed with original questionnaire
1 Natural gas: TJ, gross calorific value Data for natural gas is provided in Eurostat data in TJ based on GCVs. 2 % of the annual total, for that fuel flow, excluding the outlier.
The column “results of follow-up” is a summary of the further assessment by Eurostat
in April 2014 based on the initial outlier analysis. For the more significant outliers, it
was confirmed with the reporting Member States or with the original questionnaires that
the identified values were correct. If the outlier analysis revealed outliers that concern
Öko-Institut Early CO2 emissions from energy for the year 2013
21
only low amounts, these were not followed up as it is unlikely that they have a strong
impact on the consistency between annual and monthly data.
3.1.5 Reporting of biofuels
One area of further consideration in the data evaluation is the reporting of biofuels in
the annual and monthly oil questionnaires by Member States. In the annual oil
questionnaires Member States are expected to report petroleum products blended with
biofuels (Blended = mix of bio and fossil components).
In 2012 the annual oil questionnaire was amended and the reporting of annual data is
more complete than before. These amendments were introduced in the monthly oil
questionnaire one year later in 2013:
For motor gasoline and gas/diesel oil the fossil proportion of the fuel also has to
be reported. This makes it easier for reporting countries to add together the
fossil and bio proportion of the respective fuel resulting in the total.
For kerosene type jet fuel the bio component was introduced in 2012 and 2013
respectively. So far, kerosene type jet fuel has not been blended with the bio
component. Therefore, the total kerosene total is the same as the fossil
proportion of kerosene.
In 2011 and 2012 the monthly reporting of biofuels was not consistent throughout the
Member States, as many countries reported biofuels under the correct subcategory but
did not add up to the correct total.
Apart from Sweden in 2013 all Member States reported consistent biofuel consumption
in their monthly oil questionnaires (see Table 3-4). Only SE did not provide the figures
which would enable us to calculate the Gross Inland Deliveries (calculated) or Gross
Inland Consumption of biofuels. In the annual oil questionnaire SE provides these
figures.

Öko-Institut Early CO2 emissions from energy for the year 2013
22
Table 3-4 Consumption of gasoline and gas/diesel oil including biofuels in monthly
Eurostat data for the reporting year 2013
Product 3234 5546O 3234A 3260 5547O 3260A
Product
Name
Gasoline
(without bio
components)
Biogasoline
Total motor
gasoline
(blended
with bio
components)
Gas/diesel oil
(without bio
components)
Biodiesels
Total
gas/diesel oil
(blended with
bio
components)
Flow
Unit
Belgium -2,993 0 -2,993 348 0 348
Bulgaria -1,353 0 -1,353 -287 0 -287
Czech
Republic 225 -4 221 1,033 21 1,054
Denmark -713 65 -648 216 117 335
Germany -3,406 -14 -3,420 9,700 -103 9,597
Estonia 234 0 234 589 0 589
Ireland 623 43 666 1,940 56 1,996
Greece -1,732 0 -1,732 -4,595 1 -4,594
Spain -3,305 0 -3,305 -1,520 0 -1,520
France -3,259 -5 -3,264 21,187 -3 21,176
Croatia -307 0 -307 485 0 485
Italy -7,171 -10 -7,181 -6,021 25 -5,996
Cyprus 345 0 345 437 16 577
Latvia 206 0 206 714 -4 710
Lithuania -2,409 0 -2,409 -2,713 0 -2,713
Luxembourg 318 0 318 1,984 81 2,065
Hungary 80 11 91 -37 -8 -45
Malta 73 0 73 171 4 175
Netherlands -8,095 0 -8,095 -12,377 0 -12,377
Austria 74 8 82 3,510 222 3,732
Poland -362 0 -362 220 0 220
Portugal -1,024 0 -1,024 -1,072 0 -1,072
Romania -1,571 1 -1,570 400 -2 398
Slovenia 450 0 450 1,542 6 1,548
Slovakia -835 -24 -859 -1,415 -41 -1,456
Finland -2,540 0 -2,540 -1,450 0 -1,450
Sweden -14 0 -678 168 0 -1,544
United
Kingdom -5,971 12 -5,959 2,649 -26 2,624
Gross Inland Consumption Gross Inland Consumption
1000T 1000T
Source: Eurostat
Correct reporting is prerequisite to being able to deduct the biofuel proportion from the
total gasoline and/or gas/diesel oil consumption. For calculating CO2 emissions based
on the trend change method, good data quality for the years of 2012 and 2013 is
needed. As in 2012, monthly biofuel data has not been reported consistently and it had
not been possible to subtract the amount of biofuels from total gasoline and gas/diesel
oil consumption. Thus, for calculating the 2013 CO2 emissions the totals for gasoline
and gas/diesel oil were used without subtracting the biofuels. Subtracting the biofuels
for the monthly 2013 data only (where the reporting was consistent) and not for the
monthly 2012 data (as available in April 2013) would affect the consistency and could
influence the trend change.

Öko-Institut Early CO2 emissions from energy for the year 2013
23
However, for the calculation of CO2 emissions as in GHG inventories, CO2 from
biofuels should be excluded. For the calculation of early CO2 estimates for 2014
(calculated in 2015) the reporting of biofuels in the monthly Eurostat data for 2014 will
be analysed and, if reported correctly, the consumption of biofuels can be subtracted in
the 2013 and 2014 monthly Eurostat data for the calculation of CO2 emissions to
assess whether the results of the CO2 emission estimation improve when biofuels are
consistently subtracted from the fuel consumption. Nevertheless, the relatively low total
amounts of biofuels currently reported do not strongly affect the results of the early CO2
estimates.
3.2 Comparison of monthly Eurostat energy data with annual data
This section provides comparisons of the differences between annual and cumulated
monthly fuel consumption data of liquid, solid and gas fuel types for the years 2008-
2012. The datasets for the 28 Member States of the EU were kindly provided by
Eurostat in April 2014 and processed by Öko-Institut.
The evaluation compares the differences between the combined monthly and annual
apparent liquid, solid and gas fuel consumption data for the years 2008 to 2012. Table
8-1 in the Annex provides a detailed comparison of monthly and annual Eurostat data
for the three aggregate fuel categories for all Member States.
3.2.1 Liquid fuels
In 2008, 9 Member States showed differences below 2 % between annual and
cumulated monthly liquid fuel consumption, making up a share of 43 % of the total EU-
27 liquid fuel consumption. Differences above 5 % could be identified for 9 Member
States (see Table 3-5), adding up to a share of 24 % of EU-27 total liquid fuel
consumption.
In 2012, the last reporting year for which annual Eurostat and cumulated monthly
Eurostat data are available, data differences between annual and monthly data below
2 % could be found for 14 Member States. Liquid fuel consumption of these 14
Member States account for 57 % of the total EU-28 liquid fuel consumption. The
number of Member States that have larger differences of above 5 % increased to 8
Member States in 2012, constituting 36 % of the total EU-28 liquid fuel consumption.
In most countries the consumption of liquid fuels constitutes a large share of the total
CO2 emissions from energy consumption. Cyprus and Malta use 100 % liquid fuels in
their energy sector and in Luxembourg and Sweden the share of liquid fuels in total
emissions from energy consumption is above 70 % (see Table 3-5). Thus a high data
quality for liquid fuels is required to provide good CO2 estimates.
Table 8-1 in the Annex provides a detailed comparison of monthly and annual Eurostat
data.

Öko-Institut Early CO2 emissions from energy for the year 2013
24
Table 3-5 Difference between monthly and annual liquid fuel data, 2008-2012
Member States 2008 2009 2010 2011 2012
Share of
emissions from
liquid fuels in
total energy
CO2 emissions
(%) in 2012
Belgium -6% -4% -10% -1% 6% 49%
Bulgaria 7% 7% -14% -8% -4% 24%
Czech Republic 0% 0% -4% -2% -1% 21%
Denmark -5% -4% 21% 2% 5% 49%
Germany -1% -1% -1% 0% -1% 35%
Estonia 64% 107% 117% 114% 63% 7%
Ireland -6% 0% 5% 7% -2% 46%
Greece 2% 3% 5% 1% -4% 41%
Spain 2% 2% 0% 0% 1% 51%
France 3% 2% 2% 6% 6% 60%
Croatia NE NE NE 0% 0% 57%
Italy -3% -1% -2% -3% 1% 43%
Cyprus -6% 0% 1% 1% -2% 100%
Latvia -4% 0% -1% 4% -9% 53%
Lithuania 4% 1% 2% 1% -1% 60%
Luxembourg 8% 8% 13% -1% -2% 73%
Hungary 1% -2% -6% 2% -1% 30%
Malta NE -47% 1% -28% 34% 100%
Netherlands -1% 0% 2% 0% -2% 33%
Austria 5% 8% 11% 12% 11% 51%
Poland -15% -1% -1% 1% -2% 22%
Portugal 5% 3% 5% 3% 6% 55%
Romania 1% -4% -5% 2% 0% 29%
Slovenia -2% -2% 1% -1% -2% 49%
Slovakia 0% 5% 1% 0% -2% 27%
Finland 4% 2% 11% -3% 2% 47%
Sweden -2% 0% 2% -2% -1% 79%
United Kingdom 15% 25% 21% 18% 21% 35%
EU 15 2% 4% 3% 3% 4%
EU 27 /28 1% 3% 2% 3% 3%
<+/- 2% 9 MS 13 MS 12 MS 13 MS 14 MS
+/-2-5% 8 MS 8 MS 4 MS 8 MS 6 MS
> +/- 5% 9 MS 6 MS 11 MS 7 MS 8 MS
Percentages calculated by dividing original cumulated monthly Eurostat by annual Eurostat data.
Note: Data for Croatia is included from 2011 onwards.
NE is used for countries for which cumulated monthly data could not be estimated, as
they were not available or are incomplete.
Annual Eurostat data = 100 %, a positive value indicates that monthly data is higher
than annual data; a negative value indicates that monthly data is lower than annual
data.
Table 3-5 shows that there is not an overall systematic quality increase over the years.
While some Member States improved the consistency of monthly and annual data over
the 2008-2012 period (LU, BG, CY, CZ, LT, RO, SI), the consistency deteriorated in

Öko-Institut Early CO2 emissions from energy for the year 2013
25
other Member States (AT, FR, EL, HU, LV, SK). Germany, the Netherlands and Spain
are the only countries that provide good monthly data for liquid fuel consumption for all
years. Nevertheless, the share of these three countries in the EU-28 total liquid fuel
consumption amounts to 34 % in 2012. Some countries like Sweden, Cyprus and
Lithuania show small differences of below 5 % for only one year in the time series,
while all other countries show differences between annual and monthly liquid fuel
consumption data in at least two years.
Systematic differences for the whole time series are found for Austria and the United
Kingdom. This is due to the non-reporting of international bunkers in the Eurostat
monthly data and does not strongly influence the trend changes that are used for
calculating CO2 emissions.
The largest differences in all years are observed in the case of Estonia. These
differences are due to the reporting of shale oil, which differs in the monthly reporting
from the annual reporting. As the share of liquid fuels in total CO2 emissions from
energy consumption only amounts to 7 % in 2012, these large differences do not
strongly influence the results of the CO2 estimates.
Additionally, strong differences between annual and monthly liquid fuel consumption
are found for Malta for all reporting years. The differences occur due the differences in
the reporting of international bunkers in annual and monthly Eurostat data (see chapter
3.1.3).
Constant deviations (over- or underreporting) in the course of time indicate that there
might be a systematic problem. This seems to hold true for FR, PT and IT. Member
States should analyse their data and draw the conclusions for the next cycle of monthly
data collections.
The differences of almost 3 % in all years at the EU level can be explained by the non-
reporting of international bunkers from the UK. In 2012 the international bunkers from
jet kerosene in the UK accounted for 10,547 kt, which is 2 % of the EU-28 total liquid
fuel consumption.
3.2.2 Solid fuels
In 2008 12 Member States showed differences below 2 % between annual and
cumulated monthly solid fuel consumption, making up a share of 56 % of the total EU-
27 solid fuel consumption. Differences above 5 % could be identified for 7 Member
States (see Table 3-6), adding up to a share of only 5 % of EU-27 total solid fuel
consumption.
In 2012, the last reporting year for which annual Eurostat and cumulated monthly
Eurostat data are available, data differences between annual and monthly data below
2 % were found for 11 Member States. Solid fuel consumption of these 11 Member
States account for 44 % of the total EU-28 solid fuel consumption. The number of
Member States that have larger differences of more than 5 % increased to 8 Member
States in 2012 with a share of 9 % of the total EU-28 solid fuel consumption.

Öko-Institut Early CO2 emissions from energy for the year 2013
26
Table 3-6 Difference between monthly and annual solid fuel data, 2008-2012
Member States 2008 2009 2010 2011 2012
Share of
emissions
from solid
fuels in total
energy CO2
emissions
(%) in 2012
Belgium -6% -20% -75% -42% -12% 13%
Bulgaria 2% 0% 0% 0% 1% 65%
Czech Republic 0% 0% -4% 1% 0% 63%
Denmark 0% 1% 0% 0% 1% 30%
Germany -1% -1% -3% -2% -3% 43%
Estonia 2% 10% 0% 1% 7% 86%
Ireland -20% -17% -45% 1% 7% 27%
Greece -3% -5% -14% -6% -2% 49%
Spain -2% 10% 7% 3% 4% 23%
France 0% -2% 4% 4% 8% 14%
Croatia NE NE NE -1% -1% 15%
Italy 4% -5% -6% 1% -2% 17%
Cyprus 2% -5% -4% -15% NE
Latvia -1% 7% 1% -1% 30% 5%
Lithuania 0% -3% 8% -12% -1% 8%
Luxembourg -13% -12% -14% -2% -2% 2%
Hungary 0% -1% 1% 0% 0% 26%
Malta NO NO NO NO NO
Netherlands -2% -1% -1% 38% 22% 20%
Austria -15% -10% -2% -7% -17% 21%
Poland 4% 2% -3% 3% 1% 69%
Portugal 1% 1% -10% 0% 0% 24%
Romania -4% -9% 1% -2% 0% 38%
Slovenia -7% -4% -1% -2% -2% 40%
Slovakia 6% 1% -10% 2% 1% 37%
Finland -9% -4% -3% -3% 2% 38%
Sweden -1% -17% 9% -3% -14% 15%
United Kingdom 0% 1% 0% 1% 0% 32%
EU 15 -2% -2% -5% -1% -1%
EU 27 /28 0% -1% -4% 0% 0%
<+/- 2% 12 MS 10 MS 10 MS 14 MS 11 MS
+/-2-5% 7 MS 6 MS 6 MS 7 MS 7 MS
> +/- 5% 7 MS 10 MS 10 MS 6 MS 8 MS Percentages calculated by dividing original cumulated monthly Eurostat by annual Eurostat data.
Note: Data for Croatia is included from 2011 onwards.
NE is used for countries for which cumulated monthly data could not be estimated,
as they were available or are incomplete.
NO is reported if there is no solid fuel consumption in the country.
Annual Eurostat data = 100 %, a positive value indicates that monthly data is
higher than annual data; a negative value indicates that monthly data is lower than
annual data.
For IE the data for solid fuels has been corrected from 2011 onwards, as the
reporting is confidential (see Chapter 3.1.4).
Öko-Institut Early CO2 emissions from energy for the year 2013
27
Table 8-1 in the Annex provides a detailed comparison of monthly and annual Eurostat
data.
Countries with emissions from solid fuel consumption of above 50% of the total CO2
emissions from energy consumption in 2012 are Bulgaria, the Czech Republic, Estonia
and Poland. Table 3-6 provides an overview of the data quality based a comparison of
monthly and annual Eurostat data.
Similar to liquid fuel consumption, Table 3-6 shows that there is no systematic quality
increase over the years for solid fuels. In comparison to liquid fuel consumption there
are five countries (Denmark, the United Kingdom, Bulgaria and Hungary) that provide
good monthly data for solid fuel consumption for all years. The share of these four
countries in total solid fuel consumption accounts for 14% in 2012. Portugal and the
Czech Republic show larger differences for only one year in the time series, while all
other countries have larger differences in at least two years. Croatia only started
reporting in 2011 with EU accession and the data show very small differences.
Large differences in almost all years can be found for Ireland. For Ireland hard coal and
peat consumption data in the Eurostat monthly database are incomplete and much
lower than annual Eurostat data. Therefore, for peat and hard coal consumption
approximations were used based on reported deliveries to main activity producer
power plants instead of the reported monthly hard coal consumption data. It was
assumed that hard coal deliveries to main activity producer power plants represent
about 80 % of the total hard coal consumption. This ratio was derived from past years
(2008-2012) for which hard coal consumption is available in annual data. For peat it
was assumed that peat consumption in main activity producer power plants is
equivalent to 66% of the total consumed peat.
Belgium consistently underreported hard coal consumption and shows large
inconsistencies in the reporting of BKB and patent fuels and in coke oven/gas coke
between monthly and annual Eurostat data.
Besides Belgium differences above 10 % for solid fuel consumption in the reporting
between monthly and annual Eurostat data for the year 2012 can be found for Latvia,
the Netherlands, Austria and Sweden. For all these countries the differences are due to
inconsistencies in the reporting of hard coal consumption.
Furthermore, tendencies of continued underreporting of solid fuel consumption in
monthly Eurostat data are visible for some Member States in the case of solid fuels
(AT, DE); while for others it varies from under- to overreporting and vice versa. Some
developments are certainly not acceptable like the clear deterioration of data quality as
is visible for Lithuania and the Netherlands for the last years. It is the responsibility of
Member States to carefully analyse the reasons for the shown differences between
their monthly and annual data for solid fuels.
The difference for total solid fuel consumption on EU level is quite low in 2011 and
2012. The high difference of -4 % in 2010 amounts to an absolute difference of 25,009
kt between annual and monthly Eurostat data in the EU-28. This was due to large

Öko-Institut Early CO2 emissions from energy for the year 2013
28
differences in solid fuel consumption in Greece (-8,211 kt), Germany (-7,789 kt),
Poland (-4,224 kt) and other countries.
3.2.3 Gaseous fuels
In 2008 12 Member States showed differences below 2% between annual and
cumulated monthly natural gas consumption, making up a share of 56 % of the total
EU-27 gaseous fuel consumption. Differences above 5% were identified for 4 Member
States (see Table 3-7), adding up to a share of only 5% of the total EU-27 natural gas
consumption. Due to different concepts being used since the reference year 2012 for
import and export data for the annual (import from country of ultimate origin) and the
monthly (import from country of last consignment) data collections, the comparability of
import and export data is no longer provided. As a consequence, a country which does
not produce natural gas itself cannot report natural gas exports in annual data, while it
has to report exports of natural gas in transit in monthly statistics.
In 2012, the last reporting year for which annual Eurostat and cumulated monthly
Eurostat data are available, data differences between annual and monthly data below
2 % were found for 13 Member States. The natural gas consumption of these 13
Member States accounts for 58 % of the total EU-28 natural gas consumption. Table
8-1 in the Annex provides a detailed comparison of monthly and annual Eurostat data.
Öko-Institut Early CO2 emissions from energy for the year 2013
29
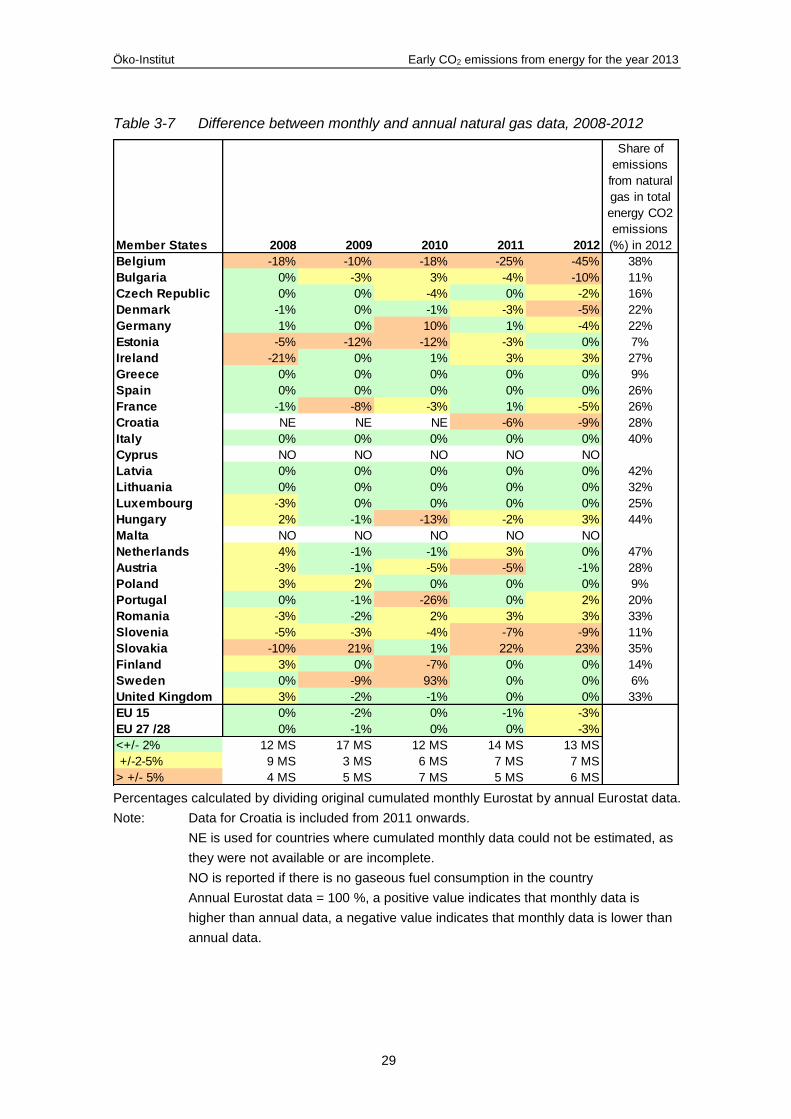
Table 3-7 Difference between monthly and annual natural gas data, 2008-2012
Member States 2008 2009 2010 2011 2012
Share of
emissions
from natural
gas in total
energy CO2
emissions
(%) in 2012
Belgium -18% -10% -18% -25% -45% 38%
Bulgaria 0% -3% 3% -4% -10% 11%
Czech Republic 0% 0% -4% 0% -2% 16%
Denmark -1% 0% -1% -3% -5% 22%
Germany 1% 0% 10% 1% -4% 22%
Estonia -5% -12% -12% -3% 0% 7%
Ireland -21% 0% 1% 3% 3% 27%
Greece 0% 0% 0% 0% 0% 9%
Spain 0% 0% 0% 0% 0% 26%
France -1% -8% -3% 1% -5% 26%
Croatia NE NE NE -6% -9% 28%
Italy 0% 0% 0% 0% 0% 40%
Cyprus NO NO NO NO NO
Latvia 0% 0% 0% 0% 0% 42%
Lithuania 0% 0% 0% 0% 0% 32%
Luxembourg -3% 0% 0% 0% 0% 25%
Hungary 2% -1% -13% -2% 3% 44%
Malta NO NO NO NO NO
Netherlands 4% -1% -1% 3% 0% 47%
Austria -3% -1% -5% -5% -1% 28%
Poland 3% 2% 0% 0% 0% 9%
Portugal 0% -1% -26% 0% 2% 20%
Romania -3% -2% 2% 3% 3% 33%
Slovenia -5% -3% -4% -7% -9% 11%
Slovakia -10% 21% 1% 22% 23% 35%
Finland 3% 0% -7% 0% 0% 14%
Sweden 0% -9% 93% 0% 0% 6%
United Kingdom 3% -2% -1% 0% 0% 33%
EU 15 0% -2% 0% -1% -3%
EU 27 /28 0% -1% 0% 0% -3%
<+/- 2% 12 MS 17 MS 12 MS 14 MS 13 MS
+/-2-5% 9 MS 3 MS 6 MS 7 MS 7 MS
> +/- 5% 4 MS 5 MS 7 MS 5 MS 6 MS Percentages calculated by dividing original cumulated monthly Eurostat by annual Eurostat data.
Note: Data for Croatia is included from 2011 onwards.
NE is used for countries where cumulated monthly data could not be estimated, as
they were not available or are incomplete.
NO is reported if there is no gaseous fuel consumption in the country
Annual Eurostat data = 100 %, a positive value indicates that monthly data is
higher than annual data, a negative value indicates that monthly data is lower than
annual data.

Öko-Institut Early CO2 emissions from energy for the year 2013
30
The number of Member States that have larger differences of above 5% increased to 6
Member States in 2012, making up a share of 6% of the EU-28 total natural gas
consumption.
Thus, similar to liquid and solid fuel consumption, there is no systematic quality
increase over the years.
There is no country within the EU-28 for which the share of emissions from natural gas
in total energy CO2 emissions is above 50 %. In Greece, Sweden, Estonia and Poland
the share is even below 10 %. In Malta and Cyprus natural gas is not consumed at all.
Of the three fuel consumption categories (liquid, solid and natural gas) monthly data on
natural gas consumption is mostly consistent with the annual Eurostat data. Five
countries (Spain, Greece, Italy, Lithuania and Latvia) provide good data quality with
differences below 2 % for all reported years, making up a share of 25 % of the total EU-
28 natural gas consumption. Luxembourg and the United Kingdom show differences for
only one year in the time series, while all other countries have larger differences in at
least two years.
Large differences in almost all years can be found for Belgium and Slovakia. For
Belgium this can be considered as an outlier. Belgium authorities have reacted in the
meantime and changed their collection system. The large differences shown by
Slovakian data are no longer acceptable and the Slovakian authorities are asked to
analyse the problem and initiate corrective action. Slovenia, Croatia and Bulgaria
should also investigate the origin of the differences. German figures also need to be
improved.
The difference for total natural gas consumption on EU level is below 2 % in all years,
except in 2012. The high difference of -3 % in 2012 amounts to an absolute difference
of 427,617 TJ between annual and monthly Eurostat data in the EU-28. This is due to
large differences in natural gas consumption in Belgium (-271,706 TJ) and Germany (-
108,248 TJ).
3.2.4 Detailed differences for individual Member States in the comparison of
monthly and annual Eurostat data
Table 3-8 provides details on the discrepancies identified in the previous sections at
the level of individual fuels for individual Member States. The table includes three
heading rows (Total Liquids, Solid Fuels and Natural Gas) for each Member State.
Sub-rows are included for the major fuel types where the difference between the
cumulated monthly and annual data was greater than 5% and larger than 100kt.
The column ‘cumulated monthly’ in Table 3-8 intends to provide additional explanations
related to the discrepancies and where exactly they occur. Six Member States (AT, BE,
DE, MT, PL, PT) provided revised monthly data for the year 2012 during the year 2013,
which has been included in the column “Cumulated monthly” (revised). Large
differences between revised monthly data occur for natural gas consumption in
Belgium. Nevertheless, the revised 2012 monthly data are the same as the annual data
for 2012 and are no longer related to any monthly statistics, but are more an adaptation
of annual figures. Other countries provided revised monthly data without adapting

Öko-Institut Early CO2 emissions from energy for the year 2013
31
annual figures. This data has been included to analyse whether the revised monthly
data had improved.
Table 3-8 Differences for Member States in the comparison of monthly and annual
Eurostat 2012 data (gross inland consumption)
Member States
Fuel type Annual
(kt, natural gas TJ NCV)
Cumulated monthly
(kt natural gas TJ NCV)
Difference (%)
Cumulated monthly (revised)
Systematic issue
Explanations and comments
Belgium Total Liquids
20,532 21,866 6% - Largely due to differences for motor spirit and LPG
Belgium Motor spirit
-3,406 -2,078 -39% - No Largely due to differences in stock change data.
Belgium LPG 869 638 -27% - No Largely due to differences in reported import amounts.
Belgium Solid Fuels
4,586 4,032 -12% -
Belgium Hard Coal 4,812 4,107 -15% - Yes Differences in imports
Belgium Lignite 0 265 - No Annual data missing.
Belgium Natural Gas
601,475 329,770 -45% 601,476
Largely due to differences in reported import amounts and to a lesser extent to stock change data.
Bulgaria Total Liquids
3,838 3,673 -4% -
Bulgaria Solid Fuels
35,273 35,683 1% -
Bulgaria Natural Gas
102,625 92,539 -10% - Yes Incomplete monthly production data.
Czech Republic
Total Liquids
8,289 8,227 -1% -
Czech Republic
Solid Fuels
49,222 49,001 0% -
Czech Republic
Natural Gas
287,051 281,038 -2% -
Denmark Total Liquids
6,182 6,490 5% 6,507 .
Denmark Kerosenes - Jet fuels
-175 272 -255% 238 Yes Ongoing differences due to lower monthly reporting of bunker fuel.
Denmark Solid Fuels
4,271 4,331 1% -
Denmark Natural Gas
145,886 138,151 -5% 145,709 No
Missing monthly import data and small mismatch in annual vs monthly production data
Germany Total Liquids
98,105 96,976 -1% 97,499
Germany Kerosenes - Jet fuels
-4,464 -4,091 -8% -4,442 No Missing monthly bunker fuel data.
Germany Gas / Diesel Oil
7,374 6,201 -16% 7,291 No Stock change and bunker fuels.
Germany Residual Fuel Oil
-1,981 -1,473 -26% -1,979 No Missing monthly bunker fuel data.
Germany Solid Fuels
247,526 239,616 -3% -

Öko-Institut Early CO2 emissions from energy for the year 2013
32
Member States
Fuel type Annual
(kt, natural gas TJ NCV)
Cumulated monthly
(kt natural gas TJ NCV)
Difference (%)
Cumulated monthly (revised)
Systematic issue
Explanations and comments
Germany Hard Coal 60,400 52,455 -13% - Yes Consistent mismatch on import data
Germany Natural Gas
2,923,196 2,814,948 -4% 2,838,489
Estonia Total Liquids
495 807 63% -
Marine bunkering and stock changes are included separately, not for individual fuels. Mismatches in all flows, especially in Residual Fuel Oil.
Estonia Residual Fuel Oil
-1 -343 34200% - Yes Mismatch in all flows, imports exports and especially bunker fuels.
Estonia Solid Fuels
17,822 19,146 7% -
Estonia Lignite 0 18,896 - No Annual data missing.
Estonia Natural Gas
22,835 22,835 0% -
Ireland Total Liquids
5,847 5,750 -2% - Only for aggregated fuel categories.
Ireland Solid Fuels
6,618 7,104 7% -
Ireland Hard Coal 2,422 2,616 8% - Yes Differences in imports and stock changes.
Ireland Peat 4,168 4,467 7% - No
Due to confidentiality peat data not reported in monthly data. The aggregate monthly value for peat is 66% of deliveries to main activity producer power plant.
Ireland Natural Gas
168,076 173,475 3% -
Greece Total Liquids
12,501 11,978 -4% -
Difference largely due to missing monthly Residual Fuel Oil imports.
Greece Residual Fuel Oil
-2,676 -3,288 23% - No Difference largely due to missing monthly imports.
Greece Solid Fuels
62,261 60,978 -2% -
Greece Hard Coal 351 120 -66% - Yes Consistently low reporting of imports.
Greece Natural Gas
153,325 153,502 0% -
Spain Total Liquids
49,044 49,504 1% -
Spain Residual Fuel Oil
-5,470 -5,094 -7% - No Relatively small difference in bunkers.
Spain Solid Fuels
28,693 29,881 4% -
Spain Lignite 0 2,183 - Yes Annual data missing.
Spain Natural Gas
1,180,239 1,182,644 0% -
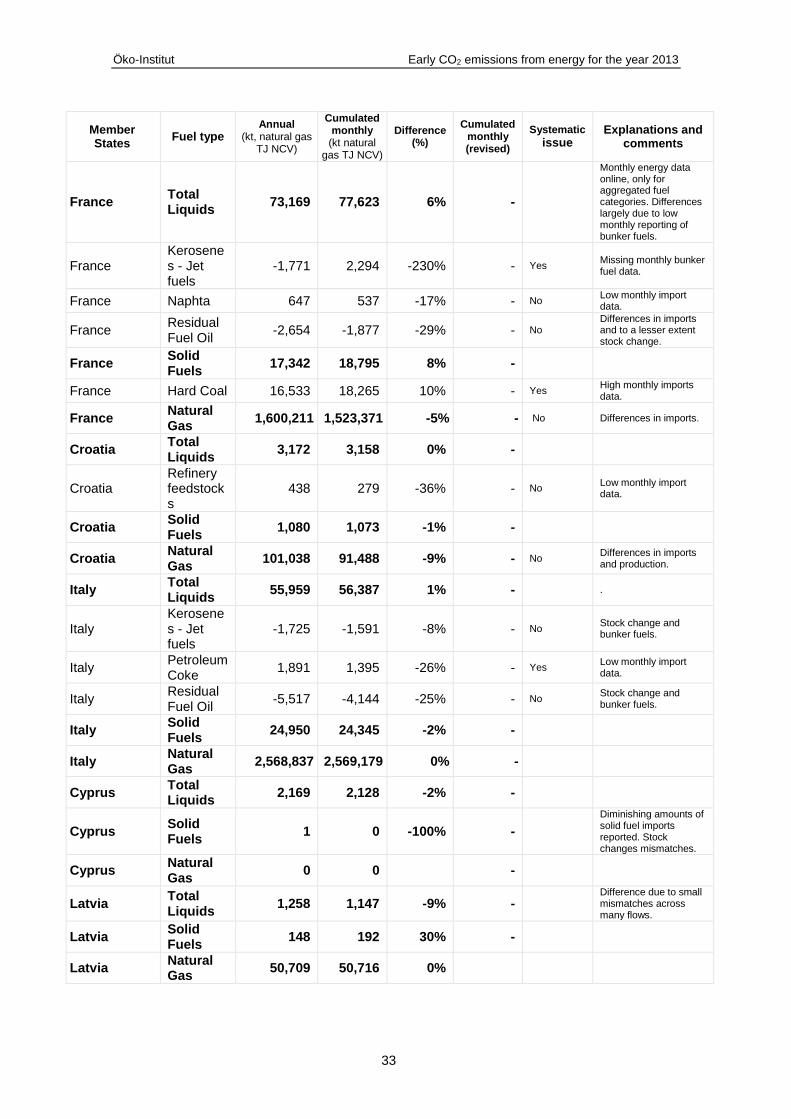
Öko-Institut Early CO2 emissions from energy for the year 2013
33
Member States
Fuel type Annual
(kt, natural gas TJ NCV)
Cumulated monthly
(kt natural gas TJ NCV)
Difference (%)
Cumulated monthly (revised)
Systematic issue
Explanations and comments
France Total Liquids
73,169 77,623 6% -
Monthly energy data online, only for aggregated fuel categories. Differences largely due to low monthly reporting of bunker fuels.
France Kerosenes - Jet fuels
-1,771 2,294 -230% - Yes Missing monthly bunker fuel data.
France Naphta 647 537 -17% - No Low monthly import data.
France Residual Fuel Oil
-2,654 -1,877 -29% - No Differences in imports and to a lesser extent stock change.
France Solid Fuels
17,342 18,795 8% -
France Hard Coal 16,533 18,265 10% - Yes High monthly imports data.
France Natural Gas
1,600,211 1,523,371 -5% - No Differences in imports.
Croatia Total Liquids
3,172 3,158 0% -
Croatia Refinery feedstocks
438 279 -36% - No Low monthly import data.
Croatia Solid Fuels
1,080 1,073 -1% -
Croatia Natural Gas
101,038 91,488 -9% - No Differences in imports and production.
Italy Total Liquids
55,959 56,387 1% - .
Italy Kerosenes - Jet fuels
-1,725 -1,591 -8% - No Stock change and bunker fuels.
Italy Petroleum Coke
1,891 1,395 -26% - Yes Low monthly import data.
Italy Residual Fuel Oil
-5,517 -4,144 -25% - No Stock change and bunker fuels.
Italy Solid Fuels
24,950 24,345 -2% -
Italy Natural Gas
2,568,837 2,569,179 0% -
Cyprus Total Liquids
2,169 2,128 -2% -
Cyprus Solid Fuels
1 0 -100% -
Diminishing amounts of solid fuel imports reported. Stock changes mismatches.
Cyprus Natural Gas
0 0 -
Latvia Total Liquids
1,258 1,147 -9% - Difference due to small mismatches across many flows.
Latvia Solid Fuels
148 192 30% -
Latvia Natural Gas
50,709 50,716 0%

Öko-Institut Early CO2 emissions from energy for the year 2013
34
Member States
Fuel type Annual
(kt, natural gas TJ NCV)
Cumulated monthly
(kt natural gas TJ NCV)
Difference (%)
Cumulated monthly (revised)
Systematic issue
Explanations and comments
Lithuania Total Liquids
2,255 2,242 -1% - For main fuel categories and flows.
Lithuania Solid Fuels
442 437 -1% -
Lithuania Natural Gas
111,119 111,118 0% -
Luxembourg Total Liquids
2,495 2,437 -2% -
Luxembourg Solid Fuels
92 90 -2% -
Luxembourg Natural Gas
44,006 43,857 0% -
Hungary Total Liquids
5,745 5,708 -1% - Difference due to small mismatches across many flows.
Hungary Solid Fuels
11,057 11,100 0% -
Hungary Hard Coal 1,853 1,497 -19% - Yes
Largely due to differences in reported import amounts and to a lesser extent to stock change data.
Hungary Natural Gas
347,753 358,854 3% -
Malta Total Liquids
772 1031 34% 765
Difference due to small mismatches across many flows.
Netherlands Total Liquids
29,517 28,973 -2%
Netherlands Solid Fuels
13,143 15,997 22%
Netherlands Hard Coal 12,790 15,926 25% - No Largely due to stock changes and also import and export flows.
Netherlands Natural Gas
1,372,878 1,367,72
3 0% -
Austria Total Liquids
11,483 12,706 11% 12,039
Largely due to differences in bunker fuels and imports of refinery feedstocks.
Austria Kerosenes - Jet fuels
-583 72 -112% 76 Yes Missing monthly bunker fuel data.
Austria Refinery feedstocks
84 759 804% 84 Yes
Largely due to differences in reported import amounts and to a lesser extent to stock change data.
Austria Solid Fuels
4,825 4,018 -17% - Largely due to the differences shown for Hard Coal.
Austria Hard Coal 3,564 2,779 -22% - No
Largely due to differences in reported import amounts and to a lesser extent to stock change data.
Austria Natural Gas
310,433 307,210 -1% -
Poland Total Liquids
23,714 23,329 -2% -
Poland Gas / Diesel Oil
979 519 -47% - No Low monthly import data.

Öko-Institut Early CO2 emissions from energy for the year 2013
35
Member States
Fuel type Annual
(kt, natural gas TJ NCV)
Cumulated monthly
(kt natural gas TJ NCV)
Difference (%)
Cumulated monthly (revised)
Systematic issue
Explanations and comments
Poland Solid Fuels
132,657 134,291 1% -
Poland Natural Gas
569,447 569,380 0% -
Portugal Total Liquids
8,913 9,457 6% - Difference largely due to missing bunker fuel data.
Portugal Kerosenes - Jet fuels
-749 -185 -75% - Yes Missing monthly bunker fuel data.
Portugal Refinery feedstocks
276 176 -36% - Yes Differences in imports
Portugal Solid Fuels
4,874 4,874 0% -
Portugal Natural Gas
164,651 168,567 2% 168,559
Romania Total Liquids
8,486 8,519 0% -
Romania Gas / Diesel Oil
797 691 -13% - No Stock changes.
Romania Solid Fuels
35,870 35,757 0% -
Romania Natural Gas
452,715 465,882 3% -
Slovenia Total Liquids
2,503 2,465 -2% -
Slovenia Solid Fuels
4,985 4,882 -2% -
Slovenia Hard Coal 438 1 -100% - Yes Low monthly import data.
Slovenia Lignite 4,512 4,880 8% - Yes High monthly imports data.
Slovenia Natural Gas
29,730 27,091 -9% - Yes Low monthly imports data.
Slovakia Total Liquids
3,132
3,062 -2% -
Difference largely due to missing monthly imports especially in Bitumen and Lubricants.
Slovakia Solid Fuels
6,982 7,029 1% -
Slovakia Natural Gas
182,768 225,478 23% - Yes High monthly imports data.
Finland Total Liquids
7,884 8,046 2% -
Exclusion of bunker fuels contributes most or all of the difference between annual and monthly data for total liquid fuels.
Finland Solid Fuels
11,336 11,593 2% -
Finland Natural Gas
125,819 125,385 0% -
Sweden Total Liquids
12,341 12,262 2% - Monthly energy data online.
Sweden Solid Fuels
3,659 3,131 -14% -

Öko-Institut Early CO2 emissions from energy for the year 2013
36
Member States
Fuel type Annual
(kt, natural gas TJ NCV)
Cumulated monthly
(kt natural gas TJ NCV)
Difference (%)
Cumulated monthly (revised)
Systematic issue
Explanations and comments
Sweden Hard Coal 2,776 2,247 -19% - No Stock changes.
Sweden Natural Gas
42,144 42,098 0% -
United Kingdom
Total Liquids
55,966 67,485 21% -
No aviation bunkers in monthly data. The exclusion of bunker fuels contributes most or all of the difference between annual and monthly data for total liquid fuels.
United Kingdom
Kerosenes - Jet fuels
-4,123 6,175 -250% - Yes Monthly data do not include international bunkers
United Kingdom
Gas / Diesel Oil
1,433 2,221 55% - Yes Monthly data do not include international bunkers
United Kingdom
Motor spirit
-4,266 -3,491 -18% - No High monthly imports data.
United Kingdom
LPG -845 -945 12% - No Low monthly import data.
United Kingdom
NGL 2,641 2,331 -12% - No Low monthly import data.
United Kingdom
Petroleum Coke
20 -124 -720% - No Low monthly import data.
United Kingdom
Solid Fuels
63,316 63,554 0% -
United Kingdom
Natural Gas
2,777,984 2,773,037 0% -
3.3 Comparison of Eurostat data with CRF data
This section provides comparisons of the annual Eurostat data and inventory CRF data
from the reference approach table 1.A(b) from UNFCCC submissions for fuel
consumption data of liquid, solid and gas fuel types for the years 2008-20123. The
comparison is based on physical units (kt) which are reported by Eurostat data and in
the CRF tables. As some Member States provide CRF tables only in TJ, CRF data for
these Member States was converted to physical units for the comparison with Eurostat
monthly and annual fuel consumption data using net calorific values from Member
States national inventory reports.
The evaluation compares the CRF data and annual Eurostat liquid, solid and gas fuel
consumption data for the years 2008 to 2012. The following sub-chapters summarize
large differences between annual Eurostat and CRF data for aggregate fuel categories
liquid, solid and gaseous fuels. A detailed analysis of the underlying differences for
specific fuels and flows for these differences is provided in Table 3-12. Table 8-5 in the
3
http://unfccc.int/national_reports/annex_i_ghg_inventories/national_inventories_submissions/items/8108.php

Öko-Institut Early CO2 emissions from energy for the year 2013
37
Annex provides a comparison of CRF data and annual Eurostat data for the three
aggregate fuel categories for all Member States.
3.3.1 Liquid fuels
In 2008, 17 Member States showed differences below 2 % between annual Eurostat
data and CRF data for liquid fuel consumption, constituting a share of 46 % of the total
EU-27 liquid fuel consumption. Differences above 5 % could be identified for 4 Member
States (see Table 3-9), adding up to a share of only 3 % of the EU-27 total liquid fuel
consumption.
In 2012, the last reporting year for which annual Eurostat and CRF data are available,
data differences between annual and CRF data below 2 % were found for 14 Member
States. Liquid fuel consumption of these 14 Member States accounts for 63 % of the
total EU-28 liquid fuel consumption. The number of Member States that have larger
differences of above 5 % increased to 7 Member States in 2012, making up a share of
29 % of the EU-28 total liquid fuel consumption.
So far, there has not been a systematic improvement of the consistency between
annual Eurostat fuel consumption and the fuel consumption reported in the CRF
reference approach table across all Member States. While the consistency improved in
Germany, Finland, Czech Republic, Cyprus, Poland and Romania, it deteriorated in the
case of Greece, France, Sweden, Hungary and Lithuania.

Öko-Institut Early CO2 emissions from energy for the year 2013
38
Table 3-9 Difference in liquid fuel consumption between CRF and annual Eurostat
data, 2008-2012
Member States
2008 2009 2010 2011 2012
Share of
emissions from
liquid fuels in
total energy
CO2 emissions
(%) in 2012
Belgium -1% 1% 2% -1% 0% 49%
Bulgaria 1% 0% -1% 0% 1% 24%
Czech Republic 2% 1% 1% 3% 0% 21%
Denmark 1% 6% -13% -3% 2% 49%
Germany 3% 3% 1% 0% -1% 35%
Estonia 452% 5% -6% -1% 8% 7%
Ireland -9% -18% 2% -2% 7% 46%
Greece 0% -4% -2% -7% 7% 41%
Spain 0% 0% 2% 2% 1% 51%
France -3% 2% -4% -4% -5% 60%
Croatia NE NE NE -3% 0% 57%
Italy -5% -7% -5% -4% -5% 43%
Cyprus 7% 5% 1% 0% 2% 100%
Latvia 0% 0% -3% 1% 3% 53%
Lithuania -1% -5% -8% -8% -7% 60%
Luxembourg -2% -2% 0% 1% 4% 73%
Hungary -1% 1% -1% -6% -1% 30%
Malta NE -7% 3% 34% -11% 100%
Netherlands 2% 3% 1% 3% -1% 33%
Austria -1% -1% -4% -1% 0% 51%
Poland -2% -1% -2% 0% 0% 22%
Portugal -2% -2% 1% 3% -3% 55%
Romania -15% -9% 8% 3% -1% 29%
Slovenia 4% -1% 1% 2% 1% 49%
Slovakia -2% -1% -1% -1% -2% 27%
Finland 4% 4% -5% 2% 2% 47%
Sweden 1% -7% 3% 6% 4% 79%
United Kingdom 0% 1% 0% -1% -2% 35%
EU 15 -1% 0% -1% -1% -2%
EU 27 /28 1% 0% 1% 1% -1%
<+/- 2% 17 MS 14 MS 14 MS 13 MS 14 MS
+/-2-5% 6 MS 5 MS 8 MS 10 MS 7 MS
> +/- 5% 4 MS 8 MS 5 MS 5 MS 7 MS
Note: Data for Croatia is included from 2011 onwards.
NE is used for countries where cumulated monthly data could not be estimated, as
they were available or are incomplete.
CRF inventory data = 100 %, a positive value indicates that annual Eurostat data is
higher than CRF inventory data, a negative value indicates that annual Eurostat
data is lower than CRF inventory data.
Öko-Institut Early CO2 emissions from energy for the year 2013
39
3.3.2 Solid fuels
In 2008 14 Member States showed differences below 2 % between annual Eurostat
data and CRF data for solid fuel consumption, making up a share of 76 % of the total
EU-27 solid fuel consumption.
Differences above 5 % could be identified for 10 Member States (see Table 3-10),
which add up to a share of 18 % of the EU-27 total solid fuel consumption.
In 2012, the last reporting year for which annual Eurostat and CRF data are available,
data differences between annual and CRF data below 2 % could be found for 21
Member States. Nevertheless, the solid fuel consumption of these 21 Member States
account only for 57 % of the total EU-28 solid fuel consumption. The reason for this
relatively low share in the total solid fuel consumption is the fact that Germany is not
amongst these 19 Member States. For Germany the difference in reporting between
annual Eurostat and CRF data amounts to 5 %. The solid fuel consumption of
Germany accounts for 31 % of the total solid fuel consumption of the EU 28. The
number of Member States that have larger differences of above 5 % decreased to 4
Member States in 2012 with a share of only 5 % of EU-28 total solid fuel consumption.
Thus, in terms of the number of Member States with lower differences between annual
Eurostat data and CRF data the situation improved.

Öko-Institut Early CO2 emissions from energy for the year 2013
40
Table 3-10 Difference in solid fuel consumption between CRF and annual Eurostat
data, 2008-2012
Member States 2008 2009 2010 2011 2012
Share of
emissions from
solid fuels in
total energy
CO2 emissions
(%) in 2012
Belgium 0% -3% -1% 0% 1% 13%
Bulgaria 1% 6% 0% 0% 0% 65%
Czech Republic 1% 1% 1% -1% -3% 63%
Denmark -7% -7% -8% -8% -11% 30%
Germany 0% 0% -1% 0% 5% 43%
Estonia 0% 1% 0% 0% 0% 86%
Ireland 10% 0% -1% 0% 7% 27%
Greece 0% 0% 1% 0% 0% 49%
Spain 0% 0% 0% 0% 0% 23%
France -11% -4% -9% -10% -11% 14%
Croatia NE NE NE 0% 0% 15%
Italy 2% 1% 1% 1% 2% 17%
Cyprus 60% 68% 4% 8% 0%
Latvia 0% 2% 6% 8% 0% 5%
Lithuania 10% 9% 8% 2% 4% 8%
Luxembourg 18% -49% 0% 0% 0% 2%
Hungary -10% -5% -8% -6% 0% 26%
Malta NO NO NO NO NO
Netherlands -1% -1% -1% -1% -5% 20%
Austria 3% 0% 0% 0% 0% 21%
Poland -1% -1% 3% -1% -1% 69%
Portugal 0% 0% 0% 2% 1% 24%
Romania 8% 9% 1% 3% 0% 38%
Slovenia 0% 0% 0% 0% 0% 40%
Slovakia -1% -1% 4% -1% -1% 37%
Finland -5% -2% 0% -1% 1% 38%
Sweden 13% 6% 5% 10% -4% 15%
United Kingdom 5% 14% -1% -1% -1% 32%
EU 15 0% 1% -1% -1% 2%
EU 27 /28 0% -1% 0% 1% -1%
<+/- 2% 14 MS 15 MS 18 MS 21 MS 21 MS
+/-2-5% 3 MS 4 MS 4 MS 1 MS 3 MS
> +/- 5% 10 MS 8 MS 5 MS 6 MS 4 MS Note: Data for Croatia is included from 2011 onwards.
NE is used for countries where cumulated monthly data could not be estimated, as
they were not available or are incomplete.
NO is reported if there is no solid fuel consumption in the country.
CRF inventory data = 100 %, a positive value indicates that annual Eurostat data is
higher than CRF inventory data, a negative value indicates that annual Eurostat
data is lower than CRF inventory data.

Öko-Institut Early CO2 emissions from energy for the year 2013
41
3.3.3 Gaseous fuels
In 2008 22 Member States showed differences below 2% between annual Eurostat and
CRF data for monthly natural gas consumption, contributing with a share of 82% to EU-
27 total natural gas consumption. Differences above 5% could be identified for Estonia
(see Table 3-11), adding up to a share of only 0.2% of EU-27 total natural gas
consumption.
In 2012, the last reporting year for which annual Eurostat and CRF data are available,
data differences between annual and CRF data below 2% were found for 24 Member
States. The natural gas consumption of these 24 Member States accounts for 99% of
the total EU-28 natural gas consumption. For 2012 there are no differences above 5%
between annual Eurostat data and CRF data.
Hence, the consistency between annual Eurostat data and the fuel consumption
reported in the CRF reference approach tables improved in the case of natural gas.

Öko-Institut Early CO2 emissions from energy for the year 2013
42
Table 3-11 Difference between natural gas consumption in CRF and annual
Eurostat data, 2008-2012
Member States 2008 2009 2010 2011 2012
Share of
emissions from
natural gas in
total energy
CO2 emissions
(%) in 2012
Belgium 0% 0% 0% -1% 0% 38%
Bulgaria 1% 0% -3% 0% 0% 11%
Czech Republic 0% 0% 0% 0% 0% 16%
Denmark 0% 0% 0% 0% 0% 22%
Germany 4% 9% 0% -1% -1% 22%
Estonia 18% 3% 0% -1% 3% 7%
Ireland 0% -1% 0% 0% 0% 27%
Greece 3% 2% 1% 2% 2% 9%
Spain 0% 0% 0% 0% 0% 26%
France 0% 0% -1% 5% 0% 26%
Croatia NA NA NA 11% -1% 28%
Italy 0% 0% 0% 0% 0% 40%
Cyprus NO NO NO NO NO
Latvia 0% 0% 0% 0% 0% 42%
Lithuania 0% 0% 27% 0% 0% 32%
Luxembourg 0% 0% 0% 0% 0% 25%
Hungary 0% 0% 0% 0% 0% 44%
Malta NO NO NO NO NO
Netherlands 0% 0% 0% 0% 0% 47%
Austria -1% -5% -1% -1% 0% 28%
Poland 0% -2% 0% 0% 0% 9%
Portugal 0% 0% 0% -1% 0% 20%
Romania 0% 0% 0% 0% 0% 33%
Slovenia 0% 0% 0% 0% 0% 11%
Slovakia 0% 0% 0% 0% 0% 35%
Finland 0% 0% 0% 0% 0% 14%
Sweden 1% 12% -10% 0% 0% 6%
United Kingdom 0% 0% 0% 0% 0% 33%
EU 15 1% 2% 0% 0% 0%
EU 27 /28 -1% -1% 0% 0% 0%
<+/- 2% 22 MS 19 MS 22 MS 24 MS 24 MS
+/-2-5% 2 MS 3 MS 1 MS 1 MS 2 MS
> +/- 5% 1 MS 3 MS 2 MS 1 MS 0 MS
Note: Data for Croatia is included from 2011 onwards.
NE is used for countries where cumulated monthly data could not be estimated, as
they were been available or are incomplete.
NO is reported if there is no solid fuel consumption in the country.
CRF inventory data = 100%, a positive value indicates that annual Eurostat data is
higher than CRF inventory data, a negative value indicates that annual Eurostat
data is lower than CRF inventory data.
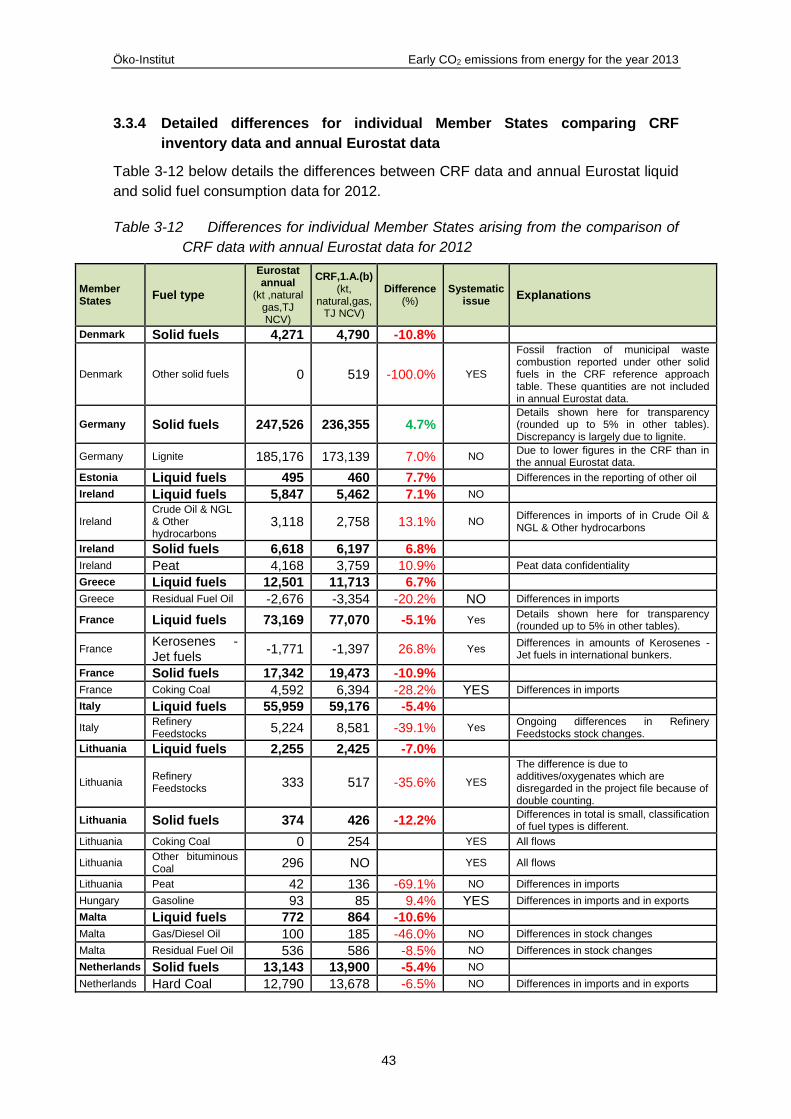
Öko-Institut Early CO2 emissions from energy for the year 2013
43
3.3.4 Detailed differences for individual Member States comparing CRF
inventory data and annual Eurostat data
Table 3-12 below details the differences between CRF data and annual Eurostat liquid
and solid fuel consumption data for 2012.
Table 3-12 Differences for individual Member States arising from the comparison of
CRF data with annual Eurostat data for 2012
Member States
Fuel type
Eurostat annual
(kt ,natural gas,TJ NCV)
CRF,1.A.(b) (kt,
natural,gas,TJ NCV)
Difference (%)
Systematic issue
Explanations
Denmark Solid fuels 4,271 4,790 -10.8%
Denmark Other solid fuels 0 519 -100.0% YES
Fossil fraction of municipal waste combustion reported under other solid fuels in the CRF reference approach table. These quantities are not included in annual Eurostat data.
Germany Solid fuels 247,526 236,355 4.7% Details shown here for transparency (rounded up to 5% in other tables). Discrepancy is largely due to lignite.
Germany Lignite 185,176 173,139 7.0% NO Due to lower figures in the CRF than in the annual Eurostat data.
Estonia Liquid fuels 495 460 7.7% Differences in the reporting of other oil
Ireland Liquid fuels 5,847 5,462 7.1% NO
Ireland Crude Oil & NGL & Other hydrocarbons
3,118 2,758 13.1% NO Differences in imports of in Crude Oil & NGL & Other hydrocarbons
Ireland Solid fuels 6,618 6,197 6.8%
Ireland Peat 4,168 3,759 10.9% Peat data confidentiality
Greece Liquid fuels 12,501 11,713 6.7%
Greece Residual Fuel Oil -2,676 -3,354 -20.2% NO Differences in imports
France Liquid fuels 73,169 77,070 -5.1% Yes Details shown here for transparency (rounded up to 5% in other tables).
France Kerosenes - Jet fuels
-1,771 -1,397 26.8% Yes Differences in amounts of Kerosenes - Jet fuels in international bunkers.
France Solid fuels 17,342 19,473 -10.9%
France Coking Coal 4,592 6,394 -28.2% YES Differences in imports
Italy Liquid fuels 55,959 59,176 -5.4%
Italy Refinery Feedstocks
5,224 8,581 -39.1% Yes Ongoing differences in Refinery Feedstocks stock changes.
Lithuania Liquid fuels 2,255 2,425 -7.0%
Lithuania Refinery Feedstocks
333 517 -35.6% YES
The difference is due to additives/oxygenates which are disregarded in the project file because of double counting.
Lithuania Solid fuels 374 426 -12.2% Differences in total is small, classification of fuel types is different.
Lithuania Coking Coal 0 254 YES All flows
Lithuania Other bituminous Coal
296 NO YES All flows
Lithuania Peat 42 136 -69.1% NO Differences in imports
Hungary Gasoline 93 85 9.4% YES Differences in imports and in exports
Malta Liquid fuels 772 864 -10.6%
Malta Gas/Diesel Oil 100 185 -46.0% NO Differences in stock changes
Malta Residual Fuel Oil 536 586 -8.5% NO Differences in stock changes
Netherlands Solid fuels 13,143 13,900 -5.4% NO
Netherlands Hard Coal 12,790 13,678 -6.5% NO Differences in imports and in exports

Öko-Institut Early CO2 emissions from energy for the year 2013
44
Individual fuels are included for those Member States for which the differences are
greater than 5 %. Sub-rows by fuel type are included when these contribute to an
explanation for the differences.
3.4 Comparison of monthly Eurostat data with early national statistics
For calculating reliable early CO2 emissions for 2013 the quality of the 2012 and the
2013 monthly Eurostat data is essential. 2012 monthly data could already be analysed
by comparing monthly Eurostat data with annual Eurostat data and CRF inventory data
for the year 2012, but the quality of the 2013 monthly Eurostat data has only been
analysed in terms of completeness, gaps and outliers (see chapter 3.1). There are only
a few data sources available that provide data 4 month after the reference year that
can be used to check the quality of the monthly Eurostat data for 2013. Early national
statistics can be used to cross-check the quality of Eurostat monthly data 2013.
This chapter provides a comparison of the trend changes from early national statistics
and cumulated monthly fuel consumption data of liquid, solid and gas fuel types
provided by Eurostat. Some Member States make their early national energy statistics
available on national websites (the references to these websites are documented in
section 7 References). These statistics are published in different ways. Some Member
States provide detailed information on individual fuel types and flows, while on other
websites only the gross inland consumption for aggregated fuel categories is available.
Therefore, the comparison of the different data sources is based on the trend changes.
For the trend change of the year 2013/2012 early national statistics could be found for
20 Member States. For most of these Member States there is a good correlation for the
trend change of monthly Eurostat data and early national energy statistics below +/-
2%.
The results of the detailed comparisons are presented in Table 3-13.

Öko-Institut Early CO2 emissions from energy for the year 2013
45
Table 3-13 Comparison of trend changes for fuel categories between Eurostat
aggregated monthly data and early national statistics for the years
2013/2012 for individual Member States
Member States
Early
national
statistics
Eurostat
monthly
data Difference
Early
national
statistics
Eurostat
monthly
data Difference
Early
national
statistics
Eurostat
monthly
data Difference
Bulgaria 93% 96% -3% 87% 85% 2% 97% 104% -8%
Czech Republic 95% 97% -2% 97% 96% 2% 101% 103% -2%
Denmark 99% 100% -1% 129% 127% 3% 94% 101% -7%
Germany 102% 102% 0% 101% 99% 2% 111% 109% 2%
Estonia 63% 38% 25% 109% 108% 1% 103% 102% 1%
Ireland 101% 102% -1% 89% 85% 4% 100% 97% 3%
Spain 98% 93% 5% 68% 68% 0% 93% 92% 0%
France 99% 93% 6% 108% 107% 1% 101% 103% -2%
Italy 94% 95% -1% 88% 89% -2% 95% 94% 1%
Latvia 99% 96% 3% 86% 69% 18% 99% 99% 0%
Lithuania 94% 98% -3% 116% 117% -1% 82% 81% 0%
Luxembourg 105% 100% 5% 89% 84% 5% 85% 85% 0%
Netherlands 98% 96% 2% 99% 81% 19% 102% 102% 0%
Austria 102% 97% 6% 101% 111% -10% 94% 95% 0%
Portugal 98% 112% -14% 93% 91% 2% 96% 96% 0%
Romania 98% 95% 3% 74% 72% 2% 96% 92% 4%
Slovenia 94% 88% 6% 96% 83% 13% 97% 107% -9%
Finland 96% 89% 6% 106% 98% 8% 93% 95% -1%
Sweden 99% 94% 4% 104% 104% 1% 94% 95% -1%
United Kingdom 98% 98% 1% 94% 96% -2% 99% 99% 0%
Liquid fuels Solid fuels Gaseous fuels
Trend changes 2013/2012 Trend changes 2013/2012 Trend changes 2013/2012
For some countries the comparison between monthly Eurostat data and early national
statistics showed large discrepancies between the trend changes of the aggregated
fuel categories. For Austria the trend changes calculated with early national statistics
showed an increase of 2 % for the year 2013 in comparison to the year 2012, while
trend changes calculated with monthly Eurostat data showed a decreasing trend of -3%
for 2013 in comparison to 2012.
As far as detailed data for early national statistics were available, the large differences
have been analysed (see Annex 8.3). The comparison of the trend changes is used as
an indication of the quality of the 2013 data and also a check of the consistency in
reporting between 2012 and 2013 monthly Eurostat data. The detailed analysis
identifies the need for correcting 2012 monthly Eurostat data (as available in April
2013) for some countries, as the quality of the monthly Eurostat data leads to
discrepancies in the trend changes. When the reporting of the 2013 monthly Eurostat
data has improved, it may no longer be consistent with the reporting of the 2012
monthly Eurostat data (as available in April 2013) which may have a strong influence
on the trend changes.

Öko-Institut Early CO2 emissions from energy for the year 2013
46
4 Early CO2 estimates for the year 2013
4.1 Data improvements to correct trend changes of monthly Eurostat data
As the previous chapters have shown, the quality of the monthly Eurostat data in the
case of some countries is not sufficient to produce reliable early CO2 estimates for the
year 2013. In order to improve the early CO2 estimates and for them to be closer to the
final CRF inventory estimates of the reference approach, the trend changes of the
monthly Eurostat data had to be improved for some countries by correcting 2012
monthly Eurostat data (as available in April 2013).
For improving the trend changes that were used to calculate 2013 CO2 emissions,
different options were used:
1. Some countries provided Eurostat with revised monthly data for the year 2012
in the year 2014. This updated monthly data has been used wherever available
(see Table 3-8).
2. For countries that did not provide updated monthly data, but for which monthly
data showed stronger inconsistencies or for which trend changes were
obviously strange, annual data has been used to replace monthly 2012 data
(see Annex Table 8-14).
3. For some countries calculated trend changes in physical units (kt) and
calculated trend changes in energy units (TJ) showed large inconsistencies.
This is due to countries that changed the share of consumption between solid
fuel categories with different net calorific values (NCVs). For the 2013
calculation, trend changes calculated with energy units have been used for
Finland and Hungary (see Section 4.1.2).
4.1.1 Corrections for 2012 monthly data to estimate 2013 CO2 emissions
In April 2014 a new extraction from Eurostat’s production database of 2012 monthly
data was performed. According to this extraction updated/revised monthly 2012 data
were available for 7 Member States: Austria (liquid fuels), Belgium (natural gas),
Germany (liquid fuels and natural gas), Denmark (liquid fuels and natural gas), Malta
(liquid fuels), Poland (liquid fuels) and Portugal (natural gas) (see Table 8-13). To
calculate the early estimates for 2013 the updated monthly 2012 data were used.
A refinement of the methodological approach was recommended for those Member
States for which accumulated monthly energy data showed large deviations from
annual Eurostat data. In these cases it was recommended that monthly Eurostat data
for the year T-2 should be replaced by annual Eurostat data. However, these
corrections should be made only for selected Member States:
(1) When the data for year T-2 show strong deviations between monthly Eurostat data
and CRF data, and much better consistency between Eurostat annual data and CRF
data;
Öko-Institut Early CO2 emissions from energy for the year 2013
47
(2) If such strong deviations occur in the same way for all fuel categories or for those
fuel categories that dominate the emission estimation.
Such a procedure was recommended for the 2013 early estimates for Austria, France,
Estonia and the Netherlands.
For Austria the consumption of hard coal was corrected by using annual data for 2012.
This changed the trend 2013/2012 in total solid fuel consumption from 111 % to 93 %.
The same procedure was applied for hard coal consumption in the Netherlands, which
changed the trend for total solid fuel consumption between 2013 and 2012 from 81 %
to 100 %.
France improved the reporting of international bunkers from jet kerosene in its monthly
data for 2013. As reporting of international bunkers in monthly 2012 data was not
complete for 2012, the annual data reported for international bunkers were used to
correct the trend change. This changed the trend change for total liquid fuel
consumption for 2013/2012 from 83 % to 105 %.
For Estonia large differences in reporting between 2012 annual and monthly Eurostat
data can be found for other hydrocarbons (which represents shale oil in this case) and
residual fuel oil. As the monthly reporting was improved in 2013 and is more consistent
with annual 2012 than with monthly 2012, the annual 2012 data for total liquid fuel
consumption was used to calculate the trend change between 2013/2012. The trend
change applied was 67% for total liquid fuel consumption instead of 38 %.
A table with a detailed analysis of the replacement with annual data is provided in the
Annex (see Table 8-14).
4.1.2 Calculation in physical units or energy units
The annual trend change between 2013 and 2012 used to calculate early CO2
estimates was calculated based on Eurostat monthly data in physical units.
Uncertainties arise from this approach if different individual fuels are related to different
NCVs and carbon contents and therefore the impact on emissions is not only related to
the physical quantity of the fuels. A modified approach (as described in 2.1.4) was used
in which, as a first step, Eurostat fuel consumption data were converted from physical
units into energy units (TJ) for all Member States based on MS NCVs used in 2014
GHG inventories (i.e. NCV reported by the MS themselves) and, in a second step, the
trend change relative to the previous year was calculated based on the fuel
consumption in energy units. For most countries the results for the CO2 emissions were
very similar (see Table 8-3 in the Annex).
There was however a substantial difference for Finland: The trend change for solid
fuels based on physical units leads to a decrease of 2.2 % in consumption whereas the
trend change based on TJ units resulted in an increase of 7.8 %. This difference is due
to the change in peat and hard coal use in Finland from 2012 to 2013 combined with
the considerably different NCVs for both fuels. Peat use decreased by around 20 % (-
1390 kt) from 2012 to 2013, while the use of hard coal increased by around 24 %

Öko-Institut Early CO2 emissions from energy for the year 2013
48
(+1077 kt). In this rather extreme case, it is clear that looking solely at physical units
would give a distorted picture and therefore the trend change has to be based on
energy units.
Table 4-1 Solid fuel consumption for 2012 and 2013 in kt and TJ for Finland
Trend change Trend change
2012 2013 2013/2012 2012 2013 2013/2012
% %
Total solid
fuel11,593 11,337 98% 193,202 208,228 108%
Hard Coal* 4,573 5,650 124% 116,612 144,075 124%
Peat** 6,704 5,314 79% 67,710 53,671 79%
Coke
Oven/Gas
Coke***
316 373 118% 8,880 10,481 118%
*NCV of 25.5 is used for Hard Coal as conversion factor
**NCV of 10.2 is used for Peat as conversion factor
***NCV of 28.1 is used for Coke Oven/Gas Coke as conversion factor
FuelEurostat monthly data
kt
Eurostat monthly data
TJ
The same approach was used for Hungary where the trend change calculated based
on energy units also showed a larger difference for solid fuels.
Table 4-2 Solid fuel consumption for 2012 and 2013 in kt and TJ for Hungary
Trend change Trend change
2012 2013 2013/2012 2012 2013 2013/2012
% %
Total solid
fuel11,100 10,796 97% 103,170 93,190 90%
Hard Coal* 1,497 1,330 89% 37,275 33,117 89%
Lignite** 9,893 9,985 101% 74,198 74,888 101%
BKB*** 10 6 60% 247 148 60%
Coke
Oven/Gas
Coke****
-300 -525 175% -8,550 -14,963 175%
*NCV of 24.9 is used for Hard Coal as conversion factor
**NCV of 7.5 is used for Lignite as conversion factor
***NCV of 24.7 is used for BKB as conversion factor
****NCV of 28.5 is used for Coke Oven/Gas Coke as conversion factor
kt TJ
FuelEurostat monthly data Eurostat monthly data

Öko-Institut Early CO2 emissions from energy for the year 2013
49
4.1.3 Results for corrected trend changes
The following table provides an overview of how the revised trend changes correlate
with trend changes from early national statistics.
Table 4-3 Comparison of trend changes and differences from revised Eurostat monthly
2012 data and early national statistics for the year 2013/2012 for individual
Member States
Member State
Early
national
statistics
Eurostat
monthly
data Difference
Early
national
statistics
Eurostat
monthly
data Difference
Early
national
statistics
Eurostat
monthly
data Difference
Belgium - 101% - 99% - 180%
Belgium revised* 99%
Bulgaria 93% 96% -3% 87% 85% 2% 97% 104% -8%
Czech Republic 95% 97% -2% 97% 96% 2% 101% 103% -2%
Denmark 99% 100% -1% 129% 127% 3% 94% 101% -7%
Denmark revised* 96% -1%
Germany 102% 102% 0% 101% 99% 2% 111% 109% 2%
Germany revised* 101% 1% 108% 3%
Estonia 63% 38% 25% 109% 108% 1% 103% 102% 1%
Estonia revised** 67% -3%
Ireland 101% 102% -1% 89% 85% 4% 100% 97% 3%
Spain 98% 93% 5% 68% 68% 0% 93% 92% 0%
France 99% 93% 6% 108% 107% 1% 101% 103% -2%
France revised** 98% 1%
Italy 94% 95% -1% 88% 89% -2% 95% 94% 1%
Cyprus 0% 0% 0%
Latvia 99% 96% 3% 86% 69% 18% 99% 99% 0%
Lithuania 94% 98% -3% 116% 117% -1% 82% 81% 0%
Luxembourg 105% 100% 5% 89% 84% 5% 85% 85% 0%
Netherlands 98% 96% 2% 99% 81% 19% 102% 102% 0%
Netherlands revised** 100% -1%
Austria 102% 97% 6% 101% 111% -10% 94% 95% 0%
Austria revised*,** 102% 0% 93% 8%
Portugal 98% 112% -14% 93% 91% 2% 96% 96% 0%
Romania 98% 95% 3% 74% 72% 2% 96% 92% 4%
Slovenia 94% 88% 6% 96% 83% 13% 97% 107% -9%
Finland 96% 89% 6% 106% 98% 8% 93% 95% -1%
Finland revised*** 108% -2%
Sweden 99% 94% 4% 104% 104% 1% 94% 95% -1%
United Kingdom 98% 98% 1% 94% 96% -2% 99% 99% 0%
Liquid fuels Solid fuels Gaseous fuels
Note: * Countries submitted new monthly data for 2012 to Eurostat in the year 2014.
** Annual Eurostat data was used instead of monthly Eurostat data for the year 2012.
*** Trend changes in TJ were used instead of trend changes in kt.
Due to the revision of Eurostat monthly 2012 data the trend changes could be
improved and correlate more closely with early national statistics for some countries.
As no detailed data was available to analyse large differences for Bulgaria, Latvia,

Öko-Institut Early CO2 emissions from energy for the year 2013
50
Portugal and Slovenia, no corrections were applied and original Eurostat monthly data
was used for calculating early CO2 estimates for the year 2013.
4.1.4 Corrections applied to Eurostat monthly data 2012 and 2013
For Ireland peat consumption data are missing in the Eurostat monthly database for
the year 2013 for confidentiality reasons. However, peat deliveries to main activity
producer power plants are reported on a monthly basis. This figure is used to estimate
the peat consumption, assuming that peat delivered to power plants represents about
70 % of the total peat consumption. This ratio was derived from annual data of past
years (2008-2012) for which peat consumption is available.
For Ireland hard coal consumption data in the Eurostat monthly database are much
lower than annual Eurostat data also for confidentiality reasons. This resulted in
improbably low CO2 estimates for Ireland. Similar to the approximation of peat
consumption, the reported deliveries to main activity producer power plants were used
for hard coal instead of the reported monthly hard coal consumption data. It was
assumed that this consumption represents about 80 % of the total hard coal
consumption. This ratio was derived from previous data (2008-2012) for which hard
coal consumption is available in annual data.
4.2 Results for 2013
The following steps were taken to calculate early CO2 emissions for 2013:
1. Calculation of trend changes of the fuel consumption for the aggregated fuel
categories (liquid, solid and natural gas) from monthly Eurostat data 2012 and
2013;
2. Calculation of CO2 emissions for the three fuel categories by multiplying the
trend changes with the CO2 emissions of the CRF inventory figures of the
Reference Approach for the year 2012 (as available in April 2014).
Table 4-4 and Table 4-5 show the calculation of the early CO2 emissions according to
the different steps.
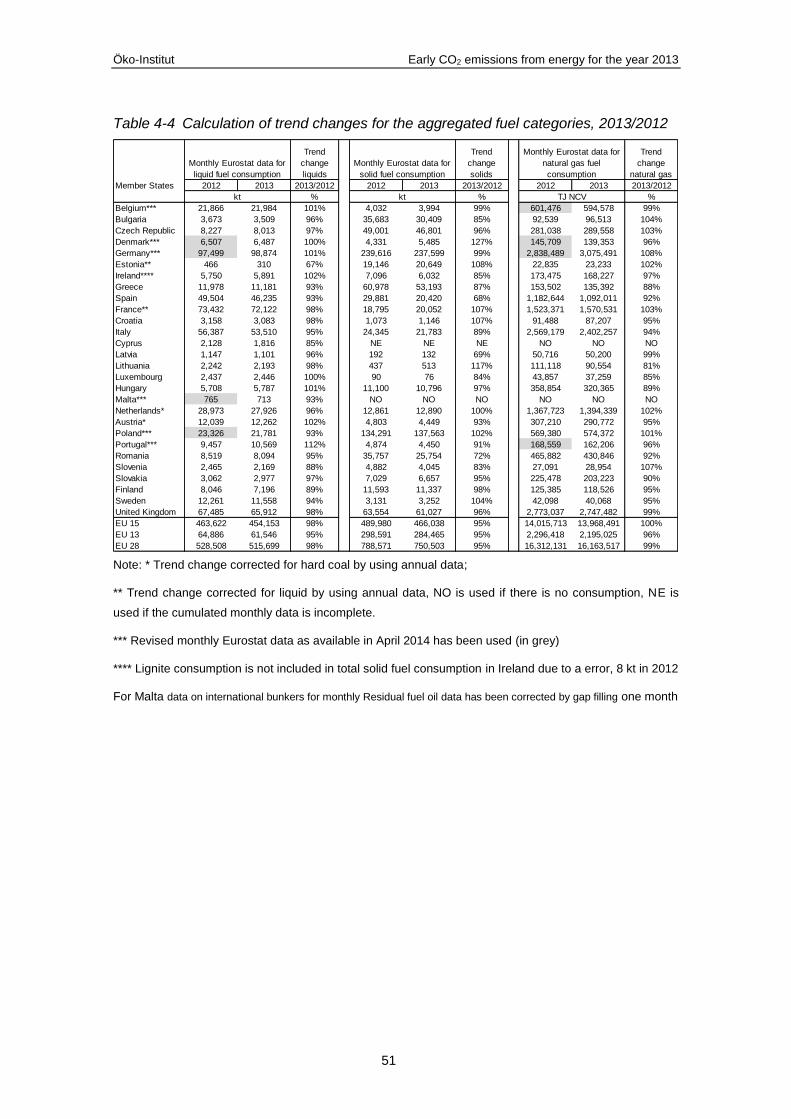
Öko-Institut Early CO2 emissions from energy for the year 2013
51
Table 4-4 Calculation of trend changes for the aggregated fuel categories, 2013/2012
Trend
change
liquids
Trend
change
solids
Trend
change
natural gas
Member States 2012 2013 2013/2012 2012 2013 2013/2012 2012 2013 2013/2012
% % %
Belgium*** 21,866 21,984 101% 4,032 3,994 99% 601,476 594,578 99%
Bulgaria 3,673 3,509 96% 35,683 30,409 85% 92,539 96,513 104%
Czech Republic 8,227 8,013 97% 49,001 46,801 96% 281,038 289,558 103%
Denmark*** 6,507 6,487 100% 4,331 5,485 127% 145,709 139,353 96%
Germany*** 97,499 98,874 101% 239,616 237,599 99% 2,838,489 3,075,491 108%
Estonia** 466 310 67% 19,146 20,649 108% 22,835 23,233 102%
Ireland**** 5,750 5,891 102% 7,096 6,032 85% 173,475 168,227 97%
Greece 11,978 11,181 93% 60,978 53,193 87% 153,502 135,392 88%
Spain 49,504 46,235 93% 29,881 20,420 68% 1,182,644 1,092,011 92%
France** 73,432 72,122 98% 18,795 20,052 107% 1,523,371 1,570,531 103%
Croatia 3,158 3,083 98% 1,073 1,146 107% 91,488 87,207 95%
Italy 56,387 53,510 95% 24,345 21,783 89% 2,569,179 2,402,257 94%
Cyprus 2,128 1,816 85% NE NE NE NO NO NO
Latvia 1,147 1,101 96% 192 132 69% 50,716 50,200 99%
Lithuania 2,242 2,193 98% 437 513 117% 111,118 90,554 81%
Luxembourg 2,437 2,446 100% 90 76 84% 43,857 37,259 85%
Hungary 5,708 5,787 101% 11,100 10,796 97% 358,854 320,365 89%
Malta*** 765 713 93% NO NO NO NO NO NO
Netherlands* 28,973 27,926 96% 12,861 12,890 100% 1,367,723 1,394,339 102%
Austria* 12,039 12,262 102% 4,803 4,449 93% 307,210 290,772 95%
Poland*** 23,326 21,781 93% 134,291 137,563 102% 569,380 574,372 101%
Portugal*** 9,457 10,569 112% 4,874 4,450 91% 168,559 162,206 96%
Romania 8,519 8,094 95% 35,757 25,754 72% 465,882 430,846 92%
Slovenia 2,465 2,169 88% 4,882 4,045 83% 27,091 28,954 107%
Slovakia 3,062 2,977 97% 7,029 6,657 95% 225,478 203,223 90%
Finland 8,046 7,196 89% 11,593 11,337 98% 125,385 118,526 95%
Sweden 12,261 11,558 94% 3,131 3,252 104% 42,098 40,068 95%
United Kingdom 67,485 65,912 98% 63,554 61,027 96% 2,773,037 2,747,482 99%
EU 15 463,622 454,153 98% 489,980 466,038 95% 14,015,713 13,968,491 100%
EU 13 64,886 61,546 95% 298,591 284,465 95% 2,296,418 2,195,025 96%
EU 28 528,508 515,699 98% 788,571 750,503 95% 16,312,131 16,163,517 99%
Monthly Eurostat data for
liquid fuel consumption
Monthly Eurostat data for
solid fuel consumption
Monthly Eurostat data for
natural gas fuel
consumption
kt kt TJ NCV
Note: * Trend change corrected for hard coal by using annual data;
** Trend change corrected for liquid by using annual data, NO is used if there is no consumption, NE is
used if the cumulated monthly data is incomplete.
*** Revised monthly Eurostat data as available in April 2014 has been used (in grey)
**** Lignite consumption is not included in total solid fuel consumption in Ireland due to a error, 8 kt in 2012
For Malta data on international bunkers for monthly Residual fuel oil data has been corrected by gap filling one month

Öko-Institut Early CO2 emissions from energy for the year 2013
52
Table 4-5 Calculation of early CO2 emissions for the year 2013
Member States
CRF Inventory
data CO2
emissions
from liquid
fuels
(submission
2014)
Trend
change
liquids
CO2
emissions
liquid fuels
calculated
with monthly
Eurostat data
CRF Inventory
data CO2
emissions
from solid
fuels
(submission
2014)
Trend
change
solids
CO2
emissions
solid fuels
calculated
with monthly
Eurostat data
CRF Inventory
data CO2
emissions from
natural gas
(submission
2014)
Trend
change
natural
gas
CO2
emissions
natural gas
calculated
with monthly
Eurostat data
Total CO2
emissions
calculated with
monthly
Eurostat data
2012 2013/2012 2013 2012 2013/2012 2013 2012 2013/2012 2013 2013
kt CO2 % kt CO2 kt CO2 % kt CO2 kt CO2 % kt CO2 kt CO2
Belgium 42,836 101% 43,067 11,332 99% 11,225 33,463 99% 33,080 87,372
Bulgaria 10,988 96% 10,497 30,023 85% 25,585 5,261 104% 5,487 41,570
Czech Republic 20,763 97% 20,223 62,843 96% 60,022 15,773 103% 16,252 96,497
Denmark 18,277 100% 18,221 11,192 127% 14,174 8,184 96% 7,827 40,222
Germany 260,892 101% 264,571 319,703 99% 317,012 164,599 108% 178,342 759,926
Estonia** 1,290 67% 858 15,034 108% 16,214 1,197 102% 1,218 18,291
Ireland 16,333 102% 16,734 9,589 85% 8,136 9,579 97% 9,289 34,160
Greece 35,264 93% 32,918 42,201 87% 36,813 7,803 88% 6,882 76,614
Spain 131,520 93% 122,835 58,923 68% 40,267 66,009 92% 60,950 224,052
France* 207,725 98% 204,019 47,291 107% 50,453 88,528 103% 91,269 345,741
Croatia 9,406 98% 9,183 2,454 107% 2,621 4,639 95% 4,422 16,226
Italy 158,892 95% 150,785 61,446 89% 54,980 145,171 94% 135,739 341,503
Cyprus 6,499 85% 5,546 1 - - NA,NO - - 5,546
Latvia 3,528 96% 3,387 354 69% 243 2,803 99% 2,774 6,404
Lithuania 6,890 98% 6,740 943 117% 1,107 3,647 81% 2,972 10,819
Luxembourg 7,417 100% 7,445 184 84% 155 2,499 85% 2,123 9,723
Hungary*** 12,933 101% 13,112 11,084 90% 9,979 18,623 89% 16,626 39,717
Malta 2,701 93% 2,518 NA,NE,NO - - IE,NO - - 2,518
Netherlands* 54,206 96% 52,247 32,284 100% 32,357 75,957 102% 77,435 162,039
Austria* 30,616 102% 31,184 12,768 93% 11,827 17,198 95% 16,278 59,289
Poland 62,855 93% 58,692 199,325 102% 204,182 27,108 101% 27,345 290,219
Portugal 25,041 112% 27,985 11,008 91% 10,050 9,232 96% 8,884 46,919
Romania 21,459 95% 20,388 28,500 72% 20,527 24,334 92% 22,504 63,419
Slovenia 7,285 88% 6,410 5,836 83% 4,836 1,625 107% 1,736 12,982
Slovakia 7,432 97% 7,226 10,181 95% 9,642 9,598 90% 8,650 25,518
Finland*** 20,982 89% 18,765 16,975 108% 18,295 6,419 95% 6,068 43,129
Sweden 30,139 94% 28,411 5,820 104% 6,045 2,159 95% 2,055 36,511
United Kingdom 162,268 98% 158,485 147,715 96% 141,841 156,036 99% 154,598 454,924
EU 15 1,202,408 1,177,670 788,432 753,632 792,837 790,820 2,722,122
EU 13 174,031 164,780 366,579 354,959 114,606 109,986 629,725
EU 28 1,376,439 1,342,451 1,155,011 1,108,591 907,444 900,806 3,351,848 Note: * Trend change corrected for hard coal by using annual data;
** Trend change corrected for liquid by using annual data;
*** Trend changes for solid fuels have been calculated in energy units;
Further issues: Irish monthly; data on solids (coal and peat) could not be used for confidentiality reasons; Poland provided new estimates for 2012 on the 27
th May 2014, this would change the early estimates from
290,219 kt published in the press release (7th
May 2014) to 296,412 kt.
Table 4-5 shows the results for early CO2 estimates for the year 2013 based on the
methodological approach described in section 2.1. These early estimates suggest that
the CO2 emissions from fuel combustion decreased for 22 Member States and
increased for only 6 Member States in 2013 (see Figure 4-1).

Öko-Institut Early CO2 emissions from energy for the year 2013
53
Figure 4-1 Relative changes in total fossil fuel consumption for all 28 EU-Member
states for 2013/2012
-2.5%
-3.8%
-2.2%
6.8%
4.4%
3.6%
2.0%
0.6%
0.3%
-0.3%
-0.3%
-1.7%
-2.1%
-2.4%
-2.8%
-2.9%
-3.7%
-3.7%
-4.2%
-4.2%
-5.8%
-6.2%
-6.6%
-6.8%
-6.9%
-10.2%
-10.2%
-12.0%
-12.6%
-14.6%
-14.7%
-16% -14% -11% -09% -06% -04% -01% 02% 04% 07%
EU 28
EU 13
EU 15
Denmark
Estonia
Portugal
Germany
France
Poland
Netherlands
Belgium
Croatia
Austria
United Kingdom
Finland
Czech Republic
Luxembourg
Ireland
Latvia
Sweden
Lithuania
Slovakia
Italy
Malta
Hungary
Greece
Bulgaria
Slovenia
Spain
Romania
Cyprus
CO2 emissions from total fossil fuels 2013 versus 2012
The early estimates indicate that EU CO2 emissions from the energy sector decreased
by 2.5 % for the EU-28 and by 2.2 % for the EU-15 between 2012 and 2013. However,
for EU-13 the early CO2 estimates indicate a stronger decrease of 3.9 % in 2013
compared to 2012.
A short explanation of the significant decreases or increases in emissions in 2013 for
certain countries is provided below:
Relevant countries with emission decreases above 10 %:
• Bulgaria: The decrease of CO2 emissions by -10 % is due to a strong decrease
in hard coal and lignite consumption which is related to a lower electricity production
and higher electricity imports in 2013 compared to 2012.
• Spain: The decrease of CO2 emissions by -13 % is due to a strong decrease in
coal consumption. Coal use for electricity production was replaced by hydro power and
wind power in Spain. 2013 was a year with high rainfalls and therefore high hydro
electricity production whereas 2012 was a particularly dry year in Spain.
• Greece: CO2 emissions decrease here due to a lower use of solid fuels (-13 %),
natural gas (-12 %) and liquid fuels (-7 %). This reflects lower use of coal for electricity
production and is related to ongoing effects of the economic crisis.
• Romania: CO2 emissions mainly decrease here because of a large reduction of
the use of solid fuels (-28 %).

Öko-Institut Early CO2 emissions from energy for the year 2013
54
• Slovenia: CO2 emissions fall in this case due to a lower use of solid (-17 %) and
liquid fuels (-12 %).
Countries with increasing emissions:
• Denmark: emissions increased by 7 % due to increased use of solid fuels (by
27 %) for electricity production. Denmark imported less electricity from the Nordic
electricity market while exports remained on a similar level to the years before.
• Emissions in Germany increased by 2 %, which is mainly due to a higher
consumption of natural gas resulting from a cold winter in the beginning of 2013.
Table 8-4 in the Annex provides a comparison of the annual trend changes for the
period 2008–2013 for the different data sources (cumulated Eurostat fuel consumption
data, annual Eurostat fuel consumption data and inventory (CRF) fuel consumption
data).
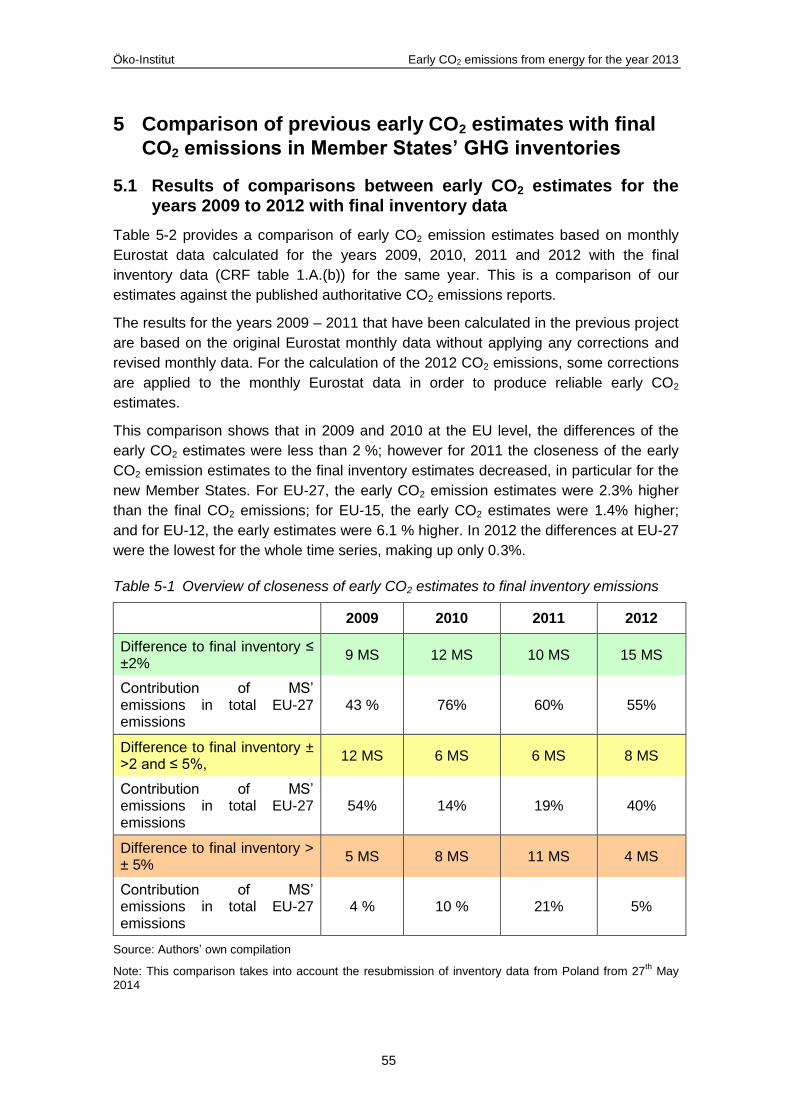
Öko-Institut Early CO2 emissions from energy for the year 2013
55
5 Comparison of previous early CO2 estimates with final
CO2 emissions in Member States’ GHG inventories
5.1 Results of comparisons between early CO2 estimates for the years 2009 to 2012 with final inventory data
Table 5-2 provides a comparison of early CO2 emission estimates based on monthly
Eurostat data calculated for the years 2009, 2010, 2011 and 2012 with the final
inventory data (CRF table 1.A.(b)) for the same year. This is a comparison of our
estimates against the published authoritative CO2 emissions reports.
The results for the years 2009 – 2011 that have been calculated in the previous project
are based on the original Eurostat monthly data without applying any corrections and
revised monthly data. For the calculation of the 2012 CO2 emissions, some corrections
are applied to the monthly Eurostat data in order to produce reliable early CO2
estimates.
This comparison shows that in 2009 and 2010 at the EU level, the differences of the
early CO2 estimates were less than 2 %; however for 2011 the closeness of the early
CO2 emission estimates to the final inventory estimates decreased, in particular for the
new Member States. For EU-27, the early CO2 emission estimates were 2.3% higher
than the final CO2 emissions; for EU-15, the early CO2 estimates were 1.4% higher;
and for EU-12, the early estimates were 6.1 % higher. In 2012 the differences at EU-27
were the lowest for the whole time series, making up only 0.3%.
Table 5-1 Overview of closeness of early CO2 estimates to final inventory emissions
2009 2010 2011 2012
Difference to final inventory ≤ ±2%
9 MS 12 MS 10 MS 15 MS
Contribution of MS’ emissions in total EU-27 emissions
43 % 76% 60% 55%
Difference to final inventory ± >2 and ≤ 5%,
12 MS 6 MS 6 MS 8 MS
Contribution of MS’ emissions in total EU-27 emissions
54% 14% 19% 40%
Difference to final inventory > ± 5%
5 MS 8 MS 11 MS 4 MS
Contribution of MS’ emissions in total EU-27 emissions
4 % 10 % 21% 5%
Source: Authors’ own compilation
Note: This comparison takes into account the resubmission of inventory data from Poland from 27th
May 2014
Öko-Institut Early CO2 emissions from energy for the year 2013
56
Table 5-1 also shows that the closeness of the early estimates to the final inventory
emissions increased again for 2012 compared to the year before. For 15 Member
States the differences are less or equal to 2% (9 MS in 2009, 12 MS in 2010 and only
10 MS in 2011), for 8 MS the differences were between 2 % and 5 % (12 MS in 2009, 6
MS in 2010 and 6 MS in 2011) and for only 4 MS the difference was larger than 5 % (5
MS in 2009, 8 MS in 2010 and 11 MS in 2011). The contribution of the Member States
with differences lower than 2 % of the total EU-27 decreased to 55 % in 2012, as the
differences for countries with high emissions like Germany and France were above 2 %
(see Table 5-2). On the other hand, the differences greater than 5 % represent only 5
% of the total EU-27 emissions in 2012.
With regard to absolute differences in 2012, Germany showed the greatest absolute
difference (early CO2 estimates 17,129 kt reduction), followed by France (early
estimates 11,249 kt reduction) and the United Kingdom (early estimates 5,511 kt
increase).
It should be noted that the countries with large differences between early estimates and
final inventory estimates change almost every year. Slovakia is the only Member State
with high percentage differences for all 4 years. Spain and Italy show small differences
≤ ± 2% for all 4 years.

Öko-Institut Early CO2 emissions from energy for the year 2013
57
Table 5-2 Comparison of early CO2 emission estimates with final inventory CO2 emissions (CRF table 1A(b)) for 2009, 2010, 2011 and
2012 based on original monthly Eurostat data (except 2012), without taking into account recalculations
Early CO2
estimates
CRF Table
1.A(b)Differences
Early CO2
estimates
CRF Table
1.A(b)
Early CO2
estimates
CRF Table
1.A(b)
Differences
relative
Early CO2
estimates
CRF Table
1.A(b)
Differences
relative
Belgium 104,751 103,066 1.6% 94,439 108,947 -13.3% 115,824 97,472 18.8% 85,939 87,632 -1.9%
Bulgaria 45,849 44,316 3.5% 43,690 46,076 -5.2% 53,729 51,410 4.5% 47,881 46,272 3.5%
Czech Republic 111,782 109,121 2.4% 108,395 107,046 1.3% 108,341 105,131 3.1% 99,646 99,380 0.3%
Denmark 47,713 46,416 2.8% 48,388 47,871 1.1% 41,524 42,961 -3.3% 38,908 37,653 3.3%
Germany 702,937 718,483 -2.2% 730,458 741,056 -1.4% 717,735 721,656 -0.5% 728,065 745,194 -2.3%
Estonia 15,357 14,197 8.2% 16,482 18,284 -9.9% 18,997 18,688 1.7% 18,590 17,521 6.1%
Ireland 47,062 40,581 16.0% 38,934 39,717 -2.0% 43,308 36,605 18.3% 36,132 35,502 1.8%
Greece 97,827 98,264 -0.4% 86,594 90,068 -3.9% 90,567 90,358 0.2% 90,189 85,268 5.8%
Spain 285,657 280,163 2.0% 258,617 258,663 0.0% 263,494 261,523 0.8% 257,760 256,452 0.5%
France 348,520 342,671 1.7% 350,181 356,999 -1.9% 347,897 335,009 3.8% 332,295 343,544 -3.3%
Italy 395,929 394,764 0.3% 399,296 394,577 1.2% 388,255 385,365 0.7% 365,688 365,509 0.0%
Cyprus 7,759 7,387 5.0% 7,229 7,161 1.0% 6,845 6,919 -1.1% 6,332 6,500 -2.6%
Latvia 6,805 6,570 3.6% 6,902 7,159 -3.6% 7,027 6,563 7.1% 6,376 6,685 -4.6%
Lithuania 11,855 12,355 -4.0% 13,329 12,283 8.5% 12,256 11,387 7.6% 11,577 11,480 0.8%
Luxembourg 10,160 10,394 -2.3% 11,326 10,432 8.6% 9,506 10,452 -9.1% 10,272 10,100 1.7%
Hungary 48,842 47,360 3.1% 44,919 46,170 -2.7% 48,392 44,880 7.8% 43,175 42,640 1.3%
Malta NE 2,582 - NE 2,479 - 2,297 2,558 -10.2% 2,720 2,701 0.7%
Netherlands 162,529 163,779 -0.8% 175,732 175,836 -0.1% 175,920 162,796 8.1% 157,115 162,447 -3.3%
Austria 63,912 62,690 1.9% 68,913 67,585 2.0% 65,024 64,338 1.1% 61,354 60,583 1.3%
Poland 300,954 294,833 2.1% 298,604 314,134 -4.9% 338,556 312,645 8.3% 296,580 295,158 0.5%
Portugal 51,850 52,981 -2.1% 45,394 46,756 -2.9% 51,250 46,217 10.9% 44,388 45,280 -2.0%
Romania 86,165 83,805 2.8% 86,847 74,663 16.3% 81,371 78,506 3.6% 74,954 74,292 0.9%
Slovenia 15,351 15,200 1.0% 15,641 15,268 2.4% 15,007 15,365 -2.3% 14,979 14,746 1.6%
Slovakia 35,790 32,438 10.3% 30,274 33,577 -9.8% 36,099 32,897 9.7% 30,758 27,211 13.0%
Finland 51,542 51,759 -0.4% 58,750 59,292 -0.9% 53,327 53,248 0.1% 46,970 44,376 5.8%
Sweden 36,320 40,973 -11.4% 53,295 43,959 21.2% 40,530 41,134 -1.5% 36,974 38,118 -3.0%
United Kingdom 484,762 472,285 2.6% 484,797 490,598 -1.2% 446,687 453,785 -1.6% 471,530 466,019 1.2%
EU 15 2,180,569 2,135,835 2.1% 2,134,045 2,168,590 -1.6% 2,165,121 2,095,220 3.3% 2,049,007 2,045,893 0.2%
EU 12 1,397,409 1,413,597 -1.1% 1,443,380 1,448,067 -0.3% 1,414,644 1,394,648 1.4% 1,368,139 1,382,371 -1.0%
EU 27 3,577,978 3,486,742 2.6% 3,577,425 3,549,072 0.8% 3,579,765 3,489,868 2.6% 3,417,145 3,428,264 -0.3%
2012
Member States
2009 2010 2011
Note: Green: difference ≤ ± 2%, Yellow: difference ± >2 and ≤ 5%, Red: difference > ± 5%
EU 12 and EU 27 totals in 2009 and 2010 are without the results for Malta due to data gaps for Malta in Eurostat data.
For calculating early estimates for the year 2012 solid fuel consumption for Belgium for the year 2011 has been corrected and for Malta
data on international bunkers for Jet kerosene has been corrected for 2012 monthly data.
Öko-Institut Early CO2 emissions from energy for the year 2013
58
5.2 Impact of inventory recalculations
In each year, the Member States perform recalculations of CRF data reported to the
UNFCCC in previous years for different reasons such as the improvement of emission
factors, improvement of methodologies or updated activity data. Such methodological
changes at Member State level cannot be captured by any methodological approach
for the calculation of early CO2 estimates and will always result in differences between
the early CO2 estimates and the CRF data in particular if the recalculations arise from
changes in emission factors or methodologies used in the inventories. Thus, inventory
recalculations are a general source of uncertainty for early CO2 estimates at EU level
which cannot be reduced through refinement of the methodological approach.
Therefore, this section analyses the changes that were triggered by inventory
recalculations for CO2 emissions in the energy sector as reported in the 2014 inventory
submissions for the reference year 2012. The recalculations may in some cases
contribute to the large differences between the Member States’ CRF data and early
CO2 estimates based on monthly Eurostat data.
Member States have to submit their national inventory for the year T-2 to the UNFCCC
by 15th April. Should they discover inconsistencies within their inventory, they can
revise the data and provide the UNFCCC with resubmissions by 27th May. As the early
CO2 estimates are calculated based on the data provided to the UNFCCC on 15th April,
the new data cannot be taken into account for the early CO2 estimates, but will be
considered as recalculations when analysing the quality of the early CO2 estimates in
the next year. After 27th May additional recalculations can occur, triggered by the
UNFCCC inventory review, which are then reflected in the inventory submission of the
subsequent year after the review.
For calculating early CO2 emissions for the year 2013, the inventory data is used that is
published on 15th April 2014 on the UNFCCC websites for the year 2012. This
inventory data includes new CO2 estimates for the year 2012, but also CO2 estimates
for all years from 1990 onwards. If new activity data has become available or
methodological changes have been applied, the CO2 estimates of all previous years
have been recalculated. For calculating the 2012 early estimates the inventory data for
the year 2011 (as available on 15th April 2013) has been used. Some countries
recalculated the year 2011 and provided new CO2 estimates for 2011 within the new
inventory submission in 2014. The following table provides a comparison of the
inventory data for the year 2011 as available in April 2013 and available in April 2014.
All Member States recalculated the CO2 emissions from the reference approach for the
year 2011. Most recalculations performed are below 1% as shown in Table 5-3, but
they could add up to more than 1% of the total CO2 emissions, as shown in Table 5-4.
As the impact of the recalculations are not related to the accuracy of the methodology
or the quality of the monthly Eurostat data and cannot be predicted in advance, it can
only be analysed whether this method produces reliable results, if the impacts of the
recalculation are known.

Öko-Institut Early CO2 emissions from energy for the year 2013
59
Table 5-3 CO2 estimates for the year 2011 by comparing the original inventory data
(2013 submission) and the recalculated data (2014 submission)
Member States Difference Difference Difference
2013
submission
Recalculations
2014
submission
2013
submission
Recalculations
2014
submission 2013/2012
2013
submission
Recalculations
2014
submission
% % %
Belgium 49,852 45,471 9.6% 12,290 13,161 -6.6% 35,330 34,936 1.1%
Bulgaria 10,475 10,413 0.6% 34,970 34,914 0.2% 5,964 5,532 7.8%
Czech Republic 21,367 21,363 0.0% 68,179 68,179 0.0% 15,584 15,665 -0.5%
Denmark 19,981 19,230 3.9% 14,249 14,242 0.0% 8,731 8,711 0.2%
Germany 264,483 256,329 3.2% 305,995 305,758 0.1% 151,177 162,092 -6.7%
Estonia 1,357 1,333 1.8% 16,164 16,209 -0.3% 1,168 - -
Ireland 18,433 18,486 -0.3% 8,321 - - 9,851 9,853 0.0%
Greece 40,827 40,452 0.9% 41,061 - - 8,470 8,428 0.5%
Spain 145,300 145,170 0.1% 48,113 47,788 0.7% 68,110 67,924 0.3%
France 210,763 209,876 0.4% 42,490 42,739 -0.6% 81,757 - -
Italy 173,890 173,980 -0.1% 60,831 - - 150,644 150,635 0.0%
Cyprus 6,885 6,887 0.0% 34 30 11.9% NA,NO NA,NO NA,NO
Latvia 3,144 3,590 -12.4% 421 427 -1.4% 2,998 2,986 0.4%
Lithuania 6,548 6,611 -1.0% 968 962 0.6% 3,871 - -
Luxembourg 7,798 7,651 1.9% 191 - - 2,463 - -
Hungary 14,251 13,477 5.7% 9,363 11,314 -17.2% 21,266 21,167 0.5%
Malta 2,558 - - NA,NE,NO NA,NE,NO NA,NE,NO IE,NO IE,NO IE,NO
Netherlands 54,221 - - 29,286 - - 79,288 - -
Austria 32,520 31,453 3.4% 13,649 13,781 -1.0% 18,169 18,059 0.6%
Poland 64,413 62,300 3.4% 222,216 222,132 0.0% 25,760 25,760 0.0%
Portugal 27,326 27,089 0.9% 8,393 - - 10,499 10,477 0.2%
Romania 22,701 22,047 3.0% 30,819 29,776 3.5% 24,986 - -
Slovenia 7,457 7,437 0.3% 6,222 6,118 1.7% 1,687 - -
Slovakia 7,631 7,711 -1.0% 14,849 11,549 28.6% 10,416 10,122 2.9%
Finland 24,027 23,871 0.7% 21,972 21,972 0.0% 7,249 - -
Sweden 32,294 33,327 -3.1% 6,330 - - 2,510 - -
United Kingdom 173,318 164,744 5.2% 115,535 115,776 -0.2% 164,932 164,938 0.0%
2011 2011 2011
Gg CO2 Gg CO2 Gg CO2
CO2 emissions from liquid
fuel consumption
CO2 emissions from solid
fuel consumption
CO2 emissions from natural
gas consumption
Note: Green: difference ≤ ± 2%, Yellow: difference ± >2 and ≤ 5%, Red: difference > ± 5%,
For Poland the resubmission of the inventory data on 27th May 2014 was used to compare the results of
the 2012 estimates.
If the calculated trend changes for monthly Eurostat data were multiplied with the
recalculated CO2 emissions (as available in 2014), the differences in the results would
indicate whether the monthly Eurostat data is correct. Thus Table 5-4 shows the
differences that appear due to the recalculations of the CO2 emissions for the year
2011 (as available in April 2014) and the real differences that are due to discrepancies
in the monthly Eurostat data that affect the trend change.

Öko-Institut Early CO2 emissions from energy for the year 2013
60
Table 5-4 Impact of inventory recalculations for uncertainties of early estimates of CO2
estimates
Member StatesTrend
change
Trend
change
2011 (2014
submission)
as available on
27th of May
2014
2012 (2014
submission) as
available on
27th of May
2014
2012/2011 2012/2011
Difference
Early
estimates
/CRF
Impact of
recalculations
Differences Early
estimates/CRF
without impact of
reclaculations
Improve
ments
A B C D E F E/B=G A/D=H G+H or C-F
% % % % %
Belgium 93,568 87,632 -6.3% 97,472 85,939 -11.8% -1.9% -4.0% -5.9% -
Bulgaria 50,859 46,272 -9.0% 51,410 47,881 -6.9% 3.5% -1.1% 2.4% +
Czech Republic 105,207 99,380 -5.5% 105,131 99,646 -5.2% 0.3% 0.1% 0.3% 0
Denmark 42,183 37,653 -10.7% 42,961 38,908 -9.4% 3.3% -1.8% 1.5% +
Germany 724,179 745,194 2.9% 721,656 728,065 0.9% -2.3% 0.3% -1.9% +
Estonia 18,709 17,521 -6.3% 18,688 18,590 -0.5% 6.1% 0.1% 6.2% -
Ireland 36,661 35,502 -3.2% 36,605 36,132 -1.3% 1.8% 0.2% 1.9% -
Greece 89,941 85,268 -5.2% 90,358 90,189 -0.2% 5.8% -0.5% 5.3% +
Spain 260,882 256,452 -1.7% 261,523 257,760 -1.4% 0.5% -0.2% 0.3% +
France 338,405 343,544 1.5% 335,009 332,295 -0.8% -3.3% 1.0% -2.3% +
Italy 385,446 365,509 -5.2% 385,365 365,688 -5.1% 0.0% 0.0% 0.1% -
Cyprus 6,917 6,500 0 6,919 6,332 -8.5% -2.6% 0.0% -2.6% 0
Latvia 7,003 6,685 -4.5% 6,563 6,376 -2.8% -4.6% 6.7% 2.1% +
Lithuania 11,445 11,480 0.3% 11,387 11,577 1.7% 0.8% 0.5% 1.3% -
Luxembourg 10,304 10,100 -2.0% 10,452 10,272 -1.7% 1.7% -1.4% 0.3% +
Hungary 45,958 42,640 -7.2% 44,880 43,175 -3.8% 1.3% 2.4% 3.7% -
Malta 2,558 2,701 0 2,558 2,720 6.3% 0.7% 0.0% 0.7% 0
Netherlands 162,796 162,447 -0.2% 162,796 157,115 -3.5% -3.3% 0.0% -3.3% 0
Austria 63,292 60,583 -4.3% 64,338 61,354 -4.6% 1.3% -1.6% -0.4% +
Poland 310,191 295,158 -4.8% 312,253 296,580 -5.0% 0.5% -0.7% -0.2% +
Portugal 45,958 45,280 -1.5% 46,217 44,388 -4.0% -2.0% -0.6% -2.5% -
Romania 76,809 74,292 -3.3% 78,506 74,954 -4.5% 0.9% -2.2% -1.3% -
Slovenia 15,241 14,746 -3.2% 15,365 14,979 -2.5% 1.6% -0.8% 0.8% +
Slovakia 29,382 27,211 -7.4% 32,897 30,758 -6.5% 13.0% -10.7% 2.3% +
Finland 53,092 44,376 -16.4% 53,248 46,970 -11.8% 5.8% -0.3% 5.6% +
Sweden 42,167 38,118 -9.6% 41,134 36,974 -10.1% -3.0% 2.5% -0.5% +
United Kingdom 445,459 466,019 4.6% 453,785 471,530 3.9% 1.2% -1.8% -0.7% +
Comparison of results and impacts of recalculations
Gg CO2 Gg CO2
Total CO2 emissions CRF
Table 1.A(b)
2011 (2013
submission)
CO2
emissions
CRF Table
1.A(b) as
available on
15th of April
2013
Early CO2
estimates
2012
Note: Green: difference ≤ ± 2%, Yellow: difference ± >2 and ≤ 5%, Red: difference > ± 5%,
For Poland the resubmission of the inventory data on 27th May 2014 was used to compare the results of
the 2012 estimates.
In the 2014 submissions, all Member States reported recalculations of CO2 emissions
from fuel combustion for the year 2011. The following applies:
When inventory recalculations for CO2 emissions are taken into account, the
comparability of early CO2 estimates with CRF data improves for 15 Member
States (AT, BG,CY, DE, DK, ES, FI, FR, EL, LU, LV, PL, SE, SI, SK and UK).
For 8 Member States (BE, EE, HU, IE, IT, LT, PT and RO), the results of the
early CO2 estimates do not match as well when inventory recalculations are
taken into account.
The large differences for Slovakia of more than 10% can be explained by the
recalculations which took place. Thus, Slovakia reported consistently incorrect natural
gas consumption, which does not influence the trend change.

Öko-Institut Early CO2 emissions from energy for the year 2013
61
5.3 Analysis of large differences at Member States level
This section provides additional explanations of the reasons for differences between
early CO2 emission estimates and Member State CRF data for the year 2012 for those
Member States for which the comparison with inventory data showed differences
exceeding ±5%.
For this purpose Table 8-4 in the Annex presents a comparison of the annual trend
changes derived for different fuel types from the fuel consumption data for the Eurostat
monthly data, the Eurostat annual data and the data reported in Member States GHG
inventories (CRF).
After taking into account the impact of recalculations of the CRF inventory tables for the
year 2011, only Belgium, Estonia and Greece show differences between early CO2
emission estimates and Member States’ CRF data of more than 5%.
5.3.1 Belgium
For Belgium the early CO2 estimate for 2012 was 5.9 pp higher than the final
CRF inventory CO2 emissions. This difference can mainly be explained by the
large differences in natural gas consumption in 2012.
Table 5-5 Differences between cumulated fuel consumption in monthly data and CRF
data for Belgium for the years 2008–2012
Cumulated
Monthly
CRF
1.A.(b)
Difference
absolute%
Cumulated
Monthly
CRF
1.A.(b)
Difference
absolute%
Cumulated
MonthlyCRF 1.A.(b)
Difference
absolute%
2008 21,726 23,551 -1,825 -8% 6,395 6,812 -417 -6% 507,678 622,938 -115,260 -19%
2009 22,489 23,033 -544 -2% 3,783 4,869 -1,086 -22% 566,504 634,426 -67,923 -11%
2010 22,071 24,049 -1,978 -8% 1,245 5,059 -3,814 -75% 580,711 712,012 -131,302 -18%
2011 21,580 21,975 -395 -2% 2,692 4,589 -1,897 -41% 474,624 640,285 -165,661 -26%
2012 21,866 20,548 1,318 6% 4,032 4,542 -510 -11% 329,770 601,475 -271,706 -45%
2013 21,984 3,994 594,578
Belgium
Liquid fuels (kt) Solid fuels (kt) Gaseous fuels (TJ)
Member States
Table 5-5 shows that there were large differences between monthly Eurostat
data for liquid fuels, solid fuels and in particular for gaseous fuels for the year
2012. As the reporting of monthly natural gas data was not consistent with the
CRF natural gas data for all 4 years, the differences in trend change are not as
high as the differences in the absolute data (Table 5-6).
Table 5-6 Annual trend changes for consumption in aggregated fuel categories for
Belgium for the years 2008–2013 based on monthly Eurostat data, annual
Eurostat data and CRF data
Eurostat
Monthly
Eurostat
annual CRF
Eurostat
Monthly
Eurostat
annual CRF
Eurostat
Monthly
Eurostat
annual CRF
2009/2008 104% 100% 100% 59% 69% 71% 112% 102% 102%
2010/2009 98% 106% 111% 33% 106% 81% 103% 112% 112%
2011/2010 98% 88% 91% 216% 92% 91% 82% 90% 90%
2012/2011 101% 94% 112% 150% 100% 99% 69% 95% 94%
2013/2012 101% 99% 180%
Member States
Liquid fuels
Belgium
Solid fuels Gaseous fuels
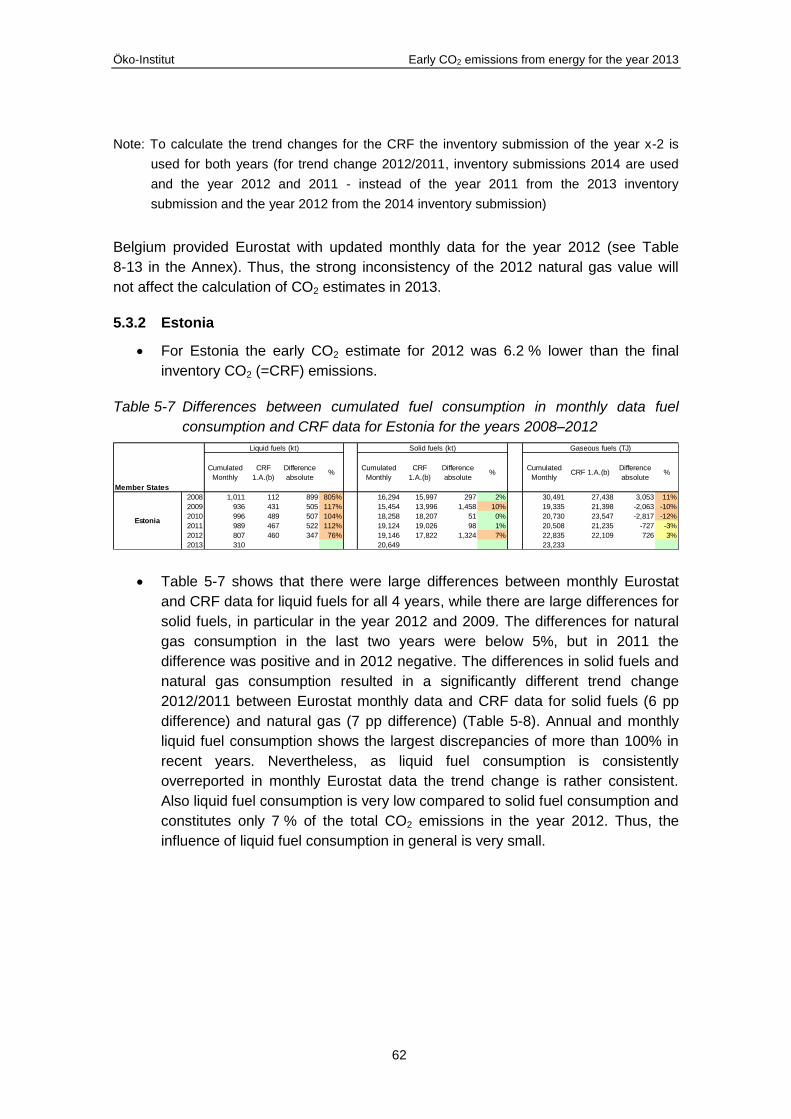
Öko-Institut Early CO2 emissions from energy for the year 2013
62
Note: To calculate the trend changes for the CRF the inventory submission of the year x-2 is
used for both years (for trend change 2012/2011, inventory submissions 2014 are used
and the year 2012 and 2011 - instead of the year 2011 from the 2013 inventory
submission and the year 2012 from the 2014 inventory submission)
Belgium provided Eurostat with updated monthly data for the year 2012 (see Table
8-13 in the Annex). Thus, the strong inconsistency of the 2012 natural gas value will
not affect the calculation of CO2 estimates in 2013.
5.3.2 Estonia
For Estonia the early CO2 estimate for 2012 was 6.2 % lower than the final
inventory CO2 (=CRF) emissions.
Table 5-7 Differences between cumulated fuel consumption in monthly data fuel
consumption and CRF data for Estonia for the years 2008–2012
Cumulated
Monthly
CRF
1.A.(b)
Difference
absolute%
Cumulated
Monthly
CRF
1.A.(b)
Difference
absolute%
Cumulated
MonthlyCRF 1.A.(b)
Difference
absolute%
2008 1,011 112 899 805% 16,294 15,997 297 2% 30,491 27,438 3,053 11%
2009 936 431 505 117% 15,454 13,996 1,458 10% 19,335 21,398 -2,063 -10%
2010 996 489 507 104% 18,258 18,207 51 0% 20,730 23,547 -2,817 -12%
2011 989 467 522 112% 19,124 19,026 98 1% 20,508 21,235 -727 -3%
2012 807 460 347 76% 19,146 17,822 1,324 7% 22,835 22,109 726 3%
2013 310 20,649 23,233
Liquid fuels (kt) Solid fuels (kt) Gaseous fuels (TJ)
Estonia
Member States
Table 5-7 shows that there were large differences between monthly Eurostat
and CRF data for liquid fuels for all 4 years, while there are large differences for
solid fuels, in particular in the year 2012 and 2009. The differences for natural
gas consumption in the last two years were below 5%, but in 2011 the
difference was positive and in 2012 negative. The differences in solid fuels and
natural gas consumption resulted in a significantly different trend change
2012/2011 between Eurostat monthly data and CRF data for solid fuels (6 pp
difference) and natural gas (7 pp difference) (Table 5-8). Annual and monthly
liquid fuel consumption shows the largest discrepancies of more than 100% in
recent years. Nevertheless, as liquid fuel consumption is consistently
overreported in monthly Eurostat data the trend change is rather consistent.
Also liquid fuel consumption is very low compared to solid fuel consumption and
constitutes only 7 % of the total CO2 emissions in the year 2012. Thus, the
influence of liquid fuel consumption in general is very small.

Öko-Institut Early CO2 emissions from energy for the year 2013
63
Table 5-8 Annual trend changes for consumption of aggregate fuel categories for
Estonia for the years 2008–2012 based on monthly Eurostat data, annual
Eurostat data and CRF data
Eurostat
Monthly
Eurostat
annual CRF
Eurostat
Monthly
Eurostat
annual CRF
Eurostat
Monthly
Eurostat
annual CRF
2009/2008 93% 73% 92% 95% 88% 87% 63% 68% 78%
2010/2009 106% 102% 113% 118% 129% 129% 107% 107% 107%
2011/2010 99% 100% 97% 105% 104% 105% 99% 89% 90%
2012/2011 82% 107% 96% 100% 94% 94% 111% 108% 104%
2013/2012 38% 108% 102%
Member States
Liquid fuels
Estonia
Solid fuels Gaseous fuels
Note: To calculate the trend changes for the CRF, the inventory submission of the year x-2 is
used for both years (for trend change 2012/2011 inventory submissions 2014 is used and
the year 2012 and 2011 - instead of the year 2011 from the 2013 inventory submission
and the year 2012 from the 2014 inventory submission).
5.3.3 Greece
For Greece the early CO2 estimate for 2012 was 5.3 % higher than the final
inventory (= CRF data) CO2 emissions.
Table 5-9 Differences between cumulated fuel consumption in monthly data and CRF
data for Greece for the years 2008–2012
Cumulated
Monthly
CRF
1.A.(b)
Difference
absolute%
Cumulated
Monthly
CRF
1.A.(b)
Difference
absolute%
Cumulated
MonthlyCRF 1.A.(b)
Difference
absolute%
2008 16,981 16,719 262 2% 63,171 65,157 -1,986 -3% 146,842 142,441 4,401 3%
2009 16,363 16,678 -315 -2% 62,025 65,405 -3,380 -5% 124,326 121,786 2,540 2%
2010 14,977 14,521 456 3% 50,108 57,961 -7,853 -14% 135,398 134,493 905 1%
2011 12,718 13,559 -841 -6% 57,015 60,359 -3,344 -6% 166,218 163,053 3,165 2%
2012 11,978 11,713 265 2% 60,978 62,263 -1,285 -2% 153,502 150,030 3,472 2%
2013 11,181 53,193 135,392
Liquid fuels (kt) Solid fuels (kt) Gaseous fuels (TJ)
Greece
Member States
Table 5-9 shows that in 2012 the data quality improved in the case of liquid and
solid fuel consumption. As for the calculation of early CO2 emissions the data
quality of the last two years is important, the monthly trend changes for
2012/2011 (Table 5-10) are inconsistent with the CRF trend changes for liquid
fuels (difference 8 pp) and for solid fuels (Difference 4 pp).

Öko-Institut Early CO2 emissions from energy for the year 2013
64
Table 5-10 Annual trend changes for consumption of aggregate fuel categories for
Greece for the years 2008–2012 based on monthly Eurostat data, annual
Eurostat data and CRF data
Eurostat
Monthly
Eurostat
annual CRF
Eurostat
Monthly
Eurostat
annual CRF
Eurostat
Monthly
Eurostat
annual CRF
2009/2008 96% 96% 99% 98% 101% 100% 85% 85% 82%
2010/2009 92% 89% 87% 81% 89% 89% 109% 109% 108%
2011/2010 85% 88% 93% 114% 103% 104% 123% 123% 121%
2012/2011 94% 99% 87% 107% 103% 103% 92% 92% 92%
2013/2012 93% 87% 88%
Member States
Liquid fuels
Greece
Solid fuels Gaseous fuels
Note: To calculate the trend changes for the CRF the inventory submission of the year x-2 is
used for both years (for trend change 2012/2011 inventory submissions 2014 is used and
the year 2012 and 2011 - instead of the year 2011 from the 2013 inventory submission
and the year 2012 from the 2014 inventory submission).
5.3.4 Slovakia
For Slovakia the early CO2 estimate for 2012 was 13.0 % higher than the final inventory
CO2 emissions. Taking the impact of recalculations into account improves the results
significantly and reduces the differences between the early estimates and the final
inventory to only 2.3 % (see Table 5-3 and Table 5-4).
Slovakia recalculated the solid fuel consumption data for the year 2011 and provided
slightly different data for liquid fuel consumption and natural gas consumption as well.
This changed the CO2 emissions of the aggregated fuel categories of Slovakia’s GHG
inventory for the year 2011, to which the trend changes of the cumulated monthly fuel
consumption data was applied to estimate 2012 emissions.

Öko-Institut Early CO2 emissions from energy for the year 2013
65
6 Conclusions and recommendations
6.1 Approach to calculate early CO2 estimates
A methodological approach was developed that calculates early CO2 emissions for the
EU and its Member States based on Eurostat monthly energy data 3 to 4 months after
the reference year, which is about one year earlier than final CO2 emissions reported in
national GHG inventories.
The approach used is based on the trend changes of the fuel consumption for
aggregated fuel categories (liquid fuels, solid fuels and gaseous fuels) of monthly
Eurostat data for the years 2009, 2010, 2011, 2012 and 2013. The trend changes of
2010/2009, 2011/2010, 2012/2011 and 2013/2012 are applied to the CO2 emissions of
the same aggregate fuel categories of the latest available reported year in Member
States’ GHG inventories as reported in the CRF reference approach table 1.A.(b).
In practical terms, for example, monthly cumulated data for liquid fuels, solid fuels and
gaseous fuels for 2012 and 2013 for a given Member State are compared and a trend
change is calculated for each fuel type. The 2013 value is simply divided by the 2012
value. The result is the trend change expressed as a percentage. Then the CRF values
(CO2 emissions in Gg) for the different fuel types of the year 2012 are multiplied with
the respective trend change from the comparison of the monthly data. The result is the
estimated CO2 emission by country and fuel type for 2013 in Gg. A year later the
estimate can be checked for its closeness to reality by comparing it with the respective
CRF values for the reference year 2013.
The methodological approach has been applied consecutively for the five years of
2009, 2010, 2011, 2012 and 2013. Table 5-2 provides a comparison of early CO2
emission estimates based on monthly Eurostat data calculated for the years of 2009,
2010, 2011 and 2012 with the final inventory data (CRF table 1.A.(b)) for the same
year.
Table 6-1 also shows that the closeness of the early estimates to the final inventory
emissions decreased for 2011 compared to the years before, but increased again in
2012. For 15 Member States the differences are less than or equal to 2 % (9 MS in
2009 and 12 MS in 2010, 10 MS in 2011); for 8 Member States the differences were
between 2 % and 5 % (12 MS in 2009, 6 MS in 2010 and 6 MS in 2011); and for 4
Member States the difference was larger than 5 % (only 5 MS in 2009, 8 MS in 2010
and 11 MS in 2011).
The detailed analysis of the discrepancies for individual Member States shows that the
differences between the early CO2 estimates can be explained. There are some
Member States for which significant differences between monthly and annual Eurostat
data still occur and a further improvement of the quality of monthly fuel consumption
data – at least in the form of an evaluation and correction at the end of each reporting
year – is necessary.
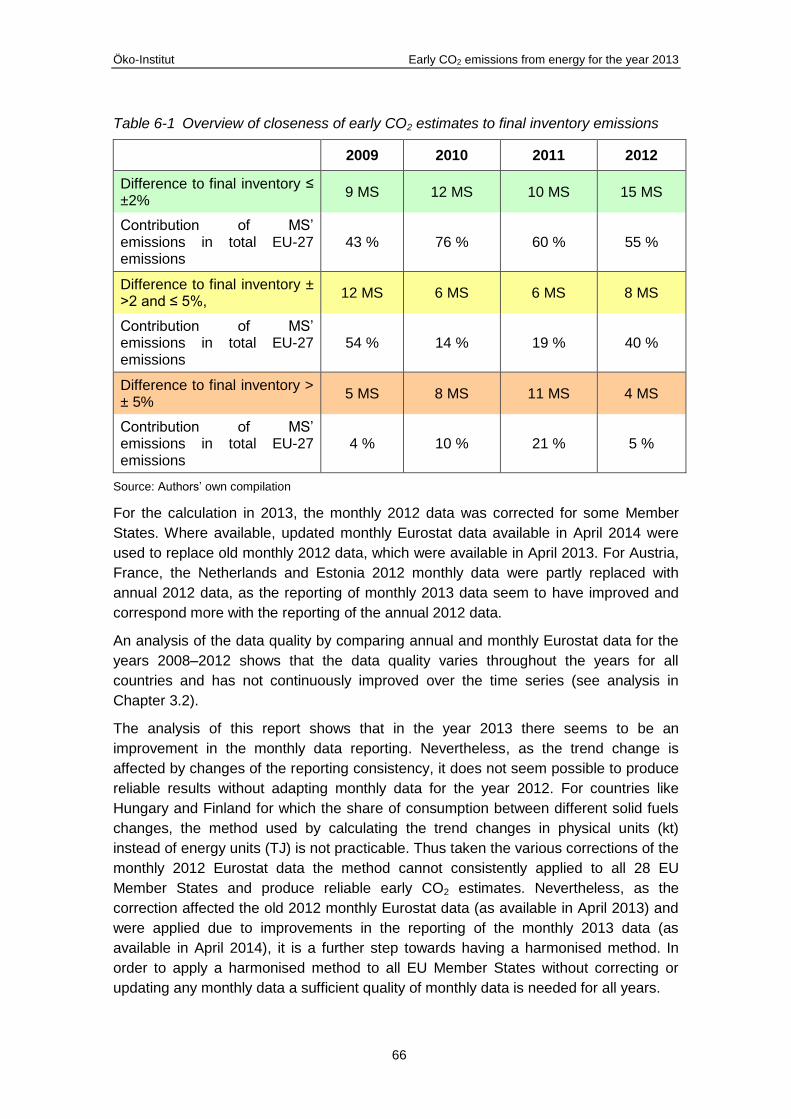
Öko-Institut Early CO2 emissions from energy for the year 2013
66
Table 6-1 Overview of closeness of early CO2 estimates to final inventory emissions
2009 2010 2011 2012
Difference to final inventory ≤ ±2%
9 MS 12 MS 10 MS 15 MS
Contribution of MS’ emissions in total EU-27 emissions
43 % 76 % 60 % 55 %
Difference to final inventory ± >2 and ≤ 5%,
12 MS 6 MS 6 MS 8 MS
Contribution of MS’ emissions in total EU-27 emissions
54 % 14 % 19 % 40 %
Difference to final inventory > ± 5%
5 MS 8 MS 11 MS 4 MS
Contribution of MS’ emissions in total EU-27 emissions
4 % 10 % 21 % 5 %
Source: Authors’ own compilation
For the calculation in 2013, the monthly 2012 data was corrected for some Member
States. Where available, updated monthly Eurostat data available in April 2014 were
used to replace old monthly 2012 data, which were available in April 2013. For Austria,
France, the Netherlands and Estonia 2012 monthly data were partly replaced with
annual 2012 data, as the reporting of monthly 2013 data seem to have improved and
correspond more with the reporting of the annual 2012 data.
An analysis of the data quality by comparing annual and monthly Eurostat data for the
years 2008–2012 shows that the data quality varies throughout the years for all
countries and has not continuously improved over the time series (see analysis in
Chapter 3.2).
The analysis of this report shows that in the year 2013 there seems to be an
improvement in the monthly data reporting. Nevertheless, as the trend change is
affected by changes of the reporting consistency, it does not seem possible to produce
reliable results without adapting monthly data for the year 2012. For countries like
Hungary and Finland for which the share of consumption between different solid fuels
changes, the method used by calculating the trend changes in physical units (kt)
instead of energy units (TJ) is not practicable. Thus taken the various corrections of the
monthly 2012 Eurostat data the method cannot consistently applied to all 28 EU
Member States and produce reliable early CO2 estimates. Nevertheless, as the
correction affected the old 2012 monthly Eurostat data (as available in April 2013) and
were applied due to improvements in the reporting of the monthly 2013 data (as
available in April 2014), it is a further step towards having a harmonised method. In
order to apply a harmonised method to all EU Member States without correcting or
updating any monthly data a sufficient quality of monthly data is needed for all years.

Öko-Institut Early CO2 emissions from energy for the year 2013
67
In the year 2013 data quality seems to have improved considerably, as the comparison
with early national statistics shows. However, a detailed analysis can only be carried
out when annual Eurostat and CRF data are available for reference year 2013 in spring
2015.
6.2 Priorities by Member State
The three summary tables below list the most significant problems related to
completeness, coherence between annual and monthly Eurostat data, coherence
between CRF and Eurostat data and the quality of the early CO2 estimates. These
tables analyse the data quality of the year 2012 and the differences in the trend
changes between monthly Eurostat data and early national statistics for 2013/2012. In
the first column the differences between the early CO2 estimates and the CRF
inventory are presented, without taking into account the impact of recalculations for the
year 2012. The next three columns provide the information of whether there is a
difference in monthly and annual Eurostat data for the year 2012, annual Eurostat and
CRF inventory data for the year 2012 and in the trend changes for 2013/2012 between
monthly Eurostat data and the early national statistics of above 5 %. This gives an
overview of the problems related to the data quality of the monthly Eurostat data for the
year 2012. The last two columns provide an explanation and the required action to
solve the problems in the data quality, if needed.
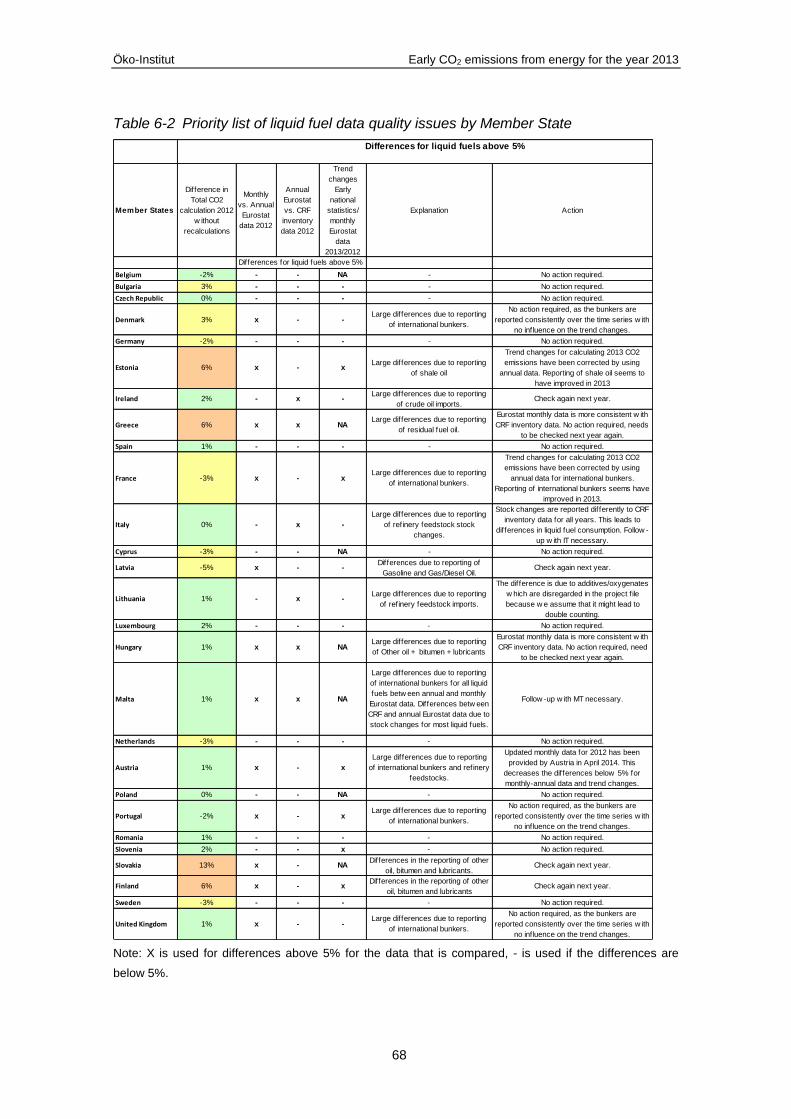
Öko-Institut Early CO2 emissions from energy for the year 2013
68
Table 6-2 Priority list of liquid fuel data quality issues by Member State
Member States
Difference in
Total CO2
calculation 2012
w ithout
recalculations
Monthly
vs. Annual
Eurostat
data 2012
Annual
Eurostat
vs. CRF
inventory
data 2012
Trend
changes
Early
national
statistics/
monthly
Eurostat
data
2013/2012
Explanation Action
Belgium -2% - - NA - No action required.
Bulgaria 3% - - - - No action required.
Czech Republic 0% - - - - No action required.
Denmark 3% x - -Large differences due to reporting
of international bunkers.
No action required, as the bunkers are
reported consistently over the time series w ith
no influence on the trend changes.
Germany -2% - - - - No action required.
Estonia 6% x - xLarge differences due to reporting
of shale oil
Trend changes for calculating 2013 CO2
emissions have been corrected by using
annual data. Reporting of shale oil seems to
have improved in 2013
Ireland 2% - x -Large differences due to reporting
of crude oil imports.Check again next year.
Greece 6% x x NALarge differences due to reporting
of residual fuel oil.
Eurostat monthly data is more consistent w ith
CRF inventory data. No action required, needs
to be checked next year again.
Spain 1% - - - - No action required.
France -3% x - xLarge differences due to reporting
of international bunkers.
Trend changes for calculating 2013 CO2
emissions have been corrected by using
annual data for international bunkers.
Reporting of international bunkers seems have
improved in 2013.
Italy 0% - x -
Large differences due to reporting
of refinery feedstock stock
changes.
Stock changes are reported differently to CRF
inventory data for all years. This leads to
differences in liquid fuel consumption. Follow -
up w ith IT necessary.
Cyprus -3% - - NA - No action required.
Latvia -5% x - -Differences due to reporting of
Gasoline and Gas/Diesel Oil.Check again next year.
Lithuania 1% - x -Large differences due to reporting
of refinery feedstock imports.
The difference is due to additives/oxygenates
w hich are disregarded in the project f ile
because w e assume that it might lead to
double counting.
Luxembourg 2% - - - - No action required.
Hungary 1% x x NALarge differences due to reporting
of Other oil + bitumen + lubricants
Eurostat monthly data is more consistent w ith
CRF inventory data. No action required, need
to be checked next year again.
Malta 1% x x NA
Large differences due to reporting
of international bunkers for all liquid
fuels betw een annual and monthly
Eurostat data. Differences betw een
CRF and annual Eurostat data due to
stock changes for most liquid fuels.
Follow -up w ith MT necessary.
Netherlands -3% - - - - No action required.
Austria 1% x - x
Large differences due to reporting
of international bunkers and refinery
feedstocks.
Updated monthly data for 2012 has been
provided by Austria in April 2014. This
decreases the differences below 5% for
monthly-annual data and trend changes.
Poland 0% - - NA - No action required.
Portugal -2% x - xLarge differences due to reporting
of international bunkers.
No action required, as the bunkers are
reported consistently over the time series w ith
no influence on the trend changes.
Romania 1% - - - - No action required.
Slovenia 2% - - x - No action required.
Slovakia 13% x - NADifferences in the reporting of other
oil, bitumen and lubricants.Check again next year.
Finland 6% x - xDifferences in the reporting of other
oil, bitumen and lubricantsCheck again next year.
Sweden -3% - - - - No action required.
United Kingdom 1% x - -Large differences due to reporting
of international bunkers.
No action required, as the bunkers are
reported consistently over the time series w ith
no influence on the trend changes.
Differences for liquid fuels above 5%
Differences for liquid fuels above 5%
Note: X is used for differences above 5% for the data that is compared, - is used if the differences are
below 5%.

Öko-Institut Early CO2 emissions from energy for the year 2013
69
Table 6-3 Priority list of solid fuel data quality issues by Member State
Member States
Difference in
Total CO2
calculation 2012
w ithout
recalculations
Monthly
vs.
Annual
Eurostat
data 2012
Annual
Eurostat
vs. CRF
inventory
data 2012
Trend
changes
Early national
statistics/
monthly
Eurostat data
2013/2012
Explanation Action
Belgium -2%
Large differences due to reporting of
hard coal, lignite and Coke oven/Gas
coke.
Check again next year.
Bulgaria 3% - - - - No action required.
Czech Republic 0% - - - - No action required.
Denmark 3% - x -
Large differences due to reporting of
fossil fraction of municipal solid w aste in
CRF inventory data.
No action required. Nevertheless gap f illing could be
applied.
Germany -2% - - - - No action required.
Estonia 6% x - -
Large differences due to reporting of oil
shale. Only small amount of stock
changes included under monthly Eurostat
data.
Check again next year.
Ireland 2% x x -
Large differences betw een annual and
monthly Eurostat data due to reporting of
hard coal and peat. Differences betw een
CRF and monthly Eurostat data due to
reporting of peat.
No monthly data provided for peat and hard coal.
Gap filling based on assumption that reported peat
deliveries to main activity producer pow er plants is
66% of total peat consumption. For hard coal
assumption that deliveries to main activity pro-ducer
pow er plants are 77% of the total hard coal
consumption. Continue w ith gap f illing method in
2015.
Greece 6% - - NA - No action required.
Spain 1% - - - - No action required.
France -3% x x -Large differences due to reporting of
hard coal imports.
Eurostat monthly data is more consistent w ith CRF
inventory data. No action required, needs to be
checked next year again.
Italy 0% - - - - No action required.
Cyprus -3% NO NO NA - No action required.
Latvia -5% x - xLarge differences due to reporting of
hard coal imports in 2012.
No action required. Reporting seems to have
improved in 2013. Eurostat monthly data consistent
w ith National statistics in 2013.
Lithuania 1% - - - - No action required.
Luxembourg 2% - - - - No action required.
Hungary 1% - - NA - No action required.
Malta 1% NO NO NA - No action required.
Netherlands -3% x x xLarge differences due to reporting of
hard coal in 2012.
Trend changes for calculating 2013 CO2 emissions
have been corrected by using annual data for hard
coal consumption. Reporting seems to have improved
in 2013. Eurostat monthly data more consistent w ith
National statistics in 2013.
Austria 1% x - xLarge differences due to reporting of
hard coal.
Trend changes for calculating 2013 CO2 emissions
have been corrected by using annual data for hard
coal consumption.
Poland 0% - - NA - No action required.
Portugal -2% - - - - No action required.
Romania 1% - - - - No action required.
Slovenia 2% - - x
Differences due to strong decrease in
solid fuel consumption in monthly Eurostat
data in 2013. Not reflected in ealry
national staistics.
To be checked next year.
Slovakia 13% - - NA - No action required.
Finland 6% - - x
Differences in trend changes due to
calculation in different units. Monthly
Eurostat kt, National statistics TJ.
Trend changes for calculating 2013 CO2 emissions
have been corrected by calculating trend changes
after conversion of data in TJ. This decreases the
differences betw een trend changes to -2%.
Sweden -3% x - -Large differences due to reporting of
hard coal stock changes in 2012.
Stock changes are not reported completely in
monthly data for all years. This leads to differences
in solid fuel consumption. Follow -up w ith SE
necessary.
United Kingdom 1% - - - - No action required.
Differences for solid fuels above 5%
Differences for solid fuels above 5%
x
Note: X is used for differences above 5% for the data that is compared, - is used if the differences are
below 5%.

Öko-Institut Early CO2 emissions from energy for the year 2013
70
Table 6-4 Priority list of natural gas fuel data quality issues by Member State
Member States
Difference
in Total CO2
calculation
2012
w ithout
recalculatio
ns
Monthly
vs.
Annual
Eurostat
data 2012
Annual
Eurostat vs.
CRF
inventory
data 2012
Trend
changes
Early national
statistics/
monthly
Eurostat data
2013/2012
Explanation Action
Belgium -2%Large differences for all
f low s.
Updated monthly data for 2012 have been
provided by Belgium in April 2014.
Bulgaria 3%
Large differences due to
reporting of natural gas
production in 2012.
No action required. Reporting seem to be
improved in 2013. Eurostat monthly data
consistent w ith National statistics in 2013.
Czech Republic 0% - - - - No action required.
Denmark 3% x - x
Large differences due to
reporting of natural gas
imports in 2012.
Updated monthly data for 2012 have been
provided by Denmark in April 2014. This
reduces the differences to -1%.
Germany -2% - - - - No action required.
Estonia 6% - - - - No action required.
Ireland 2% - - - - No action required.
Greece 6% - - NA - No action required.
Spain 1% - - - - No action required.
France -3% - - - - No action required.
Italy 0% - - - - No action required.
Cyprus -3% NO NO NA - No action required.
Latvia -5% - - - - No action required.
Lithuania 1% - - - - No action required.
Luxembourg 2% - - - - No action required.
Hungary 1% - - NA - No action required.
Malta 1% NO NO NA - No action required.
Netherlands -3% - - - - No action required.
Austria 1% - - - - No action required.
Poland 0% - - NA - No action required.
Portugal -2% - - - - No action required.
Romania 1% - - - - No action required.
Slovenia 2% x - x
Large differences due to
reporting of natural gas
imports in 2012.
No action required. Reporting seem to be
improved in 2013. Eurostat monthly data
consistent w ith National statistics in 2013.
Slovakia 13% x - NA
Large differences due to
reporting of natural gas
imports in 2012.
No action required. Reporting seem to be
improved in 2013. To be checked next year.
Finland 6% - - - - No action required.
Sweden -3% - - - - No action required.
United Kingdom 1% - - - - No action required.
x
x
Differences for natural gas above 5%
Note: X is used for differences above 5% for the data that is compared, - is used if the differences are
below 5%

Öko-Institut Early CO2 emissions from energy for the year 2013
71
7 References
Eurostat data:
o Eurostat Monthly Oil and Gas Questionnaires (2008, 2009 and 2010,
2011, 2012, 2013 submissions)
o Eurostat Monthly Coal Questionnaire (2008, 2009, 2010, 2011, 2012,
2013 submissions)
o Data from Eurostat database for monthly and annual fuel consumption
for the years 2008 - 2012
Inventory data: Data as reported by Member States to the UNFCCC in CRF table
1.A.(b). For the comparison of CO2 emissions the most recent submissions (= data for
reference year 2012) from May 2014 were used:
http://unfccc.int/national_reports/annex_i_ghg_inventories/national_inventories_submis
sions/items/8108.php
IPCC/UNEP/OECD/IEA 1997, Revised 1996 IPCC Guidelines for National Greenhouse
Gas Inventories, Paris. Volume 2.
IPCC 2006, 2006 IPCC Guidelines for National Greenhouse Gas Inventories, Prepared
by the National Greenhouse Gas Inventories Programme, Eggleston H.S., Buendia L.,
Miwa K., Ngara T. and Tanabe K. (eds). IGES, Japan.
Early national statistics:
Austria:
http://www.statistik.at/web_de/statistiken/energie_und_umwelt/energie/energiebil
anzen/
Bulgaria:
http://www.nsi.bg/en/content/5019/production-and-deliveries-energy-products
Czech Republic
http://www.mpo.cz/en/energy-and-raw-materials/statistics/
Denmark:
http://www.ens.dk/en/info/facts-figures/energy-statistics-indicators-energy-
efficiency/monthly-statistics
Germany:
http://www.ag-energiebilanzen.de/DE/daten-und-
fakten/primaerenergieverbrauch/primaerenergieverbrauch.html
Estonia:
http://pub.stat.ee/px-
web.2001/I_Databas/Economy/07Energy/02Energy_consumption_and_productio
n/01Annual_statistics/01Annual_statistics.asp
Finland:
http://193.166.171.75/database/statfin/ene/ehk/ehk_en.asp

Öko-Institut Early CO2 emissions from energy for the year 2013
72
France:
http://developpement-
durable.bsocom.fr/statistiques/ReportFolders/reportFolders.aspx
Ireland:
http://www.seai.ie/Publications/Statistics_Publications/Energy_Balance/
Italy:
http://dgerm.sviluppoeconomico.gov.it/dgerm/ben.asp
Latvia:
http://data.csb.gov.lv/Menu.aspx?selection=vide__%C4%AAstermi%C5%86a%2
0statistikas%20dati__Ener%C4%A3%C4%93tika&tablelist=true&px_language=e
n&px_db=vide&rxid=80666b16-4296-4d44-aa1c-ab806e990f07
Lithuania:
http://db1.stat.gov.lt/statbank/default.asp?w=1280
Luxembourg:
http://www.statistiques.public.lu/stat/TableViewer/tableView.aspx?ReportId=4087
&IF_Language=eng&MainTheme=1&FldrName=4&RFPath=50
Netherlands:
http://statline.cbs.nl/StatWeb/dome/?LA=EN
Portugal:
http://www.apren.pt/fotos/newsletter/conteudos/dgeg_2014_balanco_energetico_
sintetico_2013_1404920046.pdf
Romania:
http://www.insse.ro/cms/en/content/statistical-bulletins
Slovenia:
http://pxweb.stat.si/pxweb/Database/Environment/18_energy/01_18179_balance
_indicators/01_18179_balance_indicators.asp
Spain:
http://www.ine.es/jaxi/tabla.do?path=/t38/bme2/t04/a082/l1/&file=1202002.px&typ
e=pcaxis&L=1
Sweden:
http://www.scb.se/Pages/Product____24905.aspx?Produktkod=EN0201&display
publications=true
United Kingdom:
http://www.decc.gov.uk/en/content/cms/statistics/energy_stats/source/source.asp
x

Öko-Institut Early CO2 emissions from energy for the year 2013
73
8 Annex
8.1 Data tables
In the tables in this annex the following colour code is used to indicate differences between datasets:
Green: difference ≤ ± 2%, Yellow: difference ± >2 and ≤ 5%, Red: difference > ± 5%
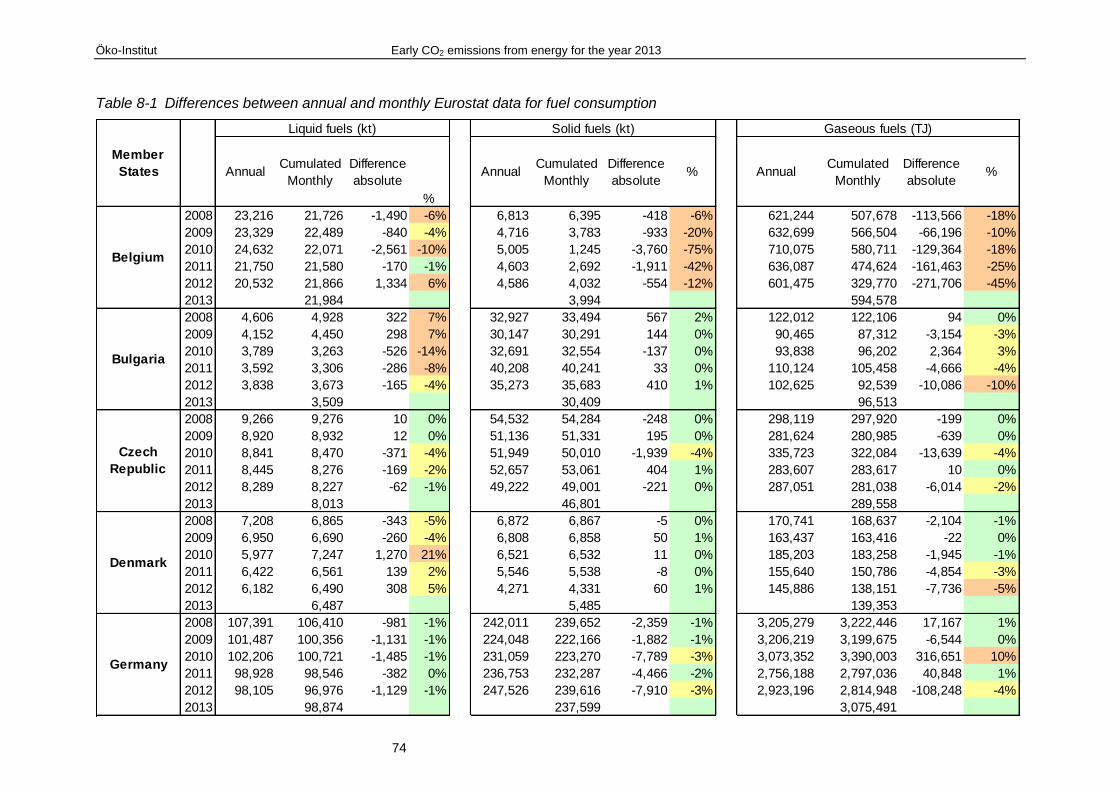
Öko-Institut Early CO2 emissions from energy for the year 2013
74
Table 8-1 Differences between annual and monthly Eurostat data for fuel consumption
AnnualCumulated
Monthly
Difference
absolute
%
AnnualCumulated
Monthly
Difference
absolute% Annual
Cumulated
Monthly
Difference
absolute%
2008 23,216 21,726 -1,490 -6% 6,813 6,395 -418 -6% 621,244 507,678 -113,566 -18%
2009 23,329 22,489 -840 -4% 4,716 3,783 -933 -20% 632,699 566,504 -66,196 -10%
2010 24,632 22,071 -2,561 -10% 5,005 1,245 -3,760 -75% 710,075 580,711 -129,364 -18%
2011 21,750 21,580 -170 -1% 4,603 2,692 -1,911 -42% 636,087 474,624 -161,463 -25%
2012 20,532 21,866 1,334 6% 4,586 4,032 -554 -12% 601,475 329,770 -271,706 -45%
2013 21,984 3,994 594,578
2008 4,606 4,928 322 7% 32,927 33,494 567 2% 122,012 122,106 94 0%
2009 4,152 4,450 298 7% 30,147 30,291 144 0% 90,465 87,312 -3,154 -3%
2010 3,789 3,263 -526 -14% 32,691 32,554 -137 0% 93,838 96,202 2,364 3%
2011 3,592 3,306 -286 -8% 40,208 40,241 33 0% 110,124 105,458 -4,666 -4%
2012 3,838 3,673 -165 -4% 35,273 35,683 410 1% 102,625 92,539 -10,086 -10%
2013 3,509 30,409 96,513
2008 9,266 9,276 10 0% 54,532 54,284 -248 0% 298,119 297,920 -199 0%
2009 8,920 8,932 12 0% 51,136 51,331 195 0% 281,624 280,985 -639 0%
2010 8,841 8,470 -371 -4% 51,949 50,010 -1,939 -4% 335,723 322,084 -13,639 -4%
2011 8,445 8,276 -169 -2% 52,657 53,061 404 1% 283,607 283,617 10 0%
2012 8,289 8,227 -62 -1% 49,222 49,001 -221 0% 287,051 281,038 -6,014 -2%
2013 8,013 46,801 289,558
2008 7,208 6,865 -343 -5% 6,872 6,867 -5 0% 170,741 168,637 -2,104 -1%
2009 6,950 6,690 -260 -4% 6,808 6,858 50 1% 163,437 163,416 -22 0%
2010 5,977 7,247 1,270 21% 6,521 6,532 11 0% 185,203 183,258 -1,945 -1%
2011 6,422 6,561 139 2% 5,546 5,538 -8 0% 155,640 150,786 -4,854 -3%
2012 6,182 6,490 308 5% 4,271 4,331 60 1% 145,886 138,151 -7,736 -5%
2013 6,487 5,485 139,353
2008 107,391 106,410 -981 -1% 242,011 239,652 -2,359 -1% 3,205,279 3,222,446 17,167 1%
2009 101,487 100,356 -1,131 -1% 224,048 222,166 -1,882 -1% 3,206,219 3,199,675 -6,544 0%
2010 102,206 100,721 -1,485 -1% 231,059 223,270 -7,789 -3% 3,073,352 3,390,003 316,651 10%
2011 98,928 98,546 -382 0% 236,753 232,287 -4,466 -2% 2,756,188 2,797,036 40,848 1%
2012 98,105 96,976 -1,129 -1% 247,526 239,616 -7,910 -3% 2,923,196 2,814,948 -108,248 -4%
2013 98,874 237,599 3,075,491
Germany
Czech
Republic
Denmark
Belgium
Bulgaria
Member
States
Liquid fuels (kt) Solid fuels (kt) Gaseous fuels (TJ)

Öko-Institut Early CO2 emissions from energy for the year 2013
75
AnnualCumulated
Monthly
Difference
absolute
%
AnnualCumulated
Monthly
Difference
absolute% Annual
Cumulated
Monthly
Difference
absolute%
2008 617 1,011 394 64% 16,046 16,294 248 2% 32,260 30,491 -1,769 -5%
2009 453 936 483 107% 14,066 15,454 1,388 10% 21,986 19,335 -2,651 -12%
2010 460 996 536 117% 18,207 18,258 51 0% 23,551 20,730 -2,822 -12%
2011 462 989 527 114% 19,023 19,124 101 1% 21,072 20,508 -563 -3%
2012 495 807 312 63% 17,822 19,146 1,324 7% 22,835 22,835 0 0%
2013 310 20,649 23,233
2008 7,406 6,995 -411 -6% 6,470 5,164 -1,306 -20% 187,666 148,332 -39,335 -21%
2009 7,018 7,005 -13 0% 6,177 5,103 -1,074 -17% 179,356 179,431 76 0%
2010 6,831 7,171 340 5% 5,965 3,251 -2,714 -45% 196,608 198,245 1,637 1%
2011 6,019 6,412 393 7% 5,837 5,917 80 1% 172,361 177,456 5,095 3%
2012 5,847 5,750 -97 -2% 6,618 7,104 486 7% 168,076 173,475 5,399 3%
2013 5,891 6,032 168,227
2008 16,667 16,981 314 2% 65,156 63,171 -1,985 -3% 146,795 146,842 47 0%
2009 15,942 16,363 421 3% 65,551 62,025 -3,526 -5% 124,388 124,326 -62 0%
2010 14,226 14,977 751 5% 58,319 50,108 -8,211 -14% 135,398 135,398 0 0%
2011 12,571 12,718 147 1% 60,358 57,015 -3,343 -6% 166,310 166,218 -92 0%
2012 12,501 11,978 -523 -4% 62,261 60,978 -1,283 -2% 153,325 153,502 177 0%
2013 11,181 53,193 135,392
2008 64,388 65,638 1,250 2% 25,903 25,373 -530 -2% 1,461,599 1,456,392 -5,207 0%
2009 59,786 60,953 1,167 2% 19,571 21,589 2,018 10% 1,309,163 1,307,858 -1,306 0%
2010 57,309 57,490 181 0% 14,451 15,426 975 7% 1,305,770 1,303,618 -2,153 0%
2011 54,007 54,060 53 0% 23,926 24,695 769 3% 1,213,828 1,211,493 -2,335 0%
2012 49,044 49,504 460 1% 28,693 29,881 1,188 4% 1,180,239 1,182,644 2,405 0%
2013 46,235 20,420 1,092,011
2008 83,231 85,477 2,246 3% 19,315 19,308 -7 0% 1,669,912 1,660,017 -9,896 -1%
2009 81,024 82,444 1,420 2% 17,287 16,918 -369 -2% 1,610,319 1,487,191 -123,128 -8%
2010 76,266 77,522 1,256 2% 18,162 18,912 750 4% 1,781,056 1,735,830 -45,225 -3%
2011 75,648 80,064 4,416 6% 15,596 16,345 749 5% 1,550,868 1,572,071 21,202 1%
2012 73,169 77,623 4,454 6% 17,342 18,795 1,453 8% 1,600,211 1,523,371 -76,840 -5%
2013 72,122 20,052 1,570,531
Spain
France
Ireland
Greece
Estonia
Member
States
Liquid fuels (kt) Solid fuels (kt) Gaseous fuels (TJ)
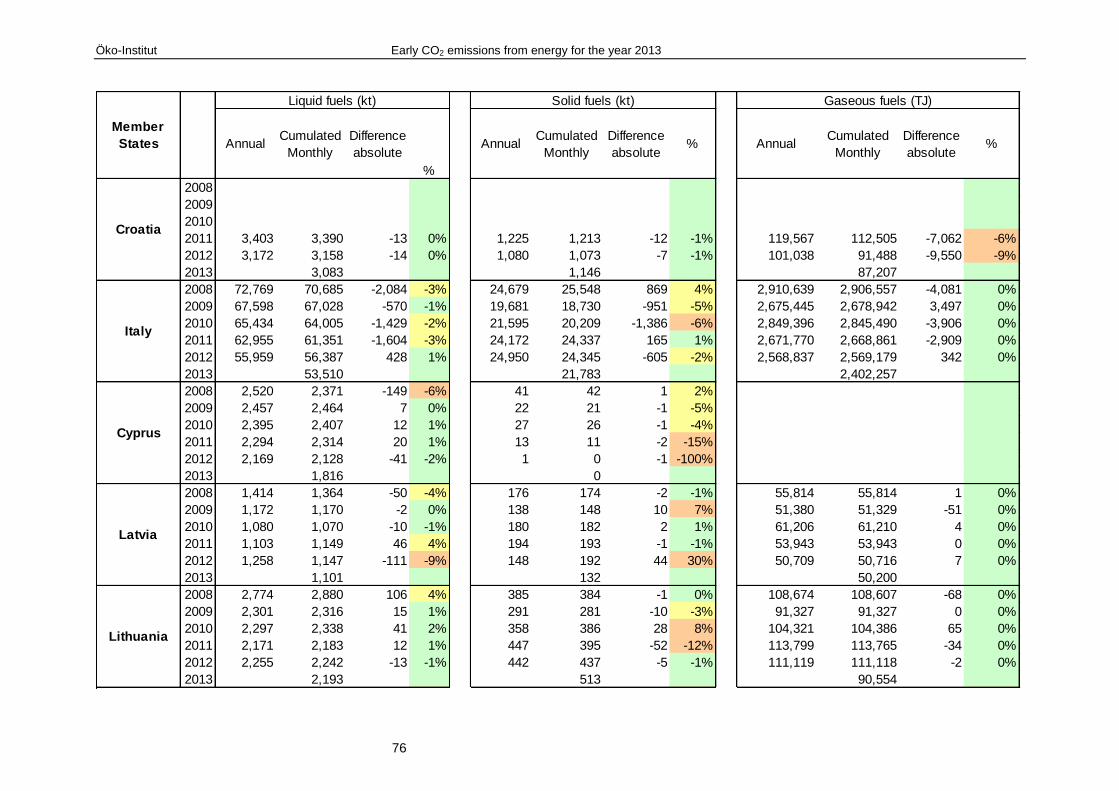
Öko-Institut Early CO2 emissions from energy for the year 2013
76
AnnualCumulated
Monthly
Difference
absolute
%
AnnualCumulated
Monthly
Difference
absolute% Annual
Cumulated
Monthly
Difference
absolute%
2008
2009
2010
2011 3,403 3,390 -13 0% 1,225 1,213 -12 -1% 119,567 112,505 -7,062 -6%
2012 3,172 3,158 -14 0% 1,080 1,073 -7 -1% 101,038 91,488 -9,550 -9%
2013 3,083 1,146 87,207
2008 72,769 70,685 -2,084 -3% 24,679 25,548 869 4% 2,910,639 2,906,557 -4,081 0%
2009 67,598 67,028 -570 -1% 19,681 18,730 -951 -5% 2,675,445 2,678,942 3,497 0%
2010 65,434 64,005 -1,429 -2% 21,595 20,209 -1,386 -6% 2,849,396 2,845,490 -3,906 0%
2011 62,955 61,351 -1,604 -3% 24,172 24,337 165 1% 2,671,770 2,668,861 -2,909 0%
2012 55,959 56,387 428 1% 24,950 24,345 -605 -2% 2,568,837 2,569,179 342 0%
2013 53,510 21,783 2,402,257
2008 2,520 2,371 -149 -6% 41 42 1 2%
2009 2,457 2,464 7 0% 22 21 -1 -5%
2010 2,395 2,407 12 1% 27 26 -1 -4%
2011 2,294 2,314 20 1% 13 11 -2 -15%
2012 2,169 2,128 -41 -2% 1 0 -1 -100%
2013 1,816 0
2008 1,414 1,364 -50 -4% 176 174 -2 -1% 55,814 55,814 1 0%
2009 1,172 1,170 -2 0% 138 148 10 7% 51,380 51,329 -51 0%
2010 1,080 1,070 -10 -1% 180 182 2 1% 61,206 61,210 4 0%
2011 1,103 1,149 46 4% 194 193 -1 -1% 53,943 53,943 0 0%
2012 1,258 1,147 -111 -9% 148 192 44 30% 50,709 50,716 7 0%
2013 1,101 132 50,200
2008 2,774 2,880 106 4% 385 384 -1 0% 108,674 108,607 -68 0%
2009 2,301 2,316 15 1% 291 281 -10 -3% 91,327 91,327 0 0%
2010 2,297 2,338 41 2% 358 386 28 8% 104,321 104,386 65 0%
2011 2,171 2,183 12 1% 447 395 -52 -12% 113,799 113,765 -34 0%
2012 2,255 2,242 -13 -1% 442 437 -5 -1% 111,119 111,118 -2 0%
2013 2,193 513 90,554
Lithuania
Cyprus
Latvia
Croatia
Italy
Member
States
Liquid fuels (kt) Solid fuels (kt) Gaseous fuels (TJ)
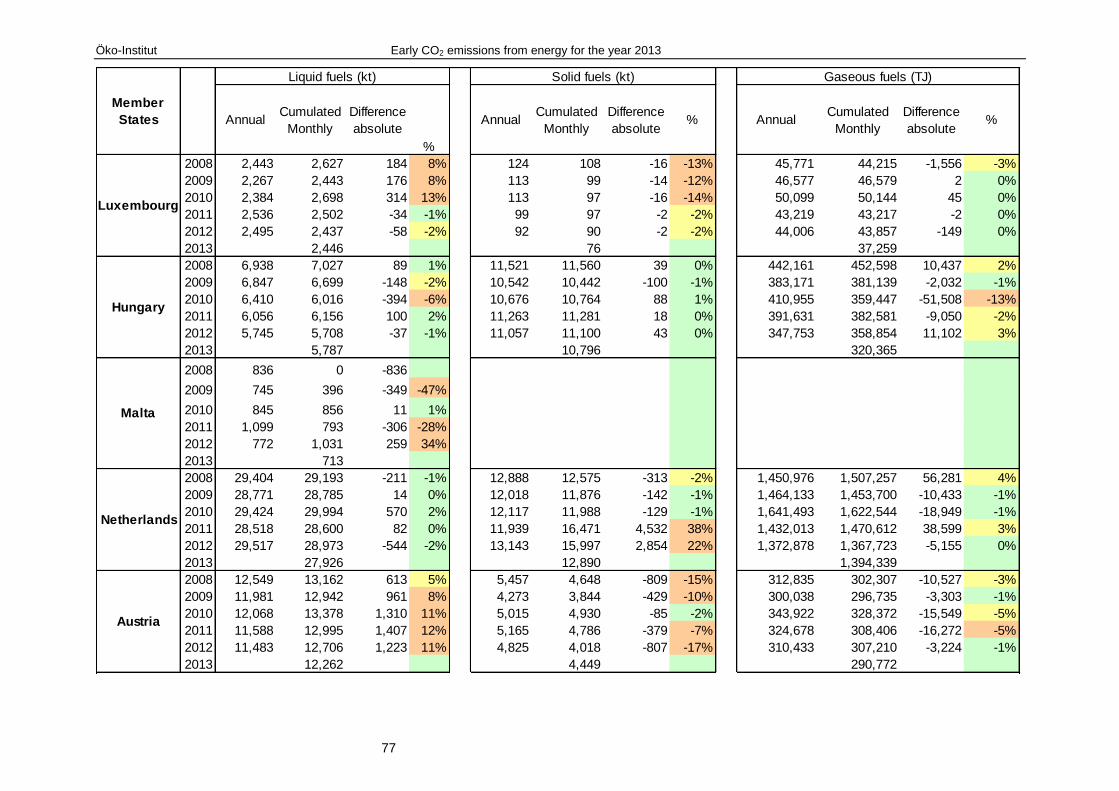
Öko-Institut Early CO2 emissions from energy for the year 2013
77
AnnualCumulated
Monthly
Difference
absolute
%
AnnualCumulated
Monthly
Difference
absolute% Annual
Cumulated
Monthly
Difference
absolute%
2008 2,443 2,627 184 8% 124 108 -16 -13% 45,771 44,215 -1,556 -3%
2009 2,267 2,443 176 8% 113 99 -14 -12% 46,577 46,579 2 0%
2010 2,384 2,698 314 13% 113 97 -16 -14% 50,099 50,144 45 0%
2011 2,536 2,502 -34 -1% 99 97 -2 -2% 43,219 43,217 -2 0%
2012 2,495 2,437 -58 -2% 92 90 -2 -2% 44,006 43,857 -149 0%
2013 2,446 76 37,259
2008 6,938 7,027 89 1% 11,521 11,560 39 0% 442,161 452,598 10,437 2%
2009 6,847 6,699 -148 -2% 10,542 10,442 -100 -1% 383,171 381,139 -2,032 -1%
2010 6,410 6,016 -394 -6% 10,676 10,764 88 1% 410,955 359,447 -51,508 -13%
2011 6,056 6,156 100 2% 11,263 11,281 18 0% 391,631 382,581 -9,050 -2%
2012 5,745 5,708 -37 -1% 11,057 11,100 43 0% 347,753 358,854 11,102 3%
2013 5,787 10,796 320,365
2008 836 0 -836
2009 745 396 -349 -47%
2010 845 856 11 1%
2011 1,099 793 -306 -28%
2012 772 1,031 259 34%
2013 713
2008 29,404 29,193 -211 -1% 12,888 12,575 -313 -2% 1,450,976 1,507,257 56,281 4%
2009 28,771 28,785 14 0% 12,018 11,876 -142 -1% 1,464,133 1,453,700 -10,433 -1%
2010 29,424 29,994 570 2% 12,117 11,988 -129 -1% 1,641,493 1,622,544 -18,949 -1%
2011 28,518 28,600 82 0% 11,939 16,471 4,532 38% 1,432,013 1,470,612 38,599 3%
2012 29,517 28,973 -544 -2% 13,143 15,997 2,854 22% 1,372,878 1,367,723 -5,155 0%
2013 27,926 12,890 1,394,339
2008 12,549 13,162 613 5% 5,457 4,648 -809 -15% 312,835 302,307 -10,527 -3%
2009 11,981 12,942 961 8% 4,273 3,844 -429 -10% 300,038 296,735 -3,303 -1%
2010 12,068 13,378 1,310 11% 5,015 4,930 -85 -2% 343,922 328,372 -15,549 -5%
2011 11,588 12,995 1,407 12% 5,165 4,786 -379 -7% 324,678 308,406 -16,272 -5%
2012 11,483 12,706 1,223 11% 4,825 4,018 -807 -17% 310,433 307,210 -3,224 -1%
2013 12,262 4,449 290,772
Netherlands
Austria
Hungary
Malta
Luxembourg
Member
States
Liquid fuels (kt) Solid fuels (kt) Gaseous fuels (TJ)

Öko-Institut Early CO2 emissions from energy for the year 2013
78
AnnualCumulated
Monthly
Difference
absolute
%
AnnualCumulated
Monthly
Difference
absolute% Annual
Cumulated
Monthly
Difference
absolute%
2008 23,894 20,328 -3,566 -15% 134,794 140,511 5,717 4% 525,307 541,589 16,282 3%
2009 23,531 23,272 -259 -1% 127,528 129,570 2,042 2% 502,567 512,955 10,388 2%
2010 24,715 24,351 -364 -1% 133,746 129,522 -4,224 -3% 536,108 535,396 -713 0%
2011 24,876 25,177 301 1% 138,699 142,424 3,725 3% 537,434 535,915 -1,519 0%
2012 23,714 23,329 -385 -2% 132,657 134,291 1,634 1% 569,447 569,380 -67 0%
2013 21,781 137,563 574,372
2008 12,313 12,942 629 5% 4,160 4,200 40 1% 173,272 172,983 -289 0%
2009 11,467 11,854 387 3% 4,680 4,747 67 1% 176,567 175,348 -1,219 -1%
2010 11,170 11,740 570 5% 2,705 2,442 -263 -10% 187,935 139,263 -48,672 -26%
2011 10,528 10,840 312 3% 3,700 3,700 0 0% 186,884 186,444 -440 0%
2012 8,913 9,457 544 6% 4,874 4,874 0 0% 164,651 168,567 3,916 2%
2013 10,569 4,450 162,206
2008 9,980 10,090 110 1% 40,384 38,719 -1,665 -4% 521,348 503,913 -17,435 -3%
2009 8,463 8,141 -322 -4% 35,136 32,091 -3,045 -9% 443,775 436,497 -7,277 -2%
2010 8,807 8,394 -413 -5% 32,649 32,815 166 1% 451,681 462,542 10,861 2%
2011 8,675 8,871 196 2% 39,010 38,269 -741 -2% 464,946 477,898 12,952 3%
2012 8,486 8,519 33 0% 35,870 35,757 -113 0% 452,715 465,882 13,167 3%
2013 8,094 25,754 430,846
2008 2,916 2,857 -59 -2% 5,236 4,887 -349 -7% 36,789 34,962 -1,828 -5%
2009 2,528 2,472 -56 -2% 4,972 4,755 -217 -4% 34,815 33,599 -1,216 -3%
2010 2,514 2,529 15 1% 4,955 4,928 -27 -1% 36,125 34,594 -1,531 -4%
2011 2,552 2,533 -19 -1% 5,064 4,952 -112 -2% 30,883 28,765 -2,118 -7%
2012 2,503 2,465 -38 -2% 4,985 4,882 -103 -2% 29,730 27,091 -2,639 -9%
2013 2,169 4,045 28,954
2008 3,493 3,490 -3 0% 8,098 8,613 515 6% 216,303 195,151 -21,152 -10%
2009 3,192 3,342 150 5% 7,715 7,806 91 1% 185,238 223,225 37,987 21%
2010 3,372 3,410 38 1% 7,609 6,871 -738 -10% 209,609 212,203 2,594 1%
2011 3,306 3,311 5 0% 7,415 7,557 142 2% 194,144 237,008 42,864 22%
2012 3,132 3,062 -70 -2% 6,982 7,029 47 1% 182,768 225,478 42,710 23%
2013 2,977 6,657 203,223
Slovakia
Romania
Slovenia
Poland
Portugal
Member
States
Liquid fuels (kt) Solid fuels (kt) Gaseous fuels (TJ)

Öko-Institut Early CO2 emissions from energy for the year 2013
79
AnnualCumulated
Monthly
Difference
absolute
%
AnnualCumulated
Monthly
Difference
absolute% Annual
Cumulated
Monthly
Difference
absolute%
2008 9,576 9,987 411 4% 12,995 11,875 -1,120 -9% 161,316 166,348 5,032 3%
2009 9,129 9,292 163 2% 12,761 12,239 -522 -4% 145,872 145,871 -1 0%
2010 8,426 9,344 918 11% 16,750 16,186 -564 -3% 160,668 149,836 -10,832 -7%
2011 9,054 8,755 -299 -3% 14,206 13,841 -365 -3% 140,674 140,148 -526 0%
2012 7,884 8,046 162 2% 11,336 11,593 257 2% 125,819 125,385 -434 0%
2013 7,196 11,337 118,526
2008 13,205 13,006 -199 -2% 4,204 4,174 -30 -1% 34,605 34,564 -41 0%
2009 11,546 11,595 49 0% 3,423 2,844 -579 -17% 50,938 46,529 -4,409 -9%
2010 13,353 13,600 247 2% 4,248 4,637 389 9% 54,969 106,010 51,041 93%
2011 13,541 13,204 -337 -2% 4,239 4,133 -106 -3% 48,287 48,214 -73 0%
2012 12,341 12,262 -79 -1% 3,659 3,131 -528 -14% 42,144 42,098 -47 0%
2013 11,558 3,252 40,068
2008 64,707 74,353 9,646 15% 58,503 58,214 -289 0% 3,536,479 3,626,832 90,353 3%
2009 61,626 77,320 15,694 25% 48,319 48,685 366 1% 3,270,733 3,215,405 -55,328 -2%
2010 60,661 73,331 12,670 21% 50,230 50,285 55 0% 3,550,973 3,525,830 -25,143 -1%
2011 58,510 69,116 10,606 18% 49,797 50,109 312 1% 2,939,218 2,934,731 -4,487 0%
2012 55,966 67,485 11,519 21% 63,316 63,554 238 0% 2,777,984 2,773,037 -4,947 0%
2013 65,912 61,027 2,747,482
2008 526,473 536,047 9,574 2% 495,550 487,272 -8,278 -2% 16,089,129 16,071,406 -17,723 0%
2009 499,921 517,558 17,637 4% 449,426 441,506 -7,920 -2% 15,355,883 15,087,507 -268,376 -2%
2010 490,367 505,289 14,922 3% 452,255 429,518 -22,737 -5% 16,226,916 16,294,551 67,635 0%
2011 472,575 487,304 14,729 3% 465,936 461,965 -3,971 -1% 14,438,024 14,350,316 -87,708 -1%
2012 449,938 467,941 18,003 4% 497,492 492,339 -5,153 -1% 14,179,161 13,712,916 -466,245 -3%
2013 454,153 466,038 13,968,491
2008 595,727 601,670 5,943 1% 799,690 796,234 -3,456 0% 18,447,915 18,414,556 -33,359 0%
2009 564,682 582,149 17,467 3% 731,119 723,696 -7,423 -1% 17,442,230 17,205,208 -237,022 -1%
2010 555,892 569,390 13,498 2% 745,302 715,834 -29,468 -4% 18,490,035 18,503,345 13,311 0%
2011 540,609 555,752 15,143 3% 781,154 780,686 -468 0% 16,759,174 16,702,279 -56,894 0%
2012 515,766 533,437 17,671 3% 793,031 790,930 -2,101 0% 16,436,950 16,009,333 -427,617 -3%
2013 515,699 750,503 16,163,517
EU 15
EU 28
Sweden
United
Kingdom
Finland
Member
States
Liquid fuels (kt) Solid fuels (kt) Gaseous fuels (TJ)

Öko-Institut Early CO2 emissions from energy for the year 2013
80
Table 8-2 Net Calorific Values used for the purposes of converting CRF data in physical units
Belgium Bulgaria
Czech
Republic Denmark Germany Estonia Ireland Greece Spain France
FUEL TYPES
Liquid Primary Crude Oil 41.9 42.5 42.4 43.0 42.7 42.8 42.8 41.9 42.0
Fossil Fuels Other hydrocarbons 41.9 27.7 42.5 41.9 27.5
NGL 44.2 46.0 44.0 41.6 44.0
Secondary Motor spirit 44.0 44.0 43.4 43.8 43.5 44.0 44.6 44.0 44.8 44.0
Fuels Kerosenes - Jet fuels 43.1 43.0 43.3 43.5 42.8 43.0 44.1 44.6 43.4 44.0
Gas / Diesel Oil 42.7 42.3 42.6 42.7 43.0 42.3 43.3 43.0 43.1 42.0
Residual Fuel Oil 40.6 40.0 39.5 40.7 40.4 40.2 41.2 40.2 40.5 40.0
LPG 46.0 46.0 46.0 46.0 46.0 45.5 47.2 47.3 44.8 46.0
Ethane 49.5 47.5
Naphta 44.0 44.0 44.0 44.5 44.0 44.0 45.0 45.0 45.0
Bitumen 37.7 37.7 40.2 39.8 40.2 40.2 37.7 40.2 40.2 40.0
Lubricants 42.3 42.3 40.2 41.9 40.2 40.2 42.3 40.2 40.2 40.0
Petroleum Coke 31.4 31.4 38.5 31.4 31.5 32.5 32.4 32.5 32.0
Refinery Feedstocks 41.9 42.5 39.0 42.7 44.3 42.5 41.3 44.8 44.8
Other Liquid Fossil Refinery gas + paraffin waxes + white spirit & SBP + other petroleum products+ Bitumen + Lubricants1.0 40.4 40.4 52.0 39.5 40.0 40.2 40.2 40.0
Liquid Fossil Totals
Solid Primary Hard Coal 26.3 25.7 22.7 24.2 38.1 27.2 25.2 25.0 22.5 26.0
Lignite 21.6 7.0 12.2 9.7 9.0 19.8 5.3 10.0 17.0
Peat 10.0 7.8 11.6
Secondary BKB (Brown coal / peat briquettes) and Patent Fuel 24.7 12.5 20.8 19.7 18.5 32.0
Fuels Coke Oven Coke + Gas Coke 29.3 28.5 28.4 28.5 16.1 28.5 27.8 27.7 28.0

Öko-Institut Early CO2 emissions from energy for the year 2013
81
Croatia Italy Cyprus Latvia Lithuania Luxembourg Hungary Malta Netherlands Austria
FUEL TYPES
Liquid Primary Crude Oil 42.7 42.6 42.20 42.8 40.8 42.2 42.5
Fossil Fuels Other hydrocarbons 40.0
NGL 42.5 43.0 44.0 42.5
Secondary Motor spirit 44.6 44.0 44.8 44.0 44.8 43.0 42.0 44.8 44.0 41.3
Fuels Kerosenes - Jet fuels 44.0 43.0 44.6 43.2 43.2 43.1 42.0 44.1 43.5 43.3
Gas / Diesel Oil 42.7 42.6 43.3 42.5 43.1 42.5 42.0 43.3 42.7 42.1
Residual Fuel Oil 40.2 40.0 40.2 40.6 40.1 40.0 40.0 40.2 40.0 40.4
LPG 46.9 46.0 47.3 45.5 46.4 46.0 47.0 47.3 45.2 46.1
Ethane 47.5
Naphta 44.6 44.0 42.0 44.0 45.0
Bitumen 33.5 40.2 41.9 39.0 40.2 37.7 41.9 44.3
Lubricants 33.5 42.0 40.2 41.9 42.0 40.2 39.8 41.4 41.8
Petroleum Coke 31.0 32.0 31.0 33.0 31.5 29.4 35.2
Refinery Feedstocks 42.6 41.9 44.0 41.8 42.6
Other Liquid Fossil Refinery gas + paraffin waxes + white spirit & SBP + other petroleum products+ Bitumen + Lubricants42.7 40.0 40.2 41.9 40.0 39.5 40.1 41.0 40.0 44.3
Liquid Fossil Totals
Solid Primary Hard Coal 24.6 26.6 25.5 26.2 25.1 24.4 24.9 24.7 27.3
Lignite 10.7 10.5 11.9 22.2 7.2 20.0 19.4
Peat 10.1 11.7 8.8
Secondary BKB (Brown coal / peat briquettes) and Patent Fuel 16.7 24.7 22.2 24.7 19.3
Fuels Coke Oven Coke + Gas Coke 29.3 28.5 26.8 28.5 28.5 28.5 28.5 29.0

Öko-Institut Early CO2 emissions from energy for the year 2013
82
21 22 23 25 26 10 24 28
Poland Portugal Romania Slovenia Slovakia Finland Sw eden
United
Kingdom
FUEL TYPES
Liquid Primary Crude Oil 42.6 42.4 41.4 42.0 42.7 36.3 43.4
Fossil Fuels Other hydrocarbons 28.0 38.9 42.5 27.5 1.0 28.2
NGL 49.5 37.0 45.2 1.0 46.9
Secondary Motor spirit 44.0 44.0 43.5 43.6 43.7 43.0 32.8 44.8
Fuels Kerosenes - Jet fuels 43.0 43.8 48.8 43.5 43.3 43.3 35.3 43.9
Gas / Diesel Oil 42.6 42.6 42.4 42.6 42.2 42.8 35.3 43.3
Residual Fuel Oil 40.0 40.0 39.4 41.4 40.4 40.8 38.2 41.2
LPG 46.0 46.0 48.1 46.1 46.0 46.2 46.1 45.4
Ethane 47.4 50.4 47.5
Naphta 44.0 44.0 44.0 43.6 44.3 28.5 45.4
Bitumen 39.0 39.0 35.2 40.2 40.2 40.2 41.9 40.2
Lubricants 42.0 42.0 35.2 42.1 42.0 40.2 41.4 40.2
Petroleum Coke 32.0 32.0 34.3 31.8 34.9 33.5 34.8 34.0
Refinery Feedstocks 42.5 44.0 44.8 43.9 42.5 36.3 42.5
Other Liquid Fossil Refinery gas + paraffin waxes + white spirit & SBP + other petroleum products+ Bitumen + Lubricants1.0 40.0 40.0 40.2 30.0 42.0 32.8 40.9
Liquid Fossil Totals
Solid Primary Hard Coal 22.4 25.2 22.0 25.5 25.5 25.5 27.2 24.7
Lignite 8.4 16.4 7.8 10.7 10.6
Peat 8.8 9.8 10.1 11.5 12.8
Secondary BKB (Brown coal / peat briquettes) and Patent Fuel 1.0 25.6 1.0 31.0
Fuels Coke Oven Coke + Gas Coke 28.5 17.6 31.8 29.9 28.0 28.1 28.1 28.3

Öko-Institut Early CO2 emissions from energy for the year 2013
83
Table 8-3 Comparison of calculation approaches of trend changes for CO2 emissions with different ways
of converting the units
Early estimates
2013 Eurostat
(conversion to
energy units)
Early estimates
2013 Eurostat
(physical units)
Belgium 87,589 87,372 0.0% -0.3%
Bulgaria 41,264 41,570 -10.8% -10.2%
Czech Republic 97,474 96,497 -1.9% -2.9%
Denmark 40,824 40,222 6.8% 6.8%
Germany 762,038 759,926 2.3% 2.0%
Estonia 18,316 18,291 4.5% 4.4%
Ireland 33,996 34,160 -4.2% -3.7%
Greece 76,326 76,614 -10.5% -10.2%
Spain 224,836 224,052 -12.3% -12.6%
France 345,891 345,741 0.7% 0.6%
Croatia 16,214 16,226 -1.7% -1.7%
Italy 341,666 341,503 -6.5% -6.6%
Cyprus 5,540 5,547 -14.8% -14.7%
Latvia 6,411 6,404 -4.1% -4.2%
Lithuania 10,819 10,819 -5.8% -5.8%
Luxembourg 9,705 9,723 -3.9% -3.7%
Hungary 39,747 40,518 -6.8% -5.0%
Malta 2,538 2,518 -6.0% -6.8%
Netherlands 162,029 162,039 -0.3% -0.3%
Austria 59,323 59,289 -2.1% -2.1%
Poland 289,639 290,219 0.1% 0.3%
Portugal 47,004 46,919 3.8% 3.6%
Romania 63,709 63,419 -14.2% -14.6%
Slovenia 12,998 12,982 -11.9% -12.0%
Slovakia 25,780 25,518 -5.3% -6.2%
Finland 43,118 41,434 0.0% -6.6%
Sweden 36,897 36,511 -3.2% -4.2%
United Kingdom 454,823 454,924 -2.4% -2.4%
EU 15 2,726,065 2,720,428 -2.1% -2.2%
EU 13 630,450 630,528 -3.8% -3.9%
EU 28 3,356,515 3,350,955 -2.4% -2.5%
Total CO2 emissions, Reference
Approach [Gg CO2]
Difference
relative
2013/2012
approach
based on
energy
units
Difference
relative
2013/2012
approach
based on
physical
units
Member States
Note: The sum of EU 15, EU13 and EU 28 does not equal the sum in chapter 4.2; this is due to the use of the trend
changes calculated in energy units only for solid fuels for Hungary and Finland.
Results for HU and FI are different from Table 4-5 as only the trend change for solid fuels was changed

Öko-Institut Early CO2 emissions from energy for the year 2013
84
Table 8-4 Trend changes of aggregate fuel categories – comparison between Eurostat monthly, Early national statistics, Eurostat annual and
CRF data
Eurostat
Monthly
Early
national
statistics
Eurostat
annual CRF
Eurostat
Monthly
Early
national
statistics
Eurostat
annual CRF
Eurostat
Monthly
Early
national
statistics
Eurostat
annual CRF
2009/2008 104% 100% 100% 59% 69% 71% 112% 102% 102%
2010/2009 98% 106% 111% 33% 106% 81% 103% 112% 112%
2011/2010 98% 88% 91% 216% 92% 91% 82% 90% 90%
2012/2011 101% 94% 112% 150% 100% 99% 69% 95% 94%
2013/2012 101% 99% 180%
2009/2008 90% 90% 91% 90% 92% 92% 72% 74% 74%
2010/2009 73% 91% 92% 107% 108% 108% 110% 104% 106%
2011/2010 101% 95% 95% 124% 123% 123% 110% 117% 114%
2012/2011 111% 111% 107% 106% 89% 87% 88% 88% 88% 93% 93% 93%
2013/2012 96% 93% 85% 87% 104% 97%
2009/2008 96% 96% 96% 95% 94% 89% 94% 94% 94%
2010/2009 95% 99% 98% 97% 102% 104% 115% 119% 119%
2011/2010 98% 96% 97% 106% 101% 103% 88% 84% 84%
2012/2011 99% 98% 98% 92% 93% 0% 99% 101% 101%
2013/2012 97% 95% 96% 97% 103% 101%
2009/2008 97% 96% 92% 100% 99% 100% 97% 96% 96%
2010/2009 108% 86% 103% 95% 96% 95% 112% 113% 114%
2011/2010 91% 107% 96% 85% 85% 85% 82% 84% 84%
2012/2011 99% 96% 96% 95% 78% 77% 77% 79% 92% 93% 94% 94%
2013/2012 100% 99% 127% 129% 101% 94%
2009/2008 94% 95% 95% 93% 93% 90% 99% 100% 96%
2010/2009 100% 101% 102% 100% 103% 107% 106% 96% 105%
2011/2010 98% 97% 97% 104% 102% 102% 83% 90% 91%
2012/2011 98% 99% 99% 101% 103% 104% 105% 100% 101% 101% 106% 107%
2013/2012 102% 102% 99% 101% 109% 111%
Member States
Liquid fuels
Denmark
Germany
Belgium
Bulgaria
Czech Republic
Solid fuels Gaseous fuels

Öko-Institut Early CO2 emissions from energy for the year 2013
85
Eurostat
Monthly
Early
national
statistics
Eurostat
annual CRF
Eurostat
Monthly
Early
national
statistics
Eurostat
annual CRF
Eurostat
Monthly
Early
national
statistics
Eurostat
annual CRF
2009/2008 93% 73% 92% 95% 88% 87% 63% 68% 78%
2010/2009 106% 102% 113% 118% 129% 129% 107% 107% 107%
2011/2010 99% 100% 97% 105% 104% 105% 99% 89% 90%
2012/2011 82% 94% 107% 96% 100% 99% 94% 94% 111% 104% 108% 104%
2013/2012 38% 63% 108% 109% 102% 103%
2009/2008 100% 95% 87% 99% 95% 95% 121% 96% 96%
2010/2009 102% 97% 95% 64% 97% 98% 110% 110% 109%
2011/2010 89% 88% 92% 182% 98% 97% 90% 88% 88%
2012/2011 90% 88% 97% 89% 120% 113% 113% 106% 98% 95% 98% 98%
2013/2012 102% 101% 85% 89% 97% 100%
2009/2008 96% 96% 99% 98% 101% 100% 85% 85% 82%
2010/2009 92% 89% 87% 81% 89% 89% 109% 109% 108%
2011/2010 85% 88% 93% 114% 103% 104% 123% 123% 121%
2012/2011 94% 99% 87% 107% 103% 103% 92% 92% 92%
2013/2012 93% 87% 88%
2009/2008 93% 93% 93% 85% 76% 75% 90% 90% 90%
2010/2009 94% 96% 96% 71% 74% 74% 100% 100% 100%
2011/2010 94% 94% 94% 160% 166% 166% 93% 93% 93%
2012/2011 92% 93% 91% 91% 121% 118% 120% 120% 98% 97% 97% 97%
2013/2012 93% 98% 68% 68% 92% 93%
2009/2008 96% 97% 93% 88% 90% 83% 90% 96% 96%
2010/2009 94% 94% 96% 112% 105% 108% 117% 111% 111%
2011/2010 103% 99% 99% 86% 86% 87% 91% 87% 82%
2012/2011 97% 98% 97% 98% 115% 112% 111% 112% 97% 104% 103% 108%
2013/2012 93% 99% 107% 108% 103% 101%
Member States
Liquid fuels
Spain
France
Ireland
Greece
Estonia
Solid fuels Gaseous fuels
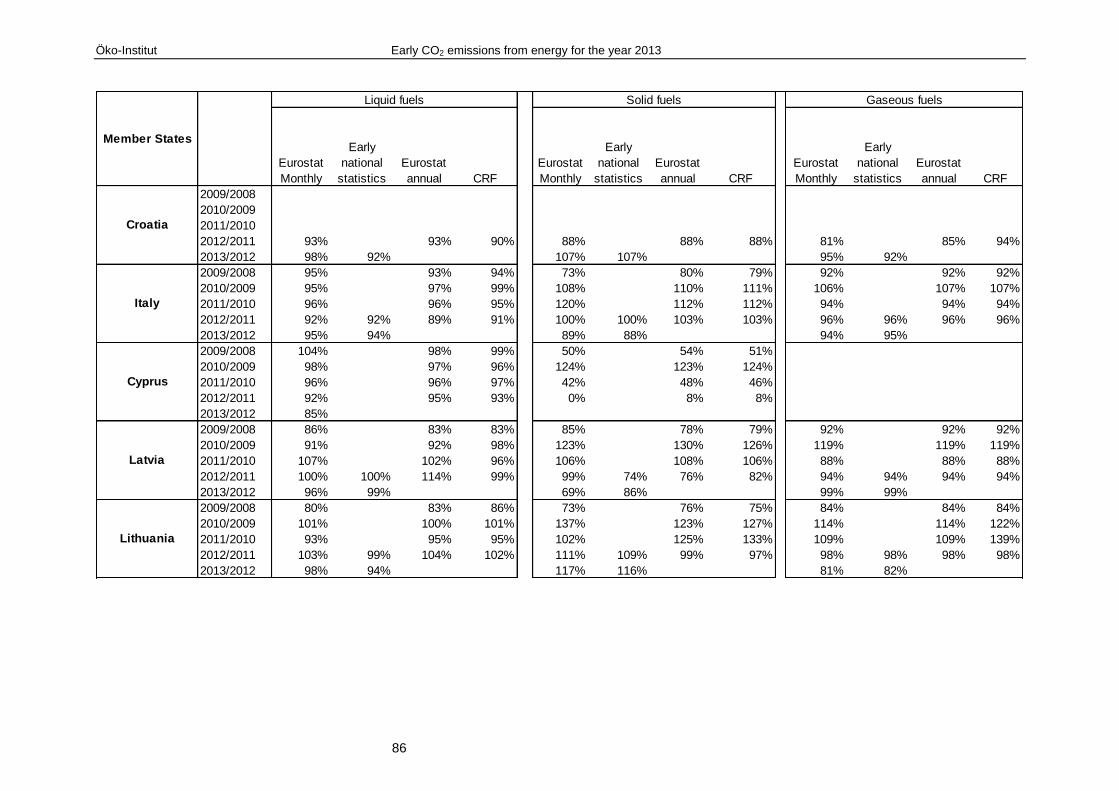
Öko-Institut Early CO2 emissions from energy for the year 2013
86
Eurostat
Monthly
Early
national
statistics
Eurostat
annual CRF
Eurostat
Monthly
Early
national
statistics
Eurostat
annual CRF
Eurostat
Monthly
Early
national
statistics
Eurostat
annual CRF
2009/2008
2010/2009
2011/2010
2012/2011 93% 93% 90% 88% 88% 88% 81% 85% 94%
2013/2012 98% 92% 107% 107% 95% 92%
2009/2008 95% 93% 94% 73% 80% 79% 92% 92% 92%
2010/2009 95% 97% 99% 108% 110% 111% 106% 107% 107%
2011/2010 96% 96% 95% 120% 112% 112% 94% 94% 94%
2012/2011 92% 92% 89% 91% 100% 100% 103% 103% 96% 96% 96% 96%
2013/2012 95% 94% 89% 88% 94% 95%
2009/2008 104% 98% 99% 50% 54% 51%
2010/2009 98% 97% 96% 124% 123% 124%
2011/2010 96% 96% 97% 42% 48% 46%
2012/2011 92% 95% 93% 0% 8% 8%
2013/2012 85%
2009/2008 86% 83% 83% 85% 78% 79% 92% 92% 92%
2010/2009 91% 92% 98% 123% 130% 126% 119% 119% 119%
2011/2010 107% 102% 96% 106% 108% 106% 88% 88% 88%
2012/2011 100% 100% 114% 99% 99% 74% 76% 82% 94% 94% 94% 94%
2013/2012 96% 99% 69% 86% 99% 99%
2009/2008 80% 83% 86% 73% 76% 75% 84% 84% 84%
2010/2009 101% 100% 101% 137% 123% 127% 114% 114% 122%
2011/2010 93% 95% 95% 102% 125% 133% 109% 109% 139%
2012/2011 103% 99% 104% 102% 111% 109% 99% 97% 98% 98% 98% 98%
2013/2012 98% 94% 117% 116% 81% 82%
Member States
Liquid fuels
Lithuania
Italy
Cyprus
Latvia
Croatia
Solid fuels Gaseous fuels

Öko-Institut Early CO2 emissions from energy for the year 2013
87
Eurostat
Monthly
Early
national
statistics
Eurostat
annual CRF
Eurostat
Monthly
Early
national
statistics
Eurostat
annual CRF
Eurostat
Monthly
Early
national
statistics
Eurostat
annual CRF
2009/2008 93% 93% 93% 92% 91% 91% 105% 102% 102%
2010/2009 110% 105% 117% 98% 100% 100% 108% 108% 108%
2011/2010 93% 106% 106% 100% 88% 88% 86% 86% 86%
2012/2011 97% 98% 97% 93% 93% 92% 101% 102% 102%
2013/2012 100% 105% 84% 85%
2009/2008 95% 99% 96% 90% 92% 84% 84% 87% 87%
2010/2009 90% 94% 95% 103% 101% 107% 94% 107% 107%
2011/2010 102% 94% 100% 105% 105% 103% 106% 95% 95%
2012/2011 93% 95% 94% 98% 98% 92% 94% 89% 89%
2013/2012 101% 97% 89%
2009/2008 89%
2010/2009 216% 113% 89%
2011/2010 93% 130% 100%
2012/2011 130% 70% 106%
2013/2012 69%
2009/2008 99% 98% 97% 94% 93% 93% 96% 101% 101%
2010/2009 104% 102% 105% 101% 101% 101% 112% 112% 112%
2011/2010 95% 97% 95% 137% 99% 98% 91% 87% 87%
2012/2011 101% 103% 104% 102% 97% 110% 110% 115% 93% 96% 96% 96%
2013/2012 96% 98% 81% 99% 102% 102%
2009/2008 98% 95% 96% 83% 78% 78% 98% 96% 98%
2010/2009 103% 101% 104% 128% 117% 119% 111% 115% 110%
2011/2010 97% 96% 93% 97% 103% 102% 94% 94% 94%
2012/2011 98% 99% 99% 84% 93% 94% 100% 96% 95%
2013/2012 97% 102% 111% 101% 95% 94%
Member States
Liquid fuels
Austria
Hungary
Malta
Netherlands
Luxembourg
Solid fuels Gaseous fuels

Öko-Institut Early CO2 emissions from energy for the year 2013
88
Eurostat
Monthly
Early
national
statistics
Eurostat
annual CRF
Eurostat
Monthly
Early
national
statistics
Eurostat
annual CRF
Eurostat
Monthly
Early
national
statistics
Eurostat
annual CRF
2009/2008 114% 98% 98% 92% 95% 94% 95% 96% 99%
2010/2009 105% 105% 105% 100% 105% 106% 104% 107% 107%
2011/2010 103% 101% 99% 110% 104% 108% 100% 100% 100%
2012/2011 93% 95% 112% 94% 96% 95% 106% 106% 106%
2013/2012 93% 102% 101%
2009/2008 92% 93% 93% 113% 113% 113% 101% 102% 102%
2010/2009 99% 97% 95% 51% 58% 58% 79% 106% 106%
2011/2010 92% 94% 93% 152% 137% 134% 134% 99% 100%
2012/2011 87% 90% 85% 90% 132% 132% 132% 133% 90% 90% 88% 88%
2013/2012 112% 98% 91% 93% 96% 96%
2009/2008 81% 85% 80% 83% 87% 77% 87% 85% 85%
2010/2009 103% 104% 109% 102% 93% 92% 106% 102% 102%
2011/2010 106% 99% 103% 117% 119% 118% 103% 103% 103%
2012/2011 96% 96% 98% 97% 93% 93% 92% 95% 97% 98% 97% 97%
2013/2012 95% 98% 72% 74% 92% 96%
2009/2008 87% 87% 87% 97% 95% 95% 96% 95% 95%
2010/2009 102% 99% 98% 104% 100% 100% 103% 104% 104%
2011/2010 100% 102% 100% 100% 102% 102% 83% 85% 86%
2012/2011 97% 98% 98% 98% 99% 97% 98% 99% 94% 96% 96% 96%
2013/2012 88% 94% 83% 96% 107% 97%
2009/2008 96% 91% 91% 91% 95% 95% 114% 86% 86%
2010/2009 102% 106% 105% 88% 99% 94% 95% 113% 113%
2011/2010 97% 98% 98% 110% 97% 103% 112% 93% 92%
2012/2011 92% 95% 96% 93% 94% 94% 95% 94% 94%
2013/2012 97% 95% 90%
Member States
Liquid fuels
Slovakia
Portugal
Romania
Slovenia
Poland
Solid fuels Gaseous fuels

Öko-Institut Early CO2 emissions from energy for the year 2013
89
Eurostat
Monthly
Early
national
statistics
Eurostat
annual CRF
Eurostat
Monthly
Early
national
statistics
Eurostat
annual CRF
Eurostat
Monthly
Early
national
statistics
Eurostat
annual CRF
2009/2008 93% 95% 95% 103% 98% 102% 88% 90% 90%
2010/2009 101% 92% 102% 132% 131% 129% 103% 110% 110%
2011/2010 94% 107% 100% 86% 85% 85% 94% 88% 88%
2012/2011 92% 98% 87% 87% 84% 85% 80% 78% 89% 89% 89% 90%
2013/2012 89% 96% 98% 106% 95% 93%
2009/2008 89% 87% 96% 68% 81% 80% 135% 147% 133%
2010/2009 117% 116% 107% 163% 124% 127% 228% 108% 134%
2011/2010 97% 101% 98% 89% 100% 95% 45% 88% 79%
2012/2011 93% 97% 91% 92% 76% 92% 86% 99% 87% 90% 87% 87%
2013/2012 94% 99% 104% 104% 95% 94%
2009/2008 104% 95% 95% 84% 83% 76% 89% 92% 92%
2010/2009 95% 98% 100% 103% 104% 104% 110% 109% 108%
2011/2010 94% 96% 97% 100% 99% 99% 83% 83% 83%
2012/2011 98% 97% 96% 97% 127% 124% 127% 127% 94% 95% 95% 95%
2013/2012 98% 98% 96% 94% 99% 99%
2009/2008 97% 95% 95% 91% 91% 90% 94% 95% 95%
2010/2009 98% 98% 99% 97% 101% 103% 108% 106% 108%
2011/2010 96% 96% 96% 108% 103% 103% 88% 89% 89%
2012/2011 96% 95% 96% 107% 107% 104% 96% 98% 99%
2013/2012 97% 95% 102%
2009/2008 97% 95% 95% 91% 91% 91% 93% 95% 94%
2010/2009 98% 98% 99% 99% 102% 103% 108% 106% 108%
2011/2010 98% 97% 96% 109% 105% 105% 90% 91% 90%
2012/2011 96% 95% 96% 101% 102% 100% 96% 98% 99%
2013/2012 97% 95% 101%
Member States
Liquid fuels
United Kingdom
EU 15
EU 28
Finland
Sweden
Solid fuels Gaseous fuels
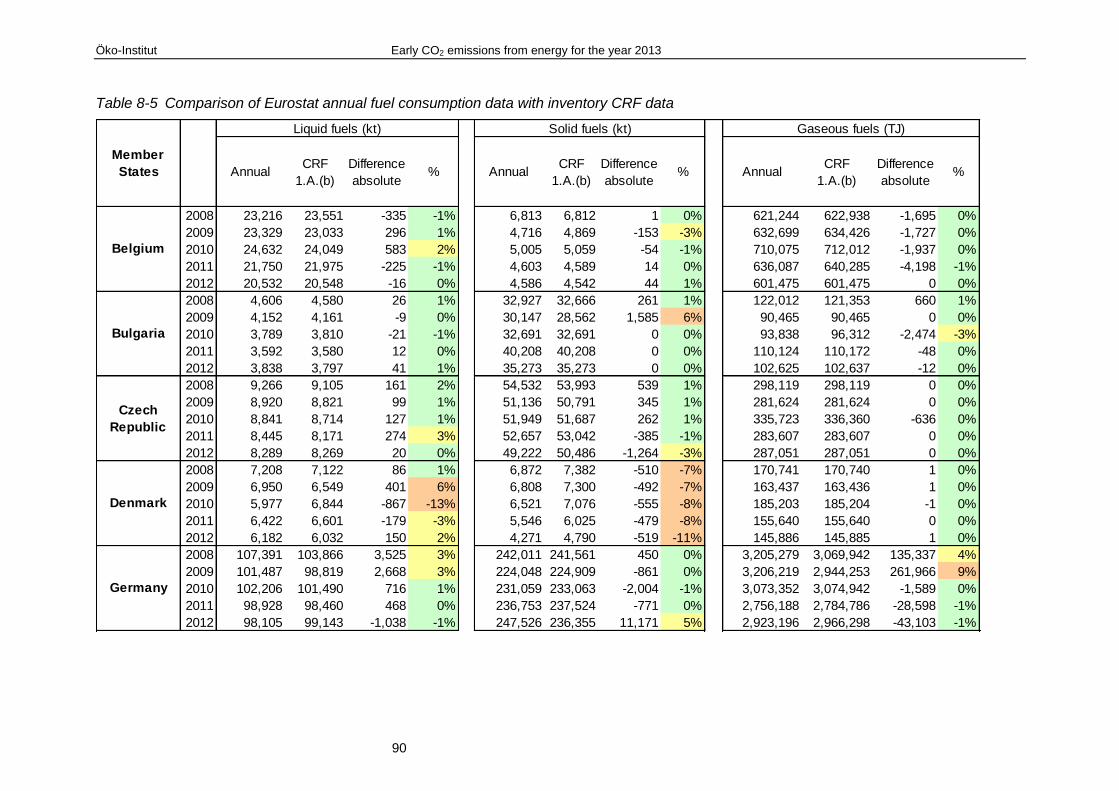
Öko-Institut Early CO2 emissions from energy for the year 2013
90
Table 8-5 Comparison of Eurostat annual fuel consumption data with inventory CRF data
AnnualCRF
1.A.(b)
Difference
absolute% Annual
CRF
1.A.(b)
Difference
absolute% Annual
CRF
1.A.(b)
Difference
absolute%
2008 23,216 23,551 -335 -1% 6,813 6,812 1 0% 621,244 622,938 -1,695 0%
2009 23,329 23,033 296 1% 4,716 4,869 -153 -3% 632,699 634,426 -1,727 0%
2010 24,632 24,049 583 2% 5,005 5,059 -54 -1% 710,075 712,012 -1,937 0%
2011 21,750 21,975 -225 -1% 4,603 4,589 14 0% 636,087 640,285 -4,198 -1%
2012 20,532 20,548 -16 0% 4,586 4,542 44 1% 601,475 601,475 0 0%
2008 4,606 4,580 26 1% 32,927 32,666 261 1% 122,012 121,353 660 1%
2009 4,152 4,161 -9 0% 30,147 28,562 1,585 6% 90,465 90,465 0 0%
2010 3,789 3,810 -21 -1% 32,691 32,691 0 0% 93,838 96,312 -2,474 -3%
2011 3,592 3,580 12 0% 40,208 40,208 0 0% 110,124 110,172 -48 0%
2012 3,838 3,797 41 1% 35,273 35,273 0 0% 102,625 102,637 -12 0%
2008 9,266 9,105 161 2% 54,532 53,993 539 1% 298,119 298,119 0 0%
2009 8,920 8,821 99 1% 51,136 50,791 345 1% 281,624 281,624 0 0%
2010 8,841 8,714 127 1% 51,949 51,687 262 1% 335,723 336,360 -636 0%
2011 8,445 8,171 274 3% 52,657 53,042 -385 -1% 283,607 283,607 0 0%
2012 8,289 8,269 20 0% 49,222 50,486 -1,264 -3% 287,051 287,051 0 0%
2008 7,208 7,122 86 1% 6,872 7,382 -510 -7% 170,741 170,740 1 0%
2009 6,950 6,549 401 6% 6,808 7,300 -492 -7% 163,437 163,436 1 0%
2010 5,977 6,844 -867 -13% 6,521 7,076 -555 -8% 185,203 185,204 -1 0%
2011 6,422 6,601 -179 -3% 5,546 6,025 -479 -8% 155,640 155,640 0 0%
2012 6,182 6,032 150 2% 4,271 4,790 -519 -11% 145,886 145,885 1 0%
2008 107,391 103,866 3,525 3% 242,011 241,561 450 0% 3,205,279 3,069,942 135,337 4%
2009 101,487 98,819 2,668 3% 224,048 224,909 -861 0% 3,206,219 2,944,253 261,966 9%
2010 102,206 101,490 716 1% 231,059 233,063 -2,004 -1% 3,073,352 3,074,942 -1,589 0%
2011 98,928 98,460 468 0% 236,753 237,524 -771 0% 2,756,188 2,784,786 -28,598 -1%
2012 98,105 99,143 -1,038 -1% 247,526 236,355 11,171 5% 2,923,196 2,966,298 -43,103 -1%
Belgium
Bulgaria
Czech
Republic
Denmark
Germany
Member
States
Liquid fuels (kt) Solid fuels (kt) Gaseous fuels (TJ)
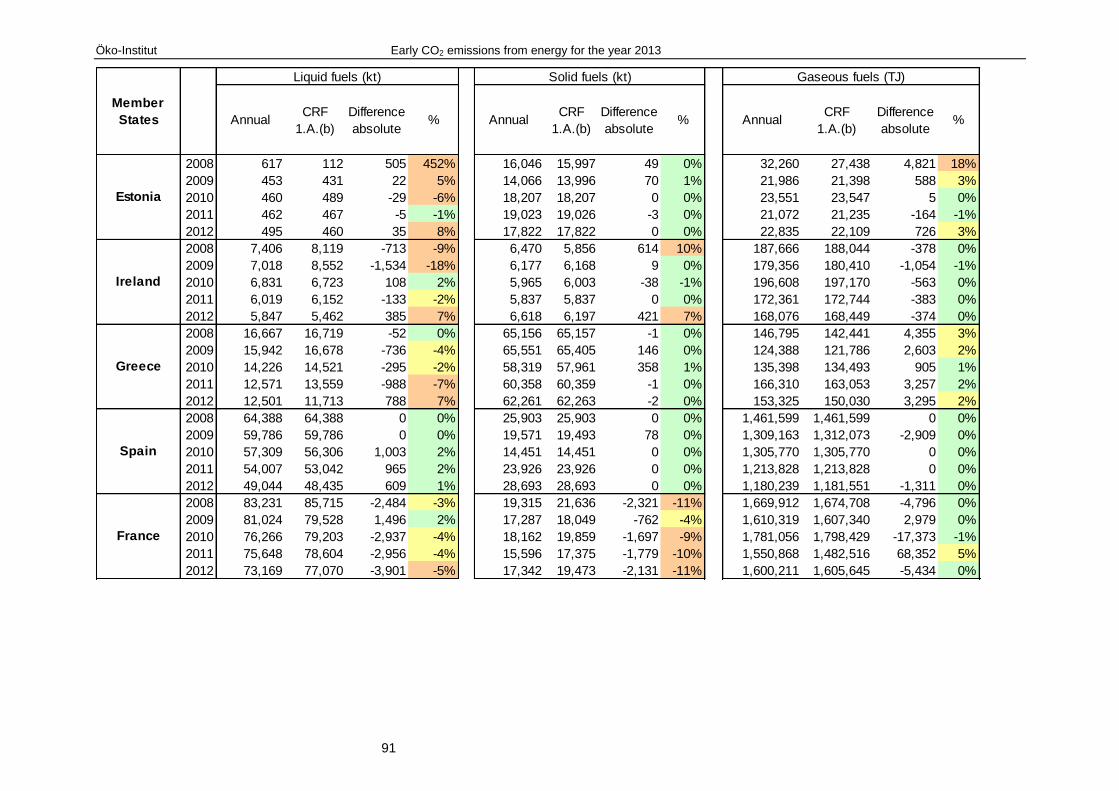
Öko-Institut Early CO2 emissions from energy for the year 2013
91
AnnualCRF
1.A.(b)
Difference
absolute% Annual
CRF
1.A.(b)
Difference
absolute% Annual
CRF
1.A.(b)
Difference
absolute%
2008 617 112 505 452% 16,046 15,997 49 0% 32,260 27,438 4,821 18%
2009 453 431 22 5% 14,066 13,996 70 1% 21,986 21,398 588 3%
2010 460 489 -29 -6% 18,207 18,207 0 0% 23,551 23,547 5 0%
2011 462 467 -5 -1% 19,023 19,026 -3 0% 21,072 21,235 -164 -1%
2012 495 460 35 8% 17,822 17,822 0 0% 22,835 22,109 726 3%
2008 7,406 8,119 -713 -9% 6,470 5,856 614 10% 187,666 188,044 -378 0%
2009 7,018 8,552 -1,534 -18% 6,177 6,168 9 0% 179,356 180,410 -1,054 -1%
2010 6,831 6,723 108 2% 5,965 6,003 -38 -1% 196,608 197,170 -563 0%
2011 6,019 6,152 -133 -2% 5,837 5,837 0 0% 172,361 172,744 -383 0%
2012 5,847 5,462 385 7% 6,618 6,197 421 7% 168,076 168,449 -374 0%
2008 16,667 16,719 -52 0% 65,156 65,157 -1 0% 146,795 142,441 4,355 3%
2009 15,942 16,678 -736 -4% 65,551 65,405 146 0% 124,388 121,786 2,603 2%
2010 14,226 14,521 -295 -2% 58,319 57,961 358 1% 135,398 134,493 905 1%
2011 12,571 13,559 -988 -7% 60,358 60,359 -1 0% 166,310 163,053 3,257 2%
2012 12,501 11,713 788 7% 62,261 62,263 -2 0% 153,325 150,030 3,295 2%
2008 64,388 64,388 0 0% 25,903 25,903 0 0% 1,461,599 1,461,599 0 0%
2009 59,786 59,786 0 0% 19,571 19,493 78 0% 1,309,163 1,312,073 -2,909 0%
2010 57,309 56,306 1,003 2% 14,451 14,451 0 0% 1,305,770 1,305,770 0 0%
2011 54,007 53,042 965 2% 23,926 23,926 0 0% 1,213,828 1,213,828 0 0%
2012 49,044 48,435 609 1% 28,693 28,693 0 0% 1,180,239 1,181,551 -1,311 0%
2008 83,231 85,715 -2,484 -3% 19,315 21,636 -2,321 -11% 1,669,912 1,674,708 -4,796 0%
2009 81,024 79,528 1,496 2% 17,287 18,049 -762 -4% 1,610,319 1,607,340 2,979 0%
2010 76,266 79,203 -2,937 -4% 18,162 19,859 -1,697 -9% 1,781,056 1,798,429 -17,373 -1%
2011 75,648 78,604 -2,956 -4% 15,596 17,375 -1,779 -10% 1,550,868 1,482,516 68,352 5%
2012 73,169 77,070 -3,901 -5% 17,342 19,473 -2,131 -11% 1,600,211 1,605,645 -5,434 0%
Ireland
Greece
Spain
France
Estonia
Member
States
Liquid fuels (kt) Solid fuels (kt) Gaseous fuels (TJ)

Öko-Institut Early CO2 emissions from energy for the year 2013
92
AnnualCRF
1.A.(b)
Difference
absolute% Annual
CRF
1.A.(b)
Difference
absolute% Annual
CRF
1.A.(b)
Difference
absolute%
2008
2009
2010
2011 3,403 3,522 -119 -3% 1,225 1,224 1 0% 119,567 107,610 11,957 11%
2012 3,172 3,167 5 0% 1,080 1,081 -1 0% 101,038 101,781 -743 -1%
2008 72,769 76,214 -3,445 -5% 24,679 24,083 596 2% 2,910,639 2,908,665 1,973 0%
2009 67,598 72,318 -4,720 -7% 19,681 19,398 283 1% 2,675,445 2,673,630 1,815 0%
2010 65,434 68,672 -3,238 -5% 21,595 21,333 262 1% 2,849,396 2,847,466 1,930 0%
2011 62,955 65,270 -2,315 -4% 24,172 23,824 348 1% 2,671,770 2,669,961 1,809 0%
2012 55,959 59,176 -3,217 -5% 24,950 24,500 450 2% 2,568,837 2,567,407 1,429 0%
2008 2,520 2,365 155 7% 41 26 15 60%
2009 2,457 2,349 108 5% 22 13 9 68%
2010 2,395 2,370 25 1% 27 26 1 4%
2011 2,294 2,294 0 0% 13 12 1 8%
2012 2,169 2,135 34 2% 1 1 0 0%
2008 1,414 1,420 -6 0% 176 176 0 0% 55,814 55,894 -81 0%
2009 1,172 1,174 -2 0% 138 135 3 2% 51,380 51,493 -113 0%
2010 1,080 1,115 -35 -3% 180 170 10 6% 61,206 61,313 -107 0%
2011 1,103 1,089 14 1% 194 180 14 8% 53,943 53,998 -55 0%
2012 1,258 1,226 32 3% 148 148 0 0% 50,709 50,812 -104 0%
2008 2,774 2,809 -35 -1% 385 351 34 10% 108,674 108,673 1 0%
2009 2,301 2,429 -128 -5% 291 267 24 9% 91,327 91,329 -2 0%
2010 2,297 2,494 -197 -8% 358 331 27 8% 104,321 82,007 22,314 27%
2011 2,171 2,372 -201 -8% 447 440 7 2% 113,799 113,817 -18 0%
2012 2,255 2,425 -170 -7% 442 426 16 4% 111,119 111,132 -13 0%
Cyprus
Latvia
Lithuania
Croatia
Italy
Member
States
Liquid fuels (kt) Solid fuels (kt) Gaseous fuels (TJ)

Öko-Institut Early CO2 emissions from energy for the year 2013
93
AnnualCRF
1.A.(b)
Difference
absolute% Annual
CRF
1.A.(b)
Difference
absolute% Annual
CRF
1.A.(b)
Difference
absolute%
2008 2,443 2,484 -41 -2% 124 105 19 18% 45,771 45,744 27 0%
2009 2,267 2,310 -43 -2% 113 221 -108 -49% 46,577 46,577 0 0%
2010 2,384 2,390 -6 0% 113 113 0 0% 50,099 50,099 0 0%
2011 2,536 2,506 30 1% 99 99 0 0% 43,219 43,219 0 0%
2012 2,495 2,404 91 4% 92 92 0 0% 44,006 44,005 0 0%
2008 6,938 6,983 -45 -1% 11,521 12,789 -1,268 -10% 442,161 442,161 0 0%
2009 6,847 6,789 58 1% 10,542 11,073 -531 -5% 383,171 383,171 0 0%
2010 6,410 6,449 -39 -1% 10,676 11,592 -916 -8% 410,955 410,955 0 0%
2011 6,056 6,413 -357 -6% 11,263 11,983 -720 -6% 391,631 391,506 124 0%
2012 5,745 5,779 -34 -1% 11,057 11,034 23 0% 347,753 347,753 0 0%
2008 836 0 836
2009 745 802 -57 -7%
2010 845 817 28 3%
2011 1,099 817 282 34%
2012 772 864 -92 -11%
2008 29,404 28,845 559 2% 12,888 12,960 -72 -1% 1,450,976 1,454,108 -3,132 0%
2009 28,771 28,017 754 3% 12,018 12,086 -68 -1% 1,464,133 1,465,789 -1,656 0%
2010 29,424 29,149 275 1% 12,117 12,253 -136 -1% 1,641,493 1,642,667 -1,174 0%
2011 28,518 27,756 762 3% 11,939 12,065 -126 -1% 1,432,013 1,433,555 -1,542 0%
2012 29,517 29,887 -370 -1% 13,143 13,900 -757 -5% 1,372,878 1,372,754 124 0%
2008 12,549 12,660 -111 -1% 5,457 5,321 136 3% 312,835 315,995 -3,160 -1%
2009 11,981 12,134 -153 -1% 4,273 4,284 -11 0% 300,038 316,162 -16,125 -5%
2010 12,068 12,534 -466 -4% 5,015 5,033 -18 0% 343,922 347,395 -3,474 -1%
2011 11,588 11,712 -124 -1% 5,165 5,157 8 0% 324,678 327,957 -3,279 -1%
2012 11,483 11,442 41 0% 4,825 4,826 -1 0% 310,433 310,433 1 0%
Netherlands
Austria
Luxembourg
Hungary
Malta
Member
States
Liquid fuels (kt) Solid fuels (kt) Gaseous fuels (TJ)
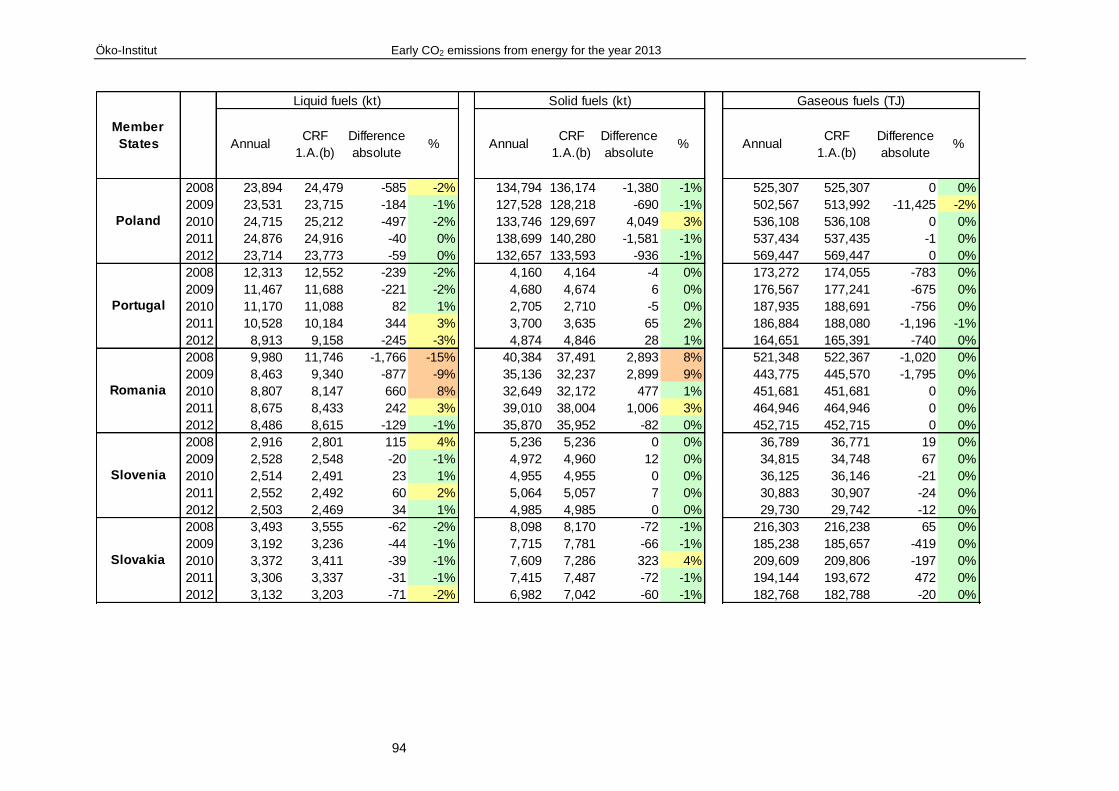
Öko-Institut Early CO2 emissions from energy for the year 2013
94
AnnualCRF
1.A.(b)
Difference
absolute% Annual
CRF
1.A.(b)
Difference
absolute% Annual
CRF
1.A.(b)
Difference
absolute%
2008 23,894 24,479 -585 -2% 134,794 136,174 -1,380 -1% 525,307 525,307 0 0%
2009 23,531 23,715 -184 -1% 127,528 128,218 -690 -1% 502,567 513,992 -11,425 -2%
2010 24,715 25,212 -497 -2% 133,746 129,697 4,049 3% 536,108 536,108 0 0%
2011 24,876 24,916 -40 0% 138,699 140,280 -1,581 -1% 537,434 537,435 -1 0%
2012 23,714 23,773 -59 0% 132,657 133,593 -936 -1% 569,447 569,447 0 0%
2008 12,313 12,552 -239 -2% 4,160 4,164 -4 0% 173,272 174,055 -783 0%
2009 11,467 11,688 -221 -2% 4,680 4,674 6 0% 176,567 177,241 -675 0%
2010 11,170 11,088 82 1% 2,705 2,710 -5 0% 187,935 188,691 -756 0%
2011 10,528 10,184 344 3% 3,700 3,635 65 2% 186,884 188,080 -1,196 -1%
2012 8,913 9,158 -245 -3% 4,874 4,846 28 1% 164,651 165,391 -740 0%
2008 9,980 11,746 -1,766 -15% 40,384 37,491 2,893 8% 521,348 522,367 -1,020 0%
2009 8,463 9,340 -877 -9% 35,136 32,237 2,899 9% 443,775 445,570 -1,795 0%
2010 8,807 8,147 660 8% 32,649 32,172 477 1% 451,681 451,681 0 0%
2011 8,675 8,433 242 3% 39,010 38,004 1,006 3% 464,946 464,946 0 0%
2012 8,486 8,615 -129 -1% 35,870 35,952 -82 0% 452,715 452,715 0 0%
2008 2,916 2,801 115 4% 5,236 5,236 0 0% 36,789 36,771 19 0%
2009 2,528 2,548 -20 -1% 4,972 4,960 12 0% 34,815 34,748 67 0%
2010 2,514 2,491 23 1% 4,955 4,955 0 0% 36,125 36,146 -21 0%
2011 2,552 2,492 60 2% 5,064 5,057 7 0% 30,883 30,907 -24 0%
2012 2,503 2,469 34 1% 4,985 4,985 0 0% 29,730 29,742 -12 0%
2008 3,493 3,555 -62 -2% 8,098 8,170 -72 -1% 216,303 216,238 65 0%
2009 3,192 3,236 -44 -1% 7,715 7,781 -66 -1% 185,238 185,657 -419 0%
2010 3,372 3,411 -39 -1% 7,609 7,286 323 4% 209,609 209,806 -197 0%
2011 3,306 3,337 -31 -1% 7,415 7,487 -72 -1% 194,144 193,672 472 0%
2012 3,132 3,203 -71 -2% 6,982 7,042 -60 -1% 182,768 182,788 -20 0%
Slovakia
Poland
Portugal
Romania
Slovenia
Member
States
Liquid fuels (kt) Solid fuels (kt) Gaseous fuels (TJ)
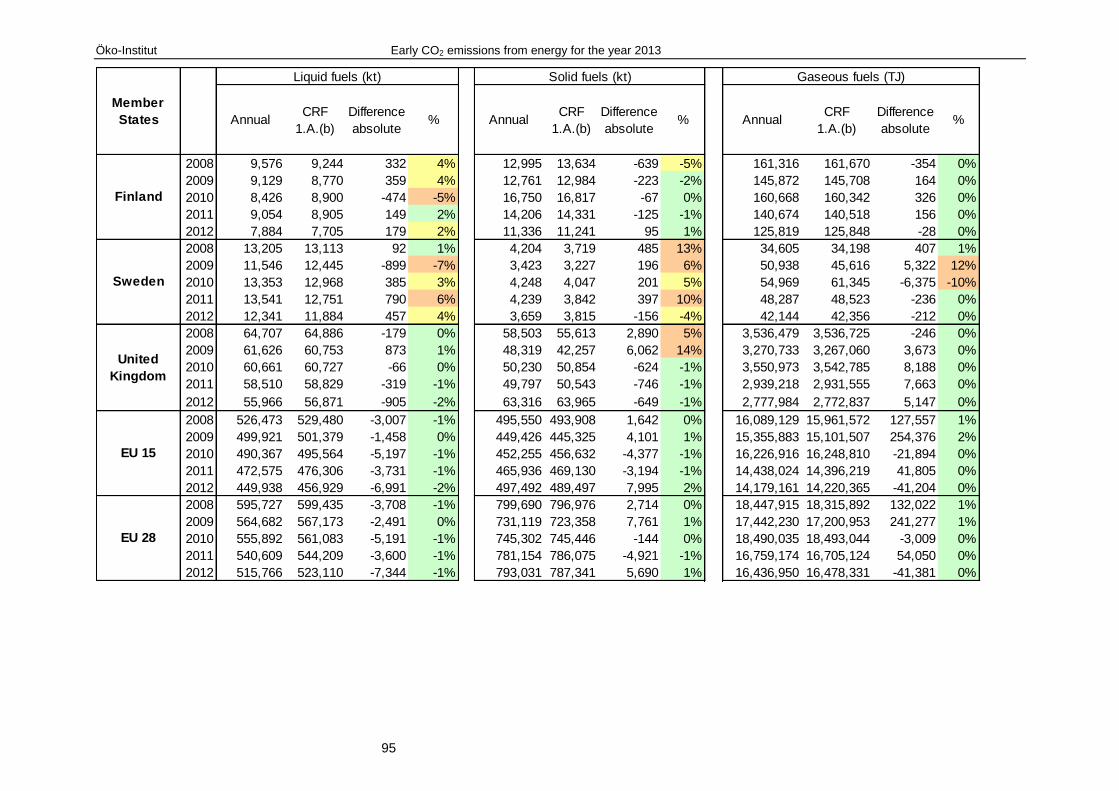
Öko-Institut Early CO2 emissions from energy for the year 2013
95
AnnualCRF
1.A.(b)
Difference
absolute% Annual
CRF
1.A.(b)
Difference
absolute% Annual
CRF
1.A.(b)
Difference
absolute%
2008 9,576 9,244 332 4% 12,995 13,634 -639 -5% 161,316 161,670 -354 0%
2009 9,129 8,770 359 4% 12,761 12,984 -223 -2% 145,872 145,708 164 0%
2010 8,426 8,900 -474 -5% 16,750 16,817 -67 0% 160,668 160,342 326 0%
2011 9,054 8,905 149 2% 14,206 14,331 -125 -1% 140,674 140,518 156 0%
2012 7,884 7,705 179 2% 11,336 11,241 95 1% 125,819 125,848 -28 0%
2008 13,205 13,113 92 1% 4,204 3,719 485 13% 34,605 34,198 407 1%
2009 11,546 12,445 -899 -7% 3,423 3,227 196 6% 50,938 45,616 5,322 12%
2010 13,353 12,968 385 3% 4,248 4,047 201 5% 54,969 61,345 -6,375 -10%
2011 13,541 12,751 790 6% 4,239 3,842 397 10% 48,287 48,523 -236 0%
2012 12,341 11,884 457 4% 3,659 3,815 -156 -4% 42,144 42,356 -212 0%
2008 64,707 64,886 -179 0% 58,503 55,613 2,890 5% 3,536,479 3,536,725 -246 0%
2009 61,626 60,753 873 1% 48,319 42,257 6,062 14% 3,270,733 3,267,060 3,673 0%
2010 60,661 60,727 -66 0% 50,230 50,854 -624 -1% 3,550,973 3,542,785 8,188 0%
2011 58,510 58,829 -319 -1% 49,797 50,543 -746 -1% 2,939,218 2,931,555 7,663 0%
2012 55,966 56,871 -905 -2% 63,316 63,965 -649 -1% 2,777,984 2,772,837 5,147 0%
2008 526,473 529,480 -3,007 -1% 495,550 493,908 1,642 0% 16,089,129 15,961,572 127,557 1%
2009 499,921 501,379 -1,458 0% 449,426 445,325 4,101 1% 15,355,883 15,101,507 254,376 2%
2010 490,367 495,564 -5,197 -1% 452,255 456,632 -4,377 -1% 16,226,916 16,248,810 -21,894 0%
2011 472,575 476,306 -3,731 -1% 465,936 469,130 -3,194 -1% 14,438,024 14,396,219 41,805 0%
2012 449,938 456,929 -6,991 -2% 497,492 489,497 7,995 2% 14,179,161 14,220,365 -41,204 0%
2008 595,727 599,435 -3,708 -1% 799,690 796,976 2,714 0% 18,447,915 18,315,892 132,022 1%
2009 564,682 567,173 -2,491 0% 731,119 723,358 7,761 1% 17,442,230 17,200,953 241,277 1%
2010 555,892 561,083 -5,191 -1% 745,302 745,446 -144 0% 18,490,035 18,493,044 -3,009 0%
2011 540,609 544,209 -3,600 -1% 781,154 786,075 -4,921 -1% 16,759,174 16,705,124 54,050 0%
2012 515,766 523,110 -7,344 -1% 793,031 787,341 5,690 1% 16,436,950 16,478,331 -41,381 0%
Finland
Sweden
United
Kingdom
EU 15
EU 28
Member
States
Liquid fuels (kt) Solid fuels (kt) Gaseous fuels (TJ)

Öko-Institut Early CO2 emissions from energy for the year 2013
96
8.2 Gaps and zero values
Table 8-6 List of gaps for individual months examined in the monthly fuel data for the year 2013
MS Product in kilo tonnes1 Flow Jan Feb Mar Apr May Jun Jul Aug Sep Oct Nov Dec Total Notes
BG Natural gas1 Stock change -3380 -2780 -1583 2 2095 2698 3776 2617 1489 -1147 3787 Gap due to stock change
CZ Natural gas Production 688 688 740 688 635 580 608 571 567 571 New data sent
CZ Natural gas Imports 19,351 27,469 130,823 122,968 120,375 118,837 128,459 120,010 116,573 113,809 New data sent
CZ Natural gas Exports 299 328 104,387 103,465 99,942 88,886 94,369 87,509 85,584 80,896 New data sent
CZ Natural gas Stock change -27,008 -12,655 -14,382 -5,365 4,588 17,299 23,327 21,592 16,011 8,606 New data sent
DK Kerosene Type Jet Fuel Total exports 27 1 1 4 5 5 18 1 1 4 3 70 Minor gap(s)
DE Petroleum Coke Stock change -4 -2 1 -1 -3 13 -1 5 -38 8 -22 Minor gap(s)
IE Kerosene Type Jet Fuel Int. Aviation 37 34 42 57 62 68 65 57 52 44 42 560 3247A includes this value in April
GR Motor Gasoline Total imports 33 25 28 29 30 36 33 45 27 28 25 339 Not relevant
GR Gas/Diesel oil Bunkers 21 17 24 21 22 22 23 24 26 19 20 239 Not relevant
GR Heating and other Gasoil Total exports 25 10 17 72 30 40 71 13 15 10 19 322 Not relevant
GR Heating and other Gasoil Bunkers 21 17 24 21 22 22 23 24 26 19 20 239 Not relevant
GR Petroleum Coke Total imports 14 10 111 53 191 165 19 14 100 122 28 827 Not relevant
GR Gas/Diesel Oil2 Bunkers 21 17 24 21 22 22 23 24 26 19 20 239 Not relevant
ES Naphta Total imports 136 77 133 85 136 73 153 138 34 108 122 1195 Explained
HR Naphta Total exports 8 3 1 3 2 2 2 1 1 4 27 Plausible
HR Fuel Oil - High Sulphur Total exports 27 33 6 39 42 21 40 34 45 9 34 330 Not relevant
IT Motor Gasoline Stock change 218 -59 -119 -7 -204 102 69 49 10 -83 -236 -260 Not relevant
LV Natural gas1 Total imports 5955 15510 16507 14541 19222 18656 7778 98169 Explained
LV Natural gas1 Total exports 9133 4170 8329 1222 311 420 320 3373 4331 31609 Explained
LV Kerosene Type Jet Fuel2 Total exports 5 1 6 2 1 3 1 1 20 Minor gap(s)
LT Natural gas1 Stock change 37 -74 -37 111 -74 37 37 -37 74 74 Stock change
HU Crude Oil Stock change 32 -13 -20 53 20 2 -27 -61 -42 -42 -98 Stock change
HU Refinery Feedstocks Stock change -15 3 76 -17 -67 9 1 26 -4 20 20 52 Stock change
NL Other Kerosene Stock change 70 -69 5 6 -7 11 2 4 -12 24 -10 24 Plausible
AT Refinery Feedstocks Total imports 3 2 5 Minor gap(s)
PT Natural gas1 Total exports 37 665 661 689 437 5920 2413 843 379 3373 90 15507 Low amount, quantitative impact minor
RO Petroleum Coke Total imports 10 1 27 6 6 4 17 5 3 12 2 93 Not relevant
RO Motor Gasoline Stock change 16 -9 -35 -6 13 11 -37 9 24 20 6 Stock change
SI Natural gas1 Total exports 3739 3663 3242 3147 3047 3108 2394 1957 3728 4256 3914 36195 New data sent
SK Natural gas1 Total exports 113997 140677 138156 135488 152825 176808 166534 174179 164559 156806 185764 1705793 New data sent
FI Natural Gas Liquids Total imports 35 40 85 68 42 73 87 64 24 35 45 598 Not relevant
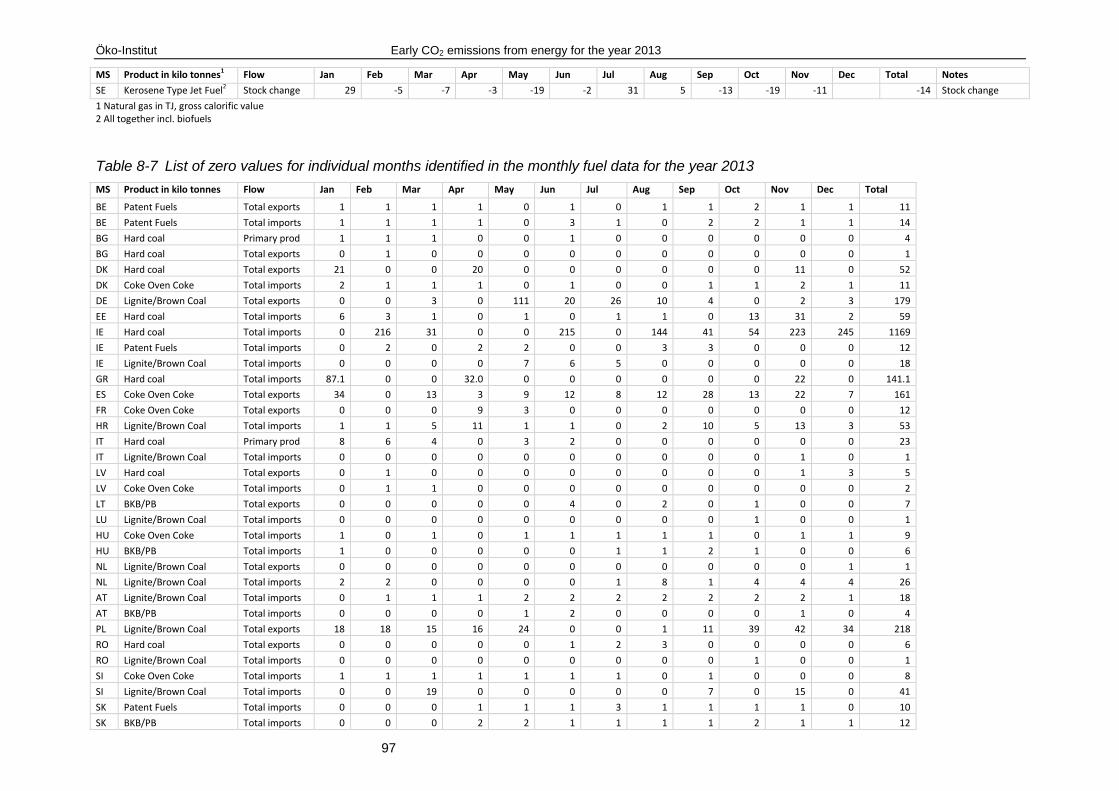
Öko-Institut Early CO2 emissions from energy for the year 2013
97
MS Product in kilo tonnes1 Flow Jan Feb Mar Apr May Jun Jul Aug Sep Oct Nov Dec Total Notes
SE Kerosene Type Jet Fuel2 Stock change 29 -5 -7 -3 -19 -2 31 5 -13 -19 -11 -14 Stock change
1 Natural gas in TJ, gross calorific value 2 All together incl. biofuels
Table 8-7 List of zero values for individual months identified in the monthly fuel data for the year 2013
MS Product in kilo tonnes Flow Jan Feb Mar Apr May Jun Jul Aug Sep Oct Nov Dec Total
BE Patent Fuels Total exports 1 1 1 1 0 1 0 1 1 2 1 1 11
BE Patent Fuels Total imports 1 1 1 1 0 3 1 0 2 2 1 1 14
BG Hard coal Primary prod 1 1 1 0 0 1 0 0 0 0 0 0 4
BG Hard coal Total exports 0 1 0 0 0 0 0 0 0 0 0 0 1
DK Hard coal Total exports 21 0 0 20 0 0 0 0 0 0 11 0 52
DK Coke Oven Coke Total imports 2 1 1 1 0 1 0 0 1 1 2 1 11
DE Lignite/Brown Coal Total exports 0 0 3 0 111 20 26 10 4 0 2 3 179
EE Hard coal Total imports 6 3 1 0 1 0 1 1 0 13 31 2 59
IE Hard coal Total imports 0 216 31 0 0 215 0 144 41 54 223 245 1169
IE Patent Fuels Total imports 0 2 0 2 2 0 0 3 3 0 0 0 12
IE Lignite/Brown Coal Total imports 0 0 0 0 7 6 5 0 0 0 0 0 18
GR Hard coal Total imports 87.1 0 0 32.0 0 0 0 0 0 0 22 0 141.1
ES Coke Oven Coke Total exports 34 0 13 3 9 12 8 12 28 13 22 7 161
FR Coke Oven Coke Total exports 0 0 0 9 3 0 0 0 0 0 0 0 12
HR Lignite/Brown Coal Total imports 1 1 5 11 1 1 0 2 10 5 13 3 53
IT Hard coal Primary prod 8 6 4 0 3 2 0 0 0 0 0 0 23
IT Lignite/Brown Coal Total imports 0 0 0 0 0 0 0 0 0 0 1 0 1
LV Hard coal Total exports 0 1 0 0 0 0 0 0 0 0 1 3 5
LV Coke Oven Coke Total imports 0 1 1 0 0 0 0 0 0 0 0 0 2
LT BKB/PB Total exports 0 0 0 0 0 4 0 2 0 1 0 0 7
LU Lignite/Brown Coal Total imports 0 0 0 0 0 0 0 0 0 1 0 0 1
HU Coke Oven Coke Total imports 1 0 1 0 1 1 1 1 1 0 1 1 9
HU BKB/PB Total imports 1 0 0 0 0 0 1 1 2 1 0 0 6
NL Lignite/Brown Coal Total exports 0 0 0 0 0 0 0 0 0 0 0 1 1
NL Lignite/Brown Coal Total imports 2 2 0 0 0 0 1 8 1 4 4 4 26
AT Lignite/Brown Coal Total imports 0 1 1 1 2 2 2 2 2 2 2 1 18
AT BKB/PB Total imports 0 0 0 0 1 2 0 0 0 0 1 0 4
PL Lignite/Brown Coal Total exports 18 18 15 16 24 0 0 1 11 39 42 34 218
RO Hard coal Total exports 0 0 0 0 0 1 2 3 0 0 0 0 6
RO Lignite/Brown Coal Total imports 0 0 0 0 0 0 0 0 0 1 0 0 1
SI Coke Oven Coke Total imports 1 1 1 1 1 1 1 0 1 0 0 0 8
SI Lignite/Brown Coal Total imports 0 0 19 0 0 0 0 0 7 0 15 0 41
SK Patent Fuels Total imports 0 0 0 1 1 1 3 1 1 1 1 0 10
SK BKB/PB Total imports 0 0 0 2 2 1 1 1 1 2 1 1 12
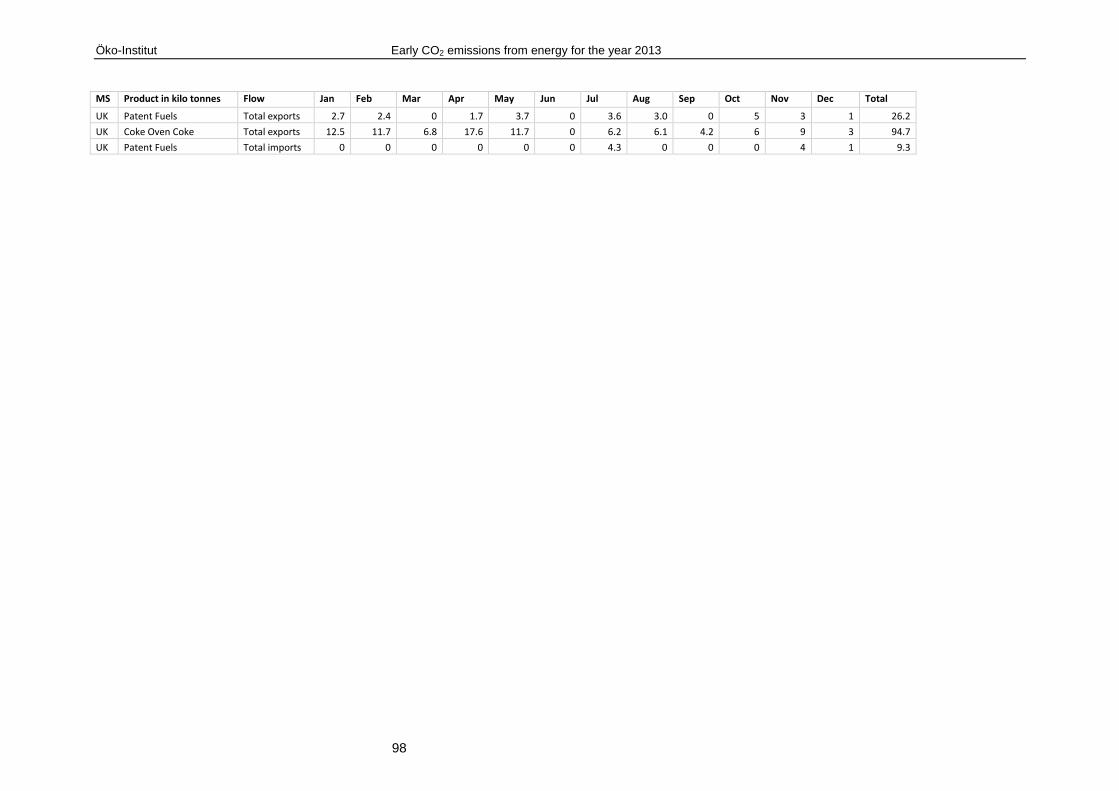
Öko-Institut Early CO2 emissions from energy for the year 2013
98
MS Product in kilo tonnes Flow Jan Feb Mar Apr May Jun Jul Aug Sep Oct Nov Dec Total
UK Patent Fuels Total exports 2.7 2.4 0 1.7 3.7 0 3.6 3.0 0 5 3 1 26.2
UK Coke Oven Coke Total exports 12.5 11.7 6.8 17.6 11.7 0 6.2 6.1 4.2 6 9 3 94.7
UK Patent Fuels Total imports 0 0 0 0 0 0 4.3 0 0 0 4 1 9.3

Öko-Institut Early CO2 emissions from energy for the year 2013
99
8.3 Comparison of monthly Eurostat data with early national statistics
8.3.1 Liquid fuels
For liquid fuels discrepancies above 5 % occur for the trend changes for Austria, Estonia, Finland,
France, Portugal and Slovenia.
Austria
Austria provided Eurostat with updated monthly data for the year 2012 in 2014. If the updated monthly
data for 2012 are taken into account, the differences in the trend changes between early national
statistics and monthly Eurostat data for liquid fuels are reduced to zero (see Table 4-3).
Estonia
For Estonia there were major differences in the reporting of shale oil in early national statistics and in the
monthly data provided to Eurostat in recent years. The large differences in the results for the trend
changes are mainly due to strong inconsistencies in the data in 2012 (see Table 8-8). In the previous
project Estonia indicated that the cumulated monthly data of residual fuel oil also includes the production
and export of shale oil, and other heavy fuel oil imports.
Table 8-8 EE, consumption of selected liquid fuels from different data sources
Eurostat
monthly data
Early
national
statistics
DifferencesAnnual
EurostatCRF
Eurostat
monthly data
Early
national
statistics
Differences
Shale Oil
Consumption*246 -473 719 -469 -472 -510 -518 8
Production 355 0 355 0 0 57 0 57
Imports 0 0 0 0 0 0 0 0
Exports 117 469 -352 469 469 576 541 35
Stock changes -8 4 -12 0 3 -9 -23 14
Residual fuel oil
Consumption**-343 1 -344 -1 1 -11 -1 -10
Exports 368 581 -213 581 581 182 56 126
Imports 66 906 -840 906 906 393 448 -55
Stock Changes 13 1 12 1 -1 -14 1 -15
Bunkers 28 325 -297 325 325 236 392 -156
*conversion factor of 39.2 is used for shale oil
**conversion factor of 40.2 is used for residual fuel oil
National data for residual fuel oil 2012 has been updated
2012
Fuel (kt)
2012 2013
Note: Consumption of primary fuels (shale oil) is calculated as: Production + Imports – Exports – Stock changes,
Consumption of secondary fuels is calculated as: Imports-Exports-Stock Changes- International
Bunkers
In comparison to the reporting year 2012, the reporting for shale oil to Eurostat improved considerably for
the year 2013. There is only a small amount reported under production and the reported exports are
close to exports reported in early national statistics. Also the reporting of residual fuel oil in monthly
Eurostat data improved in 2013 and correlates more closely with the reporting in the early national
statistics.
Öko-Institut Early CO2 emissions from energy for the year 2013
100
For shale oil consumption early national statistics are more consistent with the CRF data and Eurostat
annual data than with Eurostat monthly data. For calculating early CO2 estimates for 2013, annual data
for total liquid fuels was used for 2012, instead of the monthly data (see Table 4-3).
France
For France the early national data does not include disaggregated data related to individual fuel types.
Nevertheless, detailed data was provided on the basis of flows. The main differences in the trend
changes of single flows could be found for international bunkers. According to Eurostat monthly data the
trend change for international bunkers is calculated with 167% between 2013/2012. Early national
statistics indicate a trend change of 91% for international bunkers.
In recent years France reported only parts of international bunkers for jet kerosene as part of monthly
Eurostat data (underreporting). In 2013 France improved its reporting and monthly data on international
bunkers for jet kerosene seems to be more consistent with annual data. This has considerable influence
on the trend change of liquid fuels. For calculating early CO2 estimates for 2013 annual data for
international bunkers has been used for 2012, instead of the monthly data (see Table 8-14). This
improved the trend changes significantly (see Table 4-3).
Finland, Portugal and Slovenia
For Finland, Portugal and Slovenia the early national data does not include disaggregated data related to
individual fuel types. Therefore, the difference cannot be further analysed.
8.3.2 Solid fuels
In Austria, Finland, Latvia, the Netherlands and Slovenia larger differences in the trend changes for solid
fuels occur when early national statistics are compared with Eurostat monthly data.
Austria
According to monthly Eurostat data, hard coal consumption between 2012 and 2013 increased
considerably by 116 %, whereas the trend for hard coal consumption in early national statistics remains
at 100 %. A comparison between annual and monthly Eurostat data for 2012 shows a difference of -22%
for hard coal consumption. For calculating early CO2 estimates for 2013 annual data for hard coal
consumption was used for 2012, instead of the monthly data; this changes the trend for hard coal
consumption to 91 % (see Table 4-3, Table 8-14).
Finland
The trend changes from early national statistics are calculated using TJ, whereas the trend based on
monthly Eurostat data is calculated in kt. There is a change in solid fuel consumption between 2012 and
2013 from consumption of peat to more consumption of hard coal. The trend change for solid fuels based
on physical units results in a decrease of 2.2% in consumption, whereas the trend change based on TJ
units resulted in an increase of 7.8%. Peat has an NCV of 10.1 and hard coal an NCV of 25.5, thus
increasing the consumption of hard coal and decreasing the consumption of peat results in higher energy
consumption, due to the higher energy value of hard coal. For calculating CO2 emissions for 2013, the
trend change calculated with energy units was used (see Table 4-3 and Section 4.1).
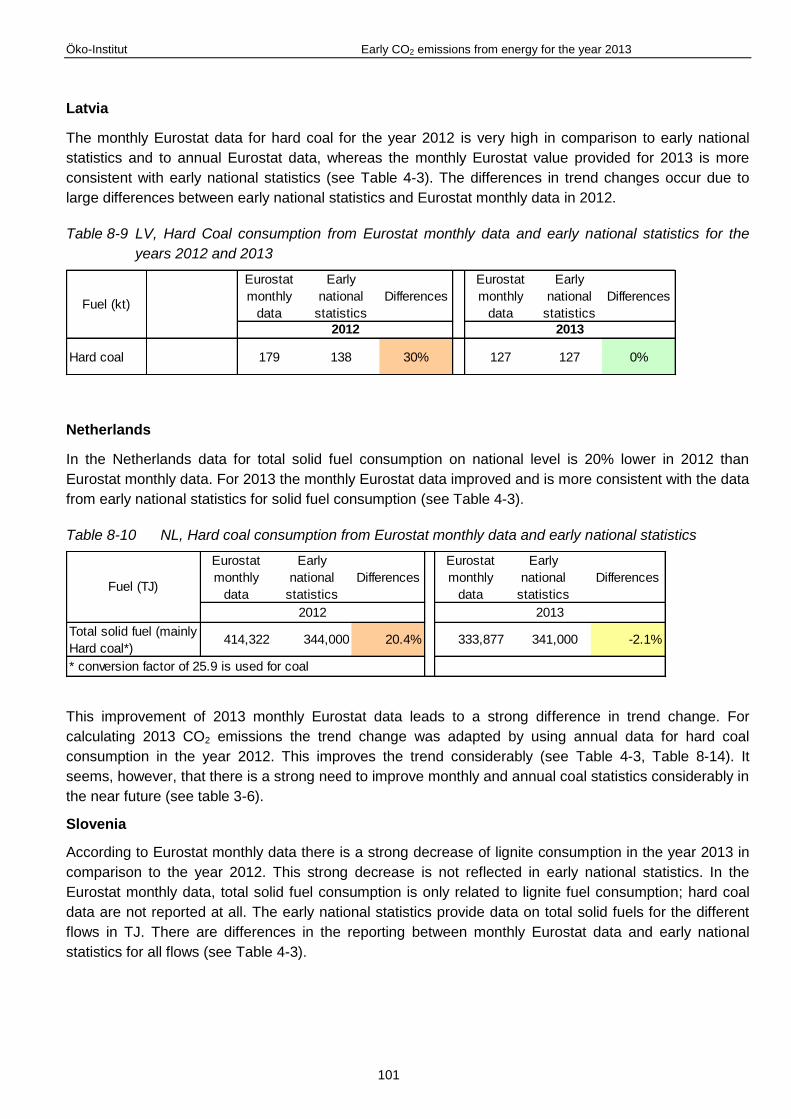
Öko-Institut Early CO2 emissions from energy for the year 2013
101
Latvia
The monthly Eurostat data for hard coal for the year 2012 is very high in comparison to early national
statistics and to annual Eurostat data, whereas the monthly Eurostat value provided for 2013 is more
consistent with early national statistics (see Table 4-3). The differences in trend changes occur due to
large differences between early national statistics and Eurostat monthly data in 2012.
Table 8-9 LV, Hard Coal consumption from Eurostat monthly data and early national statistics for the
years 2012 and 2013
Eurostat
monthly
data
Early
national
statistics
Differences
Eurostat
monthly
data
Early
national
statistics
Differences
Hard coal 179 138 30% 127 127 0%
Fuel (kt)
2012 2013
Netherlands
In the Netherlands data for total solid fuel consumption on national level is 20% lower in 2012 than
Eurostat monthly data. For 2013 the monthly Eurostat data improved and is more consistent with the data
from early national statistics for solid fuel consumption (see Table 4-3).
Table 8-10 NL, Hard coal consumption from Eurostat monthly data and early national statistics
Eurostat
monthly
data
Early
national
statistics
Differences
Eurostat
monthly
data
Early
national
statistics
Differences
Total solid fuel (mainly
Hard coal*)414,322 344,000 20.4% 333,877 341,000 -2.1%
* conversion factor of 25.9 is used for coal
Fuel (TJ)
2012 2013
This improvement of 2013 monthly Eurostat data leads to a strong difference in trend change. For
calculating 2013 CO2 emissions the trend change was adapted by using annual data for hard coal
consumption in the year 2012. This improves the trend considerably (see Table 4-3, Table 8-14). It
seems, however, that there is a strong need to improve monthly and annual coal statistics considerably in
the near future (see table 3-6).
Slovenia
According to Eurostat monthly data there is a strong decrease of lignite consumption in the year 2013 in
comparison to the year 2012. This strong decrease is not reflected in early national statistics. In the
Eurostat monthly data, total solid fuel consumption is only related to lignite fuel consumption; hard coal
data are not reported at all. The early national statistics provide data on total solid fuels for the different
flows in TJ. There are differences in the reporting between monthly Eurostat data and early national
statistics for all flows (see Table 4-3).

Öko-Institut Early CO2 emissions from energy for the year 2013
102
Table 8-11 SI, total solid fuel consumption from Eurostat monthly data and early national statistics
Eurostat
monthly
data
Early
national
statistics
Differences
Eurostat
monthly
data
Early
national
statistics
Differences
Trend
changes
Eurostat
monthly
Trend
changes
early
national
statistics
Consumption 49,308 58,378 -16% 40,855 56,166 -27% 83% 96%
Production 43,228 45,774 -6% 38,067 45,010 -15% 88% 98%
Imports 5,070 12,576 -60% 495 11,212 -96% 10% 89%
Exports 121 21 477% 0 186 -100% 0% 886%
Stock
changes-1,131 -49 2209% -2,293 -130 1664% 203% 265%
2013/20122013
Total solid
fuels
Fuel (TJ)
2012
8.3.3 Natural Gas
The trend changes for Bulgaria, Denmark and Slovenia show differences for gaseous fuels. In all three
countries there are differences in the absolute values in the year 2012 that explain the discrepancies in
trend changes.
Table 8-12 Natural gas consumption in Bulgaria, Denmark, Sweden and Slovenia from different data
sources
Eurostat
monthly
data
Early
national
statistics
Differences
Eurostat
monthly
data
Early
national
statistics
Differences
Natural gas
consumption Bulgaria92,539 102,644 -9.8% 96,513 99,158 -2.7%
Natural gas
consumption
Denmark
138,151 -5.5%
Denmark revised 145,709 -0.3%
Natural gas
consumption Slovenia27,091 29,716 -8.8% 28,954 28,965 0.0%
2013
146,178 139,353 137,872 1.1%
Fuel (TJ)
2012
Bulgaria and Slovenia
For Bulgaria and Slovenia differences in trend changes occur due to large differences between early
national statistics and Eurostat monthly data in 2012.
Denmark
Denmark only provided Eurostat with updated monthly data for the year 2012 in February 2014. Taking
into account the updated monthly data for 2012 reduces the differences in the trend changes between
early national statistics and monthly Eurostat data for natural gas fuels to less than - 1 %.
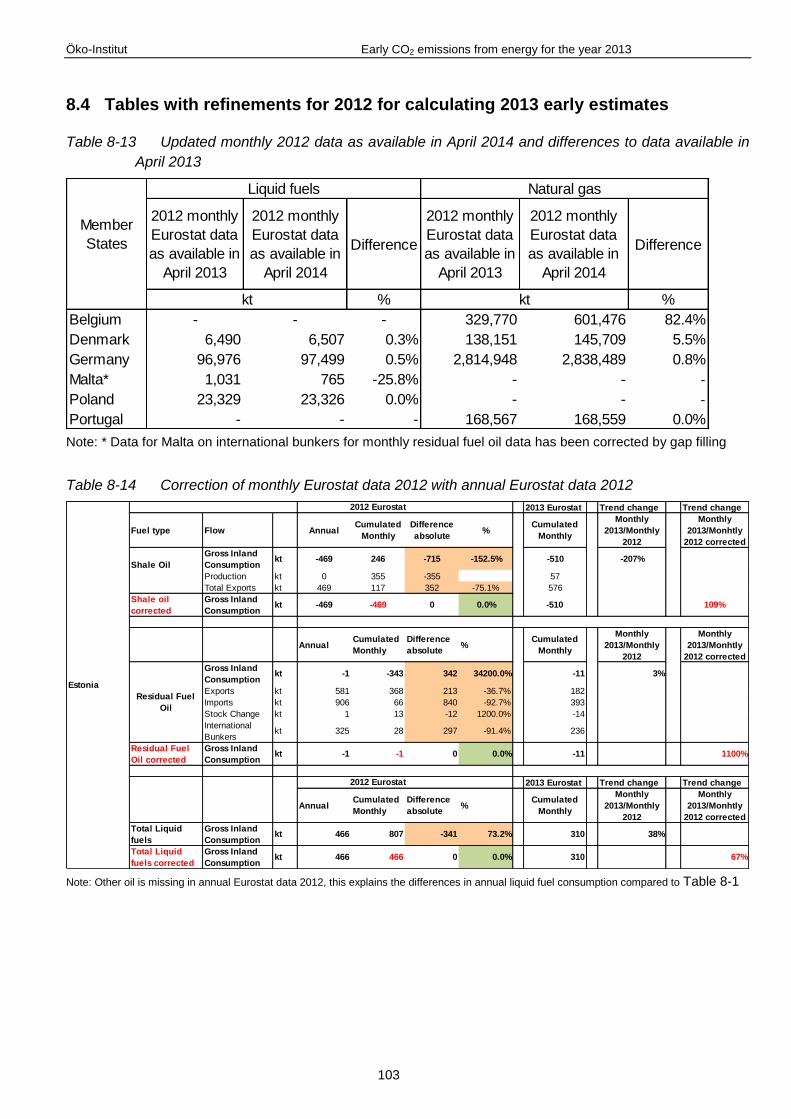
Öko-Institut Early CO2 emissions from energy for the year 2013
103
8.4 Tables with refinements for 2012 for calculating 2013 early estimates
Table 8-13 Updated monthly 2012 data as available in April 2014 and differences to data available in
April 2013
2012 monthly
Eurostat data
as available in
April 2013
2012 monthly
Eurostat data
as available in
April 2014
Difference
2012 monthly
Eurostat data
as available in
April 2013
2012 monthly
Eurostat data
as available in
April 2014
Difference
% %
Belgium - - - 329,770 601,476 82.4%
Denmark 6,490 6,507 0.3% 138,151 145,709 5.5%
Germany 96,976 97,499 0.5% 2,814,948 2,838,489 0.8%
Malta* 1,031 765 -25.8% - - -
Poland 23,329 23,326 0.0% - - -
Portugal - - - 168,567 168,559 0.0%
Member
States
Liquid fuels
kt kt
Natural gas
Note: * Data for Malta on international bunkers for monthly residual fuel oil data has been corrected by gap filling
Table 8-14 Correction of monthly Eurostat data 2012 with annual Eurostat data 2012
2013 Eurostat Trend change Trend change
Fuel type Flow AnnualCumulated
Monthly
Difference
absolute%
Cumulated
Monthly
Monthly
2013/Monthly
2012
Monthly
2013/Monhtly
2012 corrected
Shale Oil
Gross Inland
Consumptionkt -469 246 -715 -152.5% -510 -207%
Production kt 0 355 -355 57
Total Exports kt 469 117 352 -75.1% 576
Shale oil
corrected
Gross Inland
Consumptionkt -469 -469 0 0.0% -510 109%
AnnualCumulated
Monthly
Difference
absolute%
Cumulated
Monthly
Monthly
2013/Monthly
2012
Monthly
2013/Monhtly
2012 corrected
Gross Inland
Consumptionkt -1 -343 342 34200.0% -11 3%
Exports kt 581 368 213 -36.7% 182
Imports kt 906 66 840 -92.7% 393
Stock Change kt 1 13 -12 1200.0% -14
International
Bunkerskt 325 28 297 -91.4% 236
Residual Fuel
Oil corrected
Gross Inland
Consumptionkt -1 -1 0 0.0% -11 1100%
2013 Eurostat Trend change Trend change
AnnualCumulated
Monthly
Difference
absolute%
Cumulated
Monthly
Monthly
2013/Monthly
2012
Monthly
2013/Monhtly
2012 corrected
Total Liquid
fuels
Gross Inland
Consumptionkt 466 807 -341 73.2% 310 38%
Total Liquid
fuels corrected
Gross Inland
Consumptionkt 466 466 0 0.0% 310 67%
Estonia
2012 Eurostat
2012 Eurostat
Residual Fuel
Oil
Note: Other oil is missing in annual Eurostat data 2012, this explains the differences in annual liquid fuel consumption compared to Table 8-1

Öko-Institut Early CO2 emissions from energy for the year 2013
104
2013 Eurostat Trend change Trend change
Fuel type Flow AnnualCumulated
Monthly
Difference
absolute%
Cumulated
Monthly
Monthly
2013/Monthly
2012
Monthly
2013/Monhtly
2012 corrected
Jet KeroseneGross Inland
Consumption kt-1,771 2,294 -4,065 -229.5% -558 -24%
International
Bunkers kt5,491 1,300 4,191 -76.3% 4,200
Gross Inland
Consumption kt
-1,771 -1,897 126 -6.6% -558 29%
International
Bunkers kt5,491 5,491 0 0.0% 4,200
2013 Eurostat Trend change Trend change
France
AnnualCumulated
Monthly
Difference
absolute%
Cumulated
Monthly
Monthly
2013/Monthly
2012
Monthly
2013/Monhtly
2012 corrected
Total Liquid
fuels
Gross Inland
Consumption kt73,526 77,623 -3,623 21.7% 72,122 93%
Total Liquid
fuels corrected
for Jet Kerosene
International
bunkersGross Inland
Consumption kt
73,526 73,432 94 0.1% 72,122 98%
France
Jet Kerosene
corrected
2012 Eurostat
2012 Eurostat
Note: Other oil is missing in annual Eurostat data 2012, this explains the differences in annual liquid fuel consumption compared to Table 8-1
2013 Eurostat Trend change Trend change
Fuel type Flow AnnualCumulated
Monthly
Difference
absolute%
Cumulated
Monthly
Monthly
2013/Monthly
2012
Monthly
2013/Monhtly
2012 corrected
Hard CoalGross Inland
Consumption kt12,790 15,926 -3,136 24.5% 12,891 81%
Hard Coal
correctedGross Inland
Consumption kt12,790 12,790 0 0.0% 12,891 101%
Total Solid fuelGross Inland
Consumption kt13,143 15,997 -2,854 21.7% 12,890 81%
Total Solid fuel
corrected for
hard coal
Gross Inland
Consumption kt
13,143 12,861 282 2.2% 12,890 100%
The
Netherlands
2012 Eurostat
2013 Eurostat Trend change Trend change
Fuel type Flow AnnualCumulated
Monthly
Difference
absolute%
Cumulated
Monthly
Monthly
2013/Monthly
2012
Monthly
2013/Monhtly
2012 corrected
Hard CoalGross Inland
Consumptionkt 3,564 2,779 785 -22.0% 3,229 116%
Hard Coal
correctedGross Inland
Consumptionkt 3,564 3,564 0 0.0% 3,229 91%
Total Solid fuelGross Inland
Consumptionkt 4,825 4,018 807 -16.7% 4,449 111%
Total Solid fuel
corrected for
hard coal
Gross Inland
Consumption
kt 4,825 4,803 22 0.5% 4,449 93%
Austria
2012 Eurostat

Öko-Institut Early CO2 emissions from energy for the year 2013
105
8.5 The IPCC reference approach calculation
The IPCC reference approach calculates aggregate estimates of CO2 emissions from fuel combustion by
fuel type distinguishing between primary and secondary fuels in the following steps:
Step 1: Estimation of apparent fuel consumption in original units
Step 2: Convert to a common energy unit
Step 3: Conversion to carbon units (multiplication by carbon content of fuels)
Step 4: Estimation of excluded carbon or carbon stored (subtraction of the amount of carbon contained in
long-lived materials manufactured from fuel carbon, i.e. "carbon stored" in the IPCC methodology)
Step 5: Correction for carbon un-oxidised
Step 6: Conversion to CO2 emissions and summation of total CO2 emissions across fuels
These steps are expressed in the following formula:
12/4410 3
2 fuelfuel
allfuels
fuelfuelfuelCOFCarbonExclCCConvFactorAppConsemissionsCO
Where
CO2 Emissions = CO2 emissions (Gg CO2)
Apparent Consumption = production + imports – exports – international
bunkers - stock change
Conv Factor (conversion factor) = conversion factor for the fuel to energy units (TJ) on a net
calorific value basis
CC = carbon content (tonne C/TJ)
ExclCarbon fuel = Excluded Carbon or carbon stored = carbon in feedstocks and non-energy
use excluded from fuel combustion emissions (Gg C)
COFfuel = oxidation factor for incomplete combustion of C to CO2
44/12 = factor to convert C into CO2
In the annual GHG inventory submissions, the CO2 emissions from fuel combustion based on the
reference approach are reported in a separate table: CRF table 1.A.(b) CO2 from Fuel Combustion
Activities – Reference Approach (IPCC Worksheet 1-1), in each reporting year for the year X-2.
Differences between the two approaches may inter alia arise from the following reasons:
The sectoral approach only includes emissions from the non-energy use of fuel where they can be
specifically identified and estimated such as with fertilizer production and iron and steel
production. The IPCC reference approach implicitly treats the non-energy use of fuel as if it were
combustion. A correction is then applied by deducting an estimate of carbon stored from non-
energy fuel use. The carbon stored is estimated from an approximate procedure that does not
identify specific processes. The result is that the IPCC reference approach is based on a higher
estimate of non-energy use emissions.

Öko-Institut Early CO2 emissions from energy for the year 2013
106
The sectoral approach only includes emissions from the non-energy use of fuel where they can be
specifically identified and estimated such as with fertilizer production and iron and steel
production. The IPCC reference approach implicitly treats the non-energy use of fuel as if it were
combustion. A correction is then applied by deducting an estimate of carbon stored from non-
energy fuel use. The carbon stored is estimated from an approximate procedure that does not
identify specific processes. The result is that the IPCC reference approach is based on a higher
estimate of non-energy use emissions.
Inclusion of some emissions from fossil parts of certain waste fuels that are not included in the fuel
consumption statistics and the reference approach calculation.
In the reference approach calculation kerosene consumption allocated to international bunkers is
subtracted from the CO2 emissions whereas the sectoral approach provides a detailed estimation
of CO2 emissions from domestic flights and international flights based on flight movement data
and the domestic part of the kerosene consumption is estimated and allocated to the country in
which the fuel was sold.