early childhood education and development in … · early childhood education and development in...
TRANSCRIPT

Early Childhood Education and
Development in Indonesia:
Emerging Results and Proposed
Analyses Mae Chu Chang and Amer Hasan
World Bank - Jakarta
Acknowledgements
• Generous support from the Dutch Government and AusAid
• Implementation support from the Government of Indonesia
• Collaborators on research and design from local and
international academic partners
▫ International: University of Western Australia, University of Amsterdam
▫ Local: Universitas Gajah Mada
Outline
• The ECED landscape in Indonesia prior to the project
• The project ▫ The beneficiaries ▫ The intervention
• Analytical Framework • The impact evaluation
▫ Design ▫ Data ▫ Measure of child development
• Preliminary findings • Proposed analyses

Prior to the project child
developmental outcomes were mixed
1 5
28
38
80
0
10
20
30
40
50
60
70
80
90
Communication skills and general
knowledge
Social competence Emotional Maturity
Physical Health and Well-being
Language and cognitive
development
Percent vulnerable on each EDI domain - select sample of Indonesian 4-year olds
Percent of children Vulnerable
Improvements needed
Good results
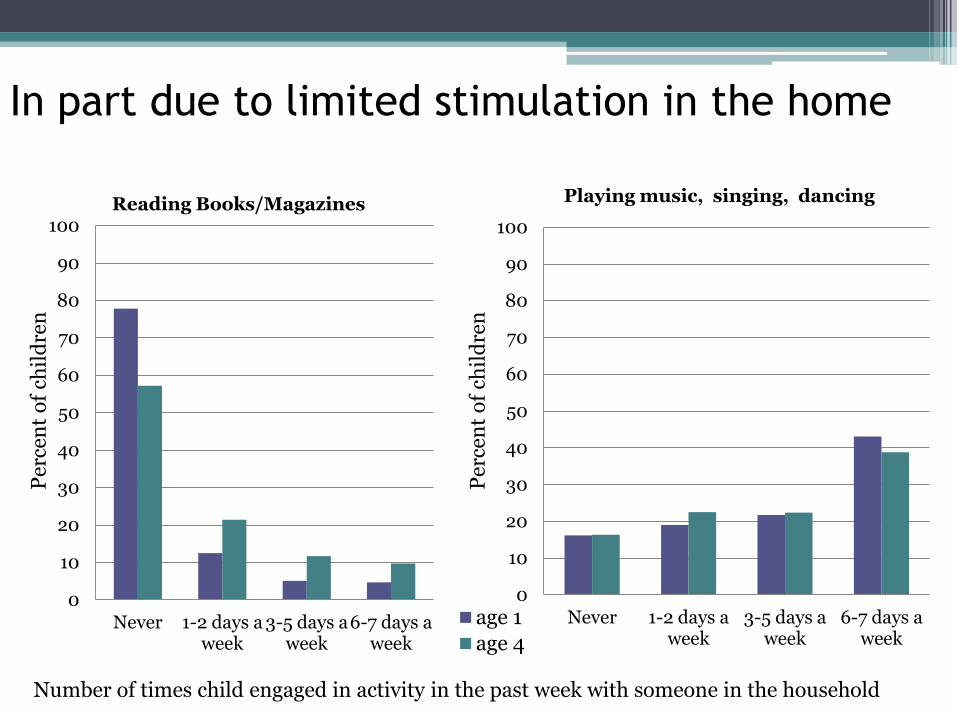
In part due to limited stimulation in the home
0
10
20
30
40
50
60
70
80
90
100
Never 1-2 days a week
3-5 days a week
6-7 days a week
Reading Books/Magazines
age 1
age 4
Number of times child engaged in activity in the past week with someone in the household
Per
cen
t o
f ch
ild
ren
Per
cen
t o
f ch
ild
ren
0
10
20
30
40
50
60
70
80
90
100
Never 1-2 days a week
3-5 days a week
6-7 days a week
Playing music, singing, dancing

Against this backdrop, the project
provided • Community facilitators to sensitize villages on
▫ Need for ECED
▫ Management of funds
▫ Proposal preparation
• Block grants to villages (USD 18,000 per village)
▫ Villages propose use of funds for new ECED services or upgrading existing services
• Teacher training
▫ 200 hours of training
Intended project beneficiaries
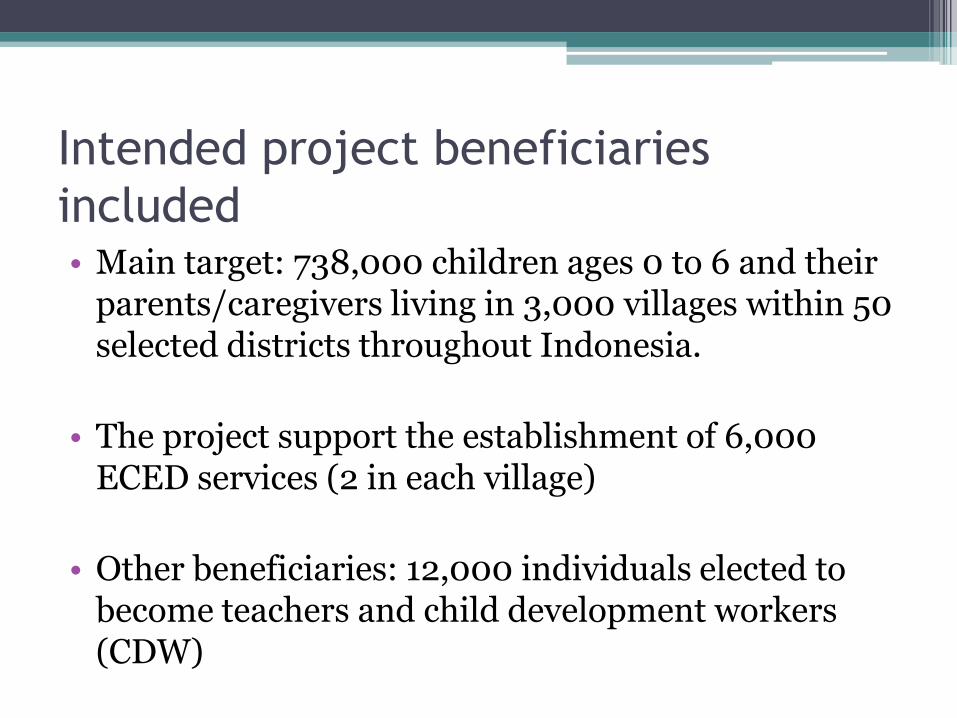
included • Main target: 738,000 children ages 0 to 6 and their
parents/caregivers living in 3,000 villages within 50 selected districts throughout Indonesia.
• The project support the establishment of 6,000 ECED services (2 in each village)
• Other beneficiaries: 12,000 individuals elected to become teachers and child development workers (CDW)

ECED Project Coverage: 50 Districts in 21 provinces, 3,000 villages
IV
I
Nangroe Aceh Darussalam: 1. Aceh Tenggara 2. Aceh Tengah
Sumatera Utara : 1. Toba Samosir 2. Tapanuli tengah
Sumatera Barat : 1. Solok 2. Sawahlunto/Sijunjung 3. Pesisir Selatan
Jambi : 1. Tanjung Jabung Timur 2. Sarolangun
Sumatera Selatan : 1. Ogan Komering Ilir
Bengkulu : 1. Bengkulu Utara 2. Bengkulu Selatan
Lampung : 1. Lampung Timur 2. Lampung Selatan
Jawa Barat : 1. Sumedang 2. Sukabumi 3. Subang 4. Majalengka 5. Garut
II
Jawa Tengah :
1. Rembang 2. Wonogiri 3. Cilacap 4. Banjarnegara
DI Yogyakarta : 1. Kulonprogo 2. Gunung Kidul
Kalimantan Barat : 1. Sambas 2. Ketapang
III
Jawa Timur : 1. Pacitan 2. Madiun 3. Bondowoso
NTB: 1. Lombok Tengah 2. Sumbawa 3. Dompu
NTT: 1. Sumba Barat 2. Timor Tengah Utara
Sulawesi Utara : 1. Kepulauan Talaud 2. Kepulauan Sangihe
Sulawesi Barat : 1. Polewali Mandar 2. Mamuju
Sulawesi Selatan : 1. Sinjai 2. Sidrap 3. Wajo 4. Jeneponto
Gorontalo : 1. Gorontalo
2. Boalemo
Maluku Utara : Halmahera Utara Halmahera Selatan
Irjabar : Manokwari
Papua Merauke Jayapura
V
(9/26 Sub Dist) (9/47 Sub Dist) (4/30 Sub Dist)
(10/12 Sub Dist) (8/24 Sub Dist)
(6/24 Sub Dist) (6/17 Sub Dist) (4/7 Sub Dist)
:

Analytical framework acknowledges multifaceted
nature of child development
•ECED success depends on
• Child health
• Household environments
• Teacher quality
• Community facilities • Center quality
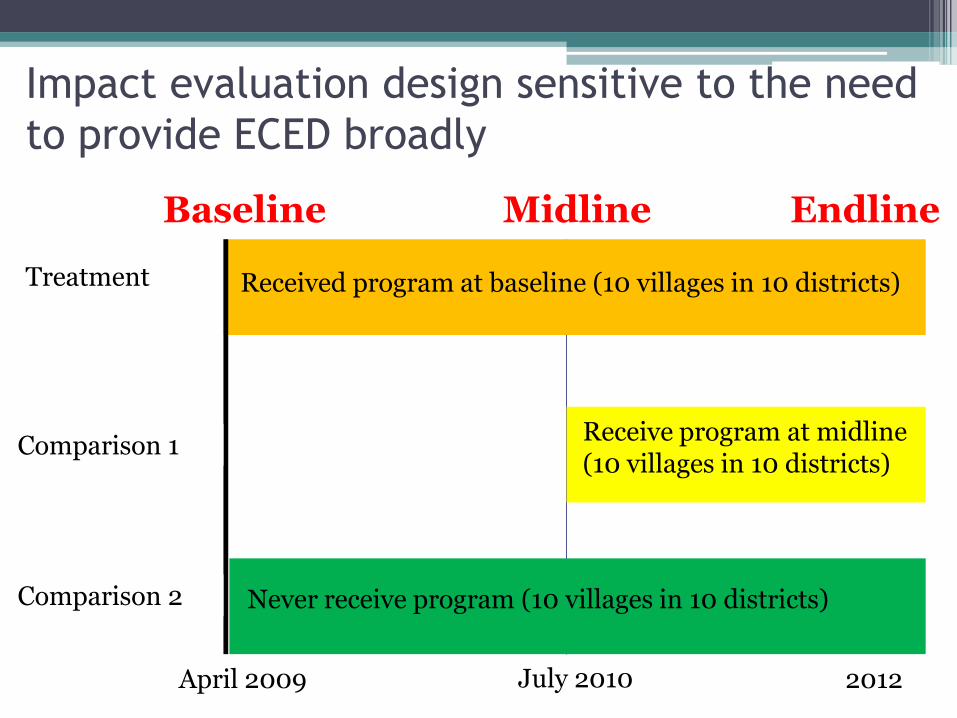
Impact evaluation design sensitive to the need
to provide ECED broadly
Baseline Midline Endline
Received program at baseline (10 villages in 10 districts)
April 2009 July 2010 2012
Treatment
Receive program at midline (10 villages in 10 districts)
Comparison 1
Comparison 2 Never receive program (10 villages in 10 districts)
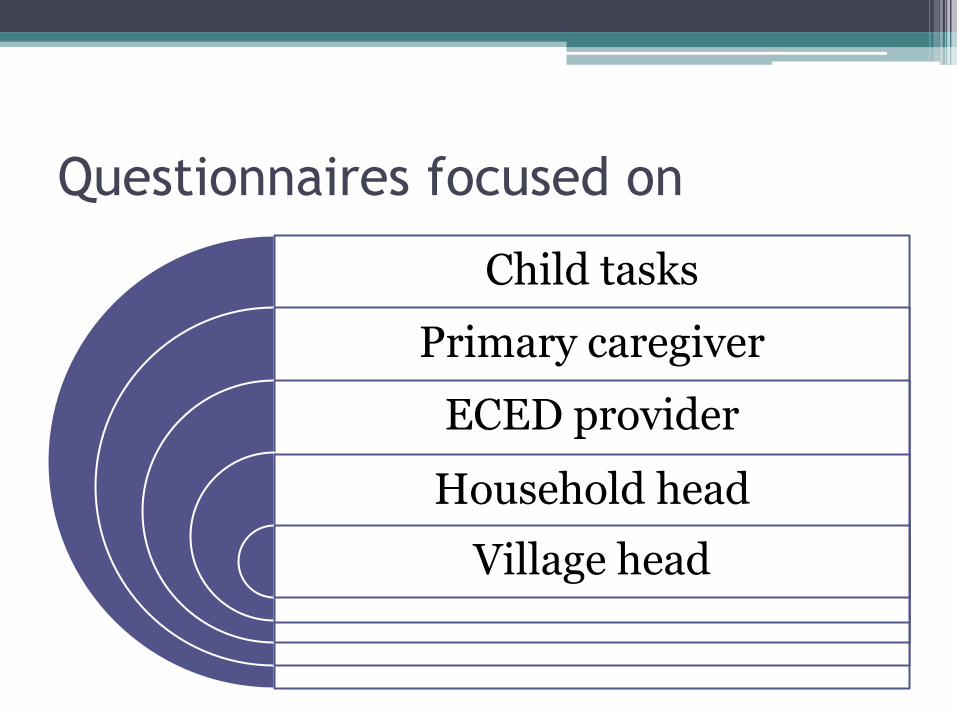
Questionnaires focused on
Child tasks
Primary caregiver
ECED provider
Household head
Village head

Multiple measures of child development
Target Age Measurement Objective
4 year olds Early Development Instrument (EDI – short version) (Janus 2006; Janus, Brinkman and Duku, 2007)
To measure children’s school readiness from five major developmental domains: 1. Physical health and well-being 2. Social competence 3. Emotional Maturity 4. Language and cognitive development 5. Communication skills and general
knowledge
1 year olds Strengths and Difficulties Questionnaire (SDQ) (Goodman 1997; Muris, Meesters, and Berg (2003)
To measure whether children have psychopathology such as emotional symptoms, conduct problems, hyperactivity/inattention, peer-relation problems, and prosocial behavior based on the caregiver’s report
1 and 4 year olds
Dimensional Change Card Sorting (DCCS) Zelazo et al (2003); Zelazo (2006)
To measure children’s executive function


Project districts are poorer
0.25 0.23
0.19 0.18 0.18
0.17
0.14 0.13
0.00
0.05
0.10
0.15
0.20
0.25
0.30
2006 2007 2009 2010
Po
ve
rty
ra
te
Year
Project and Non-project Districts
Project districts with M&E and survey data Project districts with M&E data only
Non-project districts Indonesia

Service provision in treatment and control
areas is similar but not in matched controls
Batch 1 Batch 3 Matched Control
Number of sub-villages 6.5 6.9 6
Number of children between 0 and 6 year olds 332 364 325
ECED project facilities (TPK) 2 2 .
Official kindergarten (TK) 1.6 1.7 1.9
Playgroups (KB) 0.4 0.4 1.0***
Day care (TPA) 0 0 0
Islamic Kindergarten (TPQ) 6.6 7.4 5.4
Other ECED facilities 0.6 0.2 0.7
Number of TK / 100 children 0.5 0.6 0.7***
Number of TPK / 100 children 1.1 1 .
Number of KB / 100 children 0.1 0.1 0.4***

Adherence to randomization was not
perfect…but acceptable

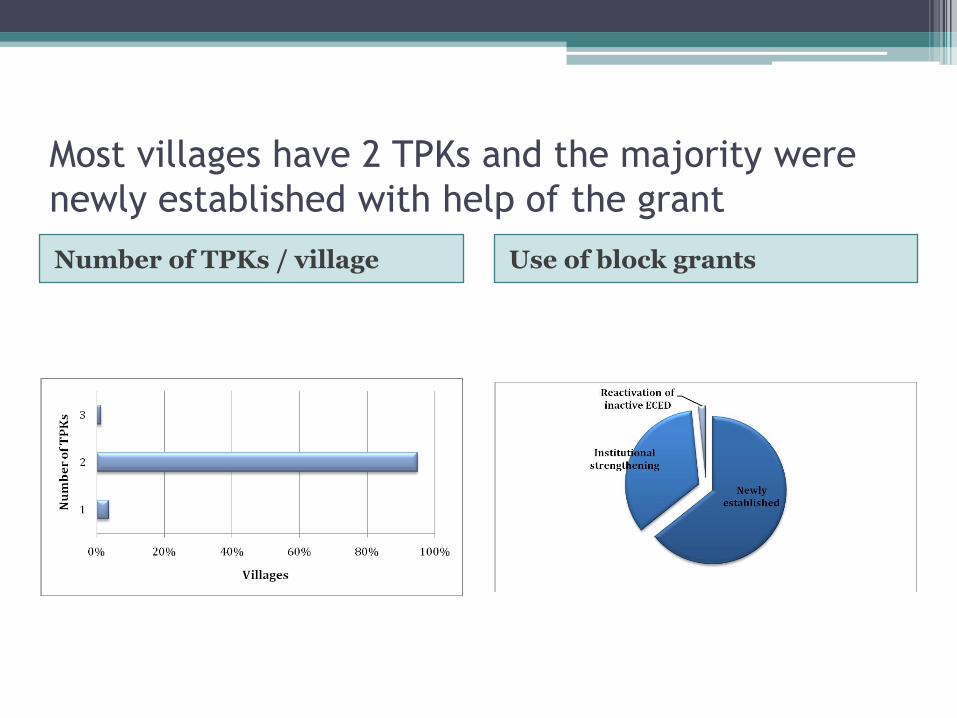
Most villages have 2 TPKs and the majority were
newly established with help of the grant
Number of TPKs / village Use of block grants

76% of teachers have completed senior high
school but some lack experience and training
Experience is low Not all teachers received 200 hours of training

Fees are charged in half the centers
• Half the centers don’t charge fees but the half that do impose mandatory fees on average charge IDR2,915 – though this varies greatly:
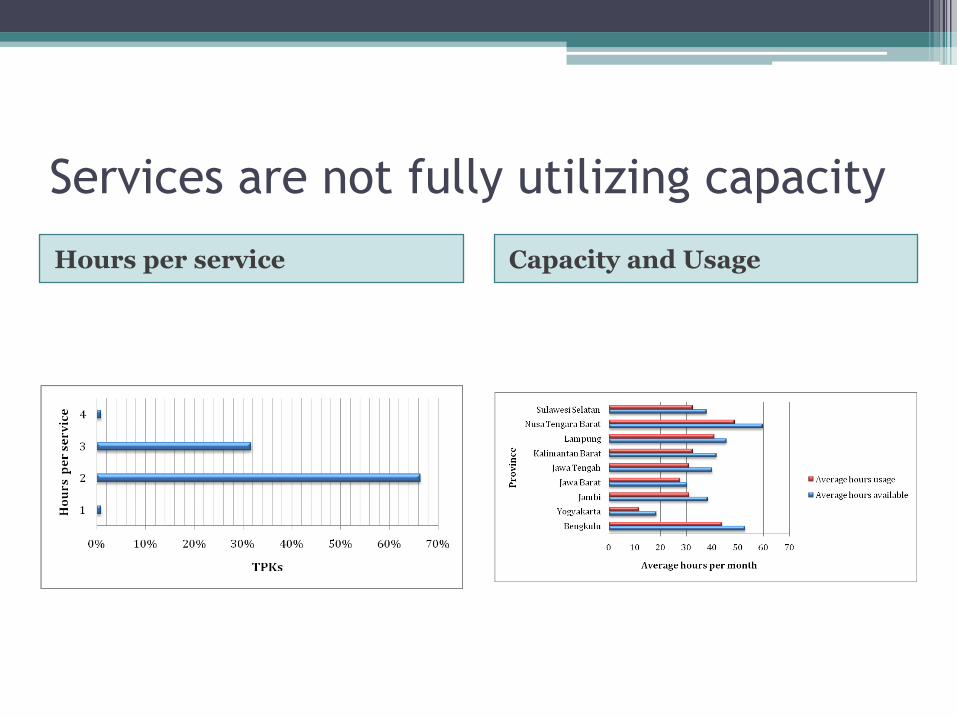
Services are not fully utilizing capacity
Hours per service Capacity and Usage

Work in progress
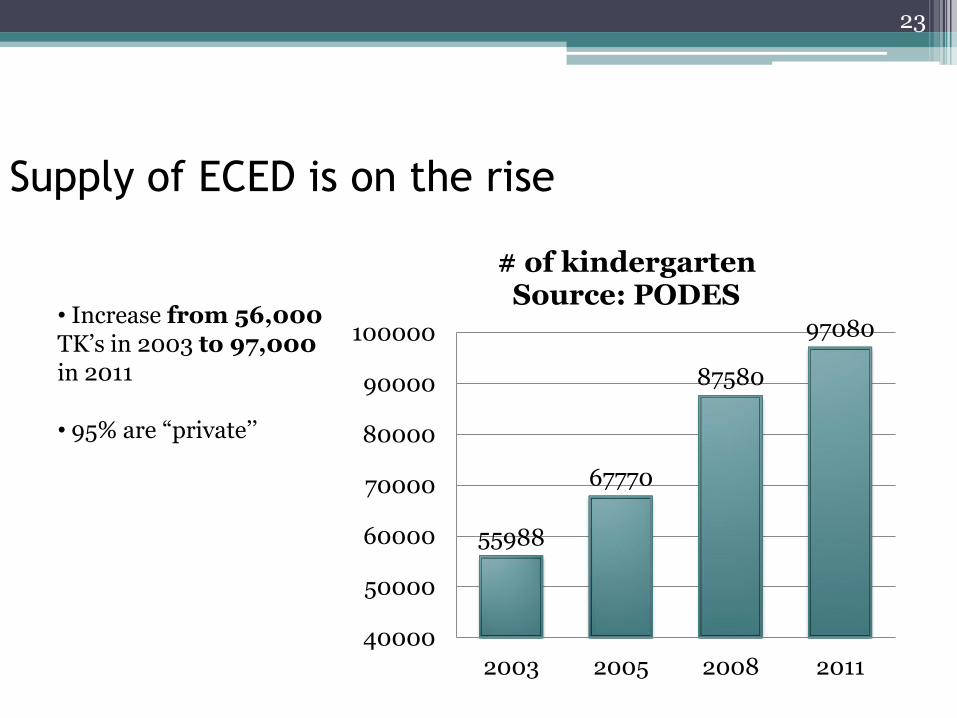
Supply of ECED is on the rise
23
• Increase from 56,000 TK’s in 2003 to 97,000 in 2011 • 95% are “private’’
55988
67770
87580
97080
40000
50000
60000
70000
80000
90000
100000
2003 2005 2008 2011
# of kindergarten Source: PODES
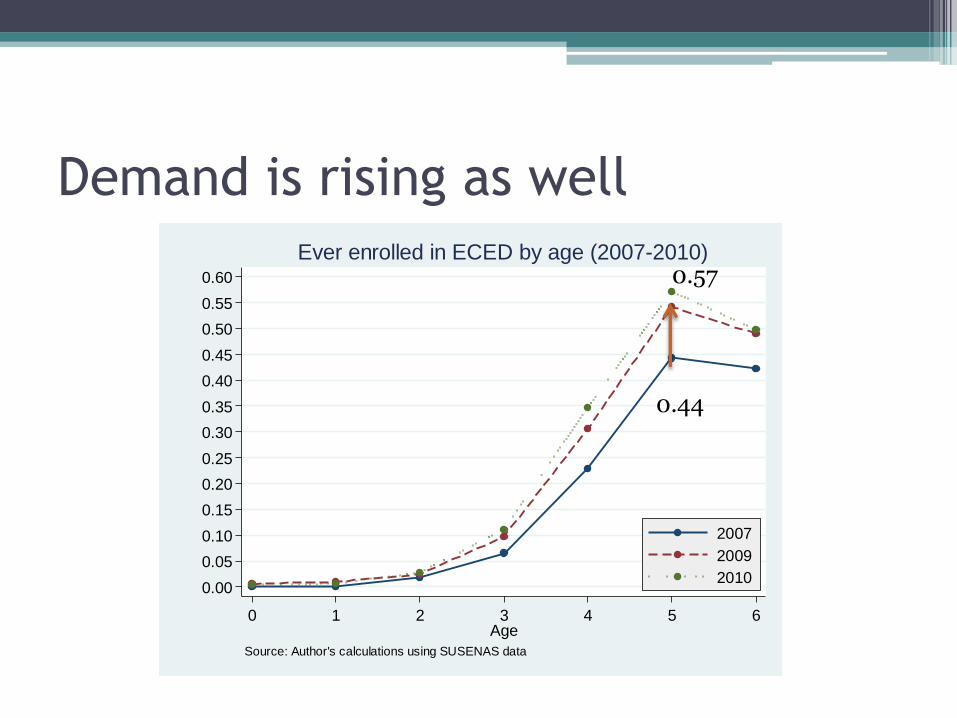
Demand is rising as well
0.00
0.05
0.10
0.15
0.20
0.25
0.30
0.35
0.40
0.45
0.50
0.55
0.60
Fra
ction e
nro
lled in E
CE
D
0 1 2 3 4 5 6Age
2007
2009
2010
Source: Author's calculations using SUSENAS data
Ever enrolled in ECED by age (2007-2010)
0.44
0.57
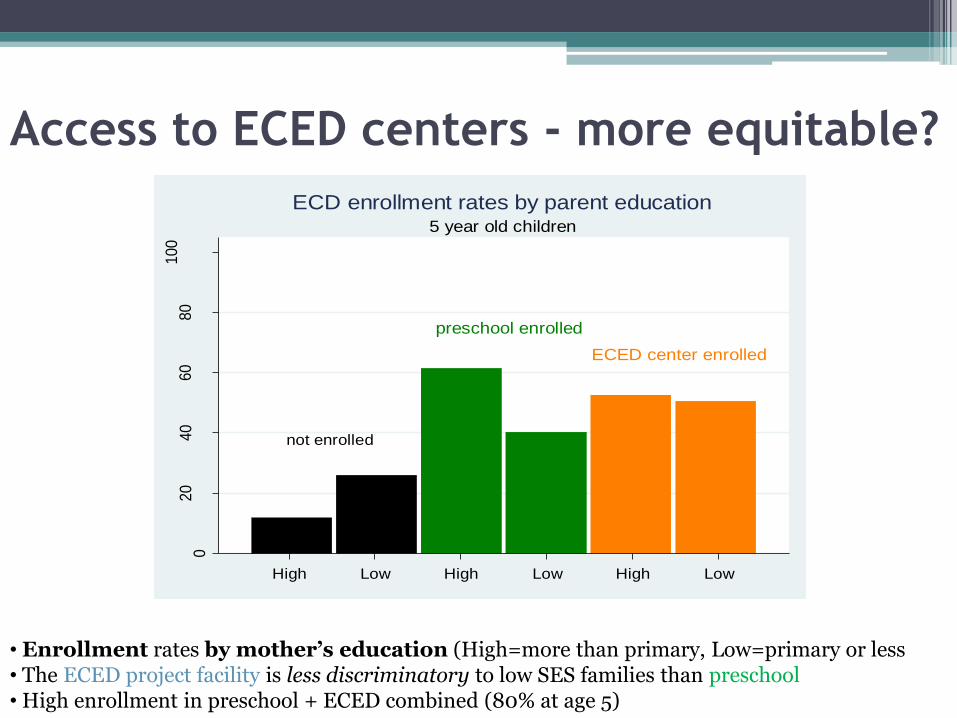
Access to ECED centers - more equitable?
not enrolled
preschool enrolled
ECED center enrolled
020
40
60
80
100
% e
ver
enro
lled
at
age 5
High Low High Low High Low
5 year old children
ECD enrollment rates by parent education
• Enrollment rates by mother’s education (High=more than primary, Low=primary or less • The ECED project facility is less discriminatory to low SES families than preschool • High enrollment in preschool + ECED combined (80% at age 5)

Analysis of baseline and midline data – work in progress
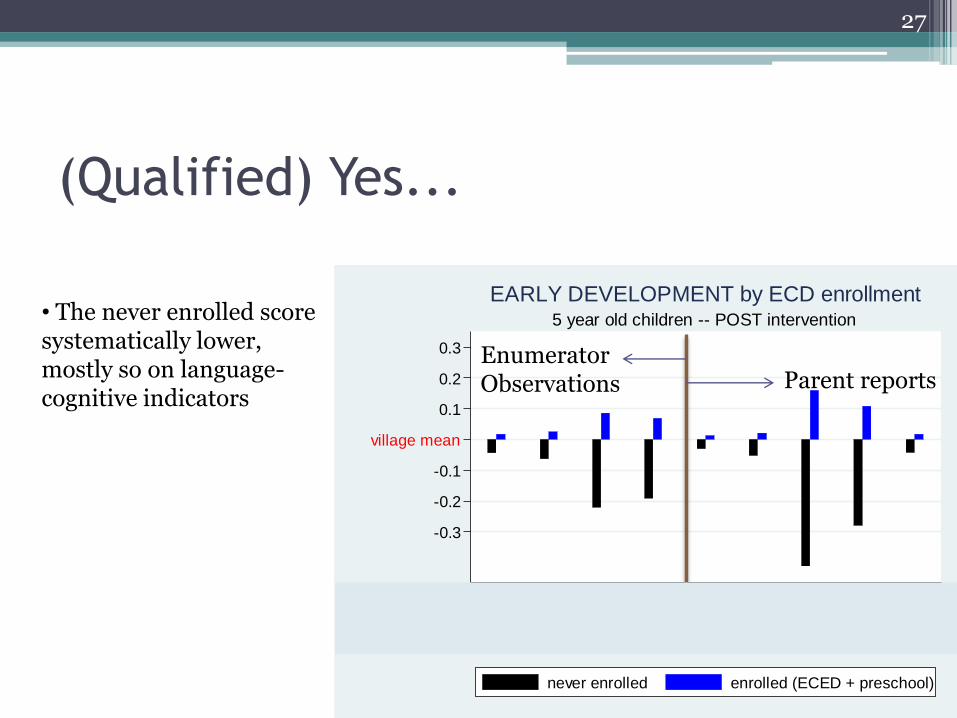
(Qualified) Yes...
village mean
-0.3
-0.1
-0.2
0.1
0.2
0.3
sta
nd
ard
devia
tio
ns f
rom
th
e m
ean
Gross Motor
Fine Motor
Language
Cognitive
EDI physical
EDI communic./knowl.
EDI language/cogn.
EDI emotional
EDI social
5 year old children -- POST intervention
EARLY DEVELOPMENT by ECD enrollment
never enrolled enrolled (ECED + preschool)
27
• The never enrolled score systematically lower, mostly so on language-cognitive indicators
Enumerator Observations Parent reports
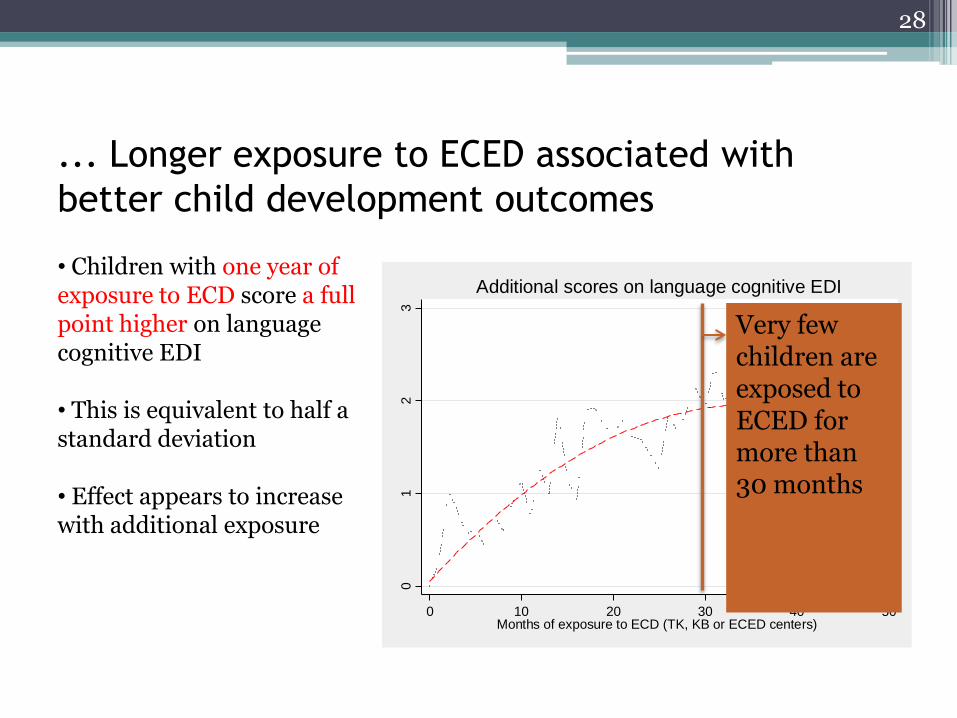
... Longer exposure to ECED associated with
better child development outcomes
01
23
0 10 20 30 40 50Months of exposure to ECD (TK, KB or ECED centers)
Additional scores on language cognitive EDI
28
• Children with one year of exposure to ECD score a full point higher on language cognitive EDI • This is equivalent to half a standard deviation • Effect appears to increase with additional exposure
Very few children are exposed to ECED for more than 30 months

Analytical inputs to the policy dialog

Tentative outline of comprehensive
report 1. The landscape of child development in
Indonesia 2. What is an Indonesian child able to do and by
what age? 3. When does demand not respond to supply of
ECED services? 4. Which child, family, community characteristics
relate to better development outcomes? 5. What is the role of facilitators? 6. Policy and practice implications
Terima kasih / Thank you!
Supplemental information follows
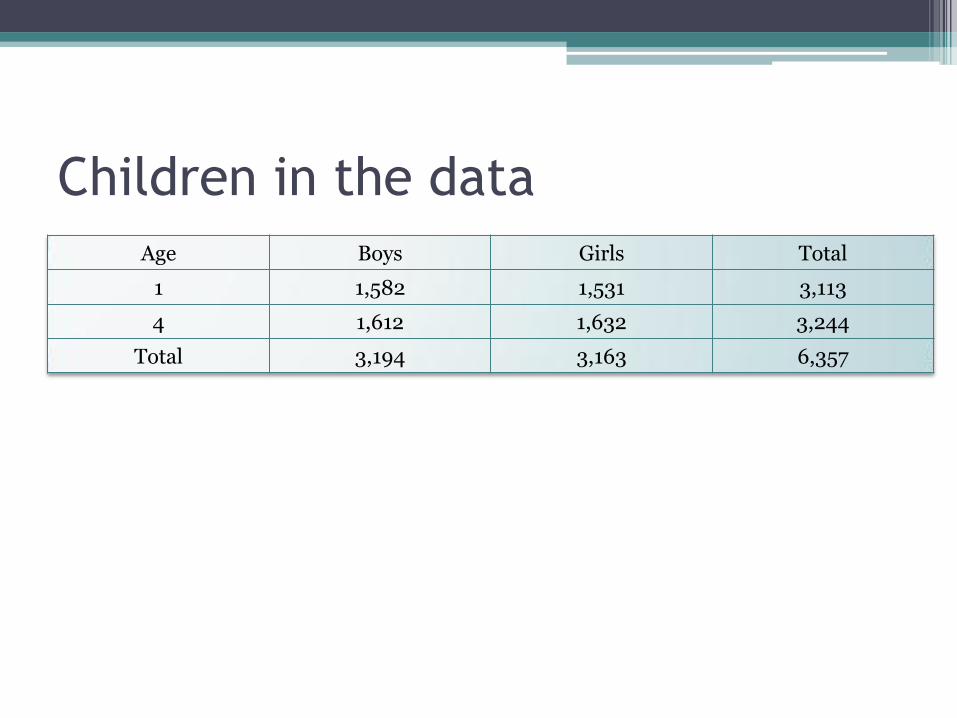
Children in the data
Age Boys Girls Total
1 1,582 1,531 3,113
4 1,612 1,632 3,244
Total 3,194 3,163 6,357
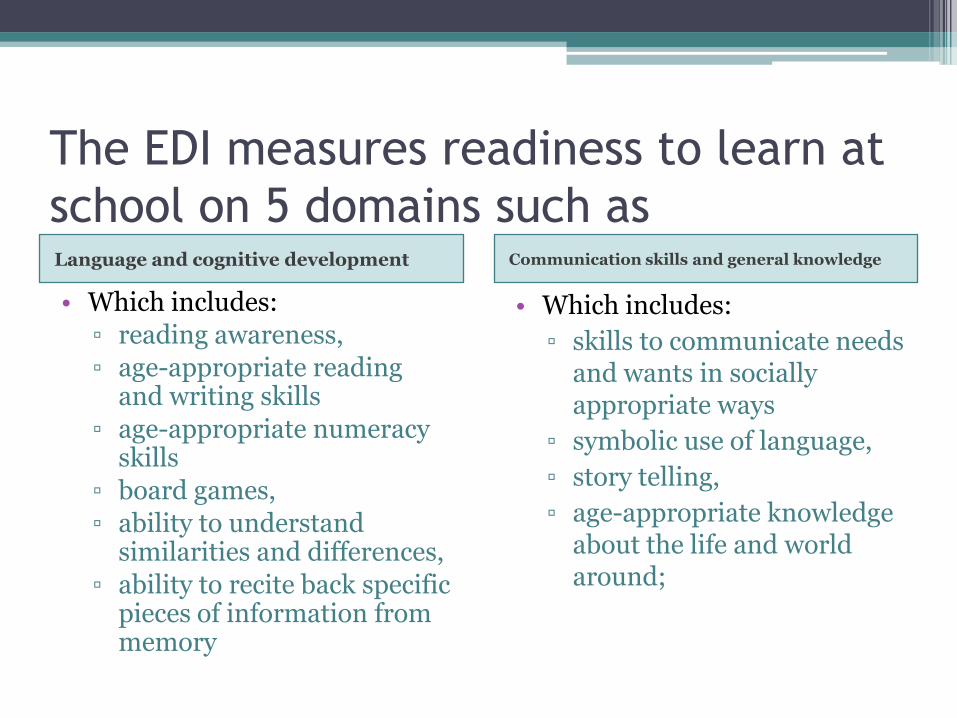
The EDI measures readiness to learn at
school on 5 domains such as Language and cognitive development Communication skills and general knowledge
• Which includes:
▫ reading awareness,
▫ age-appropriate reading and writing skills
▫ age-appropriate numeracy skills
▫ board games,
▫ ability to understand similarities and differences,
▫ ability to recite back specific pieces of information from memory
• Which includes:
▫ skills to communicate needs and wants in socially appropriate ways
▫ symbolic use of language,
▫ story telling,
▫ age-appropriate knowledge about the life and world around;

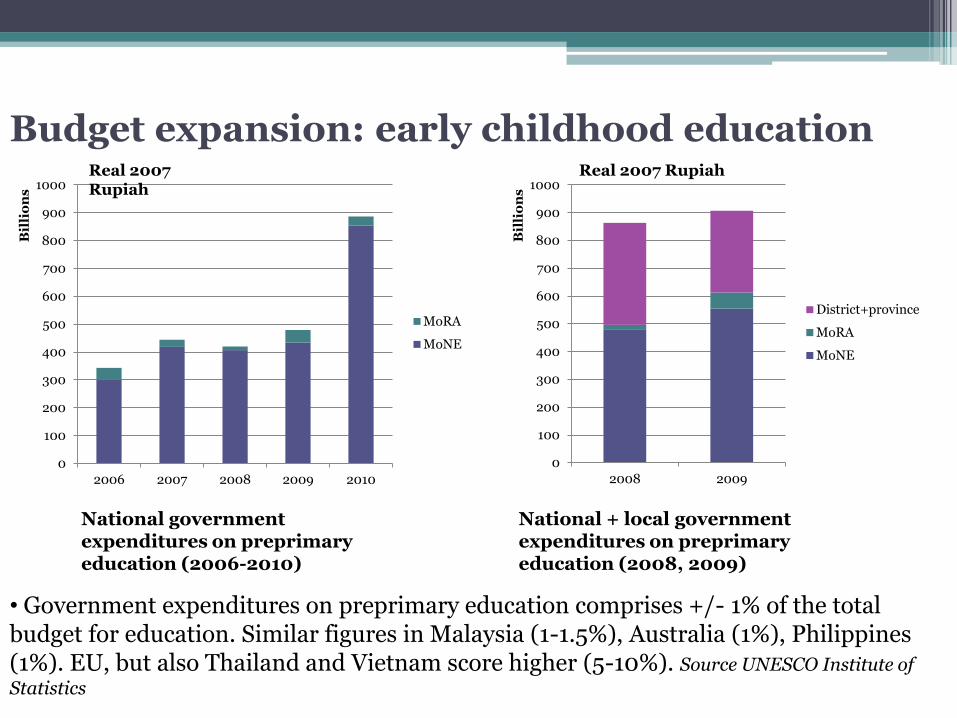
Budget expansion: early childhood education
0
100
200
300
400
500
600
700
800
900
1000
2006 2007 2008 2009 2010
Bil
lio
ns
MoRA
MoNE
0
100
200
300
400
500
600
700
800
900
1000
2008 2009
Bil
lio
ns
District+province
MoRA
MoNE
Real 2007 Rupiah
Real 2007 Rupiah
National government expenditures on preprimary education (2006-2010)
National + local government expenditures on preprimary education (2008, 2009)
• Government expenditures on preprimary education comprises +/- 1% of the total budget for education. Similar figures in Malaysia (1-1.5%), Australia (1%), Philippines (1%). EU, but also Thailand and Vietnam score higher (5-10%). Source UNESCO Institute of
Statistics
Multiple instruments for the impact evaluation
1. Child tasks / observational
2. Primary caregiver
3. Household head
4. Village head (kepala desa or lurah)
5. Institution/Lembaga PAUD and/or ECED teacher

Primary Caregiver
1. Basic health of children, 2. Parent education 3. Knowledge of importance of ECD 4. Depression 5. Parental practices (warmth, care, punishment) 6. Immunization, 7. Nutrition of child (including breastfed) 8. Knowledge of, Access to and Utilization of ECED
services, 9. Report on the child’s physical health, social competence
and emotional maturity, language, cognitive and communication skills (EDI, SDQ)
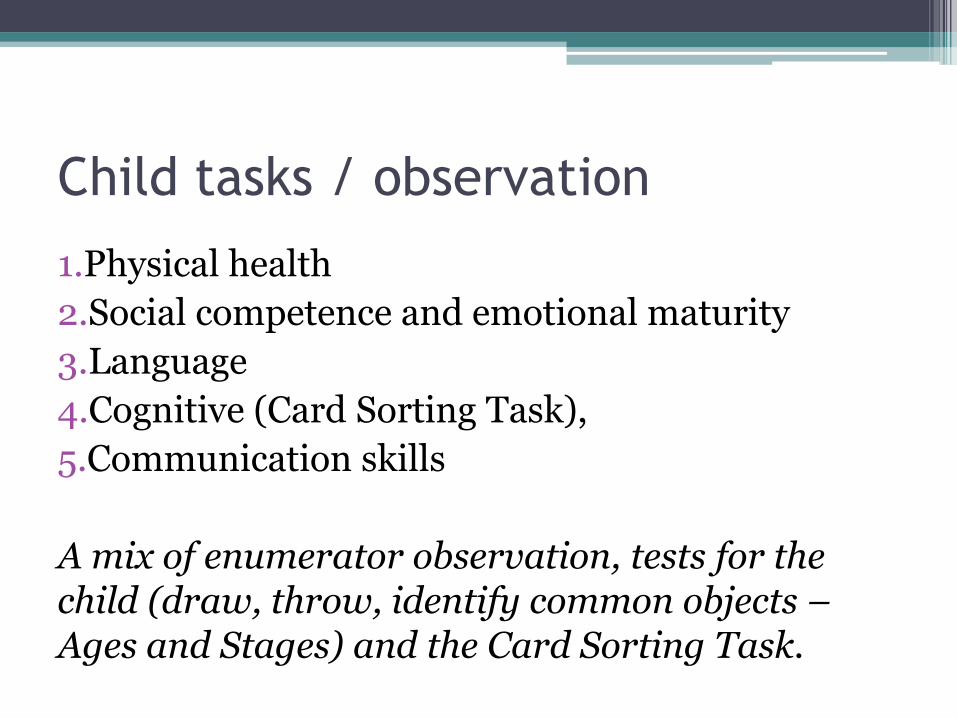
Child tasks / observation
1.Physical health
2.Social competence and emotional maturity
3.Language
4.Cognitive (Card Sorting Task),
5.Communication skills
A mix of enumerator observation, tests for the child (draw, throw, identify common objects – Ages and Stages) and the Card Sorting Task.
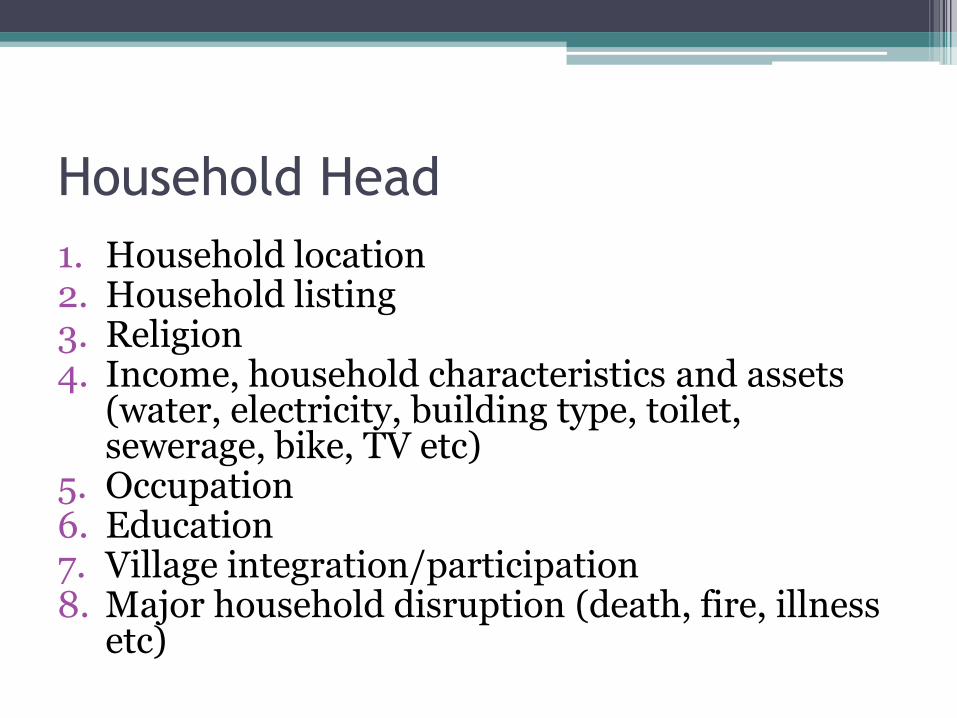
Household Head
1. Household location 2. Household listing 3. Religion 4. Income, household characteristics and assets
(water, electricity, building type, toilet, sewerage, bike, TV etc)
5. Occupation 6. Education 7. Village integration/participation 8. Major household disruption (death, fire, illness
etc)
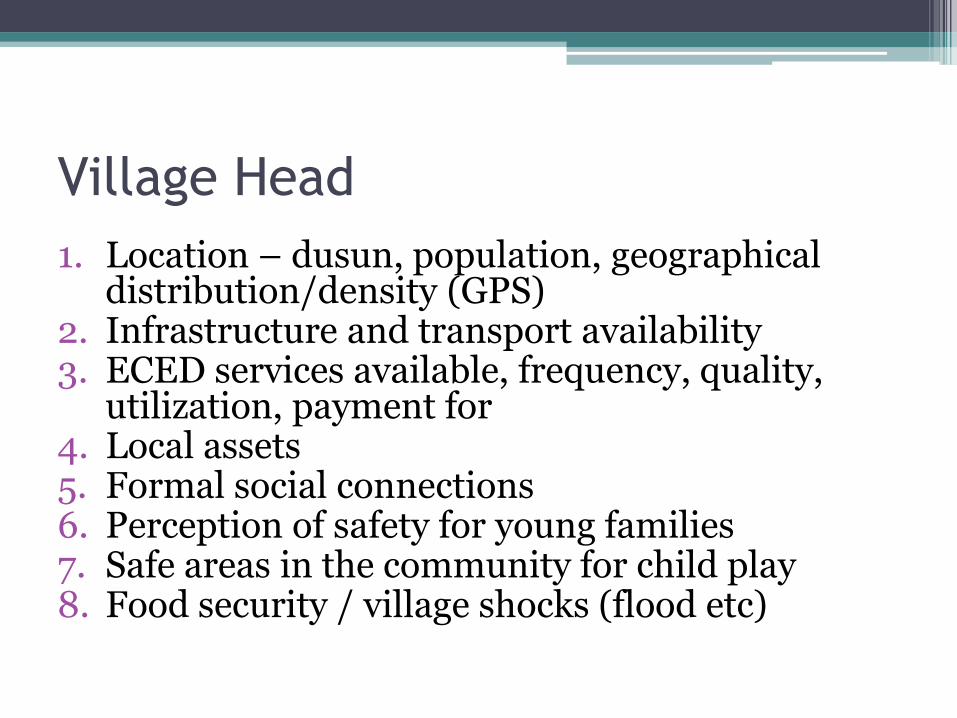
Village Head
1. Location – dusun, population, geographical distribution/density (GPS)
2. Infrastructure and transport availability 3. ECED services available, frequency, quality,
utilization, payment for 4. Local assets 5. Formal social connections 6. Perception of safety for young families 7. Safe areas in the community for child play 8. Food security / village shocks (flood etc)

The impact evaluation data are detailed
• We track a representative sample of village children – born in 2005 and 2008 ▫ Baseline - April 2009 ▫ Midline - July 2010 ▫ Endline – expected 2013
• 10 districts, 300 villages (200 project + 100 comparison villages) , 6000 children ( 3000 1-year olds + 3000 4-year olds)
• We measure children individually and construct 20 different indicators of ECED, along different domains. (observations + parent assessments)
43